bureau of nutrition and physical activity health and wellness for all arizonans january 26, 2012...
TRANSCRIPT
Bureau of Nutrition and Physical Activity
Health and Wellness for all Arizonans
January 26, [email protected]
Nutrition Network Needs Assessment
Bureau of Nutrition and Physical Activity
Health and Wellness for all Arizonans
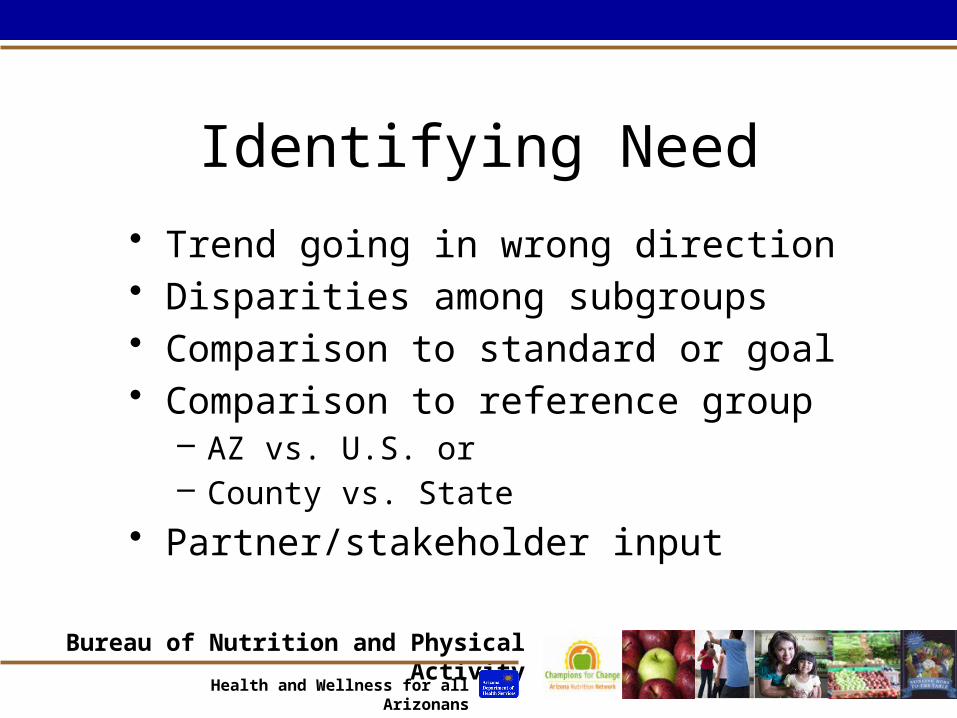
Identifying Need
• Trend going in wrong direction• Disparities among subgroups• Comparison to standard or goal• Comparison to reference group
– AZ vs. U.S. or – County vs. State
• Partner/stakeholder input

Bureau of Nutrition and Physical Activity
Health and Wellness for all Arizonans
Why Do Needs Assessments?
• Helps prioritize limited resources• Identify gaps
– Where are resources going compared to where is the need?
• Intervene where we can make a difference
• Required by USDA

Bureau of Nutrition and Physical Activity
Health and Wellness for all Arizonans
Required to Address
1. Description of the target audience
2. Their nutrition-related behavioral and lifestyle characteristics
3. Availability of other programs that target same population
4. Areas where target audience is underserved
5. Implications for planning.

Bureau of Nutrition and Physical Activity
Health and Wellness for all Arizonans
Data Sources• U. S. Census, including American Community
Survey (ACS)• SNAP Utilization data• Behavior Risk Factor Surveillance System
(BRFSS)• Youth Risk Behavior Survey (YRBS)• Program evaluation data (quantitative and
qualitative)• Social marketing studies

Bureau of Nutrition and Physical Activity
Health and Wellness for all Arizonans
Arizona Per Capita Income
• Tends to be lower than U.S. averages.• 91% of national average in 2010
Arizona United States
$23,618 $26,059
2010 Per Capita IncomeArizona vs. United States

Bureau of Nutrition and Physical Activity
Health and Wellness for all Arizonans
Median Household Income
Arizona 2008 Arizona 2010 United States 2010
$51,009
$46,789
$50,046
Bureau of Nutrition and Physical Activity
Health and Wellness for all Arizonans
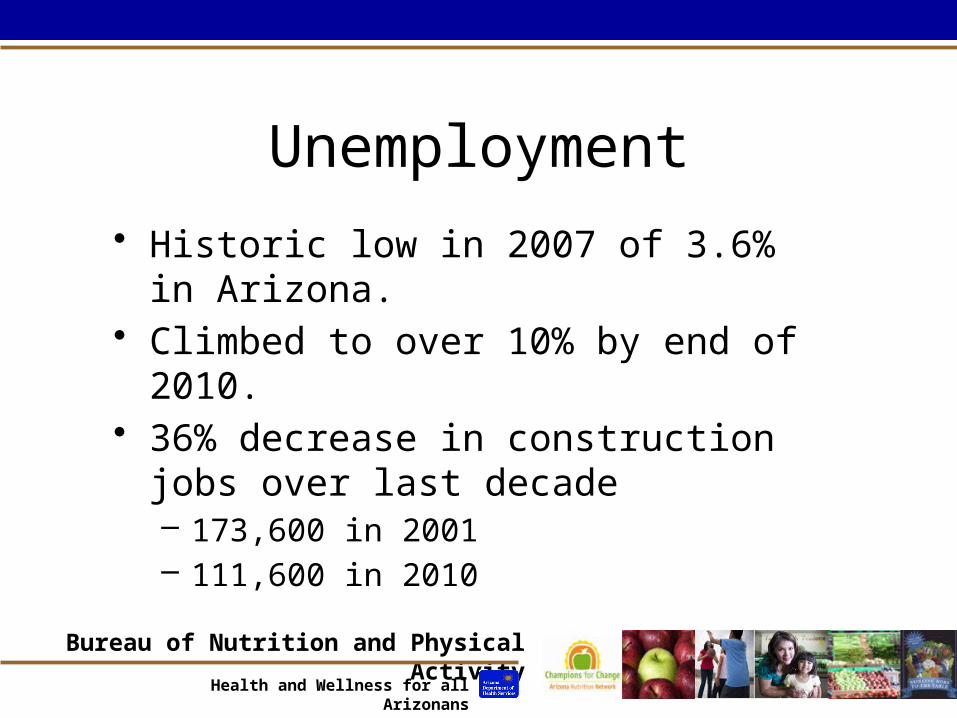
Unemployment
• Historic low in 2007 of 3.6% in Arizona.• Climbed to over 10% by end of 2010.• 36% decrease in construction jobs over
last decade– 173,600 in 2001– 111,600 in 2010

Bureau of Nutrition and Physical Activity
Health and Wellness for all Arizonans
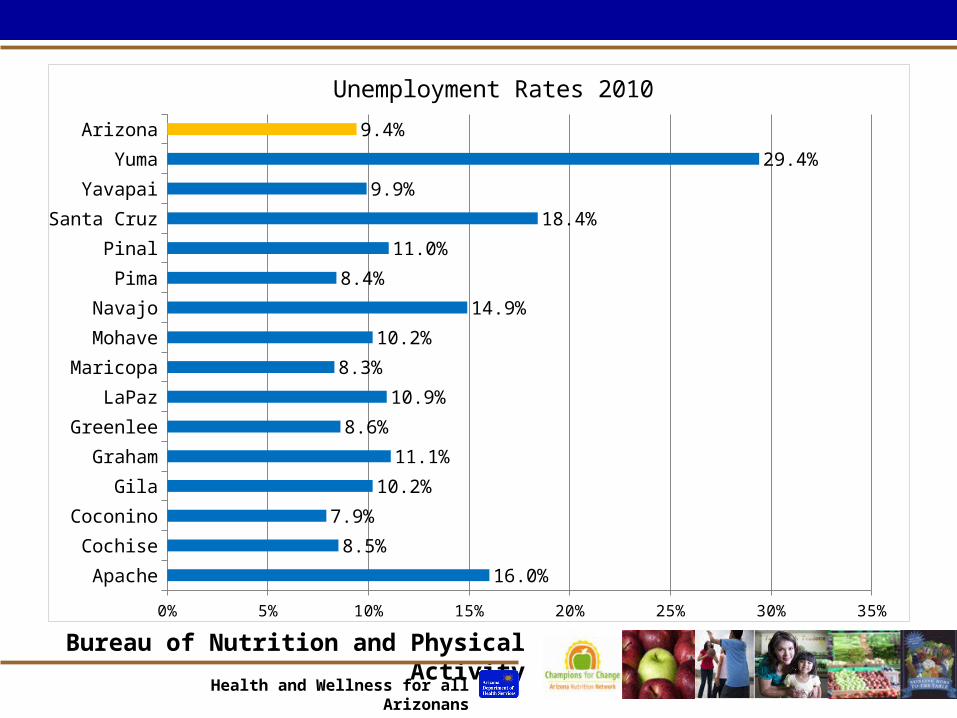
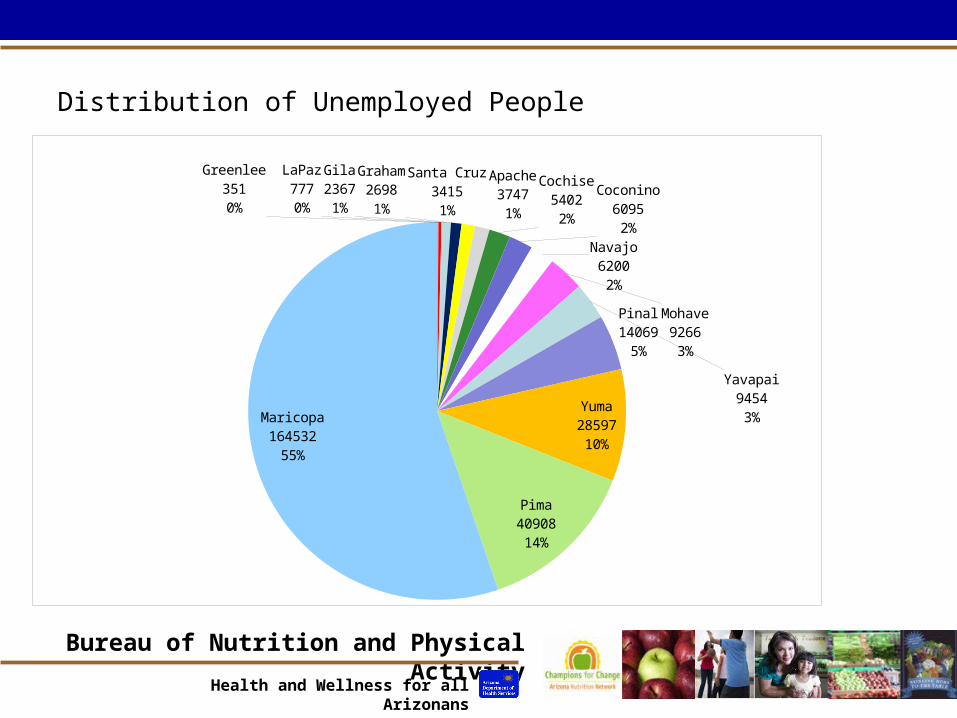
Unemployment in Arizona 2010
• Higher rates in rural areas,• Lowest rates in Maricopa and Pima
County, • However, majority of unemployed
people live in Maricopa and Pima County
Bureau of Nutrition and Physical Activity
Health and Wellness for all Arizonans
Apache
Cochise
Coconino
Gila
Graham
Greenlee
LaPaz
Maricopa
Mohave
Navajo
Pima
Pinal
Santa Cruz
Yavapai
Yuma
Arizona
0% 5% 10% 15% 20% 25% 30% 35%
16.0%
8.5%
7.9%
10.2%
11.1%
8.6%
10.9%
8.3%
10.2%
14.9%
8.4%
11.0%
18.4%
9.9%
29.4%
9.4%
Unemployment Rates 2010
Bureau of Nutrition and Physical Activity
Health and Wellness for all Arizonans
Greenlee3510%
LaPaz7770%
Gila23671%
Graham26981%
Santa Cruz34151%
Apache37471%
Cochise54022%
Coconino60952%
Navajo62002%
Mohave92663%
Yavapai94543%
Pinal14069
5%
Yuma2859710%
Pima4090814%
Maricopa164532
55%
Distribution of Unemployed People

Bureau of Nutrition and Physical Activity
Health and Wellness for all Arizonans
Persons in family Poverty guideline
1 $10,830
2 14,570
3 18,310
4 22,050
5 25,790
6 29,530
7 33,270
8 37,010
Add $3,740 for each additional person.
Federal Poverty Guidelines2010 Contiguous U. S.

Bureau of Nutrition and Physical Activity
Health and Wellness for all Arizonans
Poverty Rates 2010
Poverty (Below 100% FPL) Extreme Poverty (Below 50% FPL)
17.4%
8.3%
15.3%
6.8%
Arizona US
Bureau of Nutrition and Physical Activity
Health and Wellness for all Arizonans
Food Insecurity
• One in five Arizona households (20.8%) reported not having enough money to buy food that they needed during prior 12 months (rank=15)
• 29% of households with children did not have enough money to buy food (rank=7)

Bureau of Nutrition and Physical Activity
Health and Wellness for all Arizonans
Arizona Poverty Rates 2010by Age Group
Less than 6 6 - <12 12 - <18 18 - <26 26 - <40 40 - <65 65 or over Total0%
5%
10%
15%
20%
25%
30%27.5%
23.9%
21.6%
27.2%
18.0%
12.5%
7.9%
17.5%
• 24.4% of children under the age of 18 in poverty
Bureau of Nutrition and Physical Activity
Health and Wellness for all Arizonans
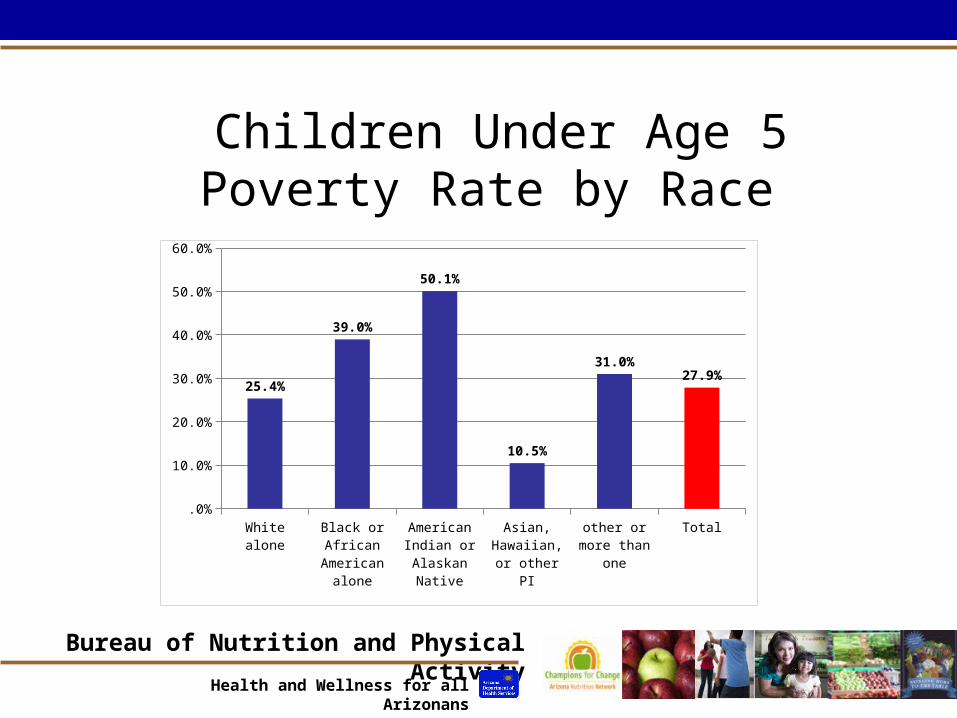
Children Under Age 5Poverty Rate by Race
Whit
e alo
ne
Black
or A
frica
n Am
erica
n alo
ne
Amer
ican
India
n or
Alas
kan
Native
Asian,
Haw
aiian
, or o
ther
PI
othe
r or m
ore
than
one
Total
.0%
10.0%
20.0%
30.0%
40.0%
50.0%
60.0%
25.4%
39.0%
50.1%
10.5%
31.0%27.9%

Bureau of Nutrition and Physical Activity
Health and Wellness for all Arizonans
Racial Composition ofChildren Under Age 5 in Poverty
White alone74.6%
Black or African Amer-
ican alone4.2%
American In-dian or
Alaskan Native3.7%
Asian, Hawai-ian, or other PI
3.0%
Other or more than one race
14.5%
Bureau of Nutrition and Physical Activity
Health and Wellness for all Arizonans
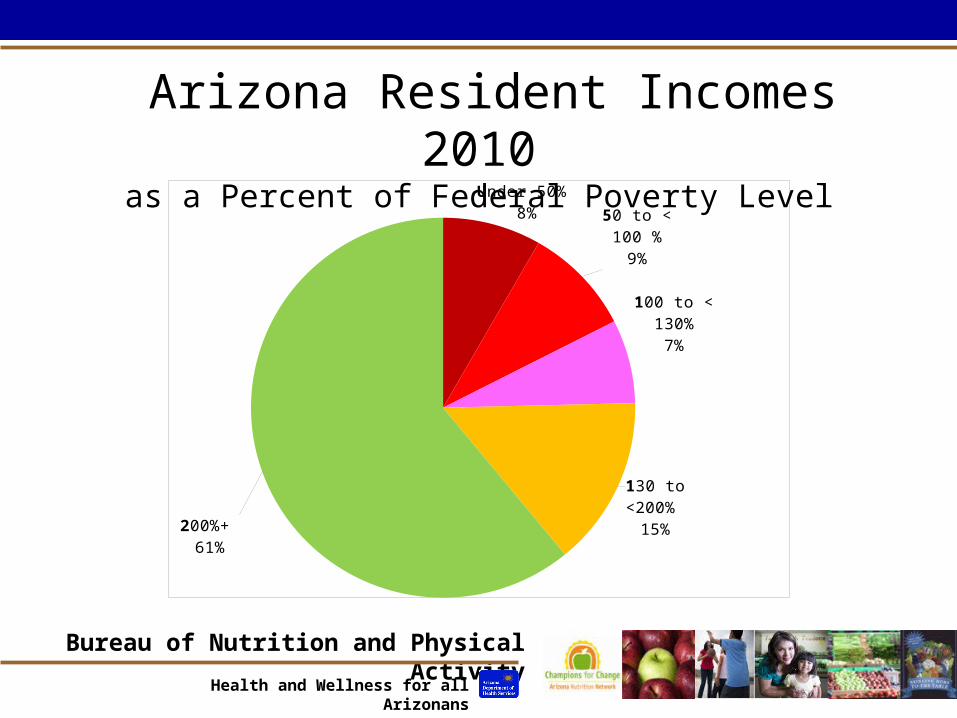
Under 50% 8%
50 to < 100 %9%
100 to < 130%
7%
130 to <200% 15%
200%+ 61%
Arizona Resident Incomes 2010as a Percent of Federal Poverty Level

Bureau of Nutrition and Physical Activity
Health and Wellness for all Arizonans
SNAP Participation
2007 20100%
2%
4%
6%
8%
10%
12%
14%
6.9%
13.2%
7.7%
11.9%
Arizona US

Bureau of Nutrition and Physical Activity
Health and Wellness for all Arizonans
Target for Nutrition Education• Certified Eligible – SNAP participants• Likely Eligible
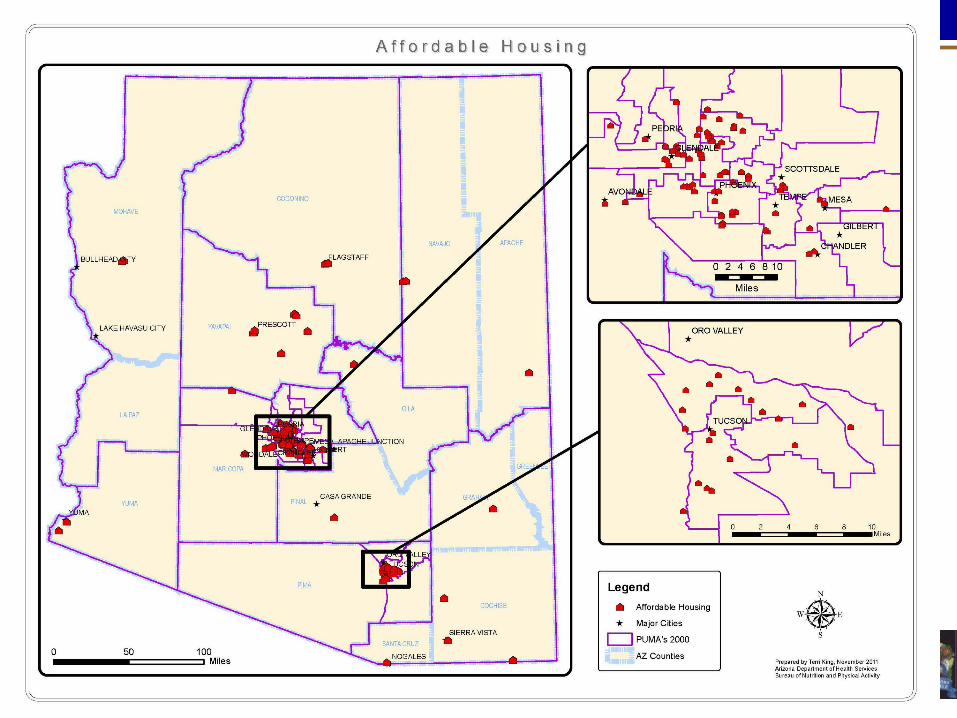
– Income below 130% FPL– Location proxies: food banks, food pantries, soup kitchens,
public housing, SNAP/TANF job readiness programs
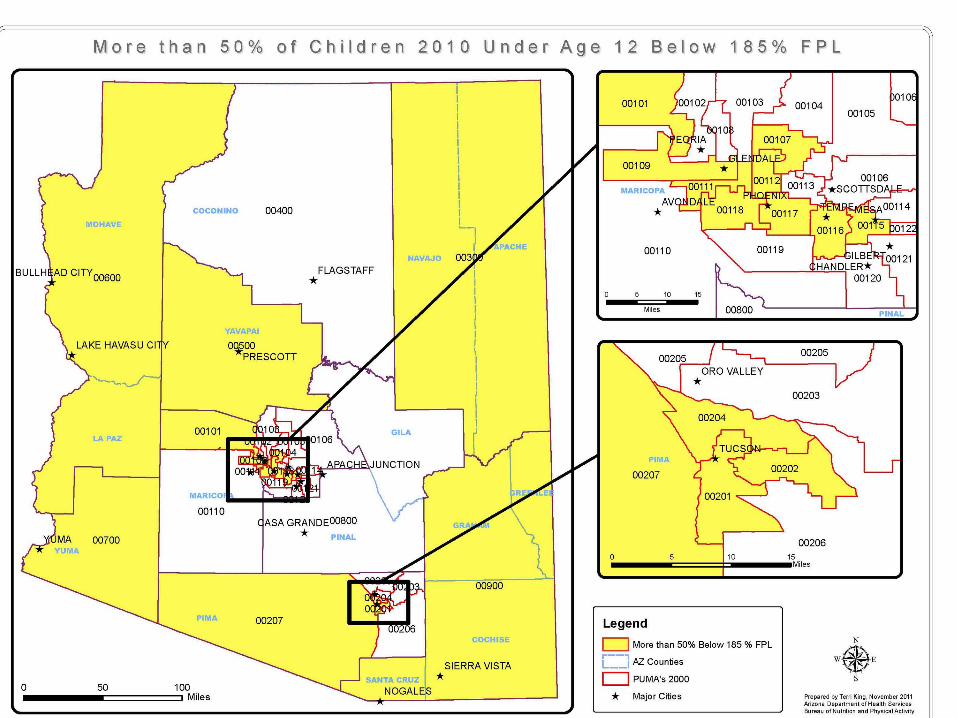
• Potentially Eligible– Locations where 50% have incomes below 185% FPL– Retail grocery stores with $50,000 average SNAP benefit
redemption
Bureau of Nutrition and Physical Activity
Health and Wellness for all Arizonans
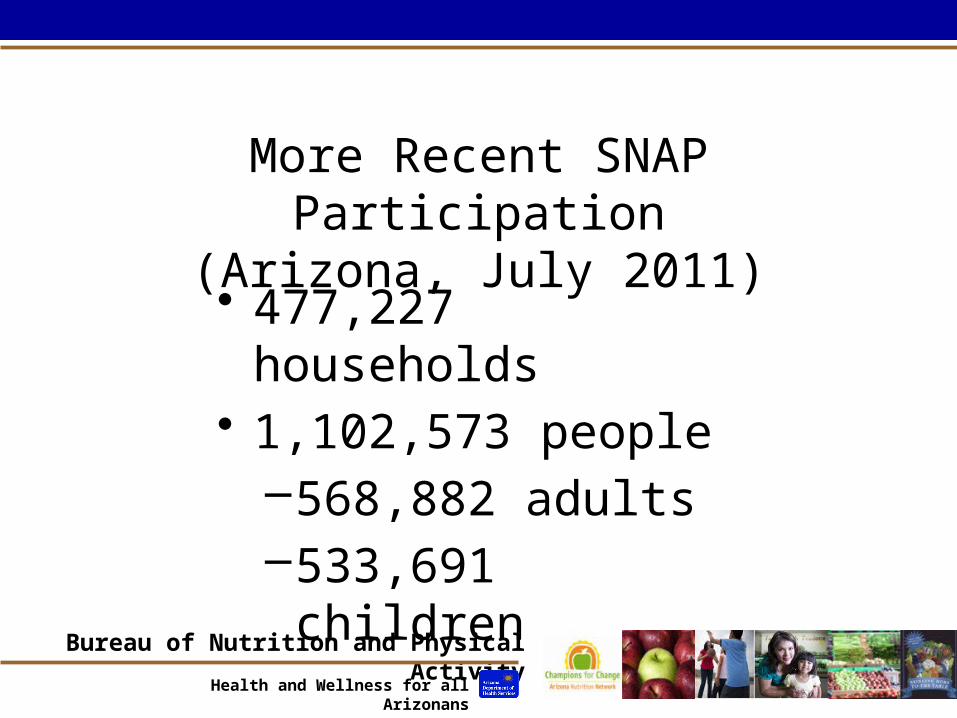
More Recent SNAP Participation(Arizona, July 2011)
• 477,227 households• 1,102,573 people
–568,882 adults–533,691 children


Bureau of Nutrition and Physical Activity
Health and Wellness for all Arizonans
Households with ChildrenLikely Eligible (<130%FPL) vs. Not eligible (>=130%FPL)
Likely Eligible Not eligible
With children under 6 years only 12.6 10.1
With children 6 to 17 years only 25.6 26.2
With children under 6 years and 6 to 17 years
28.8 12.7
No children 33.1 51.0
100% 100%
Bureau of Nutrition and Physical Activity
Health and Wellness for all Arizonans
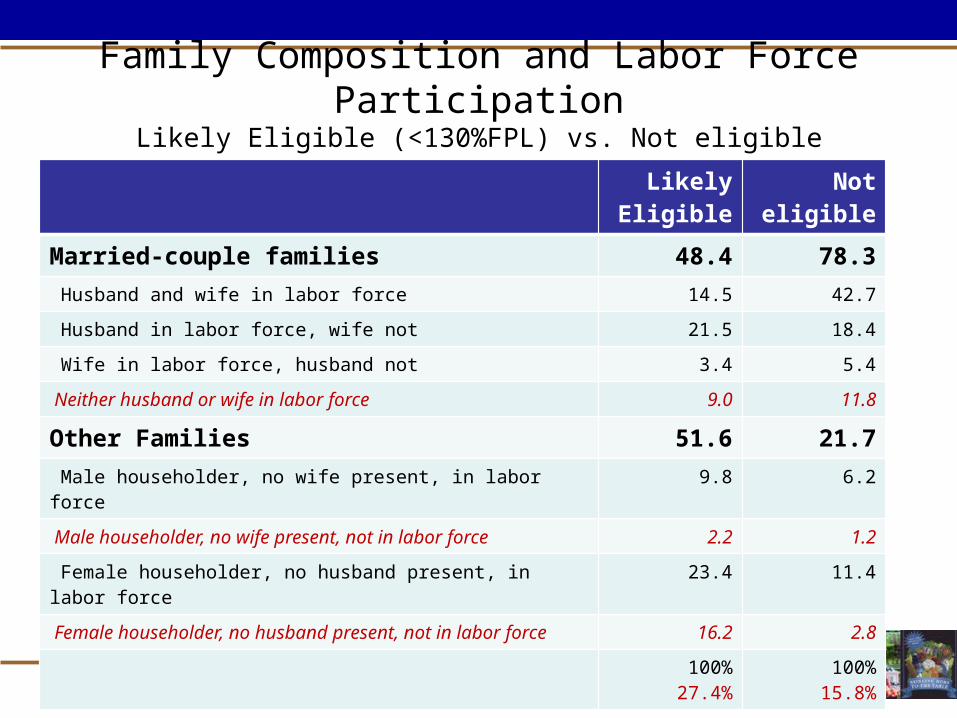
Family Composition and Labor Force ParticipationLikely Eligible (<130%FPL) vs. Not eligible (>=130%FPL)
Likely Eligible
Not eligible
Married-couple families 48.4 78.3 Husband and wife in labor force 14.5 42.7
Husband in labor force, wife not 21.5 18.4
Wife in labor force, husband not 3.4 5.4
Neither husband or wife in labor force 9.0 11.8
Other Families 51.6 21.7 Male householder, no wife present, in labor force 9.8 6.2
Male householder, no wife present, not in labor force 2.2 1.2
Female householder, no husband present, in labor force 23.4 11.4
Female householder, no husband present, not in labor force 16.2 2.8
100%27.4%
100%15.8%

Bureau of Nutrition and Physical Activity
Health and Wellness for all Arizonans
Among Likely Eligible PopulationDuring the last 12 months . . .
• 22.6% in families with no workers • 51.3% had one worker• 21.0% had two workers• 5.1% had three or more workers

Bureau of Nutrition and Physical Activity
Health and Wellness for all Arizonans
Educational Attainment Arizona Adults Age 25 and Older
Likely Eligible (<130%FPL) vs. Not eligible (>=130%FPL)
Highest Level of Education Completed
Likely EligiblePercent
Not eligiblePercent
Percent Cumulative Percent Cumulative
Graduate or Professional Degree 1.5 1.5 7.6 7.6
Bachelor’s degree 4.7 6.2 13.8 21.4
Some College 20.4 26.6 28.6 50.0
High School Diploma or GED 19.7 46.3 20.0 70.1
High school-no diploma 17.5 63.8 9.6 79.7
Grades 1-8 23.7 87.5 13.9 93.6
Less than First Grade 12.5 100.0 6.4 100.0

Bureau of Nutrition and Physical Activity
Health and Wellness for all Arizonans
Overall Health Ratings
Likely Eligible Not Eligible0%
10%
20%
30%
40%
50%
60%
70%
80%
90%
100%
12.426.2
15.3
35.536.5
28.325.4
7.410.4 2.6
PoorFairGoodVery goodExcellent

Bureau of Nutrition and Physical Activity
Health and Wellness for all Arizonans
Likely eligible population is also more likely to report . . .
• Health problems that limit their activities (32% vs. 19%)
• No health insurance (28% vs. 13%)• Needed a doctor within last year but did not
see one because of cost (vs. 31% vs. 7%)

Bureau of Nutrition and Physical Activity
Health and Wellness for all Arizonans
Fruits and Vegetable Consumption
Among Target Population

Bureau of Nutrition and Physical Activity
Health and Wellness for all Arizonans
Adults Consuming 5 or More Fruits and Vegetables Daily by Income
Under 130% FPL Under 185% FPL Over 185%
21.4%22.4%
26.9% AZ 2010 = 25.2%
Bureau of Nutrition and Physical Activity
Health and Wellness for all Arizonans
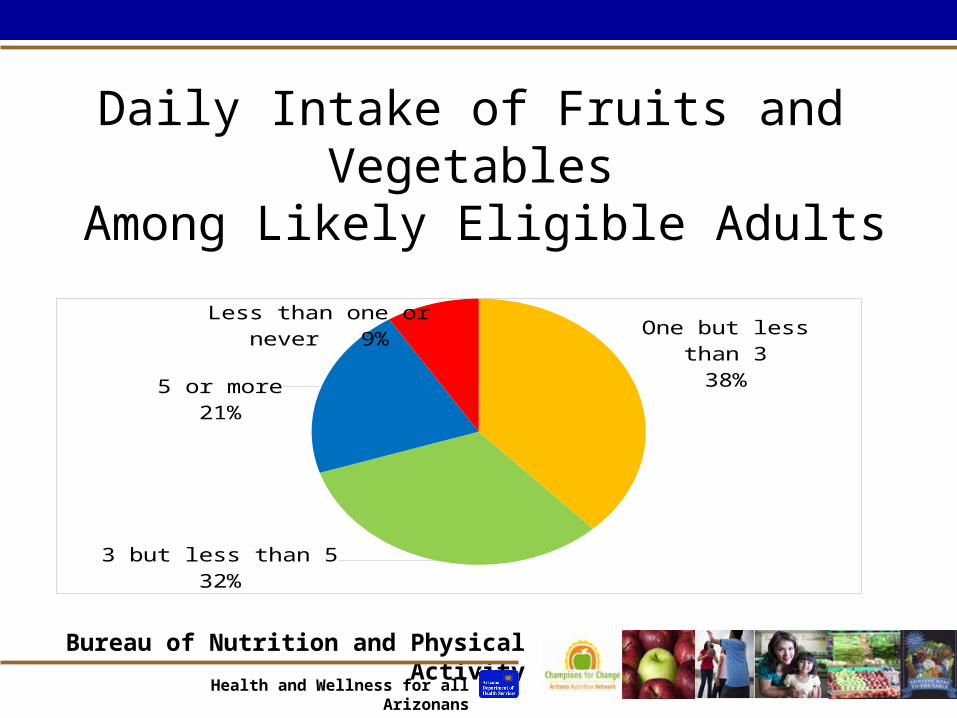
Daily Intake of Fruits and Vegetables Among Likely Eligible Adults
One but less than 3
38%
3 but less than 532%
5 or more21%
Less than one or never 9%

Bureau of Nutrition and Physical Activity
Health and Wellness for all Arizonans
Trans-Theoretical Model Not thinking about it
Thinking about it and plan to start within 6 months
Definitely planning to start in next month
Trying to do it now
Already doing it

Bureau of Nutrition and Physical Activity
Health and Wellness for all Arizonans
Post Campaign Report: Adult Readinessto Eat More Fruits and Vegetable
• 46% said they already ate 5+ servings• 42% said they were trying to eat more• 10% said they definitely planned to eat more in the
next month• 2% said they are thinking about eating more and
plan to start in the next six months• Less than half of 1% said they were not thinking
about eating more fruits and vegetables

Bureau of Nutrition and Physical Activity
Health and Wellness for all Arizonans
Before Implementation of Fruits and Veggies – More MattersTM*
Most students already . . .• Could pick at least one food that was a fruit
(96%) and one that was a vegetable (91%)• Knew which foods had a lot of vitamin C
(64%)• Said they ate fruits and vegetables as
snacks (86%)*Curriculum administered to elementary students age 7 through 10
Bureau of Nutrition and Physical Activity
Health and Wellness for all Arizonans
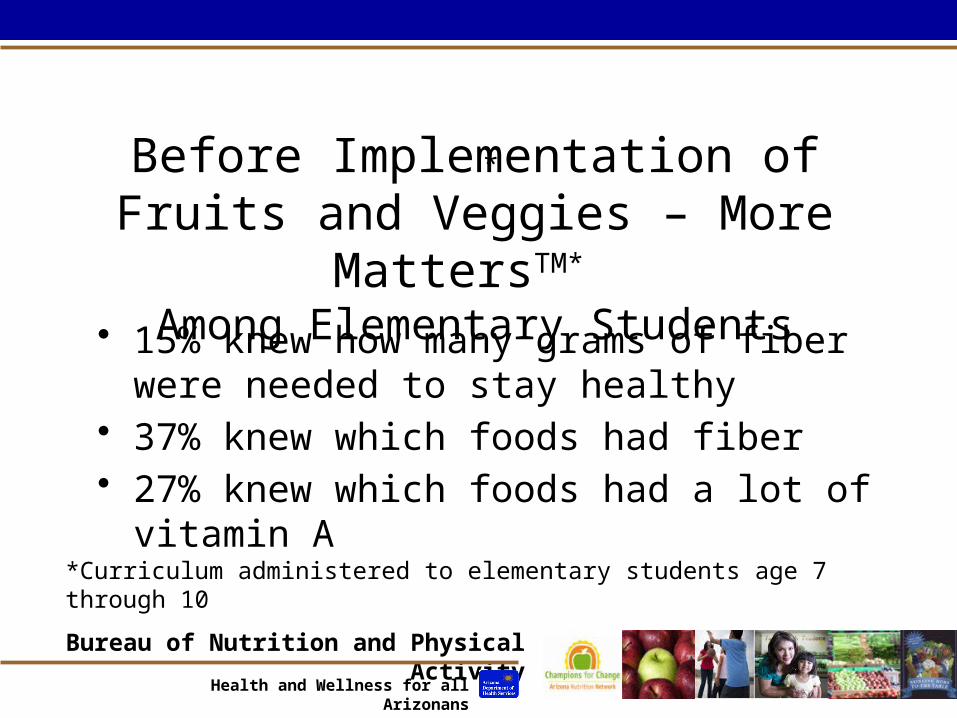
Before Implementation of Fruits and Veggies – More MattersTM*
Among Elementary Students
• 15% knew how many grams of fiber were needed to stay healthy
• 37% knew which foods had fiber• 27% knew which foods had a lot of vitamin A
*Curriculum administered to elementary students age 7 through 10
*

Bureau of Nutrition and Physical Activity
Health and Wellness for all Arizonans
Milk/CalciumAmong Target Population

Bureau of Nutrition and Physical Activity
Health and Wellness for all Arizonans
Adult Milk Drinking(from Food Behavior Checklist Survey)
• Over past three years, findings have not changed significantly:
• One in three eligible adults drink milk every day• One-fourth said they drink milk often• 15% do not drink milk

Bureau of Nutrition and Physical Activity
Health and Wellness for all Arizonans
Adult Milk Drinking – Fat Content(from Food Behavior Checklist Survey)
• 5% drank fat-free milk• 24% drank 1% milk• 38% drank 2% milk• 28% drank whole milk

Bureau of Nutrition and Physical Activity
Health and Wellness for all Arizonans
Adult Milk Drinking HabitsPrior to Launch of Go Low Campaign
• 31% in maintenance stage• 18% action stage - trying to switch• 9% preparation stage - definitely planning to change in
the next month. • 9% contemplating changing to low fat or fat free milk in
the next six months (half drank 2%, 25% drank whole milk).
• 33% in pre-conceptualization stage – not thinking about changing, or did not perceive or personalize risks.
Bureau of Nutrition and Physical Activity
Health and Wellness for all Arizonans
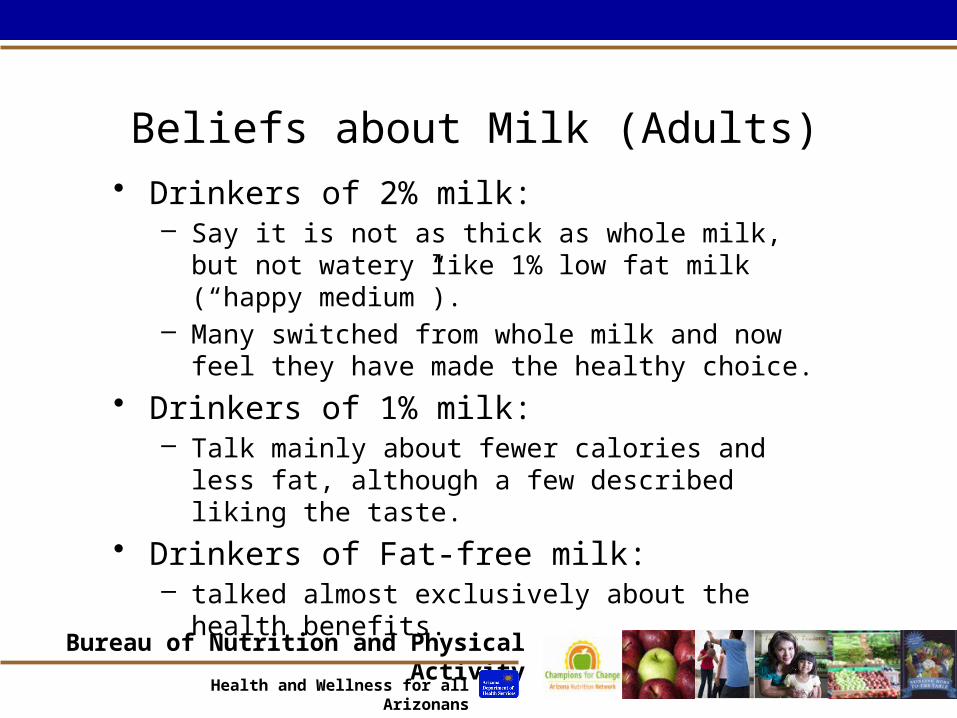
Beliefs about Milk (Adults)• Drinkers of 2% milk:
– Say it is not as thick as whole milk, but not watery like 1% low fat milk (“happy medium”).
– Many switched from whole milk and now feel they have made the healthy choice.
• Drinkers of 1% milk:– Talk mainly about fewer calories and less fat,
although a few described liking the taste.
• Drinkers of Fat-free milk:– talked almost exclusively about the health benefits.
Bureau of Nutrition and Physical Activity
Health and Wellness for all Arizonans
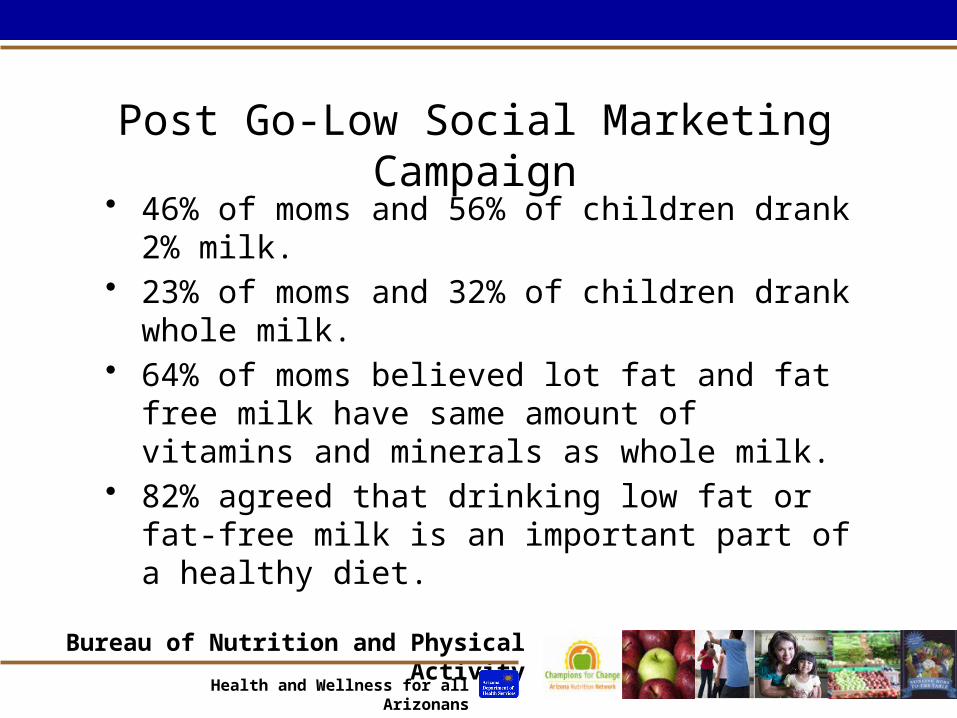
Post Go-Low Social Marketing Campaign
• 46% of moms and 56% of children drank 2% milk.• 23% of moms and 32% of children drank whole
milk.• 64% of moms believed lot fat and fat free milk
have same amount of vitamins and minerals as whole milk.
• 82% agreed that drinking low fat or fat-free milk is an important part of a healthy diet.
Bureau of Nutrition and Physical Activity
Health and Wellness for all Arizonans
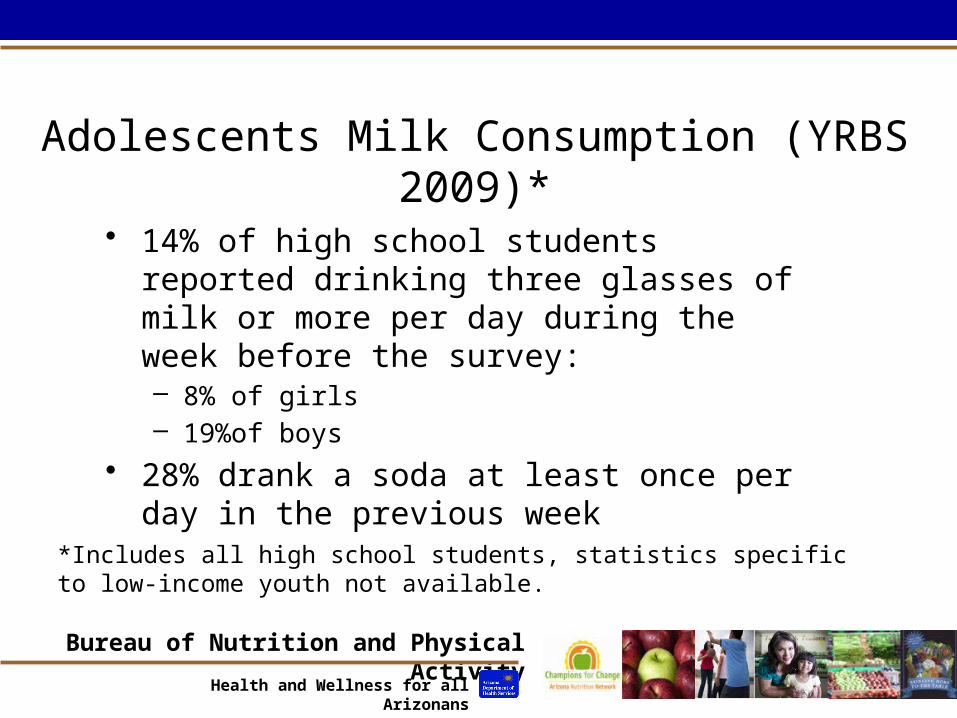
Adolescents Milk Consumption (YRBS 2009)*
• 14% of high school students reported drinking three glasses of milk or more per day during the week before the survey:– 8% of girls– 19%of boys
• 28% drank a soda at least once per day in the previous week
*Includes all high school students, statistics specific to low-income youth not available.

Bureau of Nutrition and Physical Activity
Health and Wellness for all Arizonans
Building Better Bones Pretest – 5th Graders
• 67% knew which fast foods had the most calcium and least fat
• 47% could identify foods without calcium• 37% knew how many daily servings of dairy they
should have, and the age at which 90 percent of bone density is built
• 15% knew percent daily value for calcium needed for students their age
• 20% knew what osteoporosis was• 23% had at least 3 servings of milk the day before.

Bureau of Nutrition and Physical Activity
Health and Wellness for all Arizonans
Whole GrainsAmong Target Population

Bureau of Nutrition and Physical Activity
Health and Wellness for all Arizonans
Whole Grains (Westgroup)
• Mothers understand that whole grain foods are supposed to be good for you– Some say more nutrients, others say good source of fiber– Know little about specific vitamins and minerals and why
they are good for you.– Could identify some ultimate benefits, such as improving
digestion, helping with heart health, and helping to control weight.
– Some believe whole grains give you energy and lower cholesterol.
– Messages about fiber resonated more than vitamins and minerals, especially with Hispanics.

Bureau of Nutrition and Physical Activity
Health and Wellness for all Arizonans
Confusion about Whole Grain, Whole What, Multigrain, and Stone-Ground
• Use whole grain and whole wheat interchangeably• Uncertain whether multigrain is a whole grain• Unclear about whether products that don’t say
“100% whole grain” or “100% whole wheat” are truly whole grain or whole wheat.
• Some look for “lowers cholesterol” or the Heart Healthy or red heart logo, or the wheat stalk on the package.

Bureau of Nutrition and Physical Activity
Health and Wellness for all Arizonans
Eating Whole Grains
• Most say they have whole grain foods at home, with whole grain/whole wheat bread and oatmeal being named most often.
• Some moms who eat whole grain still serve white bread to their children (“tastes better”), although . . .
• Some serve whole wheat bread to children so they will develop healthy eating habits.

Bureau of Nutrition and Physical Activity
Health and Wellness for all Arizonans
Barriers to Whole Grains
• Not liking the taste (themselves or someone in family)
• Not understanding what whole grains are, or how to prepare them
• Not liking to try new things• Cost – belief that whole grains cost two or three
times more than white bread• Many include corn tortillas, but pasta seems to
be a more difficult transition.

Bureau of Nutrition and Physical Activity
Health and Wellness for all Arizonans
Healthy ProteinsAmong Target Population

Bureau of Nutrition and Physical Activity
Health and Wellness for all Arizonans
WestGroup Study on Proteins
• Mothers agreed that lean proteins are those that have less fat.– Most listed skinless chicken, fish and ground beef as
examples of lean protein.– Fewer listed eggs, low fat dairy, beans, or lean pork
when asked which foods are considered lean proteins.
• Some mentioned – cooking differently to maintain lean quality – baking
instead of frying, using less butter or grease.– using more seasoning to add back flavor lost from
removing fat from lean chicken and beef.

Bureau of Nutrition and Physical Activity
Health and Wellness for all Arizonans
WestGroup Study on Proteins
• Spanish-speaking mothers were unfamiliar with the Spanish word for “lean” – “magra”. They used the English word “lean.”
• Most agreed with statements about health benefits (good for heart, don’t clog arteries, help build muscle, give energy.)
• Most mothers look for the “% fat” designation on a package of ground beef, as well as a sticker that says “lean,” although some look at amount of marbling.
• Almost none said they look for the grams of protein per serving, or any other information that is included on the package.
Bureau of Nutrition and Physical Activity
Health and Wellness for all Arizonans
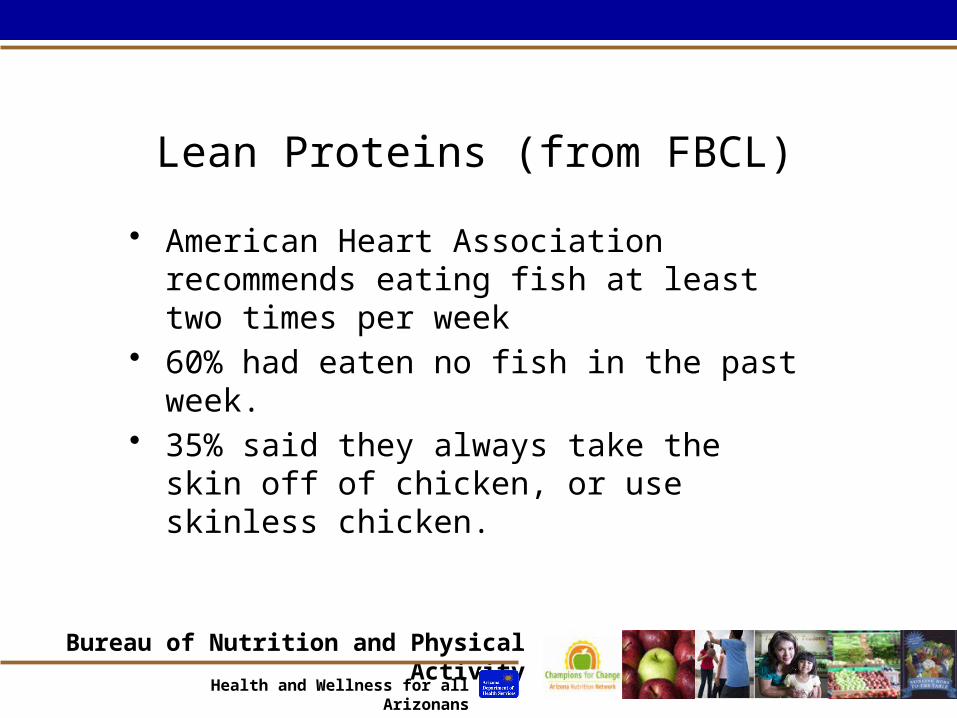
Lean Proteins (from FBCL)
• American Heart Association recommends eating fish at least two times per week
• 60% had eaten no fish in the past week.• 35% said they always take the skin off of
chicken, or use skinless chicken.
Bureau of Nutrition and Physical Activity
Health and Wellness for all Arizonans
Physical ActivityAmong Target Population
Bureau of Nutrition and Physical Activity
Health and Wellness for all Arizonans
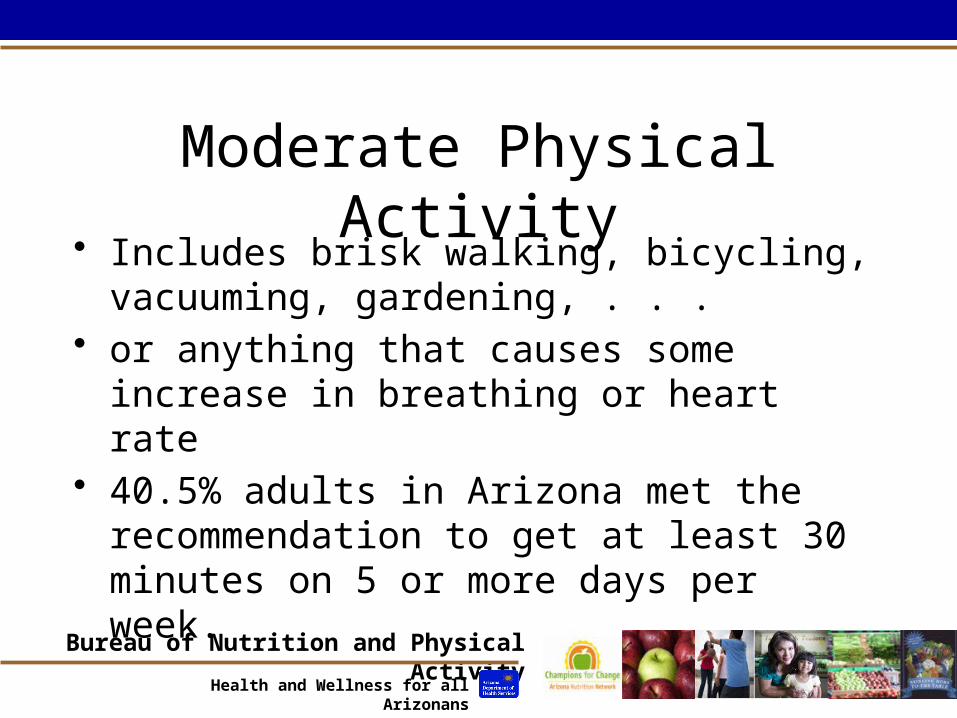
Moderate Physical Activity
• Includes brisk walking, bicycling, vacuuming, gardening, . . .
• or anything that causes some increase in breathing or heart rate
• 40.5% adults in Arizona met the recommendation to get at least 30 minutes on 5 or more days per week.

Bureau of Nutrition and Physical Activity
Health and Wellness for all Arizonans
Vigorous Physical Activity
• Examples include running, aerobics, heavy yard work, . . .
• or anything that causes large increase in breathing or heart rate
• 34.2% of adults in Arizona got at least 20 minutes of vigorous activity on 3 or more days per week

Bureau of Nutrition and Physical Activity
Health and Wellness for all Arizonans
Physical Activity by Income Group among Adults
Under 130% FPL
Under 185% FPL
Over 185%
46.0% 46.8%
59.2%54.0%
Bureau of Nutrition and Physical Activity
Health and Wellness for all Arizonans
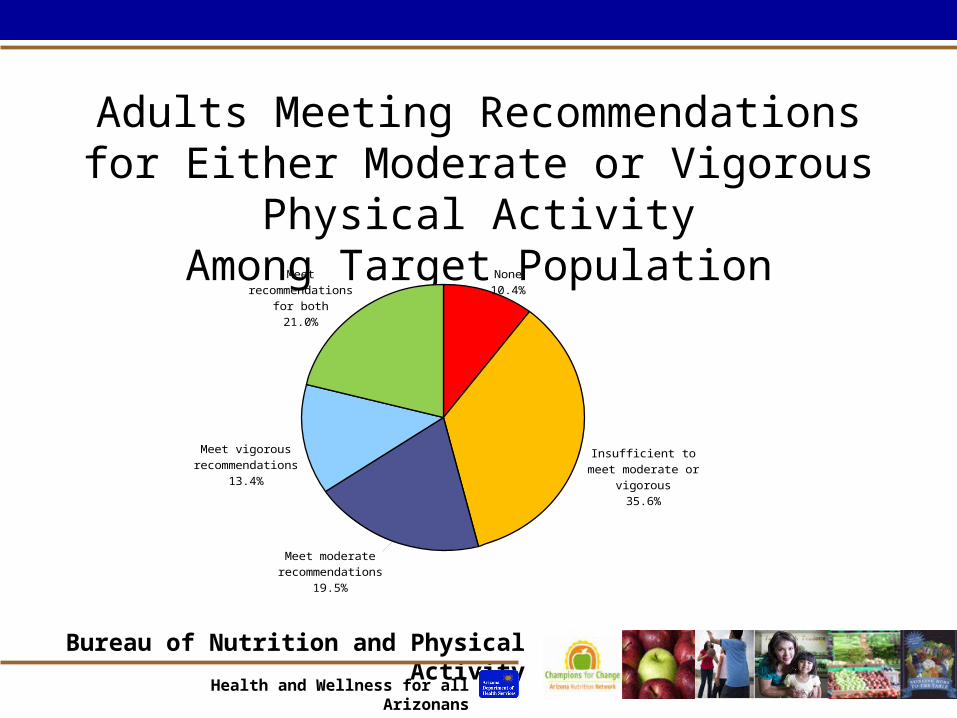
Adults Meeting Recommendations for Either Moderate or Vigorous Physical Activity
Among Target PopulationNone10.4%
Insufficient to meet moderate or vigorous
35.6%
Meet moderate recommendations19.5%
Meet vigorous recommendations
13.4%
Meet recommenda-tions for both
21.0%

Bureau of Nutrition and Physical Activity
Health and Wellness for all Arizonans
Among Fifth Graders*
• 66% knew how much physical activity they should get
• 69% reported spending 60 minutes or more being physically active on previous day
*Source: Building Better Bones Pretest
Bureau of Nutrition and Physical Activity
Health and Wellness for all Arizonans
Media Connectivity and Messaging

Bureau of Nutrition and Physical Activity
Health and Wellness for all Arizonans
Media Usability Among Target Population*
• 66% of mothers have access to the internet (nearly always high speed)– Half go online every day, 15% go online most days– 63% use it to seek health, nutrition, or disease related
information, finding it easier, faster, and more convenient than calling a number, going to the library, or using some other method.
• 86% of children go on the internet, with 87% of them using it weekly
*Westgroup Media Usability Study

Bureau of Nutrition and Physical Activity
Health and Wellness for all Arizonans
What are Three Best Sources for Health and Nutrition Information?*
Something received by mail
Library
Community health worker
Child care provider
Radio
Health fair
Government offices
Newspaper/magazines
Health Dept.
Friends
School/kid's school
Internet
Family
TV
0% 20% 40% 60%
5%5%
8%13%14%
14%18%
21%22%
25%28%
34%
37%43%
*Source: Westgroup (n=797)
Bureau of Nutrition and Physical Activity
Health and Wellness for all Arizonans
Implications for Planning
• What strikes you as new/most important?• What was not mentioned that you think
should be addressed?• What should we be continuing or doing
differently because of what we have learned?