bulging between rolls in continuously-cast...
TRANSCRIPT

University of Illinois at Urbana-Champaign • Metals Processing Simulation Lab • Lan Yu
Bulging between Rolls in Continuously-cast Slabs
Bulging between Rolls in Continuously-cast Slabs
Lan Yu
Department of Mechanical & Industrial Engineering University of Illinois at Urbana-Champaign
September 25, 2000
Lan Yu
Department of Mechanical & Industrial Engineering University of Illinois at Urbana-Champaign
September 25, 2000

University of Illinois at Urbana-Champaign • Metals Processing Simulation Lab • Lan Yu
AcknowledgmentsAcknowledgments
Allegheny Ludlum Corp.AK Steel
Columbus Stainless SteelInland SteelLTV Steel
Stollberg, Inc.
National Center for Supercomputing Applications(NCSA)
Allegheny Ludlum Corp.AK Steel
Columbus Stainless SteelInland SteelLTV Steel
Stollberg, Inc.
National Center for Supercomputing Applications(NCSA)

University of Illinois at Urbana-Champaign • Metals Processing Simulation Lab • Lan Yu
OutlineOutline� Introduction� Modeling methodology� Multiple-roll pitch model
– Effect of roll misalignment– Effect of sudden roll pitch change
� Parametric study – Plain carbon steel– Stainless steel
� Evaluation of empirical bulging prediction equations� Applications
� Introduction� Modeling methodology� Multiple-roll pitch model
– Effect of roll misalignment– Effect of sudden roll pitch change
� Parametric study – Plain carbon steel– Stainless steel
� Evaluation of empirical bulging prediction equations� Applications

University of Illinois at Urbana-Champaign • Metals Processing Simulation Lab • Lan Yu
IntroductionIntroduction
� Bulging of continuously cast steel slabs between supporting rolls is caused by internal ferrostatic pressure acting on the solidifying strand shell due to the weight of liquid steel and the height from the meniscus.– Bulging is directly responsible for internal cracks, centerline
segregation, and permanent deformation, which lead to poor quality of the continuously cast products.
– The bulging of slabs can also cause an increase of the load transmitted to the rolls and enhance their rate of wear.
� In practice, it is important to estimate bulging quantitatively in continuous caster design and set-up of secondary cooling conditions, especially in high-speed casting.

University of Illinois at Urbana-Champaign • Metals Processing Simulation Lab • Lan Yu
BackgroundBackground
The Continuous Casting Process(Acknowledgement to Prof. Brian G. Thomas)
The Continuous Casting Process(Acknowledgement to Prof. Brian G. Thomas)
2D FEM single roll pitch model for bulging
• FEM Domain with 60x16 mesh• Periodic B.C. on two ends
(coupled X & Y displacement)
Ferrostatic Pressure Casting Speed, Vc Liquid Steel
Solidifying Shell
FEM Domain
dN dP
X
Y
University of Illinois at Urbana-Champaign • Metals Processing Simulation Lab • Lan Yu
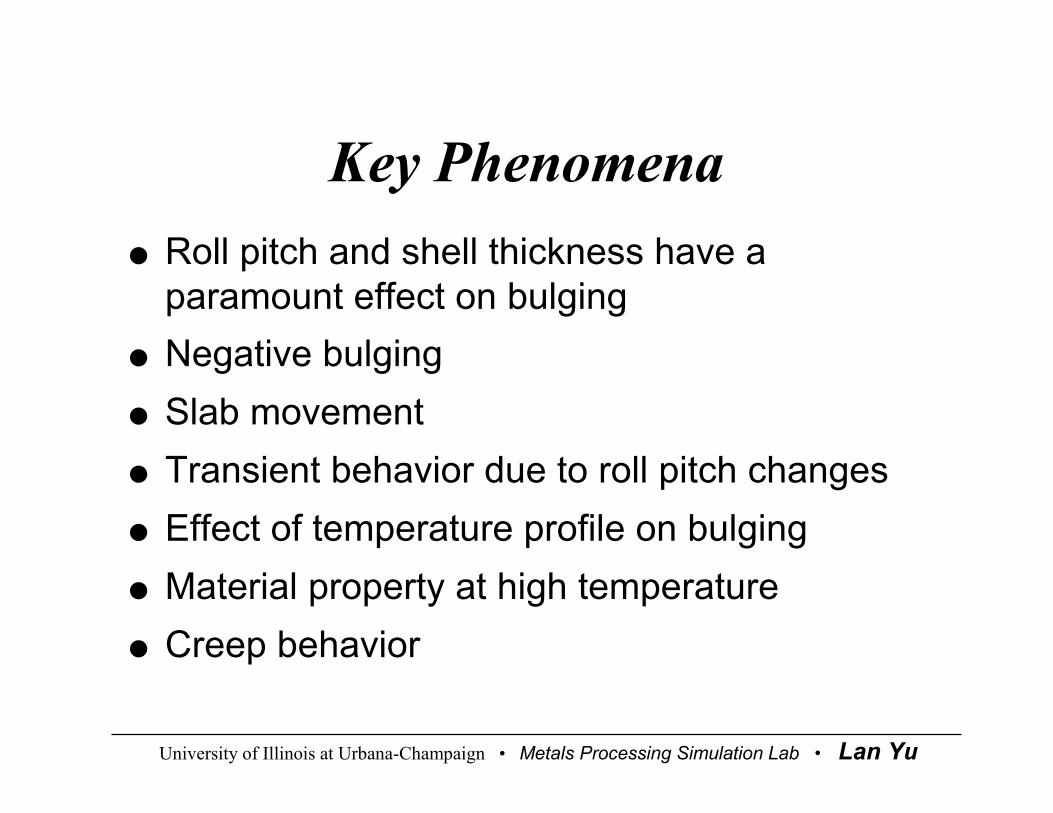
Key PhenomenaKey Phenomena� Roll pitch and shell thickness have a
paramount effect on bulging� Negative bulging� Slab movement � Transient behavior due to roll pitch changes� Effect of temperature profile on bulging� Material property at high temperature� Creep behavior
� Roll pitch and shell thickness have a paramount effect on bulging
� Negative bulging� Slab movement � Transient behavior due to roll pitch changes� Effect of temperature profile on bulging� Material property at high temperature� Creep behavior

University of Illinois at Urbana-Champaign • Metals Processing Simulation Lab • Lan Yu
Modeling MethodologyModeling Methodology� 2-D Finite Element Method thermal stress model with
Lagrangian approach is developed using commercial FEM package ABAQUS.
– Stress analysis– Nonlinear problem
� Simplifying Assumptions:– 2-D elastic-plastic model with plane stress assumption– Constant solidified shell thickness – Uniform ferrostatic pressure along x– Constant temperature gradient across the shell thickness
with uniform temperature profile along x
� 2-D Finite Element Method thermal stress model with Lagrangian approach is developed using commercial FEM package ABAQUS.
– Stress analysis– Nonlinear problem
� Simplifying Assumptions:– 2-D elastic-plastic model with plane stress assumption– Constant solidified shell thickness – Uniform ferrostatic pressure along x– Constant temperature gradient across the shell thickness
with uniform temperature profile along x

University of Illinois at Urbana-Champaign • Metals Processing Simulation Lab • Lan Yu
Define the ProblemDefine the Problem
Objectives:1. Suddenly drop one roll and keep other
rolls moving as usual, what is the difference from uniform roll pitch model?
2. What is the effect of roll misalignment on bulging?
3. Reproduce the simulation done byGancarz, Lamant, et al. Is their simulation correct?
Objectives:1. Suddenly drop one roll and keep other
rolls moving as usual, what is the difference from uniform roll pitch model?
2. What is the effect of roll misalignment on bulging?
3. Reproduce the simulation done byGancarz, Lamant, et al. Is their simulation correct?
Ferrostatic Pressure
Casting Speed, Vc
Liquid Steel
Solidifying Shell
FEM Domain
Multiple roll pitch bulging model (with at least 4 roll pitches)
Experimental bulging profile on Sumitomo andCalculations over 9 rolls done by Gancarz, Lamant, et al.

University of Illinois at Urbana-Champaign • Metals Processing Simulation Lab • Lan Yu
Wunnenberg Conditions for Bulging Calculation
Wunnenberg Conditions for Bulging Calculation
� Wunnenberg ConditionsSlab width = 1350 mm Roll pitch = 860 mmShell thickness = 79 mmT Liquidus = 1500 T Surface = 1000Liquid steel density = 7000Distance from meniscus = 3.9 mFerrostatic pressure = 0.26 MPaCasting speed = 0.85 m/min ( 14.2 mm/s )
� Wunnenberg Measurements - The bulging profile is asymmetric with maximum deflection of 6.5mm at 75% from upstream roll.
Distance from upstream roll @25% @50% @75%Displacement (mm) 3.0 5.7 6.5(max)
°C °Ckg / m3

University of Illinois at Urbana-Champaign • Metals Processing Simulation Lab • Lan Yu
Strain contour plot for a typical single roll pitch modelStrain contour plot for a typical single roll pitch model
1
2
3 1
2
3
DISPLACEMENT MAGNIFICATION FACTOR = 8.00
RESTART FILE = c2 STEP 157 INCREMENT 1
TIME COMPLETED IN THIS STEP 1.01 TOTAL ACCUMULATED TIME 304.
ABAQUS VERSION: 5.8-1 DATE: 05-APR-2000 TIME: 17:16:27
Total Strain in X direction
E11 VALUE-1.33E-02
-1.20E-02
-9.00E-03
-6.00E-03
-3.00E-03
-2.78E-17
+3.00E-03
+6.00E-03
+9.00E-03
+1.20E-02
+1.50E-02
+1.80E-02
+2.10E-02
+2.32E-02
0
0
0
0
0
0
Tension
Tension
Compression
Compression

University of Illinois at Urbana-Champaign • Metals Processing Simulation Lab • Lan Yu
Strain contour plot for an 8-roll 430mm pitch model with one roll missingStrain contour plot for an 8-roll 430mm pitch model with one roll missing
1
2
3 1
2
3
E11 VALUE-1.73E-02
-1.40E-02
-1.06E-02
-7.26E-03
-3.92E-03
-5.75E-04
+2.77E-03
+6.11E-03
+9.46E-03
+1.28E-02
+1.61E-02
+1.95E-02
+2.28E-02
+2.62E-02
DISPLACEMENT MAGNIFICATION FACTOR = 20.0
RESTART FILE = miss4 STEP 187 INCREMENT 11
TIME COMPLETED IN THIS STEP 1.01 TOTAL ACCUMULATED TIME 334.
ABAQUS VERSION: 5.8-1 DATE: 01-NOV-1999 TIME: 15:59:07
8-roll 430mm pitch model with one roll missing
Total Strain in X direction

University of Illinois at Urbana-Champaign • Metals Processing Simulation Lab • Lan Yu
-20
-15
-10
-5
0
5
10
0 430 860 1290 1720 2150 2580 3010 3440
Comparison of Bulging Profilebetween uniform roll pitch and sudden roll pitch change
Uniform 860mm roll pitch430mm roll pitch with one roll missing
Sur
face
Dis
plac
emen
t (m
m)
X (mm)
Difference430mm roll pitchwith one roll missing
Uniform 860mm roll pitch
75 %18.57 mm10.61 mmMaximum bulge152 %7.30 mm2.90 mmNegative bulge12.9 %2.62 %2.32 %Max strain on sol. front
64.2 %
59.2 %
• Sudden roll pitch change leads to larger Max bulge and much larger Negative bulge, but the change in Max tensile strain on solidification front is not as significant as that of Max bulge and Neg bulge.
•Maximum bulge is at about 60% of the roll pitch from the upstream roll. •Transient effect of sudden roll pitch change settles down in the following 4~5 roll pitches.

University of Illinois at Urbana-Champaign • Metals Processing Simulation Lab • Lan Yu
-20
-15
-10
-5
0
5
10
-8
-6
-4
-2
0
2
4
0 430 860 1290 1720 2150 2580 3010 3440
Bulging Profile on Surface and Strain Profile on Solidification Front
Surface displacement
Strain on solidification front(+ tension, - compression)
Sur
face
Dis
plac
emen
t (m
m)
Strain on S
olidification Front (%)
X (mm)
430mm roll pitch with one roll missing(infinity misalignment)+
++
+
-
--
•Negative bulge is important to tensile strain on solidification front, which is responsible for internal crack.
•Maximum tensile strain is located between maximum bulge and negative bulge, but not on maximum negative bulge point.

University of Illinois at Urbana-Champaign • Metals Processing Simulation Lab • Lan Yu
-20
-15
-10
-5
0
5
10
0 430 860 1290 1720 2150 2580 3010 3440
Effect of Misalignment on Bulging
1mm misalignment2mm misalignment3mm misalignment5mm misalignment10mm misalignment15mm misalignmentinfinity misalignm entmaximum bulgingeffective max misalignment
Sur
face
Dis
plac
emen
t (m
m)
X (mm)
Roll Pitch = 430 mm
17.43 mm
Effective Maximum Misalignment = 17.43 mm

University of Illinois at Urbana-Champaign • Metals Processing Simulation Lab • Lan Yu
-10
-5
0
5
10
15
20
-2
-1
0
1
2
3
4
0 5 10 15 20 25
Effect of Misalignment on Bulge and Max Strain on Solidification Front
Max bulge for 860mm roll pitchNeg bulge for 860mm roll pitchMax bulge for 430mm roll pitch with m isalignment Neg bulge for 430mm roll pitch with misalignment
Max strain for 860mm roll pitchMax strain on solidification front for 430mm roll pitch with misalignment
Bul
ge (
mm
)M
ax Strain on S
olidification Front (%)
Misalignment (mm)Small roll spacing 430mm
(no m isalignment)Double roll spacing 860mm
(infinity m isalignment)17.43 mm
Effective m ax misalignment
• Max bulge, Negative bulge and Max strain on solidification front are almost linear functions of misalignment till effective maximum misalignment (17.43mm).
• When actual misalignment is larger than effective maximum misalignment, it behaves like one rollis missing.

University of Illinois at Urbana-Champaign • Metals Processing Simulation Lab • Lan Yu
Effect of Misalignment on BulgingEffect of Misalignment on Bulging
Misalignment(mm)
Maximumbulge(mm)
Position fromupstream roll
Negativebulge(mm)
Ratio of neg. bulge tomax bulge
Max strain onsolidification front (%)
0(Roll spacing 430mm) 0.11 51.6% 0 0 0.046
1 1.05 54.2% 0.09 0.085 0.131
2 2.08 54.2% 0.34 0.163 0.249
3 3.12 55.8% 0.71 0.227 0.360
5 5.26 57.5% 1.64 0.312 0.686
10 10.65 59.2% 4.13 0.388 1.49
15 16.03 59.2% 6.38 0.398 2.28∞
(One roll missing)18.57 59.2% 7.30 0.393 2.62
Double roll spacing860mm 10.61 64.2% 2.90 0.273 2.32

University of Illinois at Urbana-Champaign • Metals Processing Simulation Lab • Lan Yu
Sumitomo ConditionsSumitomo Conditions
2.65
mR=3m28°
Cutoff Point
831.0
7.025.3 ≈−=
Pilot caster at Sumitomo Metals in Japan400 x 100 mm2 slabCasting Speed = 1.65 m/minCaster Radius (R) = 3 mMold Length = 0.7 mRoll Pitch (L) = 310 mmShell Thickness (D) = 23.17 mmHeight from Meniscus (H) = 2.65 mFerrostatic Pressure = 0.18 MPaSurface Temperature = 1220 oC
=> Distance from Meniscus = 3.25 m
# of rolls , the point of interest is around 8-9 rolls down the mold.
Measurement:1. Maximum bulging of 3.2 mm is at 60~65% of the roll pitch from the upstream roll. 2. There is a negative bulging at the vicinity of the supporting rolls. 3. The ratio between negative bulging and positive bulging is around 0.4.

University of Illinois at Urbana-Champaign • Metals Processing Simulation Lab • Lan Yu
Strain contour plot for roll pitch changing from 250mm to 310mmStrain contour plot for roll pitch changing from 250mm to 310mm
1
2
3 1
2
3
E11 VALUE-1.33E-02
-1.06E-02
-7.95E-03
-5.29E-03
-2.63E-03
+2.93E-05
+2.69E-03
+5.35E-03
+8.01E-03
+1.07E-02
+1.33E-02
+1.60E-02
+1.86E-02
+2.13E-02
DISPLACEMENT MAGNIFICATION FACTOR = 70.0
RESTART FILE = continue7 STEP 266 INCREMENT 8
TIME COMPLETED IN THIS STEP 1.01 TOTAL ACCUMULATED TIME 463.
ABAQUS VERSION: 5.8-1 DATE: 18-JAN-2000 TIME: 10:32:46
Roll pitch changing from 250mm to 310mm
Total Strain in X direction

University of Illinois at Urbana-Champaign • Metals Processing Simulation Lab • Lan Yu
-6
-4
-2
0
2
4
0 800 1600 2400 3200 4000 4800 5600
Comparison of Bulging Profile between uniform roll pitch and sudden roll pitch change
Sudden roll pitch change from 250mm to 310mmUniform 310mm roll pitch
-6
-4
-2
0
2
4
Sur
face
Dis
plac
emen
t (m
m)
Distance x (mm)
5.96
3.623.73
2.75
4.06
3.49 3.66 3.67
1.78
0.93
3.67
0.34

University of Illinois at Urbana-Champaign • Metals Processing Simulation Lab • Lan Yu
-6
-4
-2
0
2
4
-6
-4
-2
0
2
4
0 800 1600 2400 3200 4000 4800 5600
Bulging Profile on Surface and Strain Profile on Solidification Front
Surface displacement
Strain on solidification front
Sur
face
Dis
plac
emen
t (m
m)
Strain on S
olidification Front (%)
Distance x (mm)

University of Illinois at Urbana-Champaign • Metals Processing Simulation Lab • Lan Yu
ObservationsObservations� Current model qualitatively matches Sumitomo measurements and simulation by J. Gancarz,
et al.
* Surface temperature changed from 1220 oC to 1000 oC to account for property uncertainty.
� Sudden roll pitch change leads to a larger bulge and bigger tensile strain on solidification front.
� Disturbance from upstream rolls settles down (within 2%) after 4 roll pitches. � Maximum tensile strain on solidification front is located on top of the rolls, instead of
maximum negative bulge.
� Current model qualitatively matches Sumitomo measurements and simulation by J. Gancarz, et al.
* Surface temperature changed from 1220 oC to 1000 oC to account for property uncertainty.
� Sudden roll pitch change leads to a larger bulge and bigger tensile strain on solidification front.
� Disturbance from upstream rolls settles down (within 2%) after 4 roll pitches. � Maximum tensile strain on solidification front is located on top of the rolls, instead of
maximum negative bulge.
62%3.67 mm5.96 mmOur model *
80%2.0 mm3.6 mmJ. Gancarz et al. model
44%3.2 mm4.6 mmSumitomo measurements
Increase (sudden/uniform)Uniform 310mm roll pitchSudden change of roll pitch from 250mm to 310mm
20%
91%
62%
Increase (sudden/uniform)
1.75%2.1%0.2%Max strain on sol. front
0.93 mm1.78 mm0 mmNegative bulge
3.67 mm5.96 mm0.34 mmMaximum bulge
Uniform 310mm
Sudden change from 250mm to 310mm
Uniform 250mm

University of Illinois at Urbana-Champaign • Metals Processing Simulation Lab • Lan Yu
Temperature dependent stress-strain curves for plain carbon steel
Temperature dependent stress-strain curves for plain carbon steel
0
10
20
30
40
50
60
0 0.01 0.02 0.03 0.04 0.05
W ray data (0.051%C, 2.4e-3, 950 °C)W ray data (0.051%C, 2.9e-3, 1100 °C)W ray data ( 0.93%C, 2.3e-3, 1200 °C)Suzuki data (0.25%C, 6.7e-3, 1000 °C)Suzuki data (0.25%C, 6.7e-3, 1100 °C)Suzuki data (0.25%C, 6.7e-3, 1200 °C)Suzuki data (0.25%C, 6.7e-3, 1300 °C)Suzuki data (0.25%C, 6.7e-3, 1400 °C)Suzuki data (0.25%C, 6.7e-3, 1500 °C)
This work (950 °C)This work (1100 °C)This work (1200 °C)This work (1400 °C)This work (1500 °C)
Plastic Strain
Str
ess
(MP
a)
Linear kinematic hardening modelin ABAQUS
Experimental data ( %C, strain rate(s-1), temperature)

University of Illinois at Urbana-Champaign • Metals Processing Simulation Lab • Lan Yu
Roll Pitch StudyRoll Pitch Study
0.1
1
10
100
1000
300 400 500 600 700 800 900 1000
Bulging Displacement (mm)Standard W unnenberg Condition
Bul
ging
Dis
plac
emen
t, d m
ax (m
m)
Roll Pitch, L (mm)
dmax
= c1 * L6.34

University of Illinois at Urbana-Champaign • Metals Processing Simulation Lab • Lan Yu
Shell Thickness StudyShell Thickness Study
0.1
1
10
100
1000
104
20 30 40 50 60 70 80 90 100
Bulging Displacement (mm)Standard W unnenberg Condition
Bul
ging
Dis
plac
emen
t, d m
ax (
mm
)
Shell Thickness, D (mm)
dmax
= c2 * D-5.62

University of Illinois at Urbana-Champaign • Metals Processing Simulation Lab • Lan Yu
Ferrostatic Pressure StudyFerrostatic Pressure Study
0.1
1
10
100
1000
0.01 0.1 1
Bulging Displacement (mm)Standard W unnenberg Condition
Bul
ging
Dis
plac
emen
t, d m
ax (
mm
)
Ferrostatic Pressure, P (MPa)
dmax
= c3 * P1.99

University of Illinois at Urbana-Champaign • Metals Processing Simulation Lab • Lan Yu
Surface Temperature StudySurface Temperature Study
0
10
20
30
40
50
60
800 900 1000 1100 1200 1300
Bulging Displacement (mm)Standard W unnenberg Condition
Bul
ging
Dis
plac
emen
t, d m
ax (
mm
)
Surface Temperature, Tsurf
(°C)
dmax
= c4 * Tsurf
8.735
University of Illinois at Urbana-Champaign • Metals Processing Simulation Lab • Lan Yu
Bulging Prediction EquationBulging Prediction Equation
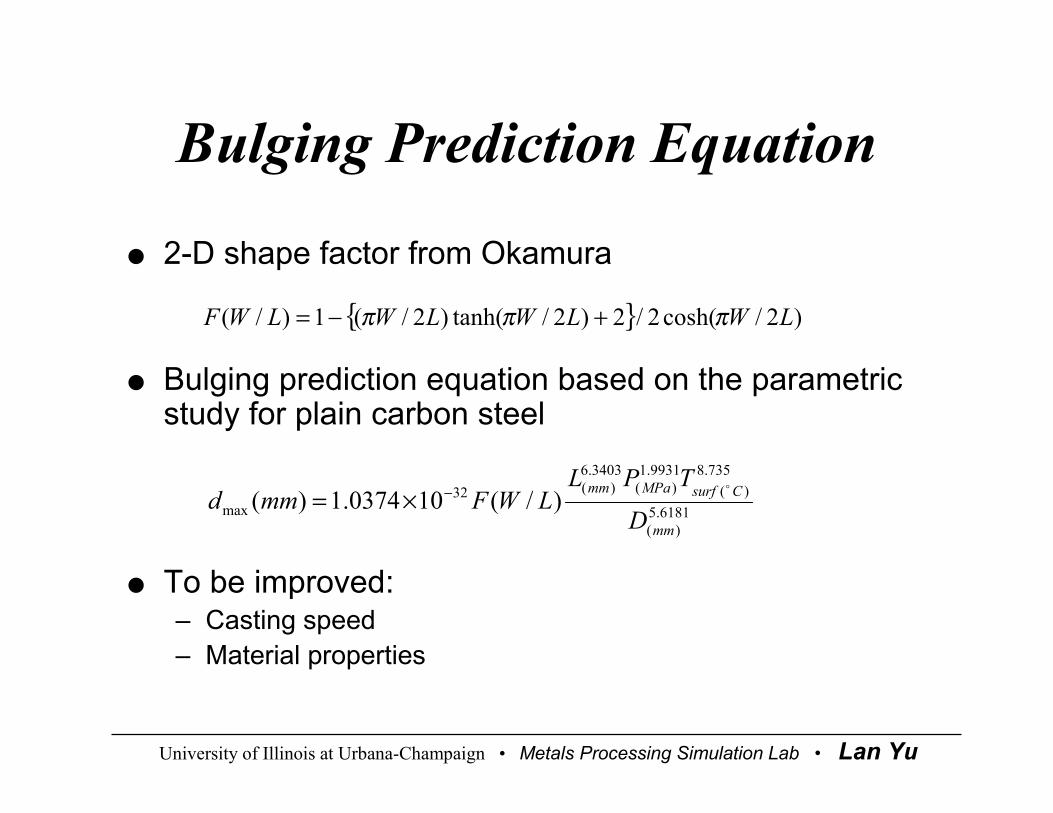
� 2-D shape factor from Okamura
� Bulging prediction equation based on the parametric study for plain carbon steel
� To be improved:– Casting speed– Material properties
� 2-D shape factor from Okamura
� Bulging prediction equation based on the parametric study for plain carbon steel
� To be improved:– Casting speed– Material properties
{ } )2/cosh(2/2)2/tanh()2/(1)/( LWLWLWLWF πππ +−=
6181.5)(
735.8)(
9931.1)(
3403.6)(32
max )/(100374.1)(mm
CsurfMPamm
D
TPLLWFmmd
o−×=

University of Illinois at Urbana-Champaign • Metals Processing Simulation Lab • Lan Yu
Temperature dependent stress-strain curves for stainless steel
Temperature dependent stress-strain curves for stainless steel
1.Kyoto University, Nippon Steel Corp. et al., “Data sheet of high temperature mechanical behavior of steel”, in Metallurgy and Mechanics of Continuous Casting, ISIJ, Tokyo, Japan, 1985, pp. 343-344.
1.Kyoto University, Nippon Steel Corp. et al., “Data sheet of high temperature mechanical behavior of steel”, in Metallurgy and Mechanics of Continuous Casting, ISIJ, Tokyo, Japan, 1985, pp. 343-344.
[1][1]
0
5
10
15
20
25
0 0.2 0.4 0.6 0.8 1
1000 °C1100 °C1200 °C1300 °C1400 °C
ABAQUS (1000 °C)ABAQUS (1100 °C)ABAQUS (1200 °C)ABAQUS (1300 °C)ABAQUS (>=1400 °C)
Str
ess
(MP
a)
P lastic Strain (%)
Experimental data for stainless steel (430)
at strain rate of 6.67x10⁻⁴

University of Illinois at Urbana-Champaign • Metals Processing Simulation Lab • Lan Yu
Armco Case StudyArmco Case Study
� Material property has a paramount effect on bulging� Material property has a paramount effect on bulging
Our Equation
Stainless steel
Plain carbon steel
0.02060.04746.8256
0.02870.03158.88dmax (mm)
0.01840.02400.6548
100010001000Surface temperature, Tsurf (oC)
0.12350.04460.0223Ferrostatic pressure, P (MPa)
28.31712Shell thickness, D (mm)
165165330Roll pitch, L (mm)
Case 3Case 2Case 1

University of Illinois at Urbana-Champaign • Metals Processing Simulation Lab • Lan Yu
Case 1 (330mm roll pitch)Case 1 (330mm roll pitch)
� Surface strain ranging from –0.8%~0.4%� Average strain rate is around 6.67x10⁻⁴ s-1
� Surface strain ranging from –0.8%~0.4%� Average strain rate is around 6.67x10⁻⁴ s-1
-0.008
-0.006
-0.004
-0.002
0
0.002
0.004
0.006
0.008
0 40 80 120 160 200 240 280 320
Strain rate
Strain rate magnitudeAverage strain rate
Col
d fa
ce s
train
rate
(s-1
)Distance (mm)
6.67x10 -4 s-1
-1
-0.8
-0.6
-0.4
-0.2
0
0.2
0.4
0 40 80 120 160 200 240 280 320
Strain
Col
d fa
ce s
trai
n (%
)
Distance (mm)

University of Illinois at Urbana-Champaign • Metals Processing Simulation Lab • Lan Yu
Evaluation of Empirical Bulging Prediction Equations
Evaluation of Empirical Bulging Prediction Equations
� Okamura Equation (based on FEM simulations):
Where,
� Palmaers Equation (based on beam bending analysis):
where,
� Lamant Equation (based on beam bending analysis):
� Okamura Equation (based on FEM simulations):
Where,
� Palmaers Equation (based on beam bending analysis):
where,
� Lamant Equation (based on beam bending analysis):
nc
msurf
lkjb VTLPDLWAFd )/(,max =ε
47.54.0
18.216.714
max ))273(003866.0exp(104088.7DVHLTd
csurf +×= −
8.322.0
12.55.1
max )(4623.0DVLPTCd
csurf=
°=×°=×°=×
=−
−
−
C1100 10929.0C1000 10725.0C900 10609.0
)(4
4
4
surf
surf
surf
surf
TTT
TC
{ } )2/cosh(2/2)2/tanh()2/(1)/( LWLWLWLWF πππ +−=

University of Illinois at Urbana-Champaign • Metals Processing Simulation Lab • Lan Yu
Comparison of Different ModelsComparison of Different Models
* Must use surface temperature = 1100 oC instead of 1220 oC, so prediction is really higher. ** Surface temperature of 1000 oC is used instead of 1220 oC.
Conclusion: ❏ Okamura Equation is always much too low.❏ Lamant Equation is ok except for Armco case 3 (too low).❏ Palmaers Equation matches measurements and our model pretty well.
0.02063.5667 **6.256Our EquationOur model
(raw / adjusted)
N/A3.25~7Measurement
0.0184 / 0.01843.67 / 1.79 **10.61 / 6.64
0.00333.83849.0123Lamant Equation
0.03323.5596 *10.2025Palmaers Equation
0.00120.46801.4985Okamura Equation
Armco case 3 (165mm)
Sumitomo case (310mm)
Wunnenberg case (860mm)

University of Illinois at Urbana-Champaign • Metals Processing Simulation Lab • Lan Yu
Future WorkFuture Work
� Need more appropriate material properties at high temperature for each individual case
� Results should be more quantitative� Applications
– Crack formation– Slab width prediction
� Need more appropriate material properties at high temperature for each individual case
� Results should be more quantitative� Applications
– Crack formation– Slab width prediction

University of Illinois at Urbana-Champaign • Metals Processing Simulation Lab • Lan Yu
Slab Width PredictionSlab Width Prediction
� Possible slab distortion mechanisms– Creep due to ferrostatic pressure– Bulging ratcheting effect
✦ Ferrostatic pressure ✦ Roll distortion
– Roll friction / thermal shrinkage ratcheting– Narrow face bulging
� Possible slab distortion mechanisms– Creep due to ferrostatic pressure– Bulging ratcheting effect
✦ Ferrostatic pressure ✦ Roll distortion
– Roll friction / thermal shrinkage ratcheting– Narrow face bulging

Bulging Calculation and Slab Width Change
Roll number Predicted bulging displacement (mm)
Slab width change due to bulging (mm)
------------------------------------------------------------------------------------------- 1 0.11942 1.5281e-05 2 0.28486 0.00017581 3 0.24819 0.00012889 4 0.20443 8.1362e-05 5 0.17293 5.2825e-05 6 0.14554 3.1893e-05 7 0.13665 2.5867e-05 8 0.23562 0.00011430 9 0.31711 0.00022241 10 0.25355 0.00013535 11 0.21009 8.6989e-05 12 0.18969 6.7413e-05 13 0.15023 3.5219e-05 14 0.11892 1.4990e-05 15 0.27250 0.00015928 16 0.58235 0.00079506 17 0.49881 0.00057825 18 0.42561 0.00041583 19 0.37769 0.00032345 20 0.33457 0.00024972 21 0.50388 0.00059045 22 0.24225 0.00012191 23 0.20463 8.1553e-05 24 0.17266 5.2606e-05 25 0.15376 3.7792e-05 26 0.13770 2.6560e-05 27 0.23118 0.00010933 28 0.12053 1.5919e-05 29 0.11656 1.3658e-05 30 0.10718 8.6223e-06 31 0.10097 5.5177e-06 32 0.095060 2.7379e-06 33 0.17286 5.2766e-05 34 0.17696 5.6210e-05 35 0.16001 4.2505e-05 36 0.13810 2.6825e-05 37 0.11896 1.5017e-05 38 0.13535 2.5019e-05 39 0.090328 6.3209e-07
------------------------------------------------------------------------------------------- Accumulated slab width change = 0.004978 mm Mold width = 1111.0 mm Measured slab width = 1138.5 mm Narrow face bulging = 7.9 mm Thermal shrinkage = 7.3 mm Accumulated slab width change due to bulging = 0.005 mm