building on strengths · development of new formulations for andas filings and new products for...
TRANSCRIPT

Building on
Strengths
Annual Report 2016-17
Forward-Looking Statements
In this annual report, we have disclosed forward-looking information to enable investors to comprehend our prospects and take informed investment decisions. This report and other statements, written and oral, that we periodically make contain forward-looking statements that set out anticipated performance/results based on the management’s plan and assumptions. We have tried wherever possible to identify such statements by using words such as ‘anticipate’, ‘estimate’, ‘expects’, ‘project’, ‘intends’, ‘plans’, ‘believes’ and words of similar substance in connection with any discussion of future performance. We cannot guarantee that these forward-looking statements will be realised, although we believe we have been prudent in assumptions. The achievement of results is subject to risks, uncertainties and realisation of assumptions. Should known or unknown risks or uncertainties materialise or should underlying assumptions prove inaccurate, actual results could vary materially from those anticipated, estimated or projected. Readers should bear this in mind.
Corporate Overview Reports & Financial Statements
2 Chairman’s Statement4 Domestic Formulations6 Exports10 Corporate Social Responsibility11 Financial Highlights12 Board of Directors13 Corporate Information
14 Directors’ Report48 Corporate Governance Report63 Business Responsibility Report
Standalone Financial Statement69 Auditors’ Report74 Balance Sheet75 Profit & Loss Statement76 Cash Flow Statement78 Notes
Contents
Consolidated Financial Statement124 Auditors’ Report126 Balance Sheet127 Profit & Loss Statement128 Cash Flow Statement130 Notes
180 Ten Year Financial Summary
JBCPL, one of India’s leading pharmaceutical companies, manufactures & markets a diverse range of pharmaceutical formulations, herbal remedies and APIs. JBCPL exports to many countries worldwide with presence in US, Europe, Australia, South Africa, other developing countries, Russia and CIS. The Company continues to invest in growing its share in the regulated markets in USA, Europe and Australia. JBCPL has a strong R&D and regulatory set-up for development of new drug delivery system and formulations, filing of ANDAs and DMFs. Its state-of-the-art manufacturing facilities are approved by health authorities of key regulated markets.

Our Founders
They are the founders... their vision, passion, perseverance and guidance is what helps JBCPL grow...
Shri Jyotindra B. Mody (Centre), Shri Dinesh B. Mody (first from left) and Shri Shirish B. Mody (third from left)

2
Annual Report 2016-17J. B. Chemicals & Pharmaceuticals Limited
Chairman's Statement
J.B. ModyChairman & Managing Director
“R&D is currently focussed on the development of new formulations for ANDAs filings and new products for Russian market, new drug delivery systems and new formulations and APIs.”
PERFORMANCEThe financial performance of your Company during FY 2016-17 fell short of our target and expectations. It was foreign currency volatility in emerging markets and resultant business uncertainty that impacted both sales and profits. I believe that creating a more focussed approach in some of the markets will yield better results in the future.
Total standalone revenue from operations for FY 2016-17 stood at ` 1,198.69 crores, which represents a growth of 2.90%. The lower sales growth also resulted into lower profits. The profit before tax which stood at ̀ 216.78 crores was 6.03% lower over the previous year, while profit after tax for the year at ` 170.26 crores was 4.83% lower over the previous year.
However, performance at group level was satisfactory. Consolidated revenue from operations for the year at ` 1,368.31 crores were 11.10% higher over the previous year. While consolidated profit before tax and consolidated profit after tax at ` 229.94 crores and `181.35 crores were 8.35% and 11.79% higher respectively. Consolidated earnings per share (FV ` 2) stood at ` 21.42.
I shall now touch upon your Company’s main businesses, their performance and our plans going forward.
DOMESTIC FORMULATIONS BUSINESSI would like to share with you that domestic formulations business of your Company continued to register impressive performance. The strategy to identify potential brands in growing therapeutic segments and focus on building those brands has paid good dividends. With net sales of ` 477.69 crores, the domestic formulations business achieved good growth of 17.27% against the industry growth of 9.2% (IMS, March 2017). I am particularly happy to share with you that relatively a young brand in anti-hypertensive segment has crossed the ` 100 crores mark in sales during the year. The Company is ranked 35th in the domestic industry (IMS MAT March 2017). The Company’s three brands viz. Cilacar (calcium channel blocker), Rantac (anti-peptic ulcerant) and Metrogyl (amoebicides) feature in top 300 brands in value terms and top 100 brands in unit terms (IMS, MAT March 2017).
In order to grow this business at a faster pace, the Company has added over 600 medical representatives during the last quarter of the year. The Company has divided the existing division into 2 divisions by splitting the products and the field force and then filled back 600 people to balance each of the teams. The objective is to improve the focus on key doctors. In addition, this creates capacity to efficiently handle more products as well. This is expected to bring in growth from current year onwards. This investment in marketing may impact bottom line in the short term but is expected to add to sales and profits in the long run. This increased strength of medical representatives will help focus on many of the products that were not getting adequate attention. This should lead to an all-round growth.
The future outlook of the domestic formulations industry appear positive in view of improved healthcare access and increasing per capita consumption of drugs. The Company is seized of the available opportunity and has been re-positioning itself with enhanced investment in products, people and processes to achieve its growth objective.

3
Corporate Overview Statutory Reports Standalone Financial Statement Consolidated Financial Statement
01-13 14-68 69-123 124-179
at Panoli, Gujarat has been commissioned. The capex on new projects amounted to over ` 175 crores, which have been funded out of internal accruals.
RESEARCH & DEVELOPMENT (R&D)The R&D division continues to play an important role in your Company’s growth. R&D is currently focussed on the development of new formulations for ANDAs filings and new products for Russian market, new drug delivery systems and new formulations and APIs. Our R&D has been playing an important role in the growth of exports. Let me underline that R&D activities will continue to remain in the forefront for driving future growth of your Company. We are hopeful that our R&D initiatives will foster growth going forward.
BUY-BACK OF SHARESWith the object to partly return cash to the shareholders, your Board approved buy-back up to 12,50,000 equity shares of FV of ` 2 for cash at ` 400 per equity share. This buy-back received thumbs-up from the shareholders and the Company received bids for over 1.20 crore equity shares. This has resulted in an outgo of ` 50 crores excluding transaction costs. The Company’s outstanding paid-up equity shares have accordingly reduced to 8,35,69,975.
CHALLENGES AHEADLike all businesses, there are challenges that we have to face. For the domestic market, Government’s stand on generic business and fixed dose combinations, and price controls pressure, are some of the hurdles that we face. For the international business, currency volatility and changing regulatory environment are the challenges, to name a few.
With a focus on building brands and increasing operations size in the domestic business, we are hopeful of a bright future. With the focus on US business and contract manufacturing, we are hopeful for a revival in the global business.
STAKEHOLDERS’ SUPPORTI take this opportunity to thank members of the medical profession, trade, institutions, government & semi-government hospitals, customers and shareholders for their continued trust and support. On behalf of the management of JBCPL, I would also like to thank all the employees of the Company for their deep commitment to achieving the Company’s objectives. I am confident that with this commitment and support, your Company will continue to surge ahead.
J.B. Mody
Chairman & Managing Director
The contrast media products in the domestic market achieved growth of 8.91% at sales of ` 43.91 crores. This business is fraught with intense competition in domestic market. In order to consolidate Company’s position, we plan to moderately increase medical representatives in this business too and launch few new products in the current year.
EXPORTSOverall exports of formulations amounted to ` 524 crores during the year, a decline of 1.44% over the previous year. It was in Global business (other than Russia-CIS) that exports at ` 378.16 crores were lower by 3.21% in Rupee terms. The exports of formulations were affected in Emerging Markets due to high volatility of local currencies against US Dollar leading to uncertainty in the market sentiments. This affected both the demand as well as tightened the payment situation. However, sales in regulated markets of US and Australia were satisfactory.
The focus of the Company will be to try and maintain the generic business in these emerging markets while increasing the focus on ANDA products for the US market. The investments in ANDAs is on rise for future growth in the business. We now have 10 approved ANDAs and 5 ANDAs are pending approval. During the current year, the Company plans to file about 4 more ANDAs. In addition, focus is being given to the contract manufacturing/site variation opportunities for larger companies.
The Company’s South African subsidiary, Biotech Laboratories (Pty.) Ltd., performed reasonably well in given circumstances. It recorded revenue of 342.73 million Rand and profit before tax of 20.08 million Rand. This strategic investment will allow your Company to expand its business in South Africa and SADC countries, which hold good growth potential. Biotech’s broad- based product basket with strong marketing reach will help Company strengthen its presence in this region.
On the other hand, Russia business is gradually improving. During the year, primary exports amounted to ` 60.65 crores, a 15.61% increase over the previous year. The currency in Russia is gradually strengthening and returning to normal and we expect growth in secondary sales. In order to consolidate the business, the Company has identified several OTC and prescription products, which are under clinical trial. The Company will continue to invest and grow in the Russian market. However, CIS markets are still sluggish and present weak business sentiment.
API BUSINESS The sales in API business at ` 91.70 crores were lower over the previous year. However, we do expect to grow the sales this year.
CAPEX New capex undertaken for creation of additional capacity for the formulations business including tablets, liquid, ointments, vials, eye drops and lozenges and creation of additional capacity for the API business is over and new tablets and capsules facility

4
Annual Report 2016-17J. B. Chemicals & Pharmaceuticals Limited
Domestic Formulations During FY 2016-17, the domestic formulations’ net sales at ` 477.69 crores registered a good growth of 17.27% against industry growth of 9.2% (IMS). The focus products group continued to register a healthy growth. The strategy to harness the potential of focus products coupled with scientific and concept-oriented promotion have helped growth. During the year, all regions of the market have shown growth.
In order to expand the business, the Company has added over 600 medical representatives during the last quarter of the year. The Company has divided the existing division into 2 divisions and then added 600 people to balance each of the teams. The objective is to improve the focus on key doctors. In addition, this creates capacity to efficiently handle more products. This is expected to bring in growth from current year onwards. The Company has chalked out aggressive strategy to fast grow this business. This investment in marketing may impact bottom line in the short
Mr. Shirish B. ModyWhole time Director (Marketing)
term but is expected to add to sales and profits in the long run. The total strength of medical representatives is now above 1,400. This increased strength will enable focus on all product categories and product mix.
The Company is ranked 35th in the domestic industry (IMS MAT March 2017). The Company’s three brands viz. Cilacar (calcium channel blocker), Rantac (anti-peptic ulcerant) and Metrogyl (amoebicides) feature in top 300 brands in value terms and top 100 brands in unit terms (IMS, MAT March 2017). The sustained brand building efforts in cardiac, gastro intestinal, pain management and topical anti-infective segments have met with good success.
New products introduced during the year in cardiovascular and pain management segment have performed reasonably well and hold good growth potential. The Company this year plans to launch new products in dermatology and wound management segment to broadbase the products basket.
The sustained brand building efforts in cardiac, gastro intestinal, pain management and topical anti-infective segments have met with good success.
5
Corporate Overview Statutory Reports Standalone Financial Statement Consolidated Financial Statement
01-13 14-68 69-123 124-179
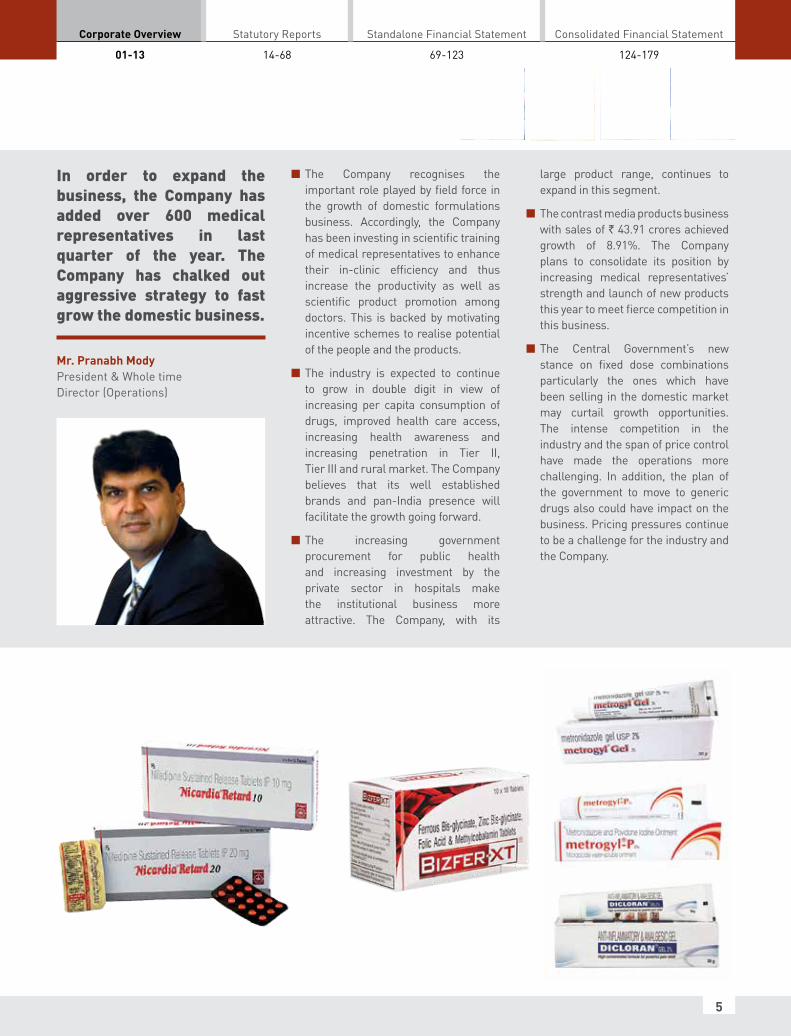
Mr. Pranabh ModyPresident & Whole time Director (Operations)
The Company recognises the important role played by field force in the growth of domestic formulations business. Accordingly, the Company has been investing in scientific training of medical representatives to enhance their in-clinic efficiency and thus increase the productivity as well as scientific product promotion among doctors. This is backed by motivating incentive schemes to realise potential of the people and the products.
The industry is expected to continue to grow in double digit in view of increasing per capita consumption of drugs, improved health care access, increasing health awareness and increasing penetration in Tier II, Tier III and rural market. The Company believes that its well established brands and pan-India presence will facilitate the growth going forward.
The increasing government procurement for public health and increasing investment by the private sector in hospitals make the institutional business more attractive. The Company, with its
large product range, continues to expand in this segment.
The contrast media products business with sales of ` 43.91 crores achieved growth of 8.91%. The Company plans to consolidate its position by increasing medical representatives’ strength and launch of new products this year to meet fierce competition in this business.
The Central Government’s new stance on fixed dose combinations particularly the ones which have been selling in the domestic market may curtail growth opportunities. The intense competition in the industry and the span of price control have made the operations more challenging. In addition, the plan of the government to move to generic drugs also could have impact on the business. Pricing pressures continue to be a challenge for the industry and the Company.
In order to expand the business, the Company has added over 600 medical representatives in last quarter of the year. The Company has chalked out aggressive strategy to fast grow the domestic business.

6
Annual Report 2016-17J. B. Chemicals & Pharmaceuticals Limited
Exports The Company’s total formulations exports amounted to ` 524 crores against ` 532 crores in the previous year. Exports to Global markets (other than Russia-CIS region) at sales of ` 378.16 crores were 3.32% lower mainly due to currency depreciation against US Dollar in emerging markets and political/business uncertainties in these markets. However, exports to regulated markets of US and Australia were satisfactory.
Consistent growth in the US ANDA business has made the US sales sizeable for the Company, which amounted to USD 15.57 million during the year. During FY 2016-17, the Company received US FDA approval for Oxybutynin Extended-Release tablets and Glipizide Extended-Release tablets, which have been commercialised. ANDA products and
contract manufacturing have been identified as growth drivers for the Global business. The Company now has 10 approved ANDAs and 5 ANDAs are pending approval. During the current year, the Company plans to file about 4 more ANDAs.
Primary exports for Russia-CIS market at ` 60.65 crores registered growth of 15.61%. Russia is a potential market and continues to remain focus market for the Company. The Company will continue to invest and grow in the market. The Company has been in the process of building portfolio of new OTC and prescription products for the Russian market to grow the business and make it more viable. However, the new products identified are under clinical trial process as per new regulatory requirement and will take some more time to reach the market. On the other hand, CIS markets have still not recovered and suffer from weak economic situation. The business environment there is not conducive for growth.
During the year, operations of the Company’s Russian subsidiary were profitable. The currency volatility situation in Russia is gradually
Consistent growth in the US ANDA business has made the US sales sizeable for the Company.
Mr. Dinesh B. ModyWhole time Director (Administration)
Mr. Shekhar Nadkarni Mr. Ravi Gulgule
US Business Partner
Silver award was conferred on JBCPL by United States Pharmacopeia (USP) as a part of its donor recognition program in recognition of the Company’s participation in Monograph Development and Upgradation Program and preparation and distribution of USP reference substances.
Award

7
Corporate Overview Statutory Reports Standalone Financial Statement Consolidated Financial Statement
01-13 14-68 69-123 124-179
returning to normal and we expect growth in secondary sales. The subsidiary also plans to undertake expansion of field force for better coverage of the products.
API exports for the year were ` 90.87 crores against ` 99.70 crores in the previous year.
During the year, the Company’s South African subsidiary, Biotech Laboratories (Pty.) Ltd. (“Biotech”), recorded revenue of 342.73 million
Rand and profit before tax of 20.08 million Rand. The Company has granted a license to Biotech for about 75 dossiers registered with MCC, South Africa. Biotech plans to market about 4-5 dossiers this year. Biotech’s existing business and product pipeline hold high growth potential.
High focus on contract manufacturing projects in the area of lozenges, tablets, ointments, creams and gels from multinational companies have been consistently doing well. During the year, the Company added 9 more products in this segment. The Company’s State-of-the-Art manufacturing facilities with approvals from international health authorities such as US FDA, EU GMP, TGA Australia, MCC South Africa, MoH Ukraine and MoH Japan with strong manufacturing, regulatory and development support give the Company the needed platform to succeed.
New formulations plant for tablets and capsules at Panoli has been commissioned. This plant has been built as per US FDA requirement and will primarily cater to US and regulated markets exports business.
Mr. Jay MehtaSr. Vice President - (International Division)
Mr. Nirav ModySr. Vice President - Strategic Marketing and Business Development
Mr. Sandeep NasaHead - Russia-CIS business
From right to left – Stewart Barker (Chief Executive Officer), Motshabi Kgantsi (RA Manager & Responsible Pharmacist), Mandy Burstein (Finance Executive) and Christa Bester (New Business Executive).
The Company continues to manufacture and supply OTC products to Cilag GmbH international. This business is expected to grow in view of return of normalcy in the Russian market.
The international business faces challenges such as currency volatility, price erosion, increased competition in generics business and changing regulatory environment. However, the Company is optimistic about its growth prospects.

8
Annual Report 2016-17J. B. Chemicals & Pharmaceuticals Limited
State-of-the-art Tablets manufacturing facility at Panoli, Gujarat
Sr. No. Health Authority Facility Approved
1 US FDA Tablets, APIs
2 EU GMP Tablets, Lozenges
3 MCC, South Africa Tablets, Injections, Lozenges
4 TGA, Australia Tablets, Lozenges, Ointments, Gel, Creams, Liquid
5 PIC/S (MOH, Ukraine) Tablets, Lozenges, Injections, Liquid, Ointments, Gel, Creams, Powder
6 Health Canada Herbal Syrup and Lozenges
7 MOH, Japan API
Mr. Bharat P. MehtaWhole time Director (Planning & Development)

9
Corporate Overview Statutory Reports Standalone Financial Statement Consolidated Financial Statement
01-13 14-68 69-123 124-179
State-of-the-art Formulations manufacturing facility at Panoli, Gujarat
State-of-the-art US FDA approved API facility at Panoli, Gujarat State-of-the-art Tablets and Lozenges manufacturing facility at Kadaiya, Daman
Mr. Kamlesh L. UdaniExecutive Director (Technical & Production)

10
Annual Report 2016-17J. B. Chemicals & Pharmaceuticals Limited
Corporate Social Responsibility
The Company’s philosophy is to conduct its business in a socially, environmentally and ethically responsible manner and contribute to the society and environment in which it operates; with an aim to assist people at large to improve their life or condition.
The promoters of the Company have long been involved in ‘giving back to society’ and have regularly supported and contributed to a variety of causes including relief and rehabilitation, promotion of education, provision of free or affordable medical facilities, child and women development schemes, etc. The operating philosophy of the Company has been guided by this approach and the Company too has been regularly contributing to socially responsible activities as an integral part of its governance.
The Company has formulated a CSR Policy not only to ensure compliance but also to carry out CSR activities in a structured manner. The objective of the Policy is to strive to create and/or encourage positive impact on the society at large through CSR activities or projects undertaken by the Company. At present, the Company undertakes CSR activities/projects in the area of promotion of education, promoting health care including preventive health care and eradication of hunger, poverty and malnutrition in poor people. Some of the projects/activities undertaken during the year are as under:
The Company continued its contribution to corpus of Ankleshwar Industrial Development Society towards treatment of poor patients at Smt. Jayaben Mody hospital run by the said society.
The Company continued its contribution to corpus of Shree Sardar Vallabhbhai Patel Rotary General Hospital Trust, which runs Sardar Patel Hospital and Heart Institute in Ankleshwar for treatment of poor and unprivileged patients. The Company places importance on providing free
and/or affordable medical facility to needy people in and around Ankleshwar, where the Company has its manufacturing facilities.
The Company through an NGO also undertook the project for providing nutrition to cancer affected children at various government and charitable cancer centres and hospitals pan India.
The Company provided free medicines to Shrimad Rajchandra Hospital for treatment of poor patients and also to poor and needy people in Solapur.
The Company contributed to Shrimad Rajchandra Educational Trust for setting up of Chemistry Laboratory in
a new science college under the name Shrimad Rajchandra Vidyapeeth set up at Dharampur, Gujarat.
The Company continued its contribution to Ashoka University corpus of International Foundation for Research and Education for scholarships to poor students at undergraduate/post graduate level.
The Company contributed to NGO’s project for re-instatement and nurturing of school dropout children in rural areas of Maharashtra.
Smt. Jayaben Mody Hospital at Ankleshwar, Gujarat
Shri Dinesh B. Mody (fourth from left) was fecilitated by Shri Pranab Mukherjee, President of India, in recognition of the Company’s contribution to Sardar Patel Hospital and Heart Institute, Ankleshwar.

11
Corporate Overview Statutory Reports Standalone Financial Statement Consolidated Financial Statement
01-13 14-68 69-123 124-179
Financial Highlights
Share Capital + Reserves & Surplus (` in crores)
Book Value (in `)
(` in crores)Sales & Profit before Exceptional item and tax (` in crores)
Investments + Cash & Bank Balance / Borrowings
Distribution of Revenue 2016-17
Sales Profit before Exceptional item and tax
2016-17
216.
78
1,16
7.45
2015-16
230.
69
1,13
6.53
2014-15
159.
10
1,13
5.23
2013-14
158.
49
946.
96
2012-13
107.
74
804.
80
2016-17
1,38
7.86
2015-16
1,22
2.71
2014-15
1,23
2.56
2013-14
1,04
7.81
2012-13
1,00
9.00
2016-17
163.
62
2015-16
144.
15
2014-15
145.
34
2013-14
123.
66
2012-13
119.
12Investments + Cash & Bank Balance Borrowings
2016-17
48.8
6
415.
21
2015-16
174.
40
485.
86
2014-15
105.
22
558.
36
2013-14
92.7
8
508.
53
2012-13
49.6
1
530.
75
35.77
13.08
0.68
5.73
3.72
25.53
0.4015.09
Cost of materials
Employee benefits expense
Finance costs
Depreciation & Amortisation
Other expenses
Duties and taxes
Dividend
Retained earning

12
Annual Report 2016-17J. B. Chemicals & Pharmaceuticals Limited
Board of Directors
Durga Dass ChopraIndependent Director
Bharat P. MehtaWhole time Director (Planning & Development)
Pranabh ModyPresident & Whole time Director (Operations)
Rajiv C. ModyIndependent Director
Dr. Manoj R. Mashru Independent Director
Devang R. ShahIndependent Director
Shaukat H. MerchantIndependent Director
Kamlesh L. UdaniExecutive Director (Technical & Production)
Dr. Satyanarain AgarwalaIndependent Director
Krupa R. GandhiIndependent Director
Jyotindra B. ModyChairman & Managing Director
Dinesh B. ModyWhole time Director (Administration)
Shirish B. ModyWhole time Director (Marketing)

13
Corporate Overview Statutory Reports Standalone Financial Statement Consolidated Financial Statement01-13 14-68 69-123 124-179
AUDIT COMMITTEEMr. Durga Dass Chopra (Chairman) Mr. Dinesh B. ModyMs. Krupa R. GandhiDr. Satyanarain Agarwala
CORE TECHNICAL TEAMMr. Bharat P. Mehta, Whole time director (Planning & Development)Mr. Kamlesh Udani, Executive director (Technical & Production)Dr. Milind Joshi, President – Global Regulatory ManagementMr. Parmeshwar Bang, Vice President - WorksMr. M. K. Karve, Quality Controller - Corporate QA
COMPANY SECRETARYM. C. Mehta
AUDITORSJ. K. Shah & Co. Chartered AccountantsMumbai
BANKERSBank of India BNP Paribas Standard Chartered BankCitibank N. A.
BUSINESS MANAGEMENT TEAM Mr. Jyotindra B. Mody, Managing directorMr. Dinesh B. Mody, Whole time director (Administration)Mr. Shirish B. Mody, Whole time director (Marketing)Mr. Pranabh Mody, President & Whole time director (Operations)Mr. P. K. Singh, President - Global Business Mr. Nirav Mody, Sr. Vice President - Strategic Marketing and Business DevelopmentMr. Jay Mehta, Sr. Vice President – International DivisionMr. Savya Sachi, Director - Marketing & Sales (DBU)Mr. Bhushan Sachdev, Vice President – Supply Chain ManagementMr. Vijay Bhatt, Chief Financial OfficerMr. B. K. Dhar, General Manager - API (Marketing)Mr. Mitesh Kothari, General Manager - Diagnostic
REGISTERED OFFICENeelam Centre, ‘B’ Wing 4th floor, Hind Cycle Road Worli, Mumbai 400 030. Tel No.(022) 2482 2222
CORPORATE OFFICE Cnergy IT Park,Unit A2, 3rd floor, Unit A, 8th floor,Appa Saheb Marathe Marg,Prabhadevi,Mumbai 400 025. Tel No.(022) 24395200/24395500 Fax No.(022) 2431 5331/24315334Website : www.jbcpl.comEmail id for investors: [email protected]@jbcpl.com
REGISTRARS & SHARE TRANSFER AGENT Datamatics Financial Services Ltd.Plot B-5, Part- B, Cross Lane, M.I.D.C., Andheri (East),Mumbai 400 093.Tel No. (022) 6671 2001-06Fax No. (022) 6671 2011
CORPORATE INFORMATION

Annual Report 2016-17J. B. Chemicals & Pharmaceuticals Limited
14
DIRECTORS’ REPORT
Your directors are pleased to present the forty first report and audited financial statement of the Company for the year ended on March 31, 2017.
1. FINANCIAL HIGHLIGHTSThe following is the highlight of financial performance of the Company during the year under review.
(` in lakhs)
2016-17 *2015-16
Revenue from Operations 119,869.42 116,493.57
Other Income 4,589.03 5,567.60
Total Income 124,458.45 122,061.17
Profit before finance cost and depreciation 26,804.91 28,139.69
Less: Finance cost 500.13 1,029.48
Less: Depreciation & Amortisation expense 4,626.42 4,040.87
Profit before tax 21,678.36 23,069.34
Tax Expense 4,381.90 5,149.05
Net Profit after tax 17,296.46 17,920.29
Other Comprehensive Income (Net of tax) (270.43) (30.98)
Total Comprehensive Income after tax 17,026.03 17,889.31
Earning per share of ` 2 (In `) 20.07 21.09
4. OPERATIONS/STATE OF AFFAIRSThe total net sales for 2016-17 at ` 1,148.70 crores were 4.11% higher compared to the net sales in the previous year. The sales growth was lower as exports to certain markets were impacted due to high depreciation of local currencies against US dollar. The domestic formulations business continued to do well and registered growth of 17.27% at sales of ` 477.70 crores, while contrast media products at net sales of ` 43.91 crores registered growth of 8.91%. Total formulations exports at ` 523.99 crores were lower compared to the previous year. API sales were also lower at ` 91.70 crores.
The operating profit at ` 175.89 crores was affected by de-growth in international business. The profit before tax and total comprehensive income after tax for the year stood at ` 216.78 crores and ` 170.26 crores respectively.
5. RESPONSIBILITY STATEMENTThe directors confirm:
(i) that in the preparation of the annual accounts for the year under review, the applicable accounting standards have been followed;
(ii) that they have selected appropriate accounting policies and applied them consistently and made judgements and estimates that are reasonable and
* prepared in accordance with new accounting standards prescribed under Companies (Indian Accounting Standards) Rules, 2015 applicable to the Company w.e.f. April 1, 2016.
2. DIVIDENDYour directors recommend a dividend of Re.1 (50%) per equity share of face value of ` 2. This together with dividend distribution tax will absorb ` 1,020.87 lakhs. The Board has not proposed any amount for transfer to reserves.
3. BUY-BACK OF EQUITY SHARESWith a view to return surplus cash and pursuant to authority conferred under the Articles of Association of the Company, the Board has approved buy-back of fully paid up equity shares of face value of ` 2 by the Company up to 12,50,000 equity shares at a price of ` 400 per equity share for a total consideration not exceeding ` 5,000 lakhs (“buy-back amount”) excluding transaction costs, on proportionate basis through tender offer. The number of equity shares authorised for buy-back represents 1.47% of the total outstanding equity shares, while the buy-back amount represents 3.85% of the equity share capital and free reserves as at March 31, 2017. This buy-back will be implemented in accordance with provisions of the Companies Act, 2013 and Securities and Exchange Board of India (Buy-back of Securities) Regulations, 1998.

15
Corporate Overview Statutory Reports Standalone Financial Statement Consolidated Financial Statement01-13 14-68 69-123 124-179
DIRECTORS’ REPORT (Contd.)
prudent so as to give a true and fair view of the state of affairs of the Company at the end of financial year 2016-17 and of profit of the Company for that year;
(iii) that they have taken proper and sufficient care for the maintenance of adequate accounting records in accordance with the provisions of the Companies Act, 2013 for safeguarding the assets of the Company and for preventing and detecting fraud and other irregularities;
(iv) that they have prepared the annual accounts for the year ended on March 31, 2017 on a going concern basis;
(v) that they have laid down internal financial controls to be followed by the Company and that such internal financial controls are adequate and were operating effectively; and
(vi) that they have devised proper systems to ensure compliance with the provisions of all applicable laws and that such systems were adequate and operating effectively.
6. SUBSIDIARIESThe report on financial performance and financial position of the subsidiary companies as on March 31, 2017 is presented in Annexure-A.
7. CORPORATE GOVERNANCE-ANNUAL REPORT DISCLOSURESA certificate from auditors of the Company on compliance of conditions of corporate governance and management discussion and analysis report are annexed to this report. Compliance report on corporate governance, business responsibility report, dividend distribution policy and information on number and dates of meetings of the Board and Committees thereof held during the financial year indicating the number of meetings attended by each director form part of this annual report.
8. PUBLIC DEPOSITSThe Company has not accepted any deposit covered under Chapter V of the Companies Act, 2013 during the year. All the public deposits accepted prior to the commencement of the said Act have been repaid in 2014-15.
9. DIRECTORSIn accordance with the provisions of the Companies Act, 2013, Mr. Kamlesh L. Udani retires by rotation at the
ensuing annual general meeting. He, being eligible, has offered himself for re-appointment.
All independent directors have given a declaration to the Board that they meet the criteria of independence as provided in Section 149(6) of the Companies Act, 2013 as well as in Regulation 16 of Securities and Exchange Board of India (Listing Obligations and Disclosure Requirements) Regulations, 2015.
During the year, the Board appointed Dr. Manoj R. Mashru as an additional director on November 18, 2016. He is an independent director and holds office up to the date of ensuing annual general meeting. The Company has received, pursuant to Section 160 of the Companies Act, 2013, a notice from a member proposing candidature of Dr. Manoj R. Mashru to the office of director of the Company. It is proposed to appoint Dr. Manoj R. Mashru as an independent director of the Company. Dr. Manoj R. Mashru is a leading Cardiologist and possesses expertise in the field of medicine. His detailed profile is given in notice for the ensuing annual general meeting. This profile is deemed to form part of this report.
During the year, two independent directors resigned from the Board viz. Mr. Jashvantrai B. Joshi resigned due to his pre-occupations and Dr. Niranjan N. Maniar resigned due to his health reasons.
Total 4 meetings of the Board of Directors of the Company were held during the year 2016-17. They were held on May 20, 2016, August 26, 2016, November 18, 2016 and February 10, 2017.
10. POLICY ON DIRECTORS’ APPOINTMENT AND REMUNERATION POLICYThe Company’s policy on directors’ appointment is set out in Annexure-B. The Company’s policy on directors’ remuneration including criteria for determining qualifications, positive attributes and independence of a director as well as policy relating to remuneration of Key Managerial Personnel and other employees is set out in Annexure-C.
11. CONSERVATION OF ENERGY, TECHNOLOGY ABSORPTION, FOREIGN EXCHANGE EARNINGS AND OUTGOThe particulars as required under Section 134(3)(m) of the Companies Act, 2013 read with the Companies (Accounts) Rules, 2014 are given in Annexure D.

Annual Report 2016-17J. B. Chemicals & Pharmaceuticals Limited
16
12. CORPORATE SOCIAL RESPONSIBILITYPursuant to the requirement of Section 135 of the Companies Act, 2013, the Board of the Company has constituted Corporate Social Responsibility (CSR) Committee comprising of Dr. Satyanarain Agarwala, independent director, Mr. Bharat P. Mehta and Mr. Pranabh Mody. The CSR Committee has formulated and recommended CSR Policy to the Board, which the Board has approved. The details and contents of CSR policy and annual report on CSR in the prescribed form are set out in Annexure-E.
The Company spent ` 265.23 lakhs on prescribed CSR projects/activities during 2016-17 as against ` 346.39 lakhs being 2% of the average net profits of the Company made during the three immediately preceding financial years. Pursuant to second proviso to Section 135(5) of the Companies Act, 2013, Board has to specify that the Company could not spend the entire amount of ` 346.39 lakhs as it did not come across other deserving activity/projects for the benefit of needy section of the society.
13. AUDIT COMMITTEE AND VIGILANCE MECHANISMThe Board has constituted Audit Committee comprising of Mr. Durga Dass Chopra, Dr. Satyanarain Agarwala, Mr. Dinesh Mody and Ms. Krupa Gandhi. There has been no instance of non-acceptance of recommendation of Audit Committee by the Board.
The Board of directors has established vigil mechanism in the form of Whistle Blower Policy to enable directors, employee and other stakeholders to make written Protected disclosures (as defined in the policy) to the Chairman of the Redressal Committee for evaluation and investigation. The Policy empowers the Redressal Committee to investigate if the issue raised constitutes protected disclosure, complete the investigation in a time bound manner and recommend, after consultation with the Audit Committee, necessary corrective action to the concerned manager for implementation. The Policy provides for access of whistle blower to the Chairman of the Audit Committee in appropriate or exceptional circumstances. The Policy provides for adequate safeguards of whistle blowers against any kind of victimisation or unfair treatment but also provides for taking stern disciplinary action against who abuses the protection so granted. This functioning of vigil mechanism is periodically reviewed by the Audit Committee. The Company has posted the Whistle Blower Policy on its website www.jbcpl.com
14. ANNUAL PERFORMACE EVALUATIONThe Board of Directors has laid down the criteria for evaluation of performance of individual directors, Board of Directors and Committees of the Board. The Nomination and Remuneration Committee first carried out evaluation of performance of each director during 2016-17 against the criteria. The result of this process was placed before the Board at its meeting held on May 23, 2017, which (excluding the director being evaluated) also independently carried out evaluation of performance of each director. The Board at the said meeting also carried out performance evaluation of each Board constituted committee (excluding the members of the Committee being evaluated) against the criteria. The Board’s own performance was also evaluated by each individual director based on the criteria. The Chairman of the Board then reviewed the outcome of entire performance evaluation process and shared the same with the Board members.
15. CONTRACTS OR ARRANGEMENTS WITH RELATED PARTIESForm AOC-2 prescribed under Section 134(3)(h) read with Rule 8(2) of the Companies (Accounts) Rules, 2014 provides for disclosure of (a) details of contracts or arrangements or transactions not at arm’s length basis and (b) details of material contracts or arrangement or transactions at arm’s length basis.
All the transactions entered into by the Company with the related parties during the year were pursuant to the contract or arrangement approved by the Audit Committee and the Board of Directors. The transactions so entered into were in the ordinary course of business of the Company and on arm’s length basis. The contract or arrangement or transactions were neither material in terms of the Policy on materiality of related party transactions adopted by the Company nor it exceeded the threshold limit prescribed pursuant to first proviso to Section 188(1) of the Companies Act, 2013. Therefore, there is no information to be furnished in Form AOC-2. However, every contract or arrangement entered into pursuant to Section 188(1) of the Companies Act, 2013 is referred to in Annexure-F pursuant to Section 188(2) of the Companies Act, 2013. These contracts or arrangements are in the ordinary course of business and terms thereof are on arm’s length basis, and have been approved by the Audit Committee and the Board of Directors.
DIRECTORS’ REPORT (Contd.)

17
Corporate Overview Statutory Reports Standalone Financial Statement Consolidated Financial Statement01-13 14-68 69-123 124-179
16. EXTRACT OF ANNUAL RETURNPursuant to Section 134(3)(a) of the Companies Act, 2013, the extract of the Annual Return as provided under Section 92(3) of the Companies Act, 2013, as on March 31, 2017 is given in Annexure-G.
17. PARTICULARS OF EMPLOYEES AND OTHER REMUNERATION RELATED DISCLOSURES.A statement showing name and other particulars of the employees in terms of Section 197(12) of the Companies Act, 2013 read with Rule 5(2) and 5(3) of the Companies (Appointment and Remuneration of Managerial Personnel) Rules, 2014 as amended, is given in Annexure-H.
The remuneration related and other disclosure required in terms of Section 197(12) of the Companies Act, 2013 read with Rule 5(1) of the Companies (Appointment and Remuneration of Managerial Personnel) Rules, 2014 as amended, are given in Annexure-I.
18. EMPLOYEE STOCK OPTION PLANThe disclosure of details in respect of the Company’s Employee Stock Option Plan, as required under the Companies (Share Capital and Debentures) Rules, 2014 are set out in Annexure-J to this report.
19. RISK MANAGEMENTThe Board of Directors has developed and implemented risk management policy for the Company. The Board periodically monitors the risk management plan and reviews mitigation measure taken in relation thereto.
20. INTERNAL FINANCIAL CONTROLSThe Board has adopted internal financial controls encompassing policies and procedures for ensuring the orderly and efficient conduct of the business, including adherence to Company’s policies, the safeguarding of the Company’s assets, prevention and detection of fraud and errors, the accuracy and completeness of the accounting records and timely preparation of reliable financial information. The specific internal financial controls with reference to financial statements include internal audit of important activities and processes relating to preparation of financial statements, adoption of well-defined standard operating procedure for business transactions and compliance relating thereto, use of ERP for accuracy and control, review of periodically prepared financial statements with objective to ensure that financial statements present true and fair view and are correct,
sufficient, credible and in compliance with legal and regulatory requirement.
Neither management of the Company has come across any instance of fraud during the year 2016-17 nor the auditors of the Company has reported any such instance to the Audit Committee.
21. LOANS, GUARANTEES AND INVESTMENTSDuring the year, the Company has not given any loan or guarantee or made any investment attracting the provisions of Section 186 of the Companies Act, 2013. Hence, there is no information to be furnished pursuant to Section 134(3)(g) of the Companies Act, 2013.
22. MANAGEMENT DISCUSSION AND ANALYSIS REPORTThe management discussion and analysis report for the year 2016-17 is attached as Annexure-K.
23. SIGNIFICANT AND MATERIAL ORDERSNo regulator or court has passed, during the year, any significant or material order impacting going concern status and Company’s operations in future.
24. AUDITORSPursuant to provisions of Section 139(2) of the Companies Act, 2013, M/s J.K. Shah & Co., Chartered Accountants, would remain in office as auditors of the Company up to the date of ensuing annual general meeting.
The Board of Directors recommend appointment of Damania & Varaiya, Chartered Accountants (having firm registration no. 102079W), as statutory auditor of the Company for a term of five consecutive years from the conclusion of ensuing annual general meeting. The said firm is well equipped and possesses requisite qualification and experience commensurate with the size and requirement of the Company. Damania & Varaiya has submitted its written consent to their appointment as well as certificate that their appointment, if made, will be in accordance with the prescribed conditions. They have also confirmed that they satisfy the criteria provided in Section 141 of the Companies Act, 2013.
25. SECRETARIAL AUDIT REPORTAshish Bhatt & Associates, Practising Company Secretaries, Secretarial Auditor of the Company, carried out secretarial audit for the financial year 2016-17 as provided under Section 204 of the Companies Act, 2013
DIRECTORS’ REPORT (Contd.)

Annual Report 2016-17J. B. Chemicals & Pharmaceuticals Limited
18
and the rules made there under. The secretarial audit report given by the said auditor is annexed to this report as Annexure-L.
26. HEALTH AND SAFETY
The Company continues to accord high priority to health and safety of employees at all manufacturing locations. During the year under review, the Company conducted safety training programmes for increasing disaster preparedness awareness among all employees at the plants. Training programmes and mock drills for safety awareness were also conducted for all employees at the plants.
27. APPRECIATIONYour Directors record their sincere gratitude to the banks for their assistance and shareholders, business associates, medical professionals and customers for their continued support and faith in the Company, and to employees of UNIQUE FAMILY for their valuable services and commitment.
For and on behalf of the Board of Directors
J. B. ModyChairman & Managing Director
Place : MumbaiDate : May 23, 2017
DIRECTORS’ REPORT (Contd.)
19
Corporate Overview Statutory Reports Standalone Financial Statement Consolidated Financial Statement01-13 14-68 69-123 124-179
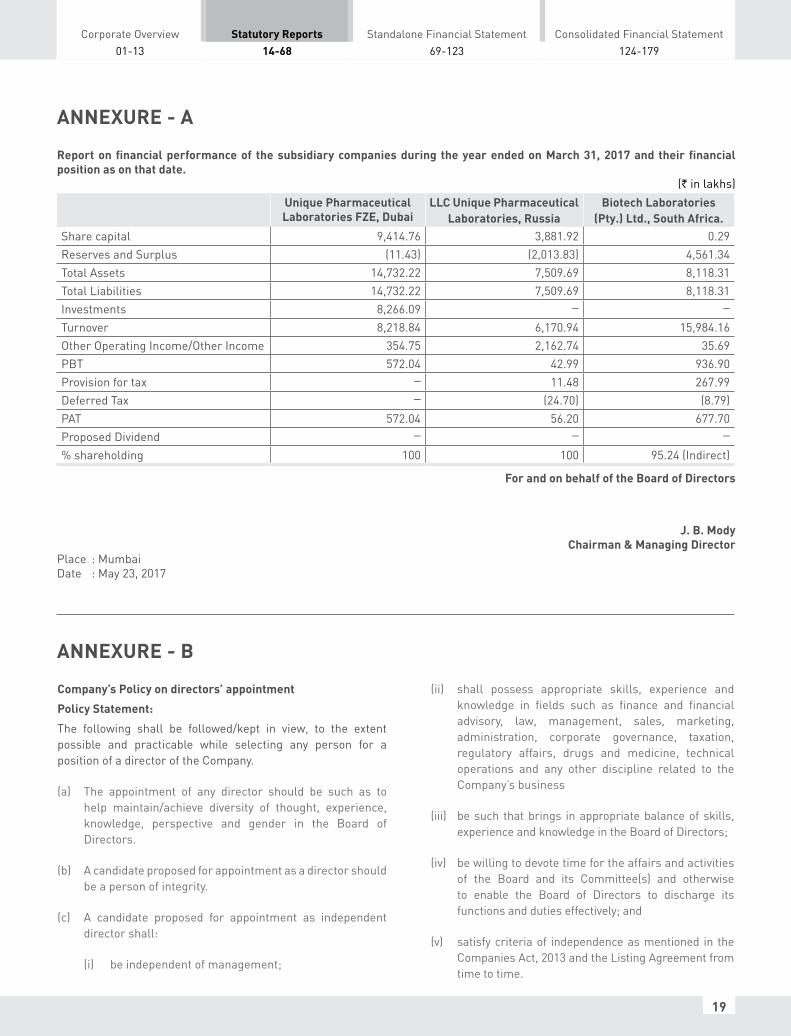
ANNEXURE - A
Report on financial performance of the subsidiary companies during the year ended on March 31, 2017 and their financial position as on that date.
(` in lakhs)Unique Pharmaceutical Laboratories FZE, Dubai
LLC Unique Pharmaceutical Laboratories, Russia
Biotech Laboratories (Pty.) Ltd., South Africa.
Share capital 9,414.76 3,881.92 0.29Reserves and Surplus (11.43) (2,013.83) 4,561.34Total Assets 14,732.22 7,509.69 8,118.31Total Liabilities 14,732.22 7,509.69 8,118.31Investments 8,266.09 − −Turnover 8,218.84 6,170.94 15,984.16Other Operating Income/Other Income 354.75 2,162.74 35.69PBT 572.04 42.99 936.90Provision for tax − 11.48 267.99Deferred Tax − (24.70) (8.79)PAT 572.04 56.20 677.70Proposed Dividend − − −% shareholding 100 100 95.24 (Indirect)
For and on behalf of the Board of Directors
J. B. Mody Chairman & Managing DirectorPlace : MumbaiDate : May 23, 2017
ANNEXURE - B
Company’s Policy on directors’ appointment
Policy Statement:
The following shall be followed/kept in view, to the extent possible and practicable while selecting any person for a position of a director of the Company.
(a) The appointment of any director should be such as to help maintain/achieve diversity of thought, experience, knowledge, perspective and gender in the Board of Directors.
(b) A candidate proposed for appointment as a director should be a person of integrity.
(c) A candidate proposed for appointment as independent director shall:
(i) be independent of management;
(ii) shall possess appropriate skills, experience and knowledge in fields such as finance and financial advisory, law, management, sales, marketing, administration, corporate governance, taxation, regulatory affairs, drugs and medicine, technical operations and any other discipline related to the Company’s business
(iii) be such that brings in appropriate balance of skills, experience and knowledge in the Board of Directors;
(iv) be willing to devote time for the affairs and activities of the Board and its Committee(s) and otherwise to enable the Board of Directors to discharge its functions and duties effectively; and
(v) satisfy criteria of independence as mentioned in the Companies Act, 2013 and the Listing Agreement from time to time.

Annual Report 2016-17J. B. Chemicals & Pharmaceuticals Limited
20
Company’s Policy on remuneration of directors, Key Managerial Personnel and other employees.
General:
The objective of remuneration for managing director, whole-time directors, other key managerial personnel and other employees of the Company is to focus them on achieving objectives and improving performance, to motivate and retain them and to be able to attract qualified, talented and competent executives and employees to the Company, when required. Besides this, achievement of long-term objectives of the Company and protecting and enhancing stakeholders’ interest are added policy objectives in case of remuneration of managing director and whole-time directors. Further, it is also the objective to create a strong performance oriented culture within the Company that rewards achievement of the Company’s short term and long term objectives and goals.
Remuneration for Executive Directors:
The Nomination and Remuneration Committee (“Committee”) shall endeavour to fix the base salaries (fixed salaries) keeping in view practices prevailing in the industry and also variety of other factors such as experience, past performance, scope of responsibilities and complexity of functions.
The Committee shall also consider incentive pay (in the form of commission, bonus or variable pay of any other description) to strike balance between fixed and incentive pay reflecting short term and long term performance objectives appropriate to the working of the Company and its goals.
The annual increments in the base salaries shall be determined keeping in view performance of the Company and shall also reflect appropriate performance benchmarks.
The remuneration of managing directors and whole-time directors shall be subject to provisions of the Companies
ANNEXURE - CAct, 2013 (“Act”). However, the base salaries shall be paid as minimum remuneration in the event of loss or inadequacy of profits, subject to provisions of the Act.
Remuneration for Non-Executive Directors:
Non-Executive directors shall be entitled to receive remuneration by way of fee for attending meetings of the Board of Directors or Committee(s) thereof or any other purpose whatsoever as may be decided by the Board from time to time within the maximum limit prescribed under the Rules made under the Act and also reimbursement of expenses for participation in the Board and other meetings. Subject to the provisions of the Act, Non-Executive directors may also receive profit related commission as may be decided by the Board.
Remuneration for other Key Managerial Personnel (KMP) and Senior Management Personnel (SMP):
The Committee shall endeavour to fix the base salaries (fixed salaries) for KMP and SMP at the time of appointment keeping in view practices prevailing in the industry and also variety of other factors such as qualifications, experience, scope of responsibilities, complexity of functions and geographical area.
The Committee shall also consider incentive pay (in the form of commission, bonus or variable pay of any other description) to strike balance between fixed and incentive pay reflecting short term and long term performance objectives appropriate to the working of the Company and its goals. The annual increments in the base salaries of KMP and SMP shall be determined by the Company management keeping in view performance of the Company and performance of the employees based on appropriate benchmarks and practices prevailing in the industry. The Company management shall place annual increment of key executives before the Board of Directors for approval.
(d) For independent directors, requisite professional qualification in the area of expertise is preferred. However, experience and expertise in a given field should be determining factor.
(e) A candidate proposed for position of executive director may be from the promoter group or outside. Such candidate should have enough experience or potentially fit for the executive responsibilities.
Observance of the Policy: Besides the Board of Directors, this Policy will also be followed by the Nomination and Remuneration Committee.
For and on behalf of the Board of Directors
J. B. Mody Chairman & Managing Director
Place : MumbaiDate : May 23, 2017
ANNEXURE - B (Contd.)

21
Corporate Overview Statutory Reports Standalone Financial Statement Consolidated Financial Statement01-13 14-68 69-123 124-179
Remuneration for other employees:
The Company management shall endeavour to fix the base salaries (fixed salaries) for other employees keeping in view qualifications, experience, scope of responsibilities, complexity of functions, geographical location and practices prevailing in the industry. The Company management shall also evaluate and explore for other employees in general or employees in any specific department or function an element of variable pay in the form of incentive, bonus etc. keeping in view short term and long term objectives of the Company. The Company management shall determine annual increments of other employees based on performance of employees, performance of the Company and practices prevailing in the industry.
Common Consideration:
While fixing the remuneration, the Committee shall ensure that the level and composition of remuneration is reasonable and sufficient to attract, retain and motivate directors, KMP and SMP of the quality required to run the Company successfully. Further, the Committee or the Company management, as the case may be, shall endeavour to ensure that the remuneration and/or annual increment determined is affordable to the Company and competitive with due consideration to industry trends and the Company’s own position, consistently followed practices.
All employees shall be entitled to loan as per the scheme formulated by the Company and group personal accident insurance as per the prevailing practice.
The Committee/Company management may also recommend grant of stock options in appropriate cases, subject to provisions of the Act and SEBI Regulations. The Committee or the Company management, as the case may be, may also undertake mid-term review of remuneration if the circumstances so warrant.
Criteria for determining qualifications, positive attributes and independence of a director.
(a) The appointment of any person as a director shall be as per the policy on appointment of directors laid down by the Board. The Nomination and Remuneration Committee (NRC) has also to ensure that the proposed candidate does not have any conflict of interest.
(b) For independent directors, requisite professional qualification in the area of expertise is preferred. However, experience and expertise in a given field should be determining factor. A candidate proposed for executive director should have enough experience or be potentially fit for the executive responsibilities.
(c) Through personal interaction with the candidate proposed for position of director, the NRC shall ascertain positive attributes such as leadership, strategic, decision making, flexibility and communication. For candidate proposed for executive director, the NRC shall ascertain additional positive attributes such as entrepreneurship, quality & customer focus, anticipation & speed, passion for superior performance and people orientation.
(d) Candidate proposed as independent director should satisfy criteria of independence specified in the Companies Act, 2013 and the Listing Agreement from time to time.
For and on behalf of the Board of Directors
J. B. Mody Chairman & Managing Director
Place : MumbaiDate : May 23, 2017
ANNEXURE - C (Contd.)
ANNEXURE - D
Conservation of energy, technology absorption, foreign exchange earnings and outgo.
(A) Conservation of energy:
(i) Steps taken or impact on conservation of energy: The Company regularly takes measures for conservation of energy and thereby contain the rising energy cost. During the year, the Company (i) replaced tube lights with LED lights at its plant located at Panoli, Gujarat to reduce electricity consumption, and (ii) installed parabolic trough solar
concentrator based hot water generating system to reduce consumption of gas.
(ii) The steps taken by the Company for utilising alternate sources of energy: During the year, the Company has taken steps to install solar power plant at its plant at Panoli, Gujarat.
(iii) The capital investment on energy conservation equipment: During the year, the Company made capital investment of ` 50 lakhs on energy conservation equipment.

Annual Report 2016-17J. B. Chemicals & Pharmaceuticals Limited
22
(B) Technology absorption:
(i) Efforts made towards technology absorption:
The Company has developed certain technologies in-house in relation to development of pharmaceutical formulations. The following efforts were made towards absorption of some of the technologies:
• Exhibit batches of anti-histamine anti-allergyimmediate release oral dosage form, H2 (histamine-2) blockers immediate release Hard Gelatin capsules and tablet oral dosage form, Osmotic Pump technology for an anti-epileptic extended release dosage form, ACE inhibitor and diuretic combination for blood pressure control immediate release dosage form and non-steroidal anti-inflammatory drug topical gel were manufactured.
• Newly developed dihydropyridine calciumchannel blocker immediate release oral dosage form was manufactured and launched.
• Validationbatchesofantibioticandantiprotozoaltopical gel and antibiotic throat lozenges (chewable tablets) were manufactured.
• Technologyforantibioticandantiprotozoaltimerelease extended release oral dosage form implemented.
• Sympatholytic drug used to treat high bloodpressure immediate release Hard Gelatin capsules dosage form developed.
• Two products of Tricyclic antidepressantimmediate release Hard Gelatin capsules dosage form developed.
• Thiazide diuretics used to treat high bloodpressure immediate release dosage form developed.
• Osmotically Controlled Release Oral DeliverySystem - a zero order delivery system developed for calcium channel blocker solid dosage forms.
(ii) The benefits derived like product improvement, cost reduction, product development or import substitution:
The Company derived the following benefits as a result of technology absorption:
• PriorapprovalsupplementsforalternativeAPIin ANDA. This will give benefit of assured supply of the desired quality and cost advantage.
• Received regulatory approval of variousformulations as a result of the technology developed & these products are launched in the global markets.
• Costreductionawarenessfornewdevelopmentproduct e.g. an excipient was used from Indian source instead of imported source, Coating material ready mix.
• Built in cost reduction awareness fordevelopment or realignment of existing products.
• Improvement in product yield, quality andreduced cost of production.
(iii) The Company has not imported any technology during last three financial years.
(iv) The expenditure incurred on Research and Development during the year is as under:
(` in lakhs)(a) Capital 1,198.38(b) Revenue 2,607.06(c) Total 3,805.44
(C) Foreign exchange earnings and outgo:
The foreign exchange earned in terms of actual inflows during the year and foreign exchange outgo in terms of actual outflows during the year was ` 63,690.80 lakhs and ` 14,967.17 lakhs respectively.
For and on behalf of the Board of Directors
J. B. Mody Chairman & Managing Director
Place : MumbaiDate : May 23, 2017
ANNEXURE - D (Contd.)

23
Corporate Overview Statutory Reports Standalone Financial Statement Consolidated Financial Statement01-13 14-68 69-123 124-179
Details and contents of corporate social responsibility policy and annual report on CSR
The objective of the CSR policy is to strive to create and/or encourage, directly or indirectly, positive impact on the society at large through CSR activities or projects undertaken by the Company.
The Company intends to undertake all or any of the activities prescribed in Schedule VII to the Companies Act, 2013. Accordingly, CSR Policy specifies activities to be undertaken by the Company from time to time in terms of Schedule VII to the Companies Act, 2013. The scope of CSR Policy has been kept as wide as possible to enable the Company to choose the activity as it deems fit and also allow the Company to respond to different situations and challenges appropriately. As per the Policy, the Company management will identify the CSR project or program which may either be time bound or ongoing in nature. The Company may undertake CSR activities directly through its own personnel or through any registered trust / registered society or company established u/s 8 of the Companies Act, 2013. Besides, the Policy also specifies criteria and modalities of undertaking CSR activities through partnering organizations.
Currently, the Company plans to focus on the activities/projects in the area of promotion of education, promoting health care including preventive health care, eradication of hunger, poverty and malnutrition and empowering women and children.
The role of the CSR Committee includes review of CSR Policy, recommendation of the amount of expenditure to be incurred on the CSR activities, formulation of transparent monitoring mechanism to ensure effective implementation of the project/programme/activity to be undertaken by the Company and monitor and implement CSR Policy from time to time. The Company has posted the CSR policy on its website and web link thereto is http://www.jbcpl.com/investors/pdf/policy/Corporate-Social-Responsibility-Policy.pdf
Annual Report on CSR Activities
1. A brief outline of the Company’s CSR policy, including overview of projects or programs proposed to be undertaken and a reference to the web-link to the CSR policy and projects or programs.
The Policy recognises CSR as a part of governance philosophy. The policy provides for undertaking any activity prescribed under Schedule VII to the Companies Act, 2013. Without limiting the aforesaid scope, the policy provides for undertaking activities/projects in the area of promotion of education, eradication of hunger, poverty and malnutrition and empowering women and children. The web link to the CSR Policy is http://www.jbcpl.com/investors/pdf/policy/Corporate-Social-Responsibility-Policy.pdf and CSR activities/projects for 2016-17 is http://www.jbcpl.com/investors/pdf/2016_2017/CSR_Projects_16_17.pdf
2. The Composition of the CSR Committee Dr. Satyanarain Agarwala, Mr. Bharat P. Mehta and Mr. Pranabh Mody.
3. Average net profit of the Company for last three financial years
` 17,319.50 lakhs
4. Prescribed CSR Expenditure (two per cent of the amount as in item 3 above)
` 346.39 lakhs
5. Details of CSR spent during the financial year(a) Total amount to be spent for the financial year; ` 346.39 lakhs (b) Amount unspent, if any; ` 81.16 lakhs(c) Manner in which the amount spent during the financial year is detailed below.
ANNEXURE - E

Annual Report 2016-17J. B. Chemicals & Pharmaceuticals Limited
24
ANNEXURE - E (Contd.)
(` in lakhs)(1) (2) (3) (4) (5) (6) (7) (8)
S.No CSR project or activity identified
Sector in which the Project is covered
Projects or programs (1) Local area or other(2) Specify the State and district where projects or programs was undertaken
Amount outlay (budget) project or programs wise
Amount spent on the projects or progamsSub-heads:(1) Direct expenditure on projects or programs(2) Overheads:
Cumulative expenditure upto to the reporting period
Amount spent:Direct or through implementing agency
1 Contribution to corpus of Ankleshwar Industrial Development Society for Smt. Jayaben Mody hospital run by the society.
Promoting health care including preventive healthcare
Ankleshwar, District: Bharuch, Gujarat State.
50.00 50.00(1) 50.00(2) Nil
177.50 Direct
2 Contribution to corpus of Shree Sardar Vallabhbhai Patel Rotary General Hospital Trust.
Promoting health care including preventive healthcare
Ankleshwar, District: Bharuch, Gujarat State.
50.00 50.00(1) 50.00(2) Nil
100.00 Direct
3 Contribution to Shrimad Rajchandra Educational Trust for setting up of Chemistry Laboratory in a new science college set up under the name Shrimad Rajchandra Vidyapeeth.
Promotion of education
Dharampur, District: Valsad, Gujarat State.
100.00 100.00(1) 100.00(2) Nil
100.00 Direct
4 Contribution to Ashoka University corpus of International Foundation for Research and Education for Scholarships to poor students at u n d e r g r a d u a t e / p o s t graduate level.
Promotion of education
Rajiv Gandhi Education city, Kundli, Haryana, National Capital Region.
40.00 40.00(1) 40.00(2) Nil
120.00 Direct
5 Contribution to corpus of Light of Life Trust or re-instatement and nurturing of underprivileged school drop outs in rural areas of Maharashtra.
Promotion of education
Somaval and Vanyaveer, Nandurbar district, Maharashtra State.
10.00 10.00(1) 10.00(2) Nil
10.00 Direct
6 Contribution for provision of nutrition for children affected with cancer.
Promoting health care including preventive healthcare
Mumbai, Maharashtra State.
10.44 10.44(1) 10.44(2) Nil
10.44 Through Concern India Foundation
7 Contribution to corpus of B. V. Patel PERD Centre for promotion of research in pharmaceutical science.
Promotion of education
Thaltej, Ahmedabad district, Gujarat State.
2.50 2.50(1) 2.50(2) Nil
2.50 Direct

25
Corporate Overview Statutory Reports Standalone Financial Statement Consolidated Financial Statement01-13 14-68 69-123 124-179
ANNEXURE - E (Contd.)
(` in lakhs)(1) (2) (3) (4) (5) (6) (7) (8)
S.No CSR project or activity identified
Sector in which the Project is covered
Projects or programs (1) Local area or other(2) Specify the State and district where projects or programs was undertaken
Amount outlay (budget) project or programs wise
Amount spent on the projects or progamsSub-heads:(1) Direct expenditure on projects or programs(2) Overheads:
Cumulative expenditure upto to the reporting period
Amount spent:Direct or through implementing agency
8 Donation of medicines for free / subsidised treatment of poor.
Promoting health care including preventive healthcare
Solapur, Maharashtra State.
1.53 1.53(1) 1.53(2) Nil
23.59 Direct
9 Contribution to corpus of Talere Pachkroshi Shikshan Prasarak Mandal for purchase of materials & apparatus for science laboratories of various educational institutions.
Promotion of education
Talere, Sindhudurg District, Maharashra State.
0.25 0.25(1) 0.25(2) Nil
0.25 Direct
10 Contribution to corpus of Jairamdas Agarwal Charitable Trust for providing food to poor people.
Eradication of poverty
Kadaiya, Daman.
0.51 0.51(1) 0.51(2) Nil
0.51 Direct
Total 265.23 265.23 544.79
The CSR Committee of the Company states that the implementation and monitoring of the CSR Policy is in compliance with CSR objectives and policy of the Company.
For and on behalf of the Board of Directors
J. B. Mody Chairman & Managing Director
Dr. Satyanarain AgarwalaChairman, CSR Committee
Place : MumbaiDate : May 23, 2017

Annual Report 2016-17J. B. Chemicals & Pharmaceuticals Limited
26
ANNEXURE - F
Details of related party contracts or arrangements
Name of the related party
Nature of the contracts or arrangements
Duration of the contracts or arrangements
Broad terms of the contract or arrangement
Justification for the contract or arrangement
Unique Pharmaceutical Laboratories FZE, Dubai (UPL FZE)
Supply Agreement
Ongoing The Company to manufacture and supply the products to UPL FZE for marketing and distribution thereof by UPL FZE in Russia-CIS markets. Price for the products to be determined mutually on case to case basis. Total supplies during the year amounted to ` 5,694.26 lakhs.
The arrangement would facilitate focused marketing of the products in Russia-CIS markets.
Re-imbursement of expenses
Ongoing Re-imbursement of expenses in the normal course of business. Total amount reimbursed on account of expenses during the year amounted to ` 9.51 lakhs.
This arrangement is in conformity with normal trade practice.
Guarantee Commission
5 years from September 23, 2015
Provision of corporate guarantee of USD 4 million to the Bank in relation to working capital finance sanctioned to UPL FZE by the Bank and guarantee commission charged @ 0.50% p.a. Guarantee Commission received during the year amounted to ` 12.97 lakhs.
Support provided to UPL FZE for availing financial facility from bank at arm’s length guarantee commission.
Biotech Laboratories (Pty.) Ltd., South Africa (Biotech)
Supply Agreement
Ongoing Biotech has been appointed as a distributor of various products of the Company for distribution in South Africa and certain other African countries. The products are supplied at price mutually agreed between the parties on case to case basis. Total supplies during the year amounted to ` 2,334.56 lakhs.
To increase Company’s exports in South Africa and certain other African countries.
Re-imbursement of expenses
Ongoing Re-imbursement of expenses in the normal course of business. There was no instance of reimbursement during the year.
This arrangement is in conformity with normal trade practice.
Lekar Pharma Limited (Lekar)
Agreement for distribution of agreed finished pharmaceutical formulations by the Company
Ongoing Lekar to supply the agreed finished pharmaceutical formulations to the Company at price based on agreed formula. The total purchases during the year amounted to ` 4,324.28 lakhs.
Timely availability of quality products at competitive price for domestic market.
Loan License Agreement for manufacture of products on loan license basis.
Ongoing The Company to manufacture certain formulations on loan license basis for Lekar and also supply certain raw material and packing materials at agreed processing charges/basis of charge respectively. The total processing charges received by the Company amounted to ` 93.32 lakhs and the amount of materials supplied to Lekar during the year was ` 153.44 lakhs.
Utilisation of available capacity at processing charges levied in line with industry-wide accepted formula and reasonable margin.

27
Corporate Overview Statutory Reports Standalone Financial Statement Consolidated Financial Statement01-13 14-68 69-123 124-179
ANNEXURE - F (Contd.)
Name of the related party
Nature of the contracts or arrangements
Duration of the contracts or arrangements
Broad terms of the contract or arrangement
Justification for the contract or arrangement
Unique Pharmaceutical Laboratories Limited (UPLL)
License Agreements for license of certain brands and logo to the Company.
Ongoing The Company is licensed the use of certain brand names and ‘Unique’ Logo by UPLL on payment of royalty @ 1% for use of brand names and @1% for use of aforesaid logo, calculated in the manner laid down in the agreements. Total royalty for the year was ` 1,131.95 lakhs.
To be able to continue to market the products and grow the sales and profits.
Jyotindra Family Trust
Leave and license agreement for various immovable properties1
3 years from November 1, 20141
License fee payable monthly in advance and security deposit paid under certain agreements in line with market practice. Total license fee paid during the year amounted to ` 9.89 lakhs.
To continue to use the premises as r e s i d e n c e / o f f i c e for the Company’s executives at arm’s length license fee.
Dinesh Family Trust Leave and license agreement for premise at Bharuch, Gujarat
3 years from November 1, 2014
License fee payable monthly in advance and security deposit paid in line with market practice. Total license fee paid during the year amounted to ` 8.35 lakhs.
To continue to use premise as office premises at arm’s length license fee.
Shirish Family Trust
Leave and license agreement for premise at Bharuch, Gujarat
3 years from November 1, 2014
License fee payable monthly in advance and security deposit paid in line with market practice. Total license fee paid during the year amounted to ` 8.35 lakhs.
To continue to use premise as office premises at arm’s length license fee.
D. B. Mody (HUF) Leave and license agreement for residential premise at Powai, Mumbai
3 years from November 1, 2014
License fee payable monthly in advance and security deposit paid in line with market practice. Total license fee paid during the year amounted to ` 1.41 lakhs.
To continue to use the residential premise as residence for the Company’s executives at arm’s length license fee.
S. B. Mody (HUF) Leave and license agreement for residential premise at Powai, Mumbai
3 years from November 1, 2014
License fee payable monthly in advance and security deposit paid in line with market practice. Total license fee paid during the year amounted to ` 1.51 lakhs.
To continue to use the residential premise as residence for the Company’s executives at arm’s length license fee.
Mehul Transport Co.
Leave and license agreement for office premises at Neelam Centre, Worli, Mumbai2
3 years from November 1, 2014
License fee payable monthly in advance and security deposit paid in line with market practice. Total license fee paid during the year amounted to ` 4.85 lakhs.
To continue to use the premises as office of the Company at arm’s length license fee.
Mody Brothers Leave and license agreement for office premises at Worli, Mumbai
3 years from November 1, 2014
License fee payable monthly in advance. Total license fee paid during the year amounted to ` 9.50 lakhs.
To continue to use the premises as office of the Company at arm’s length license fee.

Annual Report 2016-17J. B. Chemicals & Pharmaceuticals Limited
28
ANNEXURE - F (Contd.)
Name of the related party
Nature of the contracts or arrangements
Duration of the contracts or arrangements
Broad terms of the contract or arrangement
Justification for the contract or arrangement
Boxcare Packagings Private Limited
Purchase agreement for purchase of corrugated boxes
Ongoing Purchase by the Company of boxes of different sizes and specifications. Total purchases during the year amounted to ` 1,293.32 lakhs
Reliability in timely supply and boxes of required quality and specification at arm’s length prices to serve domestic and export orders.
Namplas Chemicals Private Limited (Namplas)
Job Work Agreement for processing of intermediate by Namplas
Ongoing Namplas to process intermediate Sodium Methoxide (25% in Methanol) on job work basis based on raw materials and gas provided by the Company. Total job work charges paid during the year was ` 34.10 lakhs.
Processing at arm’s length charges and supply of the processed material through pipeline resulting in optimisation in inventory holding and saving of transportation cost.
Ifiunik Pharmaceuticals Limited
Inter-corporate deposit of ` 65 lakhs accepted
On call Interest payable on quarterly basis. Total interest paid during the year amounted to ` 6.50 lakhs.
Borrowing at competitive market driven interest rate.
Synit Drugs Pvt. Ltd.
Inter-corporate deposit of ` 40 lakhs accepted
On call Interest payable on quarterly basis. Total interest paid during the year amounted to ` 4 lakhs.
Borrowing at competitive market driven interest rate.
Kruti Finance and Holdings Private Limited
Inter-corporate deposit of ` 40 lakhs accepted3
3 years from May 20, 2013
Interest payable on quarterly basis. Total interest paid during the year amounted to ` 1.76 lakhs.
Borrowing at competitive market driven interest rate.
Jyotindra Mody Ventures LLP / D.B. Mody Enterprises LLP / Shirish Mody Property LLP
Leave and license agreement for office premises at Prabhadevi, Mumbai
5 years from November 4, 2015
License fee payable monthly in advance and security deposit in line with market practice. Total license fee paid during the year was ` 762.84 lakhs.
To use the premises as corporate office of the Company at arm’s length license fee.
Bansi S. Mehta & Co.
Arrangement for provision of professional services
Period up to May 2017
Availment of professional services in relation to taxation matters. Total fee paid during the year was ` 0.69 lakhs.
Competent professional services.
M&M Legal Ventures
Arrangement for provision of legal and advisory services
Period upto March 2018
Availment of legal and advisory services in relation to review petition filed before the National Green Tribunal, Pune and other matters of the Company. Total fee paid during the year was ` 16.82 lakhs.
Competent litigation and advisory services.
1 One leave and license agreement each has been entered into in respect of premises at Mumbai and Bharuch (Gujarat). 2 This agreement has been terminated effective 01-12-2016.3 Inter-corporate deposit repaid on 30/08/2016.

29
Corporate Overview Statutory Reports Standalone Financial Statement Consolidated Financial Statement01-13 14-68 69-123 124-179
FORM NO. MGT-9EXTRACT OF ANNUAL RETURN
as on financial year ended on 31.03.2017Pursuant to Section 92 (3) of the Companies Act, 2013 and rule 12(1) of the Companies (Management and Administration) Rules, 2014.
I REGISTRATION & OTHER DETAILS:
i CIN L24390MH1976PLC019380ii Registration Date 18-12-1976iii Name of the Company J. B. Chemicals & Pharmaceuticals Ltd.iv Category/Sub-category of the Company Public Company/ Limited by sharesv Address of the Registered office & contact details Neelam Centre, “B” Wing,
4th Floor, Hind Cycle Road, Worli, Mumbai, Maharashtra : 400 030 Tel No. (022) 2482 2222email : [email protected]
vi Whether listed Company Yesvii Name, Address & contact details of the Registrar &
Transfer Agent, if any.Datamatics Financial Services Ltd. Plot No. B-5, Part-B, Cross Lane,M.I.D.C., Andheri (E), Mumbai 400 093. Tel No. (022) 6671 2001-06 Fax : (022) 2821 3404 email :[email protected]
II PRINCIPAL BUSINESS ACTIVITIES OF THE COMPANY
Business activity contributing 10% or more of the total turnover of the Company is given below:
Sl. No
Name and description of main products NIC Code of the Product % to total turnover of the Company
1 Manufacture of pharmaceutical products 2100 85.04%
2 Trading in pharmaceutical products 46497 14.01%
III PARTICULARS OF HOLDING, SUBSIDIARY & ASSOCIATE COMPANIES
Sl No Name & Address of the Company CIN/ GLN Holding/Subsidiary/
Associate
% of Shares Held
Applicable Section
1 LLC Unique Pharmaceutical Laboratories 127944, Moscow, Tverskaya Str., 18, bldg. 1, office 609.
N.A. Subsidiary 100% 2(87)
2 Unique Pharmaceutical Laboratories FZE Office No. LB181205, LOB-18, Jebel Ali Free Zone, Dubai, UAE
N.A. Subsidiary 100% 2(87)
3 Biotech Laboratories (Pty.) Ltd.Ground Floor, Bock K West, Central Park, 400 16 Street,Randjespark, Midrand 1680, South Africa.
N.A. Subsidiary 95.24% 2(87)
ANNEXURE - G

Annual Report 2016-17J. B. Chemicals & Pharmaceuticals Limited
30
ANNEXURE - G (Contd.)
IV SHAREHOLDING PATTERN (Equity Share capital Break up as % to total Equity)
(i) Category-wise Shareholding
Category of Shareholders No. of Shares held at the beginning of the year No. of Shares held at the end of the year % change during the
yearDemat Physical Total % of Total Shares
Demat Physical Total % of Total Shares
A. PROMOTERS
(1) Indian
a) Individual/HUF 46,359,020 0 46,359,020 54.65 46,356,320 0 46,356,320 54.64 (0.01)
b) Bodies Corporate 132,690 0 132,690 0.16 132,690 0 132,690 0.16 0.00
c) Any other : Firms and Trusts 522,610 0 522,610 0.62 522,610 0 522,610 0.62 0.00
SUB TOTAL:(A) (1) 47,014,320 0 47,014,320 55.43 47,011,620 0 47,011,620 55.42 (0.01)
(2) Foreign
a) NRI- Individuals 286,517 0 286,517 0.34 286,517 0 286,517 0.34 0.00
SUB TOTAL (A) (2) 286,517 0 286,517 0.34 286,517 0 286,517 0.34 0.00
Total Shareholding of Promoter (A)= (A)(1)+(A)(2)
47,300,837 0 47,300,837 55.77 47,298,137 0 47,298,137 55.76 (0.01)
B. PUBLIC SHAREHOLDING
(1) Institutions
a) Mutual Funds 2,096,588 2,550 2,099,138 2.47 5,694,378 2,550 5,696,928 6.72 4.25
b) Banks/FI 63,379 4,500 67,879 0.08 48,981 4,500 53,481 0.06 (0.02)
c) Insurance Companies 1,150,000 3,000 1,153,000 1.36 1,150,000 3,000 1,153,000 1.36 0.00
d) FPIs 4,471,717 0 4,471,717 5.27 4,635,084 0 4,635,084 5.46 0.19
e) Alternate Investment Funds 0 0 0 0 1,115,948 0 1,115,948 1.32 1.32
SUB TOTAL (B)(1): 7,781,684 10,050 7,791,734 9.18 12,644,391 10,050 12,654,441 14.92 5.74
(2) Non Institutions
a) Bodies corporate:
i) Indian 2,443,109 17,966 2,461,075 2.90 1,170,640 17,966 1,188,606 1.40 (1.50)
b) Individuals:
i) Individual shareholders holding nominal share capital upto ` 1 lakh
16,402,765 1,459,535 17,862,300 21.06 15,316,322 1,380,420 16,696,742 19.69 (1.37)
ii) Individual shareholders holding nominal share capital in excess of ` 1 lakh
8,262,658 0 8,262,658 9.75 5,854,101 0 5,854,101 6.90 (2.85)
c) Others
(i) Non Resident Indians & Foreign National
1,107,400 6,200 1,113,600 1.31 1,086,925 6,200 1,093,125 1.30 (0.01)
(ii) Trusts & Clearing Member 27,771 0 27,771 0.03 29,321 0 29,321 0.03 0.00
SUB TOTAL (B)(2): 28,243,703 1,483,701 29,727,404 35.05 23,462,811 1,404,586 24,867,397 29.32 (5.73)
Total Public Shareholding (B)= (B)(1)+(B)(2)
36,025,387 1,493,751 37,519,138 44.23 3,610,7202 1,414,636 37,521,838 44.24 0.01
C. Shares held by Custodian for GDRs & ADRs
− − − − − − − − −
Grand Total (A+B+C) 83,326,224 1,493,751 84,819,975 100 83,405,339 1,414,636 84,819,975 100 −

31
Corporate Overview Statutory Reports Standalone Financial Statement Consolidated Financial Statement01-13 14-68 69-123 124-179
ANNEXURE - G (Contd.)
(ii) Share Holding of Promoters
Sl. No.
Shareholder’s Name Shareholding at the beginning of the year Shareholding at the end of the year % change in share holding
during the year
No. of shares
% of total shares of the
Company
% of shares pledged/
encumbered to total shares
No. of shares
% of total shares of the
Company
% of shares pledged/
encumbered to total shares
1 Jyotindra B. Mody 5,371,905 6.33 0 5,371,905 6.33 0 0.00
2 Dinesh Bhagwanlal Mody 4,738,632 5.59 0 4,738,632 5.59 0 0.00
3 Dinesh B. Mody/Kumud D. Mody 300 0.00 0 300 0.00 0 0.00
4 Shirish Bhagwanlal Mody 4,828,762 5.69 0 4,828,762 5.69 0 0.00
5 Shirish B. Mody/Bharati S. Mody 227,550 0.27 0 227,550 0.27 0 0.00
6 Kumud Dinesh Mody 4,735,079 5.58 0 4,735,079 5.58 0 0.00
7 Kumud D. Mody/Dinesh B. Mody 104,865 0.12 0 104,865 0.12 0 0.00
8 Bharati S. Mody/Shirish B. Mody 219,794 0.26 0 219,794 0.26 0 0.00
9 Bharati S. Mody 4,743,208 5.59 0 4,743,208 5.59 0 0.00
10 Pallavi Bharat Mehta 4,890,317 5.77 0 4,890,317 5.77 0 0.00
11 Pallavi B. Mehta/Bharat P. Mehta 310,890 0.36 0 310,890 0.36 0 0.00
12 Pranabh Dinesh Mody 4,762,847 5.62 0 4,762,847 5.62 0 0.00
13 Pranabh Dinesh Mody/Dinesh B. Mody 90,000 0.11 0 90,000 0.11 0 0.00
14 Pranabh Dinesh Mody/Sejal P. Mody 87,325 0.10 0 87,325 0.10 0 0.00
15 Sejal Pranabh Mody/Pranabh D. Mody 50,000 0.06 0 50,000 0.06 0 0.00
16 Nirav Shirish Mody 4,766,479 5.62 0 4,766,479 5.62 0 0.00
17 Nirav Shirish Mody/Shirish B. Mody 218,500 0.26 0 218,500 0.26 0 0.00
18 Jinali Pranabh Mody 3,000 0.00 0 3,000 0.00 0 0.00
19 Purvi Uday Asher/ Uday M. Asher 375,000 0.44 0 375,000 0.44 0 0.00
20 Jay Bharat Mehta 2,456,558 2.90 0 2,456,558 2.90 0 0.00
21 Jay Bharat Mehta/Shilpi Jay Mehta 2,050 0.00 0 2,050 0.00 0 0.00
22 Dinesh Bhagwanlal Mody/Jyotindra B. Mody (held for D B Mody HUF)
502,500 0.59 0 502,500 0.59 0 0.00
23 Uday M. Asher/Purvi U. Asher 120,900 0.14 0 120,900 0.14 0 0.00
24 Uday Madhavdas Asher 14,100 0.02 0 14,100 0.02 0 0.00
25 Kantaben Vinaychandra Gosalia 19,420 0.02 0 19,420 0.02 0 0.00
26 Kantaben Vinaychandra Gosalia/Bhakti Ashok Patel
6,460 0.01 0 6,460 0.01 0 0.00
28 Priti Rajen Shah 10,000 0.01 0 10,000 0.01 0 0.00
29 Bharat P. Mehta/Pallavi B. Mehta 171,810 0.20 0 171,810 0.20 0 0.00
30 Bharat P. Mehta 2,485,549 2.93 0 2,485,549 2.93 0 0.00
31 Vibha Anupam Mehta/Anupam P. Mehta 9,500 0.01 0 6,800 0.00 0 (0.01)
32 Anupam Pravinchandra Mehta 5,000 0.01 0 5,000 0.01 0 0.00
33 P. D. Mody (held for P D Mody HUF) 7,000 0.01 0 7,000 0.01 0 0.00
34 Jyotindra Bhagwanlal Mody /Dinesh Bhagwanlal Mody (held for Mody Bros.)
19,125 0.02 0 19,125 0.02 0 0.00
35 Pallavi Bharat Mehta/D. B. Mody/Bharati Shirish Mody (held for Mody Trading Co.)
53,485 0.06 0 53,485 0.06 0 0.00
36 Nirav Shirish Mody/Shirish Bhagwanlal Mody (as a trustee of Priti Family Trust)
225,000 0.27 0 225,000 0.27 0 0.00
37 Nirav Shirish Mody/Shirish Bhagwanlal Mody (as a trustee of Deepali Family Trust)
225,000 0.27 0 225,000 0.27 0 0.00

Annual Report 2016-17J. B. Chemicals & Pharmaceuticals Limited
32
Sl. No.
Shareholder’s Name Shareholding at the beginning of the year Shareholding at the end of the year % change in share holding
during the year
No. of shares
% of total shares of the
Company
% of shares pledged/
encumbered to total shares
No. of shares
% of total shares of the
Company
% of shares pledged/
encumbered to total shares
38 Synit Drugs Pvt. Ltd. 750 0.00 0 750 0.00 0 0.00
39 Namplas Chemicals Pvt. Ltd. 123,110 0.15 0 123,110 0.15 0 0.00
40 Boxcare Packagings Pvt. Ltd. 8,830 0.01 0 8,830 0.01 0 0.00
41 Nisha Vinaychandra Gosalia/Kantaben Vinaychandra Gosalia
2,420 0.00 0 2,420 0.00 0 0.00
42 Rajniben Zaveri 11,500 0.01 0 11,500 0.01 0 0.00
43 Ila Dipak Parekh/Dipak Hiralal Parekh 9,800 0.01 0 9,800 0.01 0 0.00
44 Bharat K. Doshi 25,402 0.03 0 25,402 0.03 0 0.00
45 Nitin K. Doshi 261,115 0.31 0 261,115 0.31 0 0.00
TOTAL 47,300,837 55.77 0 47,298,137 55.76 0 (0.01)
iii) Change in Promoters’ Shareholding
Share holding at the beginning of the Year
Cumulative Shareholding during the year (01-04-2016 to 31-03-2017)
No. of Shares % of total shares of the Company
No of shares % of total shares of the Company
At the beginning of the year 47,300,837 55.77
Date wise increase/decrease in Promoters Share holding during the year specifying the reasons for increase/decrease (e.g. allotment/ transfer/bonus/sweat equity etc.)
Refer Note
At the end of the year 47,298,137 55.76
Note: The details of Increase / decrease in shareholding in respect of members in Promoter group are as under :
Sl. No.
Name Shareholding Date Increase/Decrease in Share holding
Reason Cumulative Share- holding during the year (01-04-2016 to
31-03-2017)
No. of Shares at the beginning (01-04-
2016)/ at the end of the year (31-03-
2017)
% of total shares of the
Company
No. of shares % of total shares of the Company
1
Vibha Anupam Mehta/ Anupam P. Mehta
9,500 0.01 01-04-2016
16-09-2016 (200) Sale 9300 0.011
14-10-2016 (600) Sale 8700 0.01025-11-2016 (200) Sale 8500 0.01002-12-2016 (200) Sale 8300 0.01023-12-2016 (200) Sale 8100 0.01030-12-2016 (700) Sale 7400 0.00906-01-2017 (400) Sale 7000 0.00803-02-2017 (200) Sale 6800 0.008
6800 0.00 31-03-2017
ANNEXURE - G (Contd.)

33
Corporate Overview Statutory Reports Standalone Financial Statement Consolidated Financial Statement01-13 14-68 69-123 124-179
(iv) Shareholding Pattern of top ten Shareholders (other than Directors, Promoters & Holders of GDRs & ADRs)
Sl. No.
Name Shareholding Date Increase/ Decrease in
Shareholding
Reason Cumulative Shareholding during the
year (01-04-2016 to 31-03-2017)
No. of Shares at the beginning
(01-04-2016)/ at the end of the year (31-03-2017)
% of total shares of
the Company
No. of shares
% of total shares of
the Company
1 Ashish Dhawan 5,193,530 6.12 01-04-2016
09-12-2016 (6,399) Sale 5,187,131 6.12
16-12-2016 (371,163) Sale 4,815,968 5.68
06-01-2017 (92,774) Sale 4,723,194 5.57
13-01-2017 (278,821) Sale 4,444,373 5.24
20-01-2017 (300,843) Sale 4,143,530 4.89
27-01-2017 (104,132) Sale 4,039,398 4.76
10-02-2017 (760,512) Sale 3,278,886 3.87
17-02-2017 (13,319) Sale 3,265,567 3.85
3,243,297 3.82 31-03-2017 (22,270) Sale 3,243,297 3.82
2 Franklin India Smaller Companies Fund
1,350,396 1.49 01-04-201608-04-2016 150,000 Purchase 1,500,396 1.77
30-06-2016 83,846 Purchase 1,584,242 1.87
15-07-2016 76,002 Purchase 1,660,244 1.96
22-07-2016 2,247 Purchase 1,662,491 1.96
26-08-2016 31,951 Purchase 1,694,442 1.99
02-09-2016 (100,000) Sale 1,594,442 1.88
09-09-2016 (100,000) Sale 1,494,442 1.76
23-09-2016 (82,869) Sale 1,411,573 1.66
07-10-2016 50,000 Purchase 1,461,573 1.72
21-10-2016 (210,222) Sale 1,251,351 1.48
28-10-2016 (39,778) Sale 1,211,573 1.43
25-11-2016 50,000 Purchase 1,261,573 1.49
23-12-2016 50,000 Purchase 1,311,573 1.55
30-12-2016 10,502 Purchase 1,322,075 1.56
06-01-2017 2,149 Purchase 1,324,224 1.56
13-01-2017 191,280 Purchase 1,515,504 1.79
20-01-2017 296,069 Purchase 1,811,573 2.14
03-02-2017 50,958 Purchase 1,862,531 2.20
17-02-2017 600,000 Purchase 2,462,531 2.90
10-03-2017 29,664 Purchase 2,492,195 2.94
17-03-2017 24,360 Purchase 2,516,555 2.97
24-03-2017 15,724 Purchase 2,532,279 2.99
2,532,279 2.99 31-03-2017
ANNEXURE - G (Contd.)
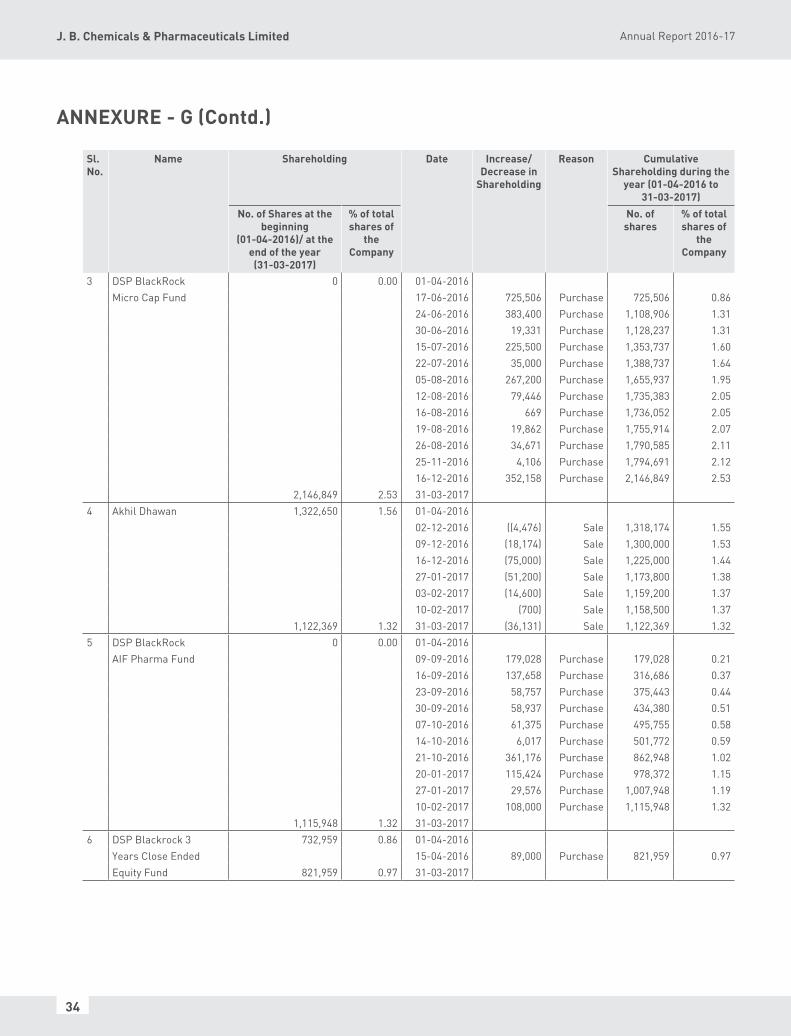
Annual Report 2016-17J. B. Chemicals & Pharmaceuticals Limited
34
Sl. No.
Name Shareholding Date Increase/ Decrease in
Shareholding
Reason Cumulative Shareholding during the
year (01-04-2016 to 31-03-2017)
No. of Shares at the beginning
(01-04-2016)/ at the end of the year (31-03-2017)
% of total shares of
the Company
No. of shares
% of total shares of
the Company
3 DSP BlackRock 0 0.00 01-04-2016Micro Cap Fund 17-06-2016 725,506 Purchase 725,506 0.86
24-06-2016 383,400 Purchase 1,108,906 1.3130-06-2016 19,331 Purchase 1,128,237 1.3115-07-2016 225,500 Purchase 1,353,737 1.6022-07-2016 35,000 Purchase 1,388,737 1.6405-08-2016 267,200 Purchase 1,655,937 1.9512-08-2016 79,446 Purchase 1,735,383 2.0516-08-2016 669 Purchase 1,736,052 2.0519-08-2016 19,862 Purchase 1,755,914 2.0726-08-2016 34,671 Purchase 1,790,585 2.1125-11-2016 4,106 Purchase 1,794,691 2.1216-12-2016 352,158 Purchase 2,146,849 2.53
2,146,849 2.53 31-03-20174 Akhil Dhawan 1,322,650 1.56 01-04-2016
02-12-2016 ((4,476) Sale 1,318,174 1.5509-12-2016 (18,174) Sale 1,300,000 1.5316-12-2016 (75,000) Sale 1,225,000 1.4427-01-2017 (51,200) Sale 1,173,800 1.3803-02-2017 (14,600) Sale 1,159,200 1.3710-02-2017 (700) Sale 1,158,500 1.37
1,122,369 1.32 31-03-2017 (36,131) Sale 1,122,369 1.325 DSP BlackRock 0 0.00 01-04-2016
AIF Pharma Fund 09-09-2016 179,028 Purchase 179,028 0.2116-09-2016 137,658 Purchase 316,686 0.3723-09-2016 58,757 Purchase 375,443 0.4430-09-2016 58,937 Purchase 434,380 0.5107-10-2016 61,375 Purchase 495,755 0.5814-10-2016 6,017 Purchase 501,772 0.5921-10-2016 361,176 Purchase 862,948 1.0220-01-2017 115,424 Purchase 978,372 1.1527-01-2017 29,576 Purchase 1,007,948 1.1910-02-2017 108,000 Purchase 1,115,948 1.32
1,115,948 1.32 31-03-20176 DSP Blackrock 3 732,959 0.86 01-04-2016
Years Close Ended 15-04-2016 89,000 Purchase 821,959 0.97Equity Fund 821,959 0.97 31-03-2017
ANNEXURE - G (Contd.)

35
Corporate Overview Statutory Reports Standalone Financial Statement Consolidated Financial Statement01-13 14-68 69-123 124-179
Sl. No.
Name Shareholding Date Increase/ Decrease in
Shareholding
Reason Cumulative Shareholding during the
year (01-04-2016 to 31-03-2017)
No. of Shares at the beginning
(01-04-2016)/ at the end of the year (31-03-2017)
% of total shares of
the Company
No. of shares
% of total shares of
the Company
7 General Insurance 751,000 0.88 01-04-2016Nil 751,000 0.88Corporation of India
Ltd.751,000 0.88 31-03-2017
8 Dimensional Emerging 611,755 0.72 01-04-2016Markets Value Fund 10-06-2016 3,949 Purchase 615,704 0.73
04-11-2016 (3,696) Sale 612,008 0.7211-11-2016 (5,912) Sale 606,096 0.7203-03-2017 (7,568) Sale 598,528 0.7110-03-2017 (11,492) Sale 587,036 0.6917-03-2017 (6,709) Sale 580,327 0.6824-03-2017 (8,116) Sale 572,211 0.68
569,944 0.67 31-03-2017 (2,267) Sale 569,944 0.679 K India Opportunities 0 0.00 01-04-2016
Fund Limited 26-08-2016 81,000 Purchase 81,000 0.1018-11-2016 19,000 Purchase 100,000 0.1202-12-2016 23,000 Purchase 123,000 0.1509-12-2016 30,300 Purchase 153,300 0.1830-12-2016 4,157 Purchase 157,457 0.1906-01-2017 68,483 Purchase 225,940 0.2727-01-2017 66,000 Purchase 291,940 0.3403-02-2017 100,000 Purchase 391,940 0.4617-03-2017 8,870 Purchase 400,810 0.4724-03-2017 50,037 Purchase 450,847 0.53
536,657 0.63 31-03-2017 85,810 Purchase 536,657 0.6310 Ramu Sitaram Deora 0 0.00 01-04-2016
07-10-2016 3,054 Purchase 3,054 0.0003-02-2017 406,169 Purchase 409,223 0.48
409,223 0.48 31-03-201711 ICICI Lombard General 409,315 0.48 01-04-2016
Insurance Company Ltd. 08-04-2016 (159114) Sale 250,201 0.3015-04-2016 (93914) Sale 156,287 0.1822-04-2016 (2649) Sale 153,638 0.1829-04-2016 (63386) Sale 90,252 0.1106-05-2016 (90252) Sale 0 0.00
0 0.00 31-03-2017
Note : Date mentioned for increase/decrease in shareholding is end-date of weekly beneficial ownership position provided by the depositories.
ANNEXURE - G (Contd.)

Annual Report 2016-17J. B. Chemicals & Pharmaceuticals Limited
36
v) Shareholding of Directors & Key Managerial Personnel (KMP’s)
Sl. No.
Name Shareholding Date Increase/ Decrease in
Share holding
Reason Cumulative Shareholding during the year (01-04-2016
to 31-03-2017)
No. of Shares at the beginning
(01-04-2016)/ at the end of the year
(31-03-2017)
% of total shares of
the Company
No. of shares
% of total shares of
the Company
A DIRECTORS:1 Mr. Jyotindra B. Mody
Chairman& Managing Director
5,371,905 6.33 01-04-2016– – 5,371,905 6.33
5,371,905 6.33 31-03-20172 Mr. Dinesh B. Mody
Whole time Director (Administration)
4,738,932 5.59 01-04-2015– – 4,738,932 5.59
4,738,932 5.59 31-03-20163 Mr. Shirish B. Mody
Whole time Director (Marketing)
5,056,312 5.96 01-04-2016– – 5,056,312 5.96
5,056,312 5.96 31-03-20174 Mr. Bharat P. Mehta
Whole time Director (Planning & Development
2,657,359 3.13 01-04-2016– – 2,657,359 3.13
2,657,359 3.13 31-03-20175 Mr. Pranabh Mody
President & Whole Time Director (Operations)
4,940,172 5.82 01-04-2016– – 4,940,172 5.82
4,940,172 5.82 31-03-20176 Mr. Durga Dass Chopra
Director307,930 0.36 01-04-2016
– – 3,07,930 0.36307,930 0.36 31-03-2017
7 Mr. Kamlesh L. Udani Executive Director (Technical & Production)
57,390 0.07 01-04-2016– – 57,390 0.07
57,390 0.07 31-03-20178 Dr. Satyanarain Agarwala
Director1,570 0.00 01-04-2016
– – 1,570 0.001,570 0.00 31-03-2017
9 Mr. Rajiv C. Mody Director
Nil Nil 01-04-201616-12-2016 1,725 Transmission 1,725 0.00
1,725 0.00 31-03-201710 Ms. Krupa R. Gandhi
DirectorNil Nil 01-04-2016
– – Nil NilNil Nil 31-03-2017
11 Mr. Devang R. ShahDirector
14,890 0.02 01-04-201630-12-2016 2,890 Off-market
internal transfer
17,780 0.02
17,780 0.02 31-03-201712 Mr. Shaukat H. Merchant
Director Nil Nil 01-04-2016
– – Nil Nil Nil Nil 31-03-2017
13 Dr. Manoj R. MashruAdditional Director
Nil Nil 01-04-2016– – Nil Nil
Nil Nil 31-03-2017B Key Managerial Personnel:1 Mr. M. C. Mehta
Company SecretaryNil Nil 01-04-2016
– – Nil Nil Nil Nil 31-03-2017
2 Mr. Vijay BhattChief Financial Officer
Nil Nil 01-04-2016– – Nil Nil
Nil Nil 31-03-2017
ANNEXURE - G (Contd.)

37
Corporate Overview Statutory Reports Standalone Financial Statement Consolidated Financial Statement01-13 14-68 69-123 124-179
V. INDEBTNESS
Indebtedness of the Company including interest outstanding/accrued but not due for payment (` in lakhs)
Secured Loans excluding
deposits
Unsecured Loans Deposits Total Indebtedness
Indebtness at the beginning of the financial yeari) Principal Amount 7,800.00 9,680.19 – 17,480.19ii) Interest due but not paid – 6.04* – 6.04iii) Interest accrued but not due – – – –Total (i+ii+iii) 7,800.00 9,686.23 – 17,486.23Change in Indebtedness during the financial yearAdditions 4,521.78 - – 4,521.78Reduction 7,800.00 9,321.98 – 17,121.98Net Change (3,278.22) (9,321.98) – (12,600.20)Indebtedness at the end of the financial yeari) Principal Amount 4,521.78 364.25 – 4,886.03ii) Interest due but not paid – – – –iii) Interest accrued but not due – – – –Total (i+ii+iii) 4,521.78 364.25 – 4,886.03
*Not debited by the Bank on due date.
VI REMUNERATION OF DIRECTORS AND KEY MANAGERIAL PERSONNEL
A. Remuneration to Managing Director and Whole time Directors : (` in lakhs)
Particulars of Remuneration Name of the MD/WTD Total AmountMr. Jyotindra
B. ModyMr. Dinesh
B. ModyMr. Shirish
B. ModyMr. Bharat P. Mehta
Mr. Pranabh Mody
Mr. Kamlesh L. Udani
Gross salary
(a) Salary as per provisions contained in section 17(1) of the Income Tax Act, 1961 504.30 504.82 504.27 214.64 214.05 124.01 2,066.09
(b) Value of perquisites u/s 17(2) of the Income Tax Act, 1961 36.64 36.12 36.67 20.50 21.09 9.19 160.21
(c) Profits in lieu of salary under section 17(3) of the Income Tax Act, 1961 Nil Nil Nil Nil Nil Nil Nil
Stock option Nil Nil Nil Nil Nil Nil Nil
Sweat Equity Nil Nil Nil Nil Nil Nil Nil
Commission
– as % of profit Nil Nil Nil Nil Nil Nil Nil
– others Nil Nil Nil Nil Nil Nil Nil
Others Nil Nil Nil Nil Nil Nil Nil
Total (A) 540.94 540.94 540.94 235.14 235.14 133.20 2,226.30
Ceiling as per the Act 2,418.40
ANNEXURE - G (Contd.)

Annual Report 2016-17J. B. Chemicals & Pharmaceuticals Limited
38
B. Remuneration to other Directors: (` in lakhs)Particulars of Remuneration
Name of the Director Total AmountMr. Durga
Dass Chopra
Dr. Satyanarain
Agarwala
Dr. Niranjan
N. Maniar
Mr. Mahesh K. Shroff
Mr. Rajiv C. Mody
Mrs. Krupa R. Gandhi
Mr. Jashvantrai
Joshi
Mr. Devang
Shah
Mr. Shaukat H. Merchant
(a) Fee for attending Board/ Committee meetings 9.60 10.80 8.00 2.80 5.60 4.00 2.00 6.00 Nil 48.80
(b) Commission Nil Nil Nil Nil Nil Nil Nil Nil Nil Nil
(c) Others Nil Nil Nil Nil Nil Nil Nil Nil Nil Nil
Total 9.60 10.80 8.00 2.80 5.60 4.00 2.00 6.00 0.00 48.80
Total Managerial Remuneration
2,275.10
Overall Ceiling as per the Act.
2,471.40
Note: The Company does not have Non-executive Directors other than Independent Directors.
C. Remuneration to Key Managerial Personnel other than MD/ WTD (` in lakhs)
Particulars of Remuneration Key Managerial Personnel Total Amount
Company Secretary CFO
Gross Salary
(a) Salary as per provisions contained in section 17(1) of the Income Tax Act, 1961 52.52 58.39 110.91
(b) Value of perquisites u/s 17(2) of the Income Tax Act, 1961 Nil Nil Nil
(c) Profits in lieu of salary under section 17(3) of the Income Tax Act, 1961
Nil Nil Nil
Stock Option Nil Nil Nil
Sweat Equity Nil Nil Nil
Commission
- as % of profit Nil Nil Nil
- others Nil Nil Nil
Others Nil Nil Nil
Total 52.52 58.39 110.91
ANNEXURE - G (Contd.)

39
Corporate Overview Statutory Reports Standalone Financial Statement Consolidated Financial Statement01-13 14-68 69-123 124-179
ANNEXURE - G (Contd.)
VII COMPOUNDING OF OFFENCES
Type Section of the
Companies Act
Brief Description Details of Compounding fees imposed
Authority Appeal made if
any
A. COMPANY – – – – –
B. DIRECTORS
Compounding
Mr. J. B. Mody
Mr. D. B. Mody
Mr. S. B. Mody
Mr. B. P. Mehta
Mr. Pranabh Mody
Mr. K. L. Udani
Dr. S. Agarwala
Dr. N. N. Maniar
Mr. M. K. Shroff
Mr. Rajen D. Shah
Mr. Vishnu D. Patel
Section 217(3) of the Companies Act, 1956
Deputy Registrar of Companies issued show cause notice dated February 5, 2010 stating that the statutory auditors have made qualified adverse remarks in their Auditors’ report dated 8-5-2008 that “In our opinion and to the best of our information and according to the explanation given to us, the said accounts, read together with notes thereon, give the information required by the Companies Act, 1956 in the manner so required and subject to: Note no. 21 of Schedule 20 relating to excess managerial remuneration provided during the year amounting to ` 204.72 lakhs for which the Company is in the process of applying to the Central Government.” and consequently alleged that the board of directors of the Company in their directors’ report dated 8-5-2008 have not given any explanation on the above remarks of the auditors. Therefore, the provisions of section 217(3) of the Act have been contravened in respect of the said directors’ report. Though the directors did not accept and provided details evidencing compliance, the directors later filed compounding application on 20/02/2015 in order to close the matter.
` 20,000 per director. (vide order dated 31/05/2016).
Company Law Board
–
C. OTHER OFFICERS IN DEFAULT
Compounding
Beejal Desai, Company Secretary
Section 217(3) of the Companies Act, 1956
Same as above. Though the company secretary did not accept and provided details evidencing compliance, he later filed compounding application on 20/02/2015 in order to close the matter.
Same Compounding fees as imposed on the directors as mentioned above.
Company Law Board
–
Note : No penalties/punishment imposed by any authority for the year ended on March 31, 2017.

Annual Report 2016-17J. B. Chemicals & Pharmaceuticals Limited
40
ANNEXURE - H
Information as per Rule 5 (2) of the Companies (Appointment and Remuneration of Managerial Personnel) Rules, 2014 for the year ended on March 31, 2017.
(a) Name & age (years) (b) Designation (c) Gross remuneration received (`) (d) Qualification(s) & experience (years) (e) Date of commencement of employment (f) Last employment held before joining the Company
(a) Joshi M.D. (Dr.) (53) (b) President-Global Regulatory Management (c) 15,570,126 (d) M.Sc., Ph.D (31) (e) 07.12.1989 (f) Adonis Labs Private Limited-Executive Quality Assurance (a) Mehta B.P. (69) (b) Whole time director (Planning & Development) (c) 24,985,481 (d) B.Sc. (46) (e) 01.01.1977 (f) Unique Pharma Labs.-Production Manager (a) Mehta J.B. (39) (b) Senior Vice President (International Division) (c) 14,118,515 (d) B.Sc.(Chem. Engg.) (12) (e) 01.10.2004 (f) Allergan Pharmaceuticals-Research Project-In charge (a) Mody D.B. (80) (b) Whole-time director (Administration) (c) # 56,957,133 (d) Exp. in Admn. (62) (e) 01.01.1977 (f) J.B. Chemicals & Pharmaceuticals Pvt. Ltd.-Whole-time director (Administration) (a) Mody J.B. (88)(b) Managing Director (c) # 56,957,133 (d) Inter Sc. (66) (e) 01.01.1977 (f) J.B. Chemicals & Pharmaceuticals Pvt. Ltd.-Managing Director (a) Mody N.S. (36) (b) Senior Vice President- Strategic Marketing & Business Development (c) 14,117,820 (d) B.Sc. in Business Admn. (12) (e) 13.07.2004 (f) Rodman & Renshaw-Equity Research Analyst (a) Mody P.D. (53) (b) President & Whole time director (Operations) (c) 24,985,481 (d) B.Pharm., M.B.A. (USA) (30) (e) 25.06.1987 (f) First employment (a) Mody S.B. (76) (b) Whole time director (Marketing) (c) # 56,957,133 (d) B.Sc. (Tech.) (57) (e) 01.01.1977 (f) J.B. Chemicals & Pharmaceuticals Pvt. Ltd.- Director-Technical (a) Singh P.K. (52) (b) President (Global Business) (c) 12,653,709 (d) M.Pharm (30) (e) 01.12.2001 (f) Coral Laboratories-General Manager (International Division) (a) Udani K.L. (63) (b) Executive Director (Technical & Production) (c) 14,364,874 (d) B.E. (Elect.), M.B.A. (37) (e) 01.02.2001 (f) Unique Pharmaceutical Laboratories Ltd.-Managing Director.
Notes: (1) The nature of employment of the above employees is contractual in nature. The other terms and conditions of each of the above are as per the contract/letter of appointment and rules of the Company. (2) Mr. J.B. Mody, Mr. D.B. Mody and Mr. S.B. Mody are related to each other as brothers. Mr. P.D. Mody is son of Mr. D. B. Mody. Mr. N.S. Mody is son of Mr. S. B. Mody. Mr. B.P. Mehta is son-in-law of Mr. J.B. Mody and Mr. J.B. Mehta is son of Mr. B.P. Mehta. (3) An employee of the Company in receipt of remuneration in excess of that drawn by the whole-time director does not hold by himself or along with his spouse and dependent children more than two percent of the equity shares of the Company. #(4) An amount of ` 100 lakhs was paid to each of Mr. J B. Mody, Mr. D. B. Mody and Mr. S. B. Mody during the year as commission for financial year 2015-16. The remuneration of Mr. J. B. Mody, Mr. D. B. Mody and Mr. S. B. Mody mentioned above is for 2016-17 and does not include the said commission paid during the year.
For and on behalf of the Board of Directors
J. B. Mody Chairman & Managing DirectorPlace : MumbaiDate : May 23, 2017

41
Corporate Overview Statutory Reports Standalone Financial Statement Consolidated Financial Statement01-13 14-68 69-123 124-179
Disclosure pursuant to Section 197(12) of the Companies Act, 2013 read with Rule 5(1) of the Companies (Appointment and Remuneration of Managerial Personnel) Rules, 2014
(i) The ratio of the remuneration of each executive director to the median remuneration of the employees of the Company.
Name Designation Remuneration for 2016-17 ( ` in lakhs)
% increase in remuneration of
2016-17
Ratio of remuneration
paid in 2016-17
to median remuneration
Jyotindra B. Mody Chairman & Managing Director 569.57 12.50 233:1
Dinesh B. Mody Wholetime director (Administration) 569.57 12.50 233:1
Shirish B. Mody Wholetime director (Marketing) 569.57 12.50 233:1
Bharat P. Mehta Wholetime director (Planning & Development) 249.85 12.50 102:1
Pranabh Mody President & Wholetime director (Operations) 249.85 12.50 102:1
Kamlesh L Udani Executive director (Technical & Production) 143.65 12.50 102:1
(ii) The non-executive directors were only paid sitting fees during the year for attending meetings of the Board and Committees thereof. The principles governing the increase in the remuneration of executive directors and increase in sitting fees payable to non-executive directors, as per the Company’s remuneration policy, are different. Further, the amount of sitting fees received by a non-executive director depends on (a) amount of sitting fee fixed by the Board for meetings of the Board and a particular Committee, and (b) number of meetings of the Board and Committee(s) thereof attended by him. Therefore, the information as to ratio of sitting fee paid to the median remuneration of employees and percentage increase in remuneration of non-executive directors is not relevant and meaningful. However, the said information is given here below.
Name of independent director Sitting fees paid during 2016-17
(` in lakhs)
Sitting fees paid during 2015-16
(` in lakhs)
% increase in 2016-17 over
2015-16
Ratio of sitting fee paid during
2016-17 to median remuneration1
Mr. Durga Dass Chopra 10.80 11.40 (5.26) 4.42:1
Dr. Satyanarain Agarwala 9.60 13.00 (26.15) 3.93:1
Mr. Rajiv C. Mody 2.80 2.00 40.00 1.14:1
Dr. Niranjan Maniar (up to 22/11/2016)
6.00 9.00 (33.33) 2.45:1
Ms. Krupa R. Gandhi 8.00 9.00 (11.11) 3.27:1
Mr. Devang Shah 5.60 5.80 3.44 2.29:1
Mr. Shaukat Merchant 4.00 2.00 100 1.63:1
Dr. Manoj Mashru (Appointed on 18/11/2016)
2.00 – – 0.81:1
1Percentage increase in sitting fee and ratio of sitting fee to median remuneration would vary due to factors such as number of meetings held and attended during current year, number of committee positions held and the date of appointment/resignation.
(iii) Increase in remuneration of Chief Financial Officer and Company Secretary
The increase in remuneration of Chief Financial Officer and Company Secretary during the year was 13.19% and 21.19% respectively.
(iv) The increase in the median remuneration of the employees in the financial year was 15.27%.
(v) As on March 31, 2017, the Company had 3,506 permanent employees on its rolls.
ANNEXURE - I

Annual Report 2016-17J. B. Chemicals & Pharmaceuticals Limited
42
(vi) Average percentile increase already made in the salaries of employees other than managerial personnel in the last financial year and its comparison with the percentage increase in the managerial remuneration and justification thereof and point out if there are any exceptional circumstances for increase in the managerial remuneration:
The average increase in the remuneration of employees (other than the managerial personnel) during 2016-17 was 16.13% as against the average increase of 12.50% granted in the fixed remuneration of managerial personnel.
The increase in remuneration of managerial personnel was the outcome of performance of the Company, performance of the managerial personnel and the market practices. But the increase was capped to 12.50% as per the resolution passed by the Board of Directors/Shareholders of the Company. There were no exceptional circumstances for increase in the managerial remuneration.
(vii) It is affirmed that the remuneration of the directors and employees of the Company is as per remuneration policy of the Company.
For and on behalf of the Board of Directors
J. B. Mody Chairman & Managing Director
Place : MumbaiDate : May 23, 2017
Disclosure of details in respect of Company’s Employee Stock Option Plan
Year of Grant2004 2005 2006
(a) Options granted 475,000 563,240 547,000(b) Exercise price 63 84 95(c) Options vested 475,000 563,240 547,000(d) Options exercised 271,800 204,250 148,925(e) The total number of shares arising as a result of exercise of option 271,800 204,250 148,925(f) Options lapsed 203,200 358,990 398,075(g) Variation of terms of options Not Applicable Not Applicable Not Applicable(h) Money realised by exercise of options (In `) 17,123,400 17,157,000 14,147,875(i) Total number of options in force Nil Nil Nil(j) Employee wise details of options granted to:
(i) Key Managerial Personnel; Nil(ii) Any other employee who receives a grant of options in any one year of option amounting to five percent or more of options granted during that year;
No employee has received a grant in any one year of option amounting to 5% or more of option granted during that year.
(iii) Identified employees who were granted option, during any one year, equal to or exceeding one percent of the issued capital of the Company at the time of grant.
No employee has been granted options equal to or exceeding 1% of the issued capital of the Company in any year.
For and on behalf of the Board of Directors
J. B. Mody Chairman & Managing Director
Place : MumbaiDate : May 23, 2017
ANNEXURE - J
ANNEXURE - I (Contd.)

43
Corporate Overview Statutory Reports Standalone Financial Statement Consolidated Financial Statement01-13 14-68 69-123 124-179
INDUSTRY DEVELOPMENTSThe domestic formulations industry at sales of over ` 96,000 crores (IMS, MAT March, 2017) achieved growth of 9.20%. The market continues to show intense competition with increased number of brands being launched in the market. In March 2016, Government of India issued notifications under Drugs and Cosmetics Act, 1940 prohibiting manufacture for sale, sale and distribution of about 344 fixed dose combinations. Many of the affected companies challenged this exercise of power by the Central Government before Hon’ble Delhi High Court, which has quashed the said notifications by judgement and order dated December 1, 2016. Central Government has appealed against this judgement and order in the Supreme Court. Only four products of the Company are affected due to some of these notifications, the sales of which are not regarded as material.
OPPORTUNITIES & THREATSDomestic Business:
The domestic formulations industry has been growing well for last several years and the growth prospects going forward seem robust. The future outlook for the industry and growth expectations remain positive in view of increased government and private spending on healthcare. The per capita consumption of drugs is on increase due to spurt in chronic diseases coupled with increase in literacy rate, increase in per capita income, improved healthcare access, increasing market penetration and increasing health awareness. All these are expected to continue to provide growth opportunity in coming years. The brand building, new products introductions, product awareness programmes and penetration in Tier II and Tier III markets will remain growth enablers. For the Company, the domestic formulations business is a thurst area and has consistently shown growth in last several years. In view of good long term growth prospects offered by the domestic industry and the Company’s strengths in this business, the Company has good growth potential and is well poised to take advantage of the growing market.
During the year 2016-17, domestic formulations business of the Company registered 17.27% growth. The Company has divided the existing division into 2 divisions and then added 600 people to balance each of the teams. The objective is to improve the focus on key doctors. In addition, this creates capacity to efficiently handle more products. This aggressive strategy is expected to bring in growth from current year onwards. The Company will continue to focus on growing therapeutic segments like anti-hypertensive, anti-peptic ulcerant, pain management, anti-infective and gastrointestinal and plans to launch this year new products in dermatology and wound management segment.
ANNEXURE - K MANAGEMENT DISCUSSION AND ANALYSIS REPORT
The Company has already created good brands like Cilacar (calcium channel blocker), Rantac (anti-peptic ulcerant) and Metrogyl (amoebicides), which feature in top 300 brands in value terms and top 100 brands in unit terms (IMS) and otherwise enjoy strong brand equity in medical fraternity and trade. The sustained brand building efforts in cardiac, gastro, pain management and topical anti-infective segments have met with good success.
The Company’s contrast media division also performed well during the year and achieved growth of 8.91%. The Company plans to add more medical representatives and also introduce few new products in this business during the year.
The rising costs and increasing span of price control remain a concern. However, the Company is hopeful of growing the business in this segment
International Business:
Wide geographical presence in international market, increased focus on ANDA filings, focus on new products introduction in Russia-CIS market, focus on lucrative contract manufacturing business backed by State-of-the-art manufacturing facilities with approval from health authorities such as US FDA, EU GMP, TGA Australia, MCC South Africa, MoH-Ukraine and MoH-Japan, and wide range of products across injectable, solid and semi-solid present a good opportunity in international business.
The Company’s exports of formulations at ` 524 crores were 1.44% lower compared to the previous year. While primary sales for Russia-CIS markets were 15.61% higher, exports to Global markets (other than Russia-CIS) were 3.21% lower due to high currency fluctuations and business uncertainties in emerging markets. The sales in key markets such as US and Australia were satisfactory. During the year, the Company received US FDA approval for Oxybutynin Extended-Release tablets and Glipizide Extended-Release tablets, which have been commercialized. ANDA products and site transfer business have been identified as growth driver of Global business and the Company has been investing accordingly.
The currency volatility situation in Russia is gradually returning to normal and the Company expects growth in secondary sales. The Company has been in the process of building portfolio of new high potential OTC and prescription products for the Russian market to grow the business and make it more viable. The new products identified are under clinical trial process as per new regulatory requirement and will take some more time to reach the market. The field force expansion this year in this market is also planned for better coverage of the Products.

Annual Report 2016-17J. B. Chemicals & Pharmaceuticals Limited
44
However, CIS market continues to be sluggish due to weak economic situation.
The Company perceives currency volatility, increased competition in generics business, price erosion and changing regulatory environment as a major concern in the international business.
SEGMENT WISE PERFORMANCEThe Company is engaged in one segment viz. pharmaceuticals. The domestic formulations business with net sales of ` 477.69 crores registered growth of 17.27% against industry growth of 10% during the year. The contrast media division with net sales of ` 43.91 crores achieved growth of 8.91%.
The exports to Rest of the World countries at ` 378.16 crores were 3.21% lower. However, exports for Russia-CIS market at ` 60.65 crores were 15.61% higher. As stated above, formulations exports during the year were particularly affected due to sharp depreciation of major currencies against US Dollar. The sales of bulk drugs at ` 91.70 crores were 8.71% lower.
OUTLOOKIn view of good business outlook both in domestic and international market as discussed above, the Company’s manufacturing infrastructure of international standard, strong products portfolio with high growth brands, strong marketing capability and strong balance sheet present good outlook for the Company’s business.
RISKS AND CONCERNSYour Company does not perceive any risks or concerns other than those that are common to the industry such as regulatory risks, exchange risk and other commercial and business related risks.
INTERNAL CONTROL SYSTEMS AND THEIR ADEQUACYYour Company has an adequate system of internal controls, which ensures that its assets are protected from loss and
unauthorized use as well as business affairs are carried out in accordance with established procedures. These systems of internal controls also ensure that transactions are carried out based on authority and are recorded and reported in line with generally accepted accounting principles. The Company also has a system of regular internal audit carried out by competent professionals retained by the Company. The internal audit programme is approved by the Audit Committee, and findings of the internal auditor are placed before the Audit Committee and the Board at regular interval. The internal control system is adequate keeping in view size and nature of the Company’s business.
FINANCIAL PERFORMANCE WITH RESPECT TO OPERATIONAL PERFORMANCERevenue from operations at ̀ 1,198.69 crores registered growth of 2.897% over the previous year. The operating profit at ̀ 175.89 crores was 5.08% lower due to lower sales. Consequently, the profit before tax and profit after tax at ` 216.78 crores and ` 170.26 crores were also lower.
However, consolidated performance was better. Consolidated revenue from operations at ` 1,368.31 crores were 11.10% higher, while consolidated profit before tax and consolidated profit after tax at ` 229.94 crores and ` 181.35 crores were 8.35% and 11.79% higher.
HUMAN RESOURCEThere has been no material development on human resources and industrial relations front. The relationship with employees and workers continued to be cordial at all levels. As on March 2017, permanent employee strength was 3,506.
For and on behalf of the Board of Directors
J. B. Mody Chairman & Managing Director
Place : MumbaiDate : May 23, 2017
ANNEXURE - K (Contd.)

45
Corporate Overview Statutory Reports Standalone Financial Statement Consolidated Financial Statement01-13 14-68 69-123 124-179
SECRETARIAL AUDIT REPORT
FOR THE FINANCIAL YEAR ENDED ON MARCH 31, 2017
[Pursuant to section 204(1) of the Companies Act, 2013 and Rule No.9 of the Companies (Appointment and Remuneration of Managerial Personnel) Rules, 2014]
To,The Members,J. B. Chemicals & Pharmaceuticals LimitedNeelam Centre, B wing,4th Floor, Hind Cycle Road,Worli, Mumbai 400030.
I have conducted the secretarial audit of the compliance of applicable statutory provisions and the adherence to good corporate practices by J. B. Chemicals & Pharmaceuticals Limited (hereinafter called the Company). The Secretarial Audit was conducted in a manner, which provided me a reasonable basis for evaluating the corporate conducts/statutory compliances and expressing my opinion thereon.
Based on my verification of the Company’s books, papers, minute books, forms and returns filed and other records maintained by the Company and also the information provided by the Company, its officers, agents and authorized representatives during the conduct of secretarial audit, I hereby report that in my opinion, the company has, during the audit period covering the financial year ended on March 31, 2017 complied with the statutory provisions listed hereunder and also that the Company has proper Board-processes and compliance-mechanism in place to the extent, in the manner and subject to the reporting made hereinafter:
I have examined the books, papers, minute books, forms and returns filed and other records maintained by the Company for the financial year ended on March 31, 2017 according to the provisions of:
(i) The Companies Act, 2013 (the Act) and the Rules made there under;
(ii) The Securities Contracts (Regulation) Act, 1956 (‘SCRA’) and the rules made there under;
(iii) The Depositories Act, 1996 and the Regulations and Bye-laws framed there under;
(iv) Foreign Exchange Management Act, 1999 and the rules and regulations made there under to the extent of Overseas Direct Investment;
(v) The following Regulations and Guidelines prescribed under the Securities and Exchange Board of India Act, 1992 (‘SEBI Act’):-
(a) The Securities and Exchange Board of India (Substantial Acquisition of Shares and Takeovers) Regulations, 2011;
(b) The Securities and Exchange Board of India (Prohibition of Insider Trading) Regulations, 2015;
(c) The Securities and Exchange Board of India (Issue of Capital and Disclosure Requirements) Regulations, 2009; (Not applicable to the Company during audit period);
(d) The Securities and Exchange Board of India (Employee Stock Option Scheme and Employee Stock Purchase Scheme) Guidelines, 1999.
(e) The Securities and Exchange Board of India (Issue and Listing of Debt Securities) Regulations, 2008 (Not applicable to the Company during audit period);
(f) The Securities and Exchange Board of India (Registrars to an Issue and Share Transfer Agents) Regulations, 1993 regarding the Companies Act and dealing with client;
ANNEXURE - L

Annual Report 2016-17J. B. Chemicals & Pharmaceuticals Limited
46
ANNEXURE - L (Contd.)
(g) The Securities and Exchange Board of India (Delisting of Equity Shares) Regulations, 2009 (Not applicable to the Company during audit period); and
(h) The Securities and Exchange Board of India (Buyback of Securities) Regulations, 1998 (Not applicable to the Company during audit period);
(vi) We have relied on the representation made by the Company and its Officers for systems and mechanism formed by the Company for compliances under other applicable Acts, Laws and Regulations to the Company. The list of major head/groups of Acts, Laws and Regulations as applicable to the Company is given in Annexure I.
I have also examined compliance with the applicable clauses of the following:
(i) Secretarial Standards issued by The Institute of Company Secretaries of India.
(ii) The Listing Agreements entered into by the Company with the Stock Exchange(s);
(iii) Securities and Exchange Board of India (Listing Obligation and Disclosure Requirements) Regulations, 2015;
During the period under review the Company has complied with the provisions of the Act, Rules, Regulations, Guidelines, Standards, etc. mentioned above.
I further report that
The Board of Directors of the Company is duly constituted with proper balance of Executive Directors, Non-Executive Directors and Independent Directors. The changes in the composition of the Board of Directors that took place during the period under review were carried out in compliance with the provisions of the Act.
Adequate notice is given to all directors to schedule the Board Meetings and agenda and detailed notes on agenda were sent at least seven days in advance, and a system exists for seeking and obtaining further information and clarifications on the agenda items before the meeting and for meaningful participation at the meeting. Majority decision is carried through while the dissenting members’ views, if any are captured and recorded as part of the minutes.
I further report that there are adequate systems and processes in the company commensurate with the size and operations of the company to monitor and ensure compliance with applicable laws, rules, regulations and guidelines.
I further report that during the audit period the Company has not passed any ordinary/special resolutions which are having major bearing on the company’s affairs in pursuance of the above referred laws, rules, regulations, guidelines, standards, etc.
For Ashish Bhatt & Associates
Ashish BhattPracticing Company Secretary
FCS No: 4650C.P. No. 2956
Place : ThaneDate : May 23, 2017

47
Corporate Overview Statutory Reports Standalone Financial Statement Consolidated Financial Statement01-13 14-68 69-123 124-179
ANNEXURE - L (Contd.)
Annexure I
List of applicable laws to the Company
Under the Major Group and Head
1. Drugs & Cosmetics Act, 1940;
2. Drugs (Prices Control) Order 2013;
3. Factories Act, 1948;
4. Industries (Development & Regulation) Act, 1951;
5. Labour Laws and other incidental laws related to labour and employees appointed by the Company either on its payroll or on contractual basis as related to wages, gratuity, provident fund, ESIC, compensation etc;
6. Acts prescribed under prevention and control of pollution;
7. Acts prescribed under Environmental protection;
8. Acts as prescribed under Direct Tax and Indirect Tax;
9. Labour Welfare Act of respective States;
10. Trade Marks Act 1999;
11. The Legal Metrology Act, 2000.
For Ashish Bhatt & Associates
Ashish BhattPracticing Company Secretary
FCS No: 4650C.P. No. 2956
Place : ThaneDate : May 23, 2017

Annual Report 2016-17J. B. Chemicals & Pharmaceuticals Limited
48
CORPORATE GOVERNANCE REPORT
COMPANY’S PHILOSOPHY ON CODE OF GOVERNANCEThe Company’s philosophy on code of governance is aimed at assisting the management and the Board of Directors in efficient conduct of the business and in meeting its obligations to all stakeholders, and is guided by the principles of transparency, fairness, accountability and integrity. The philosophy also includes insistence on strict adherence to the governance mechanism laid down in the Companies Act, 2013 and the Securities and Exchange Board of India (Listing Obligations and Disclosure Requirements) Regulations, 2015 (“Listing Regulations”). These practices are intended to achieve balance between enhancement of stakeholder value and achievement of financial objective.
BOARD OF DIRECTORS(i) (a) Composition, Attendance and other Directorships:
The strength of the Board of Directors of the Company as on the year end was thirteen. Six directors, including Mr. Jyotindra B. Mody, Chairman & Managing Director, are executive directors, while seven directors are non-executive and independent directors.
The information on composition and category of directors as well as attendance of each director at the meetings of the Board of Directors held during the year ended on March 31, 2017 and at the last annual general meeting and their directorships in other companies and committee membership in other public companies as of the year-end is as under:
Name of Director Category No. of board meetings attended
Attendance at last AGM
No. of other director-
ship(s)
Other committee position
Member Chairman
Mr. Jyotindra B. Mody Executive (Promoter) 4 Yes 3 − −
Mr. Dinesh B. Mody Executive (Promoter) 4 Yes 2 − −
Mr. Shirish B. Mody Executive (Promoter) 4 Yes 3 − −
Mr. Bharat P. Mehta Executive (Promoter Group) 4 Yes 2 − −
Mr. Pranabh Mody Executive (Promoter Group) 4 Yes 3 1 −
Mr. Kamlesh L. Udani Executive 3 Yes 3 − −
Mr. Durga Dass Chopra Non-Executive & Independent 4 Yes 1 − −
Dr. Satyanarain Agarwala Non-Executive & Independent 4 Yes 2 − −
Mr. Rajiv C. Mody Non-Executive & Independent 2 No 3 1 −
Ms. Krupa R. Gandhi Non-Executive & Independent 4 Yes 1 − −
Mr. Devang R. Shah Non-Executive & Independent 4 Yes 4 − −
Mr. Shaukat Merchant Non-Executive & Independent 4 Yes 1 − −
Dr. Manoj Mashru (appointed as additional director w.e.f. 18/11/2016)
Non-Executive & Independent 2 Not Applicable
− − −
Dr. Niranjan N. Maniar (up to 22/11/2016)
Non-Executive & Independent 3 Yes *− *− *−
Mr. Jashvantrai B. Joshi (up to 28/09/2016)
Non-Executive & Independent − No *− *− *−
*Not applicable as not a director as on March 31, 2017
Notes:
(1) The directorships exclude directorships of bodies corporate incorporated outside India.
(2) The committee positions pertain to position held on Audit Committee and Stakeholders Relationship Committee of public limited companies.

49
Corporate Overview Statutory Reports Standalone Financial Statement Consolidated Financial Statement01-13 14-68 69-123 124-179
CORPORATE GOVERNANCE REPORT (Contd.)
(b) Meetings and Review:
4 meetings of the Board of Directors were held during the year ended on March 31, 2017. These meetings were held on May 23, 2016, August 26, 2016, November 18, 2016 and February 10, 2017.
The Board of Directors reviews compliance of applicable laws on quarterly basis. The Board has formulated risk management plan and periodically reviews the mitigation measures taken by the management. The Company has also laid down system to inform Board members about risk assessment and minimization procedures. The Company is working on the succession plan for appointment to the Board of Directors and senior management and soon plans to place the same before the Board. The Company places all information, as and when applicable, as specified in Part A of Schedule II of the Listing Regulations before the Board of Directors.
Independent directors of the Company met once in the year without the presence of non-independent directors and members of management for review and assessment of the matters set in Regulation 25(4) of the Listing Regulations. The maximum tenure of independent directors is in accordance with the Companies Act, 2013 and rules made there under.
(c) Code of Conduct:
The Board has laid down the code of conduct for members of the Board and senior management personnel of the Company. Board members and senior management personnel has affirmed compliance with the code and based thereon a declaration by managing director of the Company in this regard has been annexed to this report.
(d) CEO/CFO Certification:
The Managing Director and Chief Financial Officer have provided certificate as specified in Part B of Schedule II of the Listing Regulations to the Audit Committee and the Board of Directors.
(e) Performance Evaluation:
Performance evaluation of all directors for the year 2016-17 was first carried out by the Nomination and Remuneration Committee. Thereafter, the Board (excluding director being evaluated) carried out evaluation of performance of all directors including independent directors. Further information on the subject is provided in the Directors’ Report.
(ii) Relationship between directors inter-se:
Mr. Jyotindra B. Mody, Mr. Dinesh B. Mody and Mr. Shirish B. Mody are related to each other as brothers. Mr. Bharat Mehta is related to Mr. Jyotindra B. Mody as son-in-law. Mr. Pranabh Mody is son of Mr. Dinesh B. Mody.
(iii) The number of equity shares held by the non-executive directors in the Company as on March 31, 2017 are as under:
Name No. of shares held
Mr. Durga Dass Chopra 3,07,930
Dr. Satyanarain Agarwala 1,570
Mr. Rajiv C. Mody 1,725
Ms. Krupa R. Gandhi −
Mr. Devang Shah 17,780
Dr. Manoj Mashru −
Mr. Shaukat Merchant −

Annual Report 2016-17J. B. Chemicals & Pharmaceuticals Limited
50
(iv) The Company conducted a familiarisation programme for its independent directors to familiarize them with (a) business of the Company along with over view of the industry and regulations governing it (b) type of products manufactured by the Company (c) business model of the Company in domestic and international market (d) markets where the Company does the business and growth prospects in such markets (e) Company’s business activities in each business unit (f) major brands of the Company (g) Company’s manufacturing facilities, and (h) role, rights, responsibilities and duties of Independent directors. The Company has posted the details of familiarisation programme imparted to independent directors on its website and web link thereto is http://www.jbcpl.com/investors/pdf/2015_2016/Familarization-programme.pdf
AUDIT COMMITTEEThe terms of reference of the Audit Committee are as per the provisions of Section 177 of the Companies Act, 2013 and the Listing Regulations. The terms of reference are 1) Oversight of the Company’s financial reporting process and the disclosure of its financial information to ensure that the financial statement is correct, sufficient and credible; 2) Recommendation for appointment, remuneration and terms of appointment of auditors of the Company; 3) Approval of payment to statutory auditors for any other services rendered; 4) Reviewing, with the management, the annual financial statements and auditors’ report thereon before submission to the Board for approval; 5) Reviewing, with the management, the quarterly financial statements before submission to the Board for approval; 6) Monitoring the end use of funds raised through public offers and related matters; 7) Reviewing, with the management, the statement of uses/application of funds raised through an issue (public issue, rights issue, preferential issue, etc.), the statement of funds utilized for purposes other than those stated in the offer document/prospectus/notice and the report submitted by the monitoring agency monitoring the utlilisation of proceeds of a public or rights issue, and making appropriate recommendations to the Board to take up steps in this matter; 8) Review and monitor the auditors’ independence and performance, and effectiveness of audit process; 9) Approval or any subsequent modification of transactions of the Company with related parties; 10) Scrutiny of inter-corporate loans and investments; 11) Valuation of undertakings or assets of the Company, wherever it is necessary; 12) Evaluation of internal financial controls and risk management systems; 13) Reviewing, with the management, performance of statutory and internal auditors, adequacy of the internal control systems; 14) Reviewing the adequacy of internal audit function, if any, including the structure of the internal audit department, staffing and seniority of the official heading the department, reporting structure coverage and frequency of internal audit; 15) Discussion with internal auditors of any significant findings and follow up there on; 16) Reviewing the findings of any internal investigations by the internal auditors into matters where there is suspected fraud or irregularity or a failure of internal control systems of a material nature and reporting the matter to the Board; 16) Discussion with statutory auditors before the audit commences, about the nature and scope of audit as well as post-audit discussion to ascertain any area of concern; 17) To look into the reasons for substantial defaults in the payment to the depositors, debenture holders, shareholders (in case of non-payment of declared dividends) and creditors; 18) To review the functioning of the Whistle Blower mechanism; 19) Approval of appointment of CFO (i.e., the whole-time Finance Director or any other person heading the finance function or discharging that function) after assessing the qualifications, experience and background, etc. of the candidate; 20) Approval or any subsequent modifications of transactions of the Company with related parties as per the Companies Act, 2013 and Listing Regulations; 21) Examination of the financial statements and the auditors’ report thereon; and 22) Such other items of business as the Companies Act, 2013, rules made there under and the Listing Agreement for the time being in force requires or may hereinafter require the audit committee to consider, review, evaluate, examine, scrutinise, value, approve, monitor, report, note or otherwise.
The composition of the Audit Committee complies with the requirement laid down in the Listing Regulations as well as Companies Act, 2013. Mr. D. D. Chopra, Chartered Accountant, is Chairman of the Audit Committee, while Mr. Dinesh B. Mody, Dr. Satyanarain Agarwala and Ms. Krupa R. Gandhi are the other members of the Audit Committee. M.C. Mehta, Company Secretary, acts as Secretary to the Audit Committee. The Audit Committee reviews information specified in Section B of Part C of Schedule II of the Listing Regulations, to the extent applicable.
The information pertaining to number and dates of the meetings of the Audit Committee held during 2016-17 indicating the number of meetings attended by each director is set out in Annexure G.
The Chairman & Managing Director, President & Whole-time director (Operations), Chief Financial Officer, statutory auditor and internal auditor are regular invitees to the Audit Committee meetings.
CORPORATE GOVERNANCE REPORT (Contd.)

51
Corporate Overview Statutory Reports Standalone Financial Statement Consolidated Financial Statement01-13 14-68 69-123 124-179
NOMINATION AND REMUNERATION COMMITTEEThe Nomination and Remuneration Committee comprises of three independent directors namely Dr. Satyanarain Agarwala, Chairman, Mr. Rajiv C. Mody and Mr. Devang Shah. The terms of reference of the Committee is as per the provisions of the Companies Act, 2013 and the Listing Regulations. The terms of reference are 1) To formulate criteria for determining qualifications, positive attributes and independence of a director and recommend to the Board a policy, relating to the remuneration of the directors, key managerial personnel and other employees; 2) To formulate criteria of persons who may be appointed in senior management. The term ‘senior management’ shall mean personnel of the Company who are members of its core management team (excluding Board of Directors) comprising all members of the management one level below the executive directors, including the functional heads; 3) To identify persons who are qualified to become directors and who may be appointed in senior management in accordance with the criteria laid down, and recommend to the Board their appointment and removal; 4) To devise a policy on Board diversity (including diversity of thought, experience, knowledge, perspective and gender); 5) To formulate criteria for performance evaluation of directors, Board of Directors and committees of the Board; 6) To carry out evaluation of every director’s performance; 7) To carry out such other functions as is or may be prescribed under the Companies Act, 2013, rules made there under and the SEBI (Listing Obligations and Disclosure Requirements) Regulations, 2015, from time to time; 8) To determine remuneration package for executive directors and also approve remuneration of executive directors in the event of absence or inadequacy of profits in any year pursuant to Schedule V to and other related provisions of the Companies Act, 2013. 9) To decide as to whether to extend or continue the term of appointment of independent director, on the basis of the report of performance evaluation of independent directors and make recommendation to the Board in this behalf.
The information pertaining to number and dates of the meetings of the Nomination and Remuneration Committee held during 2016-17 indicating the number of meetings attended by each director is set out in Annexure G.
The Nomination and Remuneration Committee has, inter alia, laid down criteria for evaluation of performance of independent directors, which are also adopted by the Board for the purpose. The criteria for performance evaluation of the Independent directors are (1) active participation in Board meetings and committee meetings (2) devotion of time to the Company’s affairs and regular attendance of Board meetings and committee meetings (3) adequate preparation for the Board meetings (4) objectivity and independent judgement to the proceedings and deliberations of the Board (5) observance and promotion of corporate governance (6) open and constructive communication, and (7) attendance at the meetings.
REMUNERATION OF DIRECTORS(i) Remuneration of Non-executive directors
The non-executive directors at present are only paid sitting fees for attending meetings of the Board and Committee(s) thereof. Role and responsibilities of non-executive directors, being the criteria relied upon by the Board, the Board unanimously decides the amount of sitting fees to be paid from time to time, in accordance with the Remuneration Policy of the Company. The sitting fee presently fixed does not require prior approval of the shareholders. The information on amount of sitting fees paid to the non-executive directors for attending meetings of the Board and Committee(s) thereof held during the year ended on March 31, 2017 is as under:
Name Sitting Fees (`)
Mr. Durga Dass Chopra 9,60,000
Dr. Satyanarain Agarwala 10,80,000
Mr. Rajiv C. Mody 2,80,000
Ms. Krupa R. Gandhi 8,00,000
Mr. Devang Shah 5,60,000
Mr. Shaukat Merchant 4,00,000
Dr. Manoj Mashru 2,00,000
Dr. Niranjan N. Maniar (up to 22/11/2016) 6,00,000
During the year under report, the non-executive directors’ neither had any other pecuniary relationship nor entered into any other transaction vis-à-vis the Company.
CORPORATE GOVERNANCE REPORT (Contd.)

Annual Report 2016-17J. B. Chemicals & Pharmaceuticals Limited
52
(ii) Remuneration of Executive directorsThe remuneration of the executive directors of the Company for the year ended on March 31, 2017 summarized under major elements is as under:
(` in lakhs)
Name Salary Allowances & Perquisites Retiral benefits Total
Mr. Jyotindra B. Mody 226.02 282.53 61.02 569.57
Mr. Dinesh B. Mody 226.02 282.53 61.02 569.57
Mr. Shirish B. Mody 226.02 282.53 61.02 569.57
Mr. Bharat P. Mehta 110.07 110.07 29.71 249.85
Mr. Pranabh Mody 110.07 110.07 29.71 249.85
Mr. Kamlesh L. Udani 63.28 63.28 17.09 143.65
Notes:
1. All the above remuneration components are fixed in nature.2. The appointment of each executive director is for a period of five years from the respective date of appointment.3. The Company has entered into contract with each executive director setting out terms and conditions of appointment,
which contract can be terminated by either party by giving three months notice to the other. The contract so entered into does not provide for payment of severance fees.
STAKEHOLDERS RELATIONSHIP COMMITTEEThe Stakeholders Relationship Committee consists of Mr. Durga Dass Chopra, Chairman, Mr. Jyotindra B. Mody and Mr. Dinesh B. Mody. M. C. Mehta, Company Secretary & Vice President-Compliance is compliance officer and acts as Secretary to the Committee. The terms of reference include consideration and resolution of grievances of the security holders.
The information pertaining to number and dates of the meetings of the Stakeholders Relationship Committee held during 2016-17 indicating the number of meetings attended by each director is set out in Annexure G.
The complaints received from the investors are being regularly attended to and are believed to be resolved to their satisfaction. The status of the investors’ complaints is reviewed by the Stakeholders Relationship Committee generally on quarterly basis. During the year, the Company received 14 investor complaints all of which have been resolved before the end of the year, and believed to have been resolved to the satisfaction of the investors.
GENERAL BODY MEETINGSThe information relating to the location and time of last three annual general meetings and the special resolutions passed thereat is as under:
Year Location Date Time Whether any special resolution passed
13-14 Rama & Sundri Watumull Auditorium, K.C. College, Dinshaw Wacha Road, Churchgate, Mumbai – 400020
September 15, 2014
3.30 p.m. Yes. Four special resolutions passed.
14-15 August 19, 2015 3.30 p.m. Yes. Nine special resolutions passed.
15-16 August 23, 2016 3.30 p.m. No.
The Company has neither passed any special resolution through postal ballot during 2016-17 nor at present proposes to pass any special resolution through postal ballot during the current year.
CORPORATE GOVERNANCE REPORT (Contd.)

53
Corporate Overview Statutory Reports Standalone Financial Statement Consolidated Financial Statement01-13 14-68 69-123 124-179
MEANS OF COMMUNICATIONThe quarterly results are generally published in Business Standard and Sakal, and also displayed on the Company’s website www.jbcpl.com. The official news releases are also displayed on the Company’s website. During the year, the Company has not made any presentation to institutional investors or analysts.
GENERAL SHAREHOLDER INFORMATION
AGM: Date, Time and Venue September 19, 2017 at 3.30 p.m. at Rama & Sundri Watumull Auditorium, K.C. College, Dinshaw Wacha Road, Churchgate, Mumbai – 400 020.
Record Date (for electronically held shares) September 12, 2017
Date of Book Closure (for physically held shares) September 13, 2017 to September 19, 2017 (both days inclusive)
Financial year April to March
Dividend Payment Date September 22, 2017
Listing on Stock Exchanges -BSE Limited
Address: Phiroze Jeejebhoy Towers, Dalal Street, Mumbai 400 001.
-National Stock Exchange of India Limited Address: Exchange Plaza, Bandra Kurla Complex, Bandra (E), Mumbai 400 051.
The Company has paid the annual listing fees for the period 1st April, 2017 to 31st March, 2018 to both the Exchanges.
Stock Code BSE: 506943 NSE:JBCHEPHARM
Market Price Data Annexure A
Performance in comparison to BSE Sensex Annexure B
Registrar and Share Transfer Agents Datamatics Financial Services Ltd.
Plot No.B-5, Part B Cross Lane, MIDC, Marol, Andheri (E), Mumbai - 400 093.
Tel. No.: 022-6671 2001 - 06
Fax No.: 022-6671 2011
Email: [email protected]
Share Transfer System The power of share transfer is delegated by the Board to a committee of directors. The Share Transfer Committee meets regularly to consider and approve transfer of shares held in physical form.
Distribution of Shareholding as on 31-03-2017. Annexure C.
Shareholding pattern Annexure D.
Dematerialization of shares and liquidity Annexure E.
Outstanding GDR/ADR/Warrants or any convertible instruments, conversion date and impact on equity.
The Company has not issued any GDRs/ADRs/warrants or any other convertible instrument.
Commodity price risk and hedging activities The Company does not trade in commodities and therefore not applicable.
CORPORATE GOVERNANCE REPORT (Contd.)
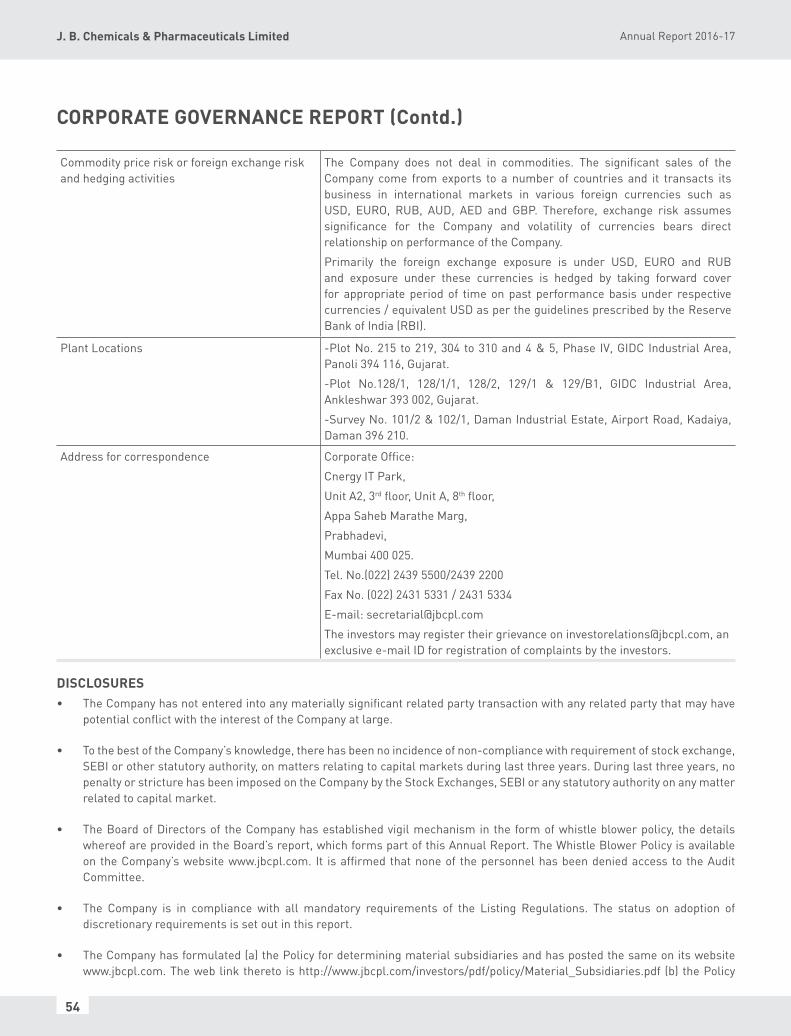
Annual Report 2016-17J. B. Chemicals & Pharmaceuticals Limited
54
Commodity price risk or foreign exchange risk and hedging activities
The Company does not deal in commodities. The significant sales of the Company come from exports to a number of countries and it transacts its business in international markets in various foreign currencies such as USD, EURO, RUB, AUD, AED and GBP. Therefore, exchange risk assumes significance for the Company and volatility of currencies bears direct relationship on performance of the Company.
Primarily the foreign exchange exposure is under USD, EURO and RUB and exposure under these currencies is hedged by taking forward cover for appropriate period of time on past performance basis under respective currencies / equivalent USD as per the guidelines prescribed by the Reserve Bank of India (RBI).
Plant Locations -Plot No. 215 to 219, 304 to 310 and 4 & 5, Phase IV, GIDC Industrial Area, Panoli 394 116, Gujarat.
-Plot No.128/1, 128/1/1, 128/2, 129/1 & 129/B1, GIDC Industrial Area, Ankleshwar 393 002, Gujarat.
-Survey No. 101/2 & 102/1, Daman Industrial Estate, Airport Road, Kadaiya, Daman 396 210.
Address for correspondence Corporate Office:
Cnergy IT Park,
Unit A2, 3rd floor, Unit A, 8th floor,
Appa Saheb Marathe Marg,
Prabhadevi,
Mumbai 400 025.
Tel. No.(022) 2439 5500/2439 2200
Fax No. (022) 2431 5331 / 2431 5334
E-mail: [email protected]
The investors may register their grievance on [email protected], an exclusive e-mail ID for registration of complaints by the investors.
DISCLOSURES• TheCompanyhasnotenteredintoanymateriallysignificantrelatedpartytransactionwithanyrelatedpartythatmayhave
potential conflict with the interest of the Company at large.
• TothebestoftheCompany’sknowledge,therehasbeennoincidenceofnon-compliancewithrequirementofstockexchange,SEBI or other statutory authority, on matters relating to capital markets during last three years. During last three years, no penalty or stricture has been imposed on the Company by the Stock Exchanges, SEBI or any statutory authority on any matter related to capital market.
• TheBoardofDirectorsof theCompanyhasestablishedvigilmechanismin the formofwhistleblowerpolicy, thedetailswhereof are provided in the Board’s report, which forms part of this Annual Report. The Whistle Blower Policy is available on the Company’s website www.jbcpl.com. It is affirmed that none of the personnel has been denied access to the Audit Committee.
• The Company is in compliance with all mandatory requirements of the Listing Regulations. The status on adoption ofdiscretionary requirements is set out in this report.
• TheCompanyhasformulated(a)thePolicyfordeterminingmaterialsubsidiariesandhaspostedthesameonitswebsitewww.jbcpl.com. The web link thereto is http://www.jbcpl.com/investors/pdf/policy/Material_Subsidiaries.pdf (b) the Policy
CORPORATE GOVERNANCE REPORT (Contd.)

55
Corporate Overview Statutory Reports Standalone Financial Statement Consolidated Financial Statement01-13 14-68 69-123 124-179
on dealing with Related Party Transactions and has posted the same on its website www.jbcpl.com. The web link thereto is http://www.jbcpl.com/investors/pdf/policy/Related_Party_Transactions.pdf
• TheCompanyisnotexposedtocommoditiespriceriskandhencecommodityhedgingactivitiesisnotundertaken.
CORPORATE GOVERNANCE COMPLIANCEThe Company has complied with all requirements of corporate governance report of sub-paras (2) and (10) of the Part C of Schedule V of the Listing Regulations. The Company has also submitted to the Exchanges periodical compliance reports on corporate governance within the prescribed period.
DISCRETIONARY REQUIREMENTThe extent of adoption of discretionary requirement set out in Part E of Schedule II of the Listing Regulations is as under :
• The Board: The Chairman of the Company is executive and hence the provision with regard to maintenance of chairman’s office as contained in the discretionary requirement is not relevant.
• Shareholders rights: The half-yearly financial results are published in the news papers as mentioned above as well as posted on the Company’s website. The significant news, if any, too are posted on the Company’s website. In view of this, the same are not separately sent to the shareholders.
• Modified opinion(s) in the audit report: The Company’s financial statement is with unmodified audit opinion.
• Separate posts of Chairman and CEO: The Company’s Articles of Association provides that the same individual may hold both these posts. This discretionary requirement will be considered by the Company at the appropriate time.
• Reporting of Internal Auditor: Internal auditor reports to both Audit Committee as well as the Board of Directors.
VIGIL MECHANISMThe Board of Directors has established vigil mechanism in the form of Whistle Blower Policy to enable directors, employee and other stakeholders to make written protected disclosures (as defined in the Policy) to the Chairman of the Redressal Committee constituted under the Policy for evaluation and investigation of such disclosure. The Policy provides for adequate safeguards against any kind of victimisation or unfair treatment of whistle blowers. The Policy also provides for access of whistle blower to the Chairman of the Audit Committee in appropriate or exceptional circumstances.
RELATED PARTY TRANSACTIONSThe Company has formulated a policy on materiality of related party transactions and on dealing with related party transactions. All related party contracts or arrangements have been entered into with prior approval of the Audit Committee and the Board of Directors. In case of omnibus approvals by the Audit Committee, the conditions mentioned in the Companies Act, 2013 and Listing Regulations have been complied with while granting omnibus approval. The related party transactions entered into by Company are at arm’s length and in ordinary course of business and none of them is material in nature.
SUBSIDIARY COMPANIESThe Company does not have unlisted material subsidiary incorporated in India. The Audit Committee reviews the financial statement of the subsidiary companies including the investments, if any, made by the subsidiary companies. The minutes of meetings of the board of directors of subsidiaries have been placed at the meeting of the Board of Directors of the Company.
SENIOR MANAGEMENTAll members of senior management submit letter of disclosure of interest to the Board relating to all material, financial and commercial transactions, where they have personal interest, if any, that may have a potential conflict with the interest of the Company at large.
CORPORATE GOVERNANCE REPORT (Contd.)

Annual Report 2016-17J. B. Chemicals & Pharmaceuticals Limited
56
QUARTERLY COMPLIANCE REPORT ON CORPORATE GOVERNANCEDuring the year 2016-17, the Company has submitted to the Exchanges quarterly compliance report on corporate governance within the prescribed time and have placed such report before the Board of Directors at the next meeting.
DIVIDEND DISTRIBUTION POLICYDividend Distribution Policy formulated by the Company pursuant to Clause 43A of the Listing Regulations is set out in Annexure-F.
DISCLOSURES ON WEBSITEThe Company has, inter alia, disseminated the following information on its website www.jbcpl.com:
(a) Terms and conditions of appointment of independent directors
(b) Composition of various Committees of the Board of Directors
(c) Code of Conduct for Board of Directors and Senior Management Personnel
(d) Details of establishment of vigil mechanism/Whistle Blower Policy
(e) Criteria for making payment to non-executive directors, which forms part of Remuneration policy
(f) Policy on dealing with related party transactions
(g) Policy for determining material subsidiary
(h) Details of familiarisation programme imparted to independent directors
(i) Dividend Distribution Policy
(j) Business Responsibility Policy
COMMITTEE MEETINGSThe information pertaining to number and dates of meetings of the Committees of the Board held during 2016-17 indicating the number of meetings attended by each director is set out in Annexure-G.
SHARES SUSPENSE ACCOUNTNo shares issued by the Company are unclaimed. Thus, no shares have been transferred to demat suspense account or unclaimed suspense account.
DECLARATION
I hereby declare that the directors and senior management personnel including all functional heads of the Company have affirmed compliance with the code of conduct, for the year ended on March 31, 2017.
For and on behalf of the Board of Directors
Place : Mumbai J. B. ModyDate : May 23, 2017 Chairman & Managing Director
CORPORATE GOVERNANCE REPORT (Contd.)

57
Corporate Overview Statutory Reports Standalone Financial Statement Consolidated Financial Statement01-13 14-68 69-123 124-179
ANNEXURE AThe high and low prices of the Company’s equity shares (of face value of ` 2 each) on BSE Limited (BSE) and on National Stock Exchange of India Limited (NSE) during each month in the financial year 2016-17 were as under:
Month BSE NSE
High (`)
Low (`)
Volume of shares traded
High (`)
Low (`)
Volume of shares traded
April, 2016 256.50 241.80 160,186 256.00 237.10 1,056,935May, 2016 266.50 242.80 219,104 266.35 242.75 1,261,020June, 2016 260.80 231.00 418,359 261.00 231.30 3,074,375July, 2016 276.40 248.10 298,535 276.50 248.00 1,673,558August, 2016 356.85 264.00 1,830,680 356.00 263.65 8,620,878September, 2016 396.00 313.00 1,332,747 396.20 313.00 5,732,194October, 2016 403.60 354.00 411,958 403.90 356.00 2,313,412November, 2016 397.40 308.00 318,495 399.00 305.00 1,951,962December, 2016 356.10 319.00 127,886 357.60 319.75 1,210,010January, 2017 361.00 337.00 83,281 360.95 336.00 1,855,382February, 2017 367.65 325.00 582,929 367.95 324.00 1,728,409March, 2017 353.00 315.10 277,470 353.95 314.20 1,011,329
ANNEXURE B
CORPORATE GOVERNANCE REPORT (Contd.)

Annual Report 2016-17J. B. Chemicals & Pharmaceuticals Limited
58
ANNEXURE CDistribution of shareholding as on March 31, 2017 is as under.
Range of equity shares held No. of shareholders % of shareholders No. of equity shares held
% of capital
Upto 500 26,172 79.31 3,731,465 4.40501 – 1000 2,947 8.93 2,361,528 2.781001 – 2000 2,016 6.11 3,148,367 3.712001 – 3000 851 2.58 2,201,366 2.603001 – 4000 290 0.88 1,047,768 1.244001 – 5000 185 0.56 862,568 1.025001 – 10000 281 0.85 2,001,852 2.3610001 – 50000 187 0.57 3,814,420 4.5050001 and above 71 0.22 65,650,641 77.40Total 33,000 100.00 84,819,975 100.00
ANNEXURE DShareholding pattern as on March 31, 2017 is as under.
Category No. of shares % holdingPromoters & Promoter Group 47,298,137 55.76Other directors & their relatives 403,395 0.48Mutual Funds, Banks & Insurance Companies 8,019,357 9.46Foreign Portfolio Investors 4,635,084 5.46Clearing Member 28,371 0.03Bodies Corporate 1,194,108 1.40Individuals 23,241,523 27.41Total 84,819,975 100.00
ANNEXURE EThe position as to dematerialization of shares as on March 31, 2017 is as under:
Category No. of shares % of shares No. of Shareholders % of Shareholders
Electronic Form 83,405,339 98.33 31,737 96.17
Physical Form 1,414,636 1.67 1,263 3.83
Total 84,819,975 100 33,000 100.00
The information as to liquidity of shares (i.e. number of shares traded) is provided in Annexure–A above.
ANNEXURE FDividend Distribution Policy
1. Preamble and Objective:
SEBI (Listing Obligations and Disclosure Requirements) Regulations, 2015, as amended, (“Regulations”) requires top 500 listed companies (by market capitalisation) to formulate a dividend distribution policy including certain specified parameters as well as disclose the same in annual report and on its website.
J.B. Chemicals & Pharmaceuticals Limited (“Company”) has, in past, regularly paid dividends and this Policy reflects intent of the Company to continue to reward shareholders by sharing a portion of its profit after retaining sufficient cash for its growth. The objective of this Policy is to set out the broad frame work that the Board of Directors of the Company shall keep
CORPORATE GOVERNANCE REPORT (Contd.)

59
Corporate Overview Statutory Reports Standalone Financial Statement Consolidated Financial Statement01-13 14-68 69-123 124-179
in view before declaring a dividend. The Board of Directors shall declare or recommend a dividend in compliance with the provisions of the Companies Act, 2013, Rules made there under, other applicable legal provisions and this Policy. The decision to pay dividend and quantum thereof is at discretion of the Board of Directors and this policy does not aim to substitute the discretion and decision making of the Board of Directors.
2. Dividend Pay out:
Dividend for any financial year will be declared out of profit after tax of the Company. Unrealised gains and such other item of income as the Board considers appropriate will not be considered for the purpose of declaration or recommendation of dividend.
Keeping in view the provisions of this Policy, the Board will endeavour to achieve dividend payout (including dividend distribution tax) in the range of 10% to 30% of profit after tax after considering the long term plans and other parameters/factors stated hereunder. However, the actual quantum of dividend pay-out may vary in any financial year on account of financial/internal and external parameters specified hereunder.
3. Financial Parameters/Internal factors:
The Board of Directors will consider all relevant financial parameters/internal factors, including but not limited to the following before recommending or declaring any dividend for any financial year as such parameters/factors has direct bearing on dividend distribution decision.
1. Existing and expected operational/financial performance;
2. Profit available for distribution;
3. Availability of free cash;
4. Stability of earnings;
5. Liquidity position;
6. Working capital requirement;
7. Capital expenditure requirement;
8. Cash required to repay debt;
9. Buy-back of shares or any other measure involving return of cash to shareholders;
4. External Factors:
The Board of Directors will consider relevant external factors, including but not limited to the following before recommending or declaring any dividend for any financial year as such factors influence dividend distribution decisions as well as future earnings.
1. Macro-economic conditions; national and international;
2. Industry outlook;
3. Overall economic and regulatory environment;
4. Impact of currencies;
5. Capital market condition;
6. Statutory provisions;
7. Dividend payout followed by similar sized companies in the same industry;
As such, the actual dividend payout may vary in a given year depending on the above stated or similar parameters/factors.
5. Circumstances under which the shareholders of the Company may or may not expect dividend:
The Shareholders may expect dividend in a financial year when the Company has earned sufficient profit after tax. However, the shareholders may not expect dividend when the Board believes (a) that resources need to be conserved for the business of the Company or (b) the available cash is proposed to be used for any purpose set out in 3 above or (c) there are no profit or inadequate profit in any year.
CORPORATE GOVERNANCE REPORT (Contd.)

Annual Report 2016-17J. B. Chemicals & Pharmaceuticals Limited
60
6. Interim Dividend/Special Dividend:
The Board may declare interim dividend/Special one-time dividend if they so deem fit in case of availability of distributable surplus, profits during the year, any exceptional gain accruing to the Company or otherwise keeping in view parameters/factors mentioned above.
7. Utilisation of retained earnings:
The retained earnings will be used, inter alia, for pursuing Company’s growth plans, meeting working capital requirement, making long-term investments, meeting contingencies, issue of bonus shares, buy-back of shares and every other purpose permitted by or under law. Further, retained earnings may also be utilised as a part of overall scheme of any merger, acquisition or any other form of restructuring.
Subject to provisions of the Companies Act and the Rules made there under, the free reserves may also be utilised for payment of dividend in the year or no profit or inadequate profit.
8. Parameters with regard to other classes of shares:
The share capital of the Company currently comprises of only equity shares. All aspects of this Policy accordingly apply to equity shares. In case of issue of other class of shares, the Board shall appropriately modify this Policy.
9. Disclosure:
As required under the Regulations, this Policy shall be disclosed in the Company’s annual report and on its website www.jbcpl.com.
10. Miscellaneous:
a) The Board may revise, modify or alter this Policy from time to time if they deem fit or necessary. Such revised Policy shall be disclosed as mentioned above.
b) In case of any doubt arising out of this Policy, clarification provided or decision taken by the Board of the Company shall be final and binding.
c) This Policy does not intend to give or shall not be taken as giving assurance of any guaranteed returns on equity shares of the Company.
ANNEXURE GNumber and dates of meetings of the Committees of the Board held during 2016-17 indicating the number of meetings attended by each director
I. AUDIT COMMITTEE
Four meetings of the Audit Committee were held during the year ended on March 31, 2017. These meetings were held on May 23, 2016, August 26, 2016, November 18, 2016 and February 10, 2017. The information with regard to attendance of the members is as under:
Name Position held Category No. of meetings attended
Mr. Durga Dass Chopra Chairman Non-executive & independent director 4
Mr. Dinesh B. Mody Member Executive director (Promoter) 4
Dr. Satyanarain Agarwala Member Non-executive & independent director 4
Ms. Krupa R. Gandhi Member Non–executive & independent director 4
Dr. Niranjan N. Maniar (up to 22/11/2016)
Member Non-executive & independent director 3
CORPORATE GOVERNANCE REPORT (Contd.)

61
Corporate Overview Statutory Reports Standalone Financial Statement Consolidated Financial Statement01-13 14-68 69-123 124-179
II. NOMINATION AND REMUNERATION COMMITTEE
Two meetings of Nomination and Remuneration Committee were held during the year on May 18, 2016 and October 18, 2016. The information with regard to attendance of the members is as under:
Name Position held Category No. of meetings attended
Dr. Satyanarain Agarwala Chairman Non-executive & independent director 2
Mr. Rajiv C. Mody Member Non-executive & independent director 1
Mr. Devang Shah Member Non-executive & independent director 2
III. STAKEHOLDERS RELATIONSHIP COMMITTEE
Four meetings of the Stakeholders Relationship Committee were held during the year on May 19, 2016, August 25, 2016, November 17, 2016 and February 9, 2017. The information with regard to attendance of the members is as under:
Name Position held Category No. of meetings attended
Mr. Durga Dass Chopra Chairman Non-executive & independent director 4
Mr. Jyotindra B. Mody Member Executive director (Promoter) 4
Mr. Dinesh B. Mody Member Executive director (Promoter) 4
IV. CORPORATE SOCIAL RESPONSIBILITY COMMITTEE
Two meetings of Corporate Social Responsibility Committee were held during the year on May 18, 2016 and February 10, 2017. The information with regard to attendance of the members is as under:
Name Position held Category No. of meetings attended
Dr. Satyanarain Agarwala Chairman Non-executive & independent director 2
Mr. Bharat P. Mehta Member Executive (Promoter Group) 2
Mr. Pranabh Mody Member Executive (Promoter Group) 2
V. SHARE TRANSFER COMMITTEE
16 meetings of Share Transfer Committee were held during the year on April 12, 2016, April 27, 2016, May 12, 2016, June 26, 2016, July 29, 2016, August 4, 2016, August 17, 2016, October 4, 2016, October 12, 2016, November 22, 2016, December 9, 2016, January 4, 2017, January 11, 2017, January 25, 2017, February 17, 2017 and February 28, 2017. The information with regard to attendance of the members is as under:
Name Position held Category No. of meetings attended
Mr. Shirish B. Mody Member Executive director (Promoter) 16
Mr. Bharat P. Mehta Member Executive (Promoter Group) 16
VI. INVESTMENT COMMITTEE
14 meetings of Investment Committee were held during the year on April 11, 2016, May 9, 2016, June 6, 2016, June 24, 2016, July 22, 2016, August 12, 2016, September 5, 2016, September 27, 2016, October 27, 2016, November 15, 2016, December 14, 2016, January 10, 2017, January 30, 2017 and February 27, 2017. The information with regard to attendance of the members is as under:
Name Position held Category No. of meetings attended
Mr. Jyotindra B. Mody Member Executive director (Promoter) 14
Mr. Dinesh B. Mody Member Executive director (Promoter) 14
Mr. Shirish B. Mody Member Executive director (Promoter) 14
CORPORATE GOVERNANCE REPORT (Contd.)
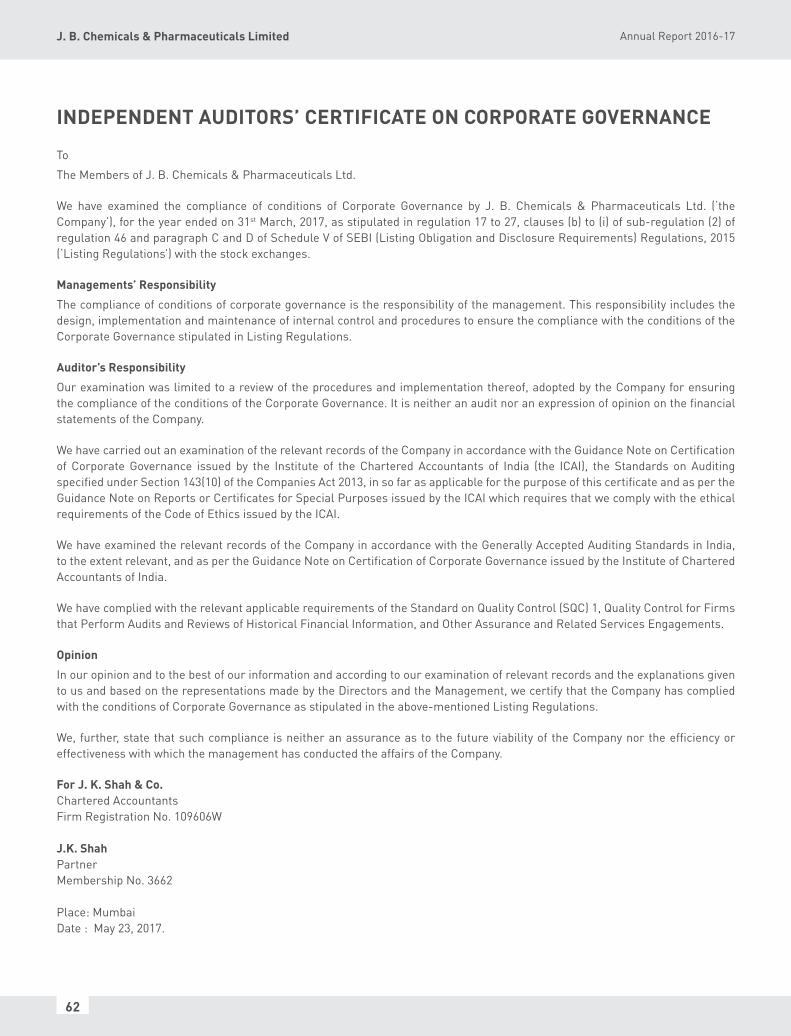
Annual Report 2016-17J. B. Chemicals & Pharmaceuticals Limited
62
To
The Members of J. B. Chemicals & Pharmaceuticals Ltd.
We have examined the compliance of conditions of Corporate Governance by J. B. Chemicals & Pharmaceuticals Ltd. (‘the Company’), for the year ended on 31st March, 2017, as stipulated in regulation 17 to 27, clauses (b) to (i) of sub-regulation (2) of regulation 46 and paragraph C and D of Schedule V of SEBI (Listing Obligation and Disclosure Requirements) Regulations, 2015 (‘Listing Regulations’) with the stock exchanges.
Managements’ Responsibility
The compliance of conditions of corporate governance is the responsibility of the management. This responsibility includes the design, implementation and maintenance of internal control and procedures to ensure the compliance with the conditions of the Corporate Governance stipulated in Listing Regulations.
Auditor’s Responsibility
Our examination was limited to a review of the procedures and implementation thereof, adopted by the Company for ensuring the compliance of the conditions of the Corporate Governance. It is neither an audit nor an expression of opinion on the financial statements of the Company.
We have carried out an examination of the relevant records of the Company in accordance with the Guidance Note on Certification of Corporate Governance issued by the Institute of the Chartered Accountants of India (the ICAI), the Standards on Auditing specified under Section 143(10) of the Companies Act 2013, in so far as applicable for the purpose of this certificate and as per the Guidance Note on Reports or Certificates for Special Purposes issued by the ICAI which requires that we comply with the ethical requirements of the Code of Ethics issued by the ICAI.
We have examined the relevant records of the Company in accordance with the Generally Accepted Auditing Standards in India, to the extent relevant, and as per the Guidance Note on Certification of Corporate Governance issued by the Institute of Chartered Accountants of India.
We have complied with the relevant applicable requirements of the Standard on Quality Control (SQC) 1, Quality Control for Firms that Perform Audits and Reviews of Historical Financial Information, and Other Assurance and Related Services Engagements.
Opinion
In our opinion and to the best of our information and according to our examination of relevant records and the explanations given to us and based on the representations made by the Directors and the Management, we certify that the Company has complied with the conditions of Corporate Governance as stipulated in the above-mentioned Listing Regulations.
We, further, state that such compliance is neither an assurance as to the future viability of the Company nor the efficiency or effectiveness with which the management has conducted the affairs of the Company.
For J. K. Shah & Co.Chartered AccountantsFirm Registration No. 109606W
J.K. ShahPartnerMembership No. 3662
Place: MumbaiDate : May 23, 2017.
INDEPENDENT AUDITORS’ CERTIFICATE ON CORPORATE GOVERNANCE

63
Corporate Overview Statutory Reports Standalone Financial Statement Consolidated Financial Statement01-13 14-68 69-123 124-179
BUSINESS RESPONSIBILITY REPORT
The following is the Business Responsibility Report pursuant to Regulation 34(2) of the Securities and Exchange Board of India (Listing Obligations and Disclosure Requirements) Regulations, 2015 (“Regulations”).
Section A: General information about the Company
1. Corporate Identity Number (CIN) of the Company L24390MH1976PLC019380
2. Name of the Company J .B. Chemicals & Pharmaceuticals Ltd.
3. Registered address Neelam Centre, ‘B’ Wing, 4th Floor, Hind Cycle Road, Worli, Mumbai - 400 030.
4. Website www.jbcpl.com
5. E-mail id [email protected]
6. Financial Year reported April 1, 2016 to March 31, 2017
7. Sector(s) that the Company is engaged in (industrial activity code-wise)
Pharmaceuticals
8. List three key products that the Company manufactures (as in balance sheet)
Ranitidine, Cilnidipine and Metronidazole.
9. Total number of locations where business activity is undertaken by the Company
(a) Number of International Locations (Provide details of major 5)
The Company has representative office in Russia and Ukraine. Excepting this, the Company does not have its own location outside India.
(b) Number of National Locations Nine manufacturing facilities across Ankleshwar, Panoli and Daman, 27 distribution locations across the country, one area office in Delhi and Kolkata, R & D Centre at Thane (Maharashtra) and a Registered and Corporate office at Mumbai.
10. Markets served by the Company India and over 50 countries across Asia and South East Asia, Gulf & Middle East, USA, EU, Canada, Australia, New Zealand, Latin & Central America, Africa & South Africa and Russia-CIS.
Section B: Financial details of the Company
1. Paid up Capital (INR) ` 1,696.40 lakhs
2. Total Turnover (INR) ` 1,167,44.55 lakhs
3. Total profit after taxes (INR) ` 17,296.46 lakhs
4. Total Spending on Corporate Social Responsibility (CSR) as percentage of profit after tax (%)
The Company’s total spending on CSR during FY 2016-17 was1.55% of the profit after tax for the year.
5. List of activities in which expenditure in 4 above has been incurred
(i) Promoting health care including preventive healthcare
(ii) Promotion of education, and (iii) Eradication of poverty.Please refer Annexure E to the Directors Report for details.
Section C: Other details
1. Does the Company have any Subsidiary Companies? Yes.
2. Do the Subsidiary Companies participate in the BR Initiatives of the parent company?
No.
3. Do any other entity (e.g. suppliers, distributors etc.) that the Company does business with, participate in the BR initiatives of the Company?
No.

Annual Report 2016-17J. B. Chemicals & Pharmaceuticals Limited
64
BUSINESS RESPONSIBILITY REPORT (Contd.)
SECTION D: BR Information
1 Details of Director responsible for BR
(a) Details of the Director responsible for implementation of the BR policies
1. DIN Number: 00036215
2. Name : Kamlesh L. Udani
3. Designation : Executive Director (Technical & Production)
(b) Details of the BR head
No. Particulars Details
1 DIN Number Not applicable
2 Name Mayur C. Mehta
3 Designation Company Secretary & Vice President-Compliance
4 Telephone number (022) 2439 5200 / 5500
5 e-mail id [email protected]
2 Principle-wise (as per NVGs) BR Policy/policies
(a) Details of compliance (Reply in Yes/No)
No. Questions P1 P2 P3 P4 P5 P6 P7 P8 P9
1 Do you have a policy/policies for: Y Y Y Y Y Y Y Y Y
2 Has the policy being formulated in consultation with the relevant stakeholders?
Y Y Y Y Y Y Y Y Y
3 Does the policy conform to any national/ international standards? If yes, specify? (50 words)
The Company has formulated Code of conduct and anti-bribery policy which meet industry standards. BR Policy conform to principles laid down in NVG on Social, Environmental and Economic Responsibilities of Business.
4 Has the policy been approved by the Board? If yes, has it been signed by MD/owner/ CEO/appropriate Board Director?
Yes. It is signed by the Chairman& Managing Director.
5 Does the company have a specified committee of the Board/ Director/ Official to oversee the implementation of the policy?
Y Y Y Y Y Y Y Y Y
6 Indicate the link for the policy to be viewed online?
http
://w
ww
.jbcp
l.co
m/i
nves
tors
/pd
f/co
de/c
ode_
of_c
ondu
ct_f
or_
dire
ctor
s.pd
fht
tp:/
/ww
w.jb
cpl.
com
/inv
esto
rs/
pdf/
polic
y/An
ti_B
ribe
ry_P
olic
y.pd
f
http
://w
ww
.jbcp
l.co
m/i
nves
tors
/p
df/
po
lic
y/B
us
ine
ss
_R
es
_Po
licy0
001.
7 Has the policy been formally communicated to all relevant internal and external stakeholders?
Y Y Y Y Y Y Y Y Y

65
Corporate Overview Statutory Reports Standalone Financial Statement Consolidated Financial Statement01-13 14-68 69-123 124-179
BUSINESS RESPONSIBILITY REPORT (Contd.)
SECTION E: PRINCIPLE-WISE PERFORMANCE
Principle 1: Ethics, Transparency and accountability
1. Does the policy relating to ethics, bribery and corruption cover only the company? Does it extend to the Group/Joint Ventures/Suppliers/Contractors/NGOs/Others?
Yes. The policy relating to ethics, bribery and corruption cover only the Company. It does not extend to the Group/Joint Ventures/Suppliers/Contractors/NGOs/Others.
2. How many stakeholder complaints have been received in the past financial year and what percentage was satisfactorily resolved by the management? If so, provide details thereof, in about 50 words or so.
The Company did not receive any complaint from any stakeholder.
Principle 2: Product safety and sustainability
1. List up to 3 of your products or services whose design has incorporated social or environmental concerns, risks and/or opportunities.
Being in pharmaceutical business, the products are manufactured as per pharmacopoeial standard. Hence, this question does not have direct relevance to nature of products manufactured by the Company. However, the Company complies with prescribed terms and conditions during the course of treatment and discharge of effluents.
2.
The Company’s API manufacturing facility is zero water discharge facility.
Does the company have procedures in place for sustainable sourcing (including transportation)? If yes, what percentage of your inputs was sourced sustainably? Also, provide details thereof, in about 50 words or so.
The Company has a well established procedure of Vendor Development. The vendors facilities and documentations are audited before being included in the approved vendor list. The Quality Assurance teams audit all key vendors every 2 years. The Company also has approved vendors for transportation of goods. There is a process of identifying and developing alternate vendors for critical materials sourced from single vendor.
3. Has the company taken any steps to procure goods and services from local & small producers, including communities surrounding their place of work? If yes, what steps have been taken to improve their capacity and capability of local and small vendors?
Currently, 70% of the Company’s procurement is from local and small vendors and 30% from International vendors. The vendors are made aware of best practices during the audits and necessary guidance is given to enable them to upgrade their manufacturing process capabilities.
No. Questions P1 P2 P3 P4 P5 P6 P7 P8 P9
8 Does the company have in-house structure to implement the policies.
Y Y Y Y Y Y Y Y Y
9 Does the Company have a grievance redressal mechanism related to the policy/policies to address stakeholders’ grievances related to the policy/policies?
Y Y Y Y Y Y Y Y Y
10 Has the company carried out independent audit/ evaluation of the working of this policy by an internal or external agency?
No. However, working of the policies is monitored by the functional heads. Formal evaluation will be carried out when deemed appropriate.
3 Governance related to BR
(a) Indicate the frequency with which the Board of Directors, Committee of the Board or CEO assess the BR performance of the Company. Within 3 months, 3-6 months, Annually, More than 1 year
This will be an annual process.
(b) Does the Company publish a BR or a Sustainability Report? What is the hyperlink for viewing this report? How frequently it is published?
This BR report will be published annually as per the Regulations. This report is available at http://www.jbcpl.com/investors/pdf/policy/Business Responsibility Report.pdf

Annual Report 2016-17J. B. Chemicals & Pharmaceuticals Limited
66
BUSINESS RESPONSIBILITY REPORT (Contd.)
4. Does the company have a mechanism to recycle products and waste? If yes what is the percentage of recycling of products and waste (separately as <5%, 5-10%, >10%). Also, provide details thereof, in about 50 words or so.
Being in pharmaceutical business, recycling of products is not permitted. Waste water generated at manufacturing facilities is re-used in cooling towers and boilers after effluent treatment. The Company disposes of other wastes generated in API manufacturing process, as per GPCB approval except one solvent viz. ethoxy ethanol, which is recycled and used in manufacturing process, which is 5-10% of total waste generated in API manufacturing process. Further, hazardous waste having calorific value is sent for co-processing to cement kilns and the same is used in place of fossil fuel in cement industry.
Principle 3: Employee well-being
1. Please indicate the total number of employees.
4,794
2. Please indicate the total number of employees hired on temporary/contractual/casual basis.
1,288
3. Please indicate the number of permanent women employees.
441
4. Please indicate the number of permanent employees with disabilities.
8
5. Do you have an employee association that is recognized by management.
The Company does not have employee association.
6. What percentage of your permanent employees is members of this recognized employee association?
Not applicable
7. Please indicate the Number of complaints relating to child labour, forced labour, involuntary labour, sexual
harassment in the last financial year and pending, as on the end of the financial year.
No. Category No.of complaints filed during
the year
No.of complaints pending as
on end of the financial year
1. Child labour/forced labour/involuntary labour
Nil Not applicable
2. Sexual harassment
Nil Not applicable
3. Discriminatory employment
Nil Not applicable
8. What percentage of your under mentioned employees were given safety & skill up-gradation training in the last year?
(a) Permanent Employees (b) Permanent Women Employees (c) Casual/Temporary/Contractual Employees (d) Employees with Disabilities
100%100%100%100%
Principle 4: Stakeholder Engagement
1. Has the company mapped its internal and external stakeholders? Yes/No
Yes.
2. Out of the above, has the company identified the disadvantaged, vulnerable & marginalized stakeholders.
No.
3. Are there any special initiatives taken by the company to engage with the disadvantaged, vulnerable and marginalized stakeholders. If so, provide details thereof, in about 50 words or so.
The Company has not identified any stakeholder as disadvantaged, vulnerable and marginalized stakeholders.
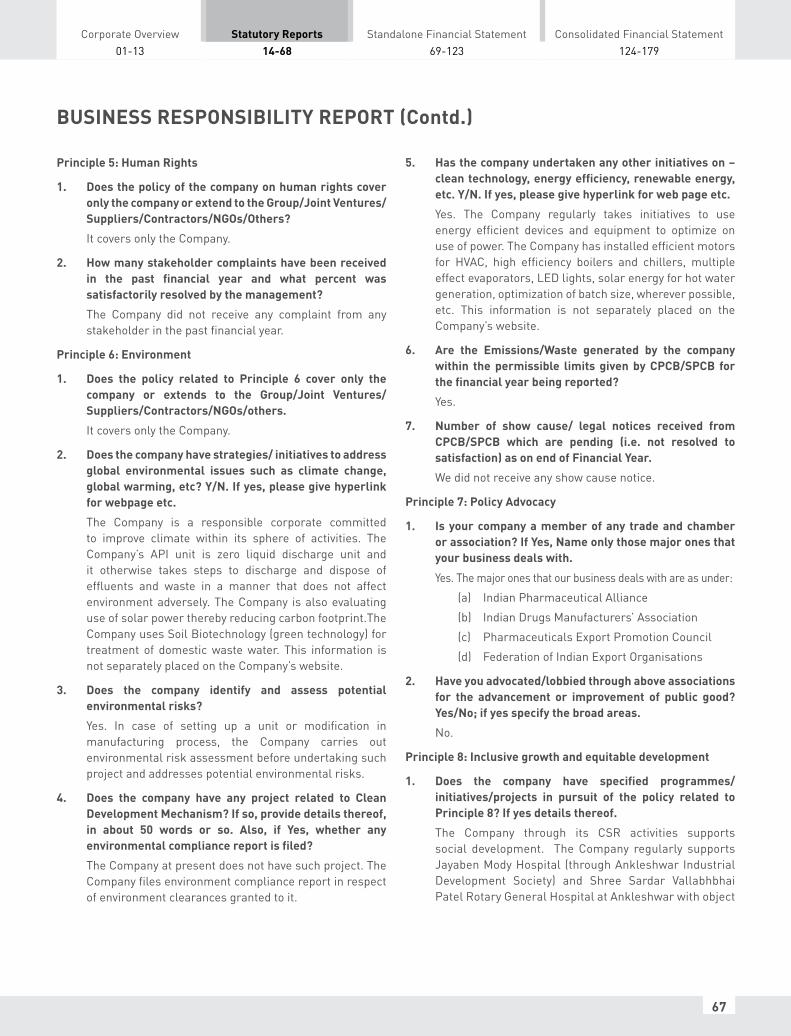
67
Corporate Overview Statutory Reports Standalone Financial Statement Consolidated Financial Statement01-13 14-68 69-123 124-179
BUSINESS RESPONSIBILITY REPORT (Contd.)
Principle 5: Human Rights
1. Does the policy of the company on human rights cover only the company or extend to the Group/Joint Ventures/Suppliers/Contractors/NGOs/Others?
It covers only the Company.
2. How many stakeholder complaints have been received in the past financial year and what percent was satisfactorily resolved by the management?
The Company did not receive any complaint from any stakeholder in the past financial year.
Principle 6: Environment
1. Does the policy related to Principle 6 cover only the company or extends to the Group/Joint Ventures/Suppliers/Contractors/NGOs/others.
It covers only the Company.
2. Does the company have strategies/ initiatives to address global environmental issues such as climate change, global warming, etc? Y/N. If yes, please give hyperlink for webpage etc.
The Company is a responsible corporate committed to improve climate within its sphere of activities. The Company’s API unit is zero liquid discharge unit and it otherwise takes steps to discharge and dispose of effluents and waste in a manner that does not affect environment adversely. The Company is also evaluating use of solar power thereby reducing carbon footprint.The Company uses Soil Biotechnology (green technology) for treatment of domestic waste water. This information is not separately placed on the Company’s website.
3. Does the company identify and assess potential environmental risks?
Yes. In case of setting up a unit or modification in manufacturing process, the Company carries out environmental risk assessment before undertaking such project and addresses potential environmental risks.
4. Does the company have any project related to Clean Development Mechanism? If so, provide details thereof, in about 50 words or so. Also, if Yes, whether any environmental compliance report is filed?
The Company at present does not have such project. The Company files environment compliance report in respect of environment clearances granted to it.
5. Has the company undertaken any other initiatives on – clean technology, energy efficiency, renewable energy, etc. Y/N. If yes, please give hyperlink for web page etc.
Yes. The Company regularly takes initiatives to use energy efficient devices and equipment to optimize on use of power. The Company has installed efficient motors for HVAC, high efficiency boilers and chillers, multiple effect evaporators, LED lights, solar energy for hot water generation, optimization of batch size, wherever possible, etc. This information is not separately placed on the Company’s website.
6. Are the Emissions/Waste generated by the company within the permissible limits given by CPCB/SPCB for the financial year being reported?
Yes.
7. Number of show cause/ legal notices received from CPCB/SPCB which are pending (i.e. not resolved to satisfaction) as on end of Financial Year.
We did not receive any show cause notice.
Principle 7: Policy Advocacy
1. Is your company a member of any trade and chamber or association? If Yes, Name only those major ones that your business deals with.
Yes. The major ones that our business deals with are as under:
(a) Indian Pharmaceutical Alliance
(b) Indian Drugs Manufacturers’ Association
(c) Pharmaceuticals Export Promotion Council
(d) Federation of Indian Export Organisations
2. Have you advocated/lobbied through above associations for the advancement or improvement of public good? Yes/No; if yes specify the broad areas.
No.
Principle 8: Inclusive growth and equitable development
1. Does the company have specified programmes/initiatives/projects in pursuit of the policy related to Principle 8? If yes details thereof.
The Company through its CSR activities supports social development. The Company regularly supports Jayaben Mody Hospital (through Ankleshwar Industrial Development Society) and Shree Sardar Vallabhbhai Patel Rotary General Hospital at Ankleshwar with object

Annual Report 2016-17J. B. Chemicals & Pharmaceuticals Limited
68
BUSINESS RESPONSIBILITY REPORT (Contd.)
2.
to make medical facility available to unprivileged and needy local community. Besides this, the Company also contributes to activities/projects in the area of education.
Are the programmes/projects undertaken through in-house team/own foundation/external NGO/government structures/any other organization?
The projects are undertaken through contribution to NGOs.
3. Have you done any impact assessment of your initiative?
In respect of contributions made to hospitals, we carry out assessment of number of patients availing the services and also the services that are required by them. This helps to upgrade the facilities.
4. What is your company’s direct contribution to community development projects- Amount in INR and the details of the projects undertaken.
The Company’s contribution to community development project is through CSR activities undertaken every year. During 2016-17, the Company spent `265.23 lakhs on such activities. Please refer to Annexure-E to Directors’ report for details of the projects / activities undertaken during 2016-17.
5. Have you taken steps to ensure that this community development initiative is successfully adopted by the community? Please explain in 50 words, or so.
Such steps are taken keeping in view the nature of community development measure. For project such as re-instatement of school dropout children or medical care of children with neurological care, their parents are also made part of discussion to ensure their commitment.
Principle 9: Customer value
1. What percentage of customer complaints/consumer cases are pending as on the end of financial year.
No customer complaints/consumer cases are pending as on the end of financial year.
2. Does the company display product information on the product label, over and above what is mandated as per local laws? Yes/No/N.A. /Remarks (additional information)
Yes. The Company provides information such as
(a) indication of the dosage in terms of the units of the dosage forms [for all solid dosage form other than prescription drugs). (b) direction for use of the drug, and (c) cautionary statement (in case of large-volume injections) not to use the injection if drug is not clear or the bottle or container containing it is found damaged or leaking.
3. Is there any case filed by any stakeholder against the company regarding unfair trade practices, irresponsible advertising and/or anti-competitive behaviour during the last five years and pending as on end of financial year. If so, provide details thereof, in about 50 words or so.
No.
4. Did your company carry out any consumer survey/consumer satisfaction trends?
No

69
Corporate Overview Statutory Reports Standalone Financial Statement Consolidated Financial Statement01-13 14-68 69-123 124-179
INDEPENDENT AUDITORS’ REPORT
To The Members of J. B. Chemicals & Pharmaceuticals Limited
Report on the Standalone Ind AS Financial Statements
We have audited the accompanying standalone Ind AS financial statements of J B Chemicals & Pharmaceuticals Limited (“the Company”), which comprise the Balance Sheet as at 31st March, 2017, the Statement of Profit and Loss (including other comprehensive Income), the Statement of Cash Flows and the Statement of Changes in Equity for the year then ended, and a summary of the significant accounting policies and other explanatory information (herein after referred to as ‘standalone Ind AS financial statements’).
Management’s Responsibility for the Standalone Financial Statements
The Company’s Board of Directors is responsible for the matters stated in Section 134(5) of the Companies Act, 2013 (“the Act”) with respect to the preparation of these standalone Ind AS financial statements that give a true and fair view of the financial position, financial performance including other comprehensive income, cash flows and changes in equity of the Company in accordance with the accounting principles generally accepted in India, including the Indian Accounting Standards (Ind AS) prescribed under section 133 of the Act read with relevant rules issued thereunder.
This responsibility also includes maintenance of adequate accounting records in accordance with the provisions of the Act for safeguarding the assets of the Company and for preventing and detecting frauds and other irregularities; selection and application of appropriate accounting policies; making judgments and estimates that are reasonable and prudent; and design, implementation and maintenance of adequate internal financial controls, that were operating effectively for ensuring the accuracy and completeness of the accounting records, relevant to the preparation and presentation of the standalone Ind AS financial statements that give a true and fair view and are free from material misstatement, whether due to fraud or error.
Auditor’s Responsibility
Our responsibility is to express an opinion on these standalone Ind AS financial statements based on our audit.
We have taken into account the provisions of the Act, the accounting and auditing standards and matters which are required to be included in the audit report under the provisions of the Act and the rules made thereunder.
We conducted our audit of the standalone Ind AS financial statements in accordance with the Standards on Auditing specified under Section 143(10) of the Act. Those Standards require that we comply with ethical requirements and plan and
perform the audit to obtain reasonable assurance about whether the standalone Ind AS financial statements are free from material misstatement.
An audit involves performing procedures to obtain audit evidence about the amounts and the disclosures in the standalone Ind AS financial statements. The procedures selected depend on the auditor’s judgment, including the assessment of the risks of material misstatement of the standalone Ind AS financial statements, whether due to fraud or error. In making those risk assessments, the auditor considers internal financial control relevant to the Company’s preparation of the standalone Ind AS financial statements that give a true and fair view in order to design audit procedures that are appropriate in the circumstances. An audit also includes evaluating the appropriateness of the accounting policies used and the reasonableness of the accounting estimates made by the Company’s Directors, as well as evaluating the overall presentation of the standalone Ind AS financial statements.
We believe that the audit evidence we have obtained is sufficient and appropriate to provide a basis for our audit opinion on the standalone Ind AS financial statements.
Opinion
In our opinion and to the best of our information and according to the explanations given to us, the aforesaid standalone Ind AS financial statements give the information required by the Act in the manner so required and give a true and fair view in conformity with the accounting principles generally accepted in India including the Ind AS, of the financial position of the Company as at 31st March, 2017, and its financial performance including other comprehensive income, its cash flows and the changes in equity for the year ended on that date.
Report on Other Legal and Regulatory Requirements
1. As required by the Companies (Auditor’s Report) Order, 2016 (“the Order”) issued by the Central Government in terms of Section 143(11) of the Act, we give in “Annexure A” a statement on the matters specified in paragraphs 3 and 4 of the Order.
2. As required by Section 143(3) of the Act, we report that:
a) We have sought and obtained all the information and explanations which to the best of our knowledge and belief were necessary for the purposes of our audit;
b) In our opinion, proper books of account as required by law have been kept by the Company so far as it appears from our examination of those books;

70
Annual Report 2016-17J. B. Chemicals & Pharmaceuticals Limited
INDEPENDENT AUDITORS’ REPORT (Contd.)
ANNEXURE - A TO THE AUDITORS’ REPORT
The Annexure referred to in Independent Auditors’ Report to the members of the Company on the standalone financial statements for the year ended 31 March 2017, we report that:
(i) a) The Company has maintained proper records showing full particulars, including quantitative details and situation of fixed assets.
b) These fixed assets have been physically verified by the management at regular interval considering the size of the Company and nature of assets. No material discrepancies have been noticed on such verification.
c) According to the information and explanations given to us and on the basis of our examination of the records of the Company, the title deeds of immovable properties held by the Company are in the name of the Company.
(ii) As explained to us, the inventories have been physically verified by the management at reasonable intervals during the year. According to the information and explanations given to us and on the basis of our examination of the records of the Company, the discrepancies noticed on physical verification between physical stock and the book records were not material and have been adequately dealt with in the books of account.
(iii) The Company has not granted loans to the companies, firms, Limited Liability Partnerships or other parties covered in the register maintained under section 189 of the Companies Act, 2013 (‘the Act’).
(iv) In our opinion and according to the information and explanations given to us, the Company has complied with the provisions of section 185 and 186 of the Act, with respect to the investments made and guarantees given.
c) The balance sheet, the statement of profit and loss, the statement of Cash Flows Statement and the statement of changes in equity dealt with by this Report are in agreement with the books of account;
d) In our opinion, the aforesaid standalone Ind AS financial statements comply with the Indian Accounting Standards prescribed under section 133 of the Act and the rules prescribed thereunder;
e) On the basis of the written representations received from the directors as on 31st March, 2017 taken on record by the Board of Directors, none of the directors is disqualified as on 31st March, 2017 from being appointed as a director in terms of Section 164(2) of the Act.
f) With respect to the adequacy of the internal financial controls over financial reporting of the Company and the operating effectiveness of such controls, refer to our separate Report in “Annexure B”.
g) With respect to the other matters to be included in the Auditor’s Report in accordance with Rule 11 of the Companies (Audit and Auditors) Rules, 2014, in our opinion and to the best of our information and according to the explanations given to us:
i. the Company has disclosed the impact of pending litigations on its financial position in its
standalone Ind AS financial statements – Refer Note no. 38 to the standalone Ind AS financial statements;
ii. the Company did not have any long term contracts including derivative contracts, as such the question of commenting on any material foreseeable losses thereon does not arise;
iii. there has been no delay in transferring amounts, required to be transferred, to the Investor Education and Protection Fund by the Company and
iv. the Company has provided requisite disclosures in its standalone Ind AS financial statements as to holding as well as dealing in Specified bank Notes during the period from 8th November, 2016 to 30th December, 2016 and these are in accordance with the books of account maintained by the Company – Refer Note no. 51 to the standalone Ind AS financial statements.
For J K Shah & Co.Chartered Accountants
Firm Registration No.: 109606W
J. K. ShahPlace : Mumbai PartnerDate : May 23, 2017 Membership No.: 3662

71
Corporate Overview Statutory Reports Standalone Financial Statement Consolidated Financial Statement01-13 14-68 69-123 124-179
(v) In our opinion and according to the information and explanations given to us, the Company, during the year, has not accepted the deposits from the public.
(vi) We have broadly reviewed the books of account maintained by the Company, pursuant to the rules made by the Central Government for the maintenance of cost records, under sub-section (1) of section 148 of the Companies Act, 2013 and are of the opinion that, prima facie, the prescribed accounts and records have generally been maintained. We have, however, not made a detailed examination of the records with a view to determining whether they are accurate or complete.
(vii) a) According to the information and explanations given to us and on the basis of our examination of the records of the Company, amounts deducted / accrued in the books of account in respect of undisputed statutory dues including provident fund, employees’ state insurance, income-tax, sales tax, service tax, duty of customs, duty of excise, value added tax, cess and other material statutory dues have been regularly deposited during the year by the Company with the appropriate authorities. According to the information and explanations given to us, no undisputed amounts payable in respect of such statutory dues were in arrears as at 31 March 2017 for a period of more than six months from the date they became payable.
b) According to information and explanation given to us, details of disputed sales tax, excise duty and service tax demands that have not been deposited on account of disputes are given below:
Name of Statute Nature of Dues Amount (` In lacs)
Period to which amount relates Forum where dispute pending
Income Tax Act, 1961 Income Tax 50.81(#) 2012-2013 Commissioner (Appeals)The UP Sales Tax Act Sales Tax 0.25 1992-1993 Supreme Court of IndiaMVAT Act, 2002 Interest 4.22 2012-2013 Commissioner (Appeals)Tamilnadu VAT Act, 2006 VAT Tax 3.44 2006-2007 to 2011-2012 Commissioner (Appeals)Central Excise Act, 1944 Excise Duty & Penalty 7.19
16.142.220.66
2006-2009May, 2001 to Nov, 2001July, 2010 to Oct, 2011 Nov, 2011 to March, 2012
CESTAT
Central Excise Act, 1944 Excise Duty & Penalty 1.700.30
25.572.42
50.22
April, 2012 to September, 2013July, 2014 to May 2015April, 2011 to June 2015July, 2015 to February, 20162011-12 to 2014-15
Commissioner (Appeals)
The Finance Act, 1994 Service Tax & Penalty
63.6412.510.58
December, 2006 to December, 2010
2013-14June, 2014 to Sep., 2014Jan, 2014 to March, 2014
Commissioner (Appeals)
(#) pertaining to the order passed in the case of erstwhile amalgamating companies.
(viii) According to the records of the Company, it has not defaulted in repayment of dues to any banks.
(ix) The Company did not raise any money by way of initial public offer or further public offer (including debt instruments) and term loans during the year.
(x) According to the information and explanations given to us, no material fraud by the Company or on the Company by its officers or employees has been noticed or reported during the course of our audit for the year.
(xi) According to the information and explanations give to us and based on our examination of the records of the Company, the Company has paid/provided for managerial remuneration in accordance with the requisite approvals mandated by the provisions of section 197 read with Schedule V to the Act.
(xii) In our opinion and according to the information and explanations given to us, the Company is not a nidhi company. Accordingly, paragraph 3(xii) of the Order is not applicable
(xiii) According to the information and explanations given to us and based on our examination of the records of the Company, transactions with the related parties are in compliance with sections 177 and 188 of the Act where applicable and details of such transactions have been disclosed in the standalone Ind AS financial statements as required by the applicable accounting standards.
ANNEXURE - A TO THE AUDITORS’ REPORT (Contd.)

72
Annual Report 2016-17J. B. Chemicals & Pharmaceuticals Limited
Report on the Internal Financial Controls under Clause (i) of Sub-section 3 of Section 143 of the Companies Act, 2013 (“the Act”)We have audited the internal financial controls over financial reporting of J. B. Chemicals & Pharmaceuticals Limited (“the Company”) as of 31 March 2017 in conjunction with our audit of the standalone Ind AS financial statements of the Company for the year ended on that date.Management’s Responsibility for Internal Financial ControlsThe Company’s management is responsible for establishing and maintaining internal financial controls based on the internal control over financial reporting criteria established by the Company considering the essential components of internal control stated in the Guidance Note on Audit of Internal Financial Controls over Financial Reporting issued by the Institute of Chartered Accountants of India (‘ICAI’). These responsibilities include the design, implementation and maintenance of adequate internal financial controls that were operating effectively for ensuring the orderly and efficient conduct of its business, including adherence to company’s policies, the safeguarding of its assets, the prevention and detection of frauds and errors, the accuracy and completeness of the accounting records, and the timely preparation of reliable financial information, as required under the Companies Act, 2013.Auditors’ ResponsibilityOur responsibility is to express an opinion on the Company’s internal financial controls over financial reporting based on our audit. We conducted our audit in accordance with the Guidance Note on Audit of Internal Financial Controls over Financial Reporting (the “Guidance Note”) and the Standards on Auditing, issued by ICAI and deemed to be prescribed under section 143(10) of the Companies Act, 2013, to the extent applicable to an audit of internal financial controls, both applicable to an audit of Internal Financial Controls and, both issued by the Institute of Chartered Accountants of India. Those Standards and the
Guidance Note require that we comply with ethical requirements and plan and perform the audit to obtain reasonable assurance about whether adequate internal financial controls over financial reporting was established and maintained and if such controls operated effectively in all material respects.Our audit involves performing procedures to obtain audit evidence about the adequacy of the internal financial controls system over financial reporting and their operating effectiveness. Our audit of internal financial controls over financial reporting included obtaining an understanding of internal financial controls over financial reporting, assessing the risk that a material weakness exists, and testing and evaluating the design and operating effectiveness of internal control based on the assessed risk. The procedures selected depend on the auditor’s judgment, including the assessment of the risks of material misstatement of the standalone Ind AS financial statements, whether due to fraud or error.We believe that the audit evidence we have obtained is sufficient and appropriate to provide a basis for our audit opinion on the Company’s internal financial controls system over financial reporting.Meaning of Internal Financial Controls over Financial Reporting
A company’s internal financial control over financial reporting is a process designed to provide reasonable assurance regarding the reliability of financial reporting and the preparation of financial statements for external purposes in accordance with generally accepted accounting principles. A company’s internal financial control over financial reporting includes those policies and procedures that (1) pertain to the maintenance of records that, in reasonable detail, accurately and fairly reflect the transactions and dispositions of the assets of the company; (2) provide reasonable assurance that transactions are recorded as necessary to permit preparation of financial statements in accordance with generally accepted accounting principles, and
ANNEXURE - B TO THE AUDITORS’ REPORT
(xiv) According to the information and explanations give to us and based on our examination of the records of the Company, the Company has not made any preferential allotment or private placement of shares or fully or partly convertible debentures during the year.
(xv) According to the information and explanations given to us and based on our examination of the records of the Company, the Company has not entered into non-cash transactions with directors or persons connected with him. Accordingly, paragraph 3(xv) of the Order is not applicable.
(xvi) The Company is not required to be registered under section 45-IA of the Reserve Bank of India Act, 1934.
for J. K. Shah & Co.Chartered Accountants
Firm’s registration No.: 109606W
J. K. ShahPlace : Mumbai PartnerDate : May 23, 2017 Membership No.: 3662
ANNEXURE - A TO THE AUDITORS’ REPORT (Contd.)
73
Corporate Overview Statutory Reports Standalone Financial Statement Consolidated Financial Statement01-13 14-68 69-123 124-179
that receipts and expenditures of the company are being made only in accordance with authorizations of management and directors of the company; and (3) provide reasonable assurance regarding prevention or timely detection of unauthorized acquisition, use, or disposition of the company’s assets that could have a material effect on the financial statements.Inherent Limitations of Internal Financial Controls over Financial Reporting
Because of the inherent limitations of internal financial controls over financial reporting, including the possibility of collusion or improper management override of controls, material misstatements due to error or fraud may occur and not be detected. Also, projections of any evaluation of the internal financial controls over financial reporting to future periods are subject to the risk that the internal financial control over financial reporting may become inadequate because of changes in conditions, or that the degree of compliance with the policies or procedures may deteriorate.
Opinion
In our opinion, the Company has, in all material respects, an adequate internal financial controls system over financial reporting and such internal financial controls over financial reporting were operating effectively as at 31 March 2017, based on the internal control over financial reporting criteria established by the Company considering the essential components of internal control stated in the Guidance Note on Audit of Internal Financial Controls Over Financial Reporting issued by the Institute of Chartered Accountants of India.
for J K Shah & Co.Chartered Accountants
Firm’s Registration No. : 109606W
J. K. ShahPlace : Mumbai PartnerDate : May 23, 2017 Membership No. : 3662
ANNEXURE - B TO THE AUDITORS’ REPORT (Contd.)

74
Annual Report 2016-17J. B. Chemicals & Pharmaceuticals Limited
(` in lakhs)
Particulars NoteNo.
As at March 31,2017
As at March 31,2016
As at April 1, 2015
ASSETSNon-current assets(a) Property, Plant and Equipment 5 59,366.61 36,796.94 29,961.91 (b) Capital work-in-progress 376.25 13,418.52 5,464.69 (c) Intangible assets 6 1,502.41 138.45 125.05 (d) Intangible assets under development − 70.48 52.44 (e) Financial Assets (i) Investments 7 31,880.88 36,438.23 25,912.72 (ii) Trade receivables 8 − − − (iii) Loans 9 30.43 15.34 17.83 (iv) Others 10 648.77 501.16 481.09 (f) Other non-current assets 11 330.76 1,779.63 1,220.39 TOTAL non current assets 94,136.11 89,158.75 63,236.12 Current assets(a) Inventories 12 15,995.57 13,329.31 12,847.40 (b) Financial Assets (i) Investments 13 22,496.16 24,728.31 43,430.52 (ii) Trade receivables 14 26,509.52 26,566.79 24,394.42 (iii) Cash and cash equivalents 15 719.71 1,070.58 859.03 (iv) Loans 16 44.32 56.51 20.20 (v) Others 17 95.57 411.45 781.53 (c) Other current assets 18 8,440.31 8,811.79 8,116.41 TOTAL current assets 74,301.16 74,974.74 90,449.51 Total Assets 168,437.27 164,133.49 153,685.63 EQUITY AND LIABILITIESEquity(a) Equity Share capital 19 1,696.40 1,696.40 1,696.16 (b) Other Equity 20 137,089.73 120,574.14 121,559.90 Total Equity 138,786.13 122,270.54 123,256.06 LIABILITIESNon-current liabilities(a) Financial Liabilities Borrowings 21 − − 40.00 (b) Provisions 22 888.01 1,020.11 1,202.60 (c) Deferred tax liabilities (Net) 23 2,895.35 3,206.57 3,023.93 (d) Other non-current liabilities 24 395.48 380.60 − TOTAL non current liabilities 4,178.84 4,607.28 4,266.53 Current liabilities(a) Financial Liabilities (i) Borrowings 25 4,886.03 17,440.19 10,472.97 (ii) Trade payables 26 7,903.47 6,860.93 6,230.76 (iii) Others 27 10,977.95 11,504.18 7,986.76 (b) Other current liabilities 28 830.07 398.79 273.16 (c) Provisions 29 787.39 622.69 586.17 (d) Current Tax Liabilities (Net) 30 87.39 428.89 613.22 TOTAL current liabilities 25,472.30 37,255.67 26,163.04 Total Equity and Liabilities 168,437.27 164,133.49 153,685.63
See accompanying notes to the financial statements
As per our report of even date For and on behalf of the Board of Directors
For J. K. Shah & Co. J. B. Mody D. B. ModyChartered Accountants Chairman & Managing Director Whole time Director (Administration)
J. K. Shah S. B. Mody Vijay D. BhattPartner Whole time Director (Marketing) Chief Financial Officer
Place : Mumbai Place : Mumbai M. C. MehtaDate : May 23, 2017 Date : May 23, 2017 Company Secretary
BALANCE SHEET As at March 31, 2017

75
Corporate Overview Statutory Reports Standalone Financial Statement Consolidated Financial Statement01-13 14-68 69-123 124-179
(` in lakhs)
Particulars Note No. 2016-17 2015-16
INCOME
I Revenue From Operations 31 1,19,869.42 1,16,493.57
II Other Income 32 4,589.03 5,567.60
III Total Income (I+II) 1,24,458.45 1,22,061.17
IV EXPENSES
Cost of materials consumed 33 36,709.36 37,307.84
Purchases of Stock-in-Trade 9,624.47 8,254.88
Changes in inventories of finished goods, Stock-in -trade and work-in-progress 34 (1,805.26) (684.05)
Employee benefits expense 35 18,786.11 16,595.97
Finance costs 36 500.13 1,029.48
Depreciation and amortization expense 5,6 4,626.42 4,040.87
Other expenses 37 34,338.86 32,446.84
Total expenses (IV) 1,02,780.09 98,991.83
V Profit/(loss) before tax (III-IV) 21,678.36 23,069.34
VI Tax expense: 30
(1) Current tax 4,550.00 4,950.00
(2) Deferred tax (168.10) 199.05
VII Profit/(loss) for the year (V-VI) 17,296.46 17,920.29
VIII Other Comprehensive Income
A (i) Items that will not be reclassified to profit or loss
Re-measurement of the defined benefit plan (413.55) (47.38)
(ii) Income tax relating to items that will not be reclassified to profit or loss 143.12 16.40
Total other comprehensive income (270.43) (30.98)
IX Total Comprehensive Income for the year (VII+VIII) 17,026.03 17,889.31
X Earnings per equity share 46
(1) Basic 20.07 21.09
(2) Diluted 20.07 21.09
See accompanying notes to the financial statements
As per our report of even date For and on behalf of the Board of Directors
For J. K. Shah & Co. J. B. Mody D. B. ModyChartered Accountants Chairman & Managing Director Whole time Director (Administration)
J. K. Shah S. B. Mody Vijay D. BhattPartner Whole time Director (Marketing) Chief Financial Officer
Place : Mumbai Place : Mumbai M. C. MehtaDate : May 23, 2017 Date : May 23, 2017 Company Secretary
PROFIT AND LOSS STATEMENT For the year ended on March 31, 2017

76
Annual Report 2016-17J. B. Chemicals & Pharmaceuticals Limited
CASH FLOW STATEMENT FOR THE YEAR ENDED ON MARCH 31, 2017
(` in lakhs)
Particulars 2016-17 2015-16
A. Cash Flow from Operating Activities
Net Profit before Tax 21,678.36 23,069.34
Adjustment For:
Depreciation 4,626.42 4,040.87
Foreign Exchange Fluctuation (Net) 858.98 (78.34)
Interest Paid 169.82 186.30
(Profit)/ Loss on Sale/Discard of Assets (Net) (183.92) 0.04
Profit on Sale of Investment designated as FVTPL (4,436.49) (3,371.79)
Net (Gain)/Loss arising from financial instruments designated as FVTPL 361.65 (268.27)
Interest Received (88.99) (89.39)
Dividend Received - (627.02)
Re-measurement of the defined benefit plan (413.55) (47.38)
Loss on Liquidation of Foreign Subsidiary - 72.60
Exchange Gain on Liquidation of Foreign Subsidiary - (1,211.13)
Provision for Doubtful debts 267.25 430.71
1,161.17 (962.80)
Operating Profit Before Working Capital Changes 22,839.53 22,106.54
Adjustment For:
Trade and Other Receivables 1,268.89 (3,756.14)
Inventories (2,666.26) (481.91)
Trade Payable 1,114.68 4,353.25
(282.69) 115.20
Cash Generated From Operations 22,556.84 22,221.74
Direct Taxes Paid (net) (4,891.50) (5,134.33)
Net Cash from Operating Activities 17,665.34 17,087.41
B. Cash Flow from Investing Activities
Purchase of Fixed Assets (15,521.18) (18,885.38)
Sale of Fixed Assets 257.80 24.17
Purchase of Investment (18,345.00) (30,976.49)
Sale of Investment 29,209.34 42,720.64
Exchange Gain realised on Liquidation of Foreign Subsidiary - 1,211.13
Interest Received 100.10 110.29
Dividend Received - 627.02
Net Cash used in Investing Activities (4,298.94) (5,168.62)
C. Cash Flow from Financing Activities

77
Corporate Overview Statutory Reports Standalone Financial Statement Consolidated Financial Statement01-13 14-68 69-123 124-179
CASH FLOW STATEMENT FOR THE YEAR ENDED ON MARCH 31, 2017 (Contd.)
(` in lakhs)
Particulars 2016-17 2015-16
Proceeds from issue of Shares under ESOP (including Securities Premium) - 11.16
Proceeds/(Repayment) from/of Short Term Borrowing (Net) (15,641.46) 9,190.95
Proceeds/(Repayment) from/of Long Term Borrowing (Net) - (8.83)
Interest Paid (175.86) (185.49)
Dividend Paid (Including Dividend Distribution Tax) (573.92) (18,754.12)
Net Cash Used in Financing Activities (16,391.25) (9,746.33)
Net Increase in Cash and Cash Equivalents (3,024.84) 2,172.46
Cash And Cash Equivalents as at 01.04.16* 722.77 (1,449.69)
Cash And Cash Equivalents as at 31.03.17 (2,302.07) (3,024.84) 722.77 2,172.46
*Cash and Cash Equivalents comprises the following:
(` in lakhs)
Particulars As at March 31,2017
As at March 31,2016
As at April 1, 2015
a. Balances with banks 466.48 696.14 502.20
b. Unclaimed Dividend A/cs * 224.60 288.08 156.21
c. Fixed Deposits with maturity of less than 12 months 9.58 61.13 173.12
d. Cash on hand 18.45 24.63 26.90
e. Post Office Saving Account 0.60 0.60 0.60
719.71 1,070.58 859.03
Less : Bank Overdraft 3,021.78 347.81 2,308.72
Cash and Cash Equivalents (2,302.07) 722.77 (1,449.69)
*The amount is to be utilised towards settlement of respective unpaid dividends.
As per our report of even date For and on behalf of the Board of Directors
For J. K. Shah & Co. J. B. Mody D. B. ModyChartered Accountants Chairman & Managing Director Whole time Director (Administration)
J. K. Shah S. B. Mody Vijay D. BhattPartner Whole time Director (Marketing) Chief Financial Officer
Place : Mumbai Place : Mumbai M. C. MehtaDate : May 23, 2017 Date : May 23, 2017 Company Secretary

78
Annual Report 2016-17J. B. Chemicals & Pharmaceuticals Limited
1. GENERAL INFORMATIONJ. B. Chemicals & Pharmaceuticals Limited (the Company) is a public limited company incorporated in India (CIN: L24390MH1976PLC019380) having its registered office in Mumbai. The Company is engaged in the business of manufacture and marketing of diverse range of pharmaceuticals formulations, herbal remedies and APIs.
These standalone financial statements for the year ended March 31, 2017 were approved for issue by the Board of Directors vide its resolution dated May 23, 2017.
2. SIGNIFICANT ACCOUNTING POLICIES2.1. STATEMENT OF COMPLIANCE:
The financial statements of the Company have been prepared in accordance with Indian Accounting Standards (Ind AS) notified under the Companies (Indian Accounting Standards) Rules, 2015 as amended by the Companies (Indian Accounting Standards) Rules, 2016. Up to the financial year ended March 31, 2016, the Company prepared its financial statements in accordance with accounting standards notified under the section 133 of the Companies Act 2013 (Previous GAAP) and the other relevant provisions of the Companies Act 2013.
The financial statements for the year ended March 31, 2017 are the Company’s first Ind AS financial statements. The Company has adopted all the Ind AS and the adoption was carried out in accordance with Ind AS 101, “First time adoption of Indian Accounting Standards”. The date of transition to Ind AS is April 1, 2015. The transition was carried out from Accounting Principles generally accepted in India (previous GAAP). Reconciliation and descriptions of the effect of the transition have been summarized in note no. 54.
2.2. BASIS OF PREPARATION:The financial statements have been prepared on a historical cost basis except for certain financial assets and financial liabilities (including financial instruments) which have been measured at fair value at the end of each reporting period as explained in the accounting policies stated below.
2.3. CURRENT VERSUS NON-CURRENT CLASSIFICATION:The Company has classified all its assets and liabilities under current and non-current as required by Ind AS 1- Presentation of Financial Statements. The asset is
treated as current when it is:
• Expectedtoberealizedorintendedtobesoldorconsumed in normal operating cycle;
• Heldprimarilyforpurposeoftrading;
• Expected to be realized within twelve monthsafter the reporting period; or
• Cashorcashequivalentunlessrestricted frombeing exchanged or used to settle a liability for at least twelve months after the reporting period.
All other assets are classified as non-current.
All liabilities are current when:
• Itisexpectedtobesettledinnormaloperatingcycle;
• Itisheldprimarilyforthepurposeoftrading;
• Itisduetobesettledwithintwelvemonthsafterthe reporting period; or
• There is no unconditional right to defer thesettlement of liability for at least twelve months after the reporting period.
All other liabilities are classified as non-current.
2.4. FUNCTIONAL AND PRESENTATION CURRENCY AND ROUNDING OFF OF THE AMOUNTS:The Functional and presentation currency of the Company is Indian rupees. Accordingly, all amounts disclosed in the financial statements and notes have been shown in Indian rupees and all values are shown in lakhs and rounded to two decimals except when otherwise indicated.
2.5. REVENUE RECOGNITION:Revenue is recognized to the extent that it is probable that the economic benefits will flow to the Company and the revenue can be reliably measured, regardless of when the payment is being received. Revenue is measured at the fair value of the consideration received or receivable, taking into account contractually defined terms of payment including excise duty collected which flows to the Company on its own account but excluding taxes or duties collected on behalf of the government.
The Company follows specific recognition criteria as described below before the revenue is recognized.
• Saleofgoods
Revenue from sale of goods is recognized when the significant risks and rewards of ownership have been transferred to the buyer, usually on
NOTES TO THE STANDALONE FINANCIAL STATEMENTS FOR THE YEAR ENDED ON MARCH 31, 2017

79
Corporate Overview Statutory Reports Standalone Financial Statement Consolidated Financial Statement01-13 14-68 69-123 124-179
NOTES TO THE STANDALONE FINANCIAL STATEMENTS FOR THE YEAR ENDED ON MARCH 31, 2017 (Contd.)
delivery of goods, recovery of the consideration is probable, the associated cost can be estimated reliably, there is no continuing effective control or managerial involvement with the goods, and the amount of revenue can be measured reliably.
Revenue from the sale of goods is measured at the fair value of the consideration received or receivable, net of returns and allowances, trade discounts and volume rebates.
• ExportofProductDevelopmentService
Revenue from export of product development service is recognized upon by reference to the stage of completion of service and the amount of revenue can be measured reliably.
• OtherOperatingRevenue
Other Operating revenue comprises of following items:
• Manufacturingcharges
• Exportincentives
• Saleofscrap
Revenue from manufacturing charges is recognized on completion of contractual obligation of manufacturing and delivery of product manufactured.
Revenue from export incentives are recognized upon adherence to the compliance as may be prescribed with regard to export and / or realization of export proceeds as per foreign trade policy and its related guidelines.
Revenue from sale of scrap is recognized on delivery of scrap items.
• OtherIncome
Other income comprises of interest income, dividend from investment and profits on redemption of investments.
Interest income from financial assets is recognized when it is probable that the economic benefit will flow to the Company and the amount of income can be measured reliably. Interest income is accrued on time basis by reference to the principal outstanding and at the effective rate applicable, which is the rate exactly discounts estimated future cash receipts through the
expected life of the financial asset to that asset’s net carrying amount on initial recognition.
Dividend income from investment is recognized when the shareholder’s right to receive payment has been established (provided that it is probable that the economic benefit will flow to the Company and the amount of income can be measured reliably).
Profit on redemption of investment is recognized by upon exercise of power by the company to redeem the investment held in any particular security / instrument (non-current as well as current investment).
2.6. FOREIGN CURRENCY TRANSACTION:Transactions in foreign currency are recorded at the exchange rate prevailing on the date of the transaction. Foreign currency denominated monetary assets and liabilities at the Balance Sheet date are translated at the exchange rate prevailing on the date of Balance Sheet.
Exchange rate differences resulting from foreign currency transactions settled during the period including year-end translation of assets and liabilities are recognized in the Statement of Profit and Loss.
Non-monetary assets, which are measured in terms of historical cost denominated in a foreign currency, are reported using the exchange rate at the date of the initial transaction.
Non-monetary items measured at fair value in a foreign currency are translated using the exchange rates at the date when the fair value was measured. The gain or loss arising on translation of non-monetary items measured at fair value is treated in line with the recognition of the gain or loss on the change in fair value of the item (i.e., translation differences on items whose fair value gain or loss is recognized in OCI or Statement of Profit and Loss are also recognized in OCI or Statement of Profit and Loss, respectively).
2.7. GOVERNMENT GRANTS:Monetary government grants are recognized where there is reasonable assurance that the grant will be received and all attached conditions will be complied with.
The grant related to an expense item is recognized as income in the year in which it is received. The grant
80
Annual Report 2016-17J. B. Chemicals & Pharmaceuticals Limited
related to an asset in the form of EPCG License is recognized in the balance sheet as deferred income and is transferred to Statement of Profit and Loss in equal amounts over the periods during which obligation attached to the License is to be fulfilled. Grant in the form of cash benefit is recognized in the Balance Sheet as deferred income and it is transferred to Statement of Profit and Loss over the useful life of the concerned asset.
2.8. EMPLOYEE BENEFITS:
Short Term and Other Long Term Employee Benefits:
A liability is recognised for benefits accruing to employees in respect of short term employee benefits in the period the related service is rendered at the undiscounted amount of the benefits expected to be paid in exchange for that service.
A liability is recognised for benefits accruing to employees in respect of other long term employee benefits are measured at the present value of the estimated future cash outflows expected to be made by the Company in respect of services provided by the employees up to the reporting date.
Long Term Employee Benefits:
• DefinedContributionPlan:
Payments to defined contributions retirement benefit plans are recognized as an expense when employees have rendered the service entitling them to the contributions.
• DefinedBenefitPlan:
For defined retirement benefit plans, the cost of providing benefits is determined using the Projected Unit Credit method, with actuarial valuations being carried out at end of each annual reporting period. Re-measurements, comprising of actuarial gains and losses, the effect of the changes to the asset ceiling (if applicable), and the return on plan assets (excluding interest), is reflected immediately in the balance sheet with a charge or credit recognized in other comprehensive income in the period in which they occur. Re-measurements recognized in Other Comprehensive Income is reflected immediately in retained earnings and will not be reclassified to Statement of Profit or Loss in subsequent periods. Past service cost is recognized in profit or loss in the period of a plan amendment. Net interest is calculated by applying the discount rate at the beginning of the period
to the net defined benefit liability or assets. Defined benefit costs are categorized as follows:
• Service Cost (including current service cost,past service cost, as well as gains or losses on curtailments and settlements).
• Netinterestexpenseorincome;and
• Re-measurement
The Company presents the first two components defined benefit cost in Statement of Profit and loss in the line items “Employee Benefit Expenses” and “Finance Cost” respectively. Curtailment gain and losses are accounted for as past service cost.
The retirement benefit obligation recognized in the Balance Sheet represents the actual deficit or surplus in the Company’s defined benefit plan. Any surplus resulting from this calculation is limited to the present value of any economic benefits available in the form of refunds from the plan or reduction in future contributions to the plan.
2.9. TAX EXPENSES:The tax expense for the period comprises current and deferred tax. Taxes are recognised in the statement of profit and loss, except to the extent that it relates to the items recognised in the comprehensive income or in Equity. In which case, the tax is also recognised in the comprehensive income or in Equity
Current tax:
Current tax payable is calculated based on taxable profit for the year. Current tax is recognized based on the amount expected to be paid to or recovered from the tax authorities based on applicable tax laws that have been enacted or substantively enacted by the balance sheet date. Management periodically evaluates positions taken in the tax return with respect to situations in which applicable tax regulations are subject to interpretation and establishes provisions where appropriate.
Deferred tax:
Deferred tax is recognised on temporary differences between the carrying amounts of assets and liabilities in the financial statements and the corresponding tax bases used in the computation of taxable profit.
Deferred tax liabilities are generally recognized for all taxable temporary timing difference. Deferred tax assets are recognized for deductible temporary differences to
NOTES TO THE STANDALONE FINANCIAL STATEMENTS FOR THE YEAR ENDED ON MARCH 31, 2017 (Contd.)

81
Corporate Overview Statutory Reports Standalone Financial Statement Consolidated Financial Statement01-13 14-68 69-123 124-179
the extent that they are probable that taxable profit will be available against which the deductible temporary difference can be utilized.
The carrying amount of deferred tax assets is reviewed at each reporting date and adjusted to the extent that it is no longer probable that sufficient taxable profit will be available to allow all or part of the deferred tax asset to be utilized.
Deferred tax assets and liabilities are measured at the tax rates that are expected to apply in the year when the asset is realized or liability is settled, based on tax rates (and tax laws) that have been enacted or substantively enacted on the reporting date.
Current and deferred tax for the year are recognized in profit or loss, except when they relate to items that are recognized in other comprehensive income or directly in equity, in which case, the current and deferred tax are also recognized in other comprehensive income or directly in equity respectively.
Minimum Alternate Tax (MAT) Credit:
MAT credit is recognized as deferred tax asset only when and to the extent there is convincing evidence that the Company will pay normal income tax during the specified period.
2.10. PROPERTY, PLANT AND EQUIPMENTFreehold Land is stated at historical cost.
Premium paid for the leasehold land is amortized over the lease period.
All other items of property, plant and equipment are stated at cost, net of recoverable taxes, trade discount and rebates less accumulated depreciation and impairment losses, if any. Such cost includes purchase price, borrowing cost and any cost directly attributable to bringing the assets to its working condition for its intended use.
Subsequent costs are included in the asset’s carrying amount or recognised as a separate asset, as appropriate, only when it is probable that future economic benefits associated with the item will flow to the entity and the cost can be measured reliably. When significant parts of plant and equipment are required to be replaced at intervals, the company depreciates them separately based on their specific useful lives. All other repairs and maintenance costs are recognized as
expense in the statement of profit and loss account as and when incurred.
Expenses incurred relating to project, net of income earned during the project development stage prior to its intended use, are considered as pre - operative expenses and disclosed under Capital Work- in- Progress.
Cost of the assets less its residual value (estimated at 5% of the cost) is depreciated over its useful life. Depreciation is calculated on a straight line basis over the useful life of the assets as prescribed in Schedule II to the Companies Act, 2013.
The management believes that the estimated useful lives are realistic and reflects fair approximation of the period over which the assets are likely to be used. At each financial year end, management reviews the residual values, useful lives and method of depreciation of property, plant and equipment and values of the same are adjusted prospectively where needed.
2.11. INTANGIBLE ASSETS:Intangible assets acquired separately are measured on initial recognition at cost. Following initial recognition, intangible assets are carried at cost less any accumulated amortization and accumulated impairment losses. Internally generated intangibles are not capitalized and the related expenditure is reflected in the statement of profit or loss in the period in which the expenditure is incurred.
Subsequent costs are included in the asset’s carrying amount or recognised as a separate asset, as appropriate, only when it is probable that future economic benefits associated with the item will flow to the entity and the cost can be measured reliably.
Intangible assets other than Product Dossiers are amortized on a straight line basis over a period of 3 years. The useful lives of intangible assets like Product Dossiers are assessed as either finite or indefinite.
Intangible assets with finite lives are amortized over the useful economic life and assessed for impairment whenever there is an indication that the intangible asset may be impaired. The amortization period and the amortization method for an intangible asset with a finite useful life are reviewed at least at the end of each reporting period. Changes in the expected useful life or the expected pattern of consumption of future economic benefits embodied in the asset are considered to modify
NOTES TO THE STANDALONE FINANCIAL STATEMENTS FOR THE YEAR ENDED ON MARCH 31, 2017 (Contd.)

82
Annual Report 2016-17J. B. Chemicals & Pharmaceuticals Limited
the amortization period or method, as appropriate, and are treated as changes in accounting estimates. The amortization expense on intangible assets with finite lives is recognized in the statement of profit and loss unless such expenditure forms part of carrying value of another asset.
Intangible assets with indefinite useful lives are not amortized, but are tested for impairment annually, either individually or at the cash-generating unit level. The assessment of indefinite life is reviewed annually to determine whether the indefinite life continues to be supportable. If not, the change in useful life from indefinite to finite is made on a prospective basis.
Gains or losses arising from derecognition of an intangible asset are measured as the difference between the net disposal proceeds and the carrying amount of the asset and are recognized in the statement of profit or loss when the asset is derecognized.
2.12. BORROWING COST:Borrowing Costs directly attributed to the acquisition of fixed assets are capitalized as a part of the cost of asset upto the date the asset is put to use. Other Borrowing Costs are charged to the statement of profit and loss account in the year in which they are incurred.
2.13. IMPAIRMENT OF ASSETS:The Company assesses at each reporting date as to whether there is any indication that any property, plant and equipment and intangible assets or group of assets, called cash generating units (CGU) may be impaired. If any such indication exists the recoverable amount of an asset or CGU is estimated to determine the extent of impairment, if any. When it is not possible to estimate the recoverable amount of an individual asset, the Company estimates the recoverable amount of the CGU to which the asset belongs.
An impairment loss is recognized in the Statement of Profit and Loss to the extent, asset’s carrying amount exceeds its recoverable amount. The recoverable amount is higher of an asset’s fair value less cost of disposal and value in use. Value in use is based on the estimated future cash flows, discounted to their present value using pre-tax discount rate that reflects current market assessments of the time value of money and risk specific to the assets.
The impairment loss recognized in prior accounting period is reversed if there has been a change in the
estimate of recoverable amount.
2.14. INVENTORIES:Inventories are stated at the lower of cost or net realizable value. Cost is determined on the basis of Moving Average method. The cost of work in progress (other than those lying at third party manufacturing site which is valued at material cost) and finished goods comprise direct material, direct labour and other direct cost and related production overheads.
2.15. PROVISIONS, CONTINGENT LIABILITIES AND CONTINGENT ASSETS:Provisions are recognized when the company has present obligation (legal or constructive) as a result of past event and it is probable that outflow of resources embodying economic benefits will be required to settle the obligation and a reliable estimate can be made of the amount of the obligation. The expense related to a provision is presented in the statement of profit and loss net of any reimbursement/contribution towards provision made.
If the effect of the time value of money is material, estimate for the provisions are discounted using a current pre-tax rate that reflects, when appropriate, the risks specific to the liability. When discounting is used, the increase in the provision due to the passage of time is recognized as a finance cost.
Provisions are reviewed at each balance sheet date and adjusted to reflect the current best estimates.
Contingent liability:
Contingent liability is disclosed in the case;
• Whenthereisapossibleobligationwhichcouldarise from past event and whose existence will be confirmed only by the occurrence or non-occurrence of one or more uncertain future events not wholly within the control of the Company or;
• Apresentobligationthatarisesfrompasteventsbut is not recognized as expense because it is not probable that an outflow of resources embodying economic benefits will be required to settle the obligation or;
• Theamountoftheobligationcannotbemeasuredwith sufficient reliability.
NOTES TO THE STANDALONE FINANCIAL STATEMENTS FOR THE YEAR ENDED ON MARCH 31, 2017 (Contd.)
83
Corporate Overview Statutory Reports Standalone Financial Statement Consolidated Financial Statement01-13 14-68 69-123 124-179
Commitments:
• Commitmentsincludethevalueofthecontractsfor the acquisition of the assets net of advances.
Contingent asset:
• Contingent asset is disclosed in case apossible asset arises from past events and whose existence will be confirmed only by the occurrence or non-occurrence of one or more uncertain future events not wholly within the control of the Company.
Provisions, contingent liabilities, contingent assets and commitments are reviewed at each balance sheet date.
2.16. LEASES:Leases are classified as finance leases whenever the terms of the lease, transfers substantially all the risks and rewards of ownership to the lessee. All other leases are classified as operating leases.
The determination of whether an arrangement is a lease is based on the substance of the arrangement at the inception of the lease. The arrangement is considered as a lease if fulfillment of the arrangement is dependent on the use of a specific asset or assets and the arrangement conveys a right to use the asset or assets, even if that right is not explicitly specified in an arrangement.
Operating lease payments are recognised as an expense in the Statement of Profit and Loss on a straight-line basis over the lease term except where another systematic basis is more representative of time pattern in which economic benefits from the leased assets are consumed.
2.17. FINANCIAL INSTRUMENTS:The Company recognizes financial assets and financial liabilities when it becomes party to the contractual provision of the instrument.
I. Financial Assets:
Initial recognition and measurement:
Financial assets are initially measured at its fair value. Transaction costs that are directly attributable to the acquisition or issue of financial assets (other than financial assets at fair value through profit or loss) are added to or deducted from the fair value of the concerned financial assets, as appropriate, on initial recognition.
Transaction costs directly attributable to acquisition of financial assets at fair value through profit or loss are recognized immediately in profit or loss. However, trade receivable that do not contain a significant financing component are measured at transaction price.
Subsequent measurement:
For subsequent measurement, the Company classifies financial asset in following broad categories:
•Financialassetcarriedatamortizedcost.
•Financial asset carried at fair value through othercomprehensive income (FVTOCI)
•Financialassetcarriedatfairvaluethroughprofitorloss (FVTPL)
Financial asset carried at amortized cost (net of any write down for impairment, if any):
Financial assets are measured at amortized cost when asset is held within a business model, whose objective is to hold assets for collecting contractual cash flows and contractual terms of the asset give rise on specified dates to cash flows that are solely payments of principal and interest. Such financial assets are subsequently measured at amortized costs using Effective Interest Rate (EIR) method less impairment, if any. The losses arising from impairment are recognized in the statement of profit or loss. Cash and bank balances, trade receivables, loans and other financial asset of the Company are covered under this category.
Under the EIR method, the future cash receipts are exactly discounted to the initial recognition value using EIR. The cumulative amortization using the EIR method of the difference between the initial recognition amount and maturity amount is added to the initial recognition value (net of principal repayments, if any) of the financial asset over the relevant period of the financial asset to arrive at amortized cost at each reporting date. The corresponding effect of the amortization under EIR method is recognized as interest income over the relevant period of the financial asset. The same is included under “other income” in the statement of profit or loss. The amortized cost of the financial asset is also adjusted for loss allowance, if any.
Financial asset carried at FVTOCI:
Financial asset under this category are measured initially as well as at each reporting date at fair value, when asset is held with a business model whose
NOTES TO THE STANDALONE FINANCIAL STATEMENTS FOR THE YEAR ENDED ON MARCH 31, 2017 (Contd.)

84
Annual Report 2016-17J. B. Chemicals & Pharmaceuticals Limited
objective is to hold asset for both collecting contractual cash flows and selling financial assets. Fair value movements are recognized in the other comprehensive income.
Financial asset carried at FVTPL:
Financial asset under this category are measured initially as well as at each reporting date at fair value. Changes in fair value are recognized in the statement of profit or loss.
Investment in subsidiaries:
The Company has accounted for its investments in subsidiaries at cost.
Other Equity Investments:
All other equity investments are measured at fair value, with value changes recognised in Statement of Profit and Loss.
Derecognition:
A financial asset is primarily derecognized when rights to receive cash flows from the asset have expired or the Company has transferred its contractual rights to receive cash flows of the financial asset and has substantially transferred all the risk and reward of the ownership of the financial asset.
Impairment of financial asset:
In accordance with Ind AS 109, the Company uses ‘Expected Credit Loss’ (ECL) model, for evaluating impairment of financial assets other than those measured at fair value through profit and loss (FVTPL).
ECL is the difference between all contractual cash flows that are due to the Company in accordance with the contract and all the cash flows that the entity expects to receive (i.e., all cash shortfalls), discounted at the original effective interest rate.
Lifetime ECL are the expected credit losses resulting from all possible default events over the expected life of a financial asset. 12-month ECL are a portion of the lifetime ECL which result from default events that are possible within 12 months from the reporting date.
For trade receivables Company applies ‘simplified approach’ which requires expected lifetime losses to be recognised from initial recognition of the receivables. The Company uses historical default rates to determine impairment loss on the portfolio of trade receivables.
At every reporting date these historical default rates are reviewed and changes in the forward looking estimates are analysed.
For other assets, the Company uses 12 month ECL to provide for impairment loss where there is no significant increase in credit risk. If there is significant increase in credit risk full lifetime ECL is used.
ECL impairment loss allowance (or reversal) recognized during the period is recognized as income/ expense in the Statement of Profit and Loss under the head ‘Other expenses’.
II. Financial liabilities:
Initial recognition and measurement:
The Company recognizes a financial liability in its Balance Sheet when it becomes party to the contractual provisions of the instrument.The Company classifies all financial liabilities as subsequently measured at amortised cost or FVTPL.
All financial liabilities are recognized initially at fair value and in the case of loans, borrowings and payables, net of directly attributable transaction costs. Financial liabilities include trade and other payables, loans and borrowings including bank overdrafts and derivative financial instruments.
Subsequent measurement:
Financial liabilities at fair value through profit or loss include financial liabilities held for trading and financial liabilities designated upon initial recognition as at fair value through profit or loss. Interest-bearing loans and borrowings are subsequently measured at amortized cost using the Effective Interest Rate (EIR) method. Gains and losses are recognized in profit or loss when the liabilities are derecognized as well as through EIR amortization process. Amortized cost is calculated by taking into account any discount or premium on acquisition and fees or costs that are an integral part of the EIR.
The EIR amortization is included as finance costs in the statement of profit and loss.
Derecognition of financial liabilities:
A financial liability is derecognized when the obligation under the liability is discharged or cancelled or expires. When an existing financial liability is replaced by another from the same lender on substantially different terms, or the terms of an existing liability are substantially
NOTES TO THE STANDALONE FINANCIAL STATEMENTS FOR THE YEAR ENDED ON MARCH 31, 2017 (Contd.)

85
Corporate Overview Statutory Reports Standalone Financial Statement Consolidated Financial Statement01-13 14-68 69-123 124-179
modified, such an exchange or modification is treated as the derecognition of the original liability and the recognition of a new liability. The difference in the respective carrying amounts is recognized in the Statement of Profit and Loss.
III. Derivative financial instrument:
Company uses derivative financial instruments such as forward currency contracts to mitigate its foreign currency fluctuation risks. Such derivative financial instruments are initially recognized at fair value on the date on which a derivative contract is entered into and are subsequently re-measured at fair value at each reporting date. Gain or loss arising from changes in the fair value of heading instrument is recognized in the Statement of Profit or Loss.
Derivatives are carried as financial assets when the fair value is positive and as financial liabilities when the fair value is negative.
Derecognition:
On derecognition of hedged item, the unamortized fair value, of the hedging instrument adjusted to the hedged items is recognized in the Statement of Profit or Loss.
IV. Fair value:
The Company measures financial instruments at fair value in accordance with the accounting policies mentioned above. Fair value is the price that would be received to sell an asset or paid to transfer a liability in an orderly transaction between market participants at the measurement date. The fair value measurement is based on the presumption that the transaction to sell the asset or transfer the liability takes place either:
• Intheprincipalmarketfortheassetorliabilityor;
• Intheabsenceofaprincipalmarket,inthemostadvantageous market for the asset or liability.
All assets and liabilities for which fair value is measured or disclosed in the financial statements are categorized within the fair value hierarchy that categorizes into three levels, described as follows, the inputs to valuation techniques used to measure value. The fair value hierarchy gives the highest priority to quoted prices in active markets for identical assets or liabilities (Level 1 inputs) and the lowest priority to unobservable inputs (Level 3 inputs).
Level 1 — quoted (unadjusted) market prices in active markets for identical assets or liabilities
Level 2 — inputs other than quoted prices included within Level 1 that are observable for the asset or liability, either directly or indirectly
Level 3 — inputs that are unobservable for the asset or liability
For the purpose of fair value disclosures, the Company has determined classes of assets and liabilities on the basis of the nature, characteristics and risks of the asset or liability and the level of the fair value hierarchy as explained above.
2.18. EMPLOYEE STOCK OPTION PLAN:The accounting value of stock options representing the excess of the market price over the exercise price of the shares granted under “Employee Stock Option Scheme” (ESOP) of the Company is amortized on straight line basis over the vesting period as “Deferred Employee Compensation”.
2.19. RESEARCH AND DEVELOPMENT EXPENDITURE:Revenue expenditure on research and development is charged to the Statement of Profit and Loss in the year in which it is incurred. Capital expenditure on research and development is treated as fixed assets.
2.20. CASH AND CASH EQUIVALENT:Cash and Cash Equivalents comprise of cash on hand and cash at bank including fixed deposit/highly liquid investments with original maturity period of three months or less that are readily convertible to known amounts of cash and which are subject to an insignificant risk of changes in value.
2.21. CASH FLOW STATEMENTS:Cash flows are reported using the indirect method, whereby net profit before tax is adjusted for the effects of transactions of a non-cash nature, any deferrals or accruals of past or future operating cash receipts or payments and item of income or expenses associated with investing or financing cash flows. The cash flow from operating, investing and financing activities of Company is segregated.
3. STANDARDS ISSUED BUT NOT YET EFFECTIVE:• IndAS115 issued inFebruary2015,establishesafive
step model to account for revenue from contracts with
NOTES TO THE STANDALONE FINANCIAL STATEMENTS FOR THE YEAR ENDED ON MARCH 31, 2017 (Contd.)

86
Annual Report 2016-17J. B. Chemicals & Pharmaceuticals Limited
customer. Under this Ind AS, the revenue is recognised at an amount that reflects the consideration in exchange for transferring goods and services which an entity expects to be entitled. The Company is in process of analyzing the impact of this proposed standard and shall adopt the same from the required effective date.
• In March 2017, the Ministry of Corporate Affairsissued the Companies (Indian Accounting Standards) (Amendments) Rules, 2017, notifying amendment to Ind AS 7, ‘Statement of cash flows’ and Ind AS 102 ‘Share-based payment’. These amendments are in accordance with the recent amendments made by International Accounting Standards Board (IASB) to IAS 7, ‘Statement of cash flows’ and IFRS 2 ‘Share-based payment’ respectively. The amendments are applicable to the Company from April 1, 2017.
Amendments to Ind AS 7
The amendments to Ind AS 7 requires the entities to provide disclosures that enable users of financial statements to evaluate changes in liabilities arising from financing activities, including both changes arising from cash flows and non-cash changes, suggesting inclusion of a reconciliation between the opening and closing balances in the Balance Sheet for liabilities arising from financing activities, to meet the disclosure requirement.
These amendments are effective for annual period beginning on or after April, 1, 2017. Application of the amendments will result in additional disclosures provided by the Company.
Amendments to Ind AS 102
The amendment to Ind AS 102 provides specific guidance on measuring the cash-settled awards, modification of cash-settled awards and awards that include a net settlement feature in respect of withholding taxes.
The Company is not having any cash settled share-based payment. No impact is currently foreseen.
4. KEY ACCOUNTING JUDGMENTS’, ESTIMATES AND ASSUMPTIONS:The preparation of the Company’s financial statements requires the management to make judgments’, estimates and assumptions that affect the reported amounts of revenues, expenses, assets and liabilities, and the accompanying disclosures and the disclosure of contingent liabilities. Uncertainty about these assumptions and estimates could result in outcomes
that require a material adjustment to the carrying amount of assets or liabilities affected in future periods.
The key assumptions concerning the future and other key sources of estimation uncertainty at the reporting date, that have asignificant risk of causing a material adjustment to the carrying amounts of assets and liabilities within the next financial year, are described below:
A) Income taxes and Deferred tax assets:
The Company’s tax jurisdiction is India. Significant judgments are involved in estimating budgeted profits for the purpose of paying advance tax, determining the provision for income taxes, including amount expected to be paid/recovered for uncertain tax positions. Deferred tax asset is recognised for all the deductible temporary differences to the extent that it is probable that taxable profit will be available against which the deductible temporary difference can be utilized. The management assumes that taxable profit will be available while recognizing the deferred tax assets.
B) Property, Plant and Equipment:
Property, Plant and Equipment represent a significant proportion of the asset base of the Company. The charge in respect of periodic depreciation is derived after determining an estimate of an asset’s expected useful life as prescribed in the Schedule II of the Companies Act, 2013 and the expected residual value at the end of its life. The useful lives and residual values of Company’s assets are determined by the management at the time the asset is acquired and reviewed periodically, including at each financial year end. The lives are based on historical experience with similar assets as well as anticipation of future events, which may impact their life, such as changes in technical or commercial obsolescence arising from changes or improvements in production or from a change in market demand of the product or service output of the asset.
C) Intangible assets:
Internal technical or user team assesses the remaining useful lives of Intangible assets. Management believes that assigned useful lives are reasonable.
D) Impairment of non-financial assets:
The Company assesses at each reporting date whether there is an indication that an asset may be impaired. If any indication exists, the Company estimates the asset’s recoverable amount. An asset’s recoverable amount
NOTES TO THE STANDALONE FINANCIAL STATEMENTS FOR THE YEAR ENDED ON MARCH 31, 2017 (Contd.)

87
Corporate Overview Statutory Reports Standalone Financial Statement Consolidated Financial Statement01-13 14-68 69-123 124-179
is the higher of an asset’s or Cash Generating Units (CGU’s) fair value less costs of disposal and its value in use. It is determined for an individual asset, unless the asset does not generate cash inflows that are largely independent of those from other assets or a group of assets. Where the carrying amount of an asset or CGU exceeds its recoverable amount, the asset is considered impaired and is written down to its recoverable amount.
In assessing value in use, the estimated future cash flows are discounted to their present value using pre-tax discount rate that reflects current market assessments of the time value of money and the risks specific to the asset. In determining fair value less costs of disposal, recent market transactions are taken into account, if no such transactions can be identified, an appropriate valuation model is used.
E) Impairment of financial assets:
The impairment provisions for financial assets are based on assumptions about risk of default and expected cash loss rates. The Company uses judgement in making these assumptions and selecting the inputs to the impairment calculation, based on Company’s past history, existing market conditions as well as forward looking estimates at the end of each reporting period.
F) Recognition and measurement of defined benefit obligation:
The obligation arising from the defined benefit plan is determined on the basis of actuarial assumptions. Key actuarial assumptions include discount rate, trends in salary escalation and vested future benefits and life expectancy. The discount rate is determined with reference to market yields at the end of the reporting
period on the government bonds. The period to maturity of the underlying bonds correspond to the probable maturity of the post-employment benefit obligations.
G) Recognition and measurement of other provisions:
The recognition and measurement of other provisions are based on the assessment of the probability of an outflow of resources, and on past experience and circumstances known at the balance sheet date. The actual outflow of resources at a future date may, therefore, vary from the figure included in other provisions.
H) Contingencies:
Management judgement is required for estimating the possible outflow of resources, if any, in respect of contingencies/claim/litigations against the Company as it is not possible to predict the outcome of pending matters with accuracy.
I) Allowances for uncollected trade receivable and advances:
Trade receivables do not carry any interest and are stated at their normal value as reduced by appropriate allowances for estimated amounts which are irrecoverable. Individual trade receivables are written off when management deems them not collectible. Impairment is made on the expected credit losses, which are the present value of the cash shortfall over the expected life of the financial assets. The impairment provisions for financial assets are based on assumption about risk of default and expected loss rates. Judgement in making these assumptions and selecting the inputs to the impairment calculation are based on past history, existing market condition as well as forward looking estimates at the end of each reporting period.
NOTES TO THE STANDALONE FINANCIAL STATEMENTS FOR THE YEAR ENDED ON MARCH 31, 2017 (Contd.)

88
Annual Report 2016-17J. B. Chemicals & Pharmaceuticals Limited
( ` in lakhs)5. PROPERTY, PLANT AND EQUIPMENT
Particulars Gross Block Accumulated Depreciaion Net Block
As at April 1,
2016
Additions Disposals As at March 31,
2017
As at April 1,
2016
Depreciation charge for
the year
On disposals
As at March 31,
2017
As at March 31,
2017
As at March 31,
2016
Land (Freehold) 59.34 - 2.18 57.16 - - - - 57.16 59.34
Land (Leasehold) 830.16 593.04 - 1,423.20 102.18 12.23 - 114.41 1,308.79 727.98
Factory Buildings 13,459.46 7,444.78 129.33 20,774.91 4,074.10 411.94 89.11 4,396.93 16,377.98 9,385.36
Other Buildings (Note 1) 5,472.53 350.52 6.19 5,816.86 235.56 91.78 2.53 324.81 5,492.05 5,236.97
Plant & Equipments 39,097.39 12,268.23 - 51,365.62 20,942.85 3,331.87 - 24,274.72 27,090.90 18,154.54
Furniture & Fixtures 1,197.54 2,002.02 - 3,199.56 959.69 107.42 - 1,067.11 2,132.45 237.85
Vehicles 1,082.40 102.16 97.26 1,087.30 531.25 119.02 69.42 580.85 506.45 551.15
Office Equipments 2,365.88 608.80 - 2,974.68 1,883.93 223.03 - 2,106.96 867.72 481.95
Airconditioners 3,515.74 3,791.15 - 7,306.89 1,553.94 219.84 - 1,773.78 5,533.11 1,961.80
Total 67,080.44 27,160.70 234.96 94,006.18 30,283.50 4,517.13 161.06 34,639.57 59,366.61 36,796.94
( ` in lakhs)Particulars Gross Block Accumulated Depreciaion Net Block
As at April 1,
2015
Additions Disposals As at March 31,
2016
As at April 1,
2015
Depreciation charge for
the year
On disposals
As at March 31,
2016
As at March 31,
2016
As at April 1,
2015
Land (Freehold) 59.34 - - 59.34 - - - - 59.34 59.34
Land (Leasehold) 830.16 - - 830.16 94.20 7.98 - 102.18 727.98 735.96
Factory Buildings 12,099.22 1,360.24 - 13,459.46 3,702.93 371.17 - 4,074.10 9,385.36 8,396.29
Other Buildings (Note 1) 669.04 4,803.49 - 5,472.53 174.63 60.93 - 235.56 5,236.97 494.41
Plant & Equipments 35,220.86 3,883.01 6.48 39,097.39 17,986.24 2,958.53 1.92 20,942.85 18,154.54 17,234.62
Furniture & Fixtures 1,179.95 21.51 3.92 1,197.54 870.16 93.10 3.57 959.69 237.85 309.79
Vehicles 1,055.81 121.01 94.42 1,082.40 496.45 110.35 75.55 531.25 551.15 559.36
Office Equipments 2,051.35 318.91 4.38 2,365.88 1,734.47 153.41 3.95 1,883.93 481.95 316.88
Airconditioners 3,223.78 291.96 - 3,515.74 1,368.52 185.42 - 1,553.94 1,961.80 1,855.26
Total 56,389.51 10,800.13 109.20 67,080.44 26,427.60 3,940.89 84.99 30,283.50 36,796.94 29,961.91
Note:
1) Value of buildings includes a sum of ` 3000/- being the cost of shares in the societies. 2) No depreciation has been claimed on assets to the extent of cenvat claimed.
6. INTANGIBLE ASSETS ( ` in lakhs)
Particulars Gross Block Accumulated Depreciaion Net Block
As at April 1,
2016
Additions Deductions As at March 31,
2017
As at April 1,
2016
Amortisation for the year
Deductions As at March 31,
2017
As at March 31,
2017
As at March 31,
2016
Trade Marks 3.67 - - 3.67 3.66 - - 3.66 0.01 0.01
Computer Software 893.27 140.95 - 1,034.22 754.83 109.29 - 864.12 170.10 138.44
Product Dossier - 1,332.30 - 1,332.30 - - - - 1,332.30 -
Total 896.94 1,473.25 - 2,370.19 758.49 109.29 - 867.78 1,502.41 138.45
NOTES TO THE STANDALONE FINANCIAL STATEMENTS FOR THE YEAR ENDED ON MARCH 31, 2017 (Contd.)

89
Corporate Overview Statutory Reports Standalone Financial Statement Consolidated Financial Statement01-13 14-68 69-123 124-179
(` in lakhs)
Particulars Gross Block Accumulated Depreciaion Net Block
As at April 1,
2015
Additions Deductions As at March 31,
2016
As at April 1,
2015
Amortisation for the year
Deductions As at March 31,
2016
As at March 31,
2016
As at April 1,
2015
Trade Marks 3.67 - - 3.67 3.66 - - 3.66 0.01 0.01
Computer Software 779.89 113.38 - 893.27 654.85 99.98 - 754.83 138.44 125.04
Total 783.56 113.38 - 896.94 658.51 99.98 - 758.49 138.45 125.05
7. FINANCIAL ASSETS - NON CURRENT INVESTMENTS (` in lakhs)
ParticularsAs at
March 31, 2017
As at March 31,
2016
As at April 1,
2015A. Investment in Equity Instruments-Unquoted
i) In Subsidiary Companies : (At cost)
Investment in OOO Unique Pharmaceutical Laboratories - Russia (No. of shares are not denominated as per Law of Russian Federation)
3,881.92 3,881.92 1,250.30
Nil (March 31, 2016: Nil, April 1, 2015 5,241,100) Ordinary shares of US $ 1 each of J.B. Healthcare Pvt. Ltd.
- - 2,337.86
Investment in Unique Pharmaceutical Laboratories LLC, Ukraine (No. of shares are not denominated as per Law of Ukraine)
- 34.45 34.45
51,885,000 (March 31, 2016: 51,885,000, April 1, 2015: 365,000) Ordinary Shares of AED 1 each of Unique Pharamaceutical laboratories FZE Dubai
9,414.76 9,414.76 59.92
Share Application Money - - 940.25
Less: Provision for diminution in value of Investment - (34.45) (34.45)
Total 13,296.68 13,296.68 4,588.33
ii) In Other Companies : (At fair value through Profit & Loss)
5,866 (March 31, 2016 : 5,866, April 1, 2015 : 5,866) Equity Shares of ` 10 each of Bharuch Enviro Infrastructure Ltd.
0.59 0.59 0.59
612,032 (March 31, 2016 : 612,032, April 1, 2015 : 612,032) Equity Shares of `10 each of Narmada Clean Tech Limited.
61.20 61.20 61.20
20,000 (March 31, 2016 : 20,000, April 1, 2015 : 20,000) Equity Shares of Enviro Technology Ltd. of ` 10 each
2.00 2.00 2.00
60,000 (March 31, 2016 : 60,000, April 1, 2015 : 60,000) Equity Shares of Panoli Enviro Technology Ltd.of `10 each
6.00 6.00 6.00
50,000 (March 31, 2016 : 50,000, April 1, 2015 : 50,000) Equity Shares of `10 each of Ankleshwar Research & Analytical Infrastructure Limited
5.00 5.00 5.00
8,036 (March 31, 2016 : 8,036, April 1, 2015 : 8,036) Equity Shares of `10 each of J B Life Science Overseas Ltd.
- - -
2,000,000 (March 31, 2016 : 200,000, April 1, 2015 : 200,000) Equity Shares of ̀ 10 each of Asian Heart Institute & Research Centre Pvt. Ltd.
828.56 721.34 642.99
Total 903.35 796.13 717.78
Total Investment in Equity Instruments 14,200.03 14,092.81 5,306.11
NOTES TO THE STANDALONE FINANCIAL STATEMENTS FOR THE YEAR ENDED ON MARCH 31, 2017 (Contd.)
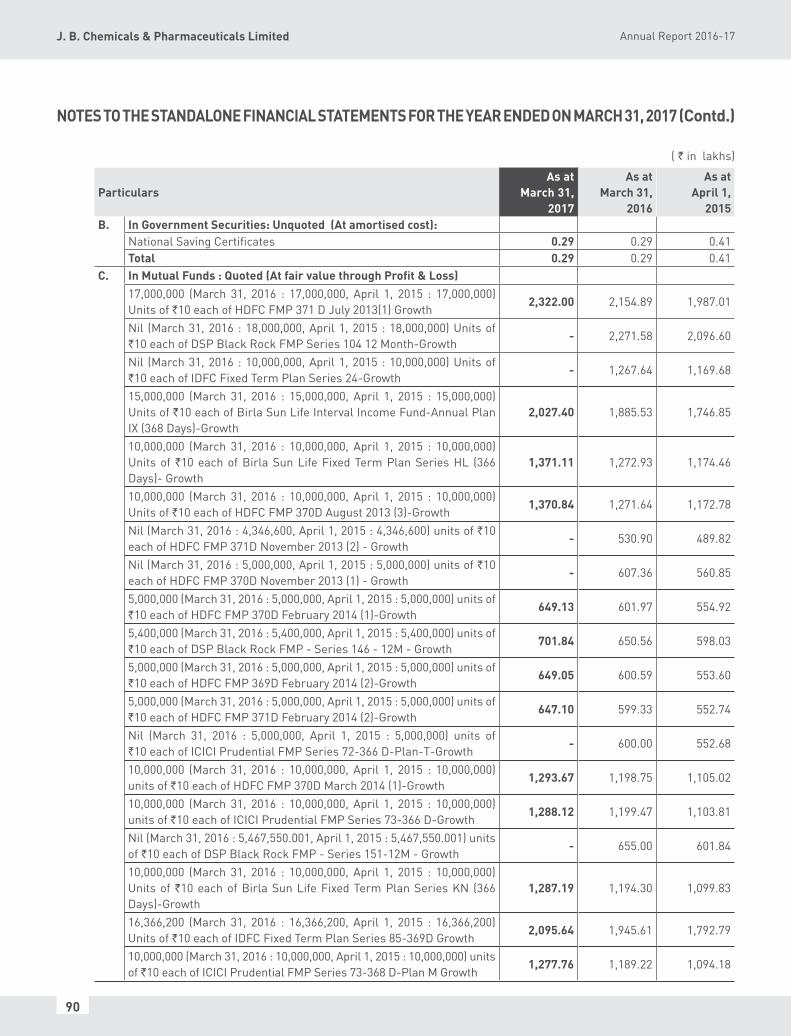
90
Annual Report 2016-17J. B. Chemicals & Pharmaceuticals Limited
ParticularsAs at
March 31, 2017
As at March 31,
2016
As at April 1,
2015B. In Government Securities: Unquoted (At amortised cost):
National Saving Certificates 0.29 0.29 0.41 Total 0.29 0.29 0.41
C. In Mutual Funds : Quoted (At fair value through Profit & Loss)17,000,000 (March 31, 2016 : 17,000,000, April 1, 2015 : 17,000,000) Units of `10 each of HDFC FMP 371 D July 2013(1) Growth
2,322.00 2,154.89 1,987.01
Nil (March 31, 2016 : 18,000,000, April 1, 2015 : 18,000,000) Units of `10 each of DSP Black Rock FMP Series 104 12 Month-Growth
- 2,271.58 2,096.60
Nil (March 31, 2016 : 10,000,000, April 1, 2015 : 10,000,000) Units of `10 each of IDFC Fixed Term Plan Series 24-Growth
- 1,267.64 1,169.68
15,000,000 (March 31, 2016 : 15,000,000, April 1, 2015 : 15,000,000) Units of `10 each of Birla Sun Life Interval Income Fund-Annual Plan IX (368 Days)-Growth
2,027.40 1,885.53 1,746.85
10,000,000 (March 31, 2016 : 10,000,000, April 1, 2015 : 10,000,000) Units of `10 each of Birla Sun Life Fixed Term Plan Series HL (366 Days)- Growth
1,371.11 1,272.93 1,174.46
10,000,000 (March 31, 2016 : 10,000,000, April 1, 2015 : 10,000,000) Units of `10 each of HDFC FMP 370D August 2013 (3)-Growth
1,370.84 1,271.64 1,172.78
Nil (March 31, 2016 : 4,346,600, April 1, 2015 : 4,346,600) units of `10 each of HDFC FMP 371D November 2013 (2) - Growth
- 530.90 489.82
Nil (March 31, 2016 : 5,000,000, April 1, 2015 : 5,000,000) units of `10 each of HDFC FMP 370D November 2013 (1) - Growth
- 607.36 560.85
5,000,000 (March 31, 2016 : 5,000,000, April 1, 2015 : 5,000,000) units of `10 each of HDFC FMP 370D February 2014 (1)-Growth
649.13 601.97 554.92
5,400,000 (March 31, 2016 : 5,400,000, April 1, 2015 : 5,400,000) units of `10 each of DSP Black Rock FMP - Series 146 - 12M - Growth
701.84 650.56 598.03
5,000,000 (March 31, 2016 : 5,000,000, April 1, 2015 : 5,000,000) units of `10 each of HDFC FMP 369D February 2014 (2)-Growth
649.05 600.59 553.60
5,000,000 (March 31, 2016 : 5,000,000, April 1, 2015 : 5,000,000) units of `10 each of HDFC FMP 371D February 2014 (2)-Growth
647.10 599.33 552.74
Nil (March 31, 2016 : 5,000,000, April 1, 2015 : 5,000,000) units of `10 each of ICICI Prudential FMP Series 72-366 D-Plan-T-Growth
- 600.00 552.68
10,000,000 (March 31, 2016 : 10,000,000, April 1, 2015 : 10,000,000) units of `10 each of HDFC FMP 370D March 2014 (1)-Growth
1,293.67 1,198.75 1,105.02
10,000,000 (March 31, 2016 : 10,000,000, April 1, 2015 : 10,000,000) units of `10 each of ICICI Prudential FMP Series 73-366 D-Growth
1,288.12 1,199.47 1,103.81
Nil (March 31, 2016 : 5,467,550.001, April 1, 2015 : 5,467,550.001) units of `10 each of DSP Black Rock FMP - Series 151-12M - Growth
- 655.00 601.84
10,000,000 (March 31, 2016 : 10,000,000, April 1, 2015 : 10,000,000) Units of `10 each of Birla Sun Life Fixed Term Plan Series KN (366 Days)-Growth
1,287.19 1,194.30 1,099.83
16,366,200 (March 31, 2016 : 16,366,200, April 1, 2015 : 16,366,200) Units of `10 each of IDFC Fixed Term Plan Series 85-369D Growth
2,095.64 1,945.61 1,792.79
10,000,000 (March 31, 2016 : 10,000,000, April 1, 2015 : 10,000,000) units of `10 each of ICICI Prudential FMP Series 73-368 D-Plan M Growth
1,277.76 1,189.22 1,094.18
( ` in lakhs)
NOTES TO THE STANDALONE FINANCIAL STATEMENTS FOR THE YEAR ENDED ON MARCH 31, 2017 (Contd.)

91
Corporate Overview Statutory Reports Standalone Financial Statement Consolidated Financial Statement01-13 14-68 69-123 124-179
ParticularsAs at
March 31, 2017
As at March 31,
2016
As at April 1,
20155,500,000 (March 31, 2016 : 5,500,000, April 1, 2015 : 5,500,000) units of `10 each of DSP Black Rock FMP Series 161-12 Month Growth
699.71 647.86 598.71
Total 17,680.56 22,345.13 20,606.20
Total Non current Investment 31,880.88 36,438.23 25,912.72
Aggregate amount of quoted investments - At Cost 13,426.62 18,208.04 18,208.04
Aggregate amount of quoted investments - At Market Value 17,680.56 22,345.13 20,606.20
Aggregate amount of unquoted investments 14,200.32 14,093.10 5,306.52
Aggregate provision for diminution in value of investments of subsidiary company
- 34.45 34.45
Category-wise Non current investment
Financial assets carried at cost 13,296.68 13,296.68 4,588.33
Financial assets measured at fair value through Profit & Loss 18,583.91 23,141.26 21,323.98
Financial assets carried at amortised cost 0.29 0.29 0.41
Total Non current Investment 31,880.88 36,438.23 25,912.72
8. NON CURRENT FINANCIAL ASSETS - TRADE RECEIVABLES (` in lakhs)
ParticularsAs at
March 31, 2017
As at March 31,
2016
As at April 1,
2015Unsecured Considered Doubtful 10.04 10.04 244.30 Less: Provision for Doubtful Debts 10.04 10.04 244.30
- - -
9. NON CURRENT FINANCIAL ASSETS - LOANSUnsecured considered good (` in lakhs)
ParticularsAs at
March 31, 2017
As at March 31,
2016
As at April 1,
2015Loans to Employees 30.43 15.34 17.83
30.43 15.34 17.83
10. NON CURRENT FINANCIAL ASSETS - OTHERS Unsecured considered good (` in lakhs)
ParticularsAs at
March 31, 2017
As at March 31,
2016
As at April 1,
2015Security Deposits for leased premises 298.51 86.11 79.17 Other Security Deposits 329.48 405.60 355.43 Fixed Deposit having maturity more than 12 months # 20.78 9.45 46.49 # Includes ` 7.60 lakhs (March 31, 2016 : ` 7.60 lakhs, April 1, 2015 : ` 7.60 lakhs) held as security against bank guarantee
648.77 501.16 481.09
(` in lakhs)
NOTES TO THE STANDALONE FINANCIAL STATEMENTS FOR THE YEAR ENDED ON MARCH 31, 2017 (Contd.)

92
Annual Report 2016-17J. B. Chemicals & Pharmaceuticals Limited
11. OTHER NON CURRENT ASSETSUnsecured considered good (` in lakhs)
ParticularsAs at
March 31, 2017
As at March 31,
2016
As at April 1,
2015Capital Advances 263.91 1,755.99 1,196.62 Prepaid Expenses 16.63 19.60 12.91 Prepaid Lease Rent 50.22 4.04 10.86
330.76 1,779.63 1,220.39
12. CURRENT ASSETS - INVENTORIES (` in lakhs)
ParticularsAs at
March 31, 2017
As at March 31,
2016
As at April 1,
2015Raw materials (Stock-in-transit ̀ Nil, March 31, 2016: ̀ 71.05, April 1, 2015: ̀ Nil) 5,274.99 4,109.13 4,864.71 Packing Materials 2,029.79 2,346.80 1,813.61 Work-in-progress 1,414.03 1,626.94 1,245.27 Finished goods (Stock-in-transit ` 203.60, March 31, 2016 ` 219.36, April 1, 2015 ` 260.94)
5,962.38 4,515.64 4,159.48
Stock-in-trade 1,276.40 704.97 737.04 Fuel 37.98 25.83 27.29
15,995.57 13,329.31 12,847.40
13. CURRENT FINANCIAL ASSETS - INVESTMENTIn Mutual Funds : Quoted (At fair value through Profit & Loss) (` in lakhs)
ParticularsAs at
March 31, 2017
As at March 31,
2016
As at April 1,
2015
7,381,837.65(March 31,2016 : 14,905,323.290, April 1, 2015 : 33,728,297.052) Units of `10 each of Birla Sun Life Dynamic Bond Fund-Retail-Growth
2,143.24 3,926.18 8,244.07
Nil (March 31, 2016 : Nil, April 1, 2015 7,660,630.319) Units of `10 each of HDFC High Interest Fund Short Term Plan - Growth
- - 2,114.22
Nil (March 31, 2016 : Nil, April 1, 2015 :13,021,055.072) Units of `10 each of ICICI Prudential Short Term Plan - Growth
- - 3,854.97
6,628,677.94 (March 31, 2016 : 10,277,332.185, April 1, 2015 10,277,332.185) Units of `10 each of Birla Sun life Short Term Fund-Growth
4,127.80 5,845.50 5,377.62
9,600,000 (March 31, 2015 : 12,196,280.245, April 1, 2015 : 20,476,362.088) Units of `10 each of HDFC Short Term Opportunities Fund-Growth
1,726.84 2,014.81 3,119.82
Nil ( March 31, 2016 : Nil, April 1, 2015 : 9,710,086.366 ) Units of ` 10 each of HDFC Floating Rate Fund Income Fund Short Term Plan-Growth
- - 2,326.27
Nil ( March 31, 2016 : 24,033,329.985, April 1, 2015 : 24,033,329.985) Units of ` 10 each of IDFC Dynamic Bond Fund-Plan B-Growth
- 4,284.97 4,076.36
112,584.469 ( March 31, 2016 : 147,118.682, April 1, 2015 : 123,134.423) Units of `1,000 each of DSP Black Rock Strategic Bond-Institutional Plan-Growth
2,206.82 2,611.89 2,057.17
Nil (March 31, 2016 : Nil, April 1, 2015 :1,029,804.264) Units of ` 10 each of Birla Sunlife Savings Fund -Growth
- - 2,770.87
NOTES TO THE STANDALONE FINANCIAL STATEMENTS FOR THE YEAR ENDED ON MARCH 31, 2017 (Contd.)

93
Corporate Overview Statutory Reports Standalone Financial Statement Consolidated Financial Statement01-13 14-68 69-123 124-179
ParticularsAs at
March 31, 2017
As at March 31,
2016
As at April 1,
2015
Nil (March 31, 2016 : Nil, April 1, 2015 : 558,466.741) Units of ` 10 each of Birla Sun Life Cash Plus Growth
- - 1,252.55
Nil (March 31, 2016 : Nil, April 1, 2015 :1,426,975.95 ) units of `10 each of ICICI Prudential Liquid Plan-Growth
- - 2,951.80
14,960,414.311 (March 31, 2016 : 14,960,414.311,April 1, 2015 : 14,960,414.311) units of ` 10 each of HDFC Medium Term Opportunities Fund Post Growth
2,708.96 2,466.54 2,272.94
Nil (March 31, 2016: 5,000,000, April 1, 2015: 5,000,000l) Units of ` 10 each of Bank Of India AXA Fixed Maturity Plan-Series 14 (366 Days)-Growth
- - 543.04
1,258,152.830 (March 31, 2016 : 1,258,152.830, April 1, 2015: 1,258,152.830) Units of ` 10 each of Birla Sun Life Treasury Optimiser Plan Growth
2,619.31 2,373.86 2,186.08
Nil (March 31, 2016: Nil, April 1, 2015 4320.429) Units of `1000 each of DSP Black Rock Liquidity Fund Institutional Plan Growth
- - 86.39
Nil (March 31, 2016 : Nil, April 1, 2015 : 587,704.023) Units of `10 each of HDFC Floating Rate Income Fund LTP-Growth
- - 143.12
Nil (March 31, 2016 : Nil, April 1, 2015 : 222,181.321) Units of `10 each of HDFC Floating Rate Income Fund STP Wholesale Option Growth
- - 53.23
671,214.160 (March 31, 2016: 288,684.703, April 1, 2015 : Nil) units of `10 each of HDFC Balanced Fund Growth
879.75 306.98 -
614,895.941 (March 31, 2016 : 256,915.235, April 1, 2015: Nil) units of ` 10 each of ICICI Prudential Balanced Fund Growth
702.58 229.91 -
562,478.145 (March 31, 2016: 402,765.883, April 1, 2015 : Nil) units of `10 each of Franklin India Balanced Fund Growth
586.45 363.87 -
Nil (March 31, 2016: 185,664.255, April 1, 2015 : Nil) units of `10 each of Tata Balanced fund Regular Growth
- 303.80 -
4,066,953.677 (March 31, 2016: Nil, April 1, 2015 : Nil) units of `10 each of HDFC Medium Term Opportunities Fund Direct Growth
739.27 - -
3,631,279.845 (March 31, 2016: Nil, April 1, 2015 : Nil) units of `10 each of ICICI Prudential Income Opportunities Fund Direct Growth
847.04 - -
401795.826 (March 31, 2016: Nil, April 1, 2015 : Nil) units of `10 each of Birla Treasury Optimizer Fund Direct Growth
845.15 - -
12,249,128.427 (March 31, 2016: Nil, April 1, 2015 : Nil) unit of `10 each of IDFC Corporate Bond Fund Direct Growth
1,373.85 - -
485,440.146 (March 31, 2016: Nil, April 1, 2015: Nil) units of `10 each of DSP Blackrock Balance Fund -Growth
637.69 - -
1,692,906.721 (March 31, 2016: Nil, April 1, 2015: Nil) units of `10 each of ICICI Prudential Long Term Fund Direct Growth
351.41 - -
22,496.16 24,728.31 43,430.52
Aggregate amount of quoted investments - At Cost 17,878.52 19,524.97 36,678.16
Aggregate amount of quoted investments - At Market Value 22,496.16 24,728.31 43,430.52
( ` in lakhs)
NOTES TO THE STANDALONE FINANCIAL STATEMENTS FOR THE YEAR ENDED ON MARCH 31, 2017 (Contd.)

94
Annual Report 2016-17J. B. Chemicals & Pharmaceuticals Limited
14. CURRENT FINANCIAL ASSETS - TRADE RECEIVABLES(Unsecured, considered good unless otherwise stated) (` in lakhs)
ParticularsAs at
March 31, 2017
As at March 31,
2016
As at April 1,
2015Considered Good 26,509.52 26,566.79 24,394.42 Considered Doubtful 267.25 430.71 -
26,776.77 26,997.50 24,394.42 Less : Provision for Doubtful Debts 267.25 430.71 -
26,509.52 26,566.79 24,394.42
15. CURRENT FINANCIAL ASSETS - CASH AND CASH EQUIVALENTS (` in lakhs)
ParticularsAs at
March 31, 2017
As at March 31,
2016
As at April 1,
2015a. Balances with banks 466.48 696.14 502.20 b. Unclaimed Dividend A/cs * 224.60 288.08 156.21 c. Fixed Deposits with maturity of less than 12 months 9.58 61.13 173.12 d. Cash on hand 18.45 24.63 26.90 e. Post Office Saving Account 0.60 0.60 0.60
719.71 1,070.58 859.03
*The amount is to be utilised towards settlement of respective unpaid dividends.
16 CURRENT FINANCIAL ASSETS - LOANSUnsecured considered good (` in lakhs)
ParticularsAs at
March 31, 2017
As at March 31,
2016
As at April 1,
2015Advances to Employees 44.32 56.51 20.20
44.32 56.51 20.20
17. CURRENT FINANCIAL ASSETS - OTHERSUnsecured considered good (` in lakhs)
ParticularsAs at
March 31, 2017
As at March 31,
2016
As at April 1,
2015Security Deposits Others 64.83 150.11 302.72 Security Deposits for lease premises 21.66 6.82 7.24 Forward Contract Receivable - 234.42 409.54 Other Advances 3.18 3.09 24.12 Accrued interest on Deposits and others 5.90 17.01 37.91
95.57 411.45 781.53
18. OTHERS CURRENT ASSETS Unsecured considered good (` in lakhs)
ParticularsAs at
March 31, 2017
As at March 31,
2016
As at April 1,
2015Advances to Suppliers 420.89 274.38 378.23Balance with Excise Authorities 4.10 4.20 2.75Other Advances 8,015.32 8,533.21 7,735.43
8,440.31 8,811.79 8,116.41
NOTES TO THE STANDALONE FINANCIAL STATEMENTS FOR THE YEAR ENDED ON MARCH 31, 2017 (Contd.)

95
Corporate Overview Statutory Reports Standalone Financial Statement Consolidated Financial Statement01-13 14-68 69-123 124-179
19. EQUITY SHARE CAPITAL (` in lakhs)
ParticularsAs at
March 31, 2017
As at March 31,
2016
As at April 1,
2015Authorised101,500,000 (March 31, 2016: 101,500,000, April 1, 2015: 101,500,000) Equity Shares of ` 2/- each
2,030.00 2,030.00 2,030.00
Issued, Subscribed & Fully Paid up84,819,975 (March 31, 2016: 84,819,975, April 1, 2015: 84,808,225) Equity Shares of ` 2/- each
1,696.40 1,696.40 1,696.16
Less: Share Capital Cancelled on Amalgamation - - 866.85 Add: Share Capital Pending Allotment - - 866.85
1,696.40 1,696.40 1,696.16
Reconciliation of the shares outstanding and amount of Share Capital
ParticularsAs at
March 31, 2017As at
March 31, 2016As at
April 1, 2015Number ` in lakhs Number ` in lakhs Number ` in lakhs
Shares Outstanding at the beginning of the year
84,819,975 1,696.40 84,808,225 1,696.16 84,731,625 1,694.63
Shares issued during the year pursuant to Employees Stock Option Scheme
- - 11,750 0.24 76,600 1.53
Shares outstanding at the year end 84,819,975 1,696.40 84,819,975 1,696.40 84,808,225 1,696.16
The Company has only one class of issued shares having par value of ` 2/-. Each holder of equity shares is entitled to one vote per share and carries identical right as to dividend. These shares are not subject to any restrictions.
Details of Shareholders holding more than 5% shares.
ParticularsAs at
March 31, 2017As at
March 31, 2016As at
April 1, 2015No of
Shares% of
HoldingNo of
Shares% of
HoldingNo of
Shares% of
HoldingJyotindra B. Mody 5,371,905 6.33 5,371,905 6.33 473,490 0.56Dinesh Bhagwanlal Mody 5,241,432 6.18 4,738,932 5.59 300 0.00Shirish Bhagwanlal Mody 5,056,312 5.96 5,056,312 5.96 227,550 0.27Kumud Dinesh Mody 4,839,984 5.71 4,839,944 5.71 104,865 0.12Bharati S. Mody 4,963,002 5.85 4,963,002 5.85 153,655 0.19Pallavi Bharat Mehta 5,201,207 6.13 5,201,207 6.13 310,890 0.37Pranabh Dinesh Mody 4,940,172 5.82 4,940,172 5.82 177,325 0.21Nirav Shirish Mody 4,984,979 5.88 4,984,979 5.88 218,500 0.26Jyotindra Mody Holdings Pvt. Ltd. - - - - 7,466,242 8.81Dinesh Mody Securities Pvt. Ltd. - - - - 7,055,326 8.33Shirish B. Mody Investments Pvt. Ltd. - - - - 6,530,601 7.71Ansuya Mody Securities Pvt. Ltd. - - - - 7,234,882 8.54Kumud Mody Securities Pvt. Ltd. - - - - 7,181,232 8.48Bharati S. Mody Investments Pvt. Ltd. - - - - 7,873,987 9.29Ashish Dhawan - - 51,93,530 6.12 8,179,608 9.65
Shares reserved for issue under ESOP
In the year 2004, the Company has instituted the Employees Stock Option Scheme, under which 2,500,000 equity shares of ` 2 each have been reserved. Under the Scheme, the options are granted at an amount equal to ninety five percent of the average daily closing price of the shares of the Company’s share quoted on National Stock Exchange of India Ltd. during
NOTES TO THE STANDALONE FINANCIAL STATEMENTS FOR THE YEAR ENDED ON MARCH 31, 2017 (Contd.)

96
Annual Report 2016-17J. B. Chemicals & Pharmaceuticals Limited
the period of twelve weeks preceding the date of grant. These options vest in four equal instalments and subject to other provisions of the Scheme, are exercisable within a period of five years from the respective date of vesting.
The activity under ESOP scheme during the year was as under. (` in lakhs)
ParticularsAs at
March 31, 2017
As at March 31,
2016
As at April 1,
2015Options outstanding at the beginning of the period (No of shares) - 35,875 1,67,350 Less: Excercised - 11,750 76,600 Lapsed - 24,125 54,875 Options outstanding at the end of the period (No of shares) - - 35,875
20. OTHER EQUITY
Reserves and Surplus Other Comprehensive
Income- remeasurement of net definded
benefit plan
Total
Particulars Capital Reserves (transferred from
amalgamating company)
Other Reserves
Investment allowance Reserve (utilised)
Capital Reserve
Capital Reserve
Contingency Reserve
Securities Premium Reserve
Statutory Reserve
General Reserve
Retained Earnings
Balance as on April 1, 2015 34.86 63.53 4.21 2,020.00 4,935.23 267.49 48,280.57 65,954.01 - 121,559.90
Share Premium received - - - - 10.92 - - - - 10.92
Transfer to General Reserve - - - - - (267.49) 267.49 - - -
Profit for the year - - - - - - - 17,920.29 - 17,920.29
Interim Dividend including Dividend Distribution Tax
- - - - - - - (4,593.94) - (4,593.94)
Final Dividend including Dividend Distribution Tax
- - - - - - - (14,292.05) - (14,292.05)
Other comprehensive income net of deferred tax
- - - - - - - - (30.98) (30.98)
Balance as on March 31, 2016 34.86 63.53 4.21 2,020.00 4,946.15 - 48,548.06 64,988.31 (30.98) 1,20,574.14
Balance as on April 1, 2016 34.86 63.53 4.21 2,020.00 4,946.15 - 48,548.06 64,988.31 (30.98) 1,20,574.14
Profit for the year - - - - - - - 17,296.46 - 17,296.46
Dividend including Dividend Distribution Tax
- - - - - - - (510.44) - (510.44)
Other comprehensive income net of deferred tax
- - - - - - - - (270.43) (270.43)
Balance as on March 31, 2017 34.86 63.53 4.21 2,020.00 4,946.15 - 48,548.06 81,774.33 (301.41) 1,37,089.73
NATURE AND PURPOSE OF RESERVESA. Capital Reserves (transferred from amalgamating company)
This was created on amalgamation of J. B. Chemicals and Pharmaceuticals Pvt. Ltd. with this Company w.e.f. April 1, 1984 (appointed date).
B. Capital reserves
Arose pursuant to forfeiture and re-issue of shares.
C. Contingency reserve
This reserve has been created out of retained earnings, as a matter of prudence, to take care of any unforseen adverse contingencies.
NOTES TO THE STANDALONE FINANCIAL STATEMENTS FOR THE YEAR ENDED ON MARCH 31, 2017 (Contd.)

97
Corporate Overview Statutory Reports Standalone Financial Statement Consolidated Financial Statement01-13 14-68 69-123 124-179
D. Securities premium reserve
The amount received in excess of face value of the equity shares is recognised in Securities Premium Reserve. In case of equity-settled share based payment transactions, the difference between fair value on grant date and nominal value of share is accounted as securities premium reserve.
E. Statutory reserve
This reserve is acquired pursuant to the Scheme of Amalgamation of six investment companies which got amalgamated with the Company from the appointed date April 1, 2014 in terms of the order of the Hon’ble Bombay High Court and in terms of the requirement of Reserve Bank of India Act, 1934. During the financial year 2015-16, the same was transferred to General Reserve pursuant to the approval from the Reserve Bank of India.
F. General reserve
The Company has transferred a portion of the net profit of the Company before declaring dividend to general reserve pursuant to the earlier provisions of Companies Act, 1956. Mandatory transfer to general reserve is not required under the Companies Act, 2013
G. RETAINED EARNINGS Retained earnings are the profits that the Company has earned till date, less any transfer to general reserve, dividends or
other distribution paid to shareholders.
21. NON CURRENT FINANCIAL LIABILITIES - BORROWINGS ( ` in lakhs)
ParticularsAs at
March 31, 2017
As at March 31,
2016
As at April 1,
2015Inter Corporate Deposit from a related party (unsecured) - - 40.00
- - 40.00
22. NON CURRENT LIABILITIES - PROVISIONS
ParticularsAs at
March 31, 2017
As at March 31,
2016
As at April 1,
2015Provision for Employee BenefitsGratuity 398.05 626.15 850.21 Leave Encashment 489.96 393.96 352.39
888.01 1,020.11 1,202.60
23. DEFERRED TAX LIABILITIES (NET)
ParticularsAs at
March 31, 2017
As at March 31,
2016
As at April 1,
2015Deferred Tax LiabilityDepreciation 4,400.23 3,093.51 2,902.47 Fair Valuation of Mutual Fund 2,046.85 2,155.03 2,111.21 Fair Valuation of Equity shares 145.02 120.28 102.21
6,592.10 5,368.82 5,115.89 Deferred Tax AssetsRetirement Benefits 681.09 568.54 619.06 MAT credit entitlement 2,923.71 1,351.71 1,351.71 Others 91.95 242.00 121.19
3,696.75 2,162.25 2,091.96 2,895.35 3,206.57 3,023.93
(For movements during the year refer note no. 44)
NOTES TO THE STANDALONE FINANCIAL STATEMENTS FOR THE YEAR ENDED ON MARCH 31, 2017 (Contd.)

98
Annual Report 2016-17J. B. Chemicals & Pharmaceuticals Limited
24. OTHER NON CURRENT LIABILITIES (` in lakhs)
ParticularsAs at
March 31, 2017
As at March 31,
2016
As at April 1,
2015Government Grant 395.48 380.60 -
395.48 380.60 -
Government grant has been received for the purpose of purchase of certain items of Property, Plant & Equipment. The condition against which the grant is received is the export obligation to be fulfilled within certain specified period. (refer note no. 38 )
25. CURRENT FINANCIAL LIABILITIES - BORROWINGS (` in lakhs)
ParticularsAs at
March 31, 2017
As at March 31,
2016
As at April 1,
2015Secured (At amortised cost) # (a) Foreign Currency Loans from Banks - 7,800.00 5,400.00 (b) Bank Overdraft 3,021.78 - - (c) Working Capital Demand Loan 1,500.00 - -
4,521.78 7,800.00 5,400.00 Unsecured (At amortised cost)(a) Foreign currency loans from Bank - 8,928.13 2,412.50 (b) Bank Overdraft - 347.81 2,308.72 (c) Deposit from Distributors / Customers 259.25 259.25 246.75 (d) Inter Corporate Deposits from related parties 105.00 105.00 105.00
364.25 9,640.19 5,072.97 4,886.03 17,440.19 10,472.97
# Woking capital borrowings from the banks are secured by first pari passu charge on the stocks and book debts of the Company.
26. CURRENT FINANCIAL LIABILITIES - TRADE PAYABLES (` in lakhs)
ParticularsAs at
March 31, 2017
As at March 31,
2016
As at April 1,
2015Payable to Micro, Small and Medium Enterprises 104.53 116.17 88.55 Payable to Others 7,798.94 6,744.76 6,142.21
TOTAL 7,903.47 6,860.93 6,230.76
The details of amount outstanding to Micro, Small and Medium Enterprise based on available information with the Company is as under:
(` in lakhs)
ParticularsAs at
March 31, 2017
As at March 31,
2016
As at April 1,
2015a) The Principal amount and the interest due thereon remaining unpaid to
any supplier as at the end of each accounting year Principal 104.53 116.17 88.55 Interest due thereon - - -
b) The amount of interest paid by the buyer in terms of S. 16 of Micro, Small and Medium Enterprise Development Act, 2006.
- - -
NOTES TO THE STANDALONE FINANCIAL STATEMENTS FOR THE YEAR ENDED ON MARCH 31, 2017 (Contd.)

99
Corporate Overview Statutory Reports Standalone Financial Statement Consolidated Financial Statement01-13 14-68 69-123 124-179
(` in lakhs)
ParticularsAs at
March 31, 2017
As at March 31,
2016
As at April 1,
2015c) The amount of payment made to supplier beyond the appointed day
during the each accounting year. 868.92 788.04 730.43
d) The amount of interest due and payable for the period of delay in making payment (which have been paid but beyond the appointed day during the year) but without adding interest specified under the Micro, Small and Medium Enterprise Development Act, 2006.
- - -
e) The amount of interest accrued and remaining unpaid at the end of each accounting year
91.39 84.43 70.43
f) The amount of further interest remaining due and payable even in succeeding years, until such date when interest dues above are actually paid to the small enterprise, for the purpose of disallowance of a deductible expenditure under S. 23 of Micro, Small and Medium Enterprise Development Act, 2006.
6.96 14.40 16.12
The above information regarding Micro, Small and Medium Enterprises has been determined to the extent such parties have been identified on the basis of information available with the Company. This has been relied upon by the auditors.
The delayed payment has been computed having regard to specified credit period of 45 days under Micro, Small and Medium Enterprise Development Act, 2006. However there is no delay in terms of agreed credit terms with these suppliers.
27. CURRENT FINANCIAL LIABILITIES - OTHERS (` in lakhs)
ParticularsAs at
March 31, 2017
As at March 31,
2016
As at April 1,
2015(a) Current maturities of long-term debt - Vehicle loan (secured) - - 8.83 (b) Intercorporate deposit from a related party (unsecured) - 40.00 - (c) Interest accrued and due on borrowings - 6.04 5.23 (d) Unclaimed Dividends 224.60 288.08 156.21 (e) Creditors for capital expenditure 1,689.68 2,159.34 603.45 (f) Forward contract payable 196.00 - - (g) Other payables 8,861.67 9,005.72 7,213.04 (h) Security deposit from customers 6.00 5.00 -
10,977.95 11,504.18 7,986.76
28. OTHER CURRENT LIABILITIES (` in lakhs)
ParticularsAs at
March 31, 2017
As at March 31,
2016
As at April 1,
2015(a) Advance from Customers 365.38 55.07 21.71 (b) Outstanding Purchase Consideration (Undischarged liabilities of vendors) 0.10 0.10 0.10 (c) Government grant 82.13 3.02 - (d) Other payable 382.46 340.60 251.35
830.07 398.79 273.16
NOTES TO THE STANDALONE FINANCIAL STATEMENTS FOR THE YEAR ENDED ON MARCH 31, 2017 (Contd.)

100
Annual Report 2016-17J. B. Chemicals & Pharmaceuticals Limited
29. CURRENT LIABILITIES - PROVISIONS (` in lakhs)
ParticularsAs at
March 31, 2017
As at March 31,
2016
As at April 1,
2015
Provision for employee benefits
Gratuity 677.31 527.76 500.07
Leave Encashment 110.08 94.93 86.10
787.39 622.69 586.17
30. CURRENT TAX LIABILITIES (NET) (` in lakhs)
ParticularsAs at
March 31, 2017
As at March 31,
2016
As at April 1,
2015
Provision for Taxes 41,312.36 36,762.36 31,822.82
Less: Taxes Paid 41,224.97 36,333.47 31,209.60
87.39 428.89 613.22
A. The major components of income tax expense for the year are as under: (` in lakhs)
Particulars 2016-17 2015-16
i. Income tax recognized in the statement of profit and loss
Current Tax:
Current tax on profit for the year 4,550.00 4,950.00
Deferred tax :
Deferred Tax expenses (168.10) 199.05
Total Income tax recognized in the statement of profit and loss 4,381.90 5,149.05
ii. Income tax recognized in other comprehensive income
Deferred tax :
Deferred Tax expenses on re-measurement of defined benefit plan 143.12 16.40
Total Income tax recognized in other comprehensive income 143.12 16.40
B. Reconciliation of tax expense and the accounting profit for the year is under: (` in lakhs)
Particulars 2016-17 2015-16
Accounting Profit before income tax expenses 21,678.36 23,069.34
Enacted tax rate in India (%) 34.608 34.608
Expected income tax expense 7,502.45 7,983.84
Tax effect of :
Expenses not deductible 61.49 95.30
Allowances and concessions (3,782.39) (2,882.48)
Deductible expenses (Net) (971.65) (47.61)
MAT credit Entitlement 1,572.00 -
Tax expenses recognized in statement of profit and loss 4,381.90 5,149.05
Effective tax rate (%) 20.21 22.32
NOTES TO THE STANDALONE FINANCIAL STATEMENTS FOR THE YEAR ENDED ON MARCH 31, 2017 (Contd.)

101
Corporate Overview Statutory Reports Standalone Financial Statement Consolidated Financial Statement01-13 14-68 69-123 124-179
31. REVENUE FROM OPERATIONS (` in lakhs)
Particulars 2016-17 2015-16Sales of Products: Sale of Pharmaceuticals Products 115,889.52 111,620.42 Export of Product Development Service 386.31 527.37 Exchange Rate Difference realised 468.72 1,505.03
116,744.55 113,652.82 Other Operating Revenues: Manufacturing Charges 93.32 65.72 Export Incentives 2,554.97 2,383.01 Sale of Scrap 289.99 297.66 Government Grant 47.08 17.22 Insurance Claims 28.70 10.47 Others 110.81 66.67
3,124.87 2,840.75 119,869.42 116,493.57
Sales of Products (` in lakhs)
Particulars 2016-17 2015-16Pharmaceuticals 106,275.34 101,029.01Active Pharmaceutical ingredients 9,190.46 10,066.53Others 423.72 524.88 115,889.52 111,620.42
32. OTHER INCOME (` in lakhs)
Particulars 2016-17 2015-16 Interest Income - Bank Deposit 3.46 17.74 - Others 85.53 71.65 Dividend From Investment designated as FVTPL - 627.02 Exchange Gain realised on liquidation of foreign subsidiary - 1,211.13 Profit on sale of Investment designated as FVTPL 4,436.49 3,371.79 Net Gain/(Loss) arising from financial instruments designated as FVTPL (361.65) 268.27 Profit on Sale of Assets (Net) 183.92 - Provision for Doubtful debts written back 11.00 - Others - - Excess provision written back 230.28 -
4,589.03 5,567.60
33. COST OF MATERIAL CONSUMED (` in lakhs)
Particulars 2016-17 2015-16 Opening Inventories 6,455.93 6,656.61 Purchases 37,558.21 37,107.16
44,014.14 43,763.77 Less: Closing Inventories 7,304.78 6,455.93
36,709.36 37,307.84
NOTES TO THE STANDALONE FINANCIAL STATEMENTS FOR THE YEAR ENDED ON MARCH 31, 2017 (Contd.)

102
Annual Report 2016-17J. B. Chemicals & Pharmaceuticals Limited
34. CHANGES IN INVENTORIES OF FINISHED GOODS, WORK-IN-PROGRESS AND STOCK-IN-TRADE(` in lakhs)
Particulars 2016-17 2015-16Inventories at the beginning Finished Goods 4,515.64 4,159.48 Work-in-process 1,626.94 1,245.27 Stock in Trade 704.97 758.75
6,847.55 6,163.50 Less: Inventories at the end Finished Goods 5,962.38 4,515.64 Work-in-process 1,414.03 1,626.94 Stock in Trade 1,276.40 704.97
8,652.81 6,847.55 (1,805.26) (684.05)
35. EMPLOYEE BENEFITS EXPENSE (` in lakhs)Particulars 2016-17 2015-16Salaries and Other Benefits 17,114.30 15,026.16 Contribution to Provident Fund and Other Funds 1,181.48 1,061.68 Employee Compensation Expense - - Gratuity Expense 166.76 157.31 Staff Welfare 323.57 350.82
18,786.11 16,595.97
36. FINANCE COST (` in lakhs)Particulars 2016-17 2015-16Interest on Working capital borrowings 169.82 186.30 Interest on Fixed Loans - - Interest on External Commercial Borrowing - - Applicable net loss on foreign Currency transactions and translations 190.60 681.95 Interest cost Employee Benefit 93.12 107.21 Other Borrowing Cost : Loan Processing Charges 30.74 21.60 Guarantee Charges 15.85 32.42
500.13 1,029.48
37. OTHER EXPENSES (` in lakhs)Particulars 2016-17 2015-16Manufacturing charges 731.71 790.22 Stores and spares 692.65 850.54 Power and fuel 5,489.14 5,528.34 Excise duty 2,403.31 2,121.56 Compensation rent 822.03 403.34 Rates and taxes 168.09 156.18 Insurance 274.65 234.77 Freight and transport charges 3,593.53 3,731.98 Repairs to:
Building 386.19 294.23 Machinery 678.61 660.96 Others 1,157.59 867.66
NOTES TO THE STANDALONE FINANCIAL STATEMENTS FOR THE YEAR ENDED ON MARCH 31, 2017 (Contd.)

103
Corporate Overview Statutory Reports Standalone Financial Statement Consolidated Financial Statement01-13 14-68 69-123 124-179
Particulars 2016-17 2015-16 Loss on sale of investments - - Loss on sale/discard of assets (Net) - 0.04 Sales promotion and publicity 2,663.08 2,524.20 Selling commission 2,219.53 2,288.66 Travelling and conveyance 2,530.84 2,285.86 Labour Hire Charges 1,786.56 1,941.65 Laboratory Expenses 2,240.78 1,786.18 Directors' fees 48.91 62.58 Royalty 1,000.65 1,000.33 Payment to Auditors
Audit fees 30.00 30.00 Tax Audit fees 12.00 12.00 Other Taxation matters 15.00 15.00 Certification matters 6.50 6.50
CSR Activity Expenses 265.23 243.58 Donations 38.61 11.35 Net loss on foreign currency transactions and translation 531.48 308.93 Fair Value Loss on Financial Instruments at fair value through profit or loss - - Bad debts - - Provision for doubtful debts 255.65 430.71 Loss on Liquidation of Foreign Subsidiary - 72.60 Miscellaneous expenses 4,296.54 3,786.89
34,338.86 32,446.84
38. COMMITMENTS & CONTINGENCIES: COMMITMENTS
• CapitalCommitments: (` in lakhs)
ParticularsAs at
March 31, 2017
As at March 31,
2016
As at April 1,
2015Estimated amount of contracts remaining to be executed on capital account and not provided (Net of Advance)
637.63 2,991.32 3,618.56
• OtherCommitments:
The Company has imported capital good including spares under the Export Promotion Capital Goods Scheme (EPCG) utilizing the benefit of zero rate or concessional rate of Customs duty. These benefits are subject to the fulfillment of certain export obligation within the stipulated period of time under the EPCG Scheme.Such export obligation at the year-end aggregate to:
(` in lakhs)
ParticularsAs at
March 31, 2017
As at March 31,
2016
As at April 1,
2015Export obligations under EPCG Scheme 20,656.05 20,076.17 17,567.81
( ` in lakhs)
NOTES TO THE STANDALONE FINANCIAL STATEMENTS FOR THE YEAR ENDED ON MARCH 31, 2017 (Contd.)

104
Annual Report 2016-17J. B. Chemicals & Pharmaceuticals Limited
CONTINGENCIES• ClaimagainsttheCompanynotacknowledgedasdebts
Pharmaceutical Division of Unique Pharmaceutical Laboratories Ltd. (UPLL) which was acquired by the Company on a going concern basis, has received demand notices from Dept. of Chemicals & Fertilizers, Govt. of India, New Delhi demanding a sum of ` 461.47 lakhs in respect of the bulk drug Metronidazole and a further sum of ` 591.05 lakhs in respect of the bulk drug Oxyphenbutazone. These amounts were claimed on hypothetical basis in 1996, under Para 7(2) of DPCO 79 read with Para 14 of DPCO 87 and Para 12 of DPCO 95, long after repeal of DPCO 79 and DPCO 87 and gains allegedly notionally made by it by procuring the bulk drugs at alleged lower cost. UPLL has filed review petition against each of these claims disputing the jurisdiction, power and legal or rational basis for making such demands, particularly in view of the repeal of DPCO 79 and DPCO 87.The Company has filed Writ Petitions bearing No. 446 of 2008 in respect of demand for Oxyphenbutazone & writ petition No. 2623 of 2007 in respect of demand for Metronidazole in Bombay High Court. These writ petitions have been admitted and the Hon. High Court has restrained the Government from adopting coercive steps to recover the amount till the disposal of the writ petition on the Company furnishing security as per the orders. The Company has already furnished the bank guarantee as security. As per the legal advice received by the Company, there is no liability and accordingly no provision is being made in the Accounts for these claims and demands.
( ` in lakhs)
ParticularsAs at
March 31, 2017
As at March 31,
2016
As at April 1,
2015Central Excise & Service tax demands / show causes (against which the Company has made pre deposit of ̀ 7.17 lakhs, ̀ 6.55 lakhs March 31, 2016 and ` 2.15 lakhs April 1, 2015)
594.67 529.51 554.04
Income Tax (against which the Company has made pre deposit of ` 28.61 lakhs, ` 28.61 lakhs March 31, 2016 and ` 20.98 lakhs April 1, 2015)
71.79 71.79 20.98
Sales Tax (against which the Company has made pre deposit of ` 0.43 lakhs, ` 0.43 lakhs March 31, 2016 and ` 3.55 lakhs April 1, 2015)
8.34 4.12 11.82
Letter of Credit (LC) opened by the Banks 1,487.54 940.81 3,035.18Guarantees issued by bank on behalf of the Company 1,443.09 2,004.13 1,605.16Corporate guarantee given by the Company to a bank in respect of loan taken by a Wholly Owned Subsidiary
2,594.40 2,650.00 2,500.00
Surrender of 0% EPCG License under Status Holder Incentive Scrip - 177.99 -
39. Traveling expenses of field personnel include incidental expenses on conveyance, postage, stationery and miscellaneous expenses, etc.
40. Details of Research & Development Expenditure incurred during the year at the following R&D Centers:
Particulars Thane Panoli-API Panoli-formulation & Development
Daman
2016-17 2015-16 2016-17 2015-16 2016-17 2015-16 2016-17 2015-16
Revenue Expenditure:
Staff Cost 775.83 778.05 36.25 28.05 170.57 147.72 62.23 46.43
Power & Fuel 76.60 76.93 - - - - 31.53 7.89
Travelling & Conveyance 38.13 33.25 - - - - - -
R & D Raw Materials 112.19 34.40 30.25 19.67 263.55 285.49 125.75 22.99
NOTES TO THE STANDALONE FINANCIAL STATEMENTS FOR THE YEAR ENDED ON MARCH 31, 2017 (Contd.)

105
Corporate Overview Statutory Reports Standalone Financial Statement Consolidated Financial Statement01-13 14-68 69-123 124-179
Particulars Thane Panoli-API Panoli-formulation & Development
Daman
2016-17 2015-16 2016-17 2015-16 2016-17 2015-16 2016-17 2015-16
Product Registration & Other Fees
3.15 0.64 - - - - - -
Clinical Trial & Bio-equivalence Studies
233.44 4.31 - - - - - -
Laboratory Expenses 128.20 165.41 12.15 7.75 264.69 247.10 13.55 1.03
Others 144.80 234.86 7.83 0.49 35.89 16.50 0.30 0.22
Fees 20.63 20.27 - - - - - -
Repairs & Maintenance Bldg 17.24 37.47 - 0.15 2.31 - - -
Total Revenue Expenditure 1,550.21 1,385.59 86.47 56.11 737.01 696.81 233.37 78.56
Capital:
Buildings - 209.43 - - - - -
Plant & Machinery - - - - - 7.59 - -
Handling Equipment - - 17.69 - - - - -
Electrical Equipments - - 96.97 - - 2.25 - -
R & D Equipment’s 55.12 146.77 179.48 - 443.23 94.11 - 23.29
EDP Equipments 11.57 3.41 - - 1.38 0.78 - -
Office Equipments 1.15 2.02 3.84 - 0.31 - - -
Furniture & Fixtures 0.06 0.51 81.78 - 12.69 5.37 - -
Air Conditioners - 0.67 83.35 - 0.33 9.84 - -
Total Capital Expenditure 67.90 153.38 672.54 - 457.94 119.94 - 23.29
1,618.11 1538.97 759.01 56.11 1,194.95 816.75 233.57 101.85
41. Excise Duty under “Other expenses” includes the differential excise duty on closing stock and opening stock of finished goods and excise duty paid on the goods distributed as free goods/medical samples amounting to ` 525.81 lakhs (Previous year ` 461.98 lakhs).
42. EMPLOYEE BENEFITS:a. Defined Contribution Plan
Contribution to defined contribution plan, recognized as expenses for the year are as under: ( ` in lakhs)
Particulars 2016-17 2015-16Employer’s Contribution to Provident Fund & Family Pension Fund 923.28 821.46Employer’s Contribution to Superannuation Fund 205.74 185.17Employer’s Contribution to Employees’ State Insurance Scheme 34.37 30.92
b. Defined Benefit Plan-Gratuity
Gratuity is payable to all eligible employees of the company on retirement, death, permanent disablement and resignation in terms of the provision of the Payment of Gratuity Act, 1972. The benefits would be paid at the time of separation.
( ` in lakhs)
NOTES TO THE STANDALONE FINANCIAL STATEMENTS FOR THE YEAR ENDED ON MARCH 31, 2017 (Contd.)

106
Annual Report 2016-17J. B. Chemicals & Pharmaceuticals Limited
i. Changes in Present Value of defined Benefit Obligation during the year (` in lakhs)
Particulars 2016-17 2015-16Present value of Defined Benefit Obligation at the beginning of the year 3,241.78 2,909.80 Interest Cost 261.61 231.04 Current Service Cost 166.76 157.31 (Benefit Paid From the Fund) (243.11) (112.80)Actuarial (Gains)/Losses on Obligations - Due to Change in Demographic Assumptions - - Actuarial (Gains)/Losses on Obligations - Due to Change in Financial Assumptions 128.29 (29.41)Actuarial (Gains)/Losses on Obligations - Due to Experience 260.59 85.83 Present value of Defined Benefit Obligation at the end of the year 3,815.92 3,241.78
ii. Changes in fair value of plan assets during the year (` in lakhs)Particulars 2016-17 2015-16Fair Value of Plan Assets at the beginning of the year 2,087.86 1,559.51 Interest Income 168.49 123.83 Contributions by the Employer 751.98 508.27 (Benefit Paid from the Fund) (243.11) (112.80)Return on Plan Assets, Excluding Interest Income (24.66) 9.05 Fair Value of Plan Assets at the end of the year 2,740.56 2,087.86
iii. Net (asset)/liability recognized in the balance sheet (` in lakhs)
Particulars 31-3-17 31-3-16Present Value of Benefit Obligation at the end of the year 3,815.92 3,241.78Fair Value of Plan Assets at the end of the year (2,740.56) (2,087.86)Net (asset)/liability recognized in the Balance Sheet 1,075.36 1,153.91Net liability – current (refer note no. 29) 677.31 527.76Net liability – non current (refer note no. 22) 398.05 626.15
iv. Expenses recognized in the statement of profit and loss for the year (` in lakhs)
Particulars 2016-17 2015-16Current Service Cost 166.76 157.31 Net Interest Cost 93.12 107.21 Expenses recognized 259.88 264.52
v. Recognized in other comprehensive income for the year (` in lakhs)
Particulars 2016-17 2015-16Actuarial (Gains)/Losses on Obligations - Due to Change in Financial Assumptions 128.29 (29.41)Actuarial (Gains)/Losses on Obligations - Due to Experience 260.59 85.83 Return on Plan Assets, Excluding Interest Income 24.67 (9.05)Net (Income)/Expense For the period recognized in OCI 413.55 47.38
vi. Actuarial assumptions
Particulars 2016-17 2015-16Expected Return on Plan Assets 7.57% 8.07%Rate of Discounting 7.57% 8.07%Rate of Salary Increase 4.00% 4.00%Rate of Employee Turnover 2.00% 2.00%
NOTES TO THE STANDALONE FINANCIAL STATEMENTS FOR THE YEAR ENDED ON MARCH 31, 2017 (Contd.)

107
Corporate Overview Statutory Reports Standalone Financial Statement Consolidated Financial Statement01-13 14-68 69-123 124-179
vii. Maturity profile of defined benefit obligation ( ` in lakhs)
Particulars 2016-17 2015-16Within 1 year 585.13 511.50 1-2 Year 273.14 248.91 2-3 Year 323.95 274.62 3-4 Year 259.38 311.12 4-5 Year 288.34 275.50 Above 5 Years 1,719.16 1,880.68
viii. Sensitivity analysis for significant assumptions is as below ( ` in lakhs)
Particulars 2016-17 2015-16Projected Benefit Obligation on Current Assumptions 3,815.92 3,241.78 Delta Effect of +1% Change in Rate of Discounting (248.30) (209.90)Delta Effect of -1% Change in Rate of Discounting 284.72 240.39 Delta Effect of +1% Change in Rate of Salary Increase 292.21 247.93 Delta Effect of -1% Change in Rate of Salary Increase (258.58) (219.54)Delta Effect of +1% Change in Rate of Employee Turnover 83.00 83.05 Delta Effect of -1% Change in Rate of Employee Turnover (93.82) (93.51)
ix. Investment details:
The Company made annual contribution to the LIC of an amount advised by the LIC. The Company was not informed by LIC of the investments made or the break-down of the plan assets by investment type.
43. SEGMENT REPORTING:
Operating segments are defined as components of an enterprise for which discrete financial information is available that is evaluated regularly by the decision maker, in assessing the performance and deciding on allocation of resources. The Company’s decision makers are the Chairman and Whole time directors and the Company has only one reportable business segment i.e. ‘Pharmaceuticals’.
44. DEFERRED TAX The major components of deferred tax liabilities and assets arising on account of timing differences are as follows:
As at March 31, 2017 (` in lakhs)
Particulars As at March 31, 2016
Recognized/ reversed
through profit and loss
Recognized in other
comprehensive income
As at March 31, 2017
Tax effect of item constituting deferred tax liabilities
i. Property plant and equipment 3,093.51 1,306.72 - 4,400.23
ii. Fair valuation of financial instruments 2,275.31 (83.44) - 2,191.87
5,368.82 1,223.28 - 6,592.10
Tax effect of item constituting deferred tax assets
i. Employee benefits 568.54 (30.57) 143.12 681.09
ii. MAT credit entitlement 1,351.71 1,572.00 - 2,923.71
iii. Others 242.00 (1,50.05) - 91.95
2,162.25 (1,391.38) 143.12 3,696.75
Net deferred tax liability/ (asset) 3,206.57 (1,68.10) 143.12 2,895.35
NOTES TO THE STANDALONE FINANCIAL STATEMENTS FOR THE YEAR ENDED ON MARCH 31, 2017 (Contd.)

108
Annual Report 2016-17J. B. Chemicals & Pharmaceuticals Limited
As at March 31, 2016 (` in lakhs)Particulars As at March
31, 2015Recognized/
reversed through profit
and loss
Recognized in other
comprehensive income
As at March 31, 2016
Tax effect of item constituting deferred tax liabilities
i. Property plant and equipment 2,902.47 191.04 - 3,093.51
ii. Fair valuation of financial instruments 2,213.42 61.89 - 2,275.315,115.89 252.93 - 5,368.82
Tax effect of item constituting deferred tax assetsi. Employee benefits 619.06 (66.92) 16.40 568.54ii. MAT credit entitlement 1,351.71 - - 1,351.71iii. Others 121.19 120.81 - 242.00
2,091.96 53.89 16.40 2,162.25Net deferred tax liability/(asset) 3,023.93 199.04 16.40 3,206.57
The Company has the following unused tax losses under the head long term capital gain under the Income Tax Act, 1961.Based on the probable uncertainty regarding the set off of these losses, the Company has not recognized deferred tax asset in the Balance Sheet:
Financial Year As atMarch 31, 2017
Expiry Date As atMarch 31, 2016
Expiry Date
2013 – 2014 - - 67.58 March 31, 20222014 – 2015 - - 10.51 March 31, 20232015 – 2016 571.61 March 31, 2024 763.19 March 31, 2024Total 571.61 841.28
45. RELATED PARTY DISCLOSURE
Related party disclosure as required by Ind AS 24, ‘Related Party Disclosures’ notified under Section 133 of the Companies Act, 2013, are given below:
Names and Relationships of the Related Parties:
I Subsidiary Companies:
a. LLC Unique Pharmaceutical Laboratories.b. J.B. Healthcare Pvt. Ltd. (Liquidated on March 2, 2016)c. Unique Pharmaceutical Laboratories FZEd. Biotech Laboratories (Pty.) Ltd. (Through Unique Pharmaceutical Laboratories FZE)
II Associate Concerns/Trusts/Companies with whom transactions have taken place during the year:
a. Mody Trading Company l. Bharti Mody Ventures LLP b. Mody Brothers m. Synit Drugs Pvt. Ltd.c. Jyotindra Family Trust n. Unique Pharmaceutical Laboratories Ltd.d. Dinesh Family Trust o. Ifiunik Pharmaceuticals Ltd. e. Shirish Family Trust p. Namplas Chemicals Pvt. Ltd.f. Biotech Laboratories (Pty.) Ltd. (Upto December 12, 2015) q. Gemma Jewellery Pvt. Ltd.g. J.B. Mody Enterprises LLP r. Lekar Pharma Ltd.h. Ansuya Mody Enterprises LLP s. Jyotindra Mody Ventures LLPi. Dinesh Mody Ventures LLP t. D. B. Mody Entreprises LLPj. Kumud Mody Ventures LLP u. Shirish Mody Property LLPk. Shirish Mody Enterprises LLP
NOTES TO THE STANDALONE FINANCIAL STATEMENTS FOR THE YEAR ENDED ON MARCH 31, 2017 (Contd.)

109
Corporate Overview Statutory Reports Standalone Financial Statement Consolidated Financial Statement01-13 14-68 69-123 124-179
III Key Management Personnel (KMP):
a. Shri Jyotindra B. Mody
b. Shri Dinesh B. Mody
c. Shri Shirish B. Mody
IV Relative of KMP:
a. Mr. Pranabh D. Mody g. Mrs. Priti R. Shah
b. Mrs. Kumud D. Mody h Mr. Nirav S. Mody
c. Mrs. Bharati S. Mody i. Mrs. K. V. Gosalia
d. Mrs. Pallavi B. Mehta j. D. B. Mody-HUF
e. Mrs. Purvi U.Asher k. S. B. Mody-HUF
f. Mrs. Deepali A. Jasani
Following transactions were carried out with related parties:
Name of Related Party Nature of Transaction 2016-17 2015-16(I) Subsidiary Companies:a. LLC Unique Pharmaceutical Laboratories,
Russia Equity Contribution - 1,691.37
b. J.B.Healthcare Pvt. Ltd., Jersey Return of Share Capital on Liquidation 7.42 3,469.23 c. Unique Pharmaceutical Laboratories
FZE,DubaiSale Of goods 5,694.26 4,791.55
Guarantee Commission Income 12.97 13.27 Equity Contribution - 9,354.84 Reimbursement of Expenses 9.51 - O/S Receivable 4,812.43 1,942.73 Corporate Guarantee given to bank for Loan taken
2,594.40 2,650.00
d. Biotech Laboratories (Pty.) Ltd., South Africa Sale of goods 2,334.56 1,015.25 Reimbursement of Expenses - 0.23 O/S Payable 2.16 2.21 O/S Receivable 920.67 1,993.18
(II) Associate Concern / Trusts /Companiesa. Mody Brothers Payment of Rent 9.50 9.50b. Jyotindra Family Trust Payment of Rent 9.89 117.85
Rent deposit refund 11.63 -O/S Receivable 9.50 21.13
c. Dinesh Family Trust Payment of Rent 8.35 59.76Rent deposit refund 4.99 -O/S Receivable 3.50 8.49
d. Shirish Family Trust Payment of Rent 8.35 71.18 Rent deposit refund 4.99 - O/S Receivable 3.50 8.49 e. J. B. Mody Enterprises LLP Payment of Rent - 6.17 Rent deposit refund 1.34 - O/S Receivable - 1.34 f. Dinesh Mody Ventures LLP Payment of Rent - 6.17 Rent deposit refund 1.34 - O/S Receivable - 1.34
NOTES TO THE STANDALONE FINANCIAL STATEMENTS FOR THE YEAR ENDED ON MARCH 31, 2017 (Contd.)

110
Annual Report 2016-17J. B. Chemicals & Pharmaceuticals Limited
Name of Related Party Nature of Transaction 2016-17 2015-16g. Shirish Mody Enterprises LLP Payment of Rent - 6.17 Rent deposit refund 1.34 - O/S Receivable - 1.34 h. Jyotindra Mody Ventures LLP Payment of Rent 254.28 - Rent deposit paid 110.64 - O/S Receivable 110.64 - i. D. B. Mody Enterprises LLP Payment of Rent 254.28 - Rent deposit paid 110.64 - O/S Receivable 110.64 - j. Shirish Mody Property LLP Payment of Rent 254.28 - Rent deposit paid 110.64 - O/S Receivable 110.64 - k. Synit Drugs Pvt. Ltd. Interest on Deposits 4.00 4.00 O/S Payable 40.00 40.00 l. Biotech Laboratories (Pty.) Ltd.
upto 17-12-15Sale of goods - 2,742.33
Reimbursement of Expenses - 0.05 m. Unique Pharmaceutical Laboratories Ltd. Royalty paid 1,131.96 1,132.12 n. Ifiunik Pharmaceuticals Ltd. Interest on Deposits 6.50 6.50 O/S Payable 65.00 65.00 o. Namplas Chemicals Pvt. Ltd. Processing Charges 34.10 76.08 O/S Payable 1.60 9.50 p. LekarPharma Ltd. Sale of goods 153.44 117.56
Purchases of goods 4,324.28 3,960.56 Receipt of Mfg Charges 93.32 65.72 O/S Receivable - 36.69 O/S Payable 286.02 278.11
(III) Key Management Personnel :a. Mr. Jyotindra B. Mody Remuneration 608.55 516.92 Retirement benefit Expenses* 61.03 62.32 b. Mr. Dinesh B. Mody Remuneration 608.55 516.92 Retirement benefit Expenses* 61.03 62.32 c. Mr. Shirish B. Mody Remuneration 608.55 516.92
Retirement benefit Expenses* 61.03 62.32 (IV) Relative of Key Management Personnel :a. Mr. Pranabh D. Mody Remuneration 220.14 195.68 Retirement benefit Expenses* 29.72 26.01 b. Mr. Nirav S. Mody Remuneration 124.38 110.57 Retirement benefit Expenses* 16.79 14.77 c. D. B. Mody - HUF Payment of Rent 1.41 37.19 Rent deposit refund 6.64 - O/S Receivable 6.00 12.64 d. S. B. Mody - HUF Payment of Rent 1.55 37.33 Rent deposit refund 6.64 - O/S Receivable 6.00 12.64
* Excludes provision for compensated leave and gratuity for KMP and Relative of KMP as both liabilities are provided on overall company as not identified separately in actuarial valuation.
NOTES TO THE STANDALONE FINANCIAL STATEMENTS FOR THE YEAR ENDED ON MARCH 31, 2017 (Contd.)

111
Corporate Overview Statutory Reports Standalone Financial Statement Consolidated Financial Statement01-13 14-68 69-123 124-179
46. EARNINGS PER SHARE:
Particulars 2016-17 2015-16Net Profit attributable to Equity Shareholders (` in lakhs) 17,026.03 17,889.31Weighted Average No. of Equity shares (No’s)Basic 8,48,19,975 8,48,16,002Diluted 8,48,19,975 8,48,16,002 Nominal value of equity shares (`) 2.00 2.00Earnings per share (`)Basic 20.07 21.09Diluted 20.07 21.09
47. CSR EXPENDITUREGross amount required to be spent during the year ` 346.39 lakhs .
Amount spent during the year ` 265.23 lakhs as detailed hereunder: (` in lakhs)
Particulars 2016-17 2015-16Promoting Healthcare including preventive healthcare 111.97 164.28Promotion of Education 152.75 76.00Eradication of Poverty and malnutrition 0.51 3.30
48. As required under section 186(4) of the Companies Act, 2013, the particulars of loans and guarantees given and investments made during the year are as follows :
(` in lakhs unless otherwise stated)Name of entity Nature of transaction and
material termsPurpose for which loan / guarantee proposed to be utilized by the
recipient
2016-17 2015-16
Unique Pharmaceutical Laboratories FZE, a wholly owned subsidiary
Subscription to equity capital - - 9,354.84
OOO Unique Pharmaceutical Laboratories, a wholly owned subsidiary
Subscription to equity capital - - 1,691.37
Unique Pharmaceutical Laboratories LLC, a wholly owned subsidiary
Subscription to equity capital - - -
Unique Pharmaceutical Laboratories FZE, a wholly owned subsidiary
Corporate guarantee. Guarantee commission charged @ 0.50 %.
Guarantee given to facilitate borrowing from bank by the subsidiary for meeting working capital needs.
USD 4 million
USD 4 million
Mukand Ltd. Inter-corporate deposit @ 16.25 % p.a. for a period of 90 days.
For meeting temporary working capital needs.
- 50.00
49. FINANCIAL RISK MANAGEMENT OBJECTIVES AND POLICIESThe Company’s financial liabilities comprise mainly of borrowings, trade payables and other payables. The Company’s financial assets comprise mainly of investments, cash and cash equivalents, other balances with banks, loans, trade receivables and other receivables.
NOTES TO THE STANDALONE FINANCIAL STATEMENTS FOR THE YEAR ENDED ON MARCH 31, 2017 (Contd.)

112
Annual Report 2016-17J. B. Chemicals & Pharmaceuticals Limited
Company has exposure to following risks arising from financial instruments:
a) Credit risk
b) Liquidity risk
c) Market risk
Risk management framework
Company’s board of directors has overall responsibility for establishment of Company’s risk management framework. Management is responsible for developing and monitoring Company’s risk management policies, under the guidance of Audit Committee. Management identifies, evaluates and analyses the risks to which the Company is exposed to and set appropriate risk limits and controls to monitor risks and adherence to limits.
Management periodically reviews its risk policy and systems to assess need for changes in the policies to adapt to the changes in market conditions and align the same to the business of the Company. Management through its interaction and training to concerned employees aims to maintain a disciplined and constructive control environment in which concerned employees understand their roles and obligations. The Audit committee oversees how management monitors compliance with Company’s risk management policies and procedures, and reviews the adequacy of the risk management framework in relation to the risks to which Company is exposed. The Audit committee is assisted in its role by the internal auditor wherever required. Internal auditor undertakes both regular and adhoc reviews of risk management controls and procedures, the results of which are reported to the Audit committee.
a) Credit risk:
Credit risk is the risk that a counter party will not meet its obligations under a financial instrument or customer contract, leading to a financial loss. Company is exposed to credit risk from its operating activities (primarily trade receivables) and from its financing activities, including deposits with banks, mutual funds and financial institutions, foreign exchange transactions and other financial instruments.
The Company has adopted a policy of only dealing with counterparties that have sufficiently high credit standards and financial strength. The Company’s exposure and credit ratings of its counterparties are continuously monitored and the aggregate value of transactions is reasonably spread amongst the several counterparties.
Credit risk arising from derivative financial instruments and other balances with banks is limited and there is no collateral held against these because the counterparties are banks and recognised financial institutions with high credit ratings assigned by the reputed credit rating agencies.
As regards, credit risk for investment in mutual funds, the Company limits its exposure to credit risk by investing mainly in debt securities issued by mutual funds which are of high credit ranking from rating agency like CRISIL or the equivalent rating agency. Company monitors changes in credit risk by tracking published external credit ranking. Based on its on-going assessment of counterparty risk, Company adjusts its exposure to various counterparties from time to time.
Credit risk from Trade receivables is managed by the Company’s established policy, procedures and control relating to customer credit risk management. Trade receivables are mainly from stockists, distributors and direct customers and are non-interest bearing. Trade receivables generally ranges from 30 - days to 180 - days credit term. Credit limits are established for all customers based on internal criteria and any deviation in credit limit require approval of Head of the department and / or Directors depending upon the quantum and overall business risk. Majority of the customers have been doing business with the company for more than 3 years and they are being monitored by individual business managers who deals with those customers. Management monitors trade receivables on regular basis and take suitable action where needed to control the receivables crossing set criteria / limits. Also, in case of international business, particularly new customers, management reviews the business risk by evaluating economic situation of the country and the customers and generally starts the relation either on advance payment or on the basis of confirmed irrevocable letter of credit.
NOTES TO THE STANDALONE FINANCIAL STATEMENTS FOR THE YEAR ENDED ON MARCH 31, 2017 (Contd.)

113
Corporate Overview Statutory Reports Standalone Financial Statement Consolidated Financial Statement01-13 14-68 69-123 124-179
Management does an impairment analysis at each reporting date on an individual basis for major clients. In addition, a large number of minor receivables are grouped into homogenous groups and assessed for impairment collectively. Further, the Company’s customers base is widely distributed both economically as well as geographically and in view of the same, the quantum risk also gets spread across wide base and hence management considers risk with respect to trade receivable as low.
For trade receivables, as a practical expedient, the Company computes credit loss allowance based on a provision matrix. The provision matrix is prepared based on historically observed default rates over the expected life of trade receivables and is adjusted for forward-looking estimates.
Expected credit loss for trade receivables under simplified approach as at the end of each reporting period is as follows:
(` in lakhs)
ParticularsAs at
March 31, 2017
As atMarch 31,
2016
As atApril 1,
2015Gross carrying amount 26,786.81 27,007.54 24,638.72Expected credit loss at simplified approach 277.29 440.75 244.30Carrying amount of trade receivables (net of impairment) 26,509.52 26,566.79 24,394.42
b) Liquidity risk:
Liquidity risk is the risk that Company may not be able to meet its present and future cash and collateral obligations without incurring unacceptable losses. Company’s objective is to, at all times maintain optimum levels of liquidity to meet its cash and collateral requirements. Company closely monitors its liquidity position and deploys a robust cash management system.
The Company has an established liquidity risk management framework for managing its short term, medium term and long term funding and liquidity management requirements. The Company manages the liquidity risk by maintaining adequate funds in cash and cash equivalents. The Company also has adequate credit facilities agreed with banks to ensure that there is sufficient cash or cash equivalent available to meet all its normal operating commitments in a timely and cost-effective manner. Working capital requirements are adequately addressed by internally generated funds. Trade receivables are kept within manageable levels. Company aims to maintain the level of its cash and cash equivalents and other highly marketable debt investments at an amount in excess of expected cash outflows on financial liabilities over the next three to six months.
c) Market risk:
Market risk is the risk that the fair value of future cash flows of a financial instrument will fluctuate because of changes in market prices. Market risk comprises three types of risks;
i. interest rate risk
ii. currency risk and;
iii. Equity price risk.
Financial instruments affected by market risk includes borrowings, investments, trade payables, trade receivables, loans and derivative financial instruments.
The objective of market risk management is to manage and control market risk exposures within acceptable parameters, while optimizing the return.
i. Interest rate risk:
Interest rate risk is the risk that the fair value or future cash flows of a financial instrument will fluctuate because of changes in market interest rates. Since the Company has insignificant interest bearing borrowings, the exposure to risk of changes in market interest rates is very low. The Company has not used any interest rate derivatives.
ii. Foreign currency risk:
Foreign currency risk is the risk that the fair value or future cash flows of an exposure will fluctuate due to changes
NOTES TO THE STANDALONE FINANCIAL STATEMENTS FOR THE YEAR ENDED ON MARCH 31, 2017 (Contd.)

114
Annual Report 2016-17J. B. Chemicals & Pharmaceuticals Limited
in foreign exchange rates. Primarily, the exposure in foreign currencies are denominated in USD, EURO and Rubles. At any point in time, Company covers foreign currency risk by taking appropriate percentage of its net foreign currency exposure by entering into forward exchange contracts on past performance basis mostly with a maturity of less than one year from the reporting date. In respect of monetary assets and liabilities denominated other than in USD, EURO and Ruble, Company’s policy is to ensure that its net exposure is kept to an acceptable level by buying or selling foreign currencies at spot rates when necessary to address short-term imbalances.
All such hedged transactions are carried out within the guidelines set by the risk management committee. The Company does not enter into any derivative instruments for trading or speculative purposes.
The carrying amounts of the Company’s foreign currency denominated monetary items are as follows:
(` in lakhs)Currency Liabilities Assets
As at March 31,
2017
As at March 31,
2016
As at April 1,
2015
As at March 31,
2017
As at March 31,
2016
As at April 1,
2015USD 4,929.36 17,397.43 8,804.51 14,371.48 17,024.65 35,094.60EURO - - - 2,937.22 3,317.97 2,725.96AUD 32.24 43.39 17.52 940.49 947.46 749.11RUBLE 138.00 - - 3,499.42 733.34 -Others - 4.84 4.32 261.01 362.63 13.58
Details of Hedged exposure in foreign currency denominated monetary items
The Company enters into forward exchange contracts to hedge against its foreign currency exposure relating to the underlying transactions and based on past performance. The Company does not enter into any derivative instruments for trading or speculative purpose.
The forward exchange contracts used for hedging foreign currency exposure and outstanding as at reporting date are as under:
Currency As at March 31, 2017 As at March 31, 2016
As at April 1, 2015
F.C. (in Mn.)
` in lakhs F.C. (in Mn.)
` in lakhs F.C. (in Mn.)
` in lakhs
Forward contract to sell USD 2.00 1,297.20 21.00 13,912.50 27.12 16,950.11
Forward contract to sell EURO 0.50 347.97 - - - -
Forward contract to sell RUBLE - - 48.00 470.40 - -
Forward contract to buy USD 1.55 1,004.72 - - - -
Details of Unhedged exposure in foreign currency denominated monetary items:
Currency As at March 31, 2017 As at March 31, 2016 As at April 1, 2015
F.C. (in Mn.)
` in lakhs F.C. (in Mn.)
` in lakhs F.C. (in Mn.)
` in lakhs
RECEIVABLE:
USD 20.16 13,074.28 4.70 3,112.15 29.03 18,144.49
EURO 3.72 2,589.25 4.40 3,317.97 4.06 2,725.96
AUD 1.90 940.49 1.86 947.46 1.58 749.11
RUBLE 304.30 3,499.42 26.83 262.94 - -
Others 1.27 261.01 1.81 362.63 0.01 13.58
NOTES TO THE STANDALONE FINANCIAL STATEMENTS FOR THE YEAR ENDED ON MARCH 31, 2017 (Contd.)

115
Corporate Overview Statutory Reports Standalone Financial Statement Consolidated Financial Statement01-13 14-68 69-123 124-179
Currency As at March 31, 2017 As at March 31, 2016 As at April 1, 2015
F.C. (in Mn.)
` in lakhs F.C. (in Mn.)
` in lakhs F.C. (in Mn.)
` in lakhs
PAYABLE:
USD 6.05 3,924.64 26.26 17,397.43 14.09 8,804.51
AUD 0.07 32.24 0.09 43.39 0.04 17.52
RUBLE 12.00 138.00 - - - -
Others - - 0.82 4.84 0.01 4.32
The Company is mainly exposed to changes in USD, EURO and RUBLE. The below table demonstrates the sensitivity to a 1% increase or decrease in the USD, EURO and RUBLE against INR, with all other variables held constant. The sensitivity analysis is prepared on the net unhedged exposure of the Company as at the reporting date. 1% represents management’s assessment of reasonably possible change in foreign exchange rate.
(` in lakhs)
ParticularsCurrency As at
March 31, 2017
As atMarch 31,
2016
As atApril 1,
2015
1% Depreciation in INR USD 91.50 (138.32) 93.39
1% Appreciation in INR USD (91.50) 138.32 (93.39)
1% Depreciation in INR EURO 12.16 11.77 19.80
1% Appreciation in INR EURO (12.16) (11.77) (19.80)
1% Depreciation in INR RUBLE 33.61 2.63 -
1% Appreciation in INR RUBLE (33.61) (2.63) -
iii. Equity Price risk:
Company does not have any exposure to equity price risk, as there is no major investment in equity except in its own subsidiaries and accordingly, exposure to risk of changes in price is very low.
50. CAPITAL MANAGEMENT:For the purpose of the Company’s capital management, capital includes issued equity share capital, share premium and all other equity reserves attributable to the equity holders of the Company. The primary objective of the Company’s capital management is to safeguard the Company’s ability to remain as a going concern and to maintain and optimal capital structure so as to maximise shareholder’s value.
The Company manages its capital structure and makes adjustments in light of changes in economic conditions, annual operating plans and long term and other strategic investment plan. To maintain or adjust the capital structure, the Company may adjust the dividend payment to shareholders, return capital to shareholders or buy-back of shares. The current capital structure of the Company is equity based with low financing through borrowings. The Company is not subject to any externally imposed capital requirement.
No changes were made in the objectives, policies or processes for managing capital during the year ended March 31, 2017 and March 31, 2016.
NOTES TO THE STANDALONE FINANCIAL STATEMENTS FOR THE YEAR ENDED ON MARCH 31, 2017 (Contd.)

116
Annual Report 2016-17J. B. Chemicals & Pharmaceuticals Limited
51. FAIR VALUE MEASUREMENTA) The carrying value and Fair value of Financial assets and liabilities by categories are as follows :
(` in lakhs)
ParticularsCarrying value of the financial assets/
liabilitiesFair value of the financial assets/
liabilities
As at March 31,
2017
As at March 31,
2016
As at April 1,
2015
As at March 31,
2017
As at March 31,
2016
As at April 1,
2015
Financial Assets at amortized cost (non-current)
Investment in Government securities
0.29 0.29 0.41 0.29 0.29 0.41
Loans 30.43 15.34 17.83 30.43 15.34 17.83
Other financial assets 648.77 501.16 481.09 648.77 501.16 481.09
Financial Assets at amortized cost (current)
Trade receivables 26,509.52 26,566.79 24,394.42 26,509.52 26,566.79 24,394.42
Cash and cash equivalent 719.71 1,070.58 859.03 719.71 1,070.58 859.03
Loans 44.32 56.51 20.20 44.32 56.51 20.20
Other financial assets 95.57 177.03 371.99 95.57 411.45 781.53
Financial liabilities at amortized cost (non-current)
Borrowings - - 40.00 - - 40.00
Financial liabilities at amortized cost (current)
Borrowings 4,886.03 17,440.19 10,472.97 4,886.03 17,440.19 10,472.97
Trade payables 7,903.47 6,860.93 6,230.76 7,903.47 6,860.93 6,230.76
Others 10,781.95 11,504.18 7,986.76 10,977.95 11,504.18 7,986.76
Financial Assets at Fair value through profit & loss (non-current)
Investment 18,583.91 23,141.26 21,323.98 18,583.91 23,141.26 21,323.98
Financial Assets at Fair value through profit & loss (current)
Investment 22,496.16 24,728.31 43,430.52 22,496.16 24,728.31 43,430.52
Forward contract receivable
- 234.42 409.54 - - -
Financial Liabilities at Fair value through profit & loss (current)
Forward contract payable 196.00 - - 196.00 - -
NOTES TO THE STANDALONE FINANCIAL STATEMENTS FOR THE YEAR ENDED ON MARCH 31, 2017 (Contd.)

117
Corporate Overview Statutory Reports Standalone Financial Statement Consolidated Financial Statement01-13 14-68 69-123 124-179
B) Level wise disclosures of financial assets and liabilities by categories are as follows :
(` in lakhs)Particulars As at
March 31, 2017
As at March 31,
2016
As at April 1,
2015
Level Valuation techniques and key inputs
Financial Assets at amortized cost (non-current)Deposit for premises 295.81 86.11 79.17 3 Discounted cash flow method
using interest rate for similar financial instrument.
Financial Assets at amortized cost (current)
Deposit for premises 21.66 6.81 7.24 3 Discounted cash flow method using interest rate for similar financial instrument.
Financial Assets at Fair value through profit & loss (non-current)
Investment in Mutual Fund 17,680.56 22,345.13 20,606.20 1 Quoted NAV in active markets.Investment in Equity shares 903.35 796.13 717.78 3 Value based on the latest
offer price with one of the items in the list on account of transfer restriction and other items being the statutory contribution nature, as per the value appearing in the books.
Financial Assets at Fair value through profit & loss (current)
Investment in Mutual Fund 22,496.16 24,728.31 43,430.52 1 Quoted NAV in active markets.Forward contract receivable - 234.42 409.54 2 Forward contracts are valued
using readily available information from the banks.
Financial Liabilities at Fair value through profit & loss (current)
Forward contract payable 196.00 - - 2 Forward contracts are valued using readily available information from the banks.
Fair value of cash and cash equivalents, short term loans, trade receivables, trade payables, other financial assets/liabilities approximate their carrying amounts largely due to the short term maturities of these instruments. Methods and assumptions used to estimate the fair values are consistent with those used for the year ended March 31, 2016.
During the reporting period ended March 31, 2017 and March 31, 2016, there were no transfers between level 1, level 2 and level 3 fair value measurements.
A one percentage point change in the unobservable inputs used in fair valuation of level 3 assets or liabilities does not have significant input in its value.
52. EVENTS AFTER THE REPORTING PERIODThe board of directors have recommended dividend of ` 1/- per fully paid up equity shares of ` 2/- each amounting to ` 848.19 lakhs plus ` 172.67 lakhs dividend distribution tax for the financial year 2016-17, which is based on relevant share capital as on March 31, 2017. The actual dividend amount will be dependent on the relevant share capital outstanding as on record date / book closure.
NOTES TO THE STANDALONE FINANCIAL STATEMENTS FOR THE YEAR ENDED ON MARCH 31, 2017 (Contd.)
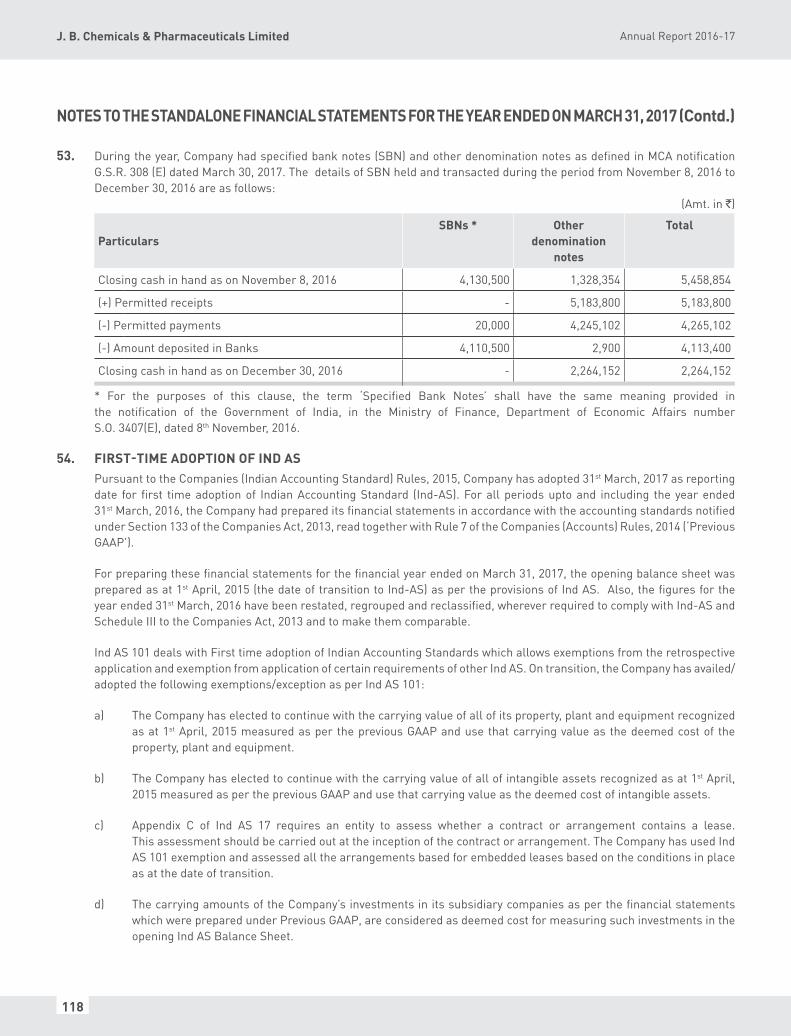
118
Annual Report 2016-17J. B. Chemicals & Pharmaceuticals Limited
53. During the year, Company had specified bank notes (SBN) and other denomination notes as defined in MCA notification G.S.R. 308 (E) dated March 30, 2017. The details of SBN held and transacted during the period from November 8, 2016 to December 30, 2016 are as follows:
(Amt. in `)
ParticularsSBNs * Other
denomination notes
Total
Closing cash in hand as on November 8, 2016 4,130,500 1,328,354 5,458,854
(+) Permitted receipts - 5,183,800 5,183,800
(-) Permitted payments 20,000 4,245,102 4,265,102
(-) Amount deposited in Banks 4,110,500 2,900 4,113,400
Closing cash in hand as on December 30, 2016 - 2,264,152 2,264,152
* For the purposes of this clause, the term ‘Specified Bank Notes’ shall have the same meaning provided in the notification of the Government of India, in the Ministry of Finance, Department of Economic Affairs number S.O. 3407(E), dated 8th November, 2016.
54. FIRST-TIME ADOPTION OF IND ASPursuant to the Companies (Indian Accounting Standard) Rules, 2015, Company has adopted 31st March, 2017 as reporting date for first time adoption of Indian Accounting Standard (Ind-AS). For all periods upto and including the year ended 31st March, 2016, the Company had prepared its financial statements in accordance with the accounting standards notified under Section 133 of the Companies Act, 2013, read together with Rule 7 of the Companies (Accounts) Rules, 2014 (‘Previous GAAP’).
For preparing these financial statements for the financial year ended on March 31, 2017, the opening balance sheet was prepared as at 1st April, 2015 (the date of transition to Ind-AS) as per the provisions of Ind AS. Also, the figures for the year ended 31st March, 2016 have been restated, regrouped and reclassified, wherever required to comply with Ind-AS and Schedule III to the Companies Act, 2013 and to make them comparable.
Ind AS 101 deals with First time adoption of Indian Accounting Standards which allows exemptions from the retrospective application and exemption from application of certain requirements of other Ind AS. On transition, the Company has availed/adopted the following exemptions/exception as per Ind AS 101:
a) The Company has elected to continue with the carrying value of all of its property, plant and equipment recognized as at 1st April, 2015 measured as per the previous GAAP and use that carrying value as the deemed cost of the property, plant and equipment.
b) The Company has elected to continue with the carrying value of all of intangible assets recognized as at 1st April, 2015 measured as per the previous GAAP and use that carrying value as the deemed cost of intangible assets.
c) Appendix C of Ind AS 17 requires an entity to assess whether a contract or arrangement contains a lease. This assessment should be carried out at the inception of the contract or arrangement. The Company has used Ind AS 101 exemption and assessed all the arrangements based for embedded leases based on the conditions in place as at the date of transition.
d) The carrying amounts of the Company’s investments in its subsidiary companies as per the financial statements which were prepared under Previous GAAP, are considered as deemed cost for measuring such investments in the opening Ind AS Balance Sheet.
NOTES TO THE STANDALONE FINANCIAL STATEMENTS FOR THE YEAR ENDED ON MARCH 31, 2017 (Contd.)

119
Corporate Overview Statutory Reports Standalone Financial Statement Consolidated Financial Statement01-13 14-68 69-123 124-179
e) The Company has elected not to apply Ind AS 103 - Business Combinations, retrospectively to past business combinations that occurred before 1st April, 2015. Consequent to use of this exemption from retrospective application:
• The carrying amounts of assets and liabilities acquired pursuant to past business combinations and recognized in the financial statements prepared under Previous GAAP, are considered to be the deemed cost under Ind AS, on the date of acquisition. On the date of transition, measurement of such assets and liabilities is in accordance with respective Ind AS. Also, there is no change in classification of such assets and liabilities;
• The Company has not recognized assets and liabilities that neither were recognized in the financial statements prepared under Previous GAAP nor qualify for recognition under Ind AS in the Balance Sheet of the acquiree;
• The Company excluded from its opening Ind AS Balance sheet as at April 1, 2015, those assets and liabilities which were recognized in accordance with Previous GAAP but do not qualify for recognition as an asset or liability under Ind AS.
f) The requirement of Ind AS 20 - Accounting for Government Grants and Disclosure of Government Assistance is opted to be applied prospectively to all grants received after the date of transition to Ind AS.
g) The Company is allowed to apply Ind AS 102 ‘Share Based Payment’ to equity instruments that remain unvested as of transition date. Accordingly, the Company has not applied Ind AS 102 to equity instruments in Share Based Payment transactions pertaining to Employee’s stock option scheme that vested before April 1, 2015.
Reconciliations of Balance Sheet (` in lakhs)
Particulars Note Balance Sheet as at April 1, 2015 Balance Sheet as at March 31, 2016
Amount as per IGAAP
Effects of Transition to Ind AS
Amount as per Ind AS
Amount as per IGAAP
Effects of Transition to Ind AS
Amount as per Ind AS
ASSETS
Non-current assets
(a) Property, Plant and Equipment
A 29,961.91 - 29,961.91 36,779.09 17.85 36,796.94
(b) Capital work-in-progress A 5,464.69 - 5,464.69 13,052.33 366.19 13,418.52
(c) Other Intangible assets 125.05 - 125.05 138.45 - 138.45
(d) Intangible assets under development
52.44 - 52.44 70.48 - 70.48
(e) Financial Assets
(i) Investments B 23,071.57 2,841.15 25,912.72 31,779.80 4,658.43 36,438.23
(ii) Trade receivables - - - - - -
(iii) Loans 17.83 - 17.83 15.34 - 15.34
(iv) Others C 481.41 (0.32) 481.09 501.79 (0.63) 501.16
(f) Other non-current assets 1,220.39 - 1,220.39 1,779.63 - 1,779.63
TOTAL non-current assets 60,395.29 2,840.83 63,236.12 84,116.91 5,041.84 89,158.75
NOTES TO THE STANDALONE FINANCIAL STATEMENTS FOR THE YEAR ENDED ON MARCH 31, 2017 (Contd.)

120
Annual Report 2016-17J. B. Chemicals & Pharmaceuticals Limited
Particulars Note Balance Sheet as at April 1, 2015 Balance Sheet as at March 31, 2016
Amount as per IGAAP
Effects of Transition to Ind AS
Amount as per Ind AS
Amount as per IGAAP
Effects of Transition to Ind AS
Amount as per Ind AS
Current assets
(a) Inventories 12,847.40 - 12,847.40 13,329.31 - 13,329.31
(b) Financial assets
(i) Investments B 36,678.17 6,752.35 43,430.52 19,524.97 5,203.34 24,728.31
(ii) Trade receivables 24,394.42 - 24,394.42 26,566.79 - 26,566.79
(iii) Cash and cash equivalents 859.03 - 859.03 1,070.58 - 1,070.58
(iv) Loans 20.20 - 20.20 56.51 - 56.51
(v) Others D 826.62 (45.09) 781.53 412.56 (1.11) 411.45
(c) Other current assets 8,116.41 - 8,116.41 8,811.79 - 8,811.79
TOTAL current assets 83,742.25 6,707.26 90,449.51 69,772.50 5,202.23 74,974.74
Total Assets 144,137.54 9,548.09 153,685.63 153,889.42 10,244.07 164,133.49
EQUITY AND LIABILITIES
Equity
(a) Equity Share capital 1,696.16 - 1,696.16 1,696.40 - 1,696.40
(b) Other Equity A to H 99,934.99 21,624.91 121,559.90 112,478.57 8,095.57 120,574.14
Total Equity 101,631.15 21,624.91 123,256.06 114,174.97 8,095.57 122,270.54
Liabilities
Non-current liabilities
(a) Financial Liabilities
(i) Borrowings 40.00 - 40.00 - - -
(b) Provisions 1,202.60 - 1,202.60 1,020.11 - 1,020.11
(c) Deferred tax liabilities (Net) H 810.51 2,213.42 3,023.93 931.26 2,275.31 3,206.57
(d) Other non-current liabilities A - - - - 380.60 380.60
TOTAL non-current liabilities 2,053.11 2,213.42 4,266.53 1,951.37 2,655.91 4,607.28
Current liabilities
(a) Financial liabilities
(i) Borrowings 10,472.97 - 10,472.97 17,440.19 - 17,440.19
(ii) Trade payables 6,230.76 - 6,230.76 6,860.93 - 6,860.93
(iii) Other financial liabilities 7,986.76 - 7,986.76 11,504.18 - 11,504.18
(b) Other current liabilities A 273.16 - 273.16 395.77 3.02 398.79
(c) Provisions E 14,876.41 (14,290.24) 586.17 1,133.13 (510.44) 622.69
(d) Current tax liabilities (Net) 613.22 - 613.22 428.89 - 428.89
TOTAL current liabilities 40,453.28 (14,290.24) 26,163.04 37,763.09 (507.42) 37,255.67
Total Equity and Liabilities 144,137.54 9,548.09 153,685.63 153,889.43 10,244.07 164,133.49
NOTES TO THE STANDALONE FINANCIAL STATEMENTS FOR THE YEAR ENDED ON MARCH 31, 2017 (Contd.)
(` in lakhs)

121
Corporate Overview Statutory Reports Standalone Financial Statement Consolidated Financial Statement01-13 14-68 69-123 124-179
Reconciliation of total comprehensive income: (` in lakhs)
Particulars Note Year ended March 31, 2016
Amount as per IGAAP
Effects of Transition to Ind AS
Amount as per Ind AS
INCOME:
Revenue From Operations A,F 114,816.77 1,676.80 116,493.57
Other Income B,C 5,292.39 275.21 5,567.60
Total Income 120,109.16 1,952.01 122,061.17
EXPENSES:
Cost of materials consumed 37,307.84 - 37,307.84
Purchases of Stock-in-trade 8,254.88 - 8,254.88
Changes in inventories of finished goods, Stock-in-trade and work-in-progress
(684.05) - (684.05)
Employee benefits expense G 16,750.56 (154.59) 16,595.97
Finance costs G 922.27 107.21 1,029.48
Depreciation and amortization expense A 4,040.56 0.31 4,040.87
Other expenses A,C,D,F 30,807.50 1,639.34 32,446.84
Total expenses 97,399.56 1,592.27 98,991.83
Profit/(loss) before tax 22,709.60 359.74 23,069.34
Tax expense:
(1) Current tax 4,950.00 - 4,950.00
(2) Deferred tax H 120.75 78.30 199.05
Profit/(loss) for the year 17,638.85 281.44 17,920.29
Other Comprehensive IncomeRe-measurement of net defined benefit plan (net of deferred tax) G - (30.98) (30.98)
Total Comprehensive Income for the year 17,638.85 250.46 17,889.31
Reconciliation of total equity: (` in lakhs)
Particulars Note As at March 31, 2016
As at April 1, 2015
Total equity (shareholder's funds) as per previous GAAP 114,174.97 101,631.15
Adjustments:
Fair valuation of Investments under Ind AS (net of tax) B 7,586.45 7,380.08
Forward contracts measured at fair value D (1.11) (45.09)
Effect of measuring of security deposit at fair value C (0.63) (0.32)
Proposed Dividend including Dividend distribution tax E 510.44 14,290.24
Government grant (net of depreciation on relevant assets) A 0.42 -
Total adjustment to equity 8,095.57 21,624.91
Total Equity under Ind AS 122,270.54 123,256.06
NOTES TO THE STANDALONE FINANCIAL STATEMENTS FOR THE YEAR ENDED ON MARCH 31, 2017 (Contd.)

122
Annual Report 2016-17J. B. Chemicals & Pharmaceuticals Limited
FOOTNOTESA. Government Grant:
Under Indian GAAP, the Company had adjusted the Government Grant related to Export Promotion Capital Goods (EPCG) scheme availed by the Company to the cost of fixed assets and the exports obligation was disclosed in the notes to financial statements whereas under Ind AS, the Company has recognized the Grant as a deferred revenue which is proportionately amortized to statement of profit and loss on the basis of actual exports made by the Company. The net impact on account of the same is increase in property, plant and equipment / Capital Work in Progress by ` 384.35 lakhs as at March 31, 2016 and increase in government grant by ` 400.84 lakhs as at March 31, 2016. Out of the grant of ` 400.84 lakhs, ` 17.22 lakhs (` 16.49 lakhs on account of stores and ` 0.73 lakhs on account of fixed assets) is transferred to the income of the year and balance is treated as deferred income and depreciation of ` 0.31 lakhs is recognized in the statement of profit or loss.
B. Investment in Mutual Fund & Equity Shares:
Under Indian GAAP, the Company accounted for long term investments in unquoted and quoted equity shares and Mutual fund as Investment measured at cost less provision for other than temporary diminution in the value of investments and for current investment cost or market value whichever is lower. Under Ind AS, the Company has designated such investments as FVTPL investments. The difference between the instruments fair value and Indian GAAP carrying amount of ` 9,593.50 lakhs as at transition date and ` 268.27 lakhs as at 31 March, 2016 has been recognized net of related corresponding deferred taxes of ` 2,213.42 lakhs and ` 61.90 lakhs in the retained earnings and in the statement of profit and loss respectively.
C. Security Deposit under lease contract:
Under Indian GAAP, the Company had accounted for financial Assets (primarily security deposit) at the undiscounted amount whereas under Ind AS, such financial assets are recognized at present value. Accordingly, security deposits and profit before tax are decreased by ` 0.31 lakhs net (` 7.25 lakhs as lease rent and `6.94 lakhs as interest on present value of deposit) as at March 31, 2016 and such security deposits and retained earnings are decreased by ` 0.32 lakhs net (` 3.59 lakhs as lease rent and ` 3.27 lakhs as interest on present value of deposit) as at April 1, 2015.
D. Forward Contract to hedge foreign currency risk:
The foreign exchange forward contract is recognized under Ind AS at the fair value, which was not recognized under Indian GAAP. The effect of this change resulting into decrease of ` 45.09 lakhs and ` 1.11 lakhs, in the retained earnings as at April 1, 2015 and in the statement of profit and loss for the year ended March 31, 2016.
E. Proposed Dividend:
Under Indian GAAP, proposed dividends including dividend distribution tax are recognized as a liability in the period to which they relate, irrespective of when they are declared. Under Ind AS, a proposed dividend is recognized as a liability in the period in which it is declared by the Company (usually when approved by shareholders in a general meeting) or paid. The effect of this change is an increase in the retained earnings as on April 1, 2015 by ` 14,290.24 lakhs and as on March 31, 2016 by ` 510.44 lakhs.
F. Excise Duty :
Excise duty of ` 1,659.58 lakhs on account of sale of goods has been included in revenue as it is on own account because, it is liability of the manufacturer which forms part of the production, irrespective of whether goods are sold or not.
G. Defined Benefit Liabilities:
Under Indian GAAP, the entire cost, including actuarial gains and losses, are charged to the statement of profit or loss. Under Ind AS, re-measurements comprising of actuarial gains and losses and the return on plan assets excluding amounts included in net interest on the net defined benefit liability are recognized immediately in the balance sheet with a corresponding debit or credit to retained earnings through OCI. Actuarial loss of ` 30.98 lakhs as at 31 March, 2016 is recognized in OCI net of deferred tax.
NOTES TO THE STANDALONE FINANCIAL STATEMENTS FOR THE YEAR ENDED ON MARCH 31, 2017 (Contd.)

123
Corporate Overview Statutory Reports Standalone Financial Statement Consolidated Financial Statement01-13 14-68 69-123 124-179
H. Deferred tax
Under Indian GAAP, deferred tax is accounted using the income statement approach as per timing differences between taxable profits and accounting profits for the period. Ind AS 12 requires accounting for deferred taxes using the balance sheet approach as per temporary differences between the carrying amount of an asset or liability in the balance sheet and its tax base. The application of Ind AS 12 approach has resulted in recognition of deferred tax on new temporary differences which was not required under Indian GAAP. In addition, the various transitional adjustments lead to temporary differences as on the transition date. The net impact of ` 2,213.42 lakhs as at April 1, 2015 and ` 61.90 lakhs as at March 31, 2016 on deferred tax liabilities on the transitional adjustments is recognized in retained earnings and to the statement of profit and loss respectively.
I. Other comprehensive income:
Under Indian GAAP, the Group has not presented other comprehensive income (OCI) separately. Hence, it has reconciled Indian GAAP profit or loss to total comprehensive income as per Ind AS.
J. Statement of cash flows
The transition from Indian GAAP to Ind AS has not had a material impact on the statement of cash flows.
55. Figures of previous year have been re-grouped, rearranged and recast, wherever considered necessary. Figures in brackets indicate corresponding figures of previous year.
As per our report of even date For and on behalf of the Board of Directors
For J. K. Shah & Co. J.B. Mody D.B. ModyChartered Accountants Chairman & Managing Director Whole time Director (Administration)
J.K. Shah S. B. Mody Vijay D. BhattPartner Whole time Director (Marketing) Chief Financial Officer
Place : Mumbai Place : Mumbai M. C. MehtaDate : May 23, 2017 Date : May 23, 2017 Company Secretary
NOTES TO THE STANDALONE FINANCIAL STATEMENTS FOR THE YEAR ENDED ON MARCH 31, 2017 (Contd.)

124
Annual Report 2016-17J. B. Chemicals & Pharmaceuticals Limited
INDEPENDENT AUDITORS’ REPORT
To the members of J.B. Chemicals & Pharmaceuticals Limited
Report on the Consolidated Ind AS Financial Statements
We have audited the accompanying consolidated Ind AS financial statements of J. B. Chemicals & Pharmaceuticals Limited (“the Holding Company”) and its subsidiaries (collectively referred to as the “Company” or “the JBCPL Group”), comprising of the Consolidated Balance Sheet as at 31st March, 2017, the Consolidated Statement of Profit and Loss (including other comprehensive income), the Consolidated statement of Cash Flows and the consolidated statement of changes in equity for the year then ended, and a summary of the significant accounting policies and other explanatory information (hereinafter referred to as “the consolidated Ind AS financial statements”).
Management’s Responsibility for the Consolidated Financial Statements
The Holding Company’s Board of Directors is responsible for the preparation of these consolidated Ind AS financial statements in terms of the requirements of the Companies Act, 2013 (“the Act”) that give a true and fair view of the consolidated financial position, consolidated financial performance including other comprehensive income, consolidated cash flows and consolidated changes in equity of the JBCPL Group in accordance with the accounting principles generally accepted in India, including the Accounting Standards (Ind AS) prescribed under section 133 of the Act read with relevant rules issued thereunder. The Board of Directors of the respective Companies, included in the JBCPL Group, are responsible for maintenance of adequate accounting records in accordance with the provisions of the Act or otherwise for safeguarding the assets of the Group and for preventing and detecting frauds and other irregularities; the selection and application of appropriate accounting policies; making judgments and estimates that are reasonable and prudent; and the design, implementation and maintenance of adequate internal financial controls, that were operating effectively for ensuring the accuracy and completeness of the accounting records, relevant to the preparation and presentation of the consolidated Ind AS financial statements that give a true and fair view and are free from material misstatement, whether due to fraud or error, which have been used for the purpose of preparation of the consolidated Ind AS financial statements by the Directors of the Holding Company, as aforesaid.
Auditor’s Responsibility
Our responsibility is to express an opinion on these consolidated Ind AS financial statements based on our audit. While conducting the audit, we have taken into account the provisions of the Act, the accounting and auditing standards and matters which are required to be included in the audit report under the provisions of the Act and the Rules made thereunder.
We conducted our audit in accordance with the Standards on Auditing specified under Section 143(10) of the Act. Those Standards require that we comply with ethical requirements and plan and perform the audit to obtain reasonable assurance about whether the consolidated Ind AS financial statements are free from material misstatement.
An audit involves performing procedures to obtain audit evidence about the amounts and the disclosures in the consolidated Ind AS financial statements. The procedures selected depend on the auditor’s judgment, including the assessment of the risks of material misstatement of the consolidated Ind AS financial statements, whether due to fraud or error. In making those risk assessments, the auditor considers internal controls and checks relevant to the Holding Company’s preparation of the consolidated Ind AS financial statements that give a true and fair view in order to design audit procedures that are appropriate in the circumstances. An audit also includes evaluating the appropriateness of the principles and procedures followed, accounting policies used and the reasonableness of the accounting estimates made by the Holding Company’s Board of Directors, as well as evaluating the overall presentation of the consolidated Ind AS financial statements.
We believe that the audit evidence obtained by us and the audit evidence obtained by the other auditors in terms of their reports referred to in the Other Matters paragraph below, is sufficient and appropriate to provide a basis for our audit opinion on the consolidated Ind AS financial statements.
Opinion
In our opinion and to the best of our information and according to the explanations given to us, the aforesaid consolidated Ind AS financial statements give the information required by the Act in the manner so required and give a true and fair view in conformity with the accounting principles generally accepted in India including Ind AS, of the consolidated financial position of the JBCPL Group, as at 31st March, 2017, and its consolidated financial performance including other comprehensive income, its consolidated cash flows and the consolidated changes in equity for the year then ended.
Other Matters
We did not audit the financial statements / financial information of certain subsidiaries, whose financial statements / financial information reflect total assets of ` 26,140.69 lakhs as at 31st March, 2017, total revenues of ` 31,373.94 lakhs and net cash inflows amounting to ` 38.49 lakhs for the year ended on that date, as considered in the consolidated financial statements. These financial statements / financial information have been prepared in accordance with accounting policies generally accepted in their respective countries and audited by other auditors whose reports have been furnished to us by the
125
Corporate Overview Statutory Reports Standalone Financial Statement Consolidated Financial Statement01-13 14-68 69-123 124-179
Management and our opinion on the consolidated financial statements, in so far as it relates to the amounts and disclosures included in respect of these subsidiaries, and our report in terms of sub-section (3) of Section 143 of the Act, to the extent applicable or considered as applicable, insofar as it relates to the aforesaid subsidiaries, is based solely on the reports of the other auditors.
Our opinion on the consolidated financial statements, and our report on Other Legal and Regulatory Requirements below, is not modified in respect of the above matters with respect to our reliance on the work done and the reports of the other auditors.
Report on Other Legal and Regulatory Requirements
As required by Section 143(3) of the Act, we report that:
a. We have sought and obtained all the information and explanations which to the best of our knowledge and belief were necessary for the purposes of our audit of the aforesaid consolidated Ind AS financial statements.
b. In our opinion, proper books of account as required by law relating to preparation of the aforesaid consolidated Ind AS financial statements have been made so far as it appears from our examination of those books.
c. The Consolidated Balance Sheet, the Consolidated Statement of Profit and Loss, the Consolidated Statement of Cash Flows and Consolidated Statement of changes in equity dealt with by this Report are in agreement with the books of account relevant for the purpose of preparation of the consolidated Ind AS financial statements.
d. In our opinion, the aforesaid consolidated Ind AS financial statements comply with the applicable Accounting Standards specified under Section 133 of the Act, read with relevant rules issued thereunder to the extent applicable.
e. On the basis of written representations received from the directors of the Holding Company as on 31st March, 2017 and taken on record by the Board of Directors of the Holding Company, none of the directors of the Holding Company incorporated in India is disqualified as on 31st March, 2017 from being appointed as a director in terms of section 164(2) of the Act.
f. With respect to the adequacy of the internal financial controls over financial reporting of the JBCPL group and operating effectiveness of such controls, refer to our report on the internal financial controls over financial
reporting given in Annexure B to the Independent Auditors’ Report on Standalone Ind AS Financial Statement as same is applicable to the Companies incorporated in India and Holding Company being the only company in the JBCPL group incorporated in India, and
g. With respect to the other matters to be included in the Auditor’s Report in accordance with Rule 11 of the Companies (Audit and Auditor’s) Rules, 2014, in our opinion and to the best of our information and according to the explanations given to us:
i. the consolidated Ind AS financial statements disclose the impact of pending litigations on the consolidated financial position of the JBCPL Group, Refer Note no. 37 to the consolidated Ind AS financial statements;
ii. the JBCPL Group did not have any material foreseeable losses on long-term contracts including derivative contracts;
iii. there has been no delay in transferring amounts, required to be transferred, to the Investor Education and Protection Fund by the Holding Company incorporated in India; and
iv. the Holding Company being the Company incorporated in India to which this disclosure is applicable has provided requisite disclosures in its consolidated Ind AS financial statements as to holding as well as dealing in Specified bank Notes during the period from 8th November, 2016 to 30th December, 2016 in respect of the Company incorporated in India and these are in accordance with the books of account maintained by the Holding Company – Refer Note no. 51 to the Consolidated Ind AS financial statements.
For J K Shah & Co.Chartered Accountants
Firm Registration No.: 109606W
J. K. ShahPartner
Membership No.: 3662
Place : MumbaiDate : May 23, 2017

126
Annual Report 2016-17J. B. Chemicals & Pharmaceuticals Limited
(` in lakhs)
Particulars NoteNo.
As at March 31, 2017
As at March 31, 2016
As at April 1, 2015
ASSETSNon-current assets(a) Property, Plant and Equipment 5 59,727.03 37,155.25 30,384.53 (b) Capital work-in-progress 376.25 13,418.52 5,464.69 (c) Goodwill 5,314.00 5,314.00 1,690.23 (d) Intangible assets 6 2,903.40 1,552.73 127.23 (e) Intangible assets under development - 70.48 52.44 (f) Financial Assets (i) Investments 7 18,584.20 23,141.55 22,795.56 (ii) Trade receivables 8 - - - (iii) Loans 9 30.43 15.34 17.83 (iv) Others 10 648.77 697.16 485.83 (g) Other non-current assets 11 330.76 1,793.28 1,220.39 TOTAL non current assets 87,914.84 83,158.31 62,238.73 Current assets(a) Inventories 12 20,016.86 18,798.33 13,991.11 (b) Financial Assets (i) Investments 13 22,496.16 24,728.31 43,430.52 (ii) Trade receivables 14 26,596.62 27,264.17 24,025.22 (iii) Cash and cash equivalents 15 1,338.65 1,290.22 1,763.03 (iv) Loans 16 92.61 74.64 39.03 (v) Others 17 114.05 413.39 757.41 (c) Other current assets 18 8,834.07 9,038.65 8,391.81 TOTAL current assets 79,489.02 81,607.71 92,398.13 Total Assets 167,403.86 164,766.02 154,636.86 EQUITY AND LIABILITIESEquity(a) Equity Share capital 19 1696.40 1,696.40 1,696.16 (b) Other Equity 20 134,670.50 116,687.43 120,546.06 Equity attributable to equity holder of the Parent 136,366.90 118,383.83 122,242.22 (c) Non Controlling interest 218.05 166.50 - Total Equity 136,584.95 118,550.33 122,242.22 LiabilitiesNon-current liabilities(a) Financial Liabilities Borrowings 21 - - 40.00 (b) Provisions 22 1,256.20 1,043.29 1,202.60 (c) Deferred tax liabilities (Net) 23 1,046.39 1,677.63 1,751.03 (d) Other non-current liabilities 24 395.48 380.60 - TOTAL non current liabilities 2,698.07 3,101.52 2,993.63 Current liabilities(a) Financial Liabilities (i) Borrowings 25 4,886.03 19,302.37 12,652.77 (ii) Trade payables 26 9,897.71 9,085.09 7,118.75 (iii) Others 27 11,376.26 13,811.57 8,379.02 (b) Other current liabilities 28 838.44 61.71 24.43 (c) Provisions 29 1,035.01 811.79 850.64 (d) Current Tax Liabilities (Net) 30 87.39 41.64 375.40 TOTAL current liabilities 28,120.84 43,114.17 29,401.01 TOTAL Equity and iabilities 167,403.86 164,766.02 154,636.86
See accompanying notes to the financial statements
As per our report of even date For and on behalf of the Board of Directors
For J. K. Shah & Co. J. B. Mody D. B. ModyChartered Accountants Chairman & Managing Director Whole time Director (Administration)
J. K. Shah S. B. Mody Vijay D. BhattPartner Whole time Director (Marketing) Chief Financial Officer
Place : Mumbai Place : Mumbai M. C. MehtaDate : May 23, 2017 Date : May 23, 2017 Company Secretary
CONSOLIDATED BALANCE ShEET As at March 31, 2017
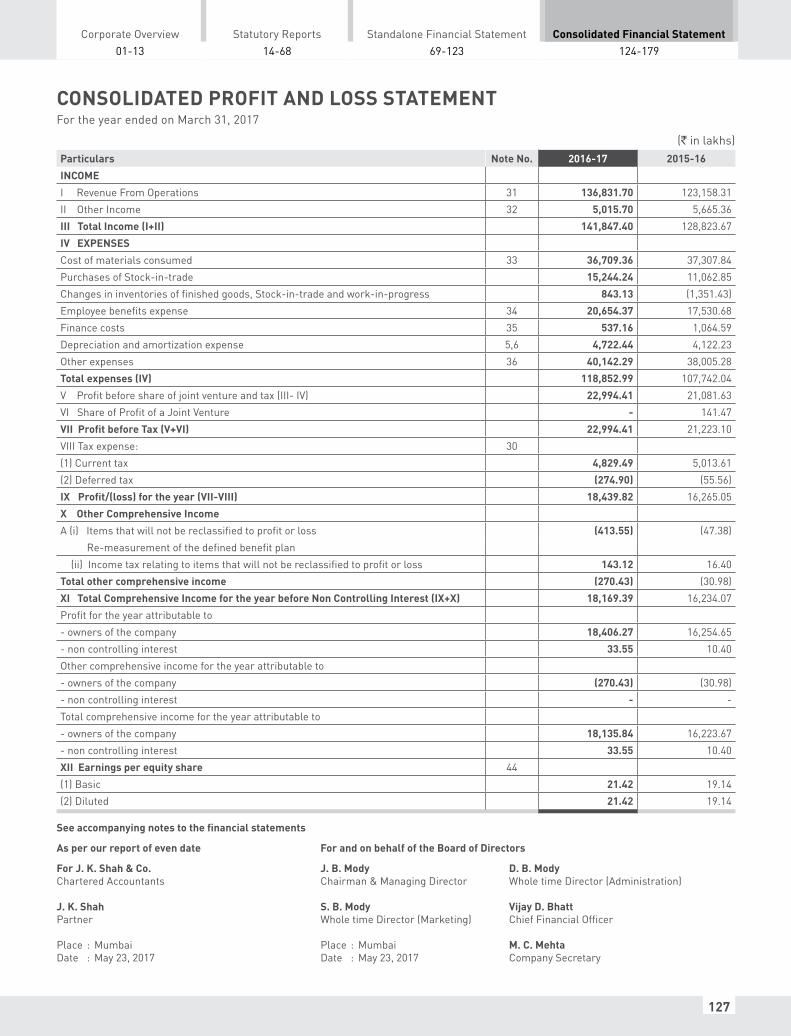
127
Corporate Overview Statutory Reports Standalone Financial Statement Consolidated Financial Statement01-13 14-68 69-123 124-179
(` in lakhs)Particulars Note No. 2016-17 2015-16INCOMEI Revenue From Operations 31 136,831.70 123,158.31 II Other Income 32 5,015.70 5,665.36 III Total Income (I+II) 141,847.40 128,823.67 IV EXPENSESCost of materials consumed 33 36,709.36 37,307.84 Purchases of Stock-in-trade 15,244.24 11,062.85 Changes in inventories of finished goods, Stock-in-trade and work-in-progress 843.13 (1,351.43)Employee benefits expense 34 20,654.37 17,530.68 Finance costs 35 537.16 1,064.59 Depreciation and amortization expense 5,6 4,722.44 4,122.23 Other expenses 36 40,142.29 38,005.28 Total expenses (IV) 118,852.99 107,742.04 V Profit before share of joint venture and tax (III- IV) 22,994.41 21,081.63 VI Share of Profit of a Joint Venture - 141.47 VII Profit before Tax (V+VI) 22,994.41 21,223.10 VIII Tax expense: 30(1) Current tax 4,829.49 5,013.61 (2) Deferred tax (274.90) (55.56)IX Profit/(loss) for the year (VII-VIII) 18,439.82 16,265.05 X Other Comprehensive IncomeA (i) Items that will not be reclassified to profit or loss (413.55) (47.38) Re-measurement of the defined benefit plan (ii) Income tax relating to items that will not be reclassified to profit or loss 143.12 16.40 Total other comprehensive income (270.43) (30.98)XI Total Comprehensive Income for the year before Non Controlling Interest (IX+X) 18,169.39 16,234.07 Profit for the year attributable to - owners of the company 18,406.27 16,254.65 - non controlling interest 33.55 10.40 Other comprehensive income for the year attributable to - owners of the company (270.43) (30.98)- non controlling interest - - Total comprehensive income for the year attributable to - owners of the company 18,135.84 16,223.67 - non controlling interest 33.55 10.40 XII Earnings per equity share 44(1) Basic 21.42 19.14 (2) Diluted 21.42 19.14
See accompanying notes to the financial statements
As per our report of even date For and on behalf of the Board of Directors
For J. K. Shah & Co. J. B. Mody D. B. ModyChartered Accountants Chairman & Managing Director Whole time Director (Administration)
J. K. Shah S. B. Mody Vijay D. BhattPartner Whole time Director (Marketing) Chief Financial Officer
Place : Mumbai Place : Mumbai M. C. MehtaDate : May 23, 2017 Date : May 23, 2017 Company Secretary
CONSOLIDATED PROFIT AND LOSS STATEMENT For the year ended on March 31, 2017

128
Annual Report 2016-17J. B. Chemicals & Pharmaceuticals Limited
CONSOLIDATED CASh FLOW STATEMENT FOR ThE YEAR ENDED ON MARCh 31, 2017
(` in lakhs)
Particulars 2016-17 2015-16
A. Cash Flow from Operating Activities
Net Profit before Tax 22,994.41 21,223.10
Adjustment For:
Depreciation 4 ,722.44 4 ,122.23
Foreign Exchange Fluctuation (Net) 1 ,040.22 (504.60)
Interest Paid 206.85 221.41
(Profit)/Loss on Sale/Discard of Assets (Net) (183.92) 3.33
Profit on sale of Investment designated as FVTPL (4,436.49) (3,371.79)
Net (Gain)/Loss arising from Financial instruments designated as FVTPL 361.65 (268.27)
Interest Received (117.89) (117.24)
Dividend Received - (627.02)
Re-measurement of the defined benefit plan (413.55) (47.38)
Provision for Doubtful debts 352.48 449.80
1 ,531.80 (139.53)
Operating Profit Before Working Capital Changes 24,526.20 21,083.57
Adjustment For:
Trade and Other Receivables 1 ,790.00 (3,169.76)
Inventories (1,218.53) (2,831.53)
Trade Payable (294.15) 4 ,305.64
277.32 (1,695.65)
Cash Generated From Operations 24,803.52 19,387.92
Direct Taxes Paid (net) (4,783.73) (5,347.37)
Net Cash from Operating Activities 20,019.79 14,040.55
B. Cash Flow from Investing Activities
Purchase of Fixed Assets (15,617.08) (20,317.82)
Sale of Fixed Assets 268.85 24.17
Purchase of Investment (18,345.00) (19,930.28)
Investment in subsidiary - (5,229.93)
Sale of Investment 29,209.34 41,926.55
Exchange gain realised on liquidation of foreign subsidiary - -
Interest Received 129.00 138.14
Dividend Received - 627.02
Net Cash used in Investing Activities (4,354.89) (2,762.15)

129
Corporate Overview Statutory Reports Standalone Financial Statement Consolidated Financial Statement01-13 14-68 69-123 124-179
CONSOLIDATED CASh FLOW STATEMENT FOR ThE YEAR ENDED ON MARCh 31, 2017 (Contd.)
(` in lakhs)
Particulars 2016-17 2015-16
C. Cash Flow from Financing Activities
Proceeds from issue of Shares under ESOP (including Securities Premium) - 11.16
Proceeds from issue of Shares to Minority (including Securities Premium) - 137.22
Proceeds/(Repayment) from/of Short Term Borrowing (Net) (17,503.64) 8,873.33
Proceeds/(Repayment) from/of Long Term Borrowing (Net) - (8.83)
Interest Paid (212.89) (220.60)
Dividend Paid (Including Dividend Distribution Tax) (573.92) (18,754.12)
Net Cash Used in Financing Activities (18,290.45) (9,961.84)
Net Increase in Cash and Cash Equivalents (2,625.55) 1 ,316.56
Cash And Cash Equivalents as at 01.04.16* 942.41 (545.69)
Add: Cash acquired on conversion of Joint Venture into Subsidiary Company - 171.54
Cash And Cash Equivalents as at 31.03.17 (1,683.14) (2,625.55) 942.41 1 ,316.56
*Cash and Cash Equivalents comprises the following:
(` in lakhs)
Particulars As at March 31,2017
As at March 31,2016
As at April 1, 2015
a. Balances with banks 855.05 915.41 1,085.14
b. Unclaimed Dividend A/cs * 224.60 288.08 156.21
c. Fixed Deposits with maturity of less than 12 months 239.58 61.13 494.12
d. Cash on hand 18.82 25.00 26.96
e. Post Office Saving Account 0.60 0.60 0.60
1,338.64 1,290.22 1,763.03
Less : Bank Overdraft 3,021.78 347.81 2,308.72
Cash and Cash Equivalents (1,683.14) 942.41 (545.69)
*The amount is to be utilised towards settlement of respective unpaid dividends.
As per our report of even date For and on behalf of the Board of Directors
For J. K. Shah & Co. J. B. Mody D. B. ModyChartered Accountants Chairman & Managing Director Whole time Director (Administration)
J. K. Shah S. B. Mody Vijay BhattPartner Whole time Director (Marketing) Chief Financial Officer
Place : Mumbai Place : Mumbai M. C. MehtaDate : May 23, 2017 Date : May 23, 2017 Company Secretary

130
Annual Report 2016-17J. B. Chemicals & Pharmaceuticals Limited
1. GENERAL INFORMATIONJ. B. Chemicals & Pharmaceuticals Limited (the Parent Company) is a public limited company incorporated in India (CIN no. L24390MH1976PLC019380) having its registered office in Mumbai. The consolidated financial statement comprises financials of the parent company and its subsidiaries (referred to collectively as “the Group”). The Group is engaged in the business of manufacturing and marketing of diverse range of pharmaceutical formulations, herbal remedies and APIs.
These consolidated financial statements for the year ended March 31, 2017 were approved for issue by the Board of Directors vide its resolution dated May 23, 2017.
2. SIGNIFICANT ACCOUNTING POLICIES2.1 STATEMENT OF COMPLIANCE:
The consolidated financial statements of the Group have been prepared in accordance with Indian Accounting Standards (Ind AS) notified under the Companies (Indian Accounting Standards) Rules, 2015 as amended by the Companies (Indian Accounting Standards) Rules, 2016. Up to the financial year ended March 31, 2016, the Group prepared its financial statements in accordance with accounting standards notified under the section 133 of the Companies Act, 2013 (Previous GAAP) and the other relevant provisions of the Companies Act, 2013.
The consolidated financial statements for the year ended March 31, 2017 are the Group’s first Ind AS financial statements and are covered by Ind AS 101, “First time adoption of Indian Accounting Standards”. The date of transition to Ind AS is April 1, 2015. The transition was carried out from Accounting Principles generally accepted in India (Previous GAAP). Reconciliation and descriptions of the effect of the transition have been summarized in note no 52.
2.2 PRINCIPLES OF CONSOLIDATION:The consolidated financial statements comprise of the financial statement of the Parent Company and its subsidiaries referred herein below. The financial statements of the Parent Company and its subsidiaries have been consolidated on a line by line basis by adding together the book values of like items of assets, liabilities, incomes and expenses after eliminating intra-group balances, intragroup transactions and unrealized profits resulting there from and are
presented to the extent possible, in the same manner as the Group’s independent financial statements.
The difference between the Group costs of investments in the Subsidiaries, over its portion of equity at the time of acquisition of shares is recognized in the consolidated financial statements as Goodwill or Capital Reserve as the case may be.
In case of foreign subsidiaries, revenue items are converted at the average rates prevailing during the year. All assets and liabilities are converted at rates prevailing at the end of the year. Any exchange difference arising on consolidation is recognized in the “Foreign Currency Translation Reserve”.
Investment in Joint Venture has been accounted under equity method as per Ind AS 28 - Investment in Associates and Joint ventures.
The financial statements of the Parent Company and its subsidiaries have been consolidated using uniform accounting policies for like transactions and other events in similar circumstances. When necessary, adjustments are made to the financial statements of subsidiaries to bring their accounting policies into line with the Group’s accounting policies. The financial statements of the subsidiaries used in consolidation are drawn up to the same reporting date as that of the Parent Company i.e., year ended March 31, 2017.
Non-controlling interests in the net assets of consolidated subsidiaries is identified and presented in the consolidated Balance Sheet separately within equity.
Non-controlling interests in the net assets of consolidated subsidiaries consists of:
a) The amount of equity attributable to non-controlling interests at the date on which investment in a subsidiary is made; and
b) The non-controlling interests’ share of movements in equity since the date parent subsidiary relationship came into existence.
The profit and other comprehensive income attributable to non-controlling interests of subsidiaries are shown separately in the consolidated Statement of Profit and Loss and consolidated Statement of Changes in Equity.
NOTES ON CONSOLIDATED FINANCIAL STATEMENTS FOR ThE YEAR ENDED ON MARCh 31, 2017

131
Corporate Overview Statutory Reports Standalone Financial Statement Consolidated Financial Statement01-13 14-68 69-123 124-179
Name of the Subsidiary Country of Incorporation
Proportion of ownership interest
Accounting year ending on
LLC Unique Pharmaceutical Laboratories Russia 100% March 31st
Unique Pharmaceutical Laboratories FZE Dubai 100% March 31st
Biotech Laboratoires (Pty.) Ltd. South Africa 95.24% March 31st
(Through Unique Pharmaceuticals Laboratories FZE, from December 18, 2015)
2.3 BASIS OF PREPARATION:The consolidated financial statements have been prepared on a historical cost basis except for certain financial assets and financial liabilities (including financial instruments) which have been measured at fair value at the end of each reporting period as explained in the accounting policies stated below.
2.4 CURRENT VERSUS NON-CURRENT CLASSIFICATIONThe Group has classified all its assets and liabilities under current and non-current as required by Ind AS 1- Presentation of the Consolidated Financial Statements. The asset is treated as current when it is:
• Expected to realized or intended to be sold orconsumed in normal operating cycle.
• Heldprimarilyforpurposeoftrading.
• Expected to be realized within twelve monthsafter the reporting period, or
• Cashorcashequivalentunlessrestricted frombeing exchanged or used to settle a liability for at least twelve months after the reporting period.
All other assets are classified as non-current.
All liabilities are current when:
• It isexpectedtobesettledinnormaloperatingcycle.
• Itisheldprimarilyforthepurposeoftrading.
• Itisduetobesettledwithintwelvemonthsafterthe reporting period, or
• There is no unconditional right to defer thesettlement of liability for at least twelve months after the reporting period.
All other liabilities are classified as non-current.
2.5 FUNCTIONAL AND PRESENTATION CURRENCY AND ROUNDING OFF OF ThE AMOUNTS:The Functional and presentation currency of the Group is Indian rupees. Accordingly, all amounts disclosed in the Consolidated Financial Statements and notes have been shown in Indian rupees and all values are shown in lakhs and rounded to two decimals except when otherwise indicated.
2.6 REVENUE RECOGNITION:Revenue is recognized to the extent that it is probable that the economic benefits will flow to the Group and the revenue can be reliably measured, regardless of when the payment is being made. Revenue is measured at the fair value of the consideration received or receivable, taking into account contractually defined terms of payment including excise duty collected which flows to the Group on its own account but excluding taxes or duties collected on behalf of the government.
The Group follows specific recognition criteria as described below before the revenue is recognized.
A) Sale of goodsRevenue from sale of goods is recognized when the significant risks and rewards of ownership have been transferred to the buyer, usually on delivery of goods, recovery of the consideration is probable, the associated cost can be estimated reliably, there is no continuing effective control or managerial involvement with the goods, and the amount of revenue can be measured reliably.
Revenue from the sale of goods is measured at the fair value of the consideration received or receivable, net of returns and allowances, trade discounts and volume rebates.
B) Export of Product Development ServiceRevenue from export of product development service is recognized upon by reference to the stage of completion of service and the amount of revenue can be measured reliably.
NOTES ON CONSOLIDATED FINANCIAL STATEMENTS FOR ThE YEAR ENDED ON MARCh 31, 2017 (Contd.)
The subsidiary companies considered in the consolidated financial statements are:

132
Annual Report 2016-17J. B. Chemicals & Pharmaceuticals Limited
C) Other Operating RevenueOther Operating revenue comprises of following items:
• Manufacturingcharges
• Exportincentives
• Saleofscrap
Revenue from manufacturing charges is recognized on completion of contractual obligation of manufacturing and delivery of product manufactured.
Revenue from export incentives are recognized upon adherence to the compliance as may be prescribed with regard to export and / or realization of export proceeds as per foreign trade policy and its related guidelines.
Revenue from sale of scrap is recognized on delivery of scrap items.
D) Other IncomeOther income comprises of interest income, dividend from investment and profits on redemption of investments.
Interest income from financial assets is recognized when it is probable that the economic benefit will flow to the Group and the amount of income can be measured reliably. Interest income is accrued on time basis by reference to the principal outstanding and at the effective rate applicable, which is the rate exactly discounts estimated future cash receipts through the expected life of the financial asset to that asset’s net carrying amount on initial recognition.
Dividend income from investment is recognized when the shareholder’s right to receive payment has been established (provided that it is probable that the economic benefit will flow to the group and the amount of income can be measured reliably).
Profit on redemption of investment is recognized by upon exercise of power by the Group to redeem the investment held in any particular security / instrument (non-current as well as current investment).
2.7 Foreign currency transactions:
Transactions in foreign currency are recorded at the exchange rate prevailing on the date of the transaction. Foreign currency denominated monetary assets and
liabilities at the Balance Sheet date are translated at the exchange rate prevailing on the date of Balance Sheet.
Exchange rate differences resulting from foreign currency transactions settled during the period including year-end translation of assets and liabilities are recognized in the consolidated Statement of Profit and loss account.
Non-monetary assets, which are measured in terms of historical cost denominated in a foreign currency, are reported using the exchange rate at the date of the initial transaction.
Non-monetary items measured at fair value in a foreign currency are translated using the exchange rates at the date when the fair value was measured. The gain or loss arising on translation of non-monetary items measured at fair value is treated in line with the recognition of the gain or loss on the change in fair value of the item (i.e., translation differences on items whose fair value gain or loss is recognized in OCI or consolidated Statement of Profit and Loss are also recognized in OCI or consolidated Statement of Profit and Loss, respectively).
2.8 GOVERNMENT GRANTS:Monetary government grants are recognized where there is reasonable assurance that the grant will be received and all attached conditions will be complied with.
The grant related to an expense item is recognized as income in the year in which it is received. The grant related to an asset in the form of EPCG License is recognized in the balance sheet as deferred income and is transferred to consolidated Statement of Profit and Loss in equal amounts over the periods during which obligation attached to the License is to be fulfilled. Grant in the form of cash benefit is recognized in the Balance Sheet as deferred income and it is transferred to consolidated Statement of Profit and Loss over the useful life of the concerned asset.
2.9 EMPLOYEE BENEFITS:Short Term and Other Long Term Employee Benefits:
A liability is recognised for benefits accruing to employees in respect of short term employee benefits in the period the related service is rendered at the undiscounted amount of the benefits expected to be paid in exchange for that service.
NOTES ON CONSOLIDATED FINANCIAL STATEMENTS FOR ThE YEAR ENDED ON MARCh 31, 2017 (Contd.)

133
Corporate Overview Statutory Reports Standalone Financial Statement Consolidated Financial Statement01-13 14-68 69-123 124-179
A liability is recognised for benefits accruing to employees in respect of other long term employee benefits are measured at the present value of the estimated future cash outflows expected to be made by the Group in respect of services provided by the employees up to the reporting date.
Long Term Employee Benefits:
• Defined Contribution Plan:
Payments to defined contributions retirement benefit plans are recognized as an expense when employees have rendered the service entitling them to the contributions.
• DefinedBenefitPlan:
For defined retirement benefit plans, the cost of providing benefits is determined using the Projected Unit Credit method, with actuarial valuations being carried out at end of each annual reporting period. Re-measurements, comprising of actuarial gains and losses, the effect of the changes to the asset ceiling (if applicable), and the return on plan assets (excluding interest), is reflected immediately in the balance sheet with a charge or credit recognized in other comprehensive income in the period in which they occur. Re-measurements recognized in Other Comprehensive Income is reflected immediately in retained earnings and will not be reclassified to consolidated Statement of Profit or Loss in subsequent periods. Past service cost is recognized in the consolidated profit or loss statement in the period of a plan amendment. Net interest is calculated by applying the discount rate at the beginning of the period to the net defined benefit liability or assets. Defined benefit costs are categorized as follows:
• Service Cost (including current service cost,past service cost, as well as gains or losses on curtailments and settlements).
• Netinterestexpenseorincome;and
• Re-measurement
The Group presents the first two components defined benefit cost in the consolidated Statement of Profit and loss in the line items “Employee Benefit Expenses” and “Finance Cost” respectively. Curtailment gain and losses are accounted for as past service cost.
The retirement benefit obligation recognized in the
Balance Sheet represents the actual deficit or surplus in the Group’s defined benefit plan. Any surplus resulting from this calculation is limited to the present value of any economic benefits available in the form of refunds from the plan or reduction in future contributions to the plan.
2.10 TAX EXPENSES:The tax expense for the period comprises current and deferred tax. Taxes are recognised in the consolidated statement of profit and loss, except to the extent that it relates to the items recognised in the comprehensive income or in Equity. In which case, the tax is also recognised in the comprehensive income or in Equity
Current tax:
Current tax payable is calculated based on taxable profit for the year. Current tax is recognized based on the amount expected to be paid to or recovered from the tax authorities based on applicable tax laws that have been enacted or substantively enacted by the balance sheet date. Management periodically evaluates positions taken in the tax return with respect to situations in which applicable tax regulations are subject to interpretation and establishes provisions where appropriate.
Deferred tax:
Deferred tax is recognised on temporary differences between the carrying amounts of assets and liabilities in the consolidated financial statements and the corresponding tax bases used in the computation of taxable profit.
Deferred tax liabilities are generally recognized for all taxable temporary timing difference. Deferred tax assets are recognized for deductible temporary differences to the extent that they are probable that taxable profit will be available against which the deductible temporary difference can be utilized.
The carrying amount of deferred tax assets is reviewed at each reporting date and adjusted to the extent that it is no longer probable that sufficient taxable profit will be available to allow all or part of the deferred tax asset to be utilized.
Deferred tax assets and liabilities are measured at the tax rates that are expected to apply in the year when the asset is realized or liability is settled, based on tax rates (and tax laws) that have been enacted or substantively enacted on the reporting date.
NOTES ON CONSOLIDATED FINANCIAL STATEMENTS FOR ThE YEAR ENDED ON MARCh 31, 2017 (Contd.)

134
Annual Report 2016-17J. B. Chemicals & Pharmaceuticals Limited
Current and deferred tax for the year are recognized in profit or loss, except when they relate to items that are recognized in other comprehensive income or directly in equity, in which case, the current and deferred tax are also recognized in other comprehensive income or directly in equity respectively. Where current or deferred tax arises from initial accounting for a business combination, the tax affect is included in the accounting for the business combination.
Minimum Alternate Tax (MAT) Credit:
MAT credit is recognized as Deferred tax asset only when and to the extent there is convincing evidence that the Company will pay normal income tax during the specified period.
2.11 PROPERTY, PLANT AND EQUIPMENTFreehold land is stated at historical cost.
Premium paid for the leasehold land is amortized over the lease period.
All other items of Property, plant and equipment are stated at cost, net of recoverable taxes, trade discount and rebates less accumulated depreciation and impairment losses, if any. Such cost includes purchase price, borrowing cost and any cost directly attributable to bringing the assets to its working condition for its intended use.
Subsequent costs are included in the asset’s carrying amount or recognised as a separate asset, as appropriate, only when it is probable that future economic benefits associated with the item will flow to the entity and the cost can be measured reliably. When significant parts of plant and equipment are required to be replaced at intervals, the Company depreciates them separately based on their specific useful lives. All other repairs and maintenance costs are recognized as expense in the consolidated statement of profit and loss account as and when incurred.
Expenses incurred relating to project, net of income earned during the project development stage prior to its intended use, are considered as pre-operative expenses and disclosed under Capital Work-in-Progress.
Cost of the assets less its residual value (estimated at 5% of the cost) is depreciated over its useful life. Depreciation is calculated on a straight line basis over the useful life of the assets as prescribed in Schedule II to the Companies Act, 2013.
The management believes that the estimated useful lives are realistic and reflects fair approximation of the period over which the assets are likely to be used. At each financial year end, management reviews the residual values, useful lives and method of depreciation of property, plant and equipment and values of the same are adjusted prospectively where needed.
2.12 INTANGIBLE ASSETS:Intangible assets acquired separately are measured on initial recognition at cost. Following initial recognition, intangible assets are carried at cost less any accumulated amortization and accumulated impairment losses. Internally generated intangibles are not capitalized and the related expenditure is reflected in the consolidated statement of profit or loss in the period in which the expenditure is incurred.
Subsequent costs are included in the asset’s carrying amount or recognised as a separate asset, as appropriate, only when it is probable that future economic benefits associated with the item will flow to the entity and the cost can be measured reliably.
Intangible assets other than Product Dossiers are amortized on a straight line basis over a period of 3 years. The useful lives of intangible assets like Product Dossiers are assessed as either finite or indefinite.
Intangible assets with finite lives are amortized over the useful economic life and assessed for impairment whenever there is an indication that the intangible asset may be impaired. The amortization period and the amortization method for an intangible asset with a finite useful life are reviewed at least at the end of each reporting period. Changes in the expected useful life or the expected pattern of consumption of future economic benefits embodied in the asset are considered to modify the amortization period or method, as appropriate, and are treated as changes in accounting estimates. The amortization expense on intangible assets with finite lives is recognized in the consolidated statement of profit and loss unless such expenditure forms part of carrying value of another asset.
Intangible assets with indefinite useful lives are not amortized, but are tested for impairment annually, either individually or at the cash-generating unit level. The assessment of indefinite life is reviewed annually to determine whether the indefinite life continues to be supportable. If not, the change in useful life from indefinite to finite is made on a prospective basis.
NOTES ON CONSOLIDATED FINANCIAL STATEMENTS FOR ThE YEAR ENDED ON MARCh 31, 2017 (Contd.)

135
Corporate Overview Statutory Reports Standalone Financial Statement Consolidated Financial Statement01-13 14-68 69-123 124-179
Gains or losses arising from derecognition of an intangible asset are measured as the difference between the net disposal proceeds and the carrying amount of the asset and are recognized in the consolidated statement of profit or loss when the asset is derecognized.
Goodwill recognized in the consolidated financial statements is not amortized.
2.13 BORROWING COSTS:Borrowing Costs directly attributed to the acquisition of fixed assets are capitalized as a part of the cost of asset up to the date the asset is put to use. Other Borrowing Costs are charged to the consolidated statement of profit and loss account in the year in which they are incurred.
2.14 IMPAIRMENT OF ASSETS:The Group assesses at each reporting date as to whether there is any indication that any property, plant and equipment and intangible assets or group of assets, called cash generating units (CGU) may be impaired. If any such indication exists the recoverable amount of an asset or CGU is estimated to determine the extent of impairment, if any. When it is not possible to estimate the recoverable amount of an individual asset, the Group estimates the recoverable amount of the CGU to which the asset belongs.
An impairment loss is recognized in the consolidated Statement of Profit and Loss to the extent, asset’s carrying amount exceeds its recoverable amount. The recoverable amount is higher of an asset’s fair value less cost of disposal and value in use. Value in use is based on the estimated future cash flows, discounted to their present value using pre-tax discount rate that reflects current market assessments of the time value of money and risk specific to the assets.
The impairment loss recognized in prior accounting period is reversed if there has been a change in the estimate of recoverable amount.
2.15 INVENTORIES:Inventories are stated at the lower of cost or net realizable value. Cost is determined on the basis of Moving Average method. The cost of work in progress (other than those lying at third party manufacturing site which is valued at material cost) and finished goods comprise direct material, direct labour and other direct cost and related production overheads.
2.16 PROVISIONS, CONTINGENT LIABILITIES AND CONTINGENT ASSETS:Provisions are recognized when the Group has present obligation (legal or constructive) as a result of past event and it is probable that outflow of resources embodying economic benefits will be required to settle the obligation and a reliable estimate can be made of the amount of the obligation. The expense related to a provision is presented in the consolidated statement of profit and loss net of any reimbursement/contribution towards provision made.
If the effect of the time value of money is material, estimate for the provisions are discounted using a current pre-tax rate that reflects, when appropriate, the risks specific to the liability. When discounting is used, the increase in the provision due to the passage of time is recognized as a finance cost.
Provisions are reviewed at each balance sheet date and adjusted to reflect the current best estimates.
Contingent liability:
Contingent liability is disclosed in the case;
• When there is a possible obligationwhich couldarise from past event and whose existence will be confirmed only by the occurrence or non-occurrence of one or more uncertain future events not wholly within the control of the Group or;
• Apresentobligationthatarisesfrompasteventsbut is not recognized as expense because it is not probable that an outflow of resources embodying economic benefits will be required to settle the obligation or;
• Theamountoftheobligationcannotbemeasuredwith sufficient reliability.
Commitments:
• Commitmentsincludethevalueofthecontractsfor the acquisition of the assets net of advances.
Contingent asset:
• Contingent asset is disclosed in case apossible asset arises from past events and whose existence will be confirmed only by the occurrence or non-occurrence of one or more uncertain future events not wholly within the control of the Group.
NOTES ON CONSOLIDATED FINANCIAL STATEMENTS FOR ThE YEAR ENDED ON MARCh 31, 2017 (Contd.)
136
Annual Report 2016-17J. B. Chemicals & Pharmaceuticals Limited
Provisions, contingent liabilities, contingent assets and commitments are reviewed at each balance sheet date.
2.17 LEASE:Leases are classified as finance leases whenever the terms of the lease, transfers substantially all the risks and rewards of ownership to the lessee. All other leases are classified as operating leases.
The determination of whether an arrangement is a lease is based on the substance of the arrangement at the inception of the lease. The arrangement is considered as a lease if fulfilment of the arrangement is dependent on the use of a specific asset or assets and the arrangement conveys a right to use the asset or assets, even if that right is not explicitly specified in an arrangement.
Operating lease payments are recognized as an expense in the consolidated Statement of Profit and Loss on a straight-line basis over the lease term except where another systematic basis is more representative of time pattern in which economic benefits from the leased assets are consumed.
2.18 FINANCIAL INSTRUMENTS:The Group recognizes financial assets and financial liabilities when it becomes party to the contractual provision of the instrument.
I. Financial Assets:
Initial recognition and measurement:
Financial assets are initially measured at its fair value. Transaction costs that are directly attributable to the acquisition or issue of financial assets (other than financial assets at fair value through profit or loss) are added to or deducted from the fair value of the concerned financial assets, as appropriate, on initial recognition. Transaction costs directly attributable to acquisition of financial assets at fair value through profit or loss are recognized immediately in profit or loss. However, trade receivable that do not contain a significant financing component are measured at transaction price.
Subsequent measurement:
For subsequent measurement, the Company classifies financial asset in following broad categories:
• Financialassetcarriedatamortizedcost.
• Financial asset carried at fair value throughother comprehensive income (FVTOCI)
• Financial asset carried at fair value throughprofit or loss (FVTPL)
Financial asset carried at amortized cost (net of any write down for impairment, if any):
Financial assets are measured at amortized cost when asset is held within a business model, whose objective is to hold assets for collecting contractual cash flows and contractual terms of the asset give rise on specified dates to cash flows that are solely payments of principal and interest. Such financial assets are subsequently measured at amortized costs using Effective Interest Rate (EIR) method less impairment, if any. The losses arising from impairment are recognized in the consolidated statement of profit or loss. Cash and bank balances, trade receivables, loans and other financial asset of the Group are covered under this category.
Under the EIR method, the future cash receipts are exactly discounted to the initial recognition value using EIR. The cumulative amortization using the EIR method of the difference between the initial recognition amount and maturity amount is added to the initial recognition value (net of principal repayments, if any) of the financial asset over the relevant period of the financial asset to arrive at amortized cost at each reporting date. The corresponding effect of the amortization under EIR method is recognized as interest income over the relevant period of the financial asset. The same is included under “other income” in the consolidated statement of profit or loss. The amortized cost of the financial asset is also adjusted for loss allowance, if any.
Financial asset carried at FVTOCI:
Financial asset under this category are measured initially as well as at each reporting date at fair value, when asset is held with a business model whose objective is to hold asset for both collecting contractual cash flows and selling financial assets. Fair value movements are recognized in the other comprehensive income.
Financial asset carried at FVTPL:
Financial asset under this category are measured initially as well as at each reporting date at fair value. Changes in fair value are recognized in the consolidated statement of profit or loss.
Other Equity Investments:
All other equity investments are measured at fair value, with value changes recognised in the consolidated Statement of Profit and Loss.
NOTES ON CONSOLIDATED FINANCIAL STATEMENTS FOR ThE YEAR ENDED ON MARCh 31, 2017 (Contd.)

137
Corporate Overview Statutory Reports Standalone Financial Statement Consolidated Financial Statement01-13 14-68 69-123 124-179
Derecognition:
A financial asset is primarily derecognized when rights to receive cash flows from the asset have expired or the Group has transferred its contractual rights to receive cash flows of the financial asset and has substantially transferred all the risk and reward of the ownership of the financial asset.
Impairment of financial asset:
In accordance with Ind AS 109, the Group uses ‘Expected Credit Loss’ (ECL) model, for evaluating impairment of financial assets other than those measured at fair value through profit and loss (FVTPL).
ECL is the difference between all contractual cash flows that are due to the Group in accordance with the contract and all the cash flows that the entity expects to receive (i.e., all cash shortfalls), discounted at the original effective interest rate.
Lifetime ECL are the expected credit losses resulting from all possible default events over the expected life of a financial asset. 12-month ECL are a portion of the lifetime ECL which result from default events that are possible within 12 months from the reporting date.
For trade receivables the Group applies ‘simplified approach’ which requires expected lifetime losses to be recognised from initial recognition of the receivables. The Group uses historical default rates to determine impairment loss on the portfolio of trade receivables. At every reporting date these historical default rates are reviewed and changes in the forward looking estimates are analysed.
For other assets, the Group uses 12 month ECL to provide for impairment loss where there is no significant increase in credit risk. If there is significant increase in credit risk full lifetime ECL is used.
ECL impairment loss allowance (or reversal) recognized during the period is recognized as income/ expense in the consolidated Statement of Profit and Loss under the head ‘Other expenses’.
II. Financial liabilities:
Initial recognition and measurement:The Group recognizes a financial liability in its Balance Sheet when it becomes party to the contractual provisions of the instrument. The Group classifies all financial liabilities as subsequently measured at amortized cost or FVTPL.
All financial liabilities are recognized initially at fair value and in the case of loans, borrowings and payables, net of directly attributable transaction costs. Financial liabilities include trade and other payables, loans and borrowings including bank overdrafts and derivative financial instruments.
Subsequent measurement:Financial liabilities at fair value through profit or loss include financial liabilities held for trading and financial liabilities designated upon initial recognition as at fair value through profit or loss. Interest-bearing loans and borrowings are subsequently measured at amortized cost using the Effective Interest Rate (EIR) method. Gains and losses are recognized in the consolidated profit or loss when the liabilities are derecognized as well as through EIR amortization process. Amortized cost is calculated by taking into account any discount or premium on acquisition and fees or costs that are an integral part of the EIR.
The EIR amortization is included as finance costs in the consolidated statement of profit and loss.
Derecognition of financial liabilities:A financial liability is derecognized when the obligation under the liability is discharged or cancelled or expires. When an existing financial liability is replaced by another from the same lender on substantially different terms, or the terms of an existing liability are substantially modified, such an exchange or modification is treated as the derecognition of the original liability and the recognition of a new liability. The difference in the respective carrying amounts is recognized in the consolidated Statement of Profit and Loss.
III. Derivative financial instrument:
Group uses derivative financial instruments, such as forward currency contracts to mitigate its foreign currency fluctuation risks. Such derivative financial instruments are initially recognized at fair value on the date on which a derivative contract is entered into and are subsequently re-measured at fair value at each reporting date. Gain or loss arising from changes in the fair value of heading instrument is recognized in the consolidated statement of profit or loss.
Derivatives are carried as financial assets when the fair value is positive and as financial liabilities when the fair value is negative.
NOTES ON CONSOLIDATED FINANCIAL STATEMENTS FOR ThE YEAR ENDED ON MARCh 31, 2017 (Contd.)

138
Annual Report 2016-17J. B. Chemicals & Pharmaceuticals Limited
Derecognition:On derecognition of hedged item, the unamortized fair value, of the hedging instrument adjusted to the hedged items is recognized in the consolidated statement of profit or loss.
IV. Fair value:
The Group measures financial instruments at fair value in accordance with the accounting policies mentioned above. Fair value is the price that would be received to sell an asset or paid to transfer a liability in an orderly transaction between market participants at the measurement date. The fair value measurement is based on the presumption that the transaction to sell the asset or transfer the liability takes place either:
• Intheprincipalmarketfortheassetorliabilityor;
• Intheabsenceofaprincipalmarket,inthemostadvantageous market for the asset or liability.
All assets and liabilities for which fair value is measured or disclosed in the consolidated financial statements are categorized within the fair value hierarchy that categorizes into three levels, described as follows, the inputs to valuation techniques used to measure value. The fair value hierarchy gives the highest priority to quoted prices in active markets for identical assets or liabilities (Level 1 inputs) and the lowest priority to unobservable inputs (Level 3 inputs).
Level 1 — quoted (unadjusted) market prices in active markets for identical assets or liabilities
Level 2 — inputs other than quoted prices included within Level 1 that are observable for the asset or liability, either directly or indirectly
Level 3 — inputs that are unobservable for the asset or liability
For the purpose of fair value disclosures, the Group has determined classes of assets and liabilities on the basis of the nature, characteristics and risks of the asset or liability and the level of the fair value hierarchy as explained above.
2.19 EMPLOYEE STOCK OPTION PLAN:The accounting value of stock options representing the excess of the market price over the exercise price of the shares granted under “Employee Stock Option Scheme” (ESOP) of the Parent company is amortized on
straight line basis over the vesting period as “Deferred Employee Compensation”.
2.20 RESEARCh AND DEVELOPMENT EXPENDITURE:Revenue expenditure on research and development is charged to the consolidated Statement of Profit and Loss in the year in which it is incurred. Capital expenditure on research and development is treated as fixed assets.
2.21 CASh AND CASh EQUIVALENT:Cash and Cash Equivalents comprise of cash on hand and cash at bank including fixed deposit/highly liquid investments with original maturity period of three months or less that are readily convertible to known amounts of cash and which are subject to an insignificant risk of changes in value.
2.22 CASh FLOW STATEMENTS:Cash flows are reported using the indirect method, whereby the consolidated net profit before tax is adjusted for the effects of transactions of a non-cash nature, any deferrals or accruals of past or future operating cash receipts or payments and item of income or expenses associated with investing or financing cash flows. The cash flow from operating, investing and financing activities of Group are segregated.
3. STANDARD ISSUED BUT NOT YET EFFECTIVE• IndAS115issuedinFebruary2015,establishes
a five step model to account for revenue from contracts with customer. Under this Ind AS, the revenue is recognised at an amount that reflects the consideration in exchange for transferring goods and services which an entity expects to be entitled. The group is in process of analyzing the impact of this proposed standard and shall adopt the same from the required effective date.
• InMarch2017,theMinistryofCorporateAffairsissued the Companies (Indian Accounting Standards) (Amendments) Rules, 2017, notifying amendment to Ind AS 7, ‘Statement of cash flows’. This amendment is in accordance with the recent amendments made by International Accounting Standards Board (IASB) to IAS 7, ‘Statement of cash flows’. The amendment is applicable to the Group from April 1, 2017.
Amendments to Ind AS 7The amendments to Ind AS 7 requires the entities to provide disclosures that enable users of financial
NOTES ON CONSOLIDATED FINANCIAL STATEMENTS FOR ThE YEAR ENDED ON MARCh 31, 2017 (Contd.)

139
Corporate Overview Statutory Reports Standalone Financial Statement Consolidated Financial Statement01-13 14-68 69-123 124-179
statements to evaluate changes in liabilities arising from financing activities, including both changes arising from cash flows and non-cash changes, suggesting inclusion of a reconciliation between the opening and closing balances in the Balance Sheet for liabilities arising from financing activities, to meet the disclosure requirement. These amendments are effective for annual period beginning on or after April, 1, 2017. Application of the amendments will result in additional disclosures provided by the Group.
Amendments to Ind AS 102
The amendment to Ind AS 102 provides specific guidance on measuring the cash-settled awards, modification of cash-settled awards and awards that include a net settlement feature in respect of withholding taxes.
The Company is not having any cash settled share-based payment. No impact is currently foreseen.
4. KEY ACCOUNTING JUDGEMENTS, ESTIMATES AND ASSUMPTIONS:The preparation of the consolidated financial statements requires the management to make judgements, estimates and assumptions that affect the reported amounts of revenues, expenses, assets and liabilities, and the accompanying disclosures, and the disclosure of contingent liabilities. Uncertainty about these assumptions and estimates could result in outcomes that require a material adjustment to the carrying amount of assets or liabilities affected in future periods.
The key assumptions concerning the future and other key sources of estimation uncertainty at the reporting date, that have a significant risk of causing a material adjustment to the carrying amounts of assets and liabilities within the next financial year, are described below:
A) Income taxes and Deferred tax assets:
Significant judgments are involved in estimating budgeted profits for the purpose of paying advance tax, determining the provision for income taxes, including amount expected to be paid/recovered for uncertain tax positions. Deferred tax asset is recognised for all the deductible temporary differences to the extent that it is probable that taxable profit will be available against which the deductible temporary difference can be utilized. The Group management assumes that taxable profit will be available while recognizing the deferred tax assets.
B) Business combinations and Intangible Assets
Business combinations are accounted for using Ind AS 103, Business Combinations. Ind AS 103 requires the identifiable intangible assets and contingent consideration to be fair valued in order to ascertain the net fair value of identifiable assets, liabilities and contingent liabilities of the acquiree. Significant estimates are required to be made in determining the value of contingent consideration and intangible assets. These valuations are conducted by independent valuation experts.
C) Property, Plant and Equipment:
Property, Plant and Equipment represent a significant proportion of the asset base of the Group. The charge in respect of periodic depreciation is derived after determining an estimate of an asset’s expected useful life and the expected residual value at the end of its life. The useful lives and residual values of Group’s assets are determined by the Group management at the time the asset is acquired and reviewed periodically, including at each financial year end. The lives are based on historical experience with similar assets as well as anticipation of future events, which may impact their life, such as changes in technical or commercial obsolescence arising from changes or improvements in production or from a change in market demand of the product or service output of the asset.
D) Intangible assets:
Internal technical or user team assesses the remaining useful lives of Intangible assets. Management believes that assigned useful lives are reasonable.
E) Impairment of non-financial assets
The Group assesses at each reporting date whether there is an indication that an asset may be impaired. If any indication exists, the Group estimates the asset’s recoverable amount. An asset’s recoverable amount is the higher of an asset’s or Cash Generating Units (CGU’s) fair value less costs of disposal and its value in use. It is determined for an individual asset, unless the asset does not generate cash inflows that are largely independent of those from other assets or a group of assets. Where the carrying amount
NOTES ON CONSOLIDATED FINANCIAL STATEMENTS FOR ThE YEAR ENDED ON MARCh 31, 2017 (Contd.)

140
Annual Report 2016-17J. B. Chemicals & Pharmaceuticals Limited
of an asset or CGU exceeds its recoverable amount, the asset is considered impaired and is written down to its recoverable amount.
In assessing value in use, the estimated future cash flows are discounted to their present value using pre-tax discount rate that reflects current market assessments of the time value of money and the risks specific to the asset. In determining fair value less costs of disposal, recent market transactions are taken into account, if no such transactions can be identified, an appropriate valuation model is used.
F) Impairment of financial assets
The impairment provisions for financial assets are based on assumptions about risk of default and expected cash loss rates. The Company uses judgement in making these assumptions and selecting the inputs to the impairment calculation, based on Company’s past history, existing market conditions as well as forward looking estimates at the end of each reporting period.
G) Recognition and measurement of defined benefit obligation:
The obligation arising from the defined benefit plan is determined on the basis of actuarial assumptions. Key actuarial assumptions include discount rate, trends in salary escalation and vested future benefits and life expectancy. The discount rate is determined with reference to market yields at the end of the reporting period on the government bonds. The period to maturity of the underlying bonds correspond to the probable maturity of the post-employment benefit obligations.
h) Recognition and measurement of other provisions:
The recognition and measurement of other provisions are based on the assessment of the probability of an outflow of resources, and on past experience and circumstances known at the balance sheet date. The actual outflow of resources at a future date may, therefore, vary from the figure included in other provisions.
I) Contingencies:
Management judgement is required for estimating the possible outflow of resources, if any, in respect of contingencies/claim/litigations against Group as it is not possible to predict the outcome of pending matters with accuracy.
J) Allowances for uncollected trade receivable and advances:
Trade receivables do not carry any interest and are stated at their normal value as reduced by appropriate allowances for estimated amounts which are irrecoverable. Individual trade receivables are written off when management deems them not collectible. Impairment is made on the expected credit losses, which are the present value of the cash shortfall over the expected life of the financial assets. The impairment provisions for financial assets are based on assumption about risk of default and expected loss rates. Judgement in making these assumptions and selecting the inputs to the impairment calculation are based on past history, existing market condition as well as forward looking estimates at the end of each reporting period.
NOTES ON CONSOLIDATED FINANCIAL STATEMENTS FOR ThE YEAR ENDED ON MARCh 31, 2017 (Contd.)

141
Corporate Overview Statutory Reports Standalone Financial Statement Consolidated Financial Statement01-13 14-68 69-123 124-179
5.
PRO
PER
TY, P
LAN
T A
ND
EQ
UIP
MEN
T (`
in l
akhs
)
Part
icul
ars
Gros
s B
lock
Accu
mul
ated
Dep
reci
aion
Net
Blo
ck
As a
t Ap
ril 1
, 20
16
Addi
tions
Adju
stm
ents
N
ote
3D
ispo
sals
As a
t M
arch
31,
20
17
As a
t Ap
ril 1
,20
16
Dep
reci
atio
n ch
arge
for
the
year
Adju
stm
ents
N
ote
3O
n di
spos
als
As a
t M
arch
31,
20
17
As a
t M
arch
31,
20
17
As a
t M
arch
31,
20
16
Land
(Fre
ehol
d) 5
9.34
-
-
2
.18
57.
16
-
-
-
-
-
57.
16
59.
34
Land
(Lea
seho
ld)
830
.16
593
.04
-
-
1,4
23.2
0 1
02.1
8 1
2.23
-
-
1
14.4
1 1
,308
.79
727
.98
Fact
ory
Bui
ldin
gs 1
3,45
9.45
7
,444
.78
-
129
.33
20,
774.
90
4,0
74.1
0 4
11.9
4 -
8
9.11
4
,396
.93
16,
377.
97
9,3
85.3
5
Bui
ldin
gs (N
ote
1&2)
5,4
72.5
3 3
50.5
2 -
6
.19
5,8
16.8
6 2
35.5
6 9
1.78
-
2
.56
324
.78
5,4
92.0
8 5
,236
.97
Plan
t & E
quip
men
ts 3
9,09
7.39
1
2,26
8.38
-
-
5
1,36
5.77
2
0,94
2.85
3
,331
.96
-
-
24,
274.
81
27,
090.
96
18,
154.
54
Furn
iture
& F
ixtu
res
1,2
31.8
3 2
,095
.98
-
-
3,3
27.8
1 9
74.8
9 1
25.9
8 -
-
1
,100
.87
2,2
26.9
4 2
56.9
4
Vehi
cles
1,6
68.8
1 1
02.0
6 -
9
7.26
1
,673
.61
787
.93
191
.37
-
69.
42
909
.88
763
.73
880
.89
Offi
ce E
quip
men
ts 2
,404
.79
610
.29
-
3.1
5 3
,011
.93
1,9
13.3
5 2
26.6
9 -
4
.40
2,1
35.6
4 8
76.2
9 4
91.4
4
Air
cond
ition
ers
3,5
15.7
4 3
,791
.15
-
-
7,3
06.8
9 1
,553
.94
219
.84
-
-
1,7
73.7
8 5
,533
.11
1,9
61.8
0
Tota
l67
,740
.04
27,
256.
20
-
238
.11
94,
758.
13
30,5
84.8
0 4
,611
.79
-
165
.49
35,
031.
10
59,
727.
03
37,
155.
25
(` in
lak
hs)
Part
icul
ars
Gros
s B
lock
Accu
mul
ated
Dep
reci
aion
Net
Blo
ck
As a
t Ap
ril 1
, 20
15
Addi
tions
Adju
stm
ents
N
ote
3D
ispo
sals
As a
t M
arch
31,
20
16
As a
t Ap
ril 1
, 20
15
Dep
reci
atio
n ch
arge
for
the
year
Adju
stm
ents
N
ote
3O
n di
spos
als
As a
t M
arch
31,
20
16
As a
t M
arch
31,
20
16
As a
t Ap
ril 1
, 20
15
Land
(Fre
ehol
d) 5
9.34
-
-
-
5
9.34
-
-
-
-
-
5
9.34
5
9.34
Land
(Lea
seho
ld)
830
.16
-
-
-
830
.16
94.
20
7.9
8 -
-
1
02.1
8 7
27.9
8 7
35.9
6
Fact
ory
Bui
ldin
gs 1
2,09
9.21
1
,360
.24
-
- 1
3,45
9.45
3
,702
.93
371
.17
-
-
4,0
74.1
0 9
,385
.35
8,3
96.2
8
Bui
ldin
gs (N
ote
1&2)
669
.04
4,8
03.4
9 -
-
5
,472
.53
174
.63
60.
93
-
-
235
.56
5,2
36.9
7 4
94.4
1
Plan
t & E
quip
men
ts 3
5,22
0.84
3
,883
.03
-
6.4
8 3
9,09
7.39
17
,986
.24
2,9
58.5
3 -
1
.92
20,
942.
85
18,1
54.5
4 1
7,23
4.60
Furn
iture
& F
ixtu
res
1,1
87.8
0 2
1.51
2
3.78
4
.82
1,2
28.2
7 8
71.3
0 9
7.00
7
.50
4.4
7 9
71.3
3 2
56.9
4 3
16.5
0
Vehi
cles
1,6
37.7
6 1
30.2
8 -
9
9.23
1
,668
.81
684
.75
180
.25
-
77.
07
787
.93
880
.88
953
.01
Offi
ce E
quip
men
ts 2
,092
.16
322
.71
-
10.
08
2,4
04.7
9 1
,752
.99
160
.00
10.
00
9.6
5 1
,913
.34
491
.45
339
.17
Air
cond
ition
ers
3,2
23.7
8 2
91.9
6 -
-
3
,515
.74
1,3
68.5
2 1
85.4
2 -
-
1
,553
.94
1,9
61.8
0 1
,855
.26
Tota
l 5
7,02
0.09
10,
813.
22
23.
78
120
.61
67,7
36.4
8 2
6,63
5.56
4
,021
.28
17.
50
93.
11 3
0,58
1.23
37,
155.
25 3
0,38
4.53
Not
e:
1) V
alue
of b
uild
ings
incl
udes
a s
um o
f ` 3
000/
- be
ing
the
cost
of s
hare
s in
the
soci
etie
s.2)
No
depr
ecia
tion
has
been
cla
imed
on
asse
ts to
the
exte
nt o
f cen
vat c
laim
ed.
3) A
djus
tmen
t pur
suan
t to
conv
ersi
on o
f joi
nt v
entu
re in
to s
ubsi
diar
y co
mpa
ny.
NOTES ON CONSOLIDATED FINANCIAL STATEMENTS FOR ThE YEAR ENDED ON MARCh 31, 2017 (Contd.)

142
Annual Report 2016-17J. B. Chemicals & Pharmaceuticals Limited
6.
INTA
NG
IBLE
ASS
ETS
(` in
lak
hs)
Part
icul
ars
Gros
s B
lock
Accu
mul
ated
Dep
reci
aion
Net
Blo
ck
As a
t Ap
ril 1
, 20
16
Addi
tions
Adju
stm
ents
N
ote
1D
educ
tions
As a
t M
arch
31,
20
17
As a
t Ap
ril 1
, 2
016
Amor
tisat
ion
for
the
year
Adju
stm
ents
N
ote
1D
educ
tions
As a
t M
arch
31,
20
17
As a
t M
arch
31,
20
17
As a
t
Mar
ch 3
1,
2016
Trad
e M
arks
3.6
7 -
-
-
3
.67
3.6
6 -
-
-
3
.66
0.0
1 0
.01
Com
pute
r So
ftw
are
917
.71
141
.33
-
12.
31
1,0
46.7
3 7
64.8
3 1
10.6
5 -
-
8
75.4
8 1
71.2
5 1
52.8
8
Prod
uct D
ossi
er 1
,399
.84
1,3
32.3
0 -
-
2
,732
.14
-
-
-
-
-
2,7
32.1
4 1
,399
.84
Tota
l 2
,321
.22
1,4
73.6
3 -
1
2.31
3
,782
.54
768
.49
110
.65
-
-
879
.14
2,9
03.4
0 1
,552
.73
(` in
lak
hs)
Part
icul
ars
Gros
s B
lock
Accu
mul
ated
Dep
reci
aion
Net
Blo
ck
As a
t Ap
ril 1
, 20
15
Addi
tions
Adju
stm
ents
N
ote
1D
educ
tions
As a
t M
arch
31,
20
16
As a
t Ap
ril 1
, 2
015
Amor
tisat
ion
for
the
year
Adju
stm
ents
N
ote
1D
educ
tions
As a
t M
arch
31,
20
16
As a
t M
arch
31,
20
16
As a
t Ap
ril 1
, 20
15
Trad
e M
arks
3.6
7 -
-
-
3
.67
3.6
6 -
-
-
3
.66
0.0
1 0
.01
Acqu
ired
Sof
twar
e 7
82.6
9 1
25.6
9 9
.33
-
917
.71
655
.47
100
.95
8.4
1 -
7
64.8
3 1
52.8
8 1
27.2
2
Reg
istr
atio
n &
D
ossi
er -
9
.89
1,3
89.9
5 -
1
,399
.84
-
-
-
-
-
1,3
99.8
4 -
Tota
l 7
86.3
6 1
35.5
8 1
,399
.28
-
2,3
21.2
2 6
59.1
3 1
00.9
5 8
.41
-
768
.49
1,5
52.7
3 1
27.2
3
Not
e:
1) A
djus
tmen
t pur
suan
t to
conv
ersi
on o
f joi
nt v
entu
re in
to s
ubsi
diar
y co
mpa
ny.
NOTES ON CONSOLIDATED FINANCIAL STATEMENTS FOR ThE YEAR ENDED ON MARCh 31, 2017 (Contd.)

143
Corporate Overview Statutory Reports Standalone Financial Statement Consolidated Financial Statement01-13 14-68 69-123 124-179
7. FINANCIAL ASSETS-NON CURRENT INVESTMENTS ( ` in lakhs)
ParticularsAs at
March 31, 2017
As at March 31,
2016
As at April 1,
2015A. Investment in Equity Instruments (unquoted)
In Joint Venture Company (At cost)Biotech Laboratories (Pty.) Ltd. - - 1,471.17
- - 1,471.17 In Other Companies : (At fair value through Profit & Loss)5,866 (March 31, 2016 : 5,866, April 1, 2015 : 5,866) Equity Shares of ` 10 each of Bharuch Enviro Infrastructure Ltd.
0.59 0.59 0.59
612,032 (March 31, 2016 : 612,032, April 1, 2015 : 612,032) Equity Shares of ` 10 each of Narmada Clean Tech Limited.
61.20 61.20 61.20
20,000 (March 31, 2016 : 20,000, April 1, 2015 : 20,000) Equity Shares of Enviro Technology Ltd. of ` 10 each
2.00 2.00 2.00
60,000 (March 31, 2016 : 60,000, April 1, 2015 : 60,000) Equity Shares of Panoli Enviro Technology Ltd.of ` 10 each
6.00 6.00 6.00
50,000 (March 31, 2016 : 50,000, April 1, 2015 : 50,000) Equity Shares of ` 10 each of Ankleshwar Research & Analytical Infrastructure Limited
5.00 5.00 5.00
8,036 (March 31, 2016 : 8,036, April 1, 2015 : 8,036) Equity Shares of ` 10 each of J B Life Science Overseas Ltd.
- - -
2,000,000 (March 31, 2016 : 200,000, April 1, 2015 : 200,000) Equity Shares of ̀ 10 each of Asian Heart Institute & Research Centre Pvt. Ltd.
828.56 721.34 642.99
903.35 796.13 717.78 Total Investment in Equity Instruments 903.35 796.13 2,188.95
B. In Government Securities: Unquoted- (At amortized cost):National Saving Certificates 0.29 0.29 0.41
0.29 0.29 0.41 C. In Mutual Funds : (At fair value through Profit & Loss)
17,000,000 (March 31, 2016 : 17,000,000, April 1, 2015 : 17,000,000) Units of ` 10 each of HDFC FMP 371 D July 2013(1) Growth
2,322.00 2,154.89 1,987.01
Nil (March 31, 2016 : 18,000,000, April 1, 2015 : 18,000,000) Units of ̀ 10 each of DSP Black Rock FMP Series 104 12 Month-Growth
- 2,271.58 2,096.60
Nil (March 31,2016 : 10,000,000, April 1, 2015 : 10,000,000) Units of ` 10 each of IDFC Fixed Term Plan Series 24-Growth
- 1,267.64 1,169.68
15,000,000 (March 31, 2016 : 15,000,000, April 1, 2015 : 15,000,000) Units of ` 10 each of Birla Sun Life Interval Income Fund-Annual Plan IX (368 Days)-Growth
2,027.40 1,885.53 1,746.85
10,000,000 (March 31, 2016 : 10,000,000, April 1, 2015 : 10,000,000) Units of ` 10 each of Birla Sun Life Fixed Term Plan Series HL (366 Days)- Growth
1,371.11 1,272.93 1,174.46
10,000,000 (March 31, 2016 : 10,000,000, April 1, 2015 : 10,000,000) Units of ` 10 each of HDFC FMP 370D August 2013 (3)-Growth
1,370.84 1,271.64 1,172.78
Nil (March 31, 2016 : 4,346,600, April 1, 2015 : 4,346,600) units of ` 10 each of HDFC FMP 371D November 2013 (2) - Growth
- 530.90 489.82
Nil (March 31, 2016 : 5,000,000, April 1, 2015 : 5,000,000) units of ` 10 each of HDFC FMP 370D November 2013 (1) - Growth
- 607.36 560.85
NOTES ON CONSOLIDATED FINANCIAL STATEMENTS FOR ThE YEAR ENDED ON MARCh 31, 2017 (Contd.)

144
Annual Report 2016-17J. B. Chemicals & Pharmaceuticals Limited
ParticularsAs at
March 31, 2017
As at March 31,
2016
As at April 1,
20155,000,000 (March 31, 2016 : 5,000,000, April 1, 2015 : 5,000,000) units of ` 10 each of HDFC FMP 370D February 2014 (1)-Growth
649.13 601.97 554.92
5,400,000 (March 31, 2016 : 5,400,000, April 1, 2015 : 5,400,000) units of ` 10 each of DSP Black Rock FMP - Series 146 - 12M - Growth
701.84 650.56 598.03
5,000,000 (March 31, 2016 : 5,000,000, April 1, 2015 : 5,000,000) units of ` 10 each of HDFC FMP 369D February 2014 (2)-Growth
649.05 600.59 553.60
5,000,000 (March 31, 2016 : 5,000,000, April 1, 2015 : 5,000,000) units of ` 10 each of HDFC FMP 371D February 2014 (2)-Growth
647.10 599.33 552.74
Nil (March 31, 2016 : 5,000,000, April 1, 2015 : 5,000,000) units of ` 10 each of ICICI Prudential FMP Series 72-366 D-Plan-T-Growth
- 600.00 552.68
10,000,000 (March 31, 2016 : 10,000,000, April 1, 2015 : 10,000,000) units of ` 10 each of HDFC FMP 370D March 2014 (1)-Growth
1,293.67 1,198.75 1,105.02
10,000,000 (March 31, 2016 : 10,000,000, April 1, 2015 : 10,000,000) units of ` 10 each of ICICI Prudential FMP Series 73-366 D-Growth
1,288.12 1,199.47 1,103.81
Nil (March 31, 2016 : 5,467,550.001, April 1, 2015 : 5,467,550.001) units of ` 10 each of DSP Black Rock FMP - Series 151-12M - Growth
- 655.00 601.84
10,000,000 (March 31, 2016 : 10,000,000, April 1, 2015 : 10,000,000) Units of `10 each of Birla Sun Life Fixed Term Plan Series KN (366 Days)- Growth
1,287.19 1,194.30 1,099.83
16,366,200 ((March 31, 2016 : 16,366,200, April 1, 2015 : 16,366,200) Units of `10 each of IDFC Fixed Term Plan Series 85-369D Growth
2,095.64 1,945.61 1,792.79
10,000,000 (March 31, 2016 : 10,000,000, April 1, 2015 : 10,000,000) units of ` 10 each of ICICI Prudential FMP Series 73-368 D-Plan M Growth
1,277.76 1,189.22 1,094.18
5,500,000 (March 31, 2016 : 5,500,000, April 1, 2015 : 5,500,000) units of ` 10 each of DSP Black Rock FMP Series 161-12 Month Growth
699.71 647.86 598.71
17,680.56 22,345.13 20,606.20 Total Non Current Investment 18,584.20 23,141.55 22,795.56 Aggregate amount of quoted investments - At Cost 13,426.62 18,208.04 18,208.04 Aggregate amount of quoted investments - At Market Value 17,680.56 22,345.13 20,606.20 Aggregate amount of unquoted investments 903.64 796.42 2,189.36 Category-wise Non current investmentFinancial assets carried at cost - - 1,471.17 Financial assets measured at fair value through Profit & Loss 18,583.91 23,141.26 21,323.98 Financial assets carried at amortised cost 0.29 0.29 0.41 Total Non current Investment 18,584.20 23,141.55 22,795.56
8. NON CURRENT FINANCIAL ASSETS - TRADE RECEIVABLES ( ` in lakhs)
ParticularsAs at
March 31, 2017
As at March 31,
2016
As at April 1,
2015Unsecured Considered Doubtful 10.04 10.04 244.30 Less: Provision for Doubtful Debts 10.04 10.04 244.30
- - -
(` in lakhs)
NOTES ON CONSOLIDATED FINANCIAL STATEMENTS FOR ThE YEAR ENDED ON MARCh 31, 2017 (Contd.)

145
Corporate Overview Statutory Reports Standalone Financial Statement Consolidated Financial Statement01-13 14-68 69-123 124-179
9. NON CURRENT FINANCIAL ASSETS - LOANS Unsecured considered good (` in lakhs)
ParticularsAs at
March 31, 2017
As at March 31,
2016
As at April 1,
2015Loans to Employees 30.43 15.34 17.83
30.43 15.34 17.83
10. NON CURRENT FINANCIAL ASSETS - OThERS Unsecured considered good (` in lakhs)
ParticularsAs at
March 31, 2017
As at March 31,
2016
As at April 1,
2015Security Deposits for leased premises 298.51 86.11 79.17 Other Security Deposits 329.48 405.60 360.17 Fixed Deposit having maturity more than 12 months # 20.78 205.45 46.49 # Includes ` 7.60 lakhs (March 31, 2016 : ` 7.60 lakhs, April 1, 2015 : ` 7.60 lakhs) held as security against bank guarantee
5.00 697.16 485.83
11. OThER NON CURRENT ASSETSUnsecured considered good (` in lakhs)
ParticularsAs at
March 31, 2017
As at March 31,
2016
As at April 1,
2015Capital Advances 263.91 1,755.99 1,196.62 Prepaid Expenses 16.63 33.25 12.91 Prepaid Lease Rent 50.22 4.04 10.86
330.76 1,793.28 1,220.39
12. CURRENT ASSETS- INVENTORIES (` in lakhs)
ParticularsAs at
March 31, 2017
As at March 31,
2016
As at April 1,
2015Raw materials (Stock-in-transit ̀ Nil, March 31, 2016: ̀ 71.05, April 1, 2015: ̀ Nil) 5,319.23 4,109.13 4,852.43 Packing Materials 2,029.79 2,346.80 1,804.18 Work-in-progress 1,414.03 1,626.94 1,245.27 Finished goods (Stock-in-transit ` 470.74, March 31, 2016 ` 282.53, April 1, 2015 ` 575.39)
9,939.43 4,515.64 4,159.48
Stock-in-trade 1,276.40 6,173.99 1,902.46 Fuel 37.98 25.83 27.29
20,016.86 18,798.33 13,991.11
NOTES ON CONSOLIDATED FINANCIAL STATEMENTS FOR ThE YEAR ENDED ON MARCh 31, 2017 (Contd.)

146
Annual Report 2016-17J. B. Chemicals & Pharmaceuticals Limited
13. CURRENT FINANCIAL ASSETS-INVESTMENTS (` in lakhs)
ParticularsAs at
March 31, 2017
As at March 31,
2016
As at April 1,
2015
In Mutual Funds : Quoted - (At fair value through profit & loss)
7,381,837.65 (March 31,2016 : 14,905,323.290, April 1, 2015 : 33,728,297.052) Units of ` 10 each of Birla Sun Life Dynamic Bond Fund-Retail-Growth
2,143.24 3,926.18 8,244.07
Nil (March 31, 2016 : Nil, April 1, 2015 7,660,630.319 ) Units of ` 10 each of HDFC High Interest Fund Short Term Plan - Growth
- - 2,114.22
Nil (March 31, 2016 : Nil, April 1, 2015 :13,021,055.072 ) Units of ` 10 each of ICICI Prudential Short Term Plan - Growth
- - 3,854.97
6,628,677.94 (March 31, 2016 : 10,277,332.185, April 1, 2015 10,277,332.185) Units of ` 10 each of Birla Sun life Short Term Fund-Growth
4,127.80 5,845.50 5,377.62
9,600,000 (March 31, 2015 : 12,196,280.245, April 1, 2015 : 20,476,362.088) Units of ` 10 each of HDFC Short Term Opportunities Fund-Growth
1,726.84 2,014.81 3,119.82
Nil (March 31, 2016 : Nil, April 1, 2015 : 9,710,086.366 ) Units of ` 10 each of HDFC Floating Rate Fund Income Fund Short Term Plan-Growth
- - 2,326.27
Nil (March 31, 2016 : 24,033,329.985, April 1, 2015 : 24,033,329.985) Units of ` 10 each of IDFC Dynamic Bond Fund-Plan B-Growth
- 4,284.97 4,076.36
112,584.469 (March 31, 2016 : 147,118.682, April 1, 2015 : 123,134.423) Units of ` 1,000 each of DSP Black Rock strategic bond-Institutional Plan-Growth
2,206.82 2,611.89 2,057.17
Nil (March 31, 2016 : Nil, April 1, 2015 :1,029,804.264) Units of ` 10 each of Birla Sunlife Savings Fund -Growth
- - 2,770.87
Nil (March 31, 2016 : Nil, April 1, 2015 : 558,466.741) Units of ` 10 each of Birla Sun Life Cash Plus Growth
- - 1,252.55
Nil (March 31, 2016 : Nil, April 1, 2015 :1,426,975.95) units of ` 10 each of ICICI Prudential Liquid Plan-Growth
- - 2,951.80
14,960,414.311 (March 31, 2016 : 14,960,414.311,April 1, 2015 : 14,960,414.311) units of ` 10 each of HDFC Medium Term Opportunities Fund Post Growth
2,708.96 2,466.54 2,272.94
Nil (March 31, 2016: 5,000,000, April 1, 2015: 5,000,000l) Units of ` 10 each of Bank Of India AXA Fixed Maturity Plan-Series 14 (366 Days)-Growth
- - 543.04
1,258,152.830 (March 31, 2016 : 1,258,152.830, April 1, 2015: 1,258,152.830) Units of ` 10 each of Birla Sun Life Treasury Optimiser Plan Growth
2,619.31 2,373.86 2,186.08
Nil (March 31, 2016: Nil, April 1, 2015 4320.429) Units of ` 1,000 each of DSP Black Rock Liquidity Fund Institutional Plan Growth
- - 86.39
Nil (March 31, 2016 : Nil, April 1, 2015 : 587,704.023) Units of ` 10 each of HDFC Floating Rate income Fund LTP Growth
- - 143.12
Nil (March 31, 2016 : Nil, April 1, 2015 : 222,181.321) Units of ` 10 each of HDFC Floating Rate Income Fund STP Wholesale Option Growth
- - 53.23
671,214.160 (March 31, 2016: 288,684.703, April 1, 2015 : Nil) units of ` 10 each of HDFC Balanced Fund Growth
879.75 306.98 -
614,895.941 (March 31, 2016 : 256,915.235, April 1, 2015: Nil) units of ` 10 each of ICICI Prudential Balanced Fund Growth
702.58 229.91 -
562,478.145 (March 31, 2016: 402,765.883, April 1, 2015 : Nil) units of ` 10 each of Franklin India Balanced Fund Growth
586.45 363.87 -
NOTES ON CONSOLIDATED FINANCIAL STATEMENTS FOR ThE YEAR ENDED ON MARCh 31, 2017 (Contd.)

147
Corporate Overview Statutory Reports Standalone Financial Statement Consolidated Financial Statement01-13 14-68 69-123 124-179
ParticularsAs at
March 31, 2017
As at March 31,
2016
As at April 1,
2015
Nil (March 31, 2016: 185,664.255, April 1, 2015 : Nil) units of ` 10 each of Tata Balanced fund Regular Growth
- 303.80 -
4,066,953.677 (March 31, 2016: Nil, April 1, 2015 : Nil) units of ` 10 each of HDFC Medium Term Opportunities Fund Direct Growth
739.27 - -
3,631,279.845 (March 31, 2016: Nil, April 1, 2015 : Nil) units of ` 10 each of ICICI Prudential Income Opportunities Fund Direct Growth
847.04 - -
401,795.826 (March 31, 2016: Nil, April 1, 2015 : Nil) units of ̀ 10 each of Birla Treasury Optimizer Fund Direct Growth
845.15 - -
12,249,128.427 (March 31, 2016: Nil, April 1, 2015 : Nil) unit of ` 10 each of IDFC Corporate Bond Fund Direct Growth
1,373.85 - -
485,440.146 (March 31, 2016: Nil, April 1, 2015: Nil) units of ` 10 each of DSP Blackrock Balance Fund -Growth
637.69 - -
1,692,906.721 (March 31, 2016: Nil, April 1, 2015: Nil) units of ` 10 each of ICICI Prudential Long Term Fund Direct Growth
351.41 - -
22,496.16 24,728.31 43,430.52
Aggregate amount of quoted investments - At Cost 17,878.52 19,524.97 36,678.16
Aggregate amount of quoted investments - At Market Value 22,496.16 24,728.31 43,430.52
14. CURRENT FINANCIAL ASSETS - TRADE RECEIVABLES(Unsecured, considered good unless otherwise stated) (` in lakhs)
ParticularsAs at
March 31, 2017
As at March 31,
2016
As at April 1,
2015Considered Good 26,681.85 27,283.26 24,025.22 Considered Doubtful 267.25 430.71 -
26,949.10 27,713.97 24,025.22 Less : Provision for Doubtful Debts 352.48 449.80 -
26,596.62 27,264.17 24,025.22
15. CURRENT FINANCIAL ASSETS - CASh AND CASh EQUIVALENTS (` in lakhs)
ParticularsAs at
March 31, 2017
As at March 31,
2016
As at April 1,
2015a. Balances with banks 855.05 915.41 1,085.14 b. Unclaimed Dividend A/cs * 224.60 288.08 156.21 c. Fixed Deposits with maturity of less than 12 months 239.58 61.13 494.12 d. Cash on hand 18.82 25.00 26.96 e. Post Office Saving Account 0.60 0.60 0.60
1,338.65 1,290.22 1,763.03
*The amount is to be utilised towards settlement of respective unpaid dividends.
NOTES ON CONSOLIDATED FINANCIAL STATEMENTS FOR ThE YEAR ENDED ON MARCh 31, 2017 (Contd.)
(` in lakhs)

148
Annual Report 2016-17J. B. Chemicals & Pharmaceuticals Limited
16 CURRENT FINANCIAL ASSETS - LOANSUnsecured considered good (` in lakhs)
ParticularsAs at
March 31, 2017
As at March 31,
2016
As at April 1,
2015Advances to Employees 77.60 74.64 39.03 Loans to others 15.01 - -
92.61 74.64 39.03
17. CURRENT FINANCIAL ASSETS - OThERSUnsecured considered good (` in lakhs)
ParticularsAs at
March 31, 2017
As at March 31,
2016
As at April 1,
2015 Security Deposits 64.83 105.15 77.72 Security Deposits for lease premises 26.73 6.81 7.24 Forward Contract Receivable - 234.42 409.54 Other Advances 16.59 50.00 225.00 Accrued interest on Deposits and others 5.90 17.01 37.91
114.05 413.39 757.41
18. OThER CURRENT ASSETSUnsecured, considered good (` in lakhs)
ParticularsAs at
March 31, 2017
As at March 31,
2016
As at April 1,
2015Advances to Suppliers 420.89 347.01 424.95 Balance with Excise Authorities 4.10 4.20 2.75 Other Advances 8,409.08 8,687.44 7,964.11 8,834.07 9,038.65 8,391.81
19. EQUITY ShARE CAPITAL (` in lakhs)
ParticularsAs at
March 31, 2017
As at March 31,
2016
As at April 1,
2015Authorised101,500,000 (March 31, 2016: 101,500, 000, April 1, 2015: 101,500,000) Equity Shares of ` 2 each
2,030.00 2,030.00 2,030.00
Issued, Subscribed & Fully Paid up84,819,975 (March 31, 2016: 84,819,975, April 1, 2015: 84,808,225) Equity Shares of ` 2 each
1,696.40 1,696.40 1,696.16
Less: Share Capital Cancelled on Amalgamation - - 866.85 Add: Share Capital Pending Allotment - - 866.85
1,696.40 1,696.40 1,696.16
NOTES ON CONSOLIDATED FINANCIAL STATEMENTS FOR ThE YEAR ENDED ON MARCh 31, 2017 (Contd.)

149
Corporate Overview Statutory Reports Standalone Financial Statement Consolidated Financial Statement01-13 14-68 69-123 124-179
Reconciliation of the shares outstanding and amount of Share Capital
ParticularsAs at
March 31, 2017As at
March 31, 2016As at
April 1, 2015Number `in lakhs Number ` in lakhs Number ` in lakhs
Shares Outstanding at the beginning of the year
84,819,975 1,696.40 84,808,225 1,696.16 84,731,625 1,694.63
Shares issued during the year pursuant to Employees Stock Option Scheme
- - 11,750 0.24 76,600 1.53
Shares outstanding at the year end 84,819,975 1,696.40 84,819,975 1,696.40 84,808,225 1,696.16
The Company has only one class of issued shares having par value of ` 2/-. Each holder of equity shares is entitled to one vote per share and carries identical right as to dividend. These shares are not subject to any restrictions.
Details of shareholders holding more than 5% shares.
Particulars
As at March 31, 2017
As at March 31, 2016
As at April 1, 2015
No of Shares
% of holding
No of Shares
% of holding
No of Shares
% of holding
Jyotindra B. Mody 5,371,905 6.33 5,371,905 6.33 473,490 0.56Dinesh Bhagwanlal Mody 5,241,432 6.18 4,738,932 5.59 300 0.00Shirish Bhagwanlal Mody 5,056,312 5.96 5,056,312 5.96 227,550 0.27Kumud Dinesh Mody 4,839,984 5.71 4,839,944 5.71 104,865 0.12Bharati S. Mody 4,963,002 5.85 4,963,002 5.85 153,655 0.19Pallavi Bharat Mehta 5,201,207 6.13 5,201,207 6.13 310,890 0.37Pranabh Dinesh Mody 4,940,172 5.82 4,940,172 5.82 177,325 0.21Nirav Shirish Mody 4,984,979 5.88 4,984,979 5.88 218,500 0.26Jyotindra Mody Holdings Pvt. Ltd. - - - - 7,466,242 8.81Dinesh Mody Securities Pvt. Ltd. - - - - 7,055,326 8.33Shirish B. Mody Investments Pvt. Ltd. - - - - 6,530,601 7.71Ansuya Mody Securities Pvt. Ltd. - - - - 7,234,882 8.54Kumud Mody Securities Pvt. Ltd. - - - - 7,181,232 8.48Bharati S. Mody Investments Pvt. Ltd. - - - - 7,873,987 9.29Ashish Dhawan - - 5,193,530 6.12 8,179,608 9.65
Shares reserved for issue under ESOP
In the year 2004, the Company has instituted the Employees Stock option Scheme, under which 2,500,000 equity shares of ` 2 each have been reserved. Under the Scheme, the options are granted at an amount equal to ninety five percent of the average daily closing price of the shares of the Company’s share quoted on National Stock Exchange of India Ltd. during the period of twelve weeks preceding the date of grant.These options vest in four equal installments and subject to other provisions of the Scheme, are exercisable within a period of five years from the respective date of vesting.
The activity under ESOP scheme during the year was as under.
ParticularsAs at
March 31, 2017
As at March 31,
2016
As at April 1,
2015Options outstanding at the beginning of the period (No of shares) - 35,875 1,67,350 Less:: Excercised - 11,750 76,600 Lapsed - 24,125 54,875 Options outstanding at the end of the period (No of shares) - - 35,875
NOTES ON CONSOLIDATED FINANCIAL STATEMENTS FOR ThE YEAR ENDED ON MARCh 31, 2017 (Contd.)

150
Annual Report 2016-17J. B. Chemicals & Pharmaceuticals Limited
20.
OTh
ER E
QU
ITY
(` in
lak
hs)
Res
erve
s an
d Su
rplu
sO
ther
Co
mpr
ehen
sive
In
com
e
Tota
l
Part
icul
ars
Capi
tal R
eser
ves
(tra
nsfe
rred
from
am
alga
mat
ing
com
pany
)
Oth
er R
eser
ves
Inve
stm
ent
allo
wan
ce
Res
erve
(u
tilis
ed)
Capi
tal
Res
erve
Cap
ital
Res
erve
Cont
inge
ncy
Res
erve
Secu
ritie
s Pr
emiu
m
Res
erve
Stat
utor
y R
eser
veGe
nera
l R
eser
veR
etai
ned
Earn
ings
Fore
ign
Curr
ency
Tr
ansl
atio
n re
serv
e
Re-
mea
sure
men
t of
net
defi
ned
bene
fit p
lan
Bal
ance
as
on A
pril
1,
2015
34.
86
63.
53
4.2
1 2
,020
.00
5,6
51.3
6 2
67.4
9 46
,959
.77
65,
544.
84
-
-
1,20
,546
.06
Shar
e Pr
emiu
m re
ceiv
ed
-
-
-
-
10.
92
-
-
-
- -
1
0.92
Adju
stm
ent p
urus
ant
to c
onve
rsio
n of
Joi
nt
Vent
ure
to S
ubsi
diar
y Co
mpa
ny.
-
-
-
-
(716
.13)
-
-
-
--
(716
.13)
Tran
sfer
to G
ener
al
Res
erve
-
-
-
-
-
(267
.49)
267
.49
-
--
-
Profi
t for
the
year
-
-
-
-
-
-
-
16,
254.
65
- -
1
6,25
4.65
Adju
stm
ent o
n ac
coun
t of
sha
res
issu
ed to
non
co
ntro
lling
inte
rest
--
--
130
.67
--
(147
.85)
--
(17.
18)
Inte
rim
Div
iden
d in
clud
ing
DD
T -
-
-
-
-
-
-
(4
,593
.94)
- -
(4
,593
.94)
Div
iden
d in
clud
ing
DD
T -
-
-
-
-
-
-
(14
,292
.05)
- -
(1
4,29
2.05
)
Fore
ign
curr
ency
tr
ansl
atio
n re
serv
e-
--
--
--
- (4
73.9
2)-
(473
.92)
Actu
rial
Los
s on
defi
ned
bene
fit p
lan
net o
f de
ferr
ed ta
x
-
-
-
-
-
-
-
--
(30.
98)
(30.
98)
Bal
ance
as
on M
arch
31,
20
16 3
4.86
6
3.53
4
.21
2,0
20.0
0 5
,076
.82
-
47,2
27.2
6 6
2,76
5.65
(4
73.9
2) (3
0.98
)1,
16,6
87.4
3
Bal
ance
as
on A
pril
1,
2016
34.
86
63.
53
4.2
1 2
,020
.00
5,0
76.8
2 -
47
,227
.26
62,
765.
65
(473
.92)
(30.
98)
1,16
,687
.43
Profi
t for
the
year
-
-
-
-
-
-
-
18,
406.
27
- -
1
8,40
6.27
Div
iden
d in
clud
ing
DD
T -
-
-
-
-
-
-
(5
10.4
4)-
- (5
10.4
4)
Actu
rial
Los
s on
defi
ned
bene
fit p
lan
net o
f de
ferr
ed ta
x
-
-
-
-
-
-
-
-
- (2
70.4
3) (2
70.4
3)
Fore
ign
curr
ency
tr
ansl
atio
n re
serv
e -
-
-
-
-
-
-
-
3
57.6
7 -
357
.67
Bal
ance
as
on M
arch
31,
20
17 3
4.86
6
3.53
4
.21
2,0
20.0
0 5
,076
.82
-
47,2
27.2
6 8
0,66
1.48
(1
16.2
5) (3
01.4
1)1,
34,6
70.5
0
NOTES ON CONSOLIDATED FINANCIAL STATEMENTS FOR ThE YEAR ENDED ON MARCh 31, 2017 (Contd.)

151
Corporate Overview Statutory Reports Standalone Financial Statement Consolidated Financial Statement01-13 14-68 69-123 124-179
NATURE AND PURPOSE OF RESERVES A. Capital Reserves (transferred from amalgamating company)
This was created on amalgamation of J. B. Chemicals and Pharmaceuticals Pvt. Ltd. with this Company w.e.f. April 1, 1984 (appointed date).
B. Capital reserves
Arose pursuant to forfeiture and re-issue of shares.
C. Contingency reserve
This reserve has been created out of retained earnings, as a matter of prudence, to take care of any unforseen adverse contingencies.
D. Securities premium reserve
The amount received in excess of face value of the equity shares is recognised in Securities Premium Reserve. In case of equity-settled share based payment transactions, the difference between fair value on grant date and nominal value of share is accounted as securities premium reserve.
E. Statutory reserve
This reserve is acquired pursuant to the scheme of amalgamation of six investment companies which got amalgamated with the company from the appointed date April 1, 2014 in terms of the order of the Hon'ble Bombay High Court and in terms of the requirement of Reserve Bank of India Act, 1934. During the financial year 2015-16, the same was transferred to General Reserve pursuant to the approval from the Reserve Bank of India.
F. General reserve
The Company has transferred a portion of the net profit of the Company before declaring dividend to general reserve pursuant to the earlier provisions of Companies Act 1956. Mandatory transfer to general reserve is not required under the Companies Act, 2013.
G. Retained earnings
Retained earnings are the profits that the Company has earned till date, less any transfer to general reserve, dividends or other distribution paid to shareholders.
h. Foreign currency translation reserve
Exchange differences relating to the translation of the results and net assets of the Group’s foreign operations from their functional currencies to the Group’s presentation currency (i.e. `) are recognised directly in the other comprehensive income and accumulated in foreign currency translation reserve.
21. NON CURRENT LIABILITIES- BORROWINGS (` in lakhs)
ParticularsAs at
March 31, 2017
As at March 31,
2016
As at April 1,
2015Inter Corporate Deposit from a related party - - 40.00
- - 40.00
22. NON CURRENT LIABILITIES - PROVISIONS (` in lakhs)
ParticularsAs at
March 31, 2017
As at March 31,
2016
As at April 1,
2015Provision for Employee BenefitsGratuity 766.24 649.33 850.21Leave Encashment 489.96 393.96 352.39
1,256.20 1,043.29 1,202.60
NOTES ON CONSOLIDATED FINANCIAL STATEMENTS FOR ThE YEAR ENDED ON MARCh 31, 2017 (Contd.)
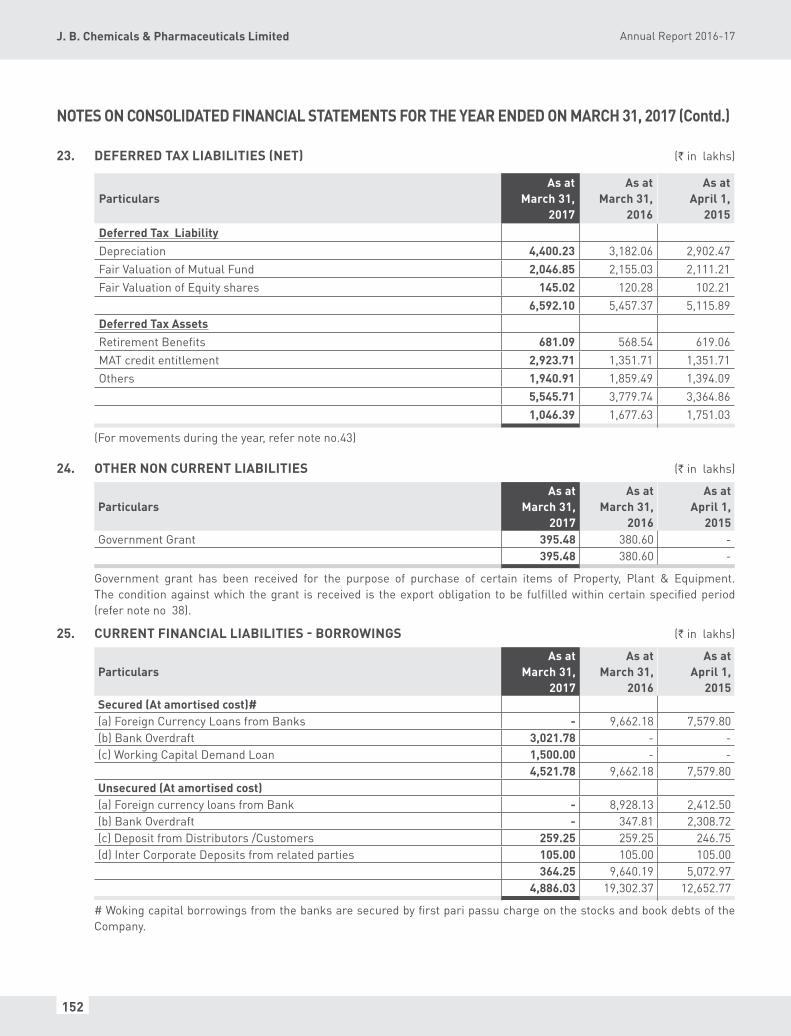
152
Annual Report 2016-17J. B. Chemicals & Pharmaceuticals Limited
23. DEFERRED TAX LIABILITIES (NET) (` in lakhs)
ParticularsAs at
March 31, 2017
As at March 31,
2016
As at April 1,
2015Deferred Tax LiabilityDepreciation 4,400.23 3,182.06 2,902.47Fair Valuation of Mutual Fund 2,046.85 2,155.03 2,111.21Fair Valuation of Equity shares 145.02 120.28 102.21
6,592.10 5,457.37 5,115.89Deferred Tax AssetsRetirement Benefits 681.09 568.54 619.06MAT credit entitlement 2,923.71 1,351.71 1,351.71Others 1,940.91 1,859.49 1,394.09
5,545.71 3,779.74 3,364.86 1,046.39 1,677.63 1,751.03
(For movements during the year, refer note no.43)
24. OThER NON CURRENT LIABILITIES (` in lakhs)
ParticularsAs at
March 31, 2017
As at March 31,
2016
As at April 1,
2015Government Grant 395.48 380.60 -
395.48 380.60 -
Government grant has been received for the purpose of purchase of certain items of Property, Plant & Equipment. The condition against which the grant is received is the export obligation to be fulfilled within certain specified period (refer note no 38).
25. CURRENT FINANCIAL LIABILITIES - BORROWINGS (` in lakhs)
ParticularsAs at
March 31, 2017
As at March 31,
2016
As at April 1,
2015Secured (At amortised cost)#(a) Foreign Currency Loans from Banks - 9,662.18 7,579.80 (b) Bank Overdraft 3,021.78 - - (c) Working Capital Demand Loan 1,500.00 - -
4,521.78 9,662.18 7,579.80 Unsecured (At amortised cost)(a) Foreign currency loans from Bank - 8,928.13 2,412.50 (b) Bank Overdraft - 347.81 2,308.72 (c) Deposit from Distributors /Customers 259.25 259.25 246.75 (d) Inter Corporate Deposits from related parties 105.00 105.00 105.00
364.25 9,640.19 5,072.97 4,886.03 19,302.37 12,652.77
# Woking capital borrowings from the banks are secured by first pari passu charge on the stocks and book debts of the Company.
NOTES ON CONSOLIDATED FINANCIAL STATEMENTS FOR ThE YEAR ENDED ON MARCh 31, 2017 (Contd.)

153
Corporate Overview Statutory Reports Standalone Financial Statement Consolidated Financial Statement01-13 14-68 69-123 124-179
26. CURRENT FINANCIAL LIABILITIES - TRADE PAYABLES (` in lakhs)
ParticularsAs at
March 31, 2017
As at March 31,
2016
As at April 1,
2015Payable to Micro, Small and Medium Enterprises 104.53 116.17 88.55 Payable to Others 9,793.18 8,968.92 7,030.20
9,897.71 9,085.09 7,118.75
The details of amount outstanding to Micro, Small and Medium Enterprise based on available information with the Company is as under:
(` in lakhs)
ParticularsAs at
March 31, 2017
As at March 31,
2016
As at April 1,
2015a) The Principal amount and the interest due thereon remaining unpaid to
any supplier as at the end of each accounting year Principal 104.53 116.17 88.55 Interest due thereon - - -
b) The amount of interest paid by the buyer in terms of S. 16 of Micro, Small and Medium Enterprise Development Act, 2006.
- - -
c) The amount of payment made to supplier beyond the appointed day during the each accoutning year.
868.92 788.04 730.43
d) The amount of interest due and payable for the period of delay in making payment (which have been paid but beyond the appointed day during the year) but without adding interest specified under the Micro, Small and Medium Enterprise Development Act, 2006.
- - -
e) The amount of interest accrued and remaining unpaid at the end of each accounting year
91.39 84.43 70.43
f) The amount of further interest remaining due and payable even in succeeding years, until such date when interest dues above are actually paid to the small enterprise, for the purpose of disallowance of a deductible expenditure under S. 23 of Micro, Small and Medium Enterprise Development Act, 2006.
6.96 14.40 16.12
The above infromation regarding Micro, Small and Medium Enterprises has been determined to the extent such parties have been identified on the basis of information available with the Company. This has been relied upon by the auditors.
The delayed payment has been computed having regard to specified credit period of 45 days under Micro, Small and Medium Enterprise Development Act, 2006. However there is no delay in terms of agreed credit terms with these suppliers.
27. CURRENT FINANCIAL LIABILITIES - OThERS (` in lakhs)
ParticularsAs at
March 31, 2017
As at March 31,
2016
As at April 1,
2015(a) Current maturities of long-term debt Vehicle loan (secured) - - 8.83 (b) intercorporate Deposit from a related party - 40.00 - (c) Interest accrued and due on borrowings - 6.04 5.23 (d) Unclaimed Dividends 224.60 288.08 156.21 (e) Creditors for capital expenditure 1,689.68 2,159.34 603.45 (f) Forward contract payable 196.00 - -(g) Other payables 9,259.98 11,313.11 7,605.30 (h) Security Deposit from Customers 6.00 5.00 -
11,376.26 13,811.57 8,379.02
NOTES ON CONSOLIDATED FINANCIAL STATEMENTS FOR ThE YEAR ENDED ON MARCh 31, 2017 (Contd.)

154
Annual Report 2016-17J. B. Chemicals & Pharmaceuticals Limited
28. OThER CURRENT LIABILITIES (` in lakhs)
ParticularsAs at
March 31, 2017
As at March 31,
2016
As at April 1,
2015
(a) Advance from customers 372.74 58.59 24.33
(b) Outstanding purchase consideration (Undischarged liabilities of vendors) 0.10 0.10 0.10
(c) Government grant 82.13 3.02 -
(d) Other payable 383.47 - -
838.44 61.71 24.43
29. CURRENT LIABILITIES - PROVISIONS ( ` in lakhs)
ParticularsAs at
March 31, 2017
As at March 31,
2016
As at April 1,
2015
Provision for employee benefits
Gratuity 677.31 527.76 510.86
Leave Encashment 357.70 284.03 339.78
1,035.01 811.79 850.64
30. CURRENT TAX LIABILITIES (NET) (` in lakhs)
ParticularsAs at
March 31, 2017
As at March 31,
2016
As at April 1,
2015
Provision for taxes 41,312.36 36,649.66 31,822.82
Less: Taxes Paid 41,224.97 36,608.02 31,447.42
87.39 41.64 375.40
A. ThE MAJOR COMPONENTS OF INCOME TAX EXPENSE FOR ThE YEAR ARE AS UNDER: (` in lakhs)
Particulars 2016-17 2015-16
i. Income tax recognized in the statement of profit and loss
Current Tax:
Current tax on profit for the year 4,829.49 5,013.61
Deferred tax :
Deferred Tax expenses (274.90) (55.56)
Total Income tax recognized in the statement of profit and loss 4,554.59 4,958.05
ii. Income tax recognized in other comprehensive income
Deferred tax :
Deferred Tax expenses on re-measurement of defined benefit plan 143.12 16.40
Total Income tax recognized in other comprehensive income 143.12 16.40
NOTES ON CONSOLIDATED FINANCIAL STATEMENTS FOR ThE YEAR ENDED ON MARCh 31, 2017 (Contd.)

155
Corporate Overview Statutory Reports Standalone Financial Statement Consolidated Financial Statement01-13 14-68 69-123 124-179
B. RECONCILIATION OF TAX EXPENSE AND ThE ACCOUNTING PROFIT FOR ThE YEAR IS UNDER: ( ` in lakhs)
Particulars 2016-17 2015-16Accounting Profit before income tax expenses 22,994.41 21,223.10 Enacted tax rate in India (%) 34.608 34.608Expected income tax expense 7,957.91 7,344.89 Tax effect of :Expenses not deductible 74.33 80.67 Allowances and concessions (3,782.39) (2,882.48)Deductible expenses (Net) (1,000.18) (216.92)MAT credit Entitlement 1,572.00 - Non Taxable Subsidiaries and Effect of differential tax rate under various jurisdiction (267.07) 631.89 Tax expenses recognized in statement of profit and loss 4,554.59 4,958.05 Effective tax rate (%) 19.81 23.36
31. REVENUE FROM OPERATIONS ( ` in lakhs)
Particulars 2016-17 2015-16Sales of Products:Sale of Pharmaceuticals Products 1,32,851.80 1,18,258.14 Export of Product Development Service 386.31 527.37 Exchange Rate Difference realised 468.72 1,505.03
1,33,706.83 1,20,290.54 Other Operating Revenues:Manufacturing Charges 93.32 65.72 Export Incentives 2,554.97 2,383.01 Sale of Scrap 289.99 297.66 Government Grant 47.08 17.22 Insurance Claims 28.70 14.41 Others 110.81 89.75
3,124.87 2,867.77 1,36,831.70 1,23,158.31
Sales of Products (` in lakhs)
Particulars 2016-17 2015-16Pharmaceuticals 1,23,237.62 1,07,666.73 Active Pharmaceutical ingrediants 9,190.46 10,066.53 Others 423.72 524.88 1,32,851.80 1,18,258.14
32. OThER INCOME (` in lakhs)
Particulars 2016-17 2015-16Interest Income - Bank Deposit 32.36 58.86 - Others 85.53 58.38 Dividend From Investment designated as FVTPL - 627.02 Exchange Gain realised on Liquidation of Foreign Subsidiary - 1,211.13 Profit on sale of Investment designated as FVTPL 4,436.49 3,371.79 Net Gain/(loss) arising fromFinancial instruments designated as FVTPL (361.65) 268.27 Profit on sale of Assets (Net) 183.92 - Provision for Doubtful debts Written Back 11.00 - Other Miscellaneous Income 397.77 69.91 Excess provision written back 230.28 -
5,015.70 5,665.36
NOTES ON CONSOLIDATED FINANCIAL STATEMENTS FOR ThE YEAR ENDED ON MARCh 31, 2017 (Contd.)

156
Annual Report 2016-17J. B. Chemicals & Pharmaceuticals Limited
33. COST OF MATERIAL CONSUMED (` in lakhs)
Particulars 2016-17 2015-16 Opening Inventories 6,455.93 6,656.61 Purchases 37,558.21 37,107.16
44,014.14 43,763.77 Less: Closing Inventories 7,304.78 6,455.93
36,709.36 37,307.84
34. EMPLOYEE BENEFITS EXPENSE (` in lakhs)
Particulars 2016-17 2015-16 Salaries and Other Benefits 18,813.80 15,918.38 Contribution to Provident Fund and Other Funds 1,342.76 1,100.77 Gratuity 166.76 157.31 Staff Welfare 331.05 354.22
20,654.37 17,530.68
35. FINANCE COST (` in lakhs)Particulars 2016-17 2015-16 Interest Expenses: Interest on Working capital borrowings 206.85 221.41 Applicable net loss on foreign currency transactions and translations 190.60 681.95 Interest cost Employee Benefit 93.12 107.21 Other Borrowing Cost: Loan Processing Charges 30.74 21.60 Guarantee Charges 15.85 32.42
537.16 1,064.59
36. OThER EXPENSES (` in lakhs)
Particulars 2016-17 2015-16 Manufacturing charges 731.71 790.22 Stores and spares 692.65 850.54 Power and fuel 5,489.14 5,528.34 Excise duty 2,403.31 2,121.56 Compensation rent 1,027.26 617.14 Rates and taxes 168.09 156.18 Insurance 306.58 248.93 Freight and transport charges 4,357.36 3,743.70 Repairs to :-
Building 386.19 294.23 Machinery 678.61 660.96 Others 1,253.51 867.66
Loss on sale/discard of assets (Net) - 3.33 Sales promotion and publicity 6,201.87 4,560.40 Selling commission 2,705.17 2,711.81 Travelling and conveyance 2,588.53 2,311.48 Labour Hire Charges 1,786.56 1,941.65 Laboratory Expenses 2,240.78 1,786.18 Directors' fees 48.91 62.58 Royalty 1,017.33 1,000.33
NOTES ON CONSOLIDATED FINANCIAL STATEMENTS FOR ThE YEAR ENDED ON MARCh 31, 2017 (Contd.)

157
Corporate Overview Statutory Reports Standalone Financial Statement Consolidated Financial Statement01-13 14-68 69-123 124-179
Particulars 2016-17 2015-16 Payment to Auditors
Audit fees 52.94 51.10 Tax Audit fees 12.00 12.00 Other Taxation matters 15.00 15.00 Certification matters 6.50 7.91
CSR Activity Expenses 265.23 243.58 Donations 38.61 11.35 Net loss on foreign currency transactions and translation 381.15 2,261.04 Provision for doubtful debts 279.40 449.80 Miscellaneous expenses 5,007.89 4,696.28
40,142.29 38,005.28
37. COMMITMENTS & CONTINGENCIES: COMMITMENTS
• CapitalCommitments: (` in lakhs)
ParticularsAs at
March 31, 2017
As at March 31,
2016
As at April 1,
2015Estimated amount of contracts remaining to be executed on capital account and not provided (Net of Advance)
637.63 2,991.32 3,618.56
• OtherCommitments:
The Parent Company has imported capital good including spares under the Export Promotion Capital Goods Scheme (EPCG) utilizing the benefit of zero rate or concessional rate of Customs duty. These benefits are subject to the fulfillment of certain export obligation within the stipulated period of time under the EPCG Scheme. Such export obligation at the year-end aggregate to:
(` in lakhs)
ParticularsAs at
March 31, 2017
As at March 31,
2016
As at April 1,
2015Export obligations under EPCG Scheme 20,656.05 20,076.17 17,567.81
CONTINGENCIES• ClaimagainsttheGroupnotacknowledgedasdebts Pharmaceutical Division of Unique Pharmaceutical Laboratories Ltd. (UPLL) which was acquired by the parent
company on a going concern basis has received demand notices from Dept. of Chemicals & Fertilizers, Govt. of India, New Delhi demanding a sum of ` 461.47 lakhs in respect of the bulk drug Metronidazole and a further sum of ` 591.05 lakhs in respect of the bulk drug Oxyphenbutazone. These amounts were claimed on hypothetical basis in 1996, under Para 7(2) of DPCO 79 read with Para 14 of DPCO 87 and Para 12 of DPCO 95, long after repeal of DPCO 79 and DPCO 87 and gains allegedly notionally made by it by procuring the bulk drugs at alleged lower cost. UPLL has filed review petition against each of these claims disputing the jurisdiction, power and legal or rational basis for making such demands, particularly in view of the repeal of DPCO 79 and DPCO 87. The Parent company has filed writ petitions bearing No. 446 of 2008 in respect of demand for Oxyphenbutazone & writ petition No. 2623 of 2007 in respect of demand for Metronidazole in Bombay High Court. These writ petitions have been admitted and the Hon'ble High Court has restrained the Government from adopting coercive steps to recover the amount till the disposal of the Writ Petition on the Parent Company furnishing security as per the orders. The Parent Company has already furnished the bank guarantee as security. As per the legal advice received by the Parent Company, there is no liability and accordingly no provision is being made in the Accounts for these claims and demands.
(` in lakhs)
NOTES ON CONSOLIDATED FINANCIAL STATEMENTS FOR ThE YEAR ENDED ON MARCh 31, 2017 (Contd.)

158
Annual Report 2016-17J. B. Chemicals & Pharmaceuticals Limited
(` in lakhs)
ParticularsAs at
March 31, 2017
As at March 31,
2016
As at April 1,
2015Central Excise & Service tax demands / show causes (against which the Parent Company has made pre deposit of ` 7.17 lakhs, ` 6.55 lakhs March 31, 2016 and ` 2.15 lakhs April 1, 2015)
594.67 529.51 554.04
Income Tax (against which the Parent Company has made pre deposit of ̀28.61 lakhs, ̀ 28.61 lakhs March 31, 2016 and ̀ 20.98 lakhs April 1, 2015)
71.79 71.79 20.98
Sales Tax (against which the Parent Company has made pre deposit of ` 0.43 lakhs, ` 0.43 lakhs March 31, 2016 and ` 3.55 lakhs April 1, 2015)
8.34 4.12 11.82
Letter of Credit (LC) opened by the Banks 1,487.54 940.81 3,035.18Guarantees issued by bank on behalf of the Parent Company 1,443.09 2,004.13 1,605.16Corporate guarantee given by the Parent Company to a bank in respect of loan taken by a Wholly Owned Subsidiary
2,594.40 2,650.00 2,500.00
Surrender of 0% EPCG License under Status Holder Incentive Scrip - 177.99 -
38. Travelling expenses of field personnel include incidental expenses on conveyance, postage, stationery and miscellaneous expenses, etc.
39. Excise Duty under “Other expenses” includes the differential excise duty on closing stock and opening stock of finished goods and excise duty paid on the goods distributed as free goods/medical samples amounting to ` 525.81 lakhs (Previous year ` 461.98 lakhs)
40. EMPLOYEE BENEFITS:a. Defined Contribution Plan
Contribution to defined contribution plan, recognized as expenses for the year are as under: (` in lakhs)
Particulars 2016-17 2015-16
Employer’s Contribution to Provident Fund & Family Pension Fund 923.28 821.46
Employer’s Contribution to Superannuation Fund 205.74 185.17
Employer’s Contribution to Employees’ State Insurance Scheme 34.37 30.92
Employer’s Contribution under various Government Scheme 161.28 77.21
b. Defined Benefit Plan-Gratuity
Gratuity is payable to all eligible employees of the Parent Company on retirement, death, permanent disablement and resignation in terms of the provision of the Payment of Gratuity Act, 1972. The benefits would be paid at the time of separation.
i. Changes in Present Value of defined Benefit Obligation during the year (` in lakhs)
Particulars 2016-17 2015-16Present value of Defined Benefit Obligation at the beginning of the year 3,241.78 2,909.80 Interest Cost 261.61 231.04 Current Service Cost 166.76 157.31 (Benefit Paid From the Fund) (243.11) (112.80)Actuarial (Gains)/Losses on Obligations - Due to Change in Demographic Assumptions - - Actuarial (Gains)/Losses on Obligations - Due to Change in Financial Assumptions 128.29 (29.41)Actuarial (Gains)/Losses on Obligations - Due to Experience 260.59 85.83 Present value of Defined Benefit Obligation at the end of the year 3,815.92 3,241.78
NOTES ON CONSOLIDATED FINANCIAL STATEMENTS FOR ThE YEAR ENDED ON MARCh 31, 2017 (Contd.)

159
Corporate Overview Statutory Reports Standalone Financial Statement Consolidated Financial Statement01-13 14-68 69-123 124-179
ii. Changes in fair value of plan assets during the year (` in lakhs)Particulars 2016-17 2015-16Fair Value of Plan Assets at the Beginning of the year 2,087.86 1,559.51 Interest Income 168.49 123.83 Contributions by the Employer 751.98 508.27 (Benefit Paid from the Fund) (243.11) (112.80)Return on Plan Assets, Excluding Interest Income (24.66) 9.05 Fair Value of Plan Assets at the end of the year 2,740.56 2,087.86
iii. Net (asset)/liability recognized in the balance sheet (` in lakhs)
Particulars 31-3-17 31-3-16Present Value of Benefit Obligation at the end of the year 3,815.92 3,241.78 Fair Value of Plan Assets at the end of the year (2,740.56) (2,087.86)Net (asset)/liability recognized in the Balance Sheet 1,075.36 1,153.91 Net liability – current (refer note no. 29) 677.31 527.76 Net liability – non-current (refer note no. 22) 398.05 626.15
iv. Expenses recognized in the statement of profit and loss for the year (` in lakhs)
Particulars 2016-17 2015-16Current Service Cost 166.76 157.31 Net Interest Cost 93.12 107.21 Expenses recognized 259.88 264.52
v. Recognized in other comprehensive income for the year (` in lakhs)
Particulars 2016-17 2015-16Actuarial (Gains)/Losses on Obligations - Due to Change in Financial Assumptions 128.29 (29.41)Actuarial (Gains)/Losses on Obligations - Due to Experience 260.59 85.83 Return on Plan Assets, Excluding Interest Income 24.67 (9.05)Net (Income)/Expense For the period recognized in OCI 413.55 47.38
vi. Actuarial assumptions
Particulars 2016-17 2015-16Expected Return on Plan Assets 7.57% 8.07%Rate of Discounting 7.57% 8.07%Rate of Salary Increase 4.00% 4.00%Rate of Employee Turnover 2.00% 2.00%
vii. Maturity profile of defined benefit obligation (` in lakhs)
Particulars 2016-17 2015-16Within 1 year 585.13 511.50 1-2 Year 273.14 248.91 2-3 Year 323.95 274.62 3-4 Year 259.38 311.12 4-5 Year 288.34 275.50 Above 5 Years 1,719.16 1,880.68
NOTES ON CONSOLIDATED FINANCIAL STATEMENTS FOR ThE YEAR ENDED ON MARCh 31, 2017 (Contd.)
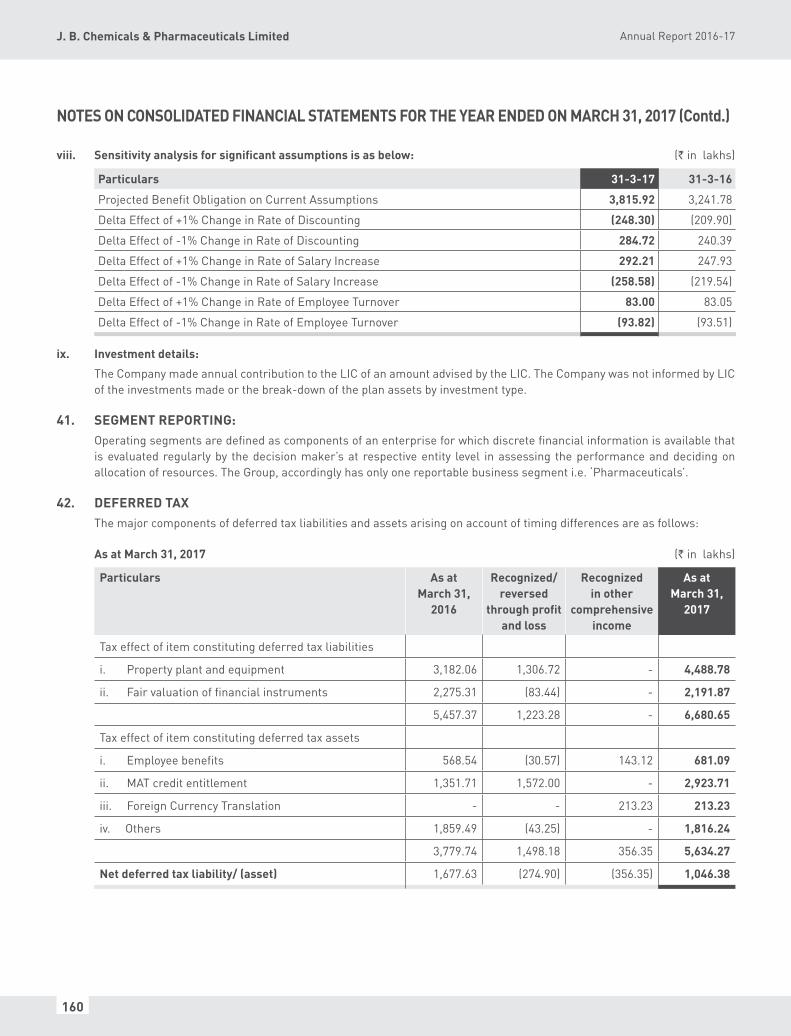
160
Annual Report 2016-17J. B. Chemicals & Pharmaceuticals Limited
viii. Sensitivity analysis for significant assumptions is as below: (` in lakhs)
Particulars 31-3-17 31-3-16
Projected Benefit Obligation on Current Assumptions 3,815.92 3,241.78
Delta Effect of +1% Change in Rate of Discounting (248.30) (209.90)
Delta Effect of -1% Change in Rate of Discounting 284.72 240.39
Delta Effect of +1% Change in Rate of Salary Increase 292.21 247.93
Delta Effect of -1% Change in Rate of Salary Increase (258.58) (219.54)
Delta Effect of +1% Change in Rate of Employee Turnover 83.00 83.05
Delta Effect of -1% Change in Rate of Employee Turnover (93.82) (93.51)
ix. Investment details:
The Company made annual contribution to the LIC of an amount advised by the LIC. The Company was not informed by LIC of the investments made or the break-down of the plan assets by investment type.
41. SEGMENT REPORTING:Operating segments are defined as components of an enterprise for which discrete financial information is available that is evaluated regularly by the decision maker’s at respective entity level in assessing the performance and deciding on allocation of resources. The Group, accordingly has only one reportable business segment i.e. ‘Pharmaceuticals’.
42. DEFERRED TAXThe major components of deferred tax liabilities and assets arising on account of timing differences are as follows:
As at March 31, 2017 (` in lakhs)
Particulars As at March 31,
2016
Recognized/ reversed
through profit and loss
Recognized in other
comprehensive income
As at March 31,
2017
Tax effect of item constituting deferred tax liabilities
i. Property plant and equipment 3,182.06 1,306.72 - 4,488.78
ii. Fair valuation of financial instruments 2,275.31 (83.44) - 2,191.87
5,457.37 1,223.28 - 6,680.65
Tax effect of item constituting deferred tax assets
i. Employee benefits 568.54 (30.57) 143.12 681.09
ii. MAT credit entitlement 1,351.71 1,572.00 - 2,923.71
iii. Foreign Currency Translation - - 213.23 213.23
iv. Others 1,859.49 (43.25) - 1,816.24
3,779.74 1,498.18 356.35 5,634.27
Net deferred tax liability/ (asset) 1,677.63 (274.90) (356.35) 1,046.38(274.90) (274.90) (356.35) 1,046.38
NOTES ON CONSOLIDATED FINANCIAL STATEMENTS FOR ThE YEAR ENDED ON MARCh 31, 2017 (Contd.)

161
Corporate Overview Statutory Reports Standalone Financial Statement Consolidated Financial Statement01-13 14-68 69-123 124-179
As at March 31, 2016 (` in lakhs)Particulars As at March
31, 2015Recognized/
reversed through profit
and loss
Recognized in other
comprehensive income
As at March 31, 2016
Tax effect of item constituting deferred tax liabilities
i. Property plant and equipment 2,902.47 191.04 - 3,093.51
ii. Fair valuation of financial instruments 2,213.42 61.89 - 2,275.315,115.89 252.93 - 5,368.82
Tax effect of item constituting deferred tax assetsi. Employee benefits 619.06 (66.92) 16.40 568.54ii. MAT credit entitlement 1,351.71 - - 1,351.71iii. Foreign Currency Translation - - 1.44 1.44iv. Others 1,394.09 375.41 - 1,769.50
3,364.86 308.49 17.84 3,691.19Net deferred tax liability/ (asset) 1,751.03 (55.56) (17.84) 1,677.63
The Parent Company has the following unused tax losses under the head Long Term Capital gain under the Income Tax Act, 1961.Based on the probable uncertainty regarding the set off of these losses, the Parent Company has not recognized deferred tax asset in the Balance Sheet:
(` in lakhs)Financial Year As at
March 31, 2017Expiry Date As at
March 31, 2016Expiry Date
2013 – 2014 - - 67.58 March 31, 2022
2014 – 2015 - - 10.51 March 31, 2023
2015 – 2016 571.61 March 31, 2024 763.19 March 31, 2024 571.61 841.28
43. RELATED PARTY DISCLOSURE Related party disclosure as required by Ind AS 24, ‘Related Party Disclosures’ notified under Section 133 of the Companies
Act,2013, are given below:
Names and Relationships of the Related Parties:
I Associate Concerns/Trusts/Companies with whom transactions have taken place during the year:a. Mody Trading Company l. Bharti Mody Ventures LLP b. Mody Brothers m. Synit Drugs Pvt. Ltd.c. Jyotindra Family Trust n. Unique Pharmaceutical Laboratories Ltd.d. Dinesh Family Trust o. Ifiunik Pharmaceuticals Ltd. e. Shirish Family Trust p. Namplas Chemicals Pvt. Ltd.f. Biotech Laboratories (Pty.) Ltd. (Upto December 17, 2015) q. Gemma Jewellery Pvt. Ltd.g. J.B. Mody Enterprises LLP r. Lekar Pharma Ltd.h. Ansuya Mody Enterprise LLP s. Jyotindra Mody Ventures LLPi. Dinesh Mody Ventures LLP t. D. B. Mody Entreprises LLPj. Kumud Mody Ventures LLP u. Shirish Mody Property LLPk. Shirish ModyEnterprises LLP
II Key Management Personnel (KMP):a. Shri Jyotindra B. Modyb. Shri Dinesh B. Modyc. Shri Shirish B. Modyd. Shri Sandeep Nasa
NOTES ON CONSOLIDATED FINANCIAL STATEMENTS FOR ThE YEAR ENDED ON MARCh 31, 2017 (Contd.)
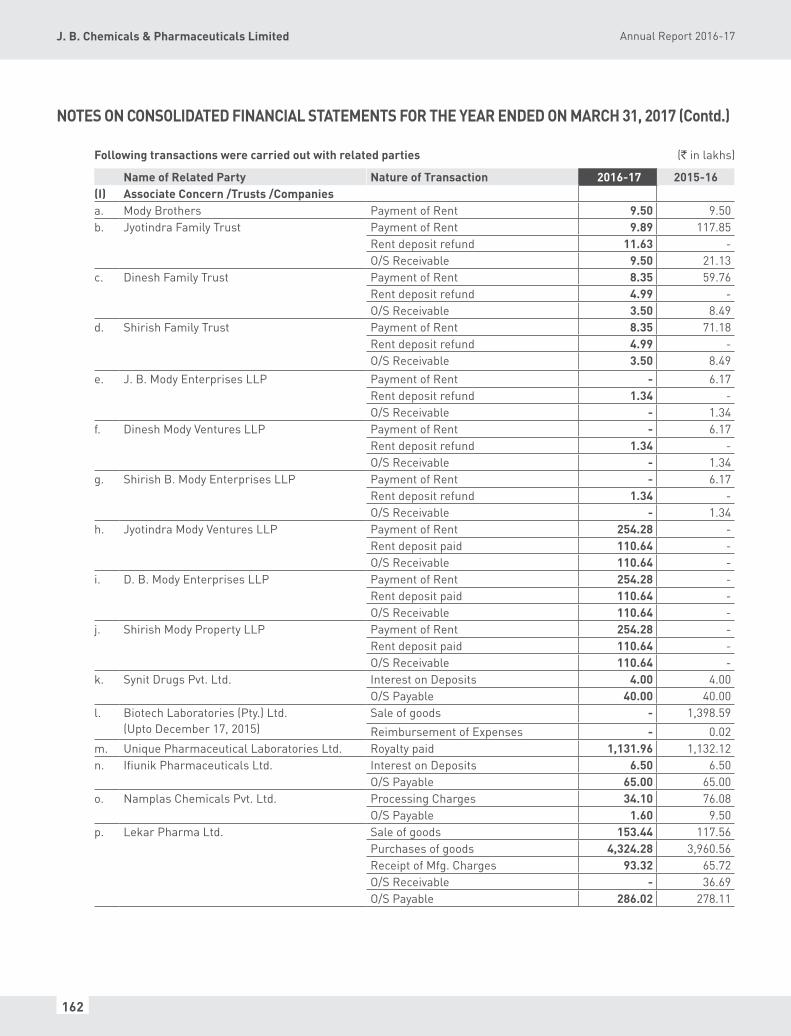
162
Annual Report 2016-17J. B. Chemicals & Pharmaceuticals Limited
Following transactions were carried out with related parties (` in lakhs)
Name of Related Party Nature of Transaction 2016-17 2015-16(I) Associate Concern /Trusts /Companiesa. Mody Brothers Payment of Rent 9.50 9.50 b. Jyotindra Family Trust Payment of Rent 9.89 117.85 Rent deposit refund 11.63 - O/S Receivable 9.50 21.13 c. Dinesh Family Trust Payment of Rent 8.35 59.76 Rent deposit refund 4.99 - O/S Receivable 3.50 8.49 d. Shirish Family Trust Payment of Rent 8.35 71.18 Rent deposit refund 4.99 - O/S Receivable 3.50 8.49 e. J. B. Mody Enterprises LLP Payment of Rent - 6.17 Rent deposit refund 1.34 - O/S Receivable - 1.34 f. Dinesh Mody Ventures LLP Payment of Rent - 6.17 Rent deposit refund 1.34 - O/S Receivable - 1.34 g. Shirish B. Mody Enterprises LLP Payment of Rent - 6.17 Rent deposit refund 1.34 - O/S Receivable - 1.34 h. Jyotindra Mody Ventures LLP Payment of Rent 254.28 - Rent deposit paid 110.64 - O/S Receivable 110.64 - i. D. B. Mody Enterprises LLP Payment of Rent 254.28 - Rent deposit paid 110.64 - O/S Receivable 110.64 - j. Shirish Mody Property LLP Payment of Rent 254.28 - Rent deposit paid 110.64 - O/S Receivable 110.64 - k. Synit Drugs Pvt. Ltd. Interest on Deposits 4.00 4.00 O/S Payable 40.00 40.00 l.
Biotech Laboratories (Pty.) Ltd. (Upto December 17, 2015)
Sale of goods - 1,398.59Reimbursement of Expenses - 0.02
m. Unique Pharmaceutical Laboratories Ltd. Royalty paid 1,131.96 1,132.12 n. Ifiunik Pharmaceuticals Ltd. Interest on Deposits 6.50 6.50 O/S Payable 65.00 65.00 o. Namplas Chemicals Pvt. Ltd. Processing Charges 34.10 76.08 O/S Payable 1.60 9.50 p. Lekar Pharma Ltd. Sale of goods 153.44 117.56 Purchases of goods 4,324.28 3,960.56 Receipt of Mfg. Charges 93.32 65.72 O/S Receivable - 36.69 O/S Payable 286.02 278.11
NOTES ON CONSOLIDATED FINANCIAL STATEMENTS FOR ThE YEAR ENDED ON MARCh 31, 2017 (Contd.)

163
Corporate Overview Statutory Reports Standalone Financial Statement Consolidated Financial Statement01-13 14-68 69-123 124-179
Name of Related Party Nature of Transaction 2016-17 2015-16(II) Key Management Personnel :a. Mr. Jyotindra B. Mody Remuneration 608.55 516.92
Retirement benefit Expenses* 61.03 62.32 b. Mr. Dinesh B. Mody Remuneration 608.55 516.92 Retirement benefit Expenses* 61.03 62.32 c. Mr. Shirish B. Mody Remuneration 608.55 516.92 Retirement benefit Expenses* 61.03 62.32 d. Mr. Sandeep Nasa Remuneration 230.56 225.77
Retirement benefit Expenses 10.85 10.64O/S Payable 32.22 21.92
(III) Relative of Key Management Personnel :a. Mr. Pranabh D. Mody Remuneration 220.14 195.68 Retirement benefit Expenses* 29.72 26.01 b. Mr. Nirav S. Mody Remuneration 124.38 110.57 Retirement benefit Expenses* 16.79 14.77 c. D. B. Mody - HUF Payment of Rent 1.41 37.19 Rent deposit refund 6.64 - O/S Receivable 6.00 12.64 d. S. B. Mody - HUF Payment of Rent 1.55 37.33 Rent deposit refund 6.64 - O/S Receivable 6.00 12.64 * Excludes provision for compensated leave and gratuity for KMP and relative of KMP as both liabilities are provided on overall basis of Parent Company, as not identified separately in actuarial valuation.
44. EARNINGS PER ShARE:
Particulars 2016-17 2015-16Net Profit attributable to Equity Shareholders (` in lakhs) 18,169.39 16,234.07Weighted Average No. of Equity shares (Nos)Basic 84,819,975 84,816,002Diluted 84,819,975 84,816,002 Nominal value of equity shares (`) 2.00 2.00Earnings per share (`)Basic 21.42 19.14Diluted 21.42 19.14
45. CSR EXPENDITUREGross amount required to be spent during the year ` 346.39 lakhs
Amount spent during the year ` 265.23 lakhs as detailed hereunder: (` in lakhs)
Nature of activity 2016-17 2015-16Promoting Healthcare including preventive healthcare 111.97 164.28Promotion of Education 152.75 76.00Eradication of Poverty and malnutrition 0.51 3.30
NOTES ON CONSOLIDATED FINANCIAL STATEMENTS FOR ThE YEAR ENDED ON MARCh 31, 2017 (Contd.)
(` in lakhs)

164
Annual Report 2016-17J. B. Chemicals & Pharmaceuticals Limited
46. FINANCIAL RISK MANAGEMENT OBJECTIVES AND POLICIESThe Group’s financial liabilities comprise mainly of borrowings, trade payables and other payables. The Group’s financial assets comprise mainly of investments, cash and cash equivalents, other balances with banks, loans, trade receivables and other receivables.
Group has exposure to following risks arising from financial instruments:
a) Credit risk
b) Liquidity risk
c) Market risk
Risk management framework
Group’s senior management (“Management”) has overall responsibility for establishment of Group’s risk management framework. Management is responsible for developing and monitoring Group’s risk management policies, under the guidance of Audit Committee. Management identifies, evaluates and analyses the risks to which the Group is exposed to and set appropriate risk limits and controls to monitor risks and adherence to limits.
Management periodically reviews its risk policy and systems to assess need for changes in the policies to adapt to the changes in market conditions and align the same to the business of the Group. Management through its interaction and training to concerned employees aims to maintain a disciplined and constructive control environment in which concerned employees understand their roles and obligations. The Audit committee oversees how management monitors compliance with Group’s risk management policies and procedures, and reviews the adequacy of the risk management framework in relation to the risks to which Group is exposed. The Audit committee is assisted in its role by the internal auditor wherever required. Internal auditor undertakes both regular and adhoc reviews of risk management controls and procedures, the results of which are reported to the Audit committee.
a) Credit risk:
Credit risk is the risk that a counter party will not meet its obligations under a financial instrument or customer contract, leading to a financial loss. The Group is exposed to credit risk from its operating activities (primarily trade receivables) and from its financing activities, including deposits with banks, mutual funds and financial institutions, foreign exchange transactions and other financial instruments.
The Group has adopted a policy of only dealing with counterparties that have sufficiently high credit standards and financial strength. The Group’s exposure and credit ratings of its counterparties are continuously monitored and the aggregate value of transactions is reasonably spread amongst the several counterparties.
Credit risk arising from derivative financial instruments and other balances with banks is limited and there is no collateral held against these because the counterparties are banks and recognised financial institutions with high credit ratings assigned by the reputed credit rating agencies.
As regards, credit risk for investment in mutual funds, the Group limits its exposure to credit risk by investing mainly in debt securities issued by mutual funds which are of high credit ranking from rating agency like CRISIL or the equivalent rating agency. The Group monitors changes in credit risk by tracking published external credit ranking. Based on its on-going assessment of counterparty risk, the Group adjusts its exposure to various counterparties from time to time.
Credit risk from Trade receivables is managed by the Group’s established policy, procedures and control relating to customer credit risk management. Trade receivables are mainly from stockists, distributors and direct customers and are non-interest bearing. Trade receivables generally range from 30 - days to 180 - days credit term. Credit limits are established for all customers based on internal criteria and any deviation in credit limit require approval of Head of the department and/or Directors depending upon the quantum and overall business risk. Majority
NOTES ON CONSOLIDATED FINANCIAL STATEMENTS FOR ThE YEAR ENDED ON MARCh 31, 2017 (Contd.)

165
Corporate Overview Statutory Reports Standalone Financial Statement Consolidated Financial Statement01-13 14-68 69-123 124-179
of the customers have been doing business with the Group for more than 3 years and they are being monitored by individual business managers who deals with those customers. Management monitors trade receivables on regular basis and take suitable action where needed to control the receivables crossing set criteria/limits. Also, in case of international business, particularly new customers, management reviews the business risk by evaluating economic situation of the country and the customers and generally starts the relation either on advance payment or on the basis of confirmed irrevocable letter of credit.
Management does an impairment analysis at each reporting date on an individual basis for major clients. In addition, a large number of minor receivables are grouped into homogenous groups and assessed for impairment collectively. Further, the Group’s customers base is widely distributed both economically as well as geographically and in view of the same, the quantum risk also gets spread across wide base and hence management considers risk with respect to trade receivable as low.
For trade receivables, as a practical expedient, the Group computes credit loss allowance based on a provision matrix. The provision matrix is prepared based on historically observed default rates over the expected life of trade receivables and is adjusted for forward-looking estimates.
Expected credit loss for trade receivables under simplified approach as at the end of each reporting period is as follows:
(` in lakhs)
ParticularsAs at
March 31, 2017
As atMarch 31,
2016
As atApril 1,
2015Gross carrying amount 26,959.14 27,724.01 24,269.52Expected credit loss at simplified approach 362.52 459.84 244.30Carrying amount of trade receivables (net of impairment) 26,596.62 27,264.17 24,025.22
b) Liquidity risk:
Liquidity risk is the risk that the Group may not be able to meet its present and future cash and collateral obligations without incurring unacceptable losses. The Group’s objective is to, at all times maintain optimum levels of liquidity to meet its cash and collateral requirements. The Group closely monitors its liquidity position and deploys a robust cash management system.
The Group has an established liquidity risk management framework for managing its short term, medium term and long term funding and liquidity management requirements. The Group manages the liquidity risk by maintaining adequate funds in cash and cash equivalents. The Group also has adequate credit facilities agreed with banks to ensure that there is sufficient cash or cash equivalent available to meet all its normal operating commitments in a timely and cost-effective manner. Working capital requirements are adequately addressed by internally generated funds. Trade receivables are kept within manageable levels. The Group aims to maintain the level of its cash and cash equivalents and other highly marketable debt investments at an amount in excess of expected cash outflows on financial liabilities over the next three to six months.
c) Market risk:
Market risk is the risk that the fair value of future cash flows of a financial instrument will fluctuate because of changes in market prices. Market risk comprises three types of risks;
i. interest rate risk
ii. currency risk and;
iii. Equity price risk.
NOTES ON CONSOLIDATED FINANCIAL STATEMENTS FOR ThE YEAR ENDED ON MARCh 31, 2017 (Contd.)

166
Annual Report 2016-17J. B. Chemicals & Pharmaceuticals Limited
Financial instruments affected by market risk includes borrowings, investments, trade payables, trade receivables, loans and derivative financial instruments.
The objective of market risk management is to manage and control market risk exposures within acceptable parameters, while optimizing the return.
i. Interest rate risk:
Interest rate risk is the risk that the fair value or future cash flows of a financial instrument will fluctuate because of changes in market interest rates. Since, the Group has insignificant interest bearing borrowings, the exposure to risk of changes in market interest rates is very low. The Group has not used any interest rate derivatives.
ii. Foreign currency risk:
Foreign currency risk is the risk that the fair value or future cash flows of an exposure will fluctuate due to changes in foreign exchange rates. Primarily, the exposure in foreign currencies are denominated in USD and EURO. At any point in time, the Group covers foreign currency risk by taking appropriate percentage of its net foreign currency exposure by entering into forward exchange contracts on past performance basis mostly with a maturity of less than one year from the reporting date. In respect of monetary assets and liabilities denominated other than in USD and EURO, the Group’s policy is to ensure that its net exposure is kept to an acceptable level by buying or selling foreign currencies at spot rates when necessary to address short-term imbalances.
All such hedged transactions are carried out within the guidelines set by the risk management committee. The Group does not enter into any derivative instruments for trading or speculative purposes.
The carrying amounts of the Group’s foreign currency denominated monetary items are as follows: (` in lakhs)
Currency Liabilities AssetsAs at
March 31, 2017
As at March 31,
2016
As at April 1,
2015
As at March 31,
2017
As at March 31,
2016
As at April 1,
2015USD 4,929.36 19,262.89 8,804.51 12,886.90 14,338.73 35,094.60EURO - - - 2,937.22 3,317.97 2,725.96AUD 32.24 43.39 17.52 940.49 947.46 749.11RUBLE 138.00 - - - 470.40 -OTHERS - 4.84 4.32 261.01 362.63 13.58
Details of hedged exposure in foreign currency denominated monetary items
The Group enters into forward exchange contracts to hedge against its foreign currency exposure relating to the underlying transactions and based on past performance. The Group does not enter into any derivative instruments for trading or speculative purpose.
The forward exchange contracts used for hedging foreign currency exposure and outstanding as at reporting date are as under:
Currency As at March 31, 2017 As at March 31, 2016 As at April 1, 2015
F.C. (in Mn.)
` in lakhs F.C. (in Mn.)
` in lakhs F.C. (in Mn.)
` in lakhs
Forward contract to sell USD 2.00 1,297.20 21.00 13,912.50 22.50 14,520.55
Forward contract to sell EURO 0.50 347.97 - - - -
Forward contract to buy USD 1.55 1,004.72 - - - -
NOTES ON CONSOLIDATED FINANCIAL STATEMENTS FOR ThE YEAR ENDED ON MARCh 31, 2017 (Contd.)

167
Corporate Overview Statutory Reports Standalone Financial Statement Consolidated Financial Statement01-13 14-68 69-123 124-179
Details of Unhedged exposure in foreign currency denominated monetary items:
Currency As at March 31, 2017 As at March 31, 2016 As at April 1, 2015
F.C. (in Mn.)
` in lakhs F.C. (in Mn.)
` in lakhs F.C. (in Mn.)
` in lakhs
RECEIVABLE:
USD 17.87 11,589.71 1.33 879.15 33.66 20,574.05
EURO 3.72 2,589.25 4.40 3,317.97 4.06 2,725.96
AUD 1.90 940.49 1.86 947.46 1.58 749.11
RUBLE - - 48.00 470.40 - -
Others 1.27 261.01 1.81 362.63 0.01 13.58
PAYABLE:
USD 6.05 3,924.64 29.08 19,262.89 14.09 8,804.51
AUD 0.07 32.24 0.09 43.39 0.04 17.52
RUBLE 12.00 138.00 - - - -
Others - - 0.82 4.84 0.01 4.32
The Group is mainly exposed to changes in USD and EURO. The below table demonstrates the sensitivity to a 1% increase or decrease in the USD and EURO against INR, with all other variables held constant. The sensitivity analysis is prepared on the net unhedged exposure of the Group as at the reporting date. 1% represents management’s assessment of reasonably possible change in foreign exchange rate.
(` in lakhs)
ParticularsCurrency As at
March 31, 2017
As atMarch 31,
2016
As atApril 1,
2015
1% Depreciation in INR USD 76.65 (165.18) 583.88
1% Appreciation in INR USD (76.65) 165.18 (583.88)
1% Depreciation in INR EURO 12.16 11.77 19.80
1% Appreciation in INR EURO (12.16) (11.77) (19.80)
iii. Equity Price risk:
The Group does not have any exposure to equity price risk, as there is no major investment in equity except in its own subsidiaries and accordingly, exposure to risk of changes in price is very low.
47. CAPITAL MANAGEMENT:For the purpose of the Group’s capital management, capital includes issued equity share capital, share premium and all other equity reserves attributable to the equity holders of the Group. The primary objective of the Group’s capital management is to safeguard the Group’s ability to remain as a going concern and to maintain and optimal capital structure so as to maximise shareholder’s value.
The Group manages its capital structure and makes adjustments in light of changes in economic conditions, annual operating plans and long term and other strategic investment plan. To maintain or adjust the capital structure, the Group may adjust the dividend payment to shareholders, return capital to shareholders or buy-back of shares. The current capital structure of the Group is equity based with low financing through borrowings. The Group is not subject to any externally imposed capital requirement.
NOTES ON CONSOLIDATED FINANCIAL STATEMENTS FOR ThE YEAR ENDED ON MARCh 31, 2017 (Contd.)

168
Annual Report 2016-17J. B. Chemicals & Pharmaceuticals Limited
No changes were made in the objectives, policies or processes for managing capital during the year ended March 31, 2017 and March 31, 2016.
48. FAIR VALUE MEASUREMENTA) The carrying value and Fair value of Financial assets and liabilities by categories are as follows :
(` in lakhs)
ParticularsCarrying value of the financial assets/
liabilitiesFair value of the financial assets/
liabilities
As at March 31,
2017
As at March 31,
2016
As at April 1,
2015
As at March 31,
2017
As at March 31,
2016
As at April 1,
2015Financial Assets at amortized cost (non-current)
Investment in Government securities
0.29 0.29 0.41 0.29 0.29 0.41
Loans 30.43 15.34 17.83 30.43 15.34 17.83Other financial assets 648.77 697.16 485.83 648.77 697.16 485.83Financial Assets at amortized cost (current)
Trade receivables 26,596.62 27,264.17 24,025.22 26,596.62 27,264.17 24,025.22cash and cash equivalent 1,338.64 1,290.22 1,763.03 1,338.64 1,290.22 1,763.03Loans 92.61 74.64 39.03 92.61 74.64 39.03Other financial assets 114.05 413.39 757.41 114.05 413.39 757.41Financial liabilities at amortized cost (non-current)Borrowings - - 40.00 - - 40.00Financial liabilities at amortized cost (current)Borrowings 4,886.03 19,302.37 12,652.77 4,886.03 19,302.37 12,652.77Trade payables 9,897.71 9,085.09 7,118.75 9,897.71 9,085.09 7,118.75Others 11,376.26 13,811.57 8,379.02 11,376.26 13,811.57 8,379.02Financial Assets at Fair value through profit & loss (non-current)
Investment 18,583.91 23,141.26 21,323.98 18,583.91 23,141.26 21,323.98Financial Assets at Fair value through profit & loss (current)Investment 22,496.16 24,728.31 43,430.52 22,496.16 24,728.31 43,430.52Forward contract receivable
- 234.42 409.54 - - -
Financial Liabilities at Fair value through profit & loss (current)
Forward contract payable 196.00 - - 196.00 - -
NOTES ON CONSOLIDATED FINANCIAL STATEMENTS FOR ThE YEAR ENDED ON MARCh 31, 2017 (Contd.)

169
Corporate Overview Statutory Reports Standalone Financial Statement Consolidated Financial Statement01-13 14-68 69-123 124-179
B) Level wise disclosures of financial assets and liabilities by categories are as follows :
(` in lakhs)Particulars As at
March 31, 2017
As at March 31,
2016
As at April 1,
2015
Level Valuation techniques and key inputs
Financial Assets at amortized cost (non-current)Deposit for premises 295.81 86.11 79.17 3 Discounted cash flow method
using interest rate for similar financial instrument.
Financial Assets at amortized cost (current)
Deposit for premises 21.66 6.81 7.24 3 Discounted cash flow method using interest rate for similar financial instrument.
Financial Assets at Fair value through profit & loss (non-current)
Investment in Mutual Fund 17,680.56 22,345.13 20,606.20 1 Quoted NAV in active markets.Investment in Equity shares 903.35 796.13 717.78 3 Value based on the latest
offer price with one of the items in the list on account of transfer restriction and other items being the statutory contribution nature, as per the value appearing in the books.
Financial Assets at Fair value through profit & loss (current)
Investment in mutual funds 22,496.16 24,728.31 43,430.52 1 Quoted NAV in active marketsForward contract receivable - 234.42 409.54 2 Forward contracts are valued
using readily available information from the banks.
Financial Liabilities at Fair value through profit & loss (current)
Forward contract payable 196.00 - - 2 Forward contracts are valued using readily available information from the banks.
Fair value of cash and cash equivalents, short term loans, trade receivables, trade payables, other financial assets/liabilities approximate their carrying amounts largely due to the short term maturities of these instruments. Methods and assumptions used to estimate the fair values are consistent with those used for the year ended March 31, 2016.
During the reporting period ended March 31, 2017 and March 31, 2016, there were no transfers between level 1, level 2 and level 3 fair value measurements.
A one percentage point change in the unobservable inputs used in fair valuation of level 3 assets or liabilities does not have significant input in its value.
49. RESTATEMENT ON ACCOUNT OF CORRECTION OF PRIOR PERIOD ERRORSIn the previous year, the consolidated financial statement included unaudited financial statement of the subsidiary, Biotech Laboratories (Pty.) Ltd. for period ended March 31, 2016. However, subsequently the audit of the financial statement of the subsidiary for the period ended March 31, 2016 was carried out and management of the subsidiary company noticed that they had erroneously calculated higher tax liability in the previous year which resulted in the decrease in the profit after tax. The management has rectified this error, as this rectified transaction provide reliable and more relevant information by restating the comparative information for the year ended March 31, 2016.
NOTES ON CONSOLIDATED FINANCIAL STATEMENTS FOR ThE YEAR ENDED ON MARCh 31, 2017 (Contd.)
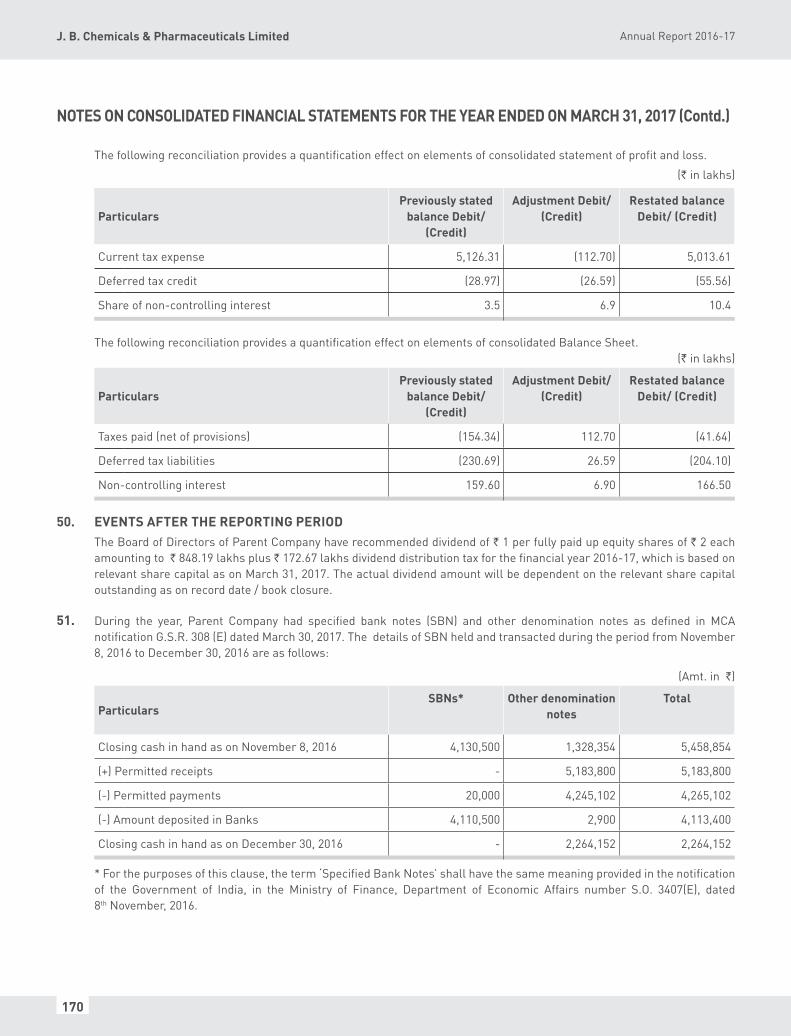
170
Annual Report 2016-17J. B. Chemicals & Pharmaceuticals Limited
The following reconciliation provides a quantification effect on elements of consolidated statement of profit and loss.
(` in lakhs)
ParticularsPreviously stated
balance Debit/(Credit)
Adjustment Debit/(Credit)
Restated balance Debit/ (Credit)
Current tax expense 5,126.31 (112.70) 5,013.61
Deferred tax credit (28.97) (26.59) (55.56)
Share of non-controlling interest 3.5 6.9 10.4
The following reconciliation provides a quantification effect on elements of consolidated Balance Sheet.(` in lakhs)
ParticularsPreviously stated
balance Debit/(Credit)
Adjustment Debit/(Credit)
Restated balance Debit/ (Credit)
Taxes paid (net of provisions) (154.34) 112.70 (41.64)
Deferred tax liabilities (230.69) 26.59 (204.10)
Non-controlling interest 159.60 6.90 166.50
50. EVENTS AFTER ThE REPORTING PERIODThe Board of Directors of Parent Company have recommended dividend of ` 1 per fully paid up equity shares of ` 2 each amounting to ` 848.19 lakhs plus ` 172.67 lakhs dividend distribution tax for the financial year 2016-17, which is based on relevant share capital as on March 31, 2017. The actual dividend amount will be dependent on the relevant share capital outstanding as on record date / book closure.
51. During the year, Parent Company had specified bank notes (SBN) and other denomination notes as defined in MCA notification G.S.R. 308 (E) dated March 30, 2017. The details of SBN held and transacted during the period from November 8, 2016 to December 30, 2016 are as follows:
(Amt. in `)
ParticularsSBNs* Other denomination
notesTotal
Closing cash in hand as on November 8, 2016 4,130,500 1,328,354 5,458,854
(+) Permitted receipts - 5,183,800 5,183,800
(-) Permitted payments 20,000 4,245,102 4,265,102
(-) Amount deposited in Banks 4,110,500 2,900 4,113,400
Closing cash in hand as on December 30, 2016 - 2,264,152 2,264,152
* For the purposes of this clause, the term ‘Specified Bank Notes’ shall have the same meaning provided in the notification of the Government of India, in the Ministry of Finance, Department of Economic Affairs number S.O. 3407(E), dated 8th November, 2016.
NOTES ON CONSOLIDATED FINANCIAL STATEMENTS FOR ThE YEAR ENDED ON MARCh 31, 2017 (Contd.)

171
Corporate Overview Statutory Reports Standalone Financial Statement Consolidated Financial Statement01-13 14-68 69-123 124-179
52. FIRST-TIME ADOPTION OF IND ASPursuant to the Companies (Indian Accounting Standard) Rules, 2015, the Group has adopted 31st March 2017 as reporting date for first time adoption of Indian Accounting Standard (Ind-AS). For all periods up to and including the year ended 31st March, 2016, the Group had prepared its consolidated financial statements in accordance with the accounting standards notified under Section 133 of the Companies Act, 2013, read together with Rule 7 of the Companies (Accounts) Rules, 2014 (‘Previous GAAP’).
For preparing these consolidated financial statements for the financial year ended on March 31, 2017, the opening balance sheet was prepared as at 1st April, 2015 (the date of transition to Ind-AS) as per the provisions of Ind AS. Also, the figures for the year ended 31st March, 2016 have been restated, regrouped and reclassified, wherever required to comply with Ind-AS and Schedule III to the Companies Act, 2013 and to make them comparable.
Ind AS 101 deals with First time adoption of Indian Accounting Standards which allows exemptions from the retrospective application and exemption from application of certain requirements of other Ind AS. On transition, the Group has availed/adopted the following exemptions/exception as per Ind AS 101:
a) The Group has elected to continue with the carrying value of all of its property, plant and equipment recognized as at 1st April, 2015 measured as per the previous GAAP and use that carrying value as the deemed cost of the property, plant and equipment.
b) The Group has elected to continue with the carrying value of all of intangible assets recognized as at 1st April, 2015 measured as per the previous GAAP and use that carrying value as the deemed cost of intangible assets.
c) Appendix C of Ind AS 17 requires an entity to assess whether a contract or arrangement contains a lease. This assessment should be carried out at the inception of the contract or arrangement. The Group has used Ind AS 101 exemption and assessed all the arrangements based for embedded leases based on the conditions in place as at the date of transition.
d) The Group has elected not to apply Ind AS 103- Business Combinations, retrospectively to past business combinations that occurred before 1st April, 2015. Consequent to use of this exemption from retrospective application:
The carrying amounts of assets and liabilities acquired pursuant to past business combinations and recognized in the financial statements prepared under Previous GAAP, are considered to be the deemed cost under Ind AS, on the date of acquisition. On the date of transition, measurement of such assets and liabilities is in accordance with respective Ind AS. Also, there is no change in classification of such assets and liabilities;
The Group has not recognized assets and liabilities that neither were recognized in the financial statements prepared under Previous GAAP nor qualify for recognition under Ind AS in the Balance Sheet of the acquiree;
The Group excluded from its opening Ind AS Balance sheet as at April 1, 2015, those assets and liabilities which were recognized in accordance with Previous GAAP but do not qualify for recognition as an asset or liability under Ind AS.
e) The requirement of Ind AS 20- Accounting for Government Grants and Disclosure of Government Assistance is opted to be applied prospectively to all grants received after the date of transition to Ind AS.
f) The Group is allowed to apply Ind AS 102 ‘Share Based Payment’ to equity instruments that remain unvested as of transition date. Accordingly, the Group has not applied Ind AS 102 to equity instruments in Share Based Payment transactions pertaining to Employee’s stock option scheme that vested before April 1, 2015.
NOTES ON CONSOLIDATED FINANCIAL STATEMENTS FOR ThE YEAR ENDED ON MARCh 31, 2017 (Contd.)

172
Annual Report 2016-17J. B. Chemicals & Pharmaceuticals Limited
Reconciliations of Balance Sheet (` in lakhs)
Particulars Note Balance Sheet as at April 1, 2015 Balance Sheet as at March 31, 2016
Amount as per IGAAP
Effects of Transition to Ind AS
Amount as per Ind AS
Amount as per IGAAP
Effects of Transition to Ind AS
Amount as per Ind AS
ASSETS
Non-current assets
(a) Property, Plant and Equipment
A 30,388.57 (4.04) 30,384.53 37,137.40 17.85 37,155.25
(b) Capital work-in-progress A 5,464.69 - 5,464.69 13,052.33 366.19 13,418.52
(c) Goodwill 1,690.23 - 1,690.23 5,314.00 - 5,314.00
(d) Other Intangible assets 777.50 (650.27) 127.23 1,552.73 - 1,552.73
(e) Intangible assets under development
52.44 - 52.44 70.48 - 70.48
(f) Financial Assets
(i) Investments B 18,483.24 4,312.32 22,795.56 18,483.12 4,658.43 23,141.55
(ii) Trade receivables - - - - -
(iiI) Loans 17.83 - 17.83 15.34 - 15.34
(iv) Other financial assets C 486.15 (0.32) 485.83 697.79 (0.63) 697.16
(g) Other non-current assets 1,228.18 (7.79) 1,220.39 1,793.28 - 1,793.28
TOTAL non-current assets 58,588.83 3,649.90 62,238.73 78,116.47 5,041.84 83,158.31
Current assets
(a) Inventories 15,027.33 (1,036.22) 13,991.11 18,798.33 - 18,798.33
(b) Financial Assets
(i) Investments B 36,678.17 6,752.35 43,430.52 19,524.97 5,203.34 24,728.31
(ii) Trade receivables J 25,825.28 (1,800.06) 24,025.22 27,284.37 (20.20) 27,264.17
(iii) Cash and cash equivalents
2,472.27 (709.24) 1,763.03 1,290.22 - 1,290.22
(iv) Loans 39.03 - 39.03 74.64 - 74.64
(v) Others 757.41 - 757.41 413.39 - 413.39
(c) Other current assets 8,360.07 31.74 8,391.81 9,038.65 - 9,038.65
TOTAL current assets 89,159.56 3,238.57 92,398.13 76,424.57 5,183.14 81,607.71
Total Assets 147,748.39 6,888.47 154,636.86 154,541.04 10,224.98 164,766.02
EQUITY AND LIABILITIES
Equity
(a) Equity Share capital 1,696.16 - 1,696.16 1,696.40 - 1,696.40
(b) Other Equity A to J 97,791.26 22,754.80 120,546.06 107,809.17 8,878.26 116,687.43
(c) Non-Controlling interest - - - 166.50* - 166.50
Total Equity 99,487.42 22,754.80 122,242.22 109,672.07 8,878.26 118,550.33
NOTES ON CONSOLIDATED FINANCIAL STATEMENTS FOR ThE YEAR ENDED ON MARCh 31, 2017 (Contd.)

173
Corporate Overview Statutory Reports Standalone Financial Statement Consolidated Financial Statement01-13 14-68 69-123 124-179
Particulars Note Balance Sheet as at April 1, 2015 Balance Sheet as at March 31, 2016
Amount as per IGAAP
Effects of Transition to Ind AS
Amount as per Ind AS
Amount as per IGAAP
Effects of Transition to Ind AS
Amount as per Ind AS
Liabilities
Non-current liabilities
(a) Financial Liabilities
(i) Borrowings 40.00 - 40.00 - - -
(b) Provisions 1,202.60 - 1,202.60 1,043.29 - 1,043.29
(c) Deferred tax liabilities (Net) H 668.05 1,082.98 1,751.03 204.10* 1,473.53 1,677.63
(d) Other non-current liabilities A - - - - 380.60 380.60
TOTAL non-current liabilities 1,910.65 1,082.98 2,993.63 1,247.39 1,854.13 3,101.52
Current liabilities
(a) Financial Liabilities
(i) Borrowings 12,687.95 (35.18) 12,652.77 19,302.37 - 19,302.37
(ii) Trade payables 7,751.39 (632.64) 7,118.75 9,085.09 - 9,085.09
(iii) Other financial liabilities 10,349.43 (1,970.41) 8,379.02 13,811.57 - 13,811.57
(b) Other current liabilities A 24.43 - 24.43 58.69 3.02 61.71
(c) Provisions E 15,161.72 (14,311.08) 850.64 1,322.22 (510.44) 811.79
(d) Current tax liabilities (Net) 375.40 - 375.40 41.64* - 41.64
TOTAL current liabilities 46,350.32 (16,949.31) 29,401.01 43,621.58 (507.42) 43,114.17
Total Equity and Liabilities 147,748.39 6,888.47 154,636.86 154,541.04 10,224.98 164,766.02
* Refer note no. 49
Reconciliation of total comprehensive income: (` in lakhs)
Particulars Note Year ended March 31, 2016
Amount as per IGAAP
Effects of Transition to Ind AS
Amount as per Ind AS
REVENUE:Revenue From Operations A,F,I 125,514.39 (2,356.08) 123,158.31Other Income B,C,I 5,415.84 249.52 5,665.36Total Income 130,930.23 (2,106.56) 128,823.67EXPENSESCost of materials consumed 37,307.84 - 37,307.84Purchases of Stock-in-trade I 14,579.68 (3,516.83) 11,062.85Changes in inventories of finished goods, I (2,526.85) 1,175.42 (1,351.43)Stock-in-trade and work-in-progressEmployee benefits expense G,I 18,411.99 (881.31) 17,530.68Finance costs G 957.38 107.21 1,064.59Depreciation and amortization expense A, I 4,123.62 (1.39) 4,122.23Other expenses A,C,D,F,I,J 37,194.12 811.16 38,005.28Total expenses 110,047.78 (2,305.74) 107,742.04
NOTES ON CONSOLIDATED FINANCIAL STATEMENTS FOR ThE YEAR ENDED ON MARCh 31, 2017 (Contd.)
(` in lakhs)
(` in lakhs)

174
Annual Report 2016-17J. B. Chemicals & Pharmaceuticals Limited
Particulars Note Year ended March 31, 2016
Amount as per IGAAP
Effects of Transition to Ind AS
Amount as per Ind AS
Profit/(loss) before tax 20,882.45 199.18 21,081.63Share of Profit of joint venture I - 141.47 141.47Profit/(loss) for the year 20,882.45 340.65 21,223.10Tax expense:1) Current tax 5,013.61 5,013.612) Deferred tax H (461.97) 406.41 (55.56)Profit/(loss) for the year 16,330.81 (65.76) 16,265.05Other Comprehensive IncomeRe-measurement of net defined benefit plan (net of deferred tax)
G - (30.98) (30.98)
Total Comprehensive Income for the period 16,330.81 (96.74) 16,234.07
Reconciliation of total equity: (` in lakhs)
Particulars NoteAs at
March 31, 2016As at
April 1, 2015
Total equity (shareholder's funds) as per previous GAAP 109,373.17 99,487.42
Correction of prior period errors (Refer Note no. 49) 132.40 -
Adjustments:
Fair valuation of Investments under Ind AS (net of tax) B 7,586.45 7,380.08
Forward contracts measured at fair value D (1.11) (45.09)
Effect of measuring of security deposit at fair value C (0.63) (0.32)
Proposed dividend including dividend distribution tax E 510.44 14,290.24
Deferred tax assets on closing stock reserve of subsidiary and joint venture
H 801.78 1,129.89
Government grant (Net of depreciation on relevant assets) A 0.42 -
ECL provision on Debtors J (19.09) -
Total adjustment to equity 8,878.26 22,754.80
Total equity under Ind AS 118,383.83 122,242.22
FOOTNOTESA. Government Grant:
Under Indian GAAP, the Group had adjusted the Government Grant related to Export Promotion Capital Goods (EPCG) scheme availed by the Parent Company to the cost of fixed assets and the exports obligation was disclosed in the notes to financial statements whereas under Ind AS, the Group has recognized the Grant as a deferred revenue which is proportionately amortized to statement of profit and loss over the export obligation period. The net impact on account of the same is increase in property, plant and equipment/Capital work in progress by ` 384.35 lakhs as at 31 March 2016 and increase in government grant by ` 400.84 lakhs as at 31 March 2016. Out of the grant of ` 400.84 lakhs, ` 17.22 lakhs (` 16.49 lakhs on account of stores and ` 0.73 lakhs on account of fixed assets) is transferred to the income of the year and balance is treated as deferred income and depreciation of ` 0.31 lakhs is recognized in the statement of profit and loss.
NOTES ON CONSOLIDATED FINANCIAL STATEMENTS FOR ThE YEAR ENDED ON MARCh 31, 2017 (Contd.)
(` in lakhs)

175
Corporate Overview Statutory Reports Standalone Financial Statement Consolidated Financial Statement01-13 14-68 69-123 124-179
B. Investment in Mutual Fund & Equity Shares:
Under Indian GAAP, the Group accounted for long term investments in unquoted and quoted equity shares and Mutual fund as Investment measured at cost less provision for other than temporary diminution in the value of investments and for current investment cost or market value whichever is lower. Under Ind AS, the Group has designated such investments as FVTPL investments. The difference between the instruments fair value and Indian GAAP carrying amount of ̀ 9,593.50 lakhs as at transition date and ` 268.27 lakhs as at 31 March, 2016 has been recognized net of related corresponding deferred taxes of ` 2,213.42 lakhs and ` 61.90 lakhs in the retained earnings and in the statement of profit and loss respectively.
C. Security Deposit under lease contract:
Under Indian GAAP, the Group had accounted for financial Assets (primarily security deposit) at the undiscounted amount whereas under Ind AS, such financial assets are recognized at present value. Accordingly, security deposits and profit before tax are decreased by ` 0.31 lakhs net (` 7.25 lakhs as lease rent and ` 6.94 lakhs as interest on present value of deposit) as at March 31, 2016 and such security deposits and retained earnings are decreased by ` 0.32 lakhs net (` 3.59 lakhs as lease rent and ` 3.27 lakhs as interest on present value of deposit) as at April 1, 2015.
D. Forward Contract to hedge foreign currency risk:
The foreign exchange forward contracts is recognized under Ind AS at the fair value, which was not recognized under Indian GAAP. The effect of this change resulting into decrease of ̀ 45.09 lakhs and ̀ 1.11 lakhs, in the retained earnings as at April 1, 2015 and in the statement of profit and loss for the year ended March 31, 2016.
E. Proposed Dividend:
Under Indian GAAP, proposed dividends including dividend distribution tax are recognized as a liability in the period to which they relate, irrespective of when they are declared. Under Ind AS, a proposed dividend is recognized as a liability in the period in which it is declared by the Group (usually when approved by shareholders in a general meeting) or paid. The effect of this change is an increase in the retained earnings as on April 1, 2015 by `14,290.24 lakhs and as on March 31, 2016 by ` 510.44 lakhs.
F. Excise Duty:
Excise duty of ` 1,659.58 lakhs on account of sale of goods has been included in revenue as it is on own account because, it is liability of the manufacturer which forms part of the production, irrespective of whether goods are sold or not.
G. Defined Benefit Liabilities:
Under Indian GAAP, the entire cost, including actuarial gains and losses, are charged to the statement of profit and loss. Under Ind AS, re-measurements comprising of actuarial gains and losses and the return on plan assets excluding amounts included in net interest on the net defined benefit liability are recognized immediately in the balance sheet with a corresponding debit or credit to retained earnings through OCI. Actuarial loss of ` 30.98 lakhs as at 1 April 2015 and ` 270.43 lakhs as at 31 March 2016 is recognized in OCI net of deferred tax.
h. Deferred tax:
Under Indian GAAP, deferred tax is accounted using the income statement approach as per timing differences between taxable profits and accounting profits for the period. Ind AS 12 requires accounting for deferred taxes using the balance sheet approach as per temporary differences between the carrying amount of an asset or liability in the balance sheet and its tax base. The application of Ind AS 12 approach has resulted in recognition of deferred tax on new temporary differences which was not required under Indian GAAP. In addition, the various transitional adjustments lead to temporary differences as on the transition date. The net impact of ` 1,082.98 lakhs as at 1 April 2015 and ` 390.55 lakhs as at 31 March 2016 on deferred tax liabilities on the transitional adjustments is recognized in retained earnings and to the statement of profit and loss respectively.
I. Investment in Biotech Laboratories (Pty.) Ltd:
Under previous GAAP, the investment in the joint venture Biotech Laboratories (Pty.) Ltd. (‘Biotech’) was consolidated
NOTES ON CONSOLIDATED FINANCIAL STATEMENTS FOR ThE YEAR ENDED ON MARCh 31, 2017 (Contd.)

176
Annual Report 2016-17J. B. Chemicals & Pharmaceuticals Limited
applying proportionate consolidation method. Under Ind AS 28 “Investment in Associates and Joint ventures”, the investment in Biotech is measured using the equity method. The below mentioned proportionately consolidated assets and liabilities and items of income and expenses under previous GAAP have been aggregated and shown as investment in joint venture at the date of transition to Ind AS.
The following items of assets and liabilities were proportionately consolidated (49%) under previous GAAP:(` in lakhs)
Particulars As at April 1, 2015
Assets
Non-current assets
Property, plant and equipment 654.31
Other non-current assets 7.79
Current assets
Inventory 1,036.22
Trade receivables 1,754.97
Cash and cash equivalent 709.24
Total 4,162.53
Equities and liabilities
Other equity 1,471.17
Non-Current Liabilities
Deferred Tax liabilities 0.55
Current Liabilities
Short term borrowing 35.18
Trade payable 632.64
Other current liabilities 2,002.15
Short term provision 20.84
Total 4,162.53
The above joint venture had been converted into subsidiary company w.e.f. December 18, 2015.
The following items of income and expenses were proportionately consolidated (49%) under previous GAAP:
(` in lakhs)
ParticularsFor the year ended
March 31, 2016
Revenue from operations 4,032.88
Other income 25.69
Increase / decrease in Stock 1,175.42
Depreciation (1.70)
Employee Benefit Expenses (726.72)
Other Expense (847.27)
Purchase of stock-in-trade (3,516.83)
Share of Profit of Joint Venture 141.47
NOTES ON CONSOLIDATED FINANCIAL STATEMENTS FOR ThE YEAR ENDED ON MARCh 31, 2017 (Contd.)

177
Corporate Overview Statutory Reports Standalone Financial Statement Consolidated Financial Statement01-13 14-68 69-123 124-179
J. EXPECTED CREDIT LOSS:The Group has applied simplified expected credit loss model for recognition of impairment loss of trade receivable and accordingly there is decrease of ` 19.09 lakhs in trade receivable and in profit before tax for the year ended March 31, 2016.
K. OThER COMPREhENSIVE INCOME:Under Indian GAAP, the Group has not presented other comprehensive income (OCI) separately. Hence, it has reconciled Indian GAAP profit or loss to total comprehensive income as per Ind AS.
L. STATEMENT OF CASh FLOWS :The transition from Indian GAAP to Ind AS has not had a material impact on the statement of cash flows.
53. ADDITIONAL INFORMATION PERTAINING TO PARENT AND SUBSIDIARY COMPANIESFor the year 2016-17 (` in lakhs)
Name of Entity in the GroupNet Assets, i.e., total
assets minus total liabilities
Share in profit or loss Share in other comprehensive income
Share in total comprehensive income
As % of consolidated
net assetsAmount
As % of consolidated profit or loss
Amount
As % of consolidated
comprehensive income
AmountAs % of total
comprehensive income
Amount
PARENT
J. B. Chemicals and Pharmaceuticals Ltd. 101.61 138,786.13 93.97 17,296.46 100.00 (270.43) 93.88 17,026.03
FOREIGN SUBSIDIARIES
LLC Unique Pharmaceutial Laboratories, Russia 1.37 1,868.08 0.31 56.21 - - - 56.20
Unique Pharmaceutial Laboratories FZE, Dubai 6.88 9,403.32 3.11 572.04 - - - 572.04
Biotech Laboratories (Pty.) Ltd, South Africa 3.45 4,714.11 3.68 677.69 - - - 677.69
Minority Interest 0.16 218.05 (0.18) (33.55) - - - (33.55)
Total Eliminations (13.47) (18,404.74) (0.88) (162.58) - - - (162.58)
TOTAL 100.00 136,584.95 100.00 18,406.27 100.00 (270.43) 100.00 18,135.84
For the year 2015-16 (` in lakhs)
Name of Entity in the GroupNet Assets, i.e., total
assets minus total liabilities
Share in profit or loss Share in other comprehensive income
Share in total comprehensive income
As % of consolidated
net assetsAmount
As % of consolidated profit or loss
Amount
As % of consolidated
comprehensive income
AmountAs % of total
comprehensive income
Amount
PARENT
J. B. Chemicals and Pharmaceuticals Ltd. 103.14 138,786.13 110.25 17,920.29 100.00 (30.98) 110.27 17,889.31
FOREIGN SUBSIDIARIES
J. B. Healthcare Pvt. Ltd., Jersey - - 0.13 21.78 - - 0.13 21.78
LLC Unique Pharmaceutial Laboratories, Russia 1.37 1,868.08 (10.58) (1,720.33) - - (10.60) (1,720.33)
Unique Pharmaceutical Laboratories LLC , Ukraine - 0.01 (0.02) (2.48) - - (0.02) (2.48)
NOTES ON CONSOLIDATED FINANCIAL STATEMENTS FOR ThE YEAR ENDED ON MARCh 31, 2017 (Contd.)

178
Annual Report 2016-17J. B. Chemicals & Pharmaceuticals Limited
Name of Entity in the GroupNet Assets, i.e., total
assets minus total liabilities
Share in profit or loss Share in other comprehensive income
Share in total comprehensive income
As % of consolidated
net assetsAmount
As % of consolidated profit or loss
Amount
As % of consolidated
comprehensive income
AmountAs % of total
comprehensive income
Amount
Unique Pharmaceutial Laboratories FZE, Dubai 7.67 9,091.98 (1.97) (320.87) - - (1.98) (320.87)
Biotech Laboratories (Pty.) Ltd., South Africa 2.87 3,400.36 2.16 351.70 - - 2.17 351.70
Joint Venture
Biotech Laboratories (Pty.) Ltd. upto December 17, 2015 - - 2.16 101.42 - 0.63 101.42
Minority Interest 0.14 166.50 (0.06) (10.40) - - (0.06) (10.40)
Total Eliminations (15.14) (17,945.46) (0.53) (86.46) - (0.53) (86.46)
TOTAL 100.00 136,584.95 100.00 16,254.65 100.00 (30.98) 100.00 16,223.67
54. Figures of previous year have been re-grouped, rearranged and recast, wherever considered necessary. Figures in brackets indicate corresponding figures of previous year.
As per our report of even date For and on behalf of the Board of Directors
For J. K. Shah & Co. J.B. Mody D.B. ModyChartered Accountants Chairman & Managing Director Whole time Director (Administration)
J.K. Shah S. B. Mody Vijay D. BhattPartner Whole time Director (Marketing) Chief Financial Officer
Place : Mumbai Place : Mumbai M. C. MehtaDate : May 23, 2017 Date : May 23, 2017 Company Secretary
NOTES ON CONSOLIDATED FINANCIAL STATEMENTS FOR ThE YEAR ENDED ON MARCh 31, 2017 (Contd.)
(` in lakhs)
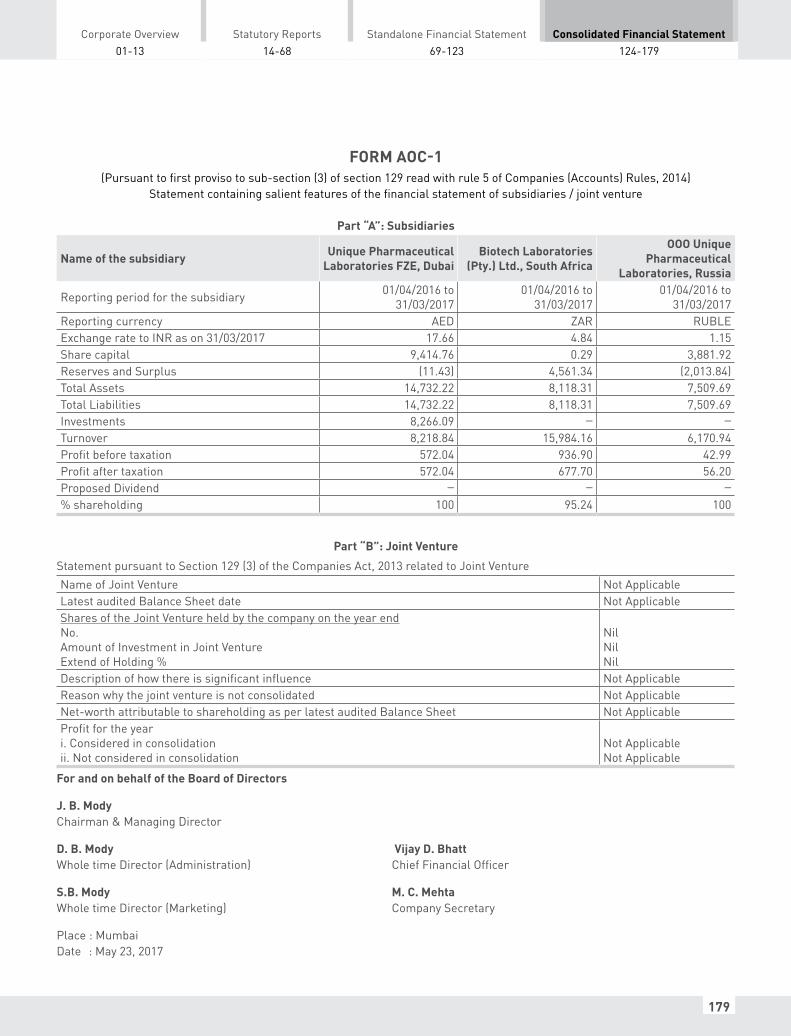
179
Corporate Overview Statutory Reports Standalone Financial Statement Consolidated Financial Statement01-13 14-68 69-123 124-179
FORM AOC-1(Pursuant to first proviso to sub-section (3) of section 129 read with rule 5 of Companies (Accounts) Rules, 2014)
Statement containing salient features of the financial statement of subsidiaries / joint venture
Part “A”: Subsidiaries
Name of the subsidiary Unique Pharmaceutical Laboratories FZE, Dubai
Biotech Laboratories (Pty.) Ltd., South Africa
OOO Unique Pharmaceutical
Laboratories, Russia
Reporting period for the subsidiary 01/04/2016 to 31/03/2017
01/04/2016 to 31/03/2017
01/04/2016 to 31/03/2017
Reporting currency AED ZAR RUBLEExchange rate to INR as on 31/03/2017 17.66 4.84 1.15Share capital 9,414.76 0.29 3,881.92Reserves and Surplus (11.43) 4,561.34 (2,013.84)Total Assets 14,732.22 8,118.31 7,509.69Total Liabilities 14,732.22 8,118.31 7,509.69Investments 8,266.09 − −Turnover 8,218.84 15,984.16 6,170.94Profit before taxation 572.04 936.90 42.99Profit after taxation 572.04 677.70 56.20Proposed Dividend − − −% shareholding 100 95.24 100
Part “B”: Joint Venture
Statement pursuant to Section 129 (3) of the Companies Act, 2013 related to Joint VentureName of Joint Venture Not ApplicableLatest audited Balance Sheet date Not ApplicableShares of the Joint Venture held by the company on the year endNo.Amount of Investment in Joint VentureExtend of Holding %
NilNilNil
Description of how there is significant influence Not ApplicableReason why the joint venture is not consolidated Not ApplicableNet-worth attributable to shareholding as per latest audited Balance Sheet Not ApplicableProfit for the yeari. Considered in consolidationii. Not considered in consolidation
Not ApplicableNot Applicable
For and on behalf of the Board of Directors
J. B. ModyChairman & Managing Director
D. B. Mody Vijay D. BhattWhole time Director (Administration) Chief Financial Officer
S.B. Mody M. C. MehtaWhole time Director (Marketing) Company Secretary
Place : MumbaiDate : May 23, 2017

180
Annual Report 2016-17J. B. Chemicals & Pharmaceuticals Limited
TEN YEAR FINANCIAL SUMMARY
(` in lakhs)Particulars 07-08 08-09 09-10 10-11 11-12 12-13 13-14 14-15 #15-16 #16-17
Balance Sheet
Share Capital 1,686.53 1,686.53 1,686.53 1,690.34 1,694.15 1,694.15 1,694.63 1,696.16 1,696.40 1,696.40
Reserves and Surplus 44,632.06 51,518.92 59,650.61 69,637.93 93,692.17 99,206.03 103,086.53 99,934.99 120,574.14 137,089.73
Loan Funds 19,552.00 17,068.81 13,622.45 16,856.32 6,997.90 4,960.91 9,278.06 10,521.80 17,440.19 4,886.03
Deferred Tax Liability (Net) 1,466.10 1,344.51 1,423.99 1,443.62 1,655.69 2197.49 1,988.93 2,162.22 3,206.57 2,895.35
Other non-current liabilities − − − − − − − − 380.60 395.48
Total 67,336.69 71,618.77 76,383.58 89,628.21 104,039.91 108,058.58 116,048.15 114,315.17 143,297.90 146,962.99
Application of Funds
Net Fixed Assets (Incl. Capital WIP)
23,352.95 22,747.69 21,807.85 22,894.44 28,000.53 29,917.34 32,852.81 35,604.09 50,424.39 61,245.27
Investments 4,290.55 4,559.44 6,246.43 12,328.84 33,771.16 43,365.78 53,611.41 59,749.74 61,166.54 54,377.04
Current Assets, Loans and Advances:
Inventories 6,511.34 5,517.99 5,640.84 8,178.22 9,079.85 8,988.92 11,122.70 12,847.40 13,329.31 15,995.57
Sundry Debtors 32,804.08 37,449.92 40,727.14 38,545.42 13,120.82 19,464.31 24,805.15 24,849.05 26,566.79 26,509.52
Cash & Bank Balances 1,450.68 4,145.45 7,056.63 12,291.77 21,136.24 14,910.99 1,080.30 905.52 1,080.03 740.49
Loans and Advances 5,864.85 5,146.99 5,550.89 6,488.05 12,163.11 10,635.07 10,720.84 10,920.23 11,566.43 9,569.38
Total Currents Assets 46,630.95 52,260.35 58,975.50 65,503.46 55,500.02 53,999.29 47,728.99 49,522.20 52,542.56 52,814.96
Less: Current Liabilities and Provisions:
Current Liabilities 5,432.94 5,846.39 7,318.30 7,688.67 10,700.43 14,457.71 13,467.30 14,481.85 19,192.79 19,798.88
Provisions 1,504.82 2,102.32 3,327.90 3,409.86 2,531.37 4,766.12 4,677.76 16,079.01 1,642.80 1,675.40
Net Current Assets 39,693.19 44,311.64 48,329.30 54,404.93 42,268.22 34,775.46 29,583.93 18,961.34 31,706.97 31,340.68
Total 67,336.69 71,618.77 76,383.58 89,628.21 1,04,039.91 108,058.58 116,048.15 114,315.17 143,297.90 146,962.99
Profit and Loss Statement
Sales 54,809.43 72,315.53 67,006.45 78,757.94 63,577.48 79,446.05 93,443.47 103,813.61 116,493.57 119,869.42
Other income 1,380.19 1,496.57 1,725.34 2,499.40 7,915.84 4,792.27 5,963.69 3,369.39 5,567.60 4,589.03
Total Income 56,189.62 73,812.10 68,731.79 81,257.34 71,493.32 84,238.32 99,407.16 107,183.00 122,061.17 124,458.45
Total Expenses 51,278.86 64,634.02 56,637.37 67,162.00 66,630.42 73,463.85 83,558.38 91,272.58 98,991.83 102,780.09
Profit before extraordinary item and taxation
4,910.76 9,178.08 12,094.42 14,095.34 4,862.90 10,774.47 15,848.78 15,910.42 23,069.34 21,678.36
Profit after taxation 5,169.13 7,873.62 10,099.73 11,819.46 64,269.94 8,493.85 6,842.55 11,358.25 17,920.29 17,296.46
Ratios:
Earning per share (`) 6.13 9.34 11.98 14.00 75.95 10.03 8.08 13.40 21.09 20.07
Book Value per share (`) 54.93 63.09 72.74 84.40 112.61 119.12 123.66 119.84 144.15 163.62
Debt Equity Ratio 0.42:1 0.32:1 0.22:1 0.24:1 0.07:1 0.05:1 0.09:1 0.10:1 0.14:1 0.04:1
Current Ratio 6.72:1 6.57:1 5.54:1 5.90:1 4.19:1 2.81:1 2.63:1 1.62:1 2.52:1 2.46:1
Dividend
In ` per share 0.50 1.00 2.00 2.00 41.00 3.00 3.00 14.00 5.00 1.00
Percentage (%) 25 50 100 100 *2050 150 150 **700 250 50
* Includes special interim dividend of ` 40 (2000%) per share. ** Includes special dividend of ` 10 (500%) per share # prepared in accordance with new accounting standards prescribed under Companies (Indian Accounting Standards) Rules, 2015 applicable to the Company w.e.f. April 1, 2016.


Cnergy IT Park, Unit A2, 3rd floor & Unit A, 8th floor, Appa Saheb Marathe Marg, Prabhadevi, Mumbai 400 025. Tel: 91-22-2439 5200 / 2439 5500. Website: www.jbcpl.com