building healthy and sustainable communities: how do we
TRANSCRIPT

CRICOS #00212K CRICOS #00212K
Building healthy and sustainable communities:
How do we know if they really work?
Dr Helen L Berry
Professor of Psychiatric Epidemiology & Associate Dean Research Faculty of Health
University of Canberra, Australia

CRICOS #00212K
1. Major challenges to contemporary communities
2. Why we should attend to mental health
3. The pivotal role of (multiple) communities
4. Built form in an urban world
5. Designing research for healthy & sustainable communities
Overview
Thanks to those contributing slides, esp. L O’Brien

CRICOS #00212K
1. Globalisation
2. Urbanisation
3. Individualisation
4. Virtualisation
5. Commercialisation
6. Demographic change
7. Climate change
1. Major challenges: Ilona’s list, plus one A ‘radically’ changing world

CRICOS #00212K
1850-2011 global surface temperature anomalies
Australian Bureau of Meteorology, 2012
World population, tech advance, emissions

CRICOS #00212K
Earth has been warming for 100+ years Tracking temperature & temp. anomalies
Trend 1997-2013: GISS: +0.75°C/century UAH: +0.94°C/century
Nicholls, 2014

CRICOS #00212K Nicholls, July 24, 2014
How much will the climate change? Global emissions & future scenarios
globalcarbonproject.org
Global agreed target is 2oC above which
change is considered “dangerous”
RCP: Representative Concentration Pathways
Gt = giga tonne = 109 t = thousand, million tonnes

CRICOS #00212K
From the IPCC 4th Assessment Report, adapted by the Climate Council in Australia for its report: The Angry Summer (funding crowd sourced)

CRICOS #00212K
Copenhagen Climate Congress, March 2009 (five years ago): Summary Message #1
• Recent observations confirm that, given high rates of observed emissions, the worst-case IPCC scenario trajectories (or even worse) are being realised.
• For many key parameters, the climate system is already moving beyond the patterns of natural variability within which our society and economy have developed and thrived.
• There is a significant risk that many of the trends will accelerate, leading to an increasing risk of abrupt or irreversible climatic shifts.
CRICOS #00212K
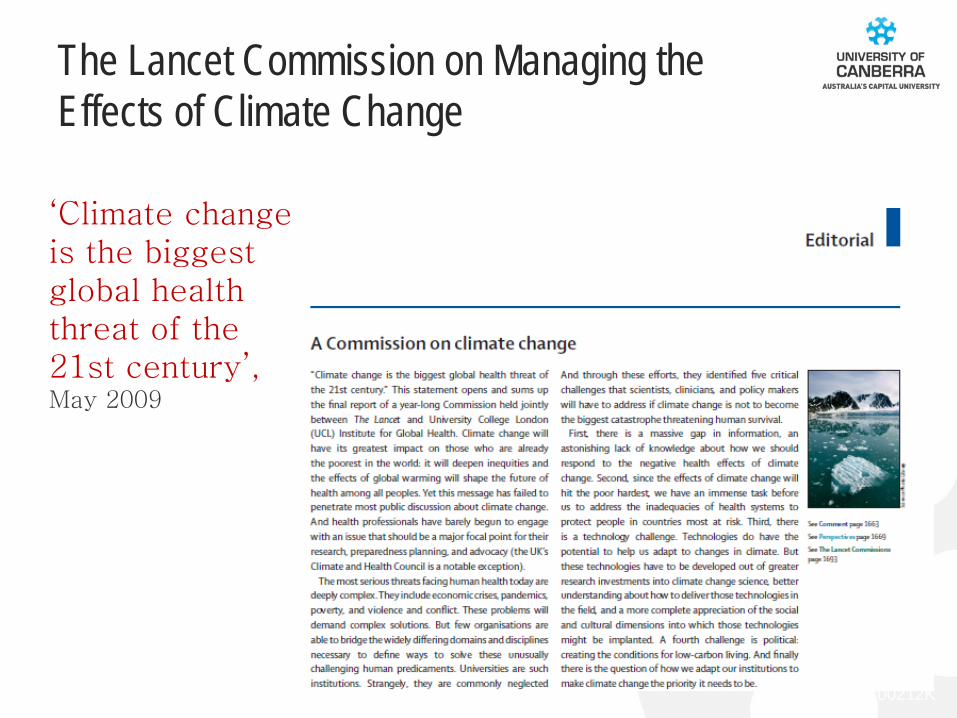
The Lancet Commission on Managing the Effects of Climate Change ‘Climate change is the biggest global health threat of the 21st century’, May 2009

CRICOS #00212K
Why we should attend to mental health
‘Social & emotional wellbeing’ Caring for (ancestral) land
CRICOS #00212K
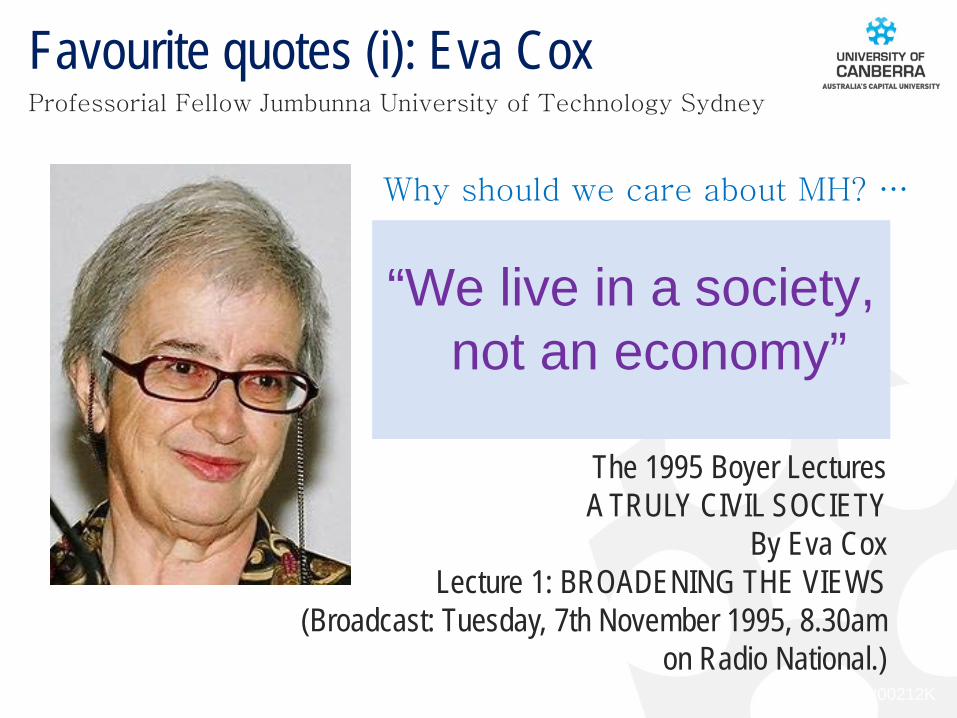
“We live in a society, not an economy”
Favourite quotes (i): Eva Cox Professorial Fellow Jumbunna University of Technology Sydney
The 1995 Boyer Lectures A TRULY CIVIL SOCIETY
By Eva Cox Lecture 1: BROADENING THE VIEWS
(Broadcast: Tuesday, 7th November 1995, 8.30am on Radio National.)
Why should we care about MH? …

CRICOS #00212K
Mental health problems The focus of most MH research
By far the leading cause of disease burden (1-in-5+) Profoundly disabling, extreme suffering Affects self, others, every realm of life and society Exceptionally expensive Stigmatised, not ‘real’, malingering, exclusion Cinderella issue -- under-funded, under-researched Hard to understand, address: End of long, complex
causal chains Very sensitive: cause, outcome, indicator
CRICOS #00212K
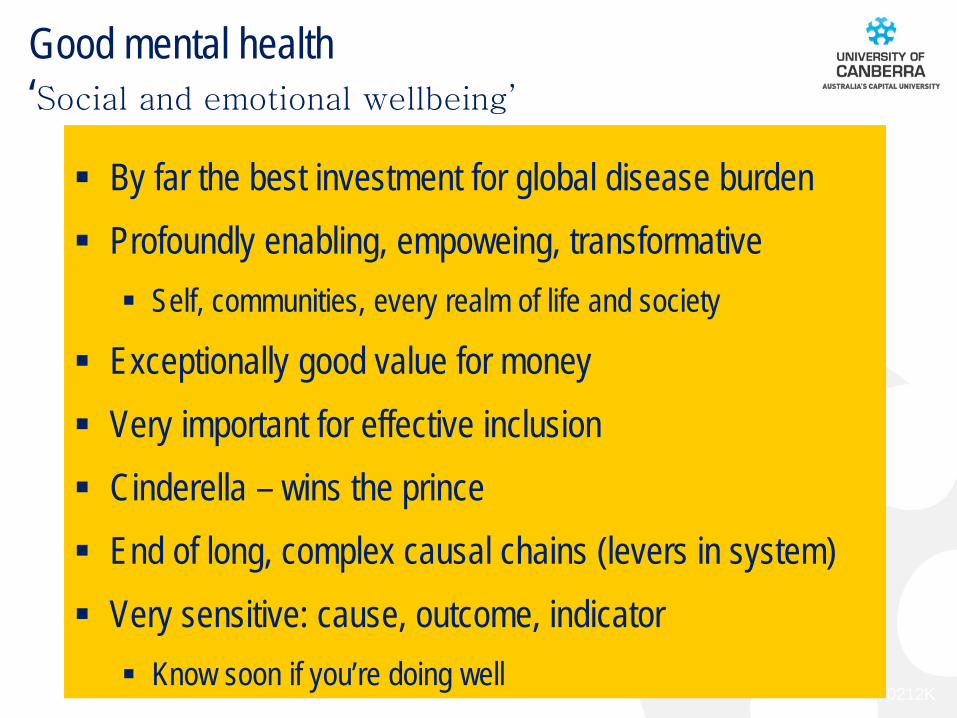
Good mental health ‘Social and emotional wellbeing’
By far the best investment for global disease burden Profoundly enabling, empoweing, transformative Self, communities, every realm of life and society
Exceptionally good value for money Very important for effective inclusion Cinderella – wins the prince End of long, complex causal chains (levers in system) Very sensitive: cause, outcome, indicator Know soon if you’re doing well

CRICOS #00212K
A working definition of mental health ‘Social and emotional wellbeing’
World Health Organization definition of MH: … a state of well-being in which the individual
realizes his or her own abilities, can cope with the normal stresses of life, can work productively and fruitfully and is able to make a contribution to his or her community.
(Helen Herrman and WHO, 2001; 2005)

CRICOS #00212K
Some key implications of this definition:
Mental health is a process Ongoing through time (lifelong, intergenerational) Applies across context (work, community) About skills, competence (coping) About the everyday (with normal stresses of life) Rights and responsibilities , not ‘all about me’ (contributing)
This is resilience in dynamic social & physical place A radically changing world means a new normal – We need a new (level of?) resilience

CRICOS #00212K
“Most mental health problems are socially caused and must be
socially solved”
Favourite quotes (ii): David Fryer Psychologist
B.A. Hons., M.A., Ph.D., C.Psychol. F.B.Ps.S., F.S.C.R.A.
Professor Extraordinarius, University of South Africa Institute for Social and Health Sciences
and Medical Research Council-University of South Africa Safety and Peace Promotion
Research Unit | University of Queensland | Honorary Senior Research Fellow, University of
Stirling, Scotland …

CRICOS #00212K
Mental health as societal –
The pivotal role of communities
1. Natural meeting place of social and physical space (workplaces, homes, suburbs; incl. online, psychological)
2. Intuitively coherent: meaningful, comprehensible, manageable
3. Not too big, not too small
4. Amenable to intervention
5. Researchable – natural living labs
CRICOS #00212K
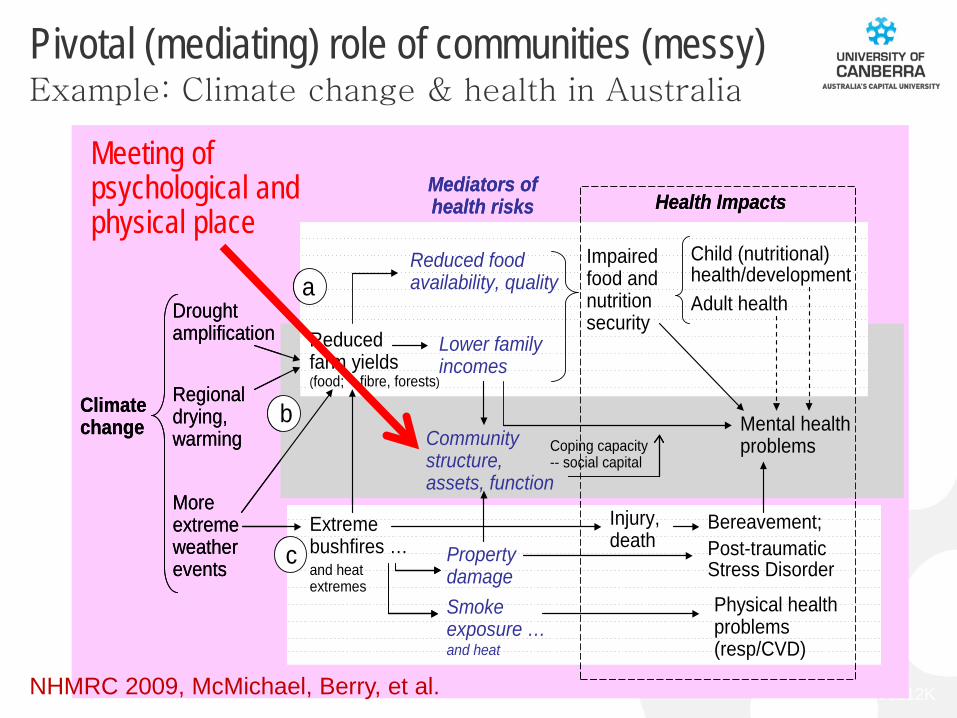
Pivotal (mediating) role of communities (messy) Example: Climate change & health in Australia
Community structure, assets, function
Regional drying, warming
Child (nutritional) health/development
Lower family incomes
Extreme bushfires …and heat extremes
Adult health
Property damage
Impaired food and nutritionsecurity
Reduced food availability, quality
Smoke exposure …and heat
Drought amplification
More extremeweather events
Mental health problems
Physical health problems (resp/CVD)
Injury, death
Climate change
Bereavement; Post-traumatic Stress Disorder
Health Impacts
Coping capacity -- social capital
Mediators of health risks
Reduced farm yields(food; + fibre, forests)
a
b
c
NHMRC 2009, McMichael, Berry, et al.
Meeting of psychological and physical place
CRICOS #00212K
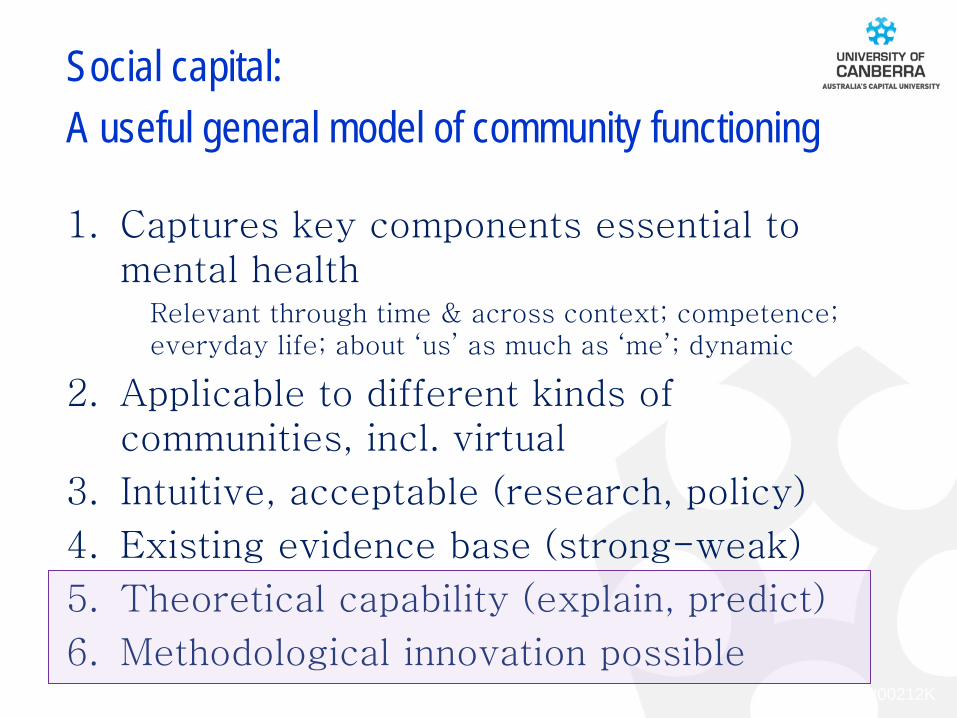
Social capital: A useful general model of community functioning
1. Captures key components essential to mental health
Relevant through time & across context; competence; everyday life; about ‘us’ as much as ‘me’; dynamic
2. Applicable to different kinds of communities, incl. virtual
3. Intuitive, acceptable (research, policy)
4. Existing evidence base (strong-weak)
5. Theoretical capability (explain, predict)
6. Methodological innovation possible

CRICOS #00212K
Wonderful example: Cantus a capella choir

CRICOS #00212K
A simple epidemiological definition of Social Capital Community functioning, underlying processes Sociological, psychological, economic interpretations
Community Participation
Social Cohesion
Health
Social Capital
Baum et al., 2000 Berry & Welsh, 2010
Berry & Shipley, 2009
(behaviours) (thoughts & feelings)
Investment
Return on investment

CRICOS #00212K
‘People and Place’ research program Trying to help address some macro challenges for MH
World Health Organization definition of health: … A state of complete physical, mental and social wellbeing
People and Place Program: … Investigate how to promote everyone’s wellbeing, no matter
who you are or where you live
Two key questions: 1. What makes a great life? 2. How can we promote great lives in cities and in rural
and remote areas?

CRICOS #00212K
One research approach:
Longitudinal, panel and case studies of social capital and mental health
Findings replicate cross-sectional findings

CRICOS #00212K
Dynamics of participation and mental health over time
Longitudinal analysis, HILDA waves 2005-07
Panel analysis, waves 2005-07 and 2009-11 (same results)
Controlling for age, sex, employment, financial situation, hardship, relationship status, household composition, education, SEIFA, ARIA etc
1. Informal social connectedness
2. Civic engagement 3. Political
participation

CRICOS #00212K
MH predicts participation Participation predicts MH (a little – but it matters!)
Potential for small scale / individual interventions
Potential for large-scale interventions. Systemic: builds cohesion, with multiple desirable outcomes, not just MH

CRICOS #00212K
Cohesion: Trust and Mental wellbeing Similar study architecture as for participation (Zhang et al., in prep.)
Current mental wellbeing
0.003** 0.191*
0.100***
Prior mental wellbeing
Generalised Trust
Mental wellbeing

CRICOS #00212K
Social Capital & MH – evidence to date Cross-sectional associations – strong, many Longitudinal & causal associations – few, but consistent with theory and cross-sectional findings
Community Participation
Social Cohesion
Mental health
Social Capital Next analysis
(Ding, Berry, O’Brien, under rev.) (Zhang, Ding, Berry, in prep.)

CRICOS #00212K
Built form in an urban world
Longitudinal, panel and case studies of social capital and mental health
‘The Crace Study’
(O’Brien & Berry)

CRICOS #00212K
• Crace joint venture – CIC Pty. Ltd. (Development company, project manager) – Land Development Agency (local government) – Defence Housing Australia – CHC Affordable Housing
• Crace design – Designed as a ‘mini-city’: high-density urban precinct around a
shopping centre surrounded by suburban areas. – ‘Walkable’ grid design with 25% of total land for common use,
including walking / bike paths, houses in walking distance of parks, shops and amenities.
Crace: A new suburb in Canberra, Australia

CRICOS #00212K
Crace master plan

CRICOS #00212K

CRICOS #00212K

CRICOS #00212K
Timing • Annual survey
spring each year – Same season,
‘neutral’ season
‘The Crace Study’ study architecture (i) Timing and phasing
Phasing • Everyone gets a ‘dose’
of ‘sustainability’ • Graduated/single dose
– ‘first fleeters’ (slow drip) vs others
Progressive addition of amenities
Single dose
Multiple annual cross-sections (monitor & compare trends) with embedded cohort design

CRICOS #00212K
• To buy in Crace – register with CIC, agree to contact – Access to CIC’s register
• Three comparison groups i. Buyers (& renters) who have moved in ii. Buyers not moved in iii. Did not buy
• Two more comparison groups iv. Living in ‘feeder’ region v. Living in other regions of Canberra
‘The Crace Study’ study architecture (ii) Control groups structure – 5 comparison groups
• Only (i) can be ‘first fleeters’
• All can eventually be new entrants

CRICOS #00212K
Progress • Residences: 550 homes,
approx. (projected total 1,500 and 4,000 people)
• Roads, minor parks built
Participants • 277 people completed all
health measures • 180 Crace residents, 97
residents in other suburbs
Wave 1: Crace in spring 2012

CRICOS #00212K
Wave 2: Crace in spring 2013
Progress • Residences: 950 homes approx. • All parks open, including new
Recreation Park, Hilltops Reserve and community garden
Participants • 516 people participated • 375 Crace residents, 141
residents in other suburbs • 86 people who did the survey in
2012 returned

CRICOS #00212K
Who did the survey? Measure Category
Crace 2012
Crace 2013
Canberra census data
Sample characteristics
Male 43.3% 49.2%
Female 56.7% 50.8%
0 – 17 — — 23.0%
18 – 29 27.2% 24.7% 16.7%
30 – 39 45.6% 44.9% 13.6%
40 – 49 15.0% 16.9% 15.1%
50 – 64 12.2% 10.1% 19.6%
65+ — 3.4% 12.1%
Singles 16.7% 6.0%
Couples 36.7% 42.8%
Couples with kids 37.2% 42.9%
Single parents 8.3% 7.3%
Other 1.1% 1.0%
Full-time 73.9% 65.2%
Part-time 11.7% 25.2%
Other 14.4% 9.5%
0 – 77,999 17.2% 34.5%
78,000 – 129,999 32.2% 21.9%
130,000 – 179,999 28.3% 20.6%
180,000 or more 22.2% 13.8%
GenderMore women in our
sample
Age
Most of our sample are young adults
(Note: Only adults over 18 were
surveyed)
Household structure
More singles in our sample
Work statusMost of our sample in
full-time work
Total household income ($)
Higher income households more
prevalent in our sample

CRICOS #00212K
I am glad I live here in CraceAgree--Strongly agree 76.7 88.1Slightly agree--Strongly Disagree 23.3 11.9
I chat with my neighbour(s) when I bump into them
Yes 78.9 76.1No 21.1 23.9
There are many places to go within walking distance from my home
Agree 48.9 65.3Disagree 51.1 34.7
There are many interesting things to look at while walking
Agree 77.7 85.8Disagree 22.3 14.2
Crace residents in 2012 vs. 2013
2012 2013
Rate of change, n=67
Increase with new parks

CRICOS #00212K
2012 2013How often do you do active stuff (like walking, running and/or lifting) that would add up to at least 30mins total exercise that day?
Everyday 40.0 203 or more times a week 28.3 461 to 2 times a week 20.0 21.2None/less than once a week 11.6 12.8
In general, would you say your health is…
Excellent-Very good 60.5 51.2Good-Fair 39.5 48.8
Crace residents in 2012 vs. 2013
Decrease with arrival of older people
CRICOS #00212K
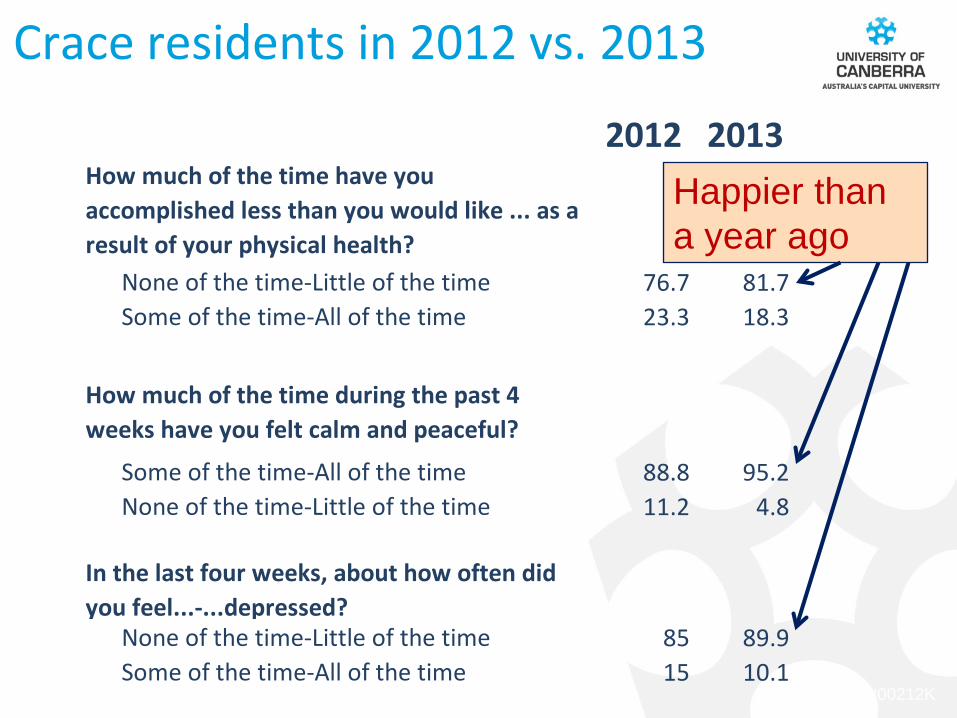
2012 2013How much of the time have you accomplished less than you would like ... as a result of your physical health?
None of the time-Little of the time 76.7 81.7Some of the time-All of the time 23.3 18.3
How much of the time during the past 4 weeks have you felt calm and peaceful?
Some of the time-All of the time 88.8 95.2None of the time-Little of the time 11.2 4.8
In the last four weeks, about how often did you feel...-...depressed?
None of the time-Little of the time 85 89.9Some of the time-All of the time 15 10.1
Crace residents in 2012 vs. 2013
Happier than a year ago

CRICOS #00212K
Use of parks: Out and about more than a year ago

CRICOS #00212K
Use of parks: increased use
Major recreation parks (newly opened in 2013): Very high % of residents use these parks

CRICOS #00212K
Using mapping to find hotspots and strongspots (in Crace)
CRICOS #00212K CRICOS #00212K
Designing research for healthy and sustainable communities
-- incorporating grand challenges
An example of one approach we are taking

CRICOS #00212K
The ‘People and Place’ research program’s
National Urban Wellbeing
Survey
University of Canberra Program Director: Prof Helen Berry
Project leader: Dr Léan OBrien
People and Place Program
… Investigate how to promote everyone’s wellbeing,
no matter who you are or where you live.

CRICOS #00212K
Wellbeing in Australia’s 100,000+ cities
National Urban Wellbeing Survey
Cities with 100,000 people or more: Sydney, Melbourne, Brisbane, Perth, Adelaide, Hobart, Canberra–Queanbeyan, Albury-Wodonga, Wollongong, Newcastle–Maitland, Geelong, Toowoomba, Gold Coast–Tweed Heads, Sunshine Coast, Townsville, Cairns, Darwin, Launceston
How can we promote great lives in our cities? • Build great places to live (houses, work spaces,
parks, meeting halls etc.) • Make it easy to move across different spheres of
life (good public transport systems) • Have high quality services and governance
processes
What makes a great life? • Being connected and effective, across family,
community and work. • Being physically active and eating good food • Having the resources for this way of living
(human, social, financial, institutional, environmental).
Can all become part of a virtuous cycle (but also potentially a downward spiral).
CRICOS #00212K
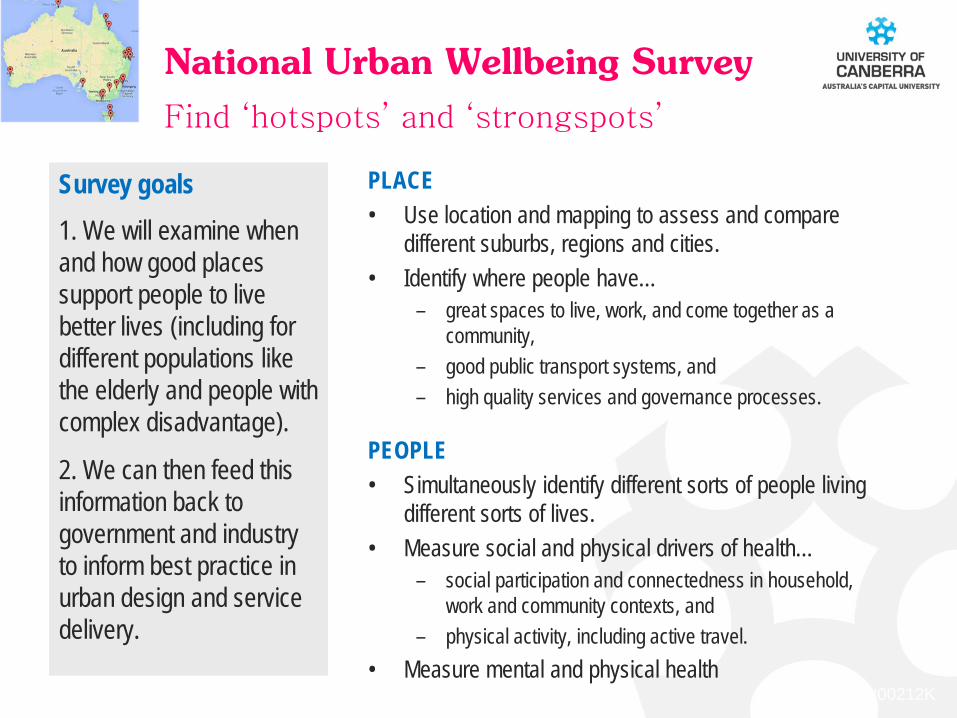
National Urban Wellbeing Survey Find ‘hotspots’ and ‘strongspots’
PLACE • Use location and mapping to assess and compare
different suburbs, regions and cities. • Identify where people have…
– great spaces to live, work, and come together as a community,
– good public transport systems, and – high quality services and governance processes.
PEOPLE • Simultaneously identify different sorts of people living
different sorts of lives. • Measure social and physical drivers of health…
– social participation and connectedness in household, work and community contexts, and
– physical activity, including active travel. • Measure mental and physical health
Survey goals 1. We will examine when and how good places support people to live better lives (including for different populations like the elderly and people with complex disadvantage).
2. We can then feed this information back to government and industry to inform best practice in urban design and service delivery.

CRICOS #00212K
Marketing to potential external partners: What is different about this survey?
Unmet data needs “I need to understand the multiple factors affecting life in my city – and where my development sits within that”
“I need to be able to track change over time”
“I need to know what things are driving people’s actions and perceptions about housing/ travel/ sustainability”
Existing social data 1. Surveys • Data typically collected at single
point in time, for single region, looking at single issue
• Not able to compare regions, or report at different scales
2. Census data • Comprehensive description of
social characteristics • Doesn’t explain behaviour,
actions, perceptions, comfortable spaces

CRICOS #00212K
What is different about this survey?
The Urban Wellbeing Survey provides data not available elsewhere, through:
• Large sample, many topics • Tracking change over time (trends, cohort) • Local to national (international) scalability
• Focus on urban ways of living
• Built-in links to existing data, geocoding • Understanding what people are doing,
perceiving and enjoying

CRICOS #00212K
• Online survey, 20-30 minutes
• Flyers, prize draw, social media, email forwards: encourage participation
• Top-line results available publically, online; tailored reports for a fee
• Builds on, links with multiple pilot studies; also with Regional Wellbeing Survey (launched 2013)
• (Mostly) online -- tailored modules can be targeted for different kinds of participants – e.g., older Australians, people living in outer suburbs, working in particular
industries (including developers)
How does it work?

CRICOS #00212K CRICOS #00212K
The place I live meets my needs
I attend community events
National Urban Wellbeing Survey ─ What can it tell us? Profiling an Australian city: Illustrative data only
A B C D
A B C D

CRICOS #00212K
I felt calm and peaceful
Active for 30 minutes or more
A B C D
A B C D
National Urban Wellbeing Survey ─ What can it tell us? Profiling an Australian city: Illustrative data only, sample size insufficient

CRICOS #00212K
I felt calm and
peaceful
Active for 30 minutes or more
The place I live meets my
needs
I attend community
events
A: Positive about built environment, socially and physically active, BUT a little bit stressed B: Positive about built environment, calm and peaceful, BUT a bit low on social and physical activity C: Generally low – AT RISK for poor wellbeing D: Socially active, calm and peaceful, BUT not happy with built environment and low physical activity
A B C D
A B C D
Analyses like these can be conducted at the suburb, district and city level for the 18 cities in Australia with a population of 100,000+
National Urban Wellbeing Survey ─ What can it tell us? Profiling an Australian city (how do multiple factors add up?): Illustrative data only

CRICOS #00212K
National Urban Wellbeing Survey Topics – build in ‘healthy & sustainable’
Survey goals 1. We will examine when and how good places support people to live better lives (including for different populations like the elderly and people with complex disadvantage).
2. We can then feed this information back to government and industry to inform best practice in urban design and service delivery.
Building comfort in work and home
Travel & public transport
Subpopulations Socio-demographics
Complex disadvantage
Services access & quality
Walkable urban design
Public space quality & access
Who people are…
Where they go…
How they get there…
Connectedness & efficacy Satisfaction
Physical activity Neighbourhood
governance & cohesion
Sustainable behaviours
Social behaviour Do good?
Feel good?
Physical health Mental health Be healthy Carbon footprint

CRICOS #00212K
FUNDING …. Partner with the National Urban Wellbeing Survey
NB. Survey partners can also commission customised analyses to answer specific questions (depending on level of partner support, commissioned analyses may attract a discount and/or be included in the partner agreement ).

CRICOS #00212K
Some concluding thoughts ‘tout acte est politique’
1. Health promotion complex & dynamic, esp. mental health needs systemic, long-term, pragmatic ‘real world’ approach types of people, types of places (concrete & virtual settings) blend individual and (mainly) collective approach
2. Vulnerabilities & risks AND strengths & opportunities ‘hotspots’ AND ‘strongspots’, use mapping to find them urban focus but remember rural & remote
3. International responsibility, especially the developing world
4. Shape research to meet grand challenges (e.g., CC) new approaches, new theories, new methods, new lines collaboration – disciplines, sectors & organisations, places advocacy difficult but essential (science communication, media)

CRICOS #00212K
1. First papers from Australia-Norway comparison of sustainable urban form and mental health (one next week!)
2. Collaboration – Govt Shanghai: promoting healthy and sustainable behaviours in the face of grand challenges
3. Oxford, RCPsych Sustainability Summit: Environment, Society and Psychiatry London 1 October (https://www.eventbrite.co.uk/e/rcpsych-sustainability-summit-environment-society-and-psychiatry-tickets-11645505019?aff=es2&rank=2)
4. RCPsych conference Birmingham July 2015 – sustainability (http://www.rcpsych.ac.uk/traininpsychiatry/eventsandcourses/internationalcongress2013.aspx)
5. Australian Academy of Science Think Tank 2014 Brisbane: CC challenges to health; report Dec 2014 (http://www.science.org.au/events/2014-theo-murphy-high-flyers-think-tank-climate-change-challenges-health)
6. Wellcome Trust, new funding stream: sustaining health (http://www.wellcome.ac.uk/funding/Innovations/awards/sustaining-health/)
On the horizon ….

CRICOS #00212K

CRICOS #00212K

CRICOS #00212K

CRICOS #00212K
Is it possible to define quantitatively who gets isolated on the margins of society, and to
describe what happens to them?

CRICOS #00212K
Defining types and sub-types of Australians Funding: FaHCSIA Social Policy Research Program
1. Identify major categories of Australians – For policy purposes for FaHCSIA: ‘clients’ – Family structure, relationship roles, belonging – Mental & physical health – Psychosocial & socio-economic factors
2. Key characteristics of categories – Distinctive strengths & vulnerabilities
Berry, 2008a, b, c
CRICOS #00212K
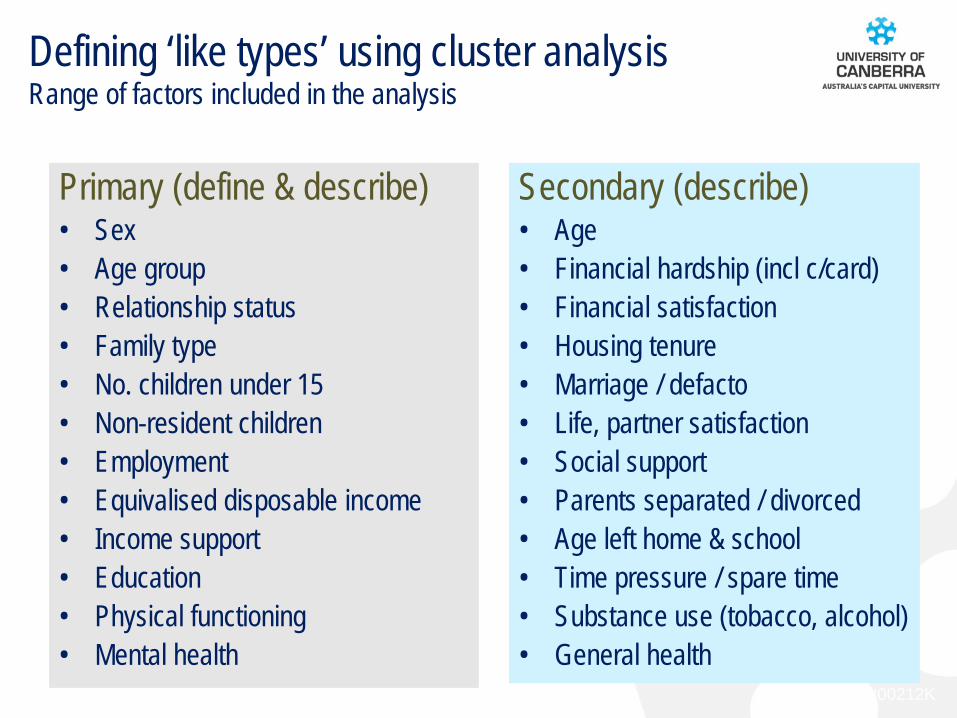
Defining ‘like types’ using cluster analysis Range of factors included in the analysis
Primary (define & describe) • Sex • Age group • Relationship status • Family type • No. children under 15 • Non-resident children • Employment • Equivalised disposable income • Income support • Education • Physical functioning • Mental health
Secondary (describe) • Age • Financial hardship (incl c/card) • Financial satisfaction • Housing tenure • Marriage / defacto • Life, partner satisfaction • Social support • Parents separated / divorced • Age left home & school • Time pressure / spare time • Substance use (tobacco, alcohol) • General health

CRICOS #00212K
Five Australian Archetypes (slides courtesy of Tegan Cruwys, 2012)
1. Well-connected Retirees
CRICOS #00212K
2. Time-Pressured Couples with Kids

CRICOS #00212K
3. Financially Secure Couples
CRICOS #00212K
4. Dissatisfied Working Age Singles

CRICOS #00212K
5. Marginalised Australians
CRICOS #00212K
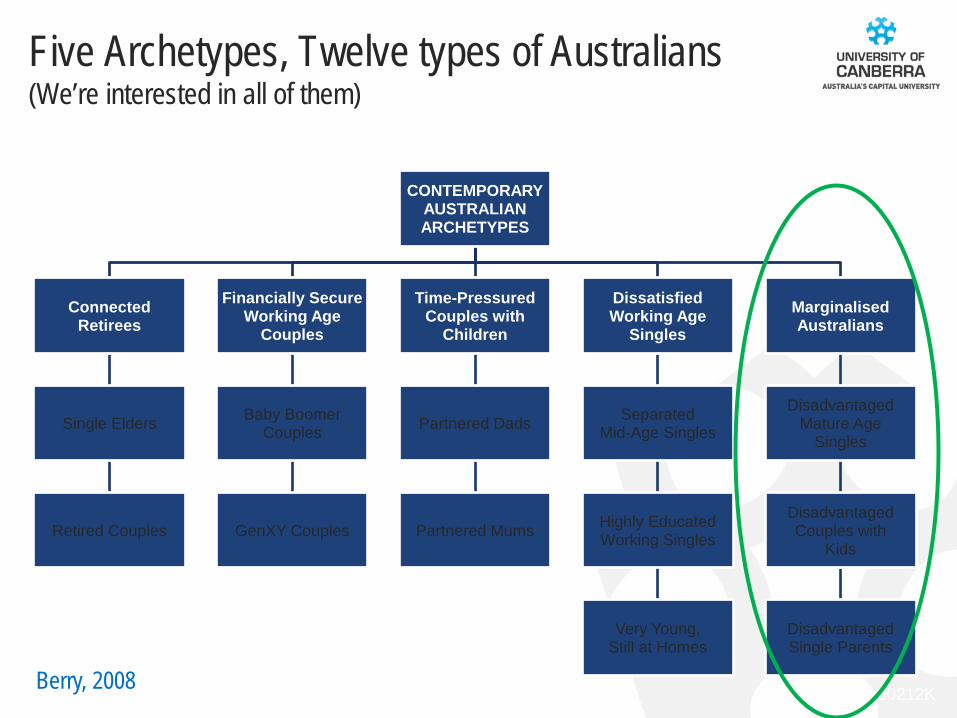
Five Archetypes, Twelve types of Australians (We’re interested in all of them)
CONTEMPORARY AUSTRALIAN ARCHETYPES
Connected Retirees
Single Elders
Retired Couples
Financially Secure Working Age
Couples
Baby Boomer Couples
GenXY Couples
Time-Pressured Couples with
Children
Partnered Dads
Partnered Mums
Dissatisfied Working Age
Singles
Separated Mid-Age Singles
Highly Educated Working Singles
Very Young, Still at Homes
Marginalised Australians
Disadvantaged Mature Age
Singles
Disadvantaged Couples with
Kids
Disadvantaged Single Parents
Berry, 2008
CRICOS #00212K
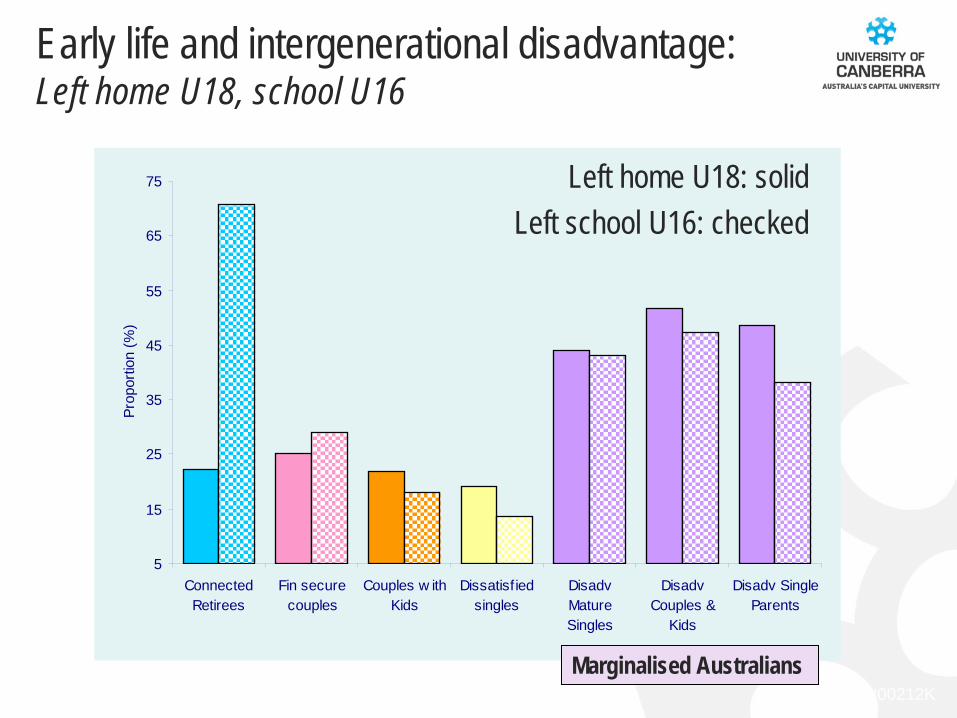
Early life and intergenerational disadvantage: Left home U18, school U16
5
15
25
35
45
55
65
75
ConnectedRetirees
Fin securecouples
Couples w ithKids
Dissatisf iedsingles
DisadvMatureSingles
DisadvCouples &
Kids
Disadv SingleParents
Prop
ortio
n (%
)
Left home U18: solid Left school U16: checked
Marginalised Australians

CRICOS #00212K
Physical & mental health (SF-36)
50
60
70
80
90
100
Still at
Hom
es
GenXY C
ouples
High Ed W
ork Sing
les
Partne
red D
ads
Partne
red M
ums
Sep M
id Age
Singles
Baby B
Coup
les
Disadv
Single P
arents
Disadv
Cou
ples &
Kids
Disadv
Matu
re Sing
les
Retired
Cou
ples
Single Elders
Phys
ical fu
nctio
ning
50
60
70
80
90
100
Men
tal h
ealth
Marginalised Physical health
Mental health
Retirees

CRICOS #00212K
(Lack of) participation & support
25
30
35
40
45
50
GenXY C
ouples
Baby B
Coup
les
Partne
red M
ums
Still at
Hom
es
Retired
Cou
ples
High Ed W
ork Sing
les
Partne
red D
ads
Single Elders
Sep M
id Age
Singles
Disadv
Cou
ples &
Kids
Disadv
Single P
arents
Disadv
Matu
re Sing
les
Com
mun
ity g
roup
s (%
yes
)
4.4
4.6
4.8
5
5.2
5.4
5.6
5.8
Mea
n so
cial
sup
port
Community participation bars; social support line

CRICOS #00212K
Where are they now? Marginalised Australians a decade later
1. Tracking Wave 1 HILDA Survey marginalised to Wave 10 2. Binary logistic regression equation probablistic model of
being marginalised (yes/no) at Waves 1 and 10 Identify marginalised people with 99% accuracy
3. Identify who exited, persisted 4. Predictors of exit In 5 domains (financial, health, social, stigma, early life) Controlling for degree of marginalisation at Wave 1
Funding: ACT Government Community Development Grants Program

CRICOS #00212K
Who Exits Marginalisation?
To start out with, they were:
• Less marginalised • Older • Male • Receiving income support
Then they ….
• Got an education • Got a job • Got a relationship • Didn’t get pregnant (again)
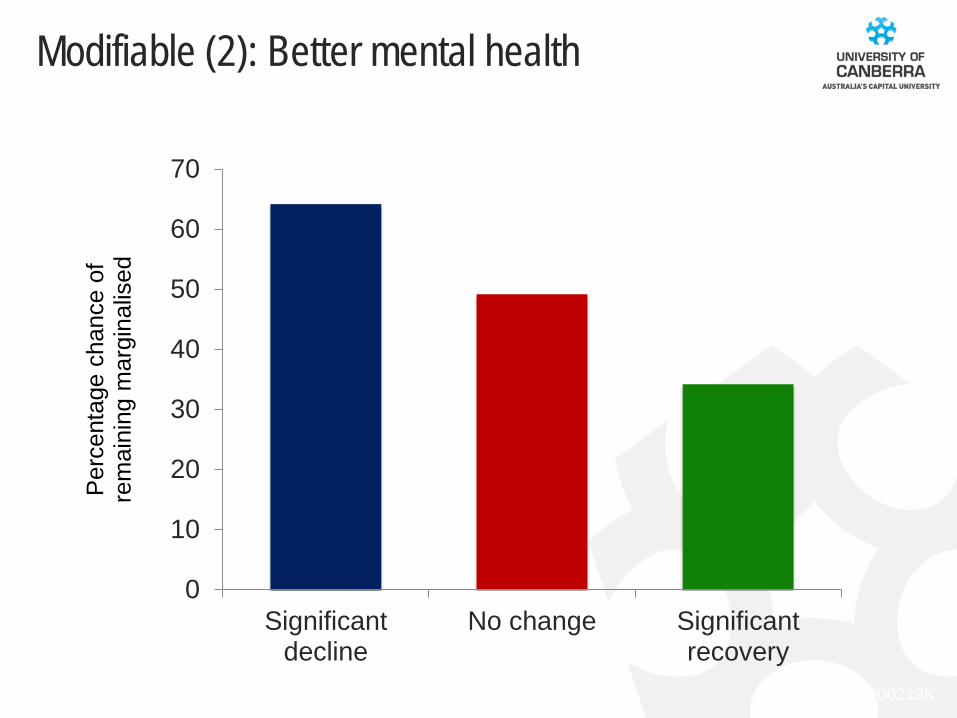
~ 60% exited marginalisation
Not modifiable Modifiable

CRICOS #00212K
0
10
20
30
40
50
60
70
Persistentlymarginalised
Exitsmarginalisation
Nevermarginalised
%
Not modifiable: More disadvantaged initially (e.g., left home under 18)

CRICOS #00212K
Modifiable (1): Obtained full-time employment
2001 2001
2001
2010
2010
2010
0
10
20
30
40
50
60
Persistentlymarginalised
Exitsmarginalisation
Never marginalised
Per
cent
age
Full-
time
Em
ploy
ed

CRICOS #00212K
2001
2001
2001
2010
2010
2010
0
5
10
15
20
25
30
Persistentlymarginalised
Exitsmarginalisation
Never marginalised
Modifiable (3): Tertiary degree
%
CRICOS #00212K
0
10
20
30
40
50
60
70
Significantdecline
No change Significantrecovery
Per
cent
age
chan
ce o
f re
mai
ning
mar
gina
lised
Modifiable (2): Better mental health

CRICOS #00212K
Some concluding thoughts
‘Marginalisation’: entrenched, complex disadvantage Not just about money; stigma, exclusion, little chance in life Affects every part of life Background vulnerability when disaster strikes
Hard to get out, but possible Isolation, mental illness: pernicious centrepiece
Intervene: isolation (participation); tho’ need MH services Address isolation: possible; systemic, multiple benefits Complex, long-term, tailored intervention
ACT ‘ThinkPlace’: http://thinkplace.com.au/

CRICOS #00212K
LINKS BETWEEN CC, SOCIAL CAPITAL AND MENTAL HEALTH:
CC AS A MULTIPLIER OF RISK AND DISADVANTAGE
CLIMATE CHANGE
PHYSICAL ENVIRONMENT
(NATURAL, BUILT)
SOCIAL ENVIRONMENT
(SOCIAL CAPITAL)
HEALTH
BEHAVIOURS
MENTAL HEALTH
INTERACTING DISADVANTAGES
CC RISK CYCLE
e.g. loss of
income
e.g. less social support
e.g. more substance
use
POORER COPING
e.g. more droughts
Berry, 2011
Can we quantify and project effects of some of these?

CRICOS #00212K
IPCC5 WGII report (Impacts, Adaptation and Vulnerability):
Chapter: health impacts (includes a very brief section on mental health
impacts of CC)

CRICOS #00212K
CLIMATE CHANGE 2014: IMPACTS, ADAPTATION, AND VULNERABILITY

CRICOS #00212K
SOCIOECONOMIC PROCESSES
Socioeconomic Pathways
Adaptation and Mitigation Actions
Governance
CLIMATE
Natural Variability
Anthropogenic Climate Change
RISK Hazards
Exposure
Vulnerability
IMPACTS
EMISSIONS and Land-use Change
Climate change: general pathways of impact

CRICOS #00212K
Social participation in Australia
85
Data • Household, Income and Labour Dynamics in Australia Survey (HILDA) • Large, national survey, representative of Australian population • Wave 6, 2006, N = 11,709
Cluster analysis (two-step) & logistic regression • Identify people’s shared characteristics, then classify people into groups based on
multiple shared characteristics, eg: age, sex, education, early adversity, marital status, ever divorced/separated, work status, household structure, household net worth, financial hardship, etc.
• Cluster analysed multiple times to identify nine meaningful subpopulations sub-groups in Australia.
• The most important distinguishing variables were: household structure, age, marital status, ever divorced/separated, the ability to raise $2000 in an emergency.

CRICOS #00212K
Social participation in Australia
86
• Five populations: (Looking at working adults in these populations) 1. Singles 2. Couples 3. Single parents 4. Nuclear family parents; 5. Blended family parents
• In each population, test whether the influence of ISC on mental
health (SF-36 subscale, 0-100) depends on: – Age (and sex) – Ability to raise $2,000 in an emergency – *Job satisfaction (6-item scale) – Divorced/separated status (if single) – *Relationship stress (if co-habitating; 6 item scale) – *Parenting stress (if resident child under 18 years; 4 item scale)

CRICOS #00212K
Social participation in Australia
87
• ISC was almost always important, but its protective properties had some limits…

CRICOS #00212K
Singles with below average job satisfaction
50
55
60
65
70
75
80
85
Lifelong Divorced
Lo ISC Hi ISC
SF-
36 M
H
88
Singles w. job satisfaction
Demographics. n=1,027; Age: M= 36.72, SE=.41; Female: 37.52%; Divorced: 26.76%; Wrk hrs: M=40.12, SE=.45, Permanent contract: 60.65%.
Singles who had below average job satisfaction also had worse wellbeing. This was only buffered by ISC for divorced/separated people.

CRICOS #00212K
Nuclear parents’ ISC and job satisfaction
Nuclear parents with high ISC or high job satisfaction do well. They do even better if they have both, and rather worse if they have neither.
89
Demographics. n=2,253; Age: M=40.41, SE=.42; Female: 43.18%; Work hours: M=38.57, SE=.30, Perm. contract: 58.81% Yngst child 0-4: 39.24%; No children: M=2.06, SE=.03.
50
55
60
65
70
75
80
85
LowerJob sat
HigherJob sat
Lo ISC Hi ISC
SF-
36 M
H

CRICOS #00212K
Blended family parents who can EASILY raise $2000 in an emergency
50
55
60
65
70
75
80
85
LowerPt stress
HigherPt stress
Lo ISC Hi ISC Parents in blended families who have with easy access to $$ need either high ISC or low parenting stress to maintain wellbeing. This kind of buffering effect does not occur for blended parents who cannot easily raise $2,000, although there are main effects for higher ISC and low parenting stress.
Cannot easily raise $2000
SF-
36 M
H
90
Demographics. n=224; Age: M=39.87, SE=.74.; Female: 39.06%; Wrk hrs: M=40.90, SE=, Perm. contract: 64.38% Yngst child 5-9: 32.24%; No children: M=1.62, SE=.09.

CRICOS #00212K
Single parents who can EASILY raise $2000 in an emergency
50
55
60
65
70
75
80
85
LowerPt stress
HigherPt stress
Lo ISC Hi ISC
SF-
36 M
H
91
Demographics. n=277; Age: M=40.45, SE=.56; Female: 87.92%; Wrk hrs: M=32.00, SE=.95, Permanent contract: 63.98%; Youngest child 10-14: 32.24%; No children: M=1.74, SE=.06.
Single parents with easy access to $$ need either high ISC or low parenting stress to maintain wellbeing. This kind of buffering effect does not occur for single parents who cannot easily raise $2,000.
Cannot easily raise $2000

CRICOS #00212K

CRICOS #00212K

CRICOS #00212K
Science communication: study participants

CRICOS #00212K
Some key implications of this definition:
Mental health is a process Ongoing through time (thus lifelong and intergenerational) Applies across context (work, community) About adult competence (coping) About the everyday (with normal stresses of life) Rights and responsibilities (self-realisation, contributing, not ‘all
about me’)
This is resilience in social & physical place Climate change means a new normal
WE NEED A NEW RESILIENCE, PERHAPS A NEW SOCIETY

CRICOS #00212K
Complext pathways of impact of CC on MH
CC is a multiplier of risk and disadvantage – and an opportunity
Climate change-related disaster (Specific acute, sub-acute and chronic events)
Community Economic &
social impacts
Mental Health
Physical Health
Damage to landscape & agriculture
Disease risks Altered food/water supply
Injury (smoke, burns)
Loss of livelihoods, out- migration, separation of families, poverty, isolation,
grief & bereavement
Stress, trauma,
solastalgia
Local cultural, economic, social, developmental and environmental context

CRICOS #00212K
10
11
12
13
14
15
16
17
18
19
20
Urban
Z-Mod
Dry
Long
Constant
Constant& Long
Drought impact in urban vs rural/remote Australia (The ‘Big Dry’: HILDA Survey Waves 1-7)
10
11
12
13
14
15
16
17
18
19
20
Rural
Mean K10 scores (moderate distress)
O’Brien, Berry et al. (2014). Funding: NHMRC
K10

CRICOS #00212K
10
11
12
13
14
15
16
17
18
19
20
Urban
Z-Mod
Dry
Long
Constant
Constant& Long
Mean K10 scores (moderate distress)
10
11
12
13
14
15
16
17
18
19
20
Rural
Drought and distress (Kessler 10) (HILDA Survey Waves 1-7)
O’Brien, Berry et al. (2014)

CRICOS #00212K
Competent, confident, connected and calm
Embedded in time and place Lifelong development, cohort effects
Everyday places we live and spend time
Connection to place (and migration)
Aboriginal Australians: ‘Social and emotional wellbeing’
Connectedness to land core component
Defining mental health: where to?

CRICOS #00212K
Happiness Distress
-.167** .200**
.039 .087-.003 .035-.062 .006-.033 .121*
-.068 .069-.165** .137*
.006 .106-.062 .029
Outside of my suburbAnywhere
I do things with my friend(s) who don’t live with me
I socialise with workmate(s) outside work
I do things with family member(s) who don’t live
with me
Outside of my suburbAnywhereInside my suburbOutside of my suburbAnywhereInside my suburb
Inside my suburb
Location- free Happiness DistressI keep in contact with my friend(s) when Iʼm not with them (e.g., -.163** .245**
I keep in contact with family who donʼt live with me (e.g., chatting -.073 .152*
I use social media to keep in touch with people (e.g., facebook & twitter) -.196** .036
Social participation and place

CRICOS #00212K
Droughts
Floods and cyclones Extreme heat

CRICOS #00212K
Drought The ‘Millenium Drought’ or the ‘Big Dry’
2001-08 (main years)

CRICOS #00212K

CRICOS #00212K
1. How do you conceptualise and measure drought for epidemiological studies?
2. How do you measure human exposure to drought? 3. Is there a direct relationship between exposure to
drought and mental health?
Using HILDA Survey, Waves 1-7 (2001-07) Millennium drought everywhere Wave 7 had K10 and SF-36 Those who did not move, N~6,500
The ‘Big Dry’ 2001-08 Berry et al.
Funding: National Health and Medical Research Council

CRICOS #00212K
• Exposure variables calculated for our study regions by CCD using a PostgreSQL database [http://www.postgresql.org] with the PostGIS spatial extension [http://postgis.refractions.net] managed by NCEPH, ANU
• Bureau of Meteorology’s gridded monthly climate data, resolution 0.25 degree of latitude-longitude, to calculate drought index based on 6-monthly percentiles for each location’s rainfall record 1890-2008
• Created two indices of dryness (a NSW data-based measure and a Victoria data-based measure) using Smith, Hutchinson & McArthur (1992) method (similar to but advance on Palmer)
• Aligned acceptably with these states’ drought declarations
Measuring drought Hanigan et al., PNAS, 2013; O’Brien, Berry et al. under review

CRICOS #00212K
How to conceptualise and measure drought?
People & places adapt: A relative concept?
-45
-40
-35
-30
-25
-20
-15
-10
-5
0year 2000 2001 2002 2003 2004 2005 2006
-17.5
Drought
occurs when threshold of
Smith, D., Hutchinson, M., & McArthur, R. (1992). Climatic and agricultural drought: Payments and policy. Canberra, ACT: Centre for Resource and Environmental Studies, ANU.
Method 2: count # months >5 ….
…. we combined the two
Some but not absolute correspondence between the two approaches
Method 1

CRICOS #00212K
Calculate indices of dryness, patterns of exposure
19 secondary indices, ways of summing, categorising
For example:
Total months in drought, how often in and out, mean extent of dryness, how long was longest period, last month experienced, quintiles / deciles of length/depth
Use indices in two-step cluster analysis by CCD
Categorise patterns of exposure over all years

CRICOS #00212K
Whether or not dryness has a negative impact on mental health depends on:
• Pattern of dryness over time
• Social context of a person’s community
Drought impact in urban vs rural/remote Australia O’Brien, Berry, Coleman & Hanigan (2014)

CRICOS #00212K
Science communication: Policy debate

CRICOS #00212K
5 Dryness Categories
59.49% Zero-to-Moderate: Most people have experienced some relative dryness but between 2001-2007 has not been extreme
11.44% Very Dry: During dry periods, relative dryness is in the top 15% for the population
17.79% Recent Long period: 11-16 months in unbroken drought between 2005-2007 (M=12.38)
5.37% Constant: 20-32 months in drought between 2001-2007 (M=21.93).
5.90% Constant + Recent Long period: Experienced both of these types of extreme relative dryness
(O’Brien, Berry, Coleman and Hanigan, 2014)

CRICOS #00212K
Rural vs urban drought & mental health (K10) What we expected, with a surprise
Impact of some types of (very bad relative) drought in rural areas What is this?
K10

CRICOS #00212K
Floods and cyclones Queensland’s ‘Summer of Sorrow’
2010-11

CRICOS #00212K
Queensland: Proportion of State affected (Queensland is 13x size of England)
No NDRRA assistance
Category A
Category A & B
Category A, B & C
Category A, B, C & D
Source: Operation Queenslander: The State, community, economic and environmental recovery and reconstruction plan 2011-2013. Queensland Reconstruction Authority 2011
72 of 73 Local Governments Area in QLD received Natural Disaster Relief and Recovery Arrangments 78% Qld ‘disaster
zone’, $7b for infrastructure alone

CRICOS #00212K
Flood damage

CRICOS #00212K
The ‘Mud Army’ (40% participated; injuries 5.6%)

CRICOS #00212K
Queensland’s ‘Summer of Sorrow’ (Berry, McDermott, QHealth, et al.)
Contacted by QHealth early 2011
2011 joint science-policy grant to investigate impact of ‘Summer of Sorrow’ using new ‘brief trauma exposure & impact screen’ (Berry et al.)
Adapted screen for these disasters
Context: Trauma is quite common in Australia • Lifetime prevalence PTSD ~1-8% (Ursano et al. 2004)
• NSMHWB: 12-month PTSD prevalence approx doubled 1997-2007 (3.3% – 6.4%)

CRICOS #00212K
Study design
QHealth annual Self-Reported Health Status survey
• 11 March to 6 June 2011, CATI, random-digit dialling • 2-stage sampling design (region, households) • Sample: N=12,564 adults, R/R 44%, ~no missing • Split-survey, random allocation; Trauma N~6,100 • Weighted (age, sex, Health Service District, selection prob)
1,693,033 adults ’personally affected’ (63%) 236,468 adults ‘still currently distressed’ (7%)

CRICOS #00212K
Trauma exposure & impact (Berry et al., 2010)
What was damaged?
1. Suburb 2. Family, friend or
carer’s home 3. Business 4. Own home
Index (range 0-4): • None • One • Any 2, 3 or 4
How did you feel? (K10; & adapted screen)
1. You thought you might be badly injured or even die (3.9%)
2. You felt terrified, helpless or hopeless (14.3%)
3. You are still currently distressed (7.1%) 4. You are worried about how you will
manage (8.6%)
1=yes, 0=no Index (range 0-4)

CRICOS #00212K
General psychological distress (K10) for cumulative exposure index (Willson et al., in prep.)

CRICOS #00212K
Cumulative exposure index by trauma index (Willson et al., in prep.)
***
***
***

CRICOS #00212K
What about vulnerable groups?
• People living in disadvantaged areas
• People living in rural and remote areas
• Diferent age groups, young people

CRICOS #00212K
Impact of cumulative exposure (trauma) by damage by area disadvantage (SEIFA) (Willson et al. in prep.)
As expected, exposure more traumatic in disadvantaged areas (blue bars)
CRICOS #00212K
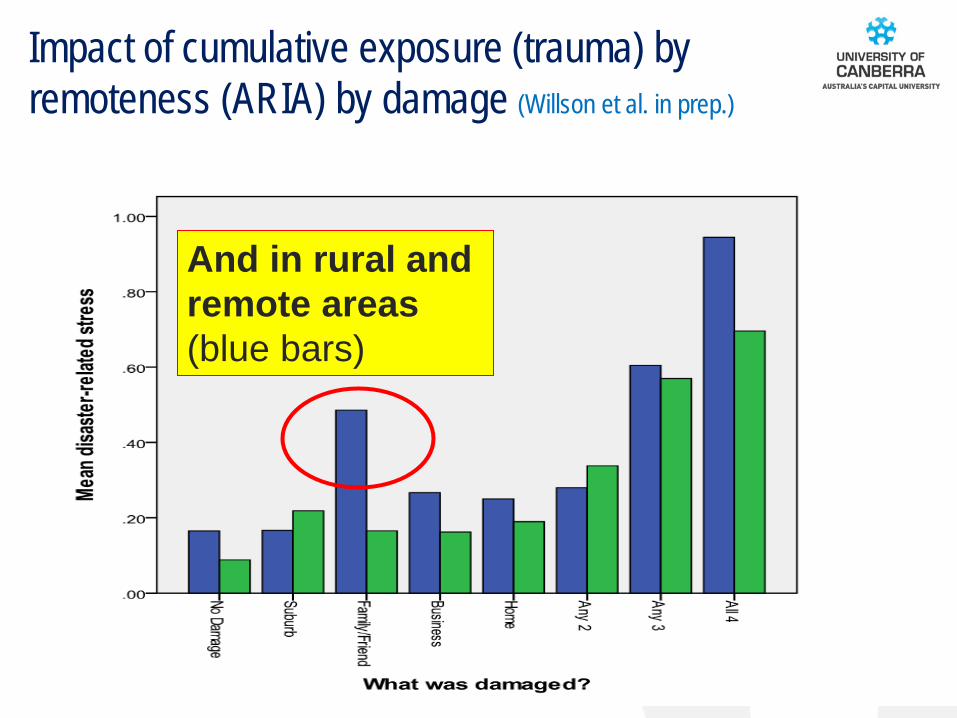
Impact of cumulative exposure (trauma) by remoteness (ARIA) by damage (Willson et al. in prep.)
And in rural and remote areas (blue bars)

CRICOS #00212K
Post-disaster trauma by age
25+
18-24
25+
Young people don’t seem more traumatised than older adults

CRICOS #00212K
Impact of cumulative exposure by age by damage (trauma) (Willson et al. in prep.)
Exposure more traumatic to older age groups (green bars)?
CRICOS #00212K
Extreme heat Australia 2009-10

CRICOS #00212K
Causal effect of extreme heat on MH in Australia 2009-10
• Quantify causal effects of extreme heat on individual MH • Wave 9 and 10 of the Household, Income and Labour Dynamics in
Australia (HILDA) Survey – Annual panel N~13,000, social, economic, demographic, health, other
– Interviewed in place (climate zone varies), time of year varies
• Gridded Daily Temperature Data, merged by CCD – Australian Government Bureau of Meteorology
• Fixed effects models: correct for potential individual-level bias in unobserved ability to cope with heat stress – Wide array of statistical controls; in standard deviations, normalised scores

CRICOS #00212K
Data sources
Human health data • Household, Income and Labour Dynamics in Australia (HILDA)
Survey, Waves 9 and 10 (2009, 2010) (good website) – Household-based cohort study – SF-36: Mental health, Vitality, Social functioning, Role-emotional, Overall – Diversity in the month of the year when measuring mental health
• From 2009, date mental health recorded • >10% participants MH measured in warm months • Diverse geographic distribution of participants, detailed geo info (CCD)
– 9,460 individuals in 2-wave balanced panel data • Weather data
– Gridded daily max temperature (Bureau of Meteorology) – 0.05×0.05°(5km×5km) – 5,223,425 CCD-day observations (no missing data)
CRICOS #00212K
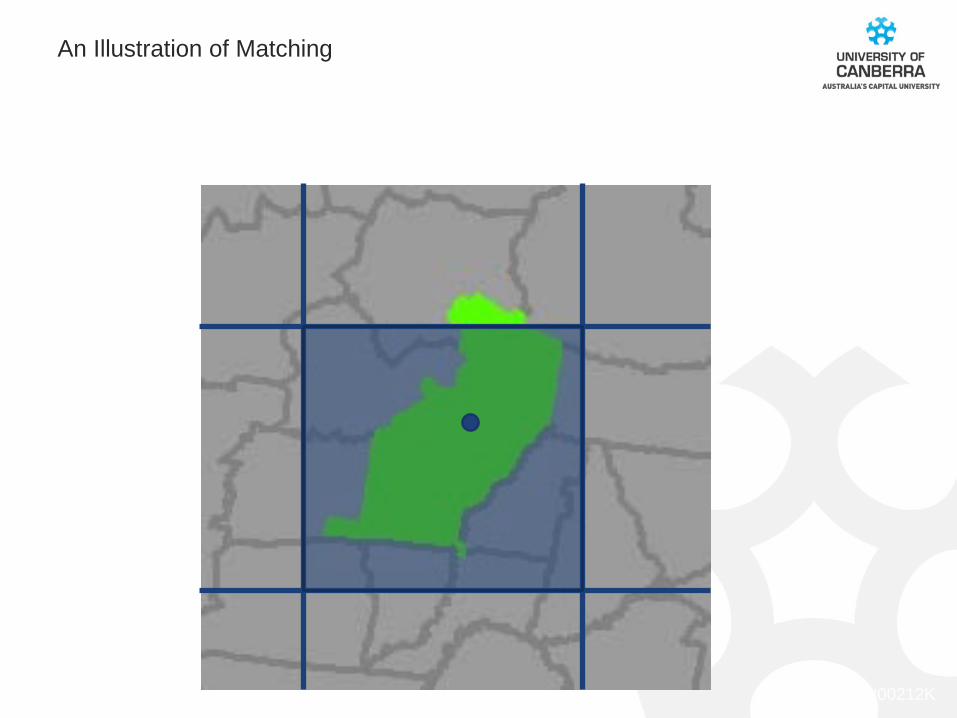
An Illustration of Matching

CRICOS #00212K
Day & month heat effects on vitality and role emotional by sex

CRICOS #00212K
Effect of Heat on MH in Australia: # days ≥30ºC 2009 and 2010, FE, Men (N=6,060)
Role emotional
Mental health
Vitality Social functioning
Same day -0.030 -0.082** -0.115*** -0.048
7-day 0.004 -0.003 -0.016* -0.010
30-day 0.001 -0.005 -0.007** -0.007*
90-day 0.000 -0.002 -0.004** -0.004*
365-day -0.001 0.000 -0.002** 0.000
Controlling for: age, sex, aboriginality, immigration, education, relationship, income, income2, employment, physical functioning, role-physical, month of the year, state, section of state,
interaction state x section of state

CRICOS #00212K
Effect of Heat on MH in Australia: # days ≥30ºC 2009 and 2010, FE, Women (N=6,831)
Role emotional
Mental health
Vitality Social functioning
Same day -0.108** -0.065 -0.057 -0.082*
7-day -0.029** -0.008 -0.004 -0.015
30-day -0.016*** -0.009** -0.006 -0.006
90-day -0.009*** -0.005** -0.002 -0.005**
365-day -0.001 0.001 0.000 0.000
Controlling for: age, sex, aboriginality, immigration, education, relationship, income, income2, employment, physical functioning, role-physical, month of the year, state, section of state,
interaction state x section of state

CRICOS #00212K
Yes, this has long been a contentious point. CC overtook GW about 20 years ago for three reasons: 1. 'Warming' sounds nice to many people. 2. Warming is only part of the overall change - albeit the best understood as a 'greenhouse' consequence. 3. IPCC has the phrase 'CC' incorporated in its name, and reflects the perspective of climate scientists. Now that extreme events (including contributions of heat, rainfall, lack-of-rainfall, winds and rising seas) are assuming prominence in the public's mind, CC is obviously the more appropriate term. (But the Climate Commission has mostly explained it, to lay readers, as a consequence of the retention of heat in the troposphere rendering the climate system more energetic, 'on steroids'). No perfect solution. Nor are they mutually exclusive in public discussion -- and the warming bit is the fundamental change.
Tony McMichael, ANU, Professor Emeritus: Email 16 Aug 2014
Climate system ‘on steroids’

CRICOS #00212K
Is it “natural”? Example: Australia Nicholls, 2014

CRICOS #00212K
Global warming means global
Data from http://www.berkeleyearth.org
All inhabited continents have been warming
Nicholls, 2014

CRICOS #00212K
Decision-making under deep uncertainty (Nicholls, 2014)
Adaptation?
Technological uncertainty
Economic uncertainty
Social uncertainty
Future emissions Natural climate
variability
“Climate sensitivity”
Climate change
Health impacts
Health science Politics etc.
Mitigation? Or both?
Other impacts
CRICOS #00212K
Greening psychiatric thinking & services
• Sustainable Healthcare (http://sustainablehealthcare.org.uk/mental-health-susnet)
• Fellowship in Sustainability (http://www.rcpsych.ac.uk/discoverpsychiatry/blogzone/drdanielmaughan.aspx)
• Editorial for International Psychiatry (Maughan, Berry & Davidson, 2014) – Set of articles commissioned on CC & MH (UK, Nepal, Australia)
• Social Psychiatry Group, Oxford Univ Dept of Psychiatry • Australia: national policy, a bit quiet • ANZCP, nothing (but do publish occasional journal papers
https://www.ranzcp.org/Publications/RANZCP-journals-public.aspx) • Department of Health and Ageing cf Government of Victoria

CRICOS #00212K

CRICOS #00212K
Australian Government Department of Health Current Corporate Plan Context Statement
The Department of Health operates in an environment where the expectation is that every dollar is well spent ... “The Department’s Corporate Plan has been developed in the context of: • Increased community and stakeholder expectations for information
and involvement in decision making about the services they need • An ageing population with increasing health demands • Challenges of a sedentary lifestyle and increased prevalence of
lifestyle diseases • Demand for better connectivity, communication and convenience in
accessing information and services • The need to operate more efficiently within constrained resources”

CRICOS #00212K
http://www.health.vic.gov.au/sustainability/
‘Mainstreaming’ sustainability and climate
adaptation

CRICOS #00212K CRICOS #00212K
What is the role of public health?

CRICOS #00212K
THE LIKELIHOOD OF
INCREASING MAGNITUDES OF WARMING INCREASE
SEVERE AND PERVASIVE IMPACTS

CRICOS #00212K
Likelihood of realised (mental) health impact
D Schroter and ATeam Consortium, 2004
Vulnerability to actual impact
Can’t always do much about these
Can with these: social, physical
environments
HUGE potential for public health promotion (finding the pearl in the oyster)

CRICOS #00212K
1. Advocacy: In the face of ‘climate denial’ and decision-
making uncertainty Human health is the ‘bottom line’
Important in every continent

CRICOS #00212K
Climate change? Global warming?
‘….. George W Bush swapped the term climate change for global warming in 2002, on the advice of the Republican political consultant, Frank Luntz. In a secret memo before the mid-term elections, Luntz warned Republicans – and Bush in particular – were singularly weak on the environment. He advised a strategy of disputing climate science, and of avoiding the term "global warming' because of its highly negative connotations. “It's time for us to start talking about 'climate change' instead of global warming ... 'climate change' is less frightening than 'global warming',” said the memo obtained by the Environmental Working Group ….’
Suzanne Goldenberg, US Envt Correspondent theguardian.com Wednesday 28 May 2014
Leiserowitz, A., Maibach, E., & Roser-Renouf, C. (2010) Climate change in the American Mind: Americans’ global warming beliefs and attitudes in January 2010. Yale University and George Mason University. New Haven, CT: Yale Project on Climate Change.
The politics of CC – a major issue in Australia

CRICOS #00212K
1998-99 2004-05
Satellite-based measures of average global temperature (near-surface lower atmosphere), by year (Sept-Feb period), 1979-2010
Reference temperature, (1979-1998 average)
2009-10 0.5
0.4
0.3
0.2
0.1
0
- 0.1
- 0.2
- 0.3
- 0.4
Temperature variation (oC), relative to reference temperature
1980 1985 1990 1995 2000 2005 2010
10 years of alleged ‘cooling’ since 1998
Long-term uptrend continues

CRICOS #00212K CRICOS #00212K
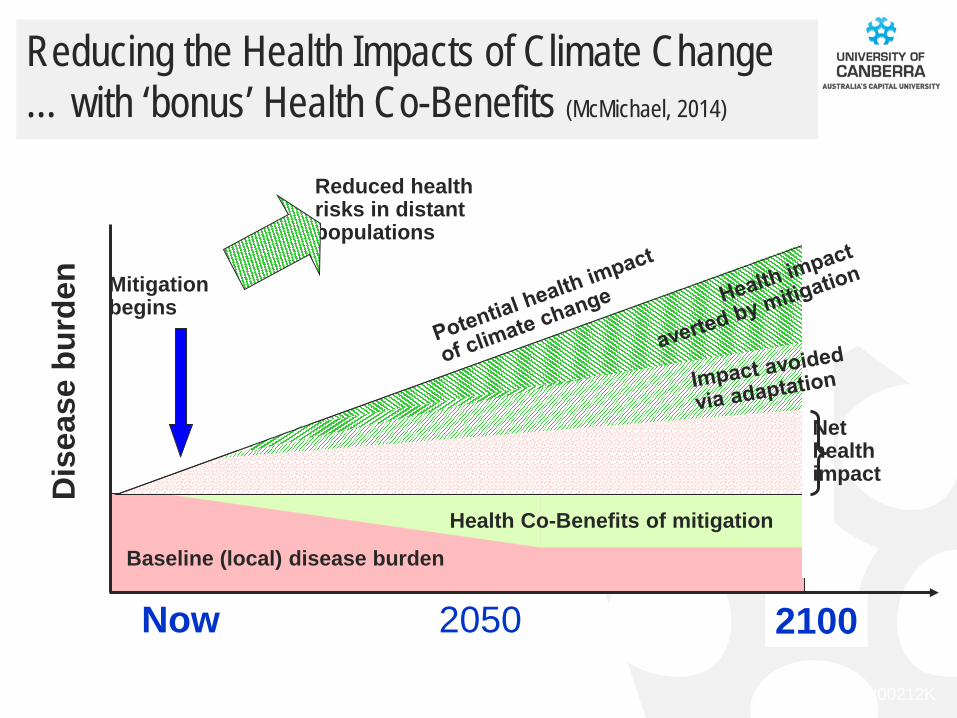
2. Emphasise that we must focus on the ‘big picture’ and a long-term approach, e.g., to respond to climate change
Most of the things we would do are also good for health, e.g., 1. eat less red meat 2. use active transport 3. focus less on having ‘stuff’
CRICOS #00212K
Reducing the Health Impacts of Climate Change … with ‘bonus’ Health Co-Benefits (McMichael, 2014)
Baseline (local) disease burden
Now 2050 2100
Dis
ease
bur
den
Health Co-Benefits of mitigation
Mitigation begins
Reduced health risks in distant populations
Net health impact

CRICOS #00212K
EFFECTIVE CLIMATE CHANGE ADAPTATION A MORE VIBRANT WORLD

CRICOS #00212K CRICOS #00212K
3. Framing public (mental) health strategy for climate change

CRICOS #00212K
Mitigation & adaptation are collective activities
Localised impact – great. Generalised – even better. e.g., recycling, cycling – co-benefits for people and planet (Capon)
• Mitigation & adaptation are appropriate (ideal even) for a
public health approach, but must not pressure individuals
• We can think about PH interventions for mitigation &
adaptation in terms of when and where interventions are
targetted

CRICOS #00212K
Framing public health interventions: Interventions matrix
Individual
Household
Community
Region
universal
targeted
early intervention treatment
From Berry et al. 2008
Targeting of intervention
Timing

CRICOS #00212K
Given the requirement for mitigation & adaptation, what should public health interventions emphasise?
Individual
Household
Community
Region
universal
targeted
early intervention treatment
Targeting of intervention
Timing

CRICOS #00212K
MH services for drought in Queensland Where are they?
Individual
Household
Community
Region
universal
targeted
early intervention treatment
From Berry et al. 2008; Saal et al, 2009, CRRMHQ Qld service mapping
Targeting of intervention
Timing

CRICOS #00212K CRICOS #00212K
4. Reminding politicians, the media, our peers and other citizens that nations have a responsibility globally (especially wealthy countries)

CRICOS #00212K 156
Cumulative Emissions of Greenhouse Gases
Countries scaled according to cumulative emissions (billions of tonnes CO2-equivalent) up to 2002.
(Patz, Gibbs, et al, 2007
Cartogram #1

CRICOS #00212K 157
Cartogram #2: Mortality Impacts of Climate Change 2000
14 WHO regions scaled according to estimated annual death rates (in year 2000) attributable to the climate change that had occurred 1970-2000. (Patz, Gibbs et al, 2007: based on McMichael et al, 2004)
Annual attributable deaths from malnutrition (~80K), diarrhoea (~50K), malaria (~20K), flooding (~3K) … and (in OECD countries) heatwaves

CRICOS #00212K
http://www.theage.com.au/national/-102r1w.html
A climate of despair, August 13, 2014 Konrad Marshall Senior Reporter for The Age
Nicole Thornton remembers the exact moment her curious case of depression became too real to ignore. It was five years ago and the environmental scientist – a trained biologist and ecologist – was writing a rather dry PhD on responsible household water use. After a two-decade career in green awareness and eco-tourism, Thornton was happy to finally be researching her pet project at the University of Technology in Sydney – but she was also on edge. Thornton had always been easily upset by apathy towards, and denial of, environmental issues. But now she began to notice an oddly powerful personal reaction to “the small stuff” – like people littering, or neighbours chopping down an old tree.
Talk to reputable journalists

CRICOS #00212K
Dear Prime Minister, We urge you to include human-induced climate change and its serious health consequences on the agenda for this year's G20 meeting. The world community looks to high-income countries for a strong lead. Current climate trends, driven by global warming, threaten the basis of future economic prosperity, regional political stability and human health. As concern rises in many countries, including increasing awareness of the risks to human health and safety, many G20 members are strengthening their commitment to substantive mitigation action. … Meanwhile, if Australia passes up opportunities for new energy technologies and efficiencies, we will forfeit gains in long-term economic security and fail to contribute fairly to reducing worldwide risks to human health ……
Open letter to the Hon Tony Abbott MP (McMichael et al., Med Journal of Australia, Aug 2014)

CRICOS #00212K
Your name is appropriate, you should be in a fruit cake with the rest of the global warning dopes. I have just been watching you on Sky News and what a lot of absolute tripe you have presented .… I notice you have red hair so you look Irish. As you know there are thousands of jokes about the stupid Irish so I guess you can be included in many of them … Why in the hell must us taxpayers continue paying your wages when you contribute absolutely nothing but lies to the people of Australia … For God’s sake resign and go and live up in Nimbin with the rest of the airheads who are drug induced and talk rot like you do ... I do not expect a reply from you as I believe your type are a lot of gutless wimps who have had such a bad upbringing they just want to cause havoc to the many decent Australians who do not listen to your garbage.
Fan mail: Climate change and health: IPCC reports emerging risks, emerging consensus http://theconversation.com/climate-change-and-health-ipcc-reports-emerging-risks-emerging-consensus-24213

CRICOS #00212K
1. Australian Academy of Science Think Tank 2014 Brisbane: CC challenges to health; report Dec 2014 (http://www.science.org.au/events/2014-theo-murphy-high-flyers-think-tank-climate-change-challenges-health)
2. Knowledge & beliefs about CC: is concern about CC linked to mental health? Regional Wellbeing Survey 2013 (http://www.canberra.edu.au/murray-darling-crn/regional-wellbeing)
3. First papers from Australia-Norway comparison of sustainable urban form and mental health
4. Collaboration – Govt Shanghai: healthy (smoking) and sustainable behaviours (incl. CC) and mental health
5. RCPsych Sustainability Summit: Environment, Society and Psychiatry London 1 October (https://www.eventbrite.co.uk/e/rcpsych-sustainability-summit-environment-society-and-psychiatry-tickets-11645505019?aff=es2&rank=2)
6. RCPsych conference Birmingham July 2015 (http://www.rcpsych.ac.uk/traininpsychiatry/eventsandcourses/internationalcongress2013.aspx)
A few forthcoming publications and activities

CRICOS #00212K
Some concluding thoughts Mitigate and adapt: Prepare, respond, recover, rebuild
There are things we can do to mitigate and adapt ahead of CC
• Impacts can be specific in nature (e.g., floods & trauma vs generalised distress), place (e.g., droughts & rural), whom affected (heat & women vs men; droughts & poverty), longevity (heat)
• Existing vulnerability is a risk factor, but nuanced: • Youth & age not necessarily risk factors – working age people • Poverty, existing MH & PH and living in remote locations are
• Innovative approaches to public health and research • Advocacy – difficult but essential
• International responsibility, especially the developing world

CRICOS #00212K
World Health Organization definition of health: … A state of complete physical, mental and social
wellbeing
People and Place Program: … Investigate how to promote everyone’s wellbeing, no
matter who you are or where you live.
Wellbeing

CRICOS #00212K
Sister study: The Regional Wellbeing Survey
www.regionalwellbeing.org.au