building an effective knowledge base - world...
TRANSCRIPT

Building an Effective Knowledge Base
The smart road to sustainable transport
April 2010 n
World Bank GEF Operations
World Bank GEF Coordination Team
Environment Department
The World Bank
1818 H Street, NW
Washington, D.C. 20433, USA
Telephone: 202.473.1816
Email: [email protected]
Web: www.worldbank.org/GEF
THE WORLD BANK

Building an Effective
Knowledge BaseThe smart road to
sustainable transport
April 2010

© 2010 The International Bank for Reconstruction and Development/ THE WORLD BANK1818 H Street, N.W.Washington, D.C. 20433 U.S.A.
Printed in the United States of America
The following evaluation team members participated in the data collection, analy-sis, and production of the report:
This report was prepared by Richard H. Hosier and John A. Rogers for the World Bank’s Global Environment Facility Coordination Team. Do-minique Kayser and Clare Fleming assisted in editing the final report.
Book design: The Word Express, Inc., based on work by Louise Shaw-Barry.Cover design by The Word Express, Inc.Photographs courtesy of iStockphoto, Flikr and World Bank Photo Library
Rights and permissionsThe material in this publication is copyrighted. Copying and/or transmitting por-tions or all of this work without permission may be a violation of applicable law. The International Bank for Reconstruction and Development/The World Bank encourages dissemination of its work and will normally grant permission to repro-duce portions of the work promptly. For permission to photocopy or reprint any part of this work, please send a request with complete information to the Copy-right Clearance Center Inc., 222 Rosewood Drive, Danvers MA 01923, USA; telephone: 978-750-8400; fax: 978-750-4470; Internet: www.copyright.com.
All rights reserved
The World Bank does not guarantee the accuracy of the data included in this work. The boundaries, colors, denominations, and other information shown on any map in this work do not imply any judgment on the part of the World Bank concerning the legal status of any territory or the endorsement or acceptance of such boundaries. The findings, interpretations, and conclusions expressed in this publication are those of the author and should not be attributed to the World Bank, to its affiliated organizations, or to the members of its Board of Executive Directors or the countries they represent.

Building an Effective Knowledge Base: The smart road to sustainable transport iii
■■ Table of Contents
Urbanization Drives Mobility . . . . . . . . . . . . . . . . . . . . . . . . . . . . . . . . . . . . . 1
Mobility Drives Infrastructure Needs . . . . . . . . . . . . . . . . . . . . . . . . . . . . . . . 1
But for what type of Infrastructure? . . . . . . . . . . . . . . . . . . . . . . . . . . . . . . . . 2
Sustainable Transport: A Solution both Local and Global . . . . . . . . . . . . . . . 3
The Global Environment Facility-World Bank Partnership with Developing Countries for Sustainable Transport. . . . . . . . . . . . . . 3
The GEF/World Bank Portfolio . . . . . . . . . . . . . . . . . . . . . . . . . . . . . . . . . . . 7
Measuring Project Effectiveness: Bridging the Critical Information Gap. . . . 9
Defining an Effective Methodology for Measuring Sustainable Transport Effectiveness . . . . . . . . . . . . . . . . . . . . . . . . . . . . . . . . . . . . . 11
Building a Sustainable Transport Toolkit . . . . . . . . . . . . . . . . . . . . . . . . . . . . 12
Conclusion: Toward Sustainable Mobility. . . . . . . . . . . . . . . . . . . . . . . . . . . . 13
References . . . . . . . . . . . . . . . . . . . . . . . . . . . . . . . . . . . . . . . . . . . . . . . . . . . . 15
Annex 1: Building a Transport Activity Measurement Toolkit . . . . . . . . . . . . 17


Building an Effective Knowledge Base: The smart road to sustainable transport 1
■■ Urbanization Drives Mobility
In 2008, for the first time in history, more than half the world’s population—3.3 billion people—lived in urban areas. Over the next twenty years, this number is expected to jump to an unprecedented 5 billion urban inhabitants, mostly in the developing world. This increasing urbanization will be most notable in Africa and Asia where the urban population is expected to double by 2030 (United Nations, 2007).
Although urbanization is frequently cited as a major cause of global emissions growth, it would be better understood as a crucial link between climate and devel-opment (Dodman 2009). Urbanization is a major driver of development (World Bank, 2008) and once in cities, people tend to increase their mobility dramatically, driving an increase in GHG emissions. On a global level, the transport sector currently generates nearly one-quarter of world-wide energy-related CO2 emis-sions, accounts for about 19 percent of energy use, and is the sector most closely linked to fossil fuel consumption. From 1971–2006, global transport energy use rose steadily at between 2 and 2.5 percent per year, closely paralleling the increase in the world’s economic activity (IEA, 2009). Of this global energy use, approxi-mately three-quarters were consumed by on-road motorized transport (50 percent by passenger and 24 percent by freight). Based on urbanization trends, the urban share of transport-sector GHG emissions can be expected to grow rapidly: total passenger travel in developing countries is expected to double by 2050, going from 4,000 to 8,000 km per person per year.
■■ Mobility Drives Infrastructure Needs
As incomes and urbanization increase, private vehicle ownership will increase as well, further increasing both GHG emissions and infrastructure demands. Over 80 percent of the 2.3 billion new cars that are expected to enter service over the 2005–2050 timeframe will be in developing countries (Chamon, et al., 2008). A World Bank study in 9 cities in 6 countries of the East Asia Pacific region forecast urban on-road motorized passenger-kms to increase to 1.9 times their 2007 values in the 13 years preceding 2020 (World Bank, 2009a). For India, a conservative forecast for the World Bank low carbon development study gave on-road motor-ized passenger-kms travelled in 2031 to be 8.7 times the 2005 figures. Not only does rising incomes promote higher car ownership, but they also increase vehicle use, energy demand, congestion, GHG emissions and local pollution from road transport.
2 Building an Effective Knowledge Base: The smart road to sustainable transport
Policies have been used to decouple car ownership and use from economic growth in a few shining cases (Schipper, 2007). European and Japanese drivers travel 30–60 percent fewer vehicle kilometers than drivers in the United States with comparable incomes and car ownership. Hong Kong, China, has one-third the car ownership of New York, the American city with the lowest ratio of cars per capita (Lam and Tam 2002). How? Through a combination of high urban density, high fuel taxes, road-pricing policies, and well-established public transport infrastruc-ture. Europe has four times the public transport routes per 1,000 persons as the United States (Kenworthy, 2003).
For most developing countries, the rapid rise in urbanization will require both expansion and improvement of modern public transport infrastructure and serv-ices just to avoid deterioration in mobility. Existing infrastructure is simply insuf-ficient for current populations even without the dramatic rise in private vehicle ownership and use. Unless infrastructure investments to improve public transport keep pace up with urban growth, urbanization and private car ownership trends will create chronic problems of congestion, pollution, road safety, health impacts and GHG emissions.
■■ But for what type of Infrastructure?
The infrastructure design and development decisions which will be taken over the coming years will directly affect the long term sustainability of these cities. Infra-structure investments have a long life; design decisions made centuries ago are still evident in cities and towns around the world. If cities are developed to satisfy the needs of private motorization—as often demanded by a vocal minority of inhab-itants—they will “lock-in” to a high energy-consuming development trajectory which will be difficult, if not impossible, to change at a later date.
Extensively adding road space leads to urban sprawl and makes providing qual-ity mass transit services. Just to maintain current mass transit shares in the face of exploding private vehicle ownership is almost an impossible task unless a paradigm shift occurs in the way we look at urban design and development. The spectacular rate of growth in auto ownership is likely to accelerate as disposable income increases, credit for vehicle purchase becomes more widely available, and lower cost cars (such as the TATA Nano in India) enter the market. Because more families in the developing world will own private vehicles, we are faced with the complex problem of convincing them not to use those vehicles for their routine daily travel. This can only be done by providing clean, modern, and ef-fective alternatives.

Building an Effective Knowledge Base: The smart road to sustainable transport 3
■■ Sustainable Transport: A Solution both Local and Global
Actions other than adding more roads need to be taken to focus cities’ develop-ment along a more sustainable pathway. A paradigm shift is urgently needed to reshape and refocus the urban transport sector toward trans-port systems that not only give the urban inhabitants the mobility and access to the goods and services that they need, but do it sustainably, with little impact on the environment.
Sustainable transport should contribute to a higher quality of life in vibrant and livable cities; reducing environmental and social impacts (such as traffic conges-tion), through an enhanced mix of efficient public transport systems, walking and cycling, car-pooling, and other transport technologies using renewable and less contaminating energy sources. (See Box 1.)
The biggest development challenge to shape a more sustainable future will be to provide the knowledge, assistance, and incentives that allow local stakeholders to purse this paradigm shift and make infrastructure decisions leading to long-term sustainability; improving access to goods and services, and improving their cities’ livability while minimizing negative externalities, among them, GHG emissions.
■■ The Global Environment Facility-World Bank Partnership with Developing Countries for Sustainable Transport
Projects on sustainable transport generally pose greater challenges than energy mitigation projects in other sectors. They pose greater design and implementation complications, particularly because of the large number of individual decision-makers that are involved. Countries undertaking transport sector redesign have
4 Building an Effective Knowledge Base: The smart road to sustainable transport
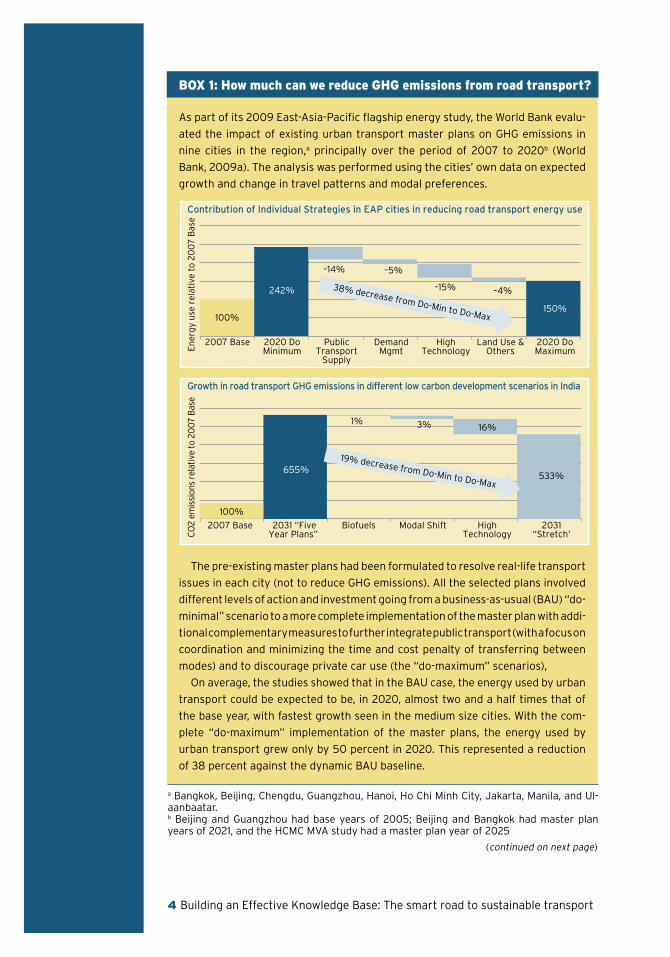
As part of its 2009 East-Asia-Pacific flagship energy study, the World Bank evalu-
ated the impact of existing urban transport master plans on GHG emissions in
nine cities in the region,a principally over the period of 2007 to 2020b (World
Bank, 2009a). The analysis was performed using the cities’ own data on expected
growth and change in travel patterns and modal preferences.
The pre-existing master plans had been formulated to resolve real-life transport
issues in each city (not to reduce GHG emissions). All the selected plans involved
different levels of action and investment going from a business-as-usual (BAU) “do-
minimal” scenario to a more complete implementation of the master plan with addi-
tional complementary measures to further integrate public transport (with a focus on
coordination and minimizing the time and cost penalty of transferring between
modes) and to discourage private car use (the “do-maximum” scenarios),
On average, the studies showed that in the BAU case, the energy used by urban
transport could be expected to be, in 2020, almost two and a half times that of
the base year, with fastest growth seen in the medium size cities. With the com-
plete “do-maximum” implementation of the master plans, the energy used by
urban transport grew only by 50 percent in 2020. This represented a reduction
of 38 percent against the dynamic BAU baseline.
Box 1: How much can we reduce GHG emissions from road transport?
a Bangkok, Beijing, Chengdu, Guangzhou, Hanoi, Ho Chi Minh City, Jakarta, Manila, and Ul-aanbaatar.b Beijing and Guangzhou had base years of 2005; Beijing and Bangkok had master plan years of 2021, and the HCMC MVA study had a master plan year of 2025
Contribution of Individual Strategies in EAP cities in reducing road transport energy use
2007 Base
Ene
rgy
use
rela
tive
to
200
7 B
ase
2020 DoMinimum
2020 DoMaximum
PublicTransport
Supply
DemandMgmt
–14%
100%
242%
150%
–15%
–5%
–4%
HighTechnology
Land Use &Others
38% decrease from Do-Min to Do-Max
Growth in road transport GHG emissions in different low carbon development scenarios in India
2007 Base
CO
2 em
issi
ons
rela
tive
to 2
00
7 B
ase
100%
19% decrease from Do-Min to Do-Max
2031 “FiveYear Plans”
Biofuels Modal Shift HighTechnology
2031“Stretch’
3%1%16%
655%533%
(continued on next page)

Building an Effective Knowledge Base: The smart road to sustainable transport 5
begun to seek global support for this work, which is central to their sustainable development plans.
In 2000, to help countries to reshape their transport sectors—not only to provide local municipal sustainability but to contribute to increased global environmental benefits—the governing Council of the Global Environment Facility (GEF) ap-proved the GEF Operational Program for Sustainable Transport (OP11), calling for a focus on six areas:
◆ Modal shifts to more efficient and less polluting forms of public and freight transport through measures such as traffic management and avoidance and increased use of cleaner fuels
◆ Non-motorized transport ◆ Fuel-cell or battery operated 2- and 3-wheelers designed to carry more than
one person
India has a lower motorization index and thus is expected to exhibit greater
growth. Nationwide, road transport GHG emissions can be reduced 19 percent
against the dynamic BAU baseline by 2032 by improving public transport and
light-duty-vehicle technology (World Bank, 2009b).
Improved (high density) urban design, strengthened public transport and a
greater commitment to charge private transport externalities will be needed to
further reduce energy consumption and GHG emissions (World Bank, 2009c).
Developing countries will install at least half the long-lived energy capital
stocks built between now and 2020(McKinsey, 2009). The scale and rate of ur-
banization present an unrivaled opportunity to make major decisions today about
building low-carbon cities with compact urban designs, good public transport,
efficient buildings, and clean vehicles.
Box 1: How much can we reduce GHG emissions from road… (cont)
Marseilles
AtlantaJohannesburg
Kuala LumpurFrankfurt Mexico City
HarareParisCape TownCuritibaBerlin
Tokyo Santiago
SingaporeSão Paulo
BogotáShanghai
Seoul Mumbai
Cairo
Delhi
LosAngeles
Individual emissions from transport (kg per capita
0 50 100 150 100 250
700
600
500
400
300
200
100
0300 350
Density (people per hectare)
6 Building an Effective Knowledge Base: The smart road to sustainable transport
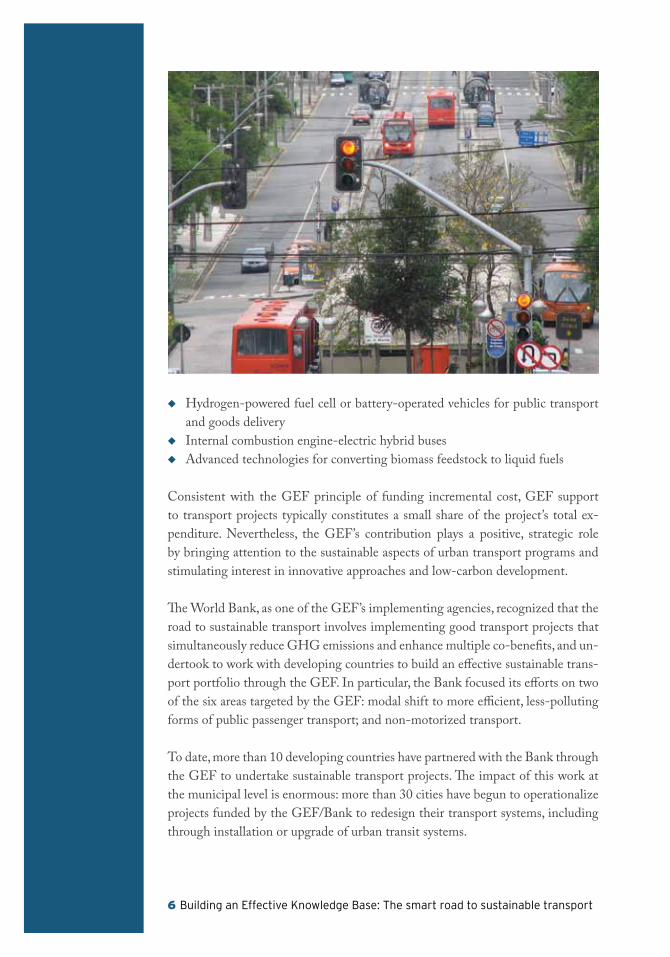
◆ Hydrogen-powered fuel cell or battery-operated vehicles for public transport and goods delivery
◆ Internal combustion engine-electric hybrid buses ◆ Advanced technologies for converting biomass feedstock to liquid fuels
Consistent with the GEF principle of funding incremental cost, GEF support to transport projects typically constitutes a small share of the project’s total ex-penditure. Nevertheless, the GEF’s contribution plays a positive, strategic role by bringing attention to the sustainable aspects of urban transport programs and stimulating interest in innovative approaches and low-carbon development.
The World Bank, as one of the GEF’s implementing agencies, recognized that the road to sustainable transport involves implementing good transport projects that simultaneously reduce GHG emissions and enhance multiple co-benefits, and un-dertook to work with developing countries to build an effective sustainable trans-port portfolio through the GEF. In particular, the Bank focused its efforts on two of the six areas targeted by the GEF: modal shift to more efficient, less-polluting forms of public passenger transport; and non-motorized transport.
To date, more than 10 developing countries have partnered with the Bank through the GEF to undertake sustainable transport projects. The impact of this work at the municipal level is enormous: more than 30 cities have begun to operationalize projects funded by the GEF/Bank to redesign their transport systems, including through installation or upgrade of urban transit systems.

Building an Effective Knowledge Base: The smart road to sustainable transport 7
TA B l E 1 Initial Cohort of GEF-sponsored World Bank Sustainable Transport Projects
Country (City) Project Title
GEF Funding
($m)
Total Funding
($m)
Estimated CO
2
Emission Reduction
Target(t CO
2e)
Current Status
Chile (San-tiago)
Sustainable Transport and Air Quality for Santiago
$7.0 $14.0 31,000 Closed late 2009
Mexico (Mexico City)
Climate Friendly Measures in Transport
$5.8 $12.2 None Completed (see Box)
Peru (Lima) Lima Urban Transport
$7.9 $142.3 1,916,000 Closes June 2010
Philippines (Manila)
Marikina Bicycle Network
$1.3m $97.6 None Completed
■■ The GEF/World Bank Portfolio
By 2006, the Bank had helped countries design a first cohort of 14 GEF-spon-sored sustainable transport projects, of which four were under implementation at the time of the Third GEF Assembly (World Bank 2006). These four projects and their current status are listed in Table 1 below.
Of the two completed projects, the Marikina project has exceeded its target for increasing the safe use of non-motorized transport safely in metropolitan Manila, and the Mexico City project (see box 2) has contributed dramatically to Mexico’s pursuit of sustainable transport throughout all of its urban areas.
Since then, the portfolio has grown to include projects in Asia, Latin America and Africa, with potential positive impacts on the transport sector in 30 cities and accounting for a vast potential projected reduction in GHG emissions by 2030.

8 Building an Effective Knowledge Base: The smart road to sustainable transport
Transport is the sector that showed the greatest participation in energy consump-
tion and the second largest contributor of GHG emissions in Mexico, accounting
for 18 percent of the 643 million tons of carbon dioxide equivalent emitted by
the country in 2002 (INE, 2007). Road transport is also associated with issues of
ambient air quality. The World Bank’s partnership with Mexico City represents a
comprehensive approach to tackling urban local and global pollution caused by
the transport sector2b (Johnson et al, 2009).
With a $5.8 million GEF contribution, the $12.2 million Introduction of Climate
Friendly Measures in Transport project has contributed to Mexico’s development
of policies and measures to support a modal shift toward lower carbon-intensive
transport in the Mexico City Metropolitan Area. The project was instrumental in
reform of the city’s transport policy framework and development of the first Bus
Rapid Transit (BRT) System. This project supported the city’s first BRT corridor,
creation of the METROBUS agency to manage the system, testing of alternative
technologies, development of monitoring methodologies for CDM, and develop-
ment of the first Latin American city-wide Climate Change Action Plan.
The city replaced an aging fleet of 350 polluting buses and microbuses with a
modern fleet of 97 high-capacity articulated buses that run in dedicated lanes, re-
sulting in time savings for passengers, increased capacity and quality of service,
and the reduction of local and global pollutants. The operation was credited with
having changed the momentum for the city’s transport system, transporting 10
million passengers and resulting in GHG emission reductions of over 107 kilo-tons
of CO2 equivalent during the first three years of operation. A cost-benefit study
done by Mexico’s Instituto Nacional de Ecología found total transport benefits of
at least $15 million/year from the
operation (Schipper et al, 2009).
Using the lessons and experienc-
es of the Climate-Friendly Trans-
port Project, the Mexico Urban
Transport Transformation Program
(UTTP) was designed to transform
urban transport in eight Mexican
cities to a lower carbon growth
path. The project will blend togeth-
er resources from IBRD ($200m);
the Clean Technology Fund ($200m); National Trust for Infrastructure ($900m);
the private sector ($300m) and participating municipalities ($150m). Anticipated
carbon revenue payments are initially estimated at being no less than $50 mil-
lion. In addition, four of the participating municipalities (Ciudad Juarez; Puebla,
Leon, and Monterrey) have also received funding under the GEF-funded Sustain-
able Transport and Air Quality Project (STAQ), which will provide assistance to
them in the preparation of their transport plans.
Box 2: Mexico City: Actions leading to replicationa
a World Bank, 2007b In the Mexico City metropolitan area, the transport sector accounts for about 40% of total GHG emissions
Building an Effective Knowledge Base: The smart road to sustainable transport 9
■■ Measuring Project Effectiveness: Bridging the Critical Information Gap
From its inception, the GEF has played a key role in helping developing coun-tries test, innovate, and learn from activities intended to improve the delivery of global environmental benefits. Its focus on “learning by doing” has paved the way for much of the growth in in-vestments in re-newable energy and energy ef-ficiency world-wide.
In the sustain-able transport sector, however, results so far
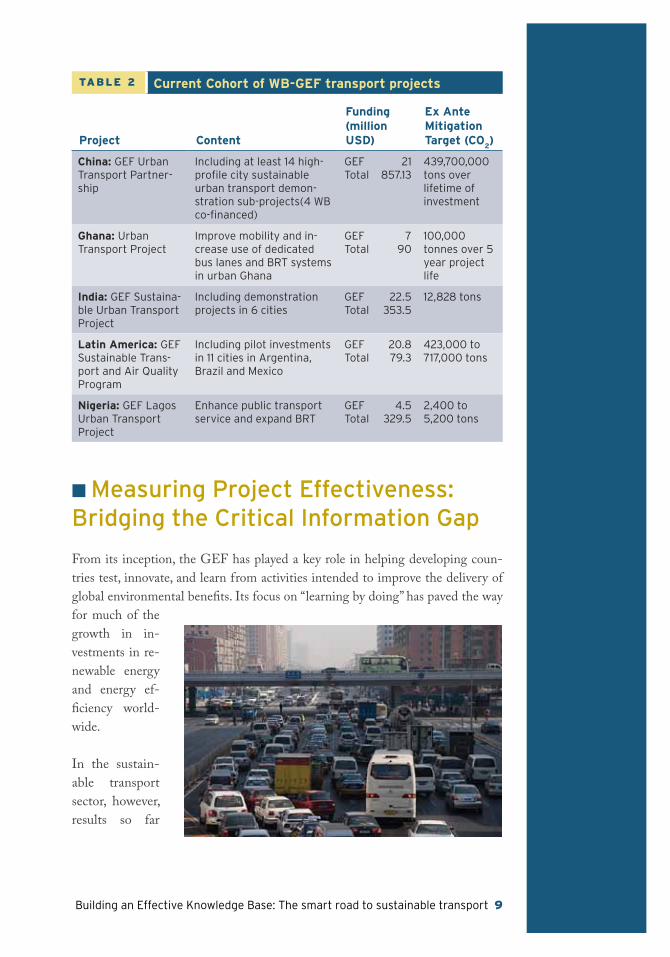
TABle 2 Current Cohort of WB-GEF transport projects
Project Content
Funding(million USD)
Ex Ante Mitigation Target (CO
2)
China: GEF Urban Transport Partner-ship
Including at least 14 high-profile city sustainable urban transport demon-stration sub-projects(4 WB co-financed)
GEF 21Total 857.13
439,700,000 tons over lifetime of investment
Ghana: Urban Transport Project
Improve mobility and in-crease use of dedicated bus lanes and BRT systems in urban Ghana
GEF 7Total 90
100,000 tonnes over 5 year project life
India: GEF Sustaina-ble Urban Transport Project
Including demonstration projects in 6 cities
GEF 22.5Total 353.5
12,828 tons
latin America: GEF Sustainable Trans-port and Air Quality Program
Including pilot investments in 11 cities in Argentina, Brazil and Mexico
GEF 20.8Total 79.3
423,000 to 717,000 tons
Nigeria: GEF Lagos Urban Transport Project
Enhance public transport service and expand BRT
GEF 4.5Total 329.5
2,400 to 5,200 tons

10 Building an Effective Knowledge Base: The smart road to sustainable transport
have neither confirmed nor contradicted the assumptions embodied in OP11 about what actions will lead to good transport systems that improve mobility and at the same time reduce GHG emissions, or at least reduce their rate of growth.
They have, however, highlighted the need to adopt a more methodical approach to measuring results, and a more systematic means for sharing knowledge and data. Low-carbon sustainable transport development is feasible only when relevant stakeholders have the information and knowledge that they need to evaluate the impacts of different policy options.
In developing countries, the information they need often cannot be easily ob-tained. Because local level transport data is usually generated on an ad-hoc basis, it is frequently incomplete or insufficient for following projects. Aggregating local level information to national and regional levels often compounds these incon-sistencies. Although people’s travel preferences vary widely from city to city, trip-based data is usually available only on a very limited basis, is often outdated and almost never is available as a time-series (IEA, 2009).
Because project developers usually have difficulty justifying the expense and effort involved in generating information beyond that which is strictly essential for their immediate project implementation requirements, little knowledge is disseminated for the benefit of other projects.
This is one of the main reasons why transport is largely missing in climate change mitigation policies and actions worldwide despite being one of the largest, and fastest growing, sources of GHG emissions. This situation has been identified by over 40 organizations;1 it was further confirmed in a range of presentations at the December 2009 UN Framework Convention on Climate Change (UNFCCC) 15th Conference of the Parties meeting.
GEF funding has been shown to have the biggest impact when it helps create an enabling environment that reduces the risk to local decision makers of promoting those innovative and transformational choices that favor long-term sustainable low-carbon outcomes. GEF support and funding are particularly advantageous in bridging this information gap through:
◆ Knowledge creation and sharing: GEF is ideally positioned to promote de-velopment of knowledge useful to others for subsequent projects; this may
1 See the SloCaT partnership at www.slocat.net
Building an Effective Knowledge Base: The smart road to sustainable transport 11
initially require greater effort at the project level but creates needed synergy between projects.
◆ Facilitation of lessons learned in other projects: Once a project has been fully implemented, funding is rarely assigned to conduct an ex-post evaluation of the outcomes, but this analysis is critical to scaling up knowledge.
◆ Sharing practical examples of best practices through GEF Agencies and beyond: Helping local developers learn from best practices in other cities is important for project implementation. Sharing successful, innovative, and transformational projects with decision-makers can help them decide to im-plement low carbon development pathways for their cities and helps reduce their perceived risk of doing so.
◆ Building on convening power: For many cities and projects, becoming part of GEF’s sustainable transport portfolio is a rallying-flag that gets stakehold-ers on board. The political importance of this leadership cannot be underes-timated.
■■ Defining an Effective Methodology for Measuring Sustainable Transport Effectiveness
Since the first cohort of projects was approved, GEF has required that GHG avoid-ance be used as a standard target and indicator across the entire climate change mitigation portfolio. However, the only methodology that has been agreed upon by GEF has been for renewable energy, energy efficiency, and advanced energy tech-nology projects. Transport projects have been proposed and approved with some form of GHG reduction esti-mate, but the methodologies used for these ex ante estimations remain incon-sistent.
The World Bank has com-mitted itself to ensure com-parability and
12 Building an Effective Knowledge Base: The smart road to sustainable transport
consistency from this and future cohorts of sustainable transport projects. To do so, it has begun to work with the GEF Secretariat, Scientific and Technical Ad-visory Panel (STAP) and other agencies to develop a consistent methodology for both ex ante and ex post estimation of GHG emission reductions.
To this end, the GEF Secretariat and the STAP organized a workshop at the Asian Development Bank (ADB) headquarters in Manila in October 2009, to move toward development of a consistent methodology for assessment of GHG benefits from urban transport interventions sponsored by GEF. The World Bank and the ADB worked together with STAP’s experts to propose a new approach to evaluating GHG emissions from GEF transport projects. This proposal involves using a simplified methodology for undertaking ex ante GHG reduction estimates at the beginning of a project. But at the same time, it requires the use of a more complex methodology to evaluate emissions from the project activities under im-plementation. This more complex ex post evaluation methodology is similar to that used worldwide in mobile source emissions inventory work to evaluate transport sector emissions between a project case and those of a dynamic baseline scenario.
The proposed methodology will employ an activity-based measurement protocol that uses low-cost global positioning systems (GPS) together with vehicle counts to define the initial, ex ante baseline travel data. Project proponents must then as-sume an obligation to measure ex-post travel activity patterns using a similar proto-col on at least two occasions after completion of the project. These measurements would allow the true GHG mitigation from the project to be evaluated. This data is essential to: refine the initial default values for use in later projects; evaluate and report the emissions reductions resultant from this project; and re-evaluate the ex-ante assumptions used and the uncertainty associated with the initial estimation.
More broadly, the contribution of knowledge and information about what has worked from this program of similar projects in 30 medium-size developing country cities will be invaluable in determining what works (and what does not) in reducing GHG emissions in the urban transport sector worldwide.
■■ Building a Sustainable Transport Toolkit
To support this approach, the Bank is working with its second cohort of GEF projects to develop a practical toolkit (Annex 1) to facilitate collection and re-porting of vehicle population and activity data in a standardized and consistent
Building an Effective Knowledge Base: The smart road to sustainable transport 13
2 The partner organizations are: Asian Development Bank (ADB), Clean Air Initiative for Asian Cities (CAI-Asia) Center, Clean Air Initiative for Latin American Cities (CAI-LAC), German Agency for Technical Cooperation (GTZ), Global Air Pollution Forum (GAPF), United States Agency for International Development (USAID) and the World Bank.
manner. As twenty-nine of the cities included in this second cohort of projects are medium-sized cities, the tool-kit and experiences are expected to provide tre-mendous insight and learning for the management of these cities of less than 10 million inhabitants. The toolkit will help project practitioners:
◆ Improve the quality and consistency of data used to evaluate impacts of spe-cific interventions
◆ Proportion a unified framework to facilitate cross-country and region assessment ◆ Involve different experts and institutions in data collection and modelling ac-
tivities
The outcomes of these activities are being combined with the Bank’s recently formed Development Grant Facility (DGF) knowledge management partnership2
to provide project developers and decision makers in Asia (and in a second phase, Latin America) with credible air quality and climate change data and in-formation for energy and transport sectors, and highlighting the co-benefits of jointly addressing both. With these activities, the Bank faces a unique opportu-nity to use GEF resources to contribute to global knowledge and understanding about what works in sustainable transport.
■■ Conclusion: Toward Sustainable Mobility
The global transport sector currently generates nearly one-quarter of energy-re-lated CO2 emissions and is the sector most closely linked to fossil fuel consump-tion. Worldwide transport energy use has risen steadily—closely paralleling the increase in the world’s economic activity—and under a business as usual scenario will grow much faster in many developing countries. A paradigm shift is needed in this historic trend for the world to successfully face its climate change challenges. However, transport is the sector that has least benefited from global assistance in towards achieving this emission mitigation.
The biggest development challenge in shaping a future involving sustainable pas-senger and freight transport will be to provide the knowledge, assistance, and

14 Building an Effective Knowledge Base: The smart road to sustainable transport
incentives that are needed by local stakeholders for them to implement infrastructure deci-sions in the short-term that lead to sustainability in the long-term.
The lack of a con-sistent methodol-ogy for measuring
the impacts of transport projects has become a serious hindrance to the world’s needs to reduce the trajectory of GHG emissions from the transport sector. The GEF’s commitment to “learning by doing” is playing an important role in help-ing resolve this problem. Several of the first cohort of GEF-approved transport projects have demonstrated impressive results. But the challenge lies in working to ensure that the much larger second and subsequent third cohort of projects provide a more systematic basis for learning by doing as a way to achieve even greater results.
The Bank has worked closely with the GEF Secretariat, STAP and ADB to de-velop and adopt a methodology that overcomes this impasse both in terms of ex ante (proposal stage) estimates and ex post (results stage) assessments. The Bank is especially committed to following through on the application of this consist-ent methodology in its current cohort of projects of over 30 medium size cities in developing countries.
These tools and experiences are expected to provide tremendous insight and learn-ing on what works to improve mobility and reduce GHG emissions through these GEF-sponsored projects in those cities that are undergoing unprecedented urban growth. In a world with such rapidly changing parameters, investing in knowledge and learning about how the challenges in the transport sector can be met is the shrewdest long-term investment that GEF can continue to make.
Building an Effective Knowledge Base: The smart road to sustainable transport 15
■■ References
Chamon, M., P. Mauro, and Y. Okawa. 2008. “Cars: Mass Car Ownership in the Emerging Market Giants.” Economic Policy 23 (54): 243–96.
Dodman, D. 2009. “Blaming Cities for Climate Change? An Analysis of Urban Greenhouse Gas Emissions Inventories.” Environment and Urbanization 21 (1): 185–201
IEA, 2009. Transport, Energy and CO2: Moving Toward Sustainability, Interna-tional Energy Agency 2009
INE, 2007. Mexico. Mexico’s third national communication to the United Nations Framework Convention on Climate Change., Instituto Nacional de Ecología and Secretaría de Medio Ambiente y Recursos Naturales, Mexico City
Johnson, Todd M; C. Alatorre; Z. Romo; and F. Liu. 2009. Low Carbon Develop-ment for Mexico. Washington DC: World Bank.
Kenworthy, J. 2003. “Transport Energy Use and Greenhouse Gases in Urban Pas-senger Transport Systems: A Study of 84 Global Cities.” Paper presented at the third International Conference of the Regional Government Network for Sus-tainable Development, Fremantle, Australia.
Lam, W. H. K., and M.-L. Tam. 2002. “Reliability of Territory-Wide Car Own-ership Estimates in Hong Kong.” Journal of Transport Geography 10 (1): 51–60).
McKinsey Global Institute. 2009. “Promoting Energy Efficiency in the Develop-ing World.” Washington DC: World Bank.
Schipper, L. 2007. Automobile Fuel, Economy and CO2 Emissions in Industrialized Countries: Troubling Trends through 2005/6. Washington, DC: EMBARQ, the World Resources Institute Center for Sustainable Transport.
Schipper, L., E. Deakin, C. McAndrews, L. Scholl, K. Trapenberg Frick, 2009. Considering Climate Change in Latin American and Caribbean Urban Transporta-tion: Concepts, Applications, and Cases, Center for Global Metropolitan Studies University of California, Berkeley
United Nations. 2007. State of the World Population 2007: Unleashing the Po-tential of Urban Growth. New York: United Nations Population Fund (UNFPA).

16 Building an Effective Knowledge Base: The smart road to sustainable transport
World Bank. 2006. “Promoting Global Environmental Priorities in the Urban Transport Sector: Experience from World Bank Group—Global Environment Facility Projects”. Washington DC: World Bank Global Environment Facility Program.
World Bank 2007. Transport and Climate: Lessons from the Partnership between Mexico City and the World Bank. Latin America and Caribbean Region Sustain-able Development Working Paper 29 Washington, DC: World Bank.
World Bank 2008. World Development Report 2009: Reshaping Economic Ge-ography. Washington, DC: World Bank.
World Bank 2009a. “Meeting East Asia’s Growing Energy Needs in a Sustainable Manner” Washington, DC: East Asia and Pacific Region
World Bank 2009b. “India: Options for Low-Carbon Development.” Washing-ton, DC: South Asia Region
World Bank 2009c. “World Bank Urban Strategy.” Washington, DC.
World Bank 2010. World Development Report 2010 Development and Climate Change, The World Bank, Washington, DC.
Building an Effective Knowledge Base: The smart road to sustainable transport 17
Annex 1
■■ Building a Transport Activity Measurement Toolkit
The toolkit will offer a practical and simplified means to collect and report ve-hicle population and activity data in a standardized and consistent manner. It is designed to be easy to use for project staff, city personnel and other stakeholders to assess fuel efficiency, greenhouse gas (GHG) and air pollutant emissions, based on vehicle characteristics and measured activity. It will use modern tools, such as low cost global positioning system (GPS) loggers to generate precise data with a minimum of effort. The toolkit will be formed of the following modules.
Practitioners guide
The practitioners guide will describe:
◆ Selection of the accounting framework (model): Options include the World Bank ESMAP/WBI and IVEM models. The document structure must facili-tate others being added at a later stage
◆ How to determine an adequate sampling size according to the selected model and size of city/region and/or area of intervention (such as a BRT corridor)
◆ The sampling and measurement process: methodology, equipment, person-nel, costs, management, logistics, and quality control and assurance (QA/QC) processes and safeguards
◆ Criteria for choosing the appropriate locations and times to carry out the measurements
◆ Process and criteria for assigning road category or hierarchy to road segments (arcs)
Data collection documentation
An Excel-based application to generate the data collection documents needed us-ing a standardized format, in the local language, and providing guidance on their use. Initially this will be developed in English, Spanish, and Portuguese and will provide a structure for adding other languages. On selecting the desired language, the application will print all the necessary data collection documents and support-ing instructions to field personnel in that language.
18 Building an Effective Knowledge Base: The smart road to sustainable transport
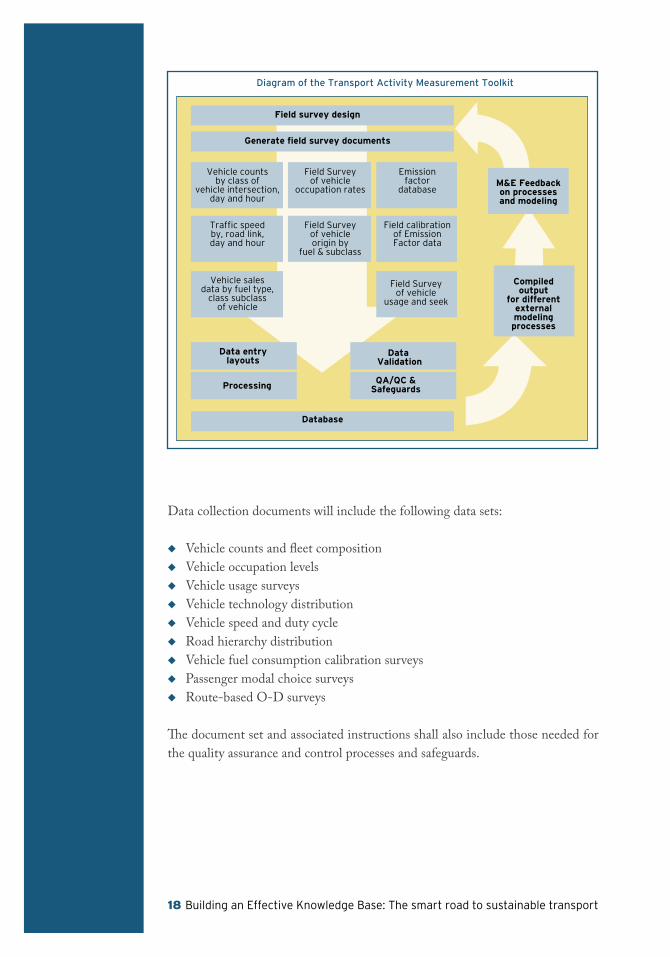
Data collection documents will include the following data sets:
◆ Vehicle counts and fleet composition ◆ Vehicle occupation levels ◆ Vehicle usage surveys ◆ Vehicle technology distribution ◆ Vehicle speed and duty cycle ◆ Road hierarchy distribution ◆ Vehicle fuel consumption calibration surveys ◆ Passenger modal choice surveys ◆ Route-based O-D surveys
The document set and associated instructions shall also include those needed for the quality assurance and control processes and safeguards.
Diagram of the Transport Activity Measurement Toolkit
Field survey design
M&E Feedbackon processesand modeling
Compiledoutput
for differentexternalmodelingprocesses
Data entrylayouts
Data Validation
ProcessingQA/QC &
Safeguards
Database
Generate field survey documents
Vehicle countsby class of
vehicle intersection,day and hour
Traffic speedby, road link,day and hour
Vehicle salesdata by fuel type,
class subclassof vehicle
Field Surveyof vehicle
occupation rates
Field Surveyof vehicleorigin by
fuel & subclass
Emissionfactor
database
Field calibrationof EmissionFactor data
Field Surveyof vehicle
usage and seek
Building an Effective Knowledge Base: The smart road to sustainable transport 19
Road hierarchy assignment
An open source and freely distributable application that:
◆ Facilitates assigning road category or hierarchy to up to 10 types of road seg-ments (arcs) within the study area. This application needs to work using Goog-le Earth and/or Openstreetmap.com
◆ Is able to automatically read all valid GPS data collected and to assign the road category or hierarchy that corresponds to each segment of road (arcs)
◆ Adds all valid GPS data collected together with the assigned the road category or hierarchy to a relational database for further analysis
Database
An open source and freely distributable relational database to house and validate the collected activity data. This database will be designed to:
◆ Facilitate data entry from the field survey documents ◆ Eliminate errors among data using verification filters ◆ Provide QA/QC validation and traceability ◆ Convert data as necessary to ensure consistency between the different data sets
and interpolate missing data ◆ Generate output files that can be used as input to the included emissions mod-
els (initially ESMAP/WBI, IVEM) ◆ Generate relational database output files that facilitate combining (replicating)
all the collected data into a common depositary
Front end
A front end that facilitates access to, and use of, the different modules when all are assembled on a CD for delivery to the local institution (such as a university) or company that is tasked with performing the selected measurements. The front end will supply information to the user on:
◆ The contents of the CD ◆ How to access/install the different modules for their use ◆ Where to find additional information ◆ Steps involved in the process

Building an Effective Knowledge Base
The smart road to sustainable transport
April 2010 n
World Bank GEF Operations
World Bank GEF Coordination Team
Environment Department
The World Bank
1818 H Street, NW
Washington, D.C. 20433, USA
Telephone: 202.473.1816
Email: [email protected]
Web: www.worldbank.org/GEF
THE WORLD BANK