building a sustainability index for highway ... · [email protected], [email protected],...
TRANSCRIPT

JBU III (2013) 1&2 · 125
___________________________________________________________________________
© 2013 Journal of Biourbanism
Building a sustainability index for highway infrastructures:
case study of flexible pavements
Stella O. OBAZEE-IGBINEDION, Manoj K. JHA, Oludare OWOLABI Center for Advanced Transportation and Infrastructure Engineering Research
Department of Civil Engineering Morgan State University, USA
[email protected], [email protected], [email protected] ABSTRACT The road network system consists of highway infrastructures which need to be maintained periodically – due to deterioration – in order to increase the life span of the system and provide riding comfort to the travelling public. Factors that cause pavements to deteriorate are accumulated traffic axle loads, environmental conditions, climate, etc. Deterioration creates conditions that undermine the performance of pavements. A literature review indicates that analytical methods have been developed to design different components of pavement performances due to pavement conditions and sustainability. These models were mostly based on definitions, operation, structural and functional research oriented analysis and they have contributed substantially to the society. However, the integration or correlations of sustainability indices with pavement condition indices were not fully explored. To fully understand and develop the proposed model, the triple sustainability dimensions (environmental, economic and social) which plays a major role in planning for both construction and maintenance of pavements is discussed. A multi-linear regression analysis (MLRA) is proposed to calculate the sustainability index. The following four possible characteristics of pavement performance indices for flexible pavements are considered (as independent variables) and analyzed for each section of pavement under consideration: (1) roughness, (2) surface distress, (3) skid resistance index, and (4) structural deflection. A numerical example using field investigation data is performed to illustrate the developed approach. Keywords: Flexible Pavements; Sustainability Index; Pavement Condition indices; Multi-Linear Regression Analysis (MLRA) Model; Pavement Performance Evaluation.

JBU III (2013) 1&2 · 126
___________________________________________________________________________
© 2013 Journal of Biourbanism
INTRODUCTION This paper explores the problem with building a sustainability index for highway infrastructures by using flexible pavements as a case study. For the past couple of decades, there have been global concerns regarding climate change, energy usage, environmental impacts, and the financial limitation as they affect highway transportation infrastructures, both in developed and developing countries. Engineers and policy makers have been looking into different ways to plan, design, construct, operate, and maintain pavements so to sustain these highway infrastructures. Pavement infrastructures are considered vital and important in safely transporting people and goods from one point to another, which makes it one of the fundamental components of any transportation system both in the United States of America and the world in general. Although many researchers have undertaken various aspects of pavement research, such as pavement evaluation, maintenance, pavement management systems, to name a few, very little research has been carried out on pavement serviceability and sustainability. The aim of this paper is to illustrate some major transportation sustainability indicators (such as, environmental, social and economic impacts) and correlate them to pavement performance/evaluation indices (such as serviceability, structural capacity, skid resistance and pavement surface distress). The paper addresses the problem of sustainability in the context of pavement performance (pavement conditions) in a statistical multi-linear regression analysis framework. The facility is divided into shorter manageable sections and each section is analyzed and correlated in order to obtain a correlation index. The motivation behind this paper therefore is to develop a comprehensive model that determines the relationship between pavement conditions (indices) and sustainability indices - known as the universally accepted “triple bottom line” or (“Three Pillars”) of sustainability (WCED, 1987). Prior to maintaining any highway infrastructure, such as pavements and bridges, the preferred mode of maintenance is selected based on the need and availability of funds for the project. The next deciding issue is whether to maintain or fix the problem of the highway infrastructure or do-nothing. The planning and maintenance strategies depend largely on the type of highway infrastructure to be maintained or rehabilitated. Another important issue to be considered is to carefully assess the environmental, economic, and social impacts – such as: types of material used (not within the scope of this paper), environmental pollution, and traffic congestions. In the past two decades transportation industry has shown increasing interest in the concept of sustainability due to the phenomena of climate change, accidents, resource depletion, increased degradation of quality of the life of pavements and bridges; and inequity of access. This paper intends to develop a statistical multi-linear regression analysis model (MLRA) that would determine these indices and help support pavement managers/engineers to make rational decisions to enhance pavement performance and sustain the infrastructure. The goal here is to provide a mathematical tool that would enable agencies meet the basic needs and improve the quality of life of pavements; while the natural resources they depend on are maintained and enhanced for their benefits and the future generations without compromising safety, health and efficiency.

JBU III (2013) 1&2 · 127
___________________________________________________________________________
© 2013 Journal of Biourbanism
LITERATURE REVIEW The literature review discusses past related research works pertaining to pavement conditions, transportation sustainability, maintenance strategies, and pavement maintenance optimization models. It also provides detailed perception on past researches that relate to pavement conditions and sustainability models. The purpose of literature review is to establish the originality of this paper in order to obtain useful background information concerning the research topic. Although there have been a lot of research works on pavement facility maintenance optimization and pavement sustainability, very few researches have been done on maintenance optimization in the context of pavement (condition) performance indices and sustainability indices; i.e., determining how sustainability indices depend on pavement conditions. The literature search provides several reports as reference materials on this research work. These reports, relevant to the research topic were reviewed to determine how pavement conditions correlate with the “three-pillar” sustainability dimensions (environmental, social, and economic) (see Figure 1), such as environmental pollutions, congestion, travel time, noise, water pollution, to mention a few. Also, research articles were reviewed to understand how rapid axle loads on pavements can quickly reduce the life span of a pavement (pavement distresses), which ultimately affects the user’s comfort when pavements become distressed. Pavement conditions directly influence the cost of operating the vehicles, such as fuel consumption, accidents – termed as “user and social costs”. Accident is outside the scope of this research.
Figure 1. Modified “Three Pillars” of Sustainability Model

JBU III (2013) 1&2 · 128
___________________________________________________________________________
© 2013 Journal of Biourbanism
Definition and history of sustainability The word “sustainability” is often used in terms of public policy. In this paper, the definition is directed towards transportation infrastructures, such as pavement management. Sustainability is defined as the process to continuously maintain and meet the needs of the present without compromising the ability of future generations to meet their own needs (WCED, 1987). According to Federal Highway Administration (FHWA), sustainability in transportation perspective is defined as “providing exceptional mobility and access in a manner that meets development needs without compromising the quality of life of future generations. A sustainable transportation system should be safe, affordable, and renewable, operates at a fair level, emits emissions at reduced level, is healthy to the society, and uses new and non-renewable resources” (FWHA, 2008). The development of sustainability started about twenty years ago between 1972 and 1992 during various international conferences. The first meeting was held during one of the UN conferences on Human Environment in Stockholm in 1972. Sustainability on a world scale was the major issue of discussion, which generated a momentum that created series of recommendations. Highway infrastructure deteriorates over time, primarily due to traffic demand (axle loads), environmental conditions, and other factors. Transportation infrastructure system needs to be maintained periodically in order to increase the life span of the facility. Pavement is one of the most valuable components in transportation infrastructure system, and it is therefore very important to keep these facilities in good condition by carrying out periodic maintenance. In order to effectively meet this obligation, an efficient pavement management system (PMS) is considered. PMS is a tool that provides a technical and economic approach to assessing problems associated with pavement conditions. Various components of a road network system are analyzed and quantified in order to achieve total or partial optimization of pavement performance over certain period of time. (Mayer, 2007) developed a framework that determines the strengths and weaknesses of common sustainability indices for multidimensional systems. The author emphasized the importance of sustainability indices in a system and grouped them by an aggregation method. (Barrera-Roldan et. al, 2003) designed a methodology for obtaining Industrial Sustainability Index (ISI) in the context of the sustainable development philosophy and to identify the issues that have to be addressed in order to bring the industry closer to a sustainable performance. The authors used the multi-attribute decision theory to develop their methodology as the ISI main structure which could be used with variances in other industries. Another paper authored by Ortiz-Gallarza et. al, (2003) discussed the selection of environmental parameters to estimate an industrial sustainability index. The paper included a methodological proposal to select and validate statistically, natural system or environmental parameters with other economic and social values in order to construct an interdisciplinary sustainability index in the petroleum refinery industry. Moretti et. al (2012) developed an economic sustainability of concrete pavements using a computer program to analyze structural, functional, and financial characteristics of joint plain concrete pavements (JPCP).

JBU III (2013) 1&2 · 129
___________________________________________________________________________
© 2013 Journal of Biourbanism
Pavement performance evaluation This section discusses the concept of serviceability and its importance. There are four major characteristics of evaluating pavement conditions: (1) roughness, i.e., the comfort of ride- ability; (2) pavement distress, i.e., surface condition; (3) pavement deflection, i.e., structural failure; and (4) skid resistance, i.e., safety. Each of these characteristics is imbedded in the triple bottom-line factors of sustainability, examined and explained briefly in subsequent sections. Pavement roughness is the irregularities of the pavement surface which makes the smoothness of the surface to be either comfortable or uncomfortable to the rider. Present Serviceability Rating (PSR) and Present Serviceability Index (PSI) were first introduced in the AASHTO Road Test to qualitatively and quantitatively rate the quality of ride-ability of pavements. The PSR is a grade number in a pavement section to rate the ability of the section to serve the designed traffic loads. Its rating scale is from 0-5; where 0 signifies very poor and the number 5 signifies “very good” (Papagiannakis, A. T. and Masad, E.A., 2007). The PSI is a surrogate of PSR which is based on physical measurements and not based on panel ratings. Another closely related performance indicator is Pavement Condition Index (PCI) which was developed by U.S. Army Corp of Engineers to rate pavement condition. The PCI can be obtained through pavement serviceability evaluation panels (group of evaluators) which provide information concerning pavement conditions. PCI rates and evaluates the condition of a road network on annual basis; it provides numerical rating of a road segment within the network or project level. Its numerical rating is between 0-100; where 0 is the worst condition and 100 is the best condition as illustrated in Figure 3. The PCI is normally conducted annually in order to evaluate changes that occur in a road network system. It is a subjective method of evaluation based on inspection and observation. The PCI is also an informative tool that shows the current condition of the road network and its deterioration over time as illustrated in Figure 2.
Figure 2. Pavement condition vs. Age (source: Pavement Interactive (2013) http://www.pavementinteractive.org (accessed October 25, 2013).

JBU III (2013) 1&2 · 130
___________________________________________________________________________
© 2013 Journal of Biourbanism
Some uses and benefits of PCI include, identifying the need for immediate maintenance and rehabilitation (M & R) (Galehouse et. Al. 2003) of roads; developing a road network preventive maintenance strategies and budgets; and for evaluating pavement materials and designs (see Figure 3).
Figure 3. Benefits of M & R as a function of pavement condition (PCI) (source: Galehouse et. al. 2003).
In order to develop an effective PCI, the road network should be divided into manageable segments or sections; sections with relatively uniform pavement structures, design and traffic volumes will have similar performance characteristics. For instance, a road network in urban settings should be kept in manageable length (shorter lengths for roads with severe deteriorated conditions) due to high volume of traffic activities. Whilst in the case of rural settings, the road network can be kept in manageable longer lengths due to lighter volume of traffic. The road section under consideration will be identified (using field survey data) based on the following basic history:
Road class (freeway or arterial); Length, width, and geometry of the roadway; Type and volume of traffic along the roadway; Initial construction date; Maintenance history; Current PCI conditions and their relationship to past PCI conditions.
The condition of a pavement provides information through the PMS, when it has some defects, such as: (1) surface defects: ravelling, flushing; (2) surface deformation: rippling & shoving, wheel track rutting, distortion; (3) cracking: longitudinal, centerline, pavement edge, and transverse defects.

JBU III (2013) 1&2 · 131
___________________________________________________________________________
© 2013 Journal of Biourbanism
Pavement condition states are used to measure pavement performance in terms of discrete condition levels as stated above. These condition states help to provide information as to how the pavement would perform under each category in order to develop pavement serviceability indices, such as International Roughness Index (IRI), Present Serviceability Index (PSI), Pavement Serviceability Rating (PSR), Structural Capacity Index (SCI), Functional Index (FI), Ride-ability Index (RI), etc. Pavement Serviceability (PS) was initiated by American Association of State Highway Official (AASHO) Road Test. In the proposed research, some of the relevant pavement indices (e.g., IRI, PSR, SRI (skid resistance index), SDI (surface distress index), and DI (deflection index)) will be discussed including Life-cycle cost analysis (LCCA) (FHWA 1998). Pavement serviceability This section discusses individual Present Serviceability Rating, Present Serviceability Rating (PSR), Present Serviceability Index (PSI), and the Performance Index (PI). These terms are defined to correlate the subjective rating of pavement performance with objective measurements. Pavement serviceability is defined as the ability of the pavement to carry the accumulated traffic axle load it is designed to serve under the existing pavement condition. There are two major methods for determining pavement serviceability; the Present Serviceability Index (PSI) and the International Roughness Index (IRI). Present Serviceability Index (PSI) is the ability for a particular pavement section to serve the traffic (with different traffic mix, high volume of traffic, and high speed) under current pavement condition. PSI method was developed by AASHO Road Test (Carey and Irick, 1960). The PSI is mostly based on both pavement distress condition and roughness, such as patching, cracking and rutting (in flexible pavements). IRI is the ability of a road section to serve vehicular traffic due to axle loads imposed on that particular section of the road under its current condition. PSR is defined as the rating of a pavement under its current conditions as illustrated in Figure 4.
Figure 4. Pavement Serviceability Evaluation Form (Papagiannakis and Masad, 2007).

JBU III (2013) 1&2 · 132
___________________________________________________________________________
© 2013 Journal of Biourbanism
The PSI is a combination of mathematical formulation that is obtained from measuring pavement sections used to predict the PSR. The PSI for both flexible and rigid pavements was developed based on an AASHO Road Test (Jayawickrama et al, 1998). For the purpose of this paper, the PSR, PSI and IRI are estimated using the FHWA guidelines, respectively (see Figures 4, 5, and Table 1); while the PCI data was obtained from field survey inspection.
Figure 5. Concept of Pavement Performance using PSI (Source: Hveem and Carmany, 1948).
Condition Category IRI Threshold
(in/mile) Good <95 Fair 95 170 IRI Poor >170
Table 1: IRI Thresholds (FHWA, 2008).
The following equations are also used to determine the PSI for flexible and rigid pavements, respectively: PSI = 5.03 – 1.9 Log (1+SV) – 0.01√C+P -1.38RD² (1) PSI = 5.41–1.80 log (1+SV) – 0.09√C+P (2)

JBU III (2013) 1&2 · 133
___________________________________________________________________________
© 2013 Journal of Biourbanism
where: SV = Slope variance (rad²), P = bitumen patching in ft²/1000ft² RD = average rut depth in inches, C+P = the relative extent of cracking and patching in the wheel-path (ft²/1000ft²) Correlations between PSR and IRI Two important correlations were reported by Paterson (1986) and Al-Omari and Darter (1992), which are expressed as:
(3)
(4) where: PSR = present serviceability rating IRI = international roughness index The smoother the riding pavement surface, the higher the value of PSR. The PSR is a subjective measure of ride quality based on individual observation of pavement conditions; while the IRI is based on the Average Rectified Slope (ARS) – a filtered ratio of a standard vehicle’s accumulated suspension motion (measured in millimeters, inches, etc.) divided by the distance travelled by the vehicle (Papagiannakis and Masad, 2007). For the purpose of this paper, IRI data are estimated based on field survey performed on a 3.5 mile arterial roadway pavement condition. These data are estimated using the FHWA IRI thresholds (see, Table 1). IRI can also be calculated using Equation (5) below: IRI = ARS*1000 (5) Skid Resistance (SR) Skid resistance is a vital part or component of pavement performance evaluation. It is the force that develops when the tires are prevented from rotating on pavement surfaces (Hveem, 1948). It can cause skid related incidents or accidents if inadequately designed. Pavement skid resistance depends on four factors: the texture of the pavement surface, the tread of a tire, the presence of water at the interface between the two, and the amount of slippage between them (Papagiannakis and Masad, 2007). It is the responsibility of the agency to provide road users reasonably safe pavement surface for good ride quality depending on the materials and construction quality, such as microtexture (small-scale texture of pavement aggregate that is in contact between the rubber tires and the pavement surface) and macrotexture (the large-scale texture of the pavement aggregate that controls the escape of water from the rubber tires which may cause loss of SR if the speed is increased) (Corley-Lay, 1998). SR of a pavement increases in the first 2-3 years of the initial construction and decreases over the remaining years of the pavement due to wear of the pavement surface either by traffic or loose
JBU III (2013) 1&2 · 134
___________________________________________________________________________
© 2013 Journal of Biourbanism
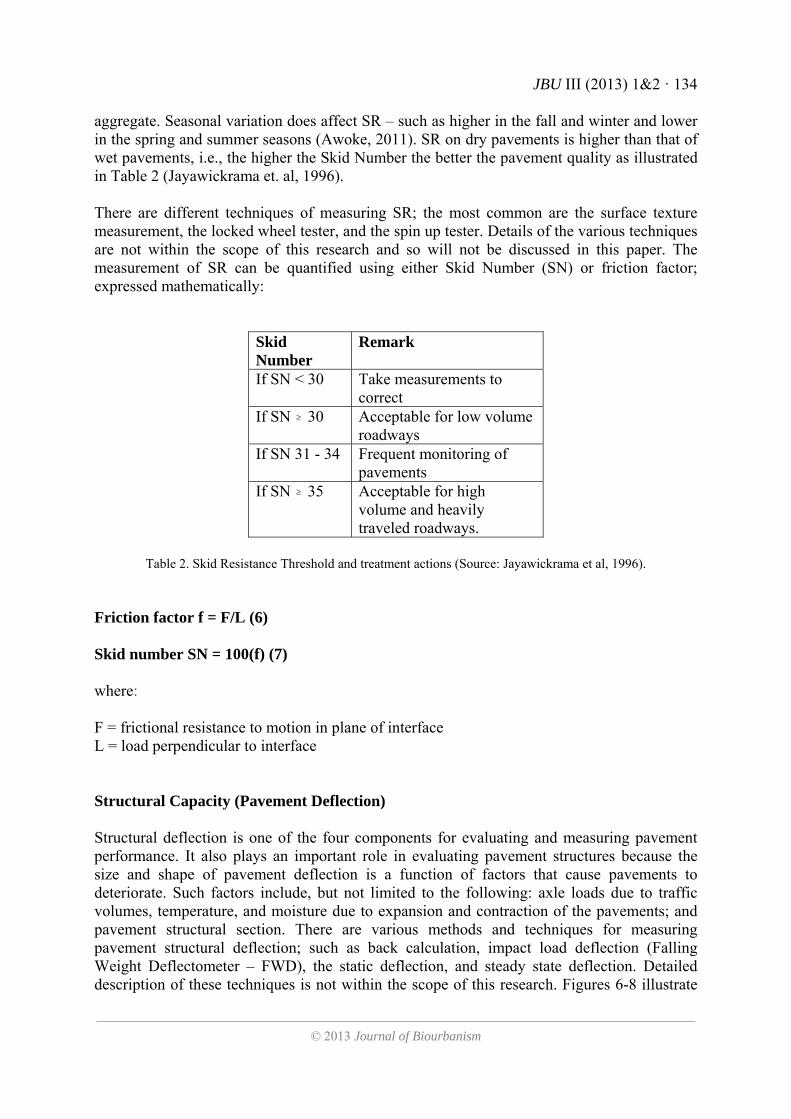
aggregate. Seasonal variation does affect SR – such as higher in the fall and winter and lower in the spring and summer seasons (Awoke, 2011). SR on dry pavements is higher than that of wet pavements, i.e., the higher the Skid Number the better the pavement quality as illustrated in Table 2 (Jayawickrama et. al, 1996). There are different techniques of measuring SR; the most common are the surface texture measurement, the locked wheel tester, and the spin up tester. Details of the various techniques are not within the scope of this research and so will not be discussed in this paper. The measurement of SR can be quantified using either Skid Number (SN) or friction factor; expressed mathematically:
Skid Number
Remark
If SN < 30 Take measurements to correct
If SN 30 Acceptable for low volume roadways
If SN 31 - 34 Frequent monitoring of pavements
If SN 35 Acceptable for high volume and heavily traveled roadways.
Table 2. Skid Resistance Threshold and treatment actions (Source: Jayawickrama et al, 1996).
Friction factor f = F/L (6) Skid number SN = 100(f) (7) where: F = frictional resistance to motion in plane of interface L = load perpendicular to interface Structural Capacity (Pavement Deflection) Structural deflection is one of the four components for evaluating and measuring pavement performance. It also plays an important role in evaluating pavement structures because the size and shape of pavement deflection is a function of factors that cause pavements to deteriorate. Such factors include, but not limited to the following: axle loads due to traffic volumes, temperature, and moisture due to expansion and contraction of the pavements; and pavement structural section. There are various methods and techniques for measuring pavement structural deflection; such as back calculation, impact load deflection (Falling Weight Deflectometer – FWD), the static deflection, and steady state deflection. Detailed description of these techniques is not within the scope of this research. Figures 6-8 illustrate

JBU III (2013) 1&2 · 135
___________________________________________________________________________
© 2013 Journal of Biourbanism
how deflection is measured in flexible pavements when a force is applied. For instance, when a truck drives along a pavement section on a roadway, the set of tires are the weights (i.e., empty) applied to the pavement surface and the load is transferred to the subgrade; which causes the pavement structure to deflect. This deflection is known as deflection basin as illustrated in Figures. 7 and 8. But, in the case of static or stationary load, the force is applied repeatedly using a cyclic load and the deflection basin is measured in a number of locations as either single or multiple quick impacts.
Figure 6: Deflection Basin collected with falling weight deflectometer (National Association of County Engineers, 1992).
Figure 7. Force applied to pavement surface
Applied Force
Pavement Surface

JBU III (2013) 1&2 · 136
___________________________________________________________________________
© 2013 Journal of Biourbanism
Figure 8. Deflection basin
Surface distress This category of pavement evaluation is the collection of pavement condition data. It is the presence of different types of distresses due to either construction defects, traffic loads, and environmental or climate interaction, such as cracks and surface distortions. Data can be collected manually or by an auto collection processes. Data collected through manual process are recorded on special forms as severity and extent. Three common types of flexible pavements distress are patching, cracking, and rutting (SHRP, 1993). EFFECTS OF PAVEMENT CONDITIONS Pavement condition impacts vehicle speed, safety, and travel time. It can also have various indirect impacts, such as environmental, social, and economic impacts. These indirect impacts are the basis of sustainability in this paper. Majority of these impacts are due to the roughness of the pavement surfaces. Roughness is the irregularities that occur on pavement surfaces due to age, environmental effects, climate, and traffic usage. These irregularities cause discomfort, delay, and increase the likelihood of accidents; as a result it becomes costly for a highway agency to maintain or rehabilitate the road segment with increased pavement roughness. The World Bank classified roughness as one of the main factors in the analysis and trade-offs involving road quality vs. user cost. Roughness is quantified using IRI and PSR; with IRI being the most important index to determine performance.
Past models Past models provide insight to different areas of pavement management system, such as predicting future condition of pavements and estimating the timing of maintenance. It helps provide feedback to the design process, and life-cycle cost analysis (Haas, et. al, 1994). The purpose of developing a modeling framework for pavement management is to identify optimal timing of undertaking maintenance activities in order to maximize the pavement life-cycle. According to Darter (1980), there are four basic measures for developing reliable

JBU III (2013) 1&2 · 137
___________________________________________________________________________
© 2013 Journal of Biourbanism
pavement models. These measures include database from existing pavements, adequate functionality of the model, models that meet the statistical criteria for prediction error, and measures that include all parameters that have relevant effects on pavement performance. There are several existing methods used for assessing and predicting pavement conditions; some of which include: Markov processes, regression analysis, neural networks, fuzzy logic, expert systems, etc. These methods are used for creating index for pavement condition evaluation and future prediction of pavement conditions. REVIEW OF RELEVANT STATISTICAL MODELS In order to understand the data and develop the statistical model, the following factors shall be considered: the method of data collection, determination of sample size “n”, type of regression analysis, analysis of variance, mean square of error (MS E ), confidence level, F-tests & t-tests, etc. The factors to be considered for designing a statistical model are mathematically expressed below:
1. Sample size (n) =
n = ))1(**())1(*(
)1(***22
2
PPXNME
PPNX
(8)
where: n = sample size X 2 = Chi-square for the specified confidence level N = Population size P = Population proportion ME = desired margin of error
2. Confidence Intervals (CI) =
CI = Mean
nZ
(9)
where: CI = confidence interval z = standard normal variants = assumed standard deviation n = sample size

JBU III (2013) 1&2 · 138
___________________________________________________________________________
© 2013 Journal of Biourbanism
3. Standard Error (S e ) =
S e = n
MSE (10)
where,
EMS = mean square error n = sample size
4. The z-score:
iZ = S
XX i (11)
where:
iX = value of data i
X = sample mean S = sample standard deviation METHODOLOGY A multi-linear regression analysis (MLRA) is employed to calculate the sustainability index of a given pavement segment (see flow chart in Figure 9). The categories for pavement performance evaluation considered in the analysis are:
1. Serviceability: IRI PSI PSR
2. Skid resistance – safety 3. Structural capacity (deflection) index, 4. Surface distress index:
Patching, Cracking, and Rutting.
Data collected under this study are classified as ratings (i.e., subjective measures based on opinions of a survey crew consisting of 5 people). The study site is a 3.5 miles section of Muncaster Road in Montgomery County, Maryland divided into 36 sections (500 feet apart) on both eastbound and westbound directions. The subjective judgment of each rating is converted into numerical values on a scale of 0 to 1 (0, being very poor and 1, being very good). It is divided into five subjective categories as illustrated in Table 3.

JBU III (2013) 1&2 · 139
___________________________________________________________________________
© 2013 Journal of Biourbanism
Sustainability Index (SI)
Pavement Performance
Evaluation (PPE)
PS SR SD PSD (PCI)
IRI PSI PSR
SNI SDI
Cracking Patching Rutting
Environmental Sustainability
Indicators
Social Sustainability
Indicators
Economic Sustainability
Indicators
Emissions WaterHealth Accidents
User Delay Costs
Agency Costs
Figure 9: Flow Chart of the Proposed Model
Subjective Category Numerical Value (Sustainability Index- SI)
Pavement Condition Index (PCI)
Very poor 0 – 0.2 0 - 40
Poor 0.2 – 0.4 40 - 55
Fair 0.4 – 0.6 55 - 70
Good 0.6 – 0.8 70 - 85
Very good 0.8 – 1.0 85 - 100
Table 3: Subjective Rating of Muncaster Road.

JBU III (2013) 1&2 · 140
___________________________________________________________________________
© 2013 Journal of Biourbanism
In the MLRA, Sustainability Index (SI) is treated as the dependent variable which is a function of PSI, PSR, and IRI as illustrated in Table 4. The pavement condition survey is conducted on a scale of 0 – 1 for SI; and the MLRA is used to model the relationships between the independent variables (IRI, PSR and PSI) and SI. In general, SI depends on a number of additional factors shown in Eq. (12) and its actual value is calculated using the AASHTO (2001) procedure (see, Table 4).
Subjective Category
Numerical Value (SI)
PCI PSR PSI
Very poor 0.0-2 0-40 0-0.9 0 Poor 0.2-0.4 40-55 1-1.9 1 Fair 0.4-0.6 55-70 2-2.9 2 Good 0.6-0.8 70-85 3-3.9 3 Very good 0.8-1.0 85-100 4-5 4-5
Table 4: Using FHWA Guidelines for rating PCI, PSR, and PSI.
SI = f(IRI, PSI, PSR, SDI, SRI, CI, RI, PI) (12) assuming: SI = y (dependent variable) PCI = nxxxx ,........., 32,1 (independent variables)
expressed as a function,
)( XfY (13) therefore,
).,.........,,( 321 nxxxxfY (14)
,...... 113322110 eXXXXY pp (15)
where: Y= dependent variable,
1,..2,1 pX = independent variables
0 = regression constant (linear regression intercept)
1,..2,1 p = variable constants (slope for linear regression); and
e = random error
JBU III (2013) 1&2 · 141
___________________________________________________________________________
© 2013 Journal of Biourbanism
There are three objectives to consider when developing the MLRA model:
Estimate the unknown parameters ( ) ,
hypothesize the proposed linear model, and Check if the model is good for predicting the dependent variableY .
Model Accuracy Once the developed model is checked for fitness, it is important to determine if the designed model is good for predicting the dependent variable. In order to perform this, a hypothesis test is carried out on all the regression ( - parameters) constants (excluding 0 ), using Eq. (16);
F-test based on the null ( 0H ); and alternative ( )aH hypothesis:
0H : 0...21 k (16)
aH : one of the parameters should differ from zero
therefore, F = model mean square/error mean square,
k
kn
R
RF
1
1 2
2
(17)
rejection region F>F a
where: n = number of observations, k = number of parameters in the model (except 0 ),
2R = multiple coefficient of determination, and a = significance level NUMERICA EXAMPLE We analyze a 3.5 miles two-lane roadway pavement along Muncaster Road in Montgomery County, Maryland, which is divided into 36 sections of 500 feet in a residential community setting. The input data is shown in Table 5. The roadway connects two State maintained roadways used by drivers as cut through to their destinations (see, Figures 10 & 11). The roadway has a configuration of two-lane with pavement markings of double yellow center line and white edge marking. A Geographic Information System (GIS) is used to map out the roadway as shown in Figure 10.

JBU III (2013) 1&2 · 142
___________________________________________________________________________
© 2013 Journal of Biourbanism
Data Point
Pavement Distress
Category
Subjective Category
(PCI) (PSI) (PSR) IRI Sustainability
Index (SI)
1 cracks Fair 55 2.5 2 100 0.5 2 Cracks Fair 55 2.5 2 100 0.5 3 Cracks Good 70 3.5 3 95 0.7 4 Cracks Good 70 3.5 3 95 0.7 5 Patchy Good 70 3.5 3 95 0.7 6 Cracks Good 70 3.5 3 95 0.7 7 Good Very good 85 4.5 4 90 0.9 8 Cracks Very good 85 4.5 4 90 0.9 9 Cracks/Patchy Good 70 3.5 3 95 0.7 10 Cracks Very good 85 4.5 4 90 0.9 11 Cracks Very good 85 4.5 4 90 0.9 12 Cracks Very good 85 4.5 4 90 0.9
13 Cracks Fair
(unacceptable) 50 2 1.5 150 0.4
14 Patchy Fair
(unacceptable) 50 2 1.5 150 0.4
15 Patchy Fair 55 2.5 2 100 0.5 16 Patchy Fair 55 2.5 2 100 0.5 17 Cracks Fair 55 2.5 2 100 0.5 18 Cracks Good 70 3.5 3 95 0.7 19 Cracks Good 70 3.5 3 95 0.7 20 Cracks Fair 55 2.5 2 100 0.5 21 Cracks Fair 55 2.5 2 100 0.5 22 Patchy Fair 55 2.5 2 100 0.5 23 Cracks Good 70 3.5 3 95 0.7 24 Cracks Good 70 3.5 3 95 0.7 25 Cracks Very good 85 4.5 4 90 0.9 26 Cracks Good 70 3.5 3 100 0.7 27 Cracks Very good 85 4.5 4 90 0.9 28 Patchy Good 70 3.5 3 100 0.7 29 Cracks Very good 85 4.5 4 90 0.9 30 Cracks Good 70 3.5 3 95 0.7 31 Patchy Fair 55 2.5 2 100 0.5 32 Patchy Fair 55 2.5 2 100 0.5 33 Cracks Fair 55 2.5 2 100 0.5 34 Cracks/Patchy Poor 45 1.5 1 170 0.3 35 Cracks/Patchy Poor 45 1.5 1 170 0.3 36
Some cracks Good/fair 65 2.5 2 110 0.6
Table 5: Average Parameters obtained from a 5-man panel field Survey.

JBU III (2013) 1&2 · 143
___________________________________________________________________________
© 2013 Journal of Biourbanism
Figure 10: GIS map of Muncaster Road (in 36 sections of 500 feet apart).
MD108
MD
115
Muncaster Road
Figure 11: Line Drawing of Muncaster Road

JBU III (2013) 1&2 · 144
___________________________________________________________________________
© 2013 Journal of Biourbanism
The volume of traffic on this link is assumed to be moderate with Annual Average Daily Traffic (AADT) of more than or equal to 10,000 veh/day/lane in each direction. Assuming each lane is 12 feet wide without shoulders in both directions. The proposed analysis is performed in Microsoft Excel. The input data used for this model are listed in Tables 5; in this application y (SI) = dependent variable; and x1, x2, x3, and x4 = independent variables. The paper assumes parameters k = 4 (x1, x2, x3, and x4) to represent PCI, PSI, PSR, and IRI, respectively. Where: PCI (x1) = Pavement Condition Index, PSI (x2) = Present Serviceability Rating, PSR (x3) = Present Serviceability Index, and IRI (x4) = International Roughness Index. RESULTS AND CONCLUSIONS Field data used for the PCI in the numerical example, for the most part exhibit characteristics of real-world pavement conditions. FHWA threshold guidelines were used in estimating the IRI, PSI, and PSR; while SI data were weighed on a scale of 0-1 (1, being very good condition and 0, being very poor condition). IRI is usually measured in meters/km or millimeter/meter; a higher value usually represents a deteriorating pavement. The analysis of the numerical example was performed using Microsoft excel software. The graphs of coefficient of determination R 2 for the different independent variables (PCI, PSI, PSR, and IRI) indicate perfect fits for PCI, PSI, and PSR respectively; compared to the R 2 of IRI. This indicates that the regression line perfectly fits the line of data and is strongly correlated to the first three independent variables (see, Figures 12, 13 & 14). IRI R 2 is also moderately correlated because the regression line does weakly fit the line of data (see Figure 15). Analyzing the graphs for the different variables, we observe that the first three independent variables are strongly correlated; with the independent variable x
1 (PCI) R 2 = 0.993, x 2 (PSI)
R 2 = 0.9917, x 3 (PSR) R 2 = 0.9917, and x 4 (IRI) R 2 = 0.5165. It can be concluded from the
above analysis that the first three variables are highly correlated; which means there is a strong linear relationship between sustainability index and the first three indices (i.e. PCI, PSI, & PSR); compared to R 2 of IRI, which is moderately correlated. This makes the model to be a useful one in determining the relationships between the independent variables and the sustainable index (dependent variable). In conclusion, it is observed that the coefficients of determination R 2 are very good fits between the proposed model and data for the numerical example as demonstrated in the graphs shown in Figures. 12-15.

JBU III (2013) 1&2 · 145
___________________________________________________________________________
© 2013 Journal of Biourbanism
SI vs. PCI
y = 0.014x - 0.2845
R2 = 0.993
0
0.1
0.2
0.3
0.4
0.5
0.6
0.7
0.8
0.9
1
0 20 40 60 80 100
PCI
SI
Figure 12: Graph of SI vs. PCI
Chart Title
y = 0.1976x + 0.0104
R2 = 0.9917
0
0.1
0.2
0.3
0.4
0.5
0.6
0.7
0.8
0.9
1
0 0.5 1 1.5 2 2.5 3 3.5 4 4.5 5
PSI
SI
Figure 13: Graph of SI vs. PSI

JBU III (2013) 1&2 · 146
___________________________________________________________________________
© 2013 Journal of Biourbanism
SI vs. PSR
y = 0.1976x + 0.1092
R2 = 0.9917
0
0.1
0.2
0.3
0.4
0.5
0.6
0.7
0.8
0.9
1
0 0.5 1 1.5 2 2.5 3 3.5 4 4.5
PSR
SI
Figure 14: Graph of SI vs. PSR
SI vs. IRI
y = -0.0062x + 1.2796
R2 = 0.5165
0
0.1
0.2
0.3
0.4
0.5
0.6
0.7
0.8
0.9
1
0 20 40 60 80 100 120 140 160 180
IRI (ins/mile)
SI
Figure 15: Graph of SI vs. IRI

JBU III (2013) 1&2 · 147
___________________________________________________________________________
© 2013 Journal of Biourbanism
Future Work Additional work is to be carried out in the future to further analyze more data regarding the “Three Pillar sustainability dimensions (environmental. Social, and economic values) and using a Life-Cycle Cost Analysis (LCCA) to minimize both user and agency costs and maximize pavement serviceability and life-cycle. A maintenance scheduling optimization model can also be developed in the future (see, Jha 2010). REFERENCES
Al-Omari, B. and M.I. Darter (1992): Relationships between IRI and PSR. Report Number UILU-ENG-92-2013. Springfield, IL: Illinois Department of Transportation
Awoke, G.S. (2011): Estimating the Friction Performance of Hot Mix Asphalt Pavements based on Aggregate Properties and Route Characteristics: Analysis, Modeling and Validation
Bester, C.J. (2002); “The Effect of Road Roughness on Safety”; Transportation Research Board TRB (2003) Annual Meeting
Bonneson, J., Zimmerman, K. and Fitzpatrick, k. (2006) Interim Roadway Safety Design Workbook – Project Report, Texas Transportation Institute, Texas A&M University System, April 2006
Bruntdland Commission on World Commission on Environment and Development (WCED)(1987): Our Common Future, Oxford University Press, Oxford, England, 1987
Barrera-Roldan A., Saldivar, A., Ortiz, S., Rosales, P., Nava, M., Auilar, S., Rodriguez, L., Villasenor, E., and Angeles, A. (2003). Industrial Sustainability Index Transaction on Ecology and the Environment vol. 63, (2003) WIT Press, www.witpress.com, ISSN 1743-3541
Carey, W. N., Jr. and Irick, P.E. (1960), The Pavement Serviceability Concept. Highway Research Board Bulletin 250. National Research Council, Washington D.C., pp. 40-58
Corley-Lay, Judith B. (1998).Friction and Surface Texture Characterization of 14 Pavement Test Sections in Greenville, North Carolina.Transportation Research Record, No. 1639 (1998): pp. 155-161
Darter, M.I. (1980). Requirements for Reliable Predictive Pavement Models”, Transportation Research Record 766, Transportation Research Board, Washington, D.C., 1980
Deakin, E. (2001). Sustainability Development and Sustainable Transportation: Strategies for Economic Prosperity, Environmental Quality, and Equity. (IURD Working Paper Series; Institute of Urban and Regional Development, University of California Berkeley). http://escholarship.org/uc/item/0m1047xc

JBU III (2013) 1&2 · 148
___________________________________________________________________________
© 2013 Journal of Biourbanism
Durango-Cohen, P. and P. Sarutipand (2009). Maintenance optimization for transportation systems with demand Responsiveness, Transportation Research, Part C, 17(4), pp.337-348
Federal Highway Administration (FHWA, 2002): Status of the Nation’s Highways, Bridges, and Transits: Conditions and Performance. www.fhwa.dot.gov/policy/2002cpr/pdfs.htm (Assessed on February 24, 2013)
Federal Highway Administration (FHWA, 2008): Status of the Nation’s Highways, Bridges, and Transits: Conditions and Performance. www.fhwa.dot.gov/policy/2008cpr/pdfs.htm (Assessed on July 2, 2013)
FHWA Life-cycle cost Analysis, FHWA report FHWA-SA-98-079: (1998) Life-Cycle Cost Analysis in Pavement Design. http://www.fhwa.dot.gov.infrastructure/asstmgmt/lcca.htm (accessedJuly, 2013)
FHWA (2011): Sustainability Evaluation and Planning Guidance for Transportation Systems. Transportation Planning Cooperative Research Board Agency Announcement DTFH61-08-R-00011
Gillespie, T. D.; Sayers, M.W.; & Sepel, L.; NCHRP Report 228 (1980). Calibration of Response-Type Road Roughness Measuring System TRB, National Research Council, Washington D.C., 1980 Galehouse, L., Moulthrop, J.S. and Hicks, R.G.(2003) Principles for Pavement Preservation: Definitions, Benefits, Issues and Barriers. TR News 228, Sep./Oct. 2003, pp. 4-9 (via NCHRP Synthesis 343) Graham, J, (2005), Internal Traffic Control Plan; Midwest Research Institute
Haas, R., Hudson, W.R., and Zaniewski, J. (1994). Modern Pavement Management, Krieger Publishing Company, Malabar, FL
Hveem, F.N. and Carmany, R. M. (1948) Factors Underlying the Rational Design of Pavements. Proceedings, Highway Research Board, Washington D.C., December 7-10, 1948
Hicks, R. G. (1991), NCHRP Synthesis of Highway Practice 175: Moisture Damage in Asphalt Concrete. Transportation Research Board. National Research Council, Washington D.C. Jayawickrama, P.W., Prasanna, R. and Senadheera, S.P. (1996). Survey of State Practices to Control Skid Resistance on Hot-Mix Asphalt Concrete Pavements. Transportation Research Record, No. 1536 (1996): pp. 52-58 Jeon, C. and Amekudzi. A. (2005). Addressing Sustainability in Transportation Systems: Definitions, Indicators, and Metrics – The Journal of Infrastructure Systems, ASCE, March 2005
Jha, M.K. (2010). Optimal Highway Infrastructure Maintenance Scheduling Considering Deterministic and Stochastic Aspects of Deterioration, in Sustainable and Resilient Critical Infrastructure Systems, K. Gopalakrishnan and S. Peeta (eds.), pp. 231-248, Springer

JBU III (2013) 1&2 · 149
___________________________________________________________________________
© 2013 Journal of Biourbanism
Lou, Z. (2007). Flexible Pavement Condition Model Using Clusterwise Regression and Mechanistic-Empirical Procedure for Fatigue Cracking Modeling.
McManus, K. J., Mann, A., and Evans, R. P., (1998). The Analysis of Road Roughness and Perception of Road Roughness. International Symposium on Heavy Vehicle Weights and Dimensions, 5th 1998, Maroochydore , Queensland, Australia, Part 4
Mayer, A. (2007). Strengths and Weaknesses of Common Sustainability Indices for Multidimensional Systems. ScienceDirect Environmental International 34 (2008) 277-291. www.sciencedirect.com
Moretti, L., Di Mascio, P., and Panunzi, F. (2012). Economic Sustainability of Concrete Pavements. Procedia – Social and Behavioral Sciences 53 (2012) 125-133.
NCHRP Synthesis 334; (2001); Automated Pavement Distress Collection Techniques – A Synthesis of Highway Practice
National Association of County Engineers, US (NACE) (1992). Action Guide, Volume III-1 “Road Surface Management”, National Association of County Engineers, 1992
Nick J. B. and Janoff, M. S. (1983). Evaluation of Panel Rating Methods for Assessing Pavement Ride Quality. Transportation Research Board (TRB) 946, National Research Council Washington D.C., 1983
Ortiz-Gallarza, S. M., Nava, M., Rodriguez, L., Barrera, A., and Villasenor, E. (2003). Selection of Environmental Parameters to Estimate an Industrial Sustainability Index. Transaction on Ecology and the Environment vol. 67, (2003) WIT Press, www.witpress.com
Papagiannakis, A. T. and Masad, E.A. (2007): Pavement Design and Materials. John Wiley & Sons, New Jersey
Paterson, W. D. O. (1986). International Roughness Index: Relationship to other Measures of Roughness and Riding Quality. Transportation Research Record 1084, Transportation Research Board, 1986, pp. 49-59
http://www.pavement interactive.org; Pavement Interactive (2007): Life-Cycle Cost Analysis; published on August 15, 2007. Accessed on March 16, 2013
http://www.pavement interactive.org “Pavement - Preventive or Repair?” (May 2013) and accessed on October 25, 2013
Ramani, T., Zietsman, J., Eisele, W., Roas, D., Spillane, D., and Bochner, B. (2009): Developing Sustainable Transportation Performance Measures for TXDOT’s Strategic Plan. Technical Report No. SWUTC/09/0-5541-1
Rodrigue, Jean-Paul, (2013) – New York: Pollutants Emitted by Transport System (Air, Water and Noise), ISBN978-0-415-82254-1
Salami, O., CPC,. El-Assaly A., and AbouRizk S.,(2003).; Performance Prediction Models of Pavement Highway Network in Alberta. TRB, 2003 Meeting CD – ROM.

JBU III (2013) 1&2 · 150
___________________________________________________________________________
© 2013 Journal of Biourbanism
Strategic Highway Research Program (SHRP) (1993), National Research Council-P338; Distress Identification Manual for the Long-Term Pavement Performance Project
Transportation Research Circular Number E-C118, (2007); Pavement Lessons Learned from the AASHO Road Test and Performance of the Interstate Highway System.
Virginia State of Transportation (2009). Pavement Evaluation and Design, Chapter VI.
Pavement Interactive. (2013). http://www.pavementinteractive.org (accessed October 25, 2013)
Vogt A. and Bared, J. G. (1998) – Accident Models for Two-Lane Rural Roads: Segments and Intersections, Publication No. FHWA-RD-98-133, October 1998.
Washington State Department of Transportation (2005).Pavement Policy. Vol. 1. May 2005. www.wsdot.wa.gov/biz/mats/pavement/WSDOT_Volume1-Pavement Policy.pdf