building a roadmap for heat 2050 scenarios and heat ... · roadmap for heat 2050 scenarios and heat...
TRANSCRIPT

Building a roadmap for heat2050 scenarios and heat delivery in the UK

b
Authors
Jamie Speirs1
Robert Gross
Sandip Deshmukh2
Phil Heptonstall1
Luis Munuera1
Matt Leach
Jacopo Torriti2
The authors would like to thank Professor David Fisk and Professor Nilay Shah of Imperial College London for their invaluable comments and advice during the drafting of the report.
ICEPT (Imperial Centre for Energy Policy and Technology) Imperial College London SW7 2AZ
Centre for Environmental Strategy The University of Surrey Guildford GU2 7XH
This report was commissioned and paid for by the Combined Heat and Power Association but is an independent piece of academic research.
About the CHPA
The Combined Heat and Power Association (CHPA) is the leading advocate of an integrated approach to delivering energy services using combined heat and power and district heating. It has over 100 members active across a range of technologies and markets. It works to build awareness and understanding of these approaches and create a strong and sustainable environment for the growth and development of its members.
For more information about the work of the CHPA please contact Tom Fern, at [email protected].
www.chpa.co.uk
CHPA, Grosvenor Gardens House, 35/37 Grosvenor Gardens, London SW1W 0BS
Version: Final, February 2010
© CHPA 2010
1 Imperial College London2 University of Surrey

1
Executive Summary
Building a roadmap for heat Executive Summary
In 2008 the UK adopted legally binding targets mandating an 80% reduction in greenhouse gas emissions by 2050. Several scenario modelling exercises have sought to explore how the energy system could meet these new targets whilst minimising costs. These scenarios depict a future energy system with an increased share of electricity in the energy mix due to the electrification of space heating and road transport. In its Low Carbon Transition Plan (DECC 2009), the government has also undertaken to produce ‘route-maps’ towards a decarbonised energy system. If the UK follows a path towards a highly electrified future then we must carefully examine the issues and challenges associated with it.
This report first examines the energy system scenarios to 2050 that have contributed to current government energy policy. It highlights the consensus around a highly electrified3 future energy system, which we refer to as the ‘all-electric future’. It then considers the role of high and low-grade heat in the energy mix. It presents and discusses energy flows in both 2007 and the energy system implied by the all-electric future in 2050. This is accompanied by an investigation of the issues associated with delivering such a system. These issues are referred to as the ‘criticalities’ of the all-electric energy future. Finally, the report presents an ‘integrated’ scenario, which delivers improvements in conversion efficiency and a more diverse delivery of heat.
The key findings of this study are:
• The all-electric future is low carbon but associated with continued reliance on fossil fuels and large losses of energy at the power generation stage. This future also creates challenges related to the management of power flows, demand peaks associated with electric heat and end-user adoption of insulation, heat pumps and other measures.
• Higher conversion efficiency is possible through the utilisation of power station waste heat through CHP and biomass fired CHP plant. Diversifying the mix of options used to meet heat demands has the potential to reduce peak power demands, provide a thermal ‘buffer’ to help manage the matching of electricity demand and supply and may help address some of the end-user issues.
• No route to low carbon heat is without challenges. A diverse combination of technologies can help overcome some of the criticalities, and it is likely that action on a range of options for low carbon heat will provide a more robust energy system in the long run. Action on a range of heat options in the short run also provides a resilient approach to uncertainties about the energy system of the future.
The Scenarios
In order to meet the binding targets set out in the Climate Change Act, the Department of Energy and Climate Change (DECC) must consider its policy options. In its Low Carbon Transition Plan (LCTP) DECC reference several reports which investigate scenarios of the energy system out to 2050. The scenarios considered in the LCTP which meet an 80% reduction in carbon emissions are:
• The Committee on Climate Change (CCC) 80% Carbon reduction scenario
• The Department of Food Agriculture and Rural affairs 80% high bioenergy scenario
• The DECC 80% Renewable Energy Strategy scenario
• The UK Energy Research Centre Low Carbon Resilient scenario
These scenarios have some common characteristics, including a high degree of electrification of both final user heat and transport energy provision. This leads to a highly electricity- dependent future energy system which we refer to in the report as the all-electric future. All the scenarios were modelled using MARKAL, a cost optimisation system modelling tool. Such approaches have many benefits but also some drawbacks that are particularly relevant to systemic changes such as wider utilisation of heat flow through CHP and district heating. It may also be a challenge for such models to attach value to diversity,
3 This refers to an energy system in which electricity is used to provide the majority of energy for end-uses.

2 Building a roadmap for heat Executive Summary
or to reflect a range of real world factors that prevent end-users in particular from making pure ‘economically rational’ (but not necessarily reasonable) choices. Engineering limits must be considered off-model. As a result, a number of criticalities are associated with the all-electric future. These can be summarised as follows:
• Build rates – the all-electric future requires rapid and sustained progress on all low carbon electricity supply options.
• Power flows – the all-electric future gives rise to problems associated with intermittent/variable and inflexible generation. It also creates new demand-side issues associated with electrifying heat and road transport. In the worst-case, a time of day winter heat demand increment of the order of several 10s GW could be created, perhaps 50 GW on top of today’s 60 GW peak.
• End-user issues – the feasibility of the targets and the suitability of heat pumps is contingent upon very high adoption levels for insulation and other domestic energy efficiency measures. Yet all such measures face considerable barriers to adoption. The interaction between options/sectors means that the feasibility of electrifying heat depends in large part upon successful measures to change individual patterns of behaviour.
Heat in 2050 and an alternative ‘integrated’ scenario
Heat losses in 2050Heat is a very important end-use of energy in the current energy system and is expected to remain so out to 2050. In 2007, heat represented 41% of total final energy consumption in the UK. Over half of this heat demand comes from the domestic sector, highlighting the significant challenge associated with decarbonising this sector particularly.
The energy flows of both the current energy system and the all-electric future are presented in the form of energy flow or ‘Sankey’ diagrams. This provides a novel view of the whole-system implications of an electricity dependent future and allows a comparison between the current state of the energy system and the possible future in 2050.
Total energy demand is significantly reduced by 2050, but demand for electricity increases. Moreover, there is a significant increase in thermal power generation, since both fossil fuel plants with carbon capture and nuclear power feature prominently in this scenario. The scenario does not envisage a large role for CHP, so the scenario is associated with high levels of conversion losses in the form of waste heat from power stations.
An ’integrated’ scenarioThe project team developed an integrated scenario which seeks specifically to utilise waste heat efficiently and diversify the means by which heat is provided to end users. This is an adaptation of the CCC 80% carbon reduction scenario that seeks only to alter assumptions regarding the delivery of heat, specifically the use of CHP and networked heat:
• Biomass: The current literature on potentially available biomass feedstock supports the proposition that excess biomass could be available to power significant volume of medium scale CHP plant by 2050. We therefore allocate 5.2 MTOE of extra bioenergy resource to CHP in the integrated scenario;
• CCS- CHP: The potential to combine CHP and CCS technologies has been explored by energy utilities and published work on plant efficiency is available. We assume that these facilities will be built on existing power station sites on the east coast of the UK with sequestration under the North Sea. The scenario seeks to maximise conversion efficiency so we assume new CCS-CHP will be gas-fired, and that district heat displaces resistive heating and electric heat pumps, while reduced electricity demand displaces coal-fired electricity generation with CCS;

3Building a roadmap for heat Executive Summary
• District heat networks (DHN): DHN potential for delivery of the heat captured at these locations is assessed in two stages. First, we assume a 30 km maximum radius for heat transmission networks. This is achievable with current technology and can therefore be viewed as conservative with respect to 2050. We then apply this radius to our selected power station locations, giving us a level of heat demand within each radius. We add to this a level of potential industry heat demand deliverable through CHP and CCS plant, based upon existing analysis.
This diversified scenario offers a number of benefits:
• By providing 4.2 MTOE heat and 4 MTOE electricity from gas-fired CCS-CHP plant, and 3.7 MTOE heat and 0.5 MTOE electricity from biomass fired CHP plant, demand for electricity is reduced by 13% and demand for primary energy is reduced by 5%4;
• Use of networked heat has the potential to reduce peak power demand and offer a degree of energy storage in the form of heat. This may provide system management benefits such as providing a buffer to diurnal electricity demand peaks and mitigating the effects of intermittency;
• Finally, heat networks also obviate the need for installation of heat pumps, reducing the disruption associated with the installation of large surface area heating systems, such as under floor heating, and may offer one route to decarbonisation for some of the hardest to insulate buildings
Conclusions
The transition to a low carbon energy future presents the UK with some difficult choices. Through the course of our analysis we find the following:
• The all-electric future can be seen as a common outcome from current 2050 energy scenario modelling. It is one possible vision of an 80% decarbonised future. It is low-carbon but not necessarily optimally efficient, since thermal losses from power generation are large;
• The all-electric scenario is also contingent on overcoming certain critical issues, which are neither easy nor fully understood. If the roll-out and performance of heat pumps, insulation and low carbon generation is not as expected, then the scenario will not be able to deliver the emission reductions required. It also gives rise to a set of challenges associated with the management of power flows;
• The conversion efficiency of this scenario can be improved through the use of CHP and DHNs without impinging upon our ability to decarbonise. This can be achieved through use of CCS-CHP technology and biomass as a fuel for CHP plant. This will also require the installation of DHN infrastructure across parts of the country.
• An integrated scenario, using more CHP and less electric heating, will assist with a number of power flow and electricity network issues; particularly, by reducing a potential heat-driven demand peak, providing an energy store in the form of heat and in supplying an alternative means by which to decarbonise hard to insulate buildings;
• No route to 80% carbon reduction is without challenges; the integrated scenario will also create some critical issues. Diversifying heat provision can mitigate the criticalities associated with each individual option. This may help in providing a more robust energy system, and manage critical issues such as increased peak electricity demands, intermittency and end-user behaviour. As we consider the policies required in the short run to create options for the long run, it is important to take action on a range of fronts, maximising diversity.
4 Reductions compared to CCC 80% carbon reduction scenario.

4 Building a roadmap for heat Glossary
Glossary
CCC Committee on Climate Change
CCGT Combined Cycle Gas Turbine
CCS Carbon Capture and Storage
CHP Combined Heat and Power
CERT Carbon Emission Reduction Target
CGEN Combined Gas and Electricity Network model
DECC Department of Energy and Climate Change
Defra Department for Environment, Food and Rural Affairs
DHN District Heat Network
EPC Energy Performance Certificate
ETS Emissions Trading Scheme
GHG Greenhouse Gasses
GW Gigawatts: watts x109
ICE Institute of Civil Engineers
IGCC Integrated Gasification Combined Cycle: Coal-fuelled power station technology
LCTP Low Carbon Transition Plan
MARKAL MARKet ALlocation model
MED MARKAL Elastic Demand model
MTCO2 Million Tonnes of Carbon Dioxide
MTOE Million Tonnes of Oil Equivalent
NGCCCHP Natural Gas Combined Cycle Combined Heat and Power
Ofgem Office of the Gas and Electricity Markets
RES Renewable Energy Strategy
UKERC UK Energy Research Centre
WASP Wien Automatic System Planning model

5Building a roadmap for heat Contents
Contents
1 Introduction 7
2 Decarbonisation scenarios and the ‘all-electric consensus’ 8
2.1 Carbon abatement scenarios and UK energy policy 8
2.1.1 The scenarios 10
2.1.2 Synthesis 14
2.1.3 Issues in modelling the transition to a low carbon economy 14
2.2 Summary 16
3 Heat and the all-electric future 17
3.1 The role of heat in the UK energy mix in 2007 17
3.2 Energy flows in the ‘all-electric world’ 21
3.3 Criticalities in the ‘all-electric’ energy system 24
3.3.1 Primary energy needs and roll out of low carbon generation 24
3.3.2 Network requirements 25
3.3.3 Power flows, peak loads and plant utilisation 26
3.3.4 End-user issues – behavioural obstacles to high penetration of domestic efficiency measures 26
3.4 Summary 27
4 An integrated scenario for meeting heat demand in a decarbonised future 28
4.1 Introduction 28
4.2 Creating anintegrated scenario 29
4.2.1 Potential for CHP from biomass and CCS 29
4.2.2 Quantifying the integrated scenario 32
4.3 Benefits of the integrated scenario 34
Reduced demand for electricity 34
Managing energy flows 34
End-user issues 35
4.4 Summary 35
5 Conclusions and implications for policy 36
Technical Annex 40

6 Building a roadmap for heat Table of Figures
Table of Figures
Figure 2.1 CO2 emissions by sector under MARKAL 80% scenario (33% by 2020, 80% by 2050)(CCC 2008) 11
Figure 2.2 CO2 intensity of electricity generation under four scenarios including the UKERC Low Carbon Resilient (LCR) scenario (UKERC 2009) 13
Figure 2.3 Comparison of final energy use (per year) by fuel in two MARKAL model runs. Based on data from CCC ( 2008) and the UKERC ( 2009) 13
Figure 2.4 Electricity generation from CHP from 2000 to 2050 using MARKAL (PJ) 16
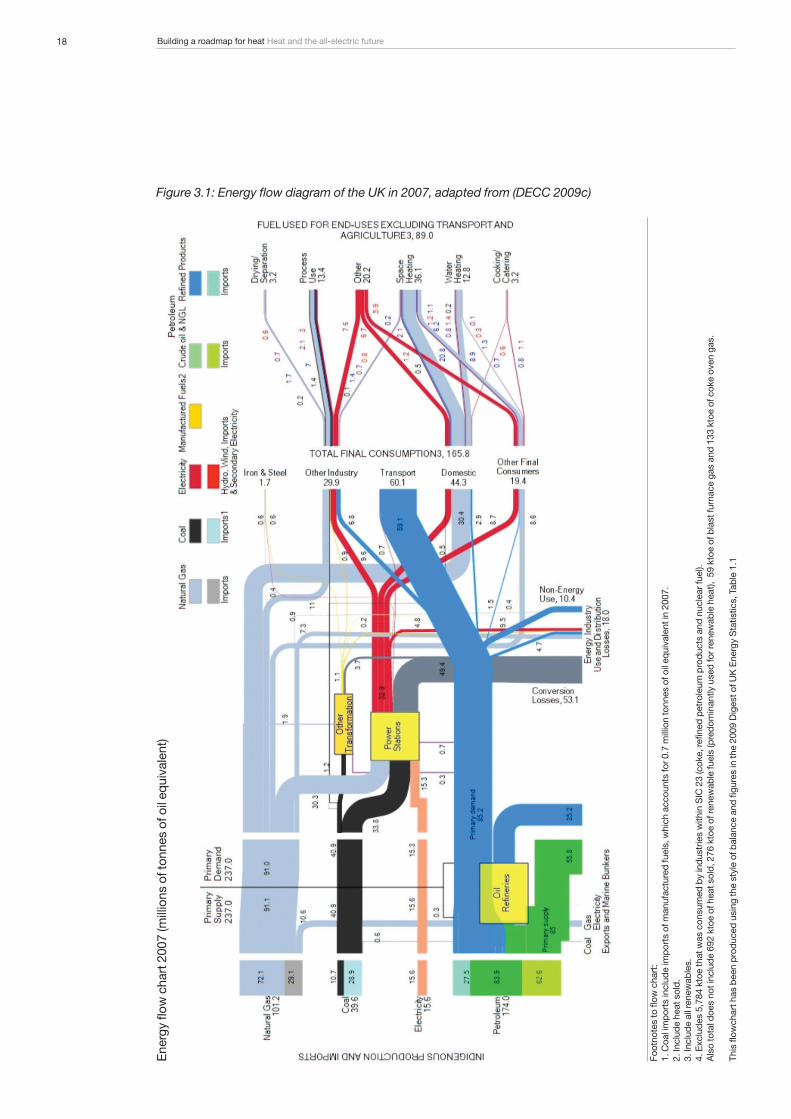
Figure 3.1 Energy flow diagram of the UK in 2007, adapted from (DECC 2009c) 18
Figure 3.2 Heat demand by sector as a percentage of total energy demand 19
Figure 3.3 Domestic heat demand by fuel as a % of domestic energy demand 19
Figure 3.4 Changes in total annual domestic heat consumption and annual heat consumption per household 20
Figure 3.5 Industrial heat demand by fuel as % of industrial energy demand 20
Figure 3.6 Service sector heat demand by fuel as % of service sector energy demand 21
Figure 3.7 Energy flow diagram of Committee on Climate Change 33/80 scenario for UK in 2050 23
Figure 4.1 Energy flow diagram of the integrated scenario 33

7Building a roadmap for heat Introduction
1/ Introduction
In 2008 the UK adopted legally binding targets mandating an 80% reduction in greenhouse gas emissions by 2050 (OPSI 2008). In its Low Carbon Transition Plan (DECC 2009), the government has also undertaken to produce ‘route-maps’ towards a decarbonised energy system. Several scenarios of the energy system in 2050 have been developed recently, describing different paths towards this future, and different mixes of technology and resources at that point. These scenarios investigate both the carbon emissions and economics of this transition. Amongst these scenarios some consensus has been built, with many envisaging a highly electrified future where demand for heat and transport is served by electric technologies rather than direct use of fossil fuels. We describe these scenarios in this report as the ‘all-electric future’.
The all-electric future, however, presents some significant challenges which are worth investigation. This report considers the challenges associated with electrifying the delivery of heat in the energy system. Heat demands currently account for some 41% of final energy consumption and most heat loads are currently met through the direct combustion of fossil fuels, primarily natural gas (DECC 2009c). As we explain below, meeting this level of energy service demand through electricity raises challenges related to both electricity system expansion and end-users. It is also notable that the all-electric scenarios rely heavily on electricity-only thermal power stations, particularly fossil fired generation with CCS, with large amounts of primary energy lost as ‘waste’ heat.
In the remaining chapters of this report we investigate these issues in more depth: reviewing current scenario analysis on how to meet 2050 emissions targets; discussing energy flows and losses; and the challenges associated with the all-electric future. The report is able to provide new insights because it takes a novel approach, using energy flow diagrams (Sankey diagrams) to help interpret and assess the implications of 2050 scenario modelling. It also develops an alternative vision of a low carbon energy system, focusing on diversifying the means by which the energy system as a whole is able to deliver heat.
Chapter 2 examines the scenarios cited in the Low Carbon Transition Plan (DECC 2009e) and explains the origins of recent UK scenario thinking. The chapter also examines some of the issues associated with scenario modelling as they pertain to heat technologies.
Chapter 3 considers the role of heat in the energy system in 2007, using an energy flow diagram, then presents the energy flows implied by the Committee on Climate Change 80% CO2 reduction scenario – an example scenario that embraces the all-electric future. Finally Chapter 3 considers the problems, referred to here as ‘criticalities’, associated with meeting heat demands in the all-electric future.
Chapter 4 presents an alternative to the all-electric future, which considers alternative means by which to meet a significant fraction of heat demands, focusing on the potential to make greater use of waste heat and biomass. We call this the ‘integrated’ scenario. This chapter also develops an energy flow diagram, depicting the changes in energy flows associated with the integrated scenario. It assesses the extent to which our integrated scenario is able to respond to the criticalities of the all-electric future, as well as creating a range of challenges of its own.
Finally, Chapter 5 provides a summary of the challenges, presents our conclusions and discusses some of the pertinent policy issues.

8 Building a roadmap for heat Decarbonisation scenarios and the ‘all-electric consensus’
2/ Decarbonisation scenarios and the ‘all-electric consensus’In order to meet its greenhouse gas (GHG) reduction targets the UK energy industry will need to adopt a range of carbon abatement options. The Department of Energy and Climate Change (DECC) considered several scenarios in order to demonstrate low GHG futures based on the abatement options available. In this chapter we examine the decarbonised scenarios considered, focussing on the increased share of electricity as an energy carrier and final energy product and the implications for transport and heat markets. Chapter 3 discusses the ‘criticalities’ for reaching an electricity-dominated future with regards to low carbon power generation, infrastructure constraints, power flows and end-user issues.
Box 2.1: What are scenarios?
“Scenarios are carefully constructed snapshots of the future and the possible ways a sector might develop. Scenarios help focus thinking on the most important factors driving change in any particular field. By considering the complex interactions between these factors, we can improve our understanding of how change works, and what we can do to guide it.”
Source: (OECD 2009)
2.1 Carbon abatement scenarios and UK energy policy
The latest energy white paper, the UK Low Carbon Transition Plan (LCTP), was published by DECC in 2009 (DECC 2009e) and “sets out the UK’s first ever comprehensive low carbon transition plan to 2020” (Box 2.2). This white paper responds to the target set out in the Climate Change Act 2008, requiring CO2 emissions cuts of 34%5 by 2020 (OPSI 2008).
One significant implication of these proposals is the increase in the provision of energy services through the electricity network, including the electrification of both private passenger transport and heat provision.
The conclusions of the LCTP are underpinned in part by the modelling of several scenarios, representing various assumptions using the MARKAL model (see Box 2.3). Several different analyses of this model are cited by DECC as contributory to the LCTP and these are presented in Table 2.1. These include work by the Committee on Climate Change (CCC), the UK Energy Research Centre (UKERC), the Department for Environment, Food and Rural Affairs (Defra) and DECC.
In this report we focus on those scenarios that provide an 80% reduction in CO2 by the year 2050, this being the legally binding target adopted by the government in the Climate Change Act (2008). We now discuss some of these scenarios, and their translation into the conclusions of the LCTP.
Box 2.2: A broad summary of the LCTP
• The power sector will be decarbonised through a move to produce 40% of electricity through low carbon sources by 2020. This includes support for renewable energy technologies, a new generation of nuclear power stations and funding for carbon capture and storage (CCS) demonstration plant.
• Homes and communities will be decarbonised through several measures including increased obligation on energy suppliers through the Carbon Emissions Reductions Target (CERT), installing every home with a smart meter by 2020, introducing ‘pay as you save’ and cash-back schemes to finance energy saving and reward low carbon energy use and raise standards through the Energy Performance Certificate (EPC) scheme.
5 Unless stated, all percentage emissions cuts are against 1990 emissions levels.

9Building a roadmap for heat Decarbonisation scenarios and the ‘all-electric consensus’
Table 2.1: MARKAL scenarios used in the LCTP
Scenario CO2 Emissions Reductions (relative to 1990)
Other Assumptions
70% scenario 29% in 2020, 70% in 2050
Commissioned by the CCC. Max nuclear and CCS build rate 3GW p.a. in the 2020s, 5GW p.a. thereafter.
70% RES 29% in 2020, 70% in 2050
Commissioned by DECC for this Transition Plan. Model constrained to deliver sufficient renewable generation in 2020 to meet the Renewable energy target.
80% base case 33% reduction by 2020. 80% reduction by 2050
Commissioned by the CCC. Max nuclear and CCS build rate 3GW p.a. in the 2020s, 5GW p.a. thereafter.
80% high bioenergy 31% in 2020, 80% in 2050
Commissioned by Defra in 2007. High availability of domestic and imported biomass, with high capacity for biomass liquids to meet transport energy demand.
80% RES 29% in 2020, 80% in 2050
Commissioned by DECC for this Transition Plan. Model constrained to deliver sufficient renewable generation in 2020 to meet the Renewable energy target.
80% ‘resilient’ (low electricity)
26% in 2020, 80% in 2050
Commissioned by the UKERC. Energy demand must fall by at least 1.2% a year. No single energy source can account for >40% of the primary energy mix, or more than 40% of the power mix from 2015 onwards. Constraints on level of expected un-served energy. Power sector modelling supplemented to account better for intermittency.
90% scenario 38% in 2020, 90% in 2050
Commissioned by the CCC. Max nuclear and CCS build rate 3GW p.a. in the 2020s, 5GW p.a. thereafter.
90% RES 29% in 2020, 90% in 2050
Commissioned by DECC for this Transition Plan. Model constrained to deliver sufficient renewable generation in 2020 to meet the renewable energy target.
Source: DECC Analytical Annex to the UK Low Carbon Transition Plan (DECC 2009a)
• The workplace will be decarbonised through the inclusion of high carbon industries in the EU Emissions Trading Scheme (ETS), incentivising workplaces through the Climate Change Levy, Climate Change Agreements and Carbon Reduction Commitments and provision of advice. This will also include support to give the UK a competitive green economy and ensure an equitable transition to this green economy.
• Transport will be decarbonised through improvements in carbon efficiency of conventional vehicles, support for electric vehicles through demonstration programs and investment in electric car charging infrastructure, providing funding for low carbon travel infrastructure such as low carbon rail networks, cycle lanes and a funding competition for the first ‘Sustainable Travel City.’
• Emissions from farming and waste management will also be mitigated through review of voluntary agreements, support for anaerobic digestion technologies and other investment and advice support.

10 Building a roadmap for heat Decarbonisation scenarios and the ‘all-electric consensus’
2.1.1 The scenarios
Committee on Climate Change (CCC) scenarios The CCC was created under the Climate Change Act to independently advise the government on emissions targets and the progress towards meeting them. In their first report (CCC 2008), the committee presented their recommendations on emissions targets for 2050 and advised on the carbon budgets out to 2022.
The CCC present 80% and 90% scenarios, quantified using the MARKAL model. These scenarios are intended to demonstrate technological and cost implications of meeting an 80% reduction in greenhouse gas (GHG) emissions by 2050 in the UK. Since MARKAL does not model non-CO2 GHGs, or emissions from international aviation, both 80% and 90% scenarios were modelled. The 80% scenario models the least cost path to meet energy service demand under a CO2 reduction of 80% by the year 2050. The 90% scenario was included to model the eventuality in which emissions both of non-CO2 GHGs, and emissions from international aviation, are not sufficiently reduced.
The CCC scenarios envisage very significant decarbonisation of electricity generation. In order to keep 2050 targets on track this decarbonisation needs to be almost complete by 2030 (Figure 2.1). Carbon intensity falls to below 70 g/kWh by 2030 in the 80% scenario and below 40 g/kWh in the 90% scenario, falling further to 35 g/kWh and 20 g/kWh respectively by 2050. In the period to 2020, MARKAL also selects the uptake of efficiency measures in the domestic sector, including insulation and efficient appliances. It is important to note that MARKAL does this because such options are highly cost effective. Nevertheless, there is a large body of evidence to suggest that individuals in particular are not ‘economically rational’ when it comes to energy efficiency. Hence, delivery of these aspects of the MARKAL scenarios will be contingent on a range of policy measures to overcome non-price market barriers. In the period to 2020, emissions in the transport sector are reduced primarily through improved fuel efficiency measures for existing internal combustion engine (ICE) technologies.
After 2020, both the CCC scenarios begin using low carbon electricity to further decarbonise the transport and domestic sectors. First, plug-in hybrids and battery electric vehicles are introduced, reducing the carbon intensity of transport. Second, the adoption of electricity-based heating systems, such as heat pumps, reduces the carbon intensity of the domestic sector. For reasons discussed below (Section 3.3), this is contingent upon the great improvements to the thermal insulation of buildings that MARKAL envisages for the period to 2020. We can see in this instance how energy system components interact, and the feasibility of one key option (heat pumps) may be contingent upon policy success in another area (building insulation).
Electricity demand falls in the early phase to 2020, due to a variety of improvements to end-user energy efficiency. The period after 2020, however, sees increases in electricity demand, due to the electrification of the transport and domestic heating sectors. In both 80% and 90% scenarios, increased demand is met by increasing generating capacity using nuclear power, renewable energy and fossil fuel plant with carbon capture and storage. During the 2020s the build rate for nuclear and fossil fuel with CCS generation capacity is limited to 3 GW p.a. This is increased to 5 GW p.a. for the period between 2030 and 2050.

11Building a roadmap for heat Decarbonisation scenarios and the ‘all-electric consensus’
Figure 2.1: CO2 emissions by sector under MARKAL 80% scenario (33% by 2020, 80% by 2050)(CCC 2008)
DECC Low Carbon Transition Plan ScenariosIn producing the LCTP, DECC commissioned two new MARKAL scenario runs. These mirrored the 80% and 90% scenarios carried out by the CCC but included constraints which comply with the 2020 renewable energy target set out in the Renewable Energy Strategy (RES) (DECC 2009f).
The RES sets out a range of provisions intended to meet the UK’s share of an EU target to source 20% of Europe’s final energy needs from renewable sources (CEC 2008). The RES seeks to ensure that 15% of final energy consumption in the UK will come from renewable sources by 2020. Scenarios run by DECC suggest that around 30% of electricity, 12% of heat and 10% of transport demand will need to come from renewable sources if this target is to be met (DECC 2009f).
An implication of the RES is that some short term electricity decarbonisation routes, favoured in the CCC scenarios, are limited by the need for renewables uptake. For example, nuclear, coal and gas-fired power are restricted, in favour of wind power in particular, in order to reach 30% electricity by renewables by 2020. Another difference is that decarbonisation by 2020 reaches 29%, as opposed to the 33% cuts seen in the CCC scenarios. The DECC scenarios have similar implications to the CCC scenarios for the electrification of the heat and transport sectors, particularly in the period after 2020, where efficiency gains in the domestic sector are maximised and a transition to electricity based heat through heat pump systems begins.
The UKERC 2050 scenariosIn the UK Energy Research Centre Energy 2050 report (UKERC 2009) several scenarios, modelled using MARKAL, are presented. They seek to define low carbon and resilient6 energy futures. The report defines four core scenarios representing combinations of those two goals. These are:
• ‘Reference’ (REF), a scenario that assumes only currently funded policies and measures in place, as of the 2007 energy white paper, are adopted. This does not include policies to reach an 80% carbon reduction target, nor the CCC proposed carbon budgets. This scenario is only intended to provide reference by which other scenarios can be compared;
6 The UKERC Energy 2050 report defines resilience as:“...the capacity of an energy system to tolerate disturbance and to continue to deliver affordable energy services to consumers. A resilient energy system can speedily recover from shocks and can provide alternative means of satisfying energy service needs in the event of changed external circumstances.”
MTC
O2

12 Building a roadmap for heat Decarbonisation scenarios and the ‘all-electric consensus’
• ‘Low Carbon’ (LC), a scenario assuming a range of policies are adopted which lead to a 26% carbon reduction by 2020, an 80% carbon reduction by 2050 and a suitable trajectory to get there;
• ‘Resilience’ (R), a scenario ignoring carbon constraints but instead assuming levels of infrastructure investment, demand reduction and supply diversity conducive with a resilient (or secure) energy system;
• ‘Low Carbon Resilient’ (LCR), a scenario, which combines the assumptions of both the LC and R scenarios.
These scenarios are represented in Figure 2.2.
The UKERC represent resilience in terms of three aspects:
• Energy intensity: lowering total energy demand decreases the burden on any area of the energy system;
• Diversity: increasing the number of contributors to the energy system, controlling the balance between these contributors and accounting for the differences between them all increase resilience;
• Reliability: equipment on the system needs to be predictable and reliable. In addition, redundancy must be maintained in the form of ‘capacity margin’.
The UKERC took a several-stage modelling approach, using ‘sectoral’ models to establish energy service demand, MARKAL to represent cost-optimised scenarios, and WASP7 and CGEN8 models to represent electricity and gas networks respectively. System shocks were then modelled for each level of the system through the MARKAL, WASP and CGEN stages.
In the LCR scenario energy demand reduction is constrained to be at least 1.2% per year. This constraint helps meet the energy intensity aspects of the resilient system. In addition, all energy sources are restricted to a maximum of 40% share of the primary energy or power mix from 2015. These constraints make sure that the energy mix is sufficiently balanced, meeting diversity aspects of the resilient system. Issues surrounding the risks associated with intermittent generation are also accounted for in the modelling of the power sector.
The UKERC suggest that low carbon and resilient electricity systems are not necessarily incompatible. Whilst the UKERC resilient scenario does not decarbonise sufficiently to meet an 80% emission reduction goal it is lower carbon than the UKERC reference scenario because the scenario places strong emphasis on energy efficiency improvements and on renewables as a domestic primary supply. By 2050 electricity generation is significantly decarbonised in all low carbon scenarios but in the low carbon resilient scenario both final energy demand and electricity demand are reduced in comparison to the scenarios presented by the CCC.
Finally, Figure 2.3 presents final energy demand by fuel for two of the referenced scenarios in 2050 with 2010 data from the UKERC model runs. This highlights the relative dominance of electricity in final demand and the decreasing quantity of gas presented in current 2050 scenarios. Interestingly, the LCR scenario presents a significant increase in the share of heat as a final energy vector.
7 The Wien Automatic System Planning (WASP) model is used to simulate medium to long-term economically optimal power system expansion policy.
8 The Combined Gas and Electricity Network (CGEN) model is a cost optimisation model used to investigate optimal operation and expansion of gas and electricity networks.

13Building a roadmap for heat Decarbonisation scenarios and the ‘all-electric consensus’
Figure 2.2: CO2 intensity of electricity generation under four scenarios including the UKERC Low Carbon Resilient (LCR) scenario (UKERC 2009)
Figure 2.3: Comparison of final energy use (per year) by fuel9 in two MARKAL model runs. Based on data from CCC ( 2008) and the UKERC ( 2009)
9 In this figure we use ‘fuel’ as shorthand for a range of energy carriers, or ‘vectors’, hence the table includes ‘heat’ (in the form of heat networks), hydrogen and electricity as well as conventional primary fuels.

14 Building a roadmap for heat Decarbonisation scenarios and the ‘all-electric consensus’
2.1.2 SynthesisThe analytical annex to the LCTP highlights several common characteristics between the scenarios reviewed.
“All scenarios share some characteristics. These include by 2050, electricity accounting for an increased share of energy consumption, a radical de-carbonisation of electricity supply and a dramatic improvement in energy efficiency.”
These common characteristics are represented in the outcomes of the LCTP. Interestingly, the LCTP does not seem to explicitly address specific outcomes of the UKERC LCR or Defra high bioenergy scenarios (see Table 2.1). In the UKERC scenario specifically, the extent to which electricity meets energy demand is more constrained than seen in DECC and CCC scenarios. The LCTP expresses the intention to publish detailed ‘route maps’ which will translate the LCTP in terms of policy action. These will be presented in the spring of 2010 and will make clear the implications of this white paper in policy terms. There are, however, implications for an energy system which relies heavily on the electricity system to deliver on energy security and GHG abatement targets in the future. These implications are explored in Chapter 3. Before we assess the issues associated with the ‘all-electric’ future, we consider the role of the MARKAL model in selecting technology mixes for future energy scenarios, how the all-electric future meets demands for heat and how that compares to the situation today.
2.1.3 Issues in modelling the transition to a low carbon economyMARKAL is described in box 2.3. It has energy producing, conversion, end-user activities and capacities as decision variables, and constraints representing energy balances, capacity limits, and various policy considerations. It involves a two-stage stochastic programming capability that facilitates decision tree analyses. Although it was originally developed in the late 1970s (Fishbone & Abilock 1981), in more recent years updated and expanded versions of MARKAL have been used to provide insights in the carbon abatement policy arena, with versions of the model in use for research and policy-support in many countries and regions.
Whilst MARKAL has the merit of being ‘technology rich’, it can produce results that are conservative when it comes to projecting certain technology capacities compared to other models (Morris et al. 2002). There are three fundamental causes of this:
• The model can ‘select’ only those options included in its database, with technical potential, constraints and costs specified by the end-user. The range of options for long-term carbon mitigation is large. The outcomes from the modelling are therefore dependent upon the full range of technologies being accurately characterised in the modelling assumptions. Moreover, it is possible that some combinations of technologies are not available in the modelling dataset and therefore cannot be factored into the bounds of the possible by MARKAL;
• As a least-cost optimisation model, MARKAL will (unless specifically instructed otherwise) select the lowest cost option for any particular application to the exclusion of all others – ’winner takes all‘. This may not always be a good reflection of reality, in which different end-users may make different choices from a range of options available. While a ‘winner takes all’ solution may be cost optimal in a narrow sense it may also create problems for system operation, for example, a large penetration of all-electric heating may create power management problems. We return to this issue in Chapters 3 and 4;
• In some cases, new measures do not simply involve replacing an existing and discrete piece of energy equipment with a low carbon substitute, but, instead, imply much wider changes to energy systems. It is clearly much harder to properly reflect the system impacts and costs of such options.

15Building a roadmap for heat Decarbonisation scenarios and the ‘all-electric consensus’
Box 2.3 The MARKAL model Source: (CCC 2008)
Examples of wider energy system transformations are moves to a hydrogen economy, biomass energy and increased utilisation of CHP or district heating – all of which imply linkages between different energy sub-systems (e.g. electricity, heat and even transport) and which may involve smaller scale, decentralised resource conversion, and thus need characterization of local conditions. Efforts have been made, and are ongoing, to refine the treatment of these and other sectors in MARKAL for the UK and in other countries, since decentralised energy, and major system changes, may be under-represented in existing modelling.
For CHP however, another issue has also affected its place in long-term and deep decarbonisation scenarios. CHP using fossil energy resources is efficient, but not zero carbon. In seeking an overall 80% cut in emissions by 2050, the low cost and large potential of low carbon options in electricity provision means that the electricity sector is almost completely decarbonised and fossil-fuelled CHP is phased out over time as the mitigation constraint bites. Figure 2.4 shows the contribution from CHP to total electricity generation for the CCC scenario.
There is some controversy over whether MARKAL modelling deals adequately with CHP. For example, it is important to note that the model seeks to meet a series of endogenously imposed carbon constraints and not to limit cumulative emissions. Previous scenario work shows that CHP could have an important role in the medium term as a transition technology. For example, according to analysis supporting the 2003 Energy White Paper (Marsh et al. 2003), the CHP share of total output increases quite significantly by 2030 compared to 2007 levels. After 2030, the share of total output of CHP diminishes again as the carbon constraint tightens and as other, lower carbon options become available – in this case for example, CCS.
MARKAL (MARKet ALlocation) is a least-cost optimisation model of energy use, which represents the entire energy system, from primary resources to demands for energy services. The model is described as ‘technology rich’, with detail on both costs and other characteristics such as lifetime and efficiency. The assumptions are drawn from multiple sources and extensively peer-reviewed.
The model imposes a cap on overall CO2 emissions and then allows abatement options to compete against each other, limiting those constrained by primary energy supply (e.g. biomass feedstock).
MARKAL does not model non-CO2 GHGs such as methane, nor international aviation. This means that MARKAL cannot model all of the actions needed to meet the targets set out in the climate change act 2008. This has resulted in some uncertainty as to the level of CO2 cuts in the modelled sectors necessary to meet 80% overall. Some scenarios with CO2 reduction above 80% have been run to allow for this uncertainty.
The output generated by the model represents the least cost option under the imposed constraints and presents the evolution of the least cost options over time. The model implicitly assumes perfect foresight therefore MARKAL outputs are not used prescriptively but to inform policy choices. Deviation from MARKAL output in policy terms implies the occurrence of increased cost.
Multiple versions of MARKAL exist, though the outputs informing the LCTP were generated using the MARKAL Elastic Demand (MED) model version.
A more comprehensive explanation of the model can be found in the CCC supporting literature available at: http://www.theccc.org.uk/reports/building-a-low-carbon-economy/supporting-research

Building a roadmap for heat Decarbonisation scenarios and the ‘all-electric consensus’16
Figure 2.4: Electricity generation from CHP from 2000 to 2050 using MARKAL (PJ)
A transitional role for fossil fuelled CHP (without CCS) offers two main benefits. First, conventional CHP can be a cost effective means to deliver reductions of CO2 from heat delivery in the near future, helping limit cumulative emissions over the period to 2050. Second, the development of conventional CHP in the short run may help facilitate the development of CHP and district heating (DHN) supplied by low carbon sources in the longer term future.
The UK has a CHP target of 10 GW by 2010 (Defra 2006). Recent policy developments, notably the extension of Climate Change Levy exemption for indirect sales of CHP electricity in the 2009 Budget, show that in the medium term the UK government expects to provide continued policy support for CHP. It is not clear how, or indeed whether, these short term policies relate to longer term scenarios and we do not consider these issues further here. Instead, Chapter 4 reviews the role of a variety of options that meet heat demands; in particular replacing fossil fuel inputs to CHP with low or zero carbon fuels –biomass, and CCS.
2.2 Summary
Chapter 2 examines some recent scenarios of the energy system out to 2050 for the UK. These scenarios, developed by a range of organisations (DECC, Defra, the CCC and the UKERC) in response to the legally binding target to reduce UK GHG emissions 80% by 2050, were all modelled using MARKAL.
The scenarios have several common elements including; demand reduction through the use of energy efficiency measures such as the insulation of all homes between now and 2030; the decarbonisation of electricity, almost complete by 2030; and significant electrification of transport and heat delivery. All recent scenario modelling efforts result in a great increase in the role of electricity in delivering energy services.
Energy system modelling, using least-cost optimisation tools such as MARKAL, has a number of limitations related to the heat sector. Modelling only considers discrete technologies, does not optimise for diverse solutions and may not reflect the whole-system implications of specific measures chosen. A general conclusion is that decentralised energy, and major system changes, may be under-represented in existing scenario analyses.

17Building a roadmap for heat Heat and the all-electric future
3/ Heat and the all-electric future
Heat plays one of the most significant roles in the current energy mix, accounting for 41% of final energy consumption in the UK. It is expected to remain a significant fraction of energy use in the future to 2050. This gives rise to several significant questions regarding the delivery of heat in a low carbon future. In order to frame the size of this decarbonisation challenge it is necessary to quantify the current role of heat in the energy mix, and investigate the implications for heat delivery in the future.
In this chapter we present the energy flows for the UK energy system in 2007. We then examine the relative share of heat demand across the energy system, and the relative proportions of heat demand within different economic sectors. Finally, this chapter presents the energy flows implied by the CCC 80% CO2 reduction target. This provides a basis from which we highlight the magnitude of the challenge to be overcome in order to transform the UK energy system in the coming years. Energy flow diagrams are used, in this and following chapters, to demonstrate the energy flows both in the current context and for the energy systems implied by 2050 scenarios. A brief description of this type of energy flow diagram can be seen in Box 3.1.
Box 3.1: Energy flow diagrams
3.1 The role of heat in the UK energy mix in 2007
The energy flow diagram in Figure 3.1 presents the energy flows in the UK in 2007, showing energy use by primary energy demand, sectoral breakdown and heat oriented end-use. Data, from the Digest of UK Energy Statistics (DECC 2009c), was used to quantify the energy flows in this figure. Primary energy demand in the UK in 2007 amounted to 237 MTOE.
Petroleum represents over 72% of primary energy supply, but approximately half of this goes to export and shipping fuel. The remaining refined products are largely used in the transport sector, and responsible for approximately 36% of the primary supply going to UK consumption. Natural Gas (43%) and coal (17%) make up the majority of the remainder with electricity from nuclear power or renewable sources (7%) making a smaller contribution. Coal is largely used in electricity generation while natural gas is largely split between power generation and domestic end-use mostly for heat provision.
Heat provision represented 41% of total energy consumption in the UK in 2007 (Figure 3.2). This is a significant share of the energy mix, greater than any other energy end-use including transport. Given the need to almost completely decarbonise this energy use, the scale of the heat decarbonisation challenge is significant. The sectoral breakdown of heat demand demonstrates the dominance of domestic heat demand, 22% of final energy consumption. Industrial and service sector heat demand, at 12% and 7% of final consumption respectively, are also significant. A discussion of these sectors follows, looking at the specific issues of each10.
The energy flow diagrams presented in this report are otherwise known as Sankey diagrams, defined as: “diagram[s] demonstrating graphically and in true proportion the energy flows in a system, starting with the energy sources (inputs) and showing losses...etc.” (DECC 2009b)
Each line in the diagram represents the flow of energy between two points within the system, with the width of the line representing the relative size of the energy flow. They are named after engineer Matthew H. Sankey, the first author to publish work including this type of diagram.
10 The year 2007 has been used as a baseline due to the availability of data. There have, however, been changes in energy consumption since 2007. In general energy consumption has decreased, with consumption in the second quarter of 2009 down 9.5% on the same quarter in 2008. Industrial consumption fell most dramatically (down 19%) but all sectors consumed less in 2009. A large contributor to this trend has been the global economic downturn, though to what extent this trend will rebound is unclear
18 Building a roadmap for heat Heat and the all-electric future
Figure 3.1: Energy flow diagram of the UK in 2007, adapted from (DECC 2009c)
Ene
rgy
flow
cha
rt 2
007
(mill
ions
of t
onne
s of
oil
equi
vale
nt)
Foot
note
s to
flow
cha
rt:
1. C
oal i
mp
orts
incl
ude
imp
orts
of m
anuf
actu
red
fuel
s, w
hich
acc
ount
s fo
r 0.7
mill
ion
tonn
es o
f oil
equi
vale
nt in
200
7.2.
Incl
ude
heat
sol
d.
3. In
clud
e al
l ren
ewab
les.
4. E
xclu
des
5,7
84 k
toe
that
was
con
sum
ed b
y in
dus
trie
s w
ithin
SIC
23
(cok
e, re
fined
pet
role
um p
rod
ucts
and
nuc
lear
fuel
). A
lso
tota
l doe
s no
t inc
lud
e 69
2 kt
oe o
f hea
t sol
d, 2
76 k
toe
of re
new
able
fuel
s (p
red
omin
antly
use
d fo
r ren
ewab
le h
eat),
59
ktoe
of b
last
furn
ace
gas
and
133
kto
e of
cok
e ov
en g
as.
This
flow
char
t has
bee
n p
rod
uced
usi
ng th
e st
yle
of b
alan
ce a
nd fi
gure
s in
the
2009
Dig
est o
f UK
Ene
rgy
Sta
tistic
s, T
able
1.1

19Building a roadmap for heat Heat and the all-electric future
Figure 3.2: Heat demand by sector as a percentage of total energy demand
Source: Energy trends Sept 2009 (DECC 2009d)
Domestic heat demand represents 85% of total domestic energy use. The majority of this heat is delivered by gas (Figure 3.3) through gas boilers. It is possible to partially decarbonise the gas supply through the use of methane derived from biomass products, and through the injection of hydrogen from zero carbon sources to create ‘hythane’. However, the use of biomass feedstocks faces some of the constraints discussed elsewhere (Box 4.1), and the production of hydrogen from zero carbon sources is some way off from being a commercial proposition. For these reasons, these possibilities are not considered further here.
Unless it is possible to decarbonise gas to a very significant extent, it will be necessary to replace almost all of these gas boilers in order to meet CO2 targets. Both gas, as a fuel, and boilers, as heat providers, must be replaced with low carbon alternatives by 2050. Hence the scale of the challenge with respect to domestic heat consumption is significant.
Figure 3.3: Domestic heat demand by fuel as a % of domestic energy demand
Source: Energy Trends Sept 2009 (DECC 2009d)
Domestic energy consumption has changed to an extent in recent history. Heat use per household has decreased and is now 7.5% lower than 1990 levels (Figure 3.4.). This has been attributed to increased insulation in the housing stock, improvements in gas boiler efficiency, smaller average home sizes, and milder winters. Total heat demand however has not decreased to the same extent. This is driven by the increase in overall number of homes in this time period (DECC 2009d). Hence it appears that policies to promote demand reduction can have an impact on consumption. However the modelling efforts described above (Section 2.1) also suggest that efficiency improvements alone are unlikely to be sufficient to meet very deep cuts in emissions.
59%
7%
12%
22%
Other energy consumption
Services
Industry
Domestic
Other energy consumption
Gas
Oil
Solid Fuel
Electricity
6%
7%
16%
69%
2%

Figure 3.4: Changes in total annual domestic heat consumption and annual heat consumption per household
Source: Energy Trends Sept 2009 (DECC 2009d)
Industrial heat demand accounts for 12% of total energy demand (Figure 3.2) and 72% of industry energy demand (Figure 3.5). Gas also plays an important role in the delivery of heat in this sector. Whilst playing a smaller role than heat in the domestic sector, industrial heat has some particular challenges. Process heat, for example, represents 85% of industrial heat demand; generating the high quality heat (notably high and stable temperature) needed for process uses is technically more demanding than lower grade heat needed for space heating. This is a significant challenge, but if industry is to decarbonise then this difficult question needs to be addressed. To give these figures context, total industrial heat demand equals 19.6 MTOE (Figure 3.1), equal to half the national coal demand in 2007.
Figure 3.5: Industrial heat demand by fuel as % of industrial energy demand
Source: Energy trends Sept 2009 (DECC 2009d)
Building a roadmap for heat Heat and the all-electric future20
Other energy consumption
Gas
Oil
Solid Fuel
Electricity
38%
14%
32%
11%
5%

Figure 3.6: Service sector heat demand by fuel as % of service sector energy demand
Source: Energy Trends Sept 2009 (DECC 2009d)
These three sectors have some things in common. The demand for heat is the greatest energy demand in all three sectors. Gas, as a principal means of heat delivery, is also a common feature. There are clear challenges with regards to the delivery of heat in 2050. The challenge of an 80% reduction target necessitates an entirely new heat delivery system within the UK. It seems unavoidable that gas boilers are displaced by some combination of decarbonised heat delivery systems in the future. The remaining question is therefore; which combination of heat delivery systems is the most appropriate for achieving a low carbon future?
3.2 Energy flows in the ‘all-electric world’
The energy system in 2050 is significantly altered under the common assumptions presented in all-electric scenarios. In particular, final energy consumption in 2050 will be reduced by 46% against 2007 figures under the assumptions used in the CCC 80% CO2 reduction scenario, which we use here as a representative of the range of all-electric scenarios reviewed in Section 2.1. To demonstrate the changes to energy flows implied by this scenario, we have developed the energy flow diagram presented in Figure 3.7.
The creation of an energy flow diagram based on a future energy scenario is not a straightforward process. Many of the underlying assumptions regarding the efficiency of electricity generation technologies, or the precise mix of those generation types and fuel sources, are not explicit in the published work. It was possible to obtain a fuller record of modelling results for some of the scenarios. Using data obtained from the CCC secretariat, and through personal communication with analysts responsible for the modelling, it was possible to begin populating a diagram of the flows through the UK energy system implied by the CCC 80% CO2 reduction scenario. First, primary energy supply and its flow destination were interpreted.
• Oil is assumed to pass through refinery process and on to transport, industry and service sector end-use. No petroleum losses are indicated in the data, and therefore, are not represented in the diagram;
• Fossil fuels and primary electricity go to electricity generation, with a proportion of gas going straight to sectoral end-use;
• Electricity output was also taken from the modelling data, with the difference between reported primary energy supply and electricity output used to represent conversion losses;
• Biomass conversion to various fuels is grouped together in line with the petroleum stream, and passes through a ‘transformation’ stage, representing the range of processes through which biofuels are produced;
Building a roadmap for heat Heat and the all-electric future 21
11 Full detail of the assumptions discussed here can be found in the Technical Annex.
Other energy consumption
Gas
Oil
Solid Fuel
Electricity
39%
0.06%
43%
6.2%
12%

• Finally, additional analysis was undertaken in order to disaggregate the share of energy going to different end-uses by sector11.
When comparing the UK energy system in 2007 with that implied in Figure 3.7 there are several significant points.
• First, though overall energy demand has fallen by 46%, electricity production increases from 29.3 MTOE to 37.7 MTOE, with installed capacities approximately doubling over the period from around 80GW to over 150GW. This represents a shift in the proportion of electricity from 18% of final consumption in 2007 to 42% in 2050;
• This elevation in electricity production is achieved through increase in all sources of production. The installed capacity of renewable energy such as wind power and hydropower increases from 8.5 GW in 2007 to around 48GW in 2050. Conventional coal plant is almost completely phased out by 2050, with over 27GW of new coal plant with CCS built over the same period. Installed capacity of gas plant increases from around 24 GW in 2007 to 53GW in 2050, of which 13GW is fitted with CCS;
• Power station fossil fuel demand in 2050 is 47 MTOE, down by 27% on 2007. As a result, conversion losses relating to electricity generation are 27 MTOE. This is a decrease of 26.1 MTOE;
• The increase in electricity demand in 2050 is driven primarily by the needs for decarbonised transport and heat. Overall, space heating demand has been more than halved, from 36.1 MTOE in 2007 to 19.1 MTOE in 2050. The energy vector has changed, however, with the majority of heat energy coming from electricity in 2050, rather than gas used in 2007. This is largely delivered through the installation of ground and air source heat pumps, which replace gas condensing boilers between 2020 and 2050. This change is facilitated by the heavy insulation of the building stock in the period up to 2020, and the decarbonisation of the electricity system which is largely complete by 2030. Small quantities of other heat delivery, such as solid fuel burners, are also seen in 2050;
• Finally, the installed capacity of combined heat and power (CHP) plant in 2050 is 0.5GW, producing 0.15MTOE of electricity and 0.7 MTOE of heat to domestic and service sectors.
The scenario can be summarised, therefore, as having greatly increased electricity generation; servicing additional transport and heat, with large quantities of conversion loss, mostly as waste heat from centralised fossil-fuelled power stations. The challenges to achieving this all-electric scenario are significant. The transformation of the electricity system and build rates implied by the all-electric scenario are dramatic and without precedent. In the next section we consider some of the challenges in more detail.
Building a roadmap for heat Heat and the all-electric future22

Figure 3.7: Energy flow diagram of Committee on Climate Change 33/80 scenario for UK in 2050
Building a roadmap for heat Heat and the all-electric future 23
Ene
rgy
flow
cha
rt 2
050
(mill
ions
of t
onne
s of
oil
equi
vale
nt)
Ass
ump
tions
:1.
Ass
umed
that
gas
will
mee
t tot
al c
ooki
ng/c
ater
ing
dem
and
and
the
rem
aini
ng g
as w
ould
then
be
used
to m
eet s
pac
e he
atin
g en
d-u
se.
2. P
rop
ortio
nalit
y of
gas
to e
lect
ricity
in fi
nal e
nerg
y co
nsum
ptio
n of
ind
ustr
ial s
ecto
r is
used
to e
stim
ate
fuel
mix
in in
dus
tria
l end
-use
s.
3. A
ssum
ed th
at to
tal p
etro
leum
pro
duc
t will
be
cons
umed
in p
roce
ss e
nd-u
se. 4
. Ass
umed
that
ene
rgy
avai
lab
le fr
om o
ther
tran
sfor
mat
ions
will
be
cons
umed
in o
ther
end
-use
. 5. A
ssum
ed th
at h
eat f
rom
CH
P
will
be
used
in o
ther
end
-use
s of
of a
gric
ultu
re e
nd-u
se.
Foot
note
s to
flow
cha
rt:
1. P
rop
ortio
nalit
y of
200
7 en
d-u
se e
nerg
y co
nsum
ptio
n is
use
d to
est
imat
e fin
al e
nerg
y co
nsum
ptio
n. 2
. Pro
por
tiona
lity
of 2
007
Ene
rgy
Ind
ustr
y U
se. N
on-E
nerg
y U
se a
nd D
istr
ibut
ion
Loss
es is
use
d to
es
timat
e. 3
. Los
ses
incl
ude
Pow
er S
tatio
n C
onve
rsio
n Lo
sses
and
are
est
imat
ed o
n th
e b
asis
of d
iffer
ence
bet
wee
n en
ergy
sup
ply
and
fina
l ene
rgy
cons
ump
tion.
4. O
ther
Tra
nsfo
rmat
ions
incl
udes
fuel
suc
h as
B
iod
iese
l, E
than
ol, H
ydro
gen
(from
Gas
and
Ele
ctro
lysi
s), B
io-W
aste
, Sol
id B
iom
ass,
etc
.
This
flow
char
t has
bee
n p
rod
uced
usi
ng th
e R
esul
ts o
f Sta
ge 1
&2
of C
CC
MA
RK
AL
ME
D P
h2_1
0110
8 fo
r UK
ER
C

3.3 Criticalities in the ‘all-electric’ energy system
Higher electricity consumption, under the all-electric future, will affect all components of the UK electricity sector. If electricity can be entirely decarbonised, the positive aspects of such a system are clear. There are, however, several issues associated with the transition to an all-electric economy. Issues such as the rate at which low carbon generation can be built, or the practicalities of insulating the building stock and retro-fitting electricity based heating systems, are fundamental challenges. This section highlights some of the key difficulties in implementing the all-electric future.
3.3.1 Primary energy needs, system efficiency and roll-out of low carbon generationAll of the low carbon scenarios discussed in section 2.1 rely on a high proportion of thermal generation of electricity from fossil fuels (with CCS) and nuclear power. This gives rise to a range of problems, including exposure to fossil fuel price volatility, the availability of primary resources and appropriate storage sites for CO2 and nuclear waste. Most of these scenarios prioritise decarbonisation over efficient utilisation of available resources. As a result they are all, to a greater or lesser extent, subject to the paradox that they use more fossil fuel than if the scenario were optimised to maximise energy efficiency and minimise losses in power generation. There are two main reasons for this: first CCS consumes energy and reduces overall thermal efficiency; second, the scenarios contain a substantial amount of thermal power generation (fossil fuels and nuclear power) but make very limited use of CHP to reduce thermal losses (waste heat from power stations). The use of electric heat pumps goes some way to compensate for the relative inefficiency of electric only power generation, since heat pumps extract ambient energy from the environment (air, ground or water), delivering more energy in the form of heat than is input in the form of electricity (see Box 4.1). In many cases, the overall efficiency by which an energy system provides heat and electricity using electric heat pumps is comparable to that using CHP.
The ability of heat pumps to extract heat from surrounding ground or air (the coefficient of performance COP) may be as high as 4 to 1. However, in practice the Seasonal Performance Factor (SPF) or Seasonal Efficiency, defined as the useful thermal energy delivered over the year divided by the electricity input over a year may be a more useful measure. This is typically lower than the COP measured at any one point in time. (Dickinson 2009) cites results from a study of 217 heat pump installations in the US, assessed for total energy use throughout the year. On average, the SPF was found to be approximately 2 to 1. There are alternative design options for heat pump systems to meet space heating and domestic hot water demands. It is possible to specify a heat pump system to meet the full demand, including peak loads. However, heat pumps are not well suited to meeting instantaneous loads, and thus such systems require large water tanks and careful sizing and optimisation. As Dickinson 2009 notes, an alternative approach is to include an additional method of heating (typically a resistance heater) to meet building needs at times of low external temperature (when heat pump performance would be very low), to meet short term peaks and other supplementary needs. Meeting some portion of the load with an electrical resistance heater will reduce the overall SPF of the domestic system.
The all-electric scenarios also require major penetration of new low carbon capacity – nuclear power, fossil generation with CCS and renewables. The scale of development implies extremely aggressive build rates when compared to historical precedent.
The all-electric scenario implies total capacity increases of 74 GW between now and 2050. This includes:
• 13 GW of new nuclear power by 2050;
• 35 GW of new renewable wind capacity by 2050;
• 27 GW of coal generation with CCS in the period between 2020 and 2050;
• 13 GW of gas generation with CCS is built in the all-electric scenario; and,
• An extra 20GW of gas without CCS in 2050.
Building a roadmap for heat Heat and the all-electric future24

Dramatic build rates are not without precedent, 10 GW of gas-fired CCGT generation was built during the first four years of the ‘dash for gas’ (Winskel 2002). Build rates for wind power in excess of 3 GW per year have been delivered in many countries including Germany, Spain, China and the US. However, UK experience has not always been so favourable. For example UK installed capacity of nuclear power increased by 7 GW in the 33 years between 1974 and 2007 (ESDS 2009), and the period between 2004 and 2008 saw installed capacity of wind in the UK increase by just 2.5 GW (DECC 2009c). It is also important to note that some low carbon options are relatively unproven, with devices in the demonstration and testing stage of development. Large-scale roll-out will also require sustained support for innovation and deployment.
Finally, the sheer scale of the new electricity generation capacity implied by the ‘all-electric’ scenarios will have a major impact on the physical landscape, which may exacerbate problems already faced by new power generation projects in the UK. The development of large-scale renewable generation in the UK (primarily wind power) has been significantly hampered by local opposition, manifested through objections to planning applications, and the resultant delays in the planning approval process (House of Lords 2008b). The Planning and Energy Bills of 2008, and the changes to the obligations on local authorities (DECC 2009e; DECC 2009f), are an attempt to expedite the approval process for large-scale generation projects (including large wind farms and nuclear), but this does not, of course, make potentially vociferous local opposition ‘go away’ – it merely provides a legal mechanism whereby such opposition can be given less weight in the decision making process.
3.3.2 Network requirementsThe changing generation profile will require major reinforcements to the electricity transmission and distribution networks. This will include:
• Investment in additional electricity transmission capacity, connecting the large increase in generating capacity to centres of electricity demand;
• Investment in the distribution grid, which must cope with increased load from heat pumps and electric cars, allowing two-way power flows and control, and the connection of distributed generation. There may be a need for upgrading work in many areas, which has the potential to be disruptive to road transport and other services;
• Installation of smart metering, allowing the management of electricity demand data.
National Grid has classified the UK in terms of required reinforcements. Under this classification the Scottish transmission network is already considered to be operating at capacity and is not currently fit to handle immediately anticipated electricity demand increases. Meeting future demand will require major reinforcements (National Grid 2009).
The Electricity Networks Strategy Group (ENSG 2009) set out a transmission reinforcement plan for 2020 that would be able to cope with all-electric scenarios. The plan concluded that the Scottish transmission network would need large investment in various areas of the transmission system in order to fulfil a scenario where 11.4GW of extra electricity generation were connected. A recent Ofgem consultation document estimated that required investment in the GB transmission and distribution network could be as much as £53.4bn between now and 2025 (Ofgem 2009). This cost reflects the difficulties in transmission and distribution described above. In addition the report estimates the installation coast of smart meters to be £10bn over the same period.
The scenarios reviewed in Chapter 2 may also require the installation of a smart distribution grid. Given the increased electricity demand associated with these scenarios, the grid will need the capacity to handle greater loads, and to manage peak loads. This includes the capacity to handle increased levels of distributed generation. Finally, the installation of smart metering will also be required in order to manage data exchange between the end-user and the utility provider, facilitating the ‘smart’ management of end-user electricity demand.
Building a roadmap for heat Heat and the all-electric future 25

3.3.3 Power flows, peak loads and plant utilisationUnder the present mix of generation technologies, nuclear and renewable power plants with very low or negligible marginal costs will typically run whenever they are physically able to do so, and fossil-fired thermal plants will supply the remaining baseload and fulfil the load-following requirement to match the diurnal demand cycle (Gross et al. 2007). Achievement of a largely decarbonised, all-electric future has significant implications for the utilisation of generation capacity, because a very large installed wind capacity will compete with nuclear for baseload supply (net of the flexible generation required to provide system balancing and reserve), leaving much fossil-fired generation running at very low, possibly uneconomic, average load factors. At times of high wind output and low demand, nuclear and/or wind power may also need to be constrained, which, whilst technically possible, has major implications for their per unit generations costs.
In addition to economic implications of generators ‘chasing baseload’, the pattern of electricity demand may change. Heat demand, largely supplied by electricity, will add considerably to the peaks in electricity demand unless there are mechanisms (technical, economic or behavioural) to shift these peaks to lower-demand times in the diurnal cycle.
Air source heat pumps in particular have a peak electricity demand of up to 5 kW. This is because these types of heat pumps usually incorporate a resistive heating element to supplement heating requirement under peak load conditions. This could have a profound impact on the electrical capacity needed to meet peak power demands. As an illustration, if 10 million homes replaced their gas boilers with air source heat pumps, each with a 5 kW peak load this would have the potential to create up to 50 GW of additional electricity demand. Since heat pumps operate least efficiently and default to resistive heating when the outside temperature is cold and demands for heat also occur when it is cold, ‘heat pump peaks’ are likely in winter when peak electricity demand occurs. If heat pumps are also operated on a time of day cycle similar to today’s central heating timers, the additional demand would coincide with current morning and evening demand increments. Peak demand in Britain is around 60GW (National Grid 2009), so, in the worse case, installing air source heat pumps in around half of all the UK’s houses could almost double peak electricity demand.
Of course, the precise number, nature, rated capacity and timer settings of heat pumps in 2050 is a matter of speculation. It is possible that householders, with highly insulated homes, will be persuaded to alter the way they operate their home heating systems and avoid a time of day peak (see below). The precise impact on demand peaks is, therefore, impossible to quantify, but the order of magnitude of the potential impact is clear, and is clearly very large.
3.3.4 End-user issues – behavioural obstacles to high penetration of domestic efficiency measuresThe viability of an electricity dominated energy future relies on achieving very substantial improvements in the end use of energy, notably on reducing demands for heating. In particular this will include the following key problems:
• The need to achieve a major roll-out of insulation in order to reduce demand and facilitate a move to electricity based heat systems;
• The potentially disruptive retrofitting of heat pumps;
• Changes to demand patterns.
Insulation of buildings is an important step in order to reduce domestic energy demand and may be prudent in our attempt to decarbonise. In addition, in order to make a transition to electricity based heat provision using heat pumps, high levels of insulation are necessary. Given the relatively low output temperatures usually associated with ground and air source heat pumps, achieving a sufficient level of thermal comfort using heat pumps is contingent on a high level of building insulation.
Building a roadmap for heat Heat and the all-electric future26

The installation of heat pumps is another area potentially unpopular with end-users. It is suggested that the most efficient way to achieve sufficient thermal comfort is through the installation of under floor heating systems, increasing the thermal surface area of the heating system and improving heat delivery. Under floor heating is already popular for new build, but obviously presents greater disruption for retrofit.
Both the installation of insulation and of heat pump systems is complicated by the dynamics of the housing stock. Installing these systems in modern homes or homes with cavity walls may be a relatively simple and non-disruptive process. However, around 80% of the 2050 housing stock is likely to be currently existing housing stock (Boardman 2007) and 7 million of these homes are of solid-wall construction (EST 2009b). Since internal solid wall insulation reduces the internal space of homes, and requires disruptive work, it may be difficult to persuade end-users to accept this transition.
Finally, it has been suggested that behaviour in utilisation of heat be altered in order to achieve the optimal benefit from heat pump systems. This behavioural change may also be an important factor in dealing with the issues of peak electricity demand discussed in section 3.3. Given the efficiency characteristics of heat pumps, and the planned improvement to building envelope insulation, heat pumps could operate 24 hours a day, relying on the building fabric as a heat store (a capacity that innovative insulation materials may be able to enhance). This would maximize the efficiency of heat pumps, most efficient when operating continuously, and minimize the issues associated with peak electricity demand. However, it is not yet clear whether end-users can be convinced to adopt this new behavioural pattern and/or how it relates to perceptions of thermal comfort (for example householders may in fact prefer a cooler night time temperature).
Table 3.1: Summary table of criticalities
Energy System Area Criticalities
Primary Energy and Low Carbon Generation Extra exposure to fossil fuel price; efficiency of electricity generation; build rates; maturity of technologies; public acceptance
Network requirements Investment in: transmission lines; distribution system; installation of smart metering
Power Flows and Plant Utilisation Higher peak electricity demand; Economics of fossil-fired plant with low load factors
End-User Issues Need for: roll-out of insulation; retrofitting of heat pumps; management of consumer behaviour
3.4 Summary
Chapter 3 examines heat and its role in both the present and its potential place in the all-electric future. Heating services constitute 41% of final energy demand, the largest single component of UK energy demand in 2007 and heat demand is expected to play a significant role out to 2050. Energy flows in the all-electric scenarios are reduced in absolute terms relative to 2007. However, electricity demand increases substantially, and because the all-electric scenarios envisage a large amount of thermal generation with CCS and a small role for CHP the proportion of conversion losses also increase.
Finally the all-electric future is contingent on progress in critical areas such as build rates for power generation, management of intermittent generation and delivery of a robust electricity transmission system with peak electricity management capability. In addition, issues of behavioural change and end user disruption may impede implementation.
Building a roadmap for heat Heat and the all-electric future 27

Building a roadmap for heat An integrated scenario for meeting heat demand in a decarbonised future28
4.1 Introduction
This chapter considers alternatives to the ‘all-electric’ scenarios reviewed in Chapter 2. It seeks in particular to explore the potential to make efficient use of primary resources and reduce the share of electricity in providing the UK’s heat requirements. A range of options exist to deliver low carbon heat, including greater use of renewable heat options such as solar and biomass, and decarbonisation of the natural gas supply. Chapter 3 highlights the inefficiencies in the ‘all-electric’ system that are a result of the energy lost from thermal power generation in the form of waste heat. The use of heat pumps can improve system efficiency, but gives rise to problems associated with peak demand and may be difficult to implement in a large enough number of dwellings. Our focus here is, therefore, on the potential to maintain, or improve, systemic efficiency, and diversify the means by which we meet heat demand through an expanded role for CHP and District Heat Networks (DHN), and to a lesser extent, greater use of biomass. We refer to the scenario described below as the integrated scenario. It is purely illustrative and has not been subject to detailed scrutiny in terms of cost effectiveness or operating characteristics. It is not a definitive scenario, a wide range of possibilities exists both in terms of the total utilisation of CHP, from biomass and on CCS plants and in terms of the mix of fuels for CCS-CHP (we focus here only on gas-fired CCS-CHP). Nevertheless, it does offer a reasonable and practical alternative means by which a significant fraction of the heat required in 2050 can be provided, which is low carbon and reduces primary energy demand relative to the ‘all-electric’ scenarios described above.
The project team have assessed the practical potential for large-scale district heating from power stations fitted with CCS and reviewed the roles of industrial CHP and biomass. The chapter begins with an exposition of the process through which we define these potentials. This is in part based on a review of the relevant technologies, which are summarised in Box 4.1. We then present an energy flow diagram of this integrated scenario, highlighting the differences in comparison to the all-electric scenarios. Finally, we discuss the implications of this integrated scenario for the criticalities identified in Chapter 3.
Box 4.1: Review of lower carbon heat technologies
4/ An integrated scenario for meeting heat demand in a decarbonised future
Passive Solar methods in building design can be used in to increase the overall efficiency of the building and heating system. Estimates of passive solar potential in the UK are approximately 1.38 MTOE, representing approximately 4% of current domestic heat demand (AEA 2007).
Heat Pumps are a potentially efficient form of electrical heating. They make use of a diffuse heat source, such as the ground or the air, and use electricity to concentrate that heat through a process similar to refrigeration in reverse. Whilst the ratio of heat output to electrical input may typically be of the order of 2 - 4 to 1 (House of Lords 2008a), efficiencies are lowest when the external temperatures are also low (and heat demand is therefore high). Output temperatures are such that high levels of insulation may be necessary in order to achieve desired levels of thermal comfort (EST 2009a). Seasonal Performance Factor or Seasonal Efficiency, in practice is typically between 2 to 1 and 3 to 1 (Dickinson 2009). It is possible to specify a heat pump system to meet the full demand, including peak loads. However heat pumps are not well suited to meeting instantaneous loads, and thus such systems require large water tanks and careful sizing and optimisation. Under very cold conditions resistance heating may be used to supplement heat pump output, significantly reducing efficiency (Byun et al. 2008), and contributing to additional peak electricity loads.
Micro-CHP technologies such as gas-fired Stirling engines or fuel cells can produce heat and electricity simultaneously and therefore have the potential to be lower carbon than conventional heat-only technologies. However, the availability of low carbon fuel sources dictates whether these technologies are sufficient to achieve ambitious carbon reduction targets. Biomass, for example, is a suitably low carbon fuel, though there are questions surrounding the availability of biomass in sufficient quantities to meet domestic heat demand.

Building a roadmap for heat An integrated scenario for meeting heat demand in a decarbonised future 29
4.2 Creating an integrated scenario
The objective for this integrated scenario is to seek out opportunities to diversify heat provision and reduce thermal losses relative to the all-electric futures described above. The project team used the CCC 80% scenario as its ‘base case’, and analysed the energy flows through the CCC 80% scenario. The team then sought out a plausible potential to meet demands for heat through CHP generation with CCS and via biomass, utilising district heating networks (DHNs). We describe the process by which this scenario was developed in the form of three steps:
1. Which CHP generation technologies could be used in the future and what are their efficiencies12?
2. Which electricity generation and heat delivery technologies could be displaced?
3. To what extent could domestic and industrial heat demands be met through CHP and DHN?
4.2.1 Potential for CHP from biomass and CCSWaste heat arises from three main sources of thermal generation: nuclear energy facilities, coal-fired power stations; and gas-fired power stations. Since public acceptance of DHNs supplied from nuclear power stations may be problematic, the possibility of utilising this waste heat is discounted in the integrated scenario. The potential to utilise waste heat from coal and gas-fired power stations, however, has a proven track record in many countries and was, therefore, deemed tractable for the integrated scenario.
The carbon emissions from coal or gas-fired CHP can be abated either by use of biomass derived fuels (including biogas solid waste or other solid biomass), or through carbon capture and storage (CCS) technologies. We examine the potential for both of these decarbonised CHP options in turn below.
District Heat Networks (DHNs) deliver heat from medium/large-scale CHP or heat-only boilers to homes or businesses. Currently heat transmission networks can be built up to around 30km from generating plant and distribution networks can be hundreds of kilometres long (Mattias 2009). Conventional forms of district heating run at a temperature sufficient to run building heating systems directly. It may also be possible to use heat pumps to ‘upgrade’ lower temperature systems, which offers higher efficiency. In either case, installing such networks represents a major infrastructure development (and cost), with incorporation into new developments much easier than retrofit of existing communities. Heat from typical fossil fuel CHP plant delivered through DHNs is not sufficiently decarbonised to meet an 80% reduction target, although this may be able to be addressed through the use of CCS-CHP or biomass fuelled CHP.
Solid fuel boilers burning biomass such as wood have the potential to be very low carbon. However the potential scale of application is assumed to be relatively limited, due to the difficulties of managing the solid fuel feedstock, and hence obstacles to mass market uptake as a primary source of building heating. Biomass heating in the UK domestic sector currently accounts for 0.02MTOE, or 0.6% of UK domestic heating demand (AEA 2007).
Geothermal heat can be exploited by pumping water through boreholes in sub-surface rock, where local geology provides sufficient access to the warmth of the underlying layers. Heated water arising at the surface can be used to heat homes through heat networks (see above). While geothermal heat is very low carbon, the UK practical potential is very low (AEA 2007).
12 Micro-CHP technologies have not been considered here, though, should these technologies be provided with suitably low carbon fuels, they could contribute to the heat and electricity demands of an 80% decarbonised future. The scenario also excludes the use of extra conventional (unabated) fossil fuel CHP plant. Widespread utilisation of conventional fossil fuel CHP is not compatible with an 80% carbon reduction scenario. However, as discussed in Chapter 2, CHP technologies may provide both early carbon reductions and facilitate the development of the low carbon CHP options discussed below.

30
BiomassThe CCC 80% scenario prioritises biomass for the production of transport fuel (Figure 3.7). We assess the potential for additional biomass in 2050. The biomass/waste energy deployed in the CCC 80% scenario is 12.7 MTOE. There is evidence to suggest that there may be potential to make greater use of bioenergy than the amount presented in the CCC 80% scenario:
• The 2007 UK Biomass Strategy (Defra 2007) estimated that the potential of the biomass resource in 2020 would be around 8.3 MTOE with predicted theoretical biomass resource of about 10 MTOE;
• Recent work for DECC on Biomass Supply Curves (DECC 2009f) estimates that the biomass resource from UK could reach around 10% of current UK primary energy demand by 2030, or 23.7 MTOE;
• Similar estimates are also made by the European Environment Agency (EEA 2006), who estimate the environmentally compatible bioenergy potential of the UK to be 13.5 MTOE in 2010, 19.0 MTOE in 2020 and 24.5 MTOE in 2030.
Based on this evidence, it seems reasonable to suggest that sufficient biomass resource exists for the integrated scenario to consider a fraction for CHP over and above the volumes going to transport in the CCC 80% scenario. There is potential to increase the role for bioenergy much further through importing biomass, but exploring all the issues related to biomass is far beyond the scope of this report. Limiting ourselves to domestically arising biomass, and seeking a cautious approach, we adopt the 2020 resource penetration potential from the UK Low Carbon Transition Plan and assume that this remains constant out to 2050, which results in bioenergy potential of 17.9 MTOE.
CHP-CCSA combination of CHP and CCS technologies is increasingly discussed as a way of regaining some of the efficiency lost through the carbon capture process (Vattenfall 2009). First we must consider the conversion efficiency of such technologies in 2050: Integrated gasification combined cycle (IGCC) is a coal technology which can be fitted with both CHP and CCS functions. In this case combined efficiencies for both heat and electricity generation can reach approximately 58% (Ng et al. 2009) (compared to overall efficiencies for coal-fired CCS without heat capture of 32-40% (Damen et al. 2006; Descamps et al. 2008)). Efficiencies for gas are considerably higher; research suggests that natural gas combined cycle combined heat and power (NGCCCHP) can achieve 84-88% total efficiency (Kuramochi et al. 2009).
With the goal of improving whole system efficiency we assume the following:
• That CHP technologies are combined with gas-fired CCS plant with efficiency of 86% and a heat power ratio of approximately 1:1;
• That the displaced electricity generation is coal-fired;
• That the heat generated from CHP plants will substitute for electricity-based heat provision in houses and commercial properties using resistance heating or heat pump systems.
The focus on gas-fired CCS was chosen as it is most consistent with the objective to improve overall efficiency and reduce losses. CHP technologies could, instead, be added to coal-fired power stations first, though this may decrease the level of efficiency improvement. Future work could explore the potential for coal-fired CCS-CHP to reduce emissions and diversify the generation mix.
Building a roadmap for heat An integrated scenario for meeting heat demand in a decarbonised future

31Building a roadmap for heat An integrated scenario for meeting heat demand in a decarbonised future
Modelling CHP-CCS with District HeatingQuantifying the potential role of CHP with CCS creates the practical problem of how to deal with carbon transportation. Where do the likely sequestration reservoirs exist and where will CCS-CHP plant be located? Many of the likely geological repositories for CCS are under the North Sea, off the east coast of the United Kingdom, and large population centres also exist along or near this coast. The project team, therefore, identified sites of existing power generation near to the east coast of the UK; formed a view on the potential for generation in suitable locations to expand; and developed a methodology to assess the potential to link such CHP-CCS plants to heat loads in nearby conurbations. The geographical locations of the CCS plants in the all-electric scenarios are not specified. By 2050, it is possible to envisage an integrated network of CO2 pipelines running across the country. It is, therefore, possible for CO2 pipelines to run from power stations located further west and, hence, to support the development of a larger array of CCS-CHP schemes. Investigating these possibilities would be an important opportunity for future work.
With regard to the domestic sector, we must define a proportion of that sector which can be serviced through DHNs. Current potential has been estimated as 14% of the UK’s building heat demand, though estimates tend not to report future potential, particularly out to 2050 (Poyry & Faber Maunsell 2009). There is a paucity of studies examining future potential of CHP and DHNs, and this is likely to be a valuable area for future work.
Having defined generation locations, we can then begin to estimate catchments surrounding locations where CHP and DHN could be constructed. Modern DHNs have been constructed over distances up to around 30 km with complex local networks extending this range into population centres (Mattias 2009). DHNs constructed in Sweden demonstrate the feasibility of maintaining DHN temperatures over such distances and could provide a model for the UK. We can then apply an assumed network distance to the feasible catchments for future DHN networks in the UK. For the purposes of this study a 30 km radius is used. Based on population density data, these catchments can then be converted into estimates of DHN delivery potential.
We follow a procedure similar to that outlined by the Institution of Civil Engineers (ICE) in a study of the near term potential for district heating (ICE 2009). DECC gas consumption data for England and Wales and existing and planned fossil fuel power plants have been incorporated into a GIS database. We then implement the above constraints and identified 23 potential sites that meet conditions related to location of CCS infrastructure and presence of existing power stations.
A circumference with a 30km radius is superimposed around each of the 21 power station locations on the GIS output. The heat demands from all population dense zones within each radius are added up. This method also replicates the procedure followed by ICE, with the modifications being the radius chosen (up to 10 km for ICE’s 2020 study), and the number of sites considered feasible.
Industrial CHPIt is also possible for CHP systems to meet a fraction of industrial heat and electricity demand. Some estimates of current industrial CCGT CHP potential have suggested that as much as 16 GWe of extra CHP capacity could be installed (Poyry 2008). This estimate is based on analysis of existing industrial clusters and their electrical and heat demands. It seems reasonable to assume, therefore, that provided industrial planning policy focuses on the potential for CHP in all new industrial development we could reach at least this level of installed capacity in 2050. If we take Poyry’s ‘pessimistic assumption’ about electricity and heat capacity and assume a load factor of 60% this means we may consider industrial potential for CHP to be 5.2 MTOE electrical and 3.8 MTOE thermal.
The magnitudes of waste heat utilisation and primary resource reductions can then be calculated through the assumptions regarding technological efficiency of CHP and the conventional thermal generation technology being displaced. The results are presented in Figure 4.1. The assumptions made at each stage in this process are presented in the Technical Annex.

32 Building a roadmap for heat An integrated scenario for meeting heat demand in a decarbonised future
4.2.2 Quantifying the integrated scenarioBased on the judgements, assumptions and methods described above, the integrated scenario unfolds as follows:
• By the year 2050, we have built large-scale CHP facilities in 23 locations along the east coast of the UK supplying 4.18 MTOE of heat and 3.97 MTOE of electricity to the UK. The plant installed is efficient gas-fired plant with CCS providing a combined electricity and heat efficiency of 86%;
• DHNs have been constructed, delivering heat from our additional CHP plants to population centres, representing 14% of heat demand in the domestic sector. The availability of district heating for many consumers has reduced the demand for other heat delivery technologies such as heat pumps, reducing the domestic demand for electricity by 1.9 MTOE. In industry, electricity demand has also been reduced, and is now 2 MTOE less than expected under typical all-electric assumptions;
• Smaller scale biomass-burning CHP plant has been installed to service heat and electricity demand in areas not serviced by a CO2 sequestration network. This plant will produce 3.67 MTOE of heat and 0.48 MTOE of electricity;
• By increasing the efficiency of the electricity generation system, the scenario has been able to reduce demand for primary resources by 5%. As a further result of this efficiency increase, conversion loss has been decreased by 8 MTOE.
Overall, these reductions equate to a 13% reduction in electricity demand against the CCC 80% scenario. Since primary energy demand has been reduced, and CHP carbon emissions captured, system CO2 emissions have remained within the constraint of the all-electric scenario, meeting current CO2 emission reduction commitments.
The integrated scenario has changed only those conditions which pertain to the efficiency gains associated with applying CHP and DHN technology to biomass and CCS plants. Other scenario assumptions are held constant, and derived entirely from the CCC 80% scenario. This includes the completion of deep insulation to most building stock by 2030, the capture and storage of all feasible emissions from coal plant in 2050, and the installation of efficient heat pump technologies for most homes not connected to DHNs. There is also a role for small scale CHP, which constitutes 0.9 MTOE in the CCC 80% scenario. Future work could quantify the implications of relaxing certain assumptions for building stock efficiency in the light of the potential for CHP-DHN to reduce system wide emissions.
The energy flow diagram representing the scenario described above, is presented in Figure 4.1
The integrated scenario will create many challenges. DHNs must be built and connected to people’s homes, which is likely to involve considerable disruption to streets and domestic premises. CHP-CCS facilities must be developed and built in suitable locations, traversing the challenges of the planning process, cost minimisation, and timely delivery. Conversely, the scenario may also offer a number of benefits for the energy system and its management. The following section addresses these issues in some detail.

33
Figure 4.1: Energy flow diagram of the integrated scenario
Building a roadmap for heat An integrated scenario for meeting heat demand in a decarbonised future
Ene
rgy
flow
cha
rt 2
050
(mill
ions
of t
onne
s of
oil
equi
vale
nt)
Ass
ump
tions
:1.
Ass
umed
that
gas
will
mee
t tot
al c
ooki
ng/c
ater
ing
dem
and
and
the
rem
aini
ng g
as w
ould
then
be
used
to m
eet s
pac
e he
atin
g en
d-u
se.
2. P
rop
ortio
nalit
y of
gas
to e
lect
ricity
in fi
nal e
nerg
y co
nsum
ptio
n of
ind
ustr
ial s
ecto
r is
used
to e
stim
ate
fuel
mix
in in
dus
tria
l end
-use
s.
3. A
ssum
ed th
at to
tal p
etro
leum
pro
duc
t will
be
cons
umed
in p
roce
ss e
nd-u
se. 4
. Ass
umed
that
CH
P h
eat w
ould
rep
lace
ele
ctric
ity. 5
. Ass
umed
that
CH
P h
eat w
ould
be
used
in s
pac
e an
d w
ater
hea
ting
end
-use
s to
rep
lace
hea
t pum
ps
of s
easo
nal e
ffici
ency
2..
Foot
note
s to
flow
cha
rt:
1. P
rop
ortio
nalit
y of
200
7 en
d-u
se e
nerg
y co
nsum
ptio
n is
use
d to
est
imat
e fin
al e
nerg
y co
nsum
ptio
n. 2
. Pro
por
tiona
lity
of 2
007
Ene
rgy
Ind
ustr
y U
se. N
on-E
nerg
y U
se a
nd D
istr
ibut
ion
Loss
es is
use
d to
es
timat
e. 3
. Los
ses
incl
ude
Pow
er S
tatio
n C
onve
rsio
n Lo
sses
and
are
est
imat
ed o
n th
e b
asis
of d
iffer
ence
bet
wee
n en
ergy
sup
ply
and
fina
l ene
rgy
cons
ump
tion.
4. O
ther
Tra
nsfo
rmat
ions
incl
udes
fuel
suc
h as
Bio
die
sel,
Eth
anol
, Hyd
roge
n (fr
om G
as a
nd E
lect
roly
sis)
, Bio
-Was
te, S
olid
Bio
mas
s, e
tc. 5
. CH
P s
tatio
ns in
clud
e B
iom
ass
and
CC
GT
with
CC
S. 6
. Hea
t Net
wor
ks in
clud
es d
istr
ict h
eat n
etw
orks
and
co
mm
unity
hea
t net
wor
ks.
This
flow
char
t has
bee
n p
rod
uced
usi
ng th
e R
esul
ts o
f Sta
ge 1
&2
of C
CC
MA
RK
AL
ME
D P
h2_1
0110
8 fo
r UK
ER
C

34
4.3 Benefits of the integrated scenario
The integrated scenario encompasses a number of potential advantages which may provide some benefits in a highly electrified world. The following section provides a brief overview of these benefits. It has not been possible to explore each of these issues in great depth within the confines of this report, but given the challenges for power system development and operation created by an all-electric scenario, each of the issues outlined below is a strong candidate for further research.
Reduced demand for electricityThe integrated scenario has offset a proportion of the electricity demand required under the ‘all-electric’ scenarios by making use of CHP, district heating and biomass and reducing the use of electric heat pumps and resistive heaters. As a result, primary energy demand for power generation has been reduced by 6 MTOE. Demand for coal has been reduced by 13 MTOE, equivalent to 9 – 14 GW of coal-fired generation capacity displaced from the integrated scenario13.
Reducing absolute electricity capacity has the principal benefit of reducing at least some of the highly ambitious electricity generation build rates implied in the all-electric scenarios (see Section 3.3). Moreover, replacing electric heat pumps with non-electric sources of low carbon heat has the potential to reduce the scale of heating-driven peak electricity demands as well as helping manage electric power flows in a number of other ways, as we now explain.
Managing energy flowsBy utilising waste heat and installing heat networks in the integrated scenario, the system has the potential to provide a greater robustness and ability to manage power flows. The integrated scenario will provide 14% of domestic heat demand through DHNs. This represents 4 MTOE of heat delivered without the use of electrical heat systems such as heat pumps.
For reasons explained in Section 3.3 air source heat pumps in particular may default to resistive heating mode when heat demands are highest. Unless steps are taken to counteract this tendency, the current 60 GW winter peak electricity demand could increase significantly. As discussed in Section 3.3, if 10 million homes were to run heat pumps with a 5 kW electrical demand, this could potentially increase peak electricity demand by 50 GW. The integrated scenario has the potential to remove a fraction of the additional peak load. We have sought out urban or suburban districts in our district heating scenario. Since air source heat pumps also have highest applicability in urban areas, where installing ground source heat pumps is likely to be more difficult, the fraction of the demand peak removed as a result of the scenario is likely to be higher than the 13% of electricity displaced on an energy basis.
Similar implications can be drawn for the heat demand displaced by the 1.9 MTOE of networked heat going to industrial end-use, and the 2 MTOE of networked heat supplying the agricultural and service sector. By reducing peak electricity demand, requirements for electricity network upgrading, particularly at the distribution networks, may also be reduced.
There are other prospective benefits for the management of energy flows afforded by the use of heat networks. DHNs can be (and often are) built in conjunction with large hot water storage systems. These systems are essentially large, heavily insulated hot water tanks, one UK example of which is in Pimlico, London (CityWest Homes 2009). These heat storage technologies can provide system management opportunities in several ways.
• First, by storing hot water during normal electricity production, and providing that heat flexibly throughout the diurnal cycle heat can be delivered to end-users in a manner that may be able to smooth fluctuations in electricity demand.
Building a roadmap for heat An integrated scenario for meeting heat demand in a decarbonised future
13 This range reflects assumed load factors for the displaced plant of between 50% and 80% (Poyry 2009; SKM 2008).

35
• Second, during high wind weather events, CHP can decrease its output, using stored heat to continue to satisfy heat demand. When wind production subsequently drops, the CHP plant can increase electricity and heat production in order to meet subsequent demand. This has been demonstrated in various countries and is the subject of a recent European FP6 project (DESIRE 2009). By utilising this flexibility, the impacts of intermittency expected by a very high installed capacity of wind power can be mitigated.
• Finally, CHP schemes and hot water stores can be ‘co-fired’ with electric boilers. It is possible to utilise these when electricity from intermittent sources is in plentiful supply. Recently, Danish CHP and district schemes have been retrofitted with electric boilers and allowed to participate in the Nordic electricity market (Baker 2009). In Denmark electricity from wind can exceed demand at some periods of the year, particularly if demand is relatively low and heat load following CHP schemes are operating at the same time (cold and windy nights for example). This means that electric heating connected to DHNs is incentivised during periods of high wind, when difficulties of utilising extra electrical output are encountered, and electricity prices are very low.
Overall, increasing the share of district heating and CHP, perhaps with electrical co-firing, offers a great deal of flexible demand that is otherwise not present in the all-electric scenario. It also decreases to a significant extent the absolute level of peak electrical demand arising from heating needs. As a result, the integrated scenario offers a substantial and potentially extremely valuable contribution to managing power flows on a low carbon electricity system.
End-user issuesIssues for end-users surrounding the implementation of low carbon heating alternatives are also important. The integrated scenario reduces the use of electricity for heating by delivering heat through DHNs. In the domestic sector and in many instances in the service sector this shift will obviate the need to install heat pump systems, with accompanying insulation and under floor heating. If a proportion of the 7 million solid wall properties potentially existing in the UK in 2050 (EST 2009b) are connected to DHNs this could provide an additional path to decarbonisation for dwellings which are particularly hard to insulate.
4.4 Summary
The purpose of this chapter is to explore the potential to make more efficient use of primary resources by reducing thermal losses and increasing the role of CHP in providing the UK’s heat requirements in 2050 energy scenarios. The chapter has several outcomes:
• By providing 4.2 MTOE heat and 4 MTOE electricity from gas-fired CCS-CHP plant, and 3.7 MTOE heat and 0.5 MTOE electricity from biomass fired CHP plant, demand for electricity is reduced by 13% and demand for primary energy is reduced by 5%14;
• Reducing electricity demand has the potential to reduce the ambitious build rates implied by the all-electric scenarios;
• Use of network heat to deliver domestic heat demand has the potential to reduce peak demand while providing system management benefits such as buffering of diurnal electricity demand peaks and mitigating the effects of intermittency;
• Heat networks also obviate the need from installation of heat pumps, reducing the disruption associated with the installation of large surface area heating systems, such as underfloor heating, and help decarbonise the hardest to insulate buildings
Building a roadmap for heat An integrated scenario for meeting heat demand in a decarbonised future
14 Reductions compared to common assumptions of an all-electric future.

36
The transition to a low carbon energy future presents the UK with some difficult choices, none more so than the choices around heat. Heat represents more than 40% of current energy demand and it is reasonable to assume that demands for thermal comfort and other heating services will endure, long after 2050. How then should we decarbonise its delivery? Many recent scenario modelling exercises envisage a largely all-electric future where electricity provides many of our energy needs, including the electrification of heat delivery. The ‘all-electric’ scenarios reviewed in this report are highly decarbonised and, at least on the basis of the assumptions made in order to model them, cost optimal. However in all cases a large fraction of primary energy is lost as waste heat from fossil fuel stations (with and without CCS) and nuclear power stations. Heat pumps help to improve overall efficiency, but also give rise to challenges related to power flows, particularly in the winter peak demand periods. By presenting the all-electric scenario in terms of its energy flows, it has been possible to examine these implications for the first time. The all-electric scenarios also face several practical difficulties, requiring future developments that would be critical to a successful outcome. The report has examined these criticalities, raising questions about overall viability of the scenarios reviewed.
In this report we have presented an alternative to the all-electric future. This integrated scenario makes greater use of waste process heat in order to increase conversion efficiencies, hence meeting equivalent energy demands whilst reducing demand for electricity and consumption of primary resources. By building heat networks, heat can be delivered to buildings. By heating these networks with waste heat from CCS and biomass fuelled plant, the heat is sufficiently decarbonised to remain compatible with deep cuts in emissions. The integrated scenario helps address some of the key criticalities, reducing peak electricity loads and helping manage power flows.
Although the primary focus of this report is on a snapshot of our future in 2050, we must also consider the transition journey to a low carbon future. Options which provide early cuts in CO2 can reduce cumulative emissions between now and 2050, which recent climate research has highlighted as a key factor in avoiding dangerous climate change (Anderson et al. 2008). This includes technologies which are not sufficiently decarbonised to reach an 80% target but provide significant CO2 savings in a period in which grid electricity and gas both remain carbon intensive. Fossil fuelled CHP at the small and micro scale may fall into this category. Another option may be the use of gas-fired CHP at medium scale, which may be used to support the development of heat networks. The networks could then be connected to large-scale CHP with CCS or biomass fired CHP plant to help decarbonise heat sufficiently for demanding 2050 targets. This has the benefit of making early cuts to the CO2 intensity of heat and supporting the development of district heating. By contrast, if we ignore opportunities to support DHN building in the near term, we will begin to lock ourselves in to a path towards another future which is less amenable to capturing the benefits associated with CHP-CCS and district heating.
This leads to a question of incentives. If we are to pursue a 2050 energy system with greater utilisation of waste heat, district heating and biomass CHP, how can this best be facilitated? The UK already has a CHP target of 10 GW by 2010 (Defra 2006), but the target will not be met, raising questions regarding barriers to CHP in the UK. Nevertheless, the recently announced consultation on National Policy Statements for energy presents a desire for the inclusion of CHP feasibility assessment for all electricity planning applications, which has the potential to increase the build rate of CHP. The Renewable Heat Incentive (RHI) is another mechanism which could be used to encourage CHP in the UK.
In conclusion, the journey to a low carbon energy system will be difficult regardless of the path. In this report we have focused on the energy flows and ‘criticalities’ associated with a largely ‘all-electric’ future. We have developed an integrated scenario which makes efficient use of primary resources, reduces the absolute requirement for electricity and reduces some of the problems associated with running an ‘all-electric’ system. The integrated scenario, however, presents challenges of its own, and we are presented with a choice: in which of these visions of the future energy system do we believe?
5/ Conclusions and implications for policy
Building a roadmap for heat Conclusions and implications for policy

37Building a roadmap for heat Conclusions and implications for policy
• On one hand, we have the all-electric scenario, which sees an almost-exclusive dependence on electric heating in buildings. Can we deliver an electricity system resilient to the difficulties of implied peak loads and transmission issues? Can we build the generation capacity necessary to power this system? Are we prepared to accept the implications of continued large and inefficient use of fossil fuel? And will we as end-users accept the disruption associated with both insulation and installation of heat pumps?
• On the other hand we have the integrated scenario, which adopts a complementary and diverse mix of heating approaches, including both electric heat and more extensive use of heat from thermal power generation. This reduces some of the problems above, but introduces others. Will consumers and citizens be prepared to tolerate the disruption created in order to lay heat networks in existing urban areas? Again, will they tolerate the disruption to their homes associated with connecting them to heat mains?
Both scenarios involve dramatic changes to the energy system and neither have historical precedent. It is important to stress that they are by no means mutually exclusive. Indeed, bringing together elements of both has the potential to ameliorate some of the problems associated with each. As policymakers and energy industry consider the means by which to deliver a low carbon future, it may be important to encourage diverse solutions. In the case of low carbon heat, a variety of means are available, and bringing them together in combination is likely to create a more resilient outcome and meet heat demands in a technically feasible, efficient and low carbon way.

38
AEA 2007, Renewable Heat and Heat from Combined Heat and Power Plants - Study and Analysis, AEA Technology, Didcot.
Anderson, K., Bows, A., & Mander, S. 2008, From long-term targets to cumulative emission pathways: Reframing UK climate policy, Energy Policy, vol. 36, no. 10, pp. 3714-3722.
Baker, P. 2009, Fuel-substitution – Danish Experience From January 2009 Lecture at Imperial College London.
Boardman, B. 2007, Home Truths. A low-carbon strategy to reduce UK housing emissions by 80% by 2050, Environmental Change Institute, University of Oxford, ECI Research Report 34.
Byun, J. S., Lee, J., & Jeon, C. D. 2008, Frost retardation of an air-source heat pump by the hot gas bypass method, International Journal of Refrigeration, vol. 31, no. 2, pp. 328-334.
CCC 2008, Building a low-carbon economy - the UK’s contribution to tackling climate change, Committee on Climate Change, London.
CEC 2008, Communication from the Commission to the European Parliament, the Council, the European Economic and Social Committee and the Committee of the Regions - 20 20 by 2020 - Europe’s climate change opportunity, Commission to the European Parliament, Brussels.
CityWest Homes 2009, The History of PDHU, The Pimlico District Heating Undertaking (PDHU), London.
Damen, K., Troost, M. v., Faaij, A., & Turkenburg, W. 2006, A comparison of electricity and hydrogen production systems with CO2 capture and storage. Part A: Review and selection of promising conversion and capture technologies, Progress in Energy and Combustion Science, vol. 32, no. 2, pp. 215-246.
DECC 2009a, Analytical Annex to the UK Low Carbon Transition Plan, Department of Energy and Climate Change, London.
DECC 2009b, Combined Heat and Power Focus - Glossary, Department of Energy and Climate Change, London.
DECC 2009c, Digest of UK Energy Statistics, Department of Energy and Climate Change, London.
DECC 2009d, Energy Trends September 2009, Department of Energy and Climate Change, London.
DECC 2009e, The UK Low Carbon Transition Plan, The Stationery Office, London.
DECC 2009f, The UK Renewable Energy Strategy, The Stationery Office, London.
Defra 2006, Climate Change: The UK Programme 2006, Department for the Environment, Food and Rural Affairs, London.
Defra 2007, UK Biomass Strategy, Department for Environment, Food and Rural Affairs, London.
Descamps, C., Bouallou, C., & Kanniche, M. 2008, Efficiency of an Integrated Gasification Combined Cycle (IGCC) power plant including CO2 removal, Energy, vol. 33, no. 6, pp. 874-881.
DESIRE 2009, Project Desire – Objectives, Dissemination Strategy on Electricity Balancing for Large Scale Integration of Renewable Energy, Aalborg, Denmark.
Dickinson, J. 2009, An investigation into the geological, hydrological and carbon reduction potential and economics for building ground energy systems in the UK, EngD thesis, University of Surrey.
EEA 2006, How much bioenergy can Europe produce without harming the environment?, European Environment Agency, Copenhagen, EEA Report No 7/2006.
ENSG 2009, Our Electricity Transmission Network: A Vision for 2020, Department of Energy and Climate Change, London, URN/09/752.
ESDS 2009, IEA Electricity Information, Economic and Social Data Service, University of Manchester.
EST 2009a, Ground source heat pumps, Energy Saving Trust, London.
References
Building a roadmap for heat References

39
EST 2009b, New funding initiative aims to open door to advanced green measures in the home, Energy Saving Trust, London.
Fishbone, L. & Abilock, H. 1981, MARKAL, a linear-programming model for energy-systems analysis – technical description of the BNL version, International Journal of Energy Research, vol. 5, no. 4, pp. 353-375.
Gross, R., Heptonstall, P., & Blyth, W. 2007, Investment in Electricity Generation - the role of costs, incentives and risk, UK Energy Research Centre, London.
House of Lords 2008a, The EU’s Target for Renewable Energy: 20% by 2020 - A report from the European Union Committee. Volume I: Report, The Stationery Office, London.
House of Lords 2008b, The EU’s Target for Renewable Energy: 20% by 2020 - A report from the European Union Committee. Volume II: Evidence, The Stationery Office, London.
ICE 2009, Why waste heat?, Institution of Civil Engineers, London.
Kuramochi, T., Ram∅rez, A., Faaij, A., & Turkenburg, W. 2009, Post-combustion CO2 capture from part-load industrial NGCCCHPs: Selected results, Energy Procedia, vol. 1, no. 1, pp. 1395-1402.
Marsh, G., Taylor, P., Anderson, D., Leach, M., & Gross, R. 2003, Options for a Low Carbon Future - Phase 2, Report for DTI, Department for Trade and Industry, London.
Mattias, P. 2009, Waste to Energy – The Swedish model, Usitall AB, Linköping, Sweden.
Morris, C., Goldstein, A., & Fthenakis, M. 2002, NEMS and MARKAL-MACRO models for energy- environmental economic analysis: a comparison of the electricity and carbon reduction projections, Environmental Modeling & Assessment, vol. 7, no. 3, pp. 207-216.
National Grid 2009, Seven Year Statement, National Grid Electricity Transmission plc.
Ng, K. S., Lopez, Y., Campbell, G. M., & Sadhukhan, J. 2009, Heat integration and analysis of decarbonised IGCC sites, Chemical Engineering Research and Design, vol. In Press, Corrected Proof.
OECD, 2009, What are scenarios? Organisation for Economic Co-operation and Development, Paris,
Ofgem 2009, Project Discovery Energy Market Scenarios - Consultation, Ofgem, London, 122/09.
OPSI 2008, Climate Change Act 2008 (Chapter 27), Office of Public Sector Information, London.
Poyry 2008, Securing Power: Potential for CCGT CHP generation at industrial sites in the UK, Greenpeace UK, London.
Poyry 2009, Impact of intermittency: How wind variability could change the shape of the British and Irish electricity markets, Poyry Energy Consulting, Oxford.
Poyry & Faber Maunsell 2009, The potential and costs of district heating networks. A report to DECC, Poyry, Oxford.
SKM 2008, Growth scenarios for UK renewables generation and implications for future developments and operation of electricity networks, Department of Energy and Climate Change, London.
UKERC 2009, UKERC Energy 2050 Making the transition to a secure and low-carbon energy system: synthesis report, UK Energy Research Centre, London.
Vattenfall 2009, Common misunderstandings about CCS, Vattenfall AB, Stockholm.
Winskel, M. 2002, When Systems Are Overthrown: The ‘Dash for Gas’ in the British Electricity Supply Industry, Social Studies of Science, vol. 32, no. 4, pp. 563-598.
Building a roadmap for heat References

Plotting the ‘all-electric’ SankeyData used to generate the all-electric Sankey (Figure 3.7) was taken from The Committee on Climate Change’s MARKAL Results spreadsheet (not published). From these data, the tables15 presented below were populated, and interpreted into Sankey diagram form using ‘e!Sankey pro 2.0.3.2098’ software. Data in Table A represents the inputs, located at the far left of the Sankey diagrams. Tables B and C represent aggregate forms of energy end-use. Table D represents the data used to create the right hand side of the diagram marked “Total Final Consumption”.
Table A: Primary energy input and distribution
PRIMARY ENERGY
Description MTOE
Nuclear 8.2
Coal 39.4
Natural gas 38.6
Oil 8.1
Refined oil 4.1
Renewables (excl. Biomass) 12.5
Biomass / waste 12.7
Electricity import 2.5
Hydrogen import 0.0
TOTAL 126.1
Table B: Final energy by sector
Description MTOE
Services 12.7
Residential 17.4
Transport 28.8
Industry 29.3
Agriculture 1.1
Total 89.4
Technical Annex
Building a roadmap for heat Technical Annex40
15 All figures in tables 1-4 represent MARKAL results from the Committee on Climate Change’s 33/80 scenario. All values are for year 2050.

Table C: Final energy by fuel
Description MTOE
Coal and coke 0.8
Gas 23.8
Oil 1.8
LPG 0.0
Biomass 0.4
Electricity 37.7
LTH and Steam 0.7
Diesel 2.1
Petrol 8.0
Biodiesel and BtL diesel 5.5
Ethanol 0.6
Hydrogen 7.2
Methanol 0.0
Jet fuel 0.8
BtL Biokerosene 0.0
Total 89.4
Table D: Final energy by sector / fuel in MTOE
Gas Electricity Manufactured Fuels
Oil Heat Coal
Industry 18.8 7.9 0.7 1.8 0.0 0.1
Transport 0.0 5.3 13.3 10.2 0.0 0.0
Domestic 0.9 16.4 0.0 0.0 0.1 0.0
Service and Agriculture
4.0 8.1 0.4 0.6 0.6 0.0
Total 89.4
Finally, the proportionality of end-use energy demand (far right of diagram) must be assumed since it is not explicitly provided in the available MARKAL results spreadsheet. This proportionality was assumed to be the same as 2007 and was applied to sectoral results for final consumption by sector.
Building a roadmap for heat Technical Annex 41

Integrated SankeyThe following tables present the data and assumptions used to adapt the all-electric scenario. The values included in these tables represent the new values used for areas of the scenario which have been altered. All assumptions other than those detailed in tables E-L are as seen in the all-electric scenario (tables A-D).
Note: All figures in tables E-L are in MTOE and apply to integrated Sankey diagram for 2050.
Table E: Additional CHP included in the integrated scenario.
Domestic Service Industry Total Heat Power Output
CCGT-DHN 2.15 1.08 0.95 4.18 3.97
Biomass 1.82 0.90 0.95 3.67 0.48
Total 3.97 1.98 1.90 7.85 4.45
% penetration 27.73 27.42 28.71
Table F: New assumptions on biomass resource
Assumption
New Biomass Supply 17.9
Biomass Supply for CHP 5.2
Table G: Input, output, heat/power ration and losses for additional CHP
Input Heat Power Total Output
Losses
Biomass CHP Calculations 5.2 3.67 0.48 4.14 1.06
CCGT-CCC CHP Calculations 9.50 4.18 3.98 8.17 1.33
Table H: Power station supply in the integrated scenario
Energy Supply in 2050 for Power Stations MTOE
Natural Gas 9.5
Biomass 5.2
Coal 26.2
Nuclear 8.2
Renewable 12.5
Electricity Import 2.5
Total 64.1
Table I: Overall efficiency of electricity generation
Total Generation Overall Efficiency (%)
64.1 38.4 59.9
Building a roadmap for heat Technical Annex42

Building a roadmap for heat Technical Annex 43
Table J: Change to coal inputs in integrated diagram
Assumption
New Energy Supply required to Power Stations 33.9
Coal Supply 26.2
The figures in Table K represent assumptions regarding the level of loss for both electricity and gas. Since this is not transparent from MARKAL results, it was assumed that losses in 2050 would be proportional to losses occurring in 2007. Losses for 2007 are obtained from DUKES (2009).
Table K: Calculation of losses
Electricity Losses Calculations MTOE
Total Consumption in 2007 29.3
Total Losses in 2007 4.8
% of total consumption 16.4
Total Consumption in 2050 33.0
Total Losses in 2050 5.4
Gas Losses Calculations MTOE
Total Consumption in 2007 91.0
Total Losses in 2007 8.2
% of total consumption 9
Total Consumption in 2050 40.5
Total Losses in 2050 3.6
DHN PotentialTable L presents the results of GIS analysis of heat demand existing within a 30km radius of current East Coast power station sites. Heat demand is taken from Mid-Layer Super Output Areas for gas demand held by the Office of National Statistics. Merged cells in the right column represent power stations with overlapping radii. The percentage of UK heat demand deliverable through DHNs is assumed out to 2050, and used to derive the MTOE values seen in Table E.

Building a roadmap for heat Technical Annex44
Table L: Heat demand within 30km radius of east coast power stations
Power Station MTOE
Drax
0.53Glandford Brigg
West Burton
Cottam Development Centre
South Humber Bank
0.78Killingholme
Saltend
Spalding
0.32Sutton Bridge
King’s Lynn
Corby
0.30Peterborough
Little Barford
Rye House
2.79
Barking
Tilbury
Kingsnorth
Coryton
Damhead Creek
Shoreham 0.12
Teeside 0.17
Great Yarmouth 0.07
Lynemouth 0.29
TOTAL 5.38
Percentage of UK total 15.22%