btb real estate investment trust (tsx: btb.un) conference
TRANSCRIPT
Conference Call Presentation
May 11, 2021
For the quarter ended March 31, 2021
BTB Real Estate Investment Trust (TSX: BTB.UN)
7150 Alexander Fleming Street, St-Laurent

NON-IFRS MEASURES
BTB consolidated financial statements are prepared in accordance with IFRS. Consistent with BTB management framework, management uses certain financial measures to assess BTB
financial performance, which are not generally accepted accounting principles (GAAP) under IFRS.
The following measures, net operating income (NOI), net operating income of the same-property portfolio (SPNOI), funds from operations (FFO), adjusted funds from operations (AFFO),
adjusted net income and comprehensive income and net property income and per unit information, if applicable, are non-IFRS performance measures and do not have standardized meanings
prescribed by IFRS.
These measures are used by BTB to improve the investing public’s understanding of operating results and the Trust’s performance. IFRS are International Financial Reporting Standards defined
and issued by the IASB, in effect as at the date of this presentation. These measures cannot be compared to similar measures used by other issuers. However, BTB presents its FFO in
accordance with the Real Property Association of Canada (REALPAC) White Paper on Funds from Operations, as revised in February 2019. Securities regulations require that these measures
be clearly defined, that they be readily comparable to the most similar IFRS measures, and that they not be assigned greater weight than IFRS measures.
FORWARD-LOOKING STATEMENTS
From time to time, we make written or oral forward-looking statements within the meaning of applicable Canadian securities legislation. We may make forward-looking statements in this
document, in other filings with Canadian regulators, in reports to unitholders and in other communications. These forward-looking statements may include statements regarding our future
objectives, strategies to achieve our objectives, as well as statements with respect to our beliefs, outlooks, plans, objectives, expectations, forecasts, estimates and intentions. The words “may,”
“could,” “should,” “outlook,” “believe,” “plan,” “forecast,” “estimate,” “expect,” “propose,” and the use of the conditional and similar words and expressions are intended to identify forward looking
statements.
By their very nature, forward-looking statements involve numerous factors and assumptions, and are subject to inherent risks and uncertainties, both general and specific, which give rise to the
possibility that predictions, forecasts, projections and other forward-looking statements will not be achieved. We caution readers not to place undue reliance on these statements as a number of
important factors could cause our actual results to differ materially from the expectations expressed in such forward-looking statements. These factors include general economic conditions in
Canada and elsewhere, the effects of competition in the markets where we operate, the impact of changes in laws and regulations, including tax laws, successful execution of our strategy, our
ability to complete and integrate strategic acquisitions successfully, potential dilution, our ability to attract and retain key employees and executives, the financial position of lessees, our ability to
refinance our debts upon maturity, our ability to renew leases coming to maturity, and to lease vacant space, our ability to complete developments on plan and on schedule and to raise capital to
finance our growth, as well as changes in interest rates. We caution that the foregoing list of important factors likely to affect future results is not exhaustive. When relying on forward-looking
statements to make decisions with respect to BTB, investors and others should carefully consider these factors and other facts and uncertainties. Additional information about these factors can
be found in the “Risks and Uncertainties” section of the MD&A.
BTB cannot assure investors that actual results will be consistent with any forward-looking statements and BTB assumes no obligation to update or revise such forward-looking statements to
reflect new events or circumstances, except as required under applicable securities regulations.
2

QUARTERLY HIGHLIGHTS
MICHEL LÉONARD
PRESIDENT & CEO
80 Aberdeen, Ottawa, Ontario
3
Highlights
BTB continued to show stability through the diversity of its portfolio.
High rent collection rate (99.6%) and proactive lease renewal and leasing
strategies, despite the current context of the COVID-19 pandemic.
BTB is reporting a reduction of the balance of receivables from $5.2M at the
end of Q4 2020 to $4.8M for the quarter.
No additional rent deferral agreements were negotiated with tenants, further
ensuring future revenue.
The Trust’s three largest tenants are the Government of Québec, the
Government of Canada, and Walmart Canada Inc., representing respectively
7.3%, 6.2% and 3.0% of rental revenue.
Although the effect of the pandemic and the resulting government mandated
restrictions have certainly impacted the retail industry in general, BTB had
limited exposure to bankrupt tenants and tenants in restructuring
procedures.
245 Menten Place, Ottawa, Ontario4

Key financial and operational metrics (1)
91.7%
Committed occupancy as at April 30,
2021 (91.0% committed as at March
31, 2021, 90.8% in place)
5.9%
Increase in lease renewal rate
50 445 sq. ft.Renewals & new leases
58.9%
Total debt ratio
8.9¢FFO / Unit(Payout 84.0%)
99.6%Rent collection rate
5
BTB'S
COMPETITIVE
ADVANTAGES
▪ No enclosed malls
▪ Portfolio diversification with
good exposure to industrial
& office markets
▪ Largest tenants are
investment grade
▪ Core market presence
▪ The Trust is currently
working on a five-year
growth plan
(1) The key metrics above result from the quarter ended March 31, 2021, unless if a different date is specified.
52.8%NOI margin
476 695 sq. ft.Available leasable area

31,763 sq. ft. of renewals were concluded with office tenants (78% of renewals), further confirming a
strong desire for businesses to revert to an office setting.
BTB continued the efforts to renew leases coming to maturity post 2021 to ensure the stability
of BTB’s portfolio – these leases represent 54,477 sq. ft.
Overall, BTB’s renewals (term and anticipated) were concluded with tenants operating in the
following industries:
Government;
Necessity-based retail;
Essential professional services;
Health & Technology.
9,751 sq.ft. of vacant spaces were leased during Q1
Leasing and Renewal Activity
50 Saint-Charles Street Ouest, Longueuil, Québec
6
YearQ1 Renewals
(sq. ft.)
2021 40,694
2022+ 54,477
Total 95,171
A total of 104 922 sq.ft. were leased, representing 22% of BTB’s total available leasable area
Renewal rate 61.3%
Average increase in
lease renewal rate5.9%
93.3
89.9
93.2
92.4
91.3
89.0
93.0
91.0
Montréal Québec Ottawa Total
Q1 2020 Q1 2021
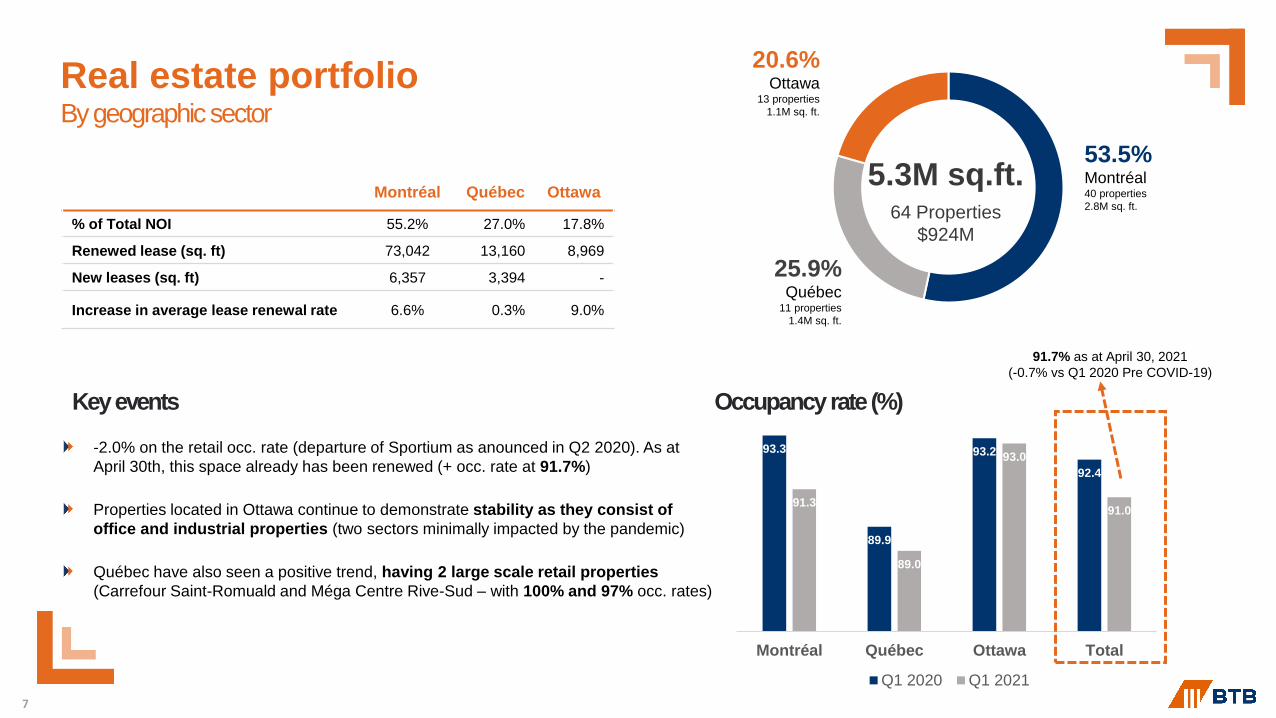
Real estate portfolioBy geographic sector
7
91.7% as at April 30, 2021
(-0.7% vs Q1 2020 Pre COVID-19)
Montréal Québec Ottawa
% of Total NOI 55.2% 27.0% 17.8%
Renewed lease (sq. ft) 73,042 13,160 8,969
New leases (sq. ft) 6,357 3,394 -
Increase in average lease renewal rate 6.6% 0.3% 9.0%
Key events Occupancy rate (%)
5.3M sq.ft.64 Properties
$924M
53.5%Montréal40 properties
2.8M sq. ft.
20.6%Ottawa
13 properties
1.1M sq. ft.
25.9%Québec
11 properties
1.4M sq. ft.
-2.0% on the retail occ. rate (departure of Sportium as anounced in Q2 2020). As at
April 30th, this space already has been renewed (+ occ. rate at 91.7%)
Properties located in Ottawa continue to demonstrate stability as they consist of
office and industrial properties (two sectors minimally impacted by the pandemic)
Québec have also seen a positive trend, having 2 large scale retail properties
(Carrefour Saint-Romuald and Méga Centre Rive-Sud – with 100% and 97% occ. rates)

Real estate portfolioBy operating segment
5.3M sq.ft.64 Properties
$924M
48.8%
Office34 properties
2.6M sq. ft.
24.7%
Industrial18 properties
1.3M sq. ft.
26.5%
Retail12 properties
1.4M sq. ft.
8
95.6
90.2
93.6
92.4
90.0
89.3
95.6
91.0
Retail Office Industrial Total
Q1 2020 Q1 2021
Key events
Retail Office Industrial
% of Total NOI 26.8% 57.1% 16.1%
Renewed lease (sq. ft) 49,157 40,190 5,824
New leases (sq. ft) 1,199 8,552 -
Increase in average lease renewal rate 4.5% 4.7% 48.1%
Occupancy rate (%)
-5.6% on the retail occ. rate (departure of Sportium as anounced in Q2 2020). As at
April 30th, this space already has been renewed (+ occ. rate at 91.7%.
Performance has been stable across the 3 segments and has been supported by the
quality of its tenants (top 2 tenants are the Federal and Provincial government).
The industrial segment continues to show good traction and performance (increase
in the occ. rate in Q1 2021)

FINANCIAL OVERVIEW
MATHIEU BOLTÉ
VICE PRESIDENT
& CFO825 Lebourgneuf Boulevard ‘‘Complexe Lebourgneuf Phase I’’, Quebec City
9
Financial highlights
For the same period in 2020, the pandemic had no impact on financial results yet
other than an adjustment in fair value of $6.9M.
The negative impact of the COVID-19 in Q1 2021 totals $0.6M on NOI and $0.3M
on net income: (1) $0.5M on revenue due to tenant departures; (2) $0.1M extra
cleaning expenses; (3) $0.3M improved expected credit losses with better collections
( “COVID-19 Events”).
NOI margin is 52.8% in Q1 2021 (vs 53.5% in Q1 2020). Excluding $0.6M COVID-19
Events, NOI margin would be 54.3% (+0.8% vs Q1 2020).
BTB received 896 871 units conversion notices during the quarter for a total of
$3.3M for the new Series H debenture, for a total of $3.9M since the issuance in
September 2020 and is continuing receiving conversion notices.
Improvement in total debt ratio from 59.4% at the end of Q4 2020 to 58.9%.
Following the equity issuance of April 2021 ($30.4M), the acquisition credit facility
outstanding balance was paid ($15M) and the remaining balance will be used to fund
the Trust’s future acquisitions. 100% of the $23M credit facility is available.
Q1 2021 unit performance: $4.22 (+20% vs Q4 2020 and +34% vs Q1 2020).
245 Menten Place, Ottawa, Ontario10

Q1’21COVID-19
EventsQ1’21 Adj. Q1’20 ∆ ∆ Adj
Revenues $23.5M $0.5M $24.0M $23.9M $(0.4M) $0.1M
NOI $12.4M $0.6M $13.0M $12.8M $(0.4M) $0.2M
Net income $2.5M $0.3M $2.8M $(5.6M) $8.1M $8.4M
Recurring FFO per unit 8.9¢ 0.5¢ 9.4¢ 10.0¢ (1.1¢) (0.6¢)
Payout ratio on FFO 84% (5%) 79% 105% (21%) (26%)
Recurring AFFO per unit 9.8¢ 0.5¢ 10.3¢ 10.8¢ (1.0¢) (0.5¢)
Payout ratio on AFFO 87% (5%) 82% 119% (32%) (37%)
Wtd avg units o/s (000) 64,148 - 64,148 62,887 1,261 1,261
Financial Results
❶ Unfavorable variance mainly due to $0.6M COVID-19 Events
❷ Favorable variance mainly due to a decrease to the fair value of investment properties of $8M in 2020
❸ The increase in the weighted average units is mostly due to the Serie H debentures conversions (897 thousands units converted in Q1 2021)
❶
❷
11
❸
❶
❶

23.9 23.5
24.0
Q1 2020 Q1 2021 Q1 2021 Adj.
-1.4%
12.8 12.4 13.0
Q1 2020 Q1 2021 Q1 2021 Adj.
53.3% 52.8%54.2%
Operating Revenues ($M) Net Operating Income ($M)
12
-2.8%
▪ Excluding the $0.6M COVID-19 Events:
▪ NOI would have increased +1.8% and NOI margin would be 54.2% for Q1 2021 (vs
53.3% Q1 2020)
▪ SPNOI would have increased by $0.3M (+2.8%) and SPNOI margin would be 53.6%
for Q1 2021 (vs 53.8% Q1 2020)
▪ Same property NOI margin (SPNOI): 52.0% in Q1 2021 (vs 53.8% Q1 2020)
▪ $0.5M COVID-19 Events
▪ Property acquisitions (2) and dispositions (4) made in 2020 result in a reduction of $0.4
M in revenue for Q1 2021 (but offsets on NOI).
▪ Excluding $0.5M COVID-19 events and $0.4M net negative impact due to acquisitions
and dispositions, rental revenue would have increased by $0.6M (+2.5%) due to lease
renewals and leasing efforts.
Operating Revenues & NOI
+0.6%Excluding $0.6 million
COVID-19 EventsExcluding $0.5 million
COVID-19 Events
+1.8%
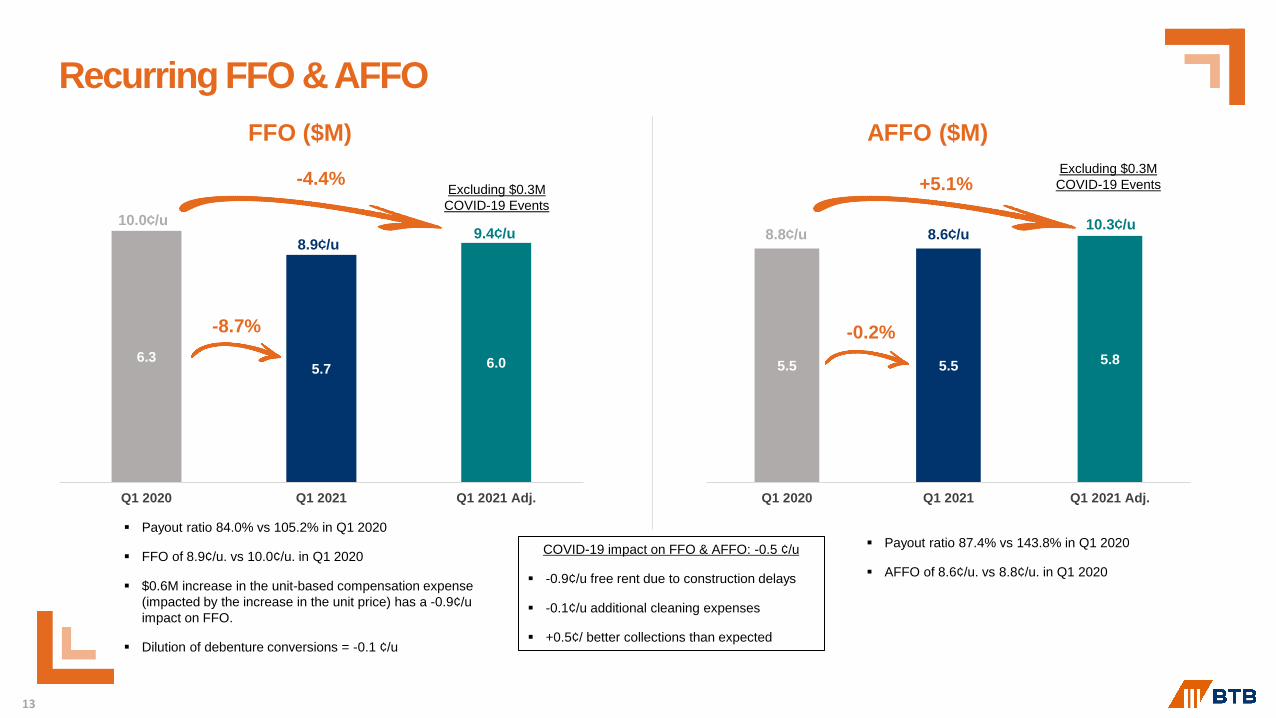
▪ Payout ratio 87.4% vs 143.8% in Q1 2020
▪ AFFO of 8.6¢/u. vs 8.8¢/u. in Q1 2020
FFO ($M) AFFO ($M)
6.3 5.7 6.0
Q1 2020 Q1 2021 Q1 2021 Adj.
5.5 5.5 5.8
Q1 2020 Q1 2021 Q1 2021 Adj.
-8.7%
10.0¢/u
8.9¢/u8.8¢/u 8.6¢/u
▪ Payout ratio 84.0% vs 105.2% in Q1 2020
▪ FFO of 8.9¢/u. vs 10.0¢/u. in Q1 2020
▪ $0.6M increase in the unit-based compensation expense
(impacted by the increase in the unit price) has a -0.9¢/u
impact on FFO.
▪ Dilution of debenture conversions = -0.1 ¢/u
13
Recurring FFO & AFFO
COVID-19 impact on FFO & AFFO: -0.5 ¢/u
▪ -0.9¢/u free rent due to construction delays
▪ -0.1¢/u additional cleaning expenses
▪ +0.5¢/ better collections than expected
Excluding $0.3M
COVID-19 Events
Excluding $0.3M
COVID-19 Events
9.4¢/u10.3¢/u
-4.4%
-0.2%
+5.1%
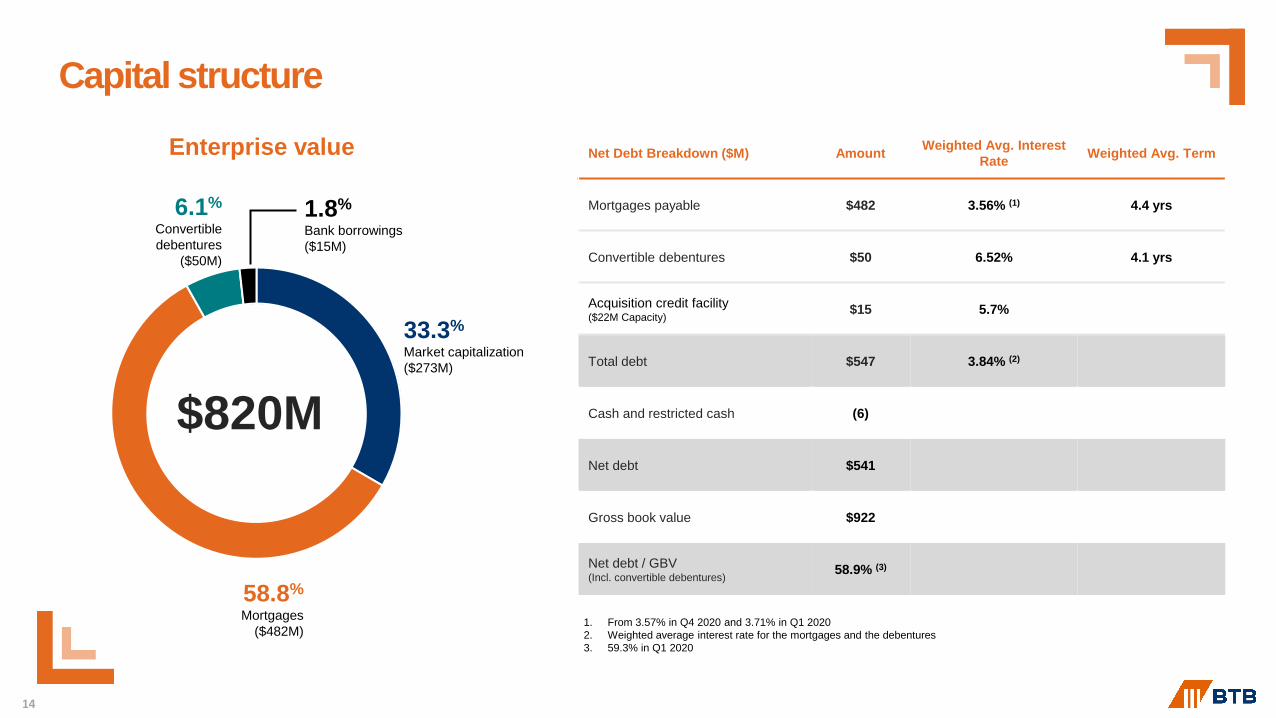
Net Debt Breakdown ($M) AmountWeighted Avg. Interest
RateWeighted Avg. Term
Mortgages payable $482 3.56% (1) 4.4 yrs
Convertible debentures $50 6.52% 4.1 yrs
Acquisition credit facility($22M Capacity)
$15 5.7%
Total debt $547 3.84% (2)
Cash and restricted cash (6)
Net debt $541
Gross book value $922
Net debt / GBV(Incl. convertible debentures)
58.9% (3)
14
1. From 3.57% in Q4 2020 and 3.71% in Q1 2020
2. Weighted average interest rate for the mortgages and the debentures
3. 59.3% in Q1 2020
Capital structure
$820M
33.3%
Market capitalization
($273M)
58.8%
Mortgages
($482M)
1.8%
Bank borrowings
($15M)
6.1%
Convertible
debentures
($50M)
Enterprise value

Debt MaturitiesGood progress to refinancing coming 2021 maturities
104.8
35.5 35.4
82.4
44.8
179.2 24.0
26.1
0
20
40
60
80
100
120
140
160
180
200
AvailableLiquidity
2021(9 months)
2022 2023 2024 2025 2026+
$M
Mortgage payable
Convertible debentures
Mortgages
• $47.3M refinancing completed in
May 2021 and $60.8M coming due
in second half of 2021.
• Out of the $47.3M refinanced,
$15.8M of equity top up.
15
Debenture
Debenture Series H with a conversion price @
$3.64. Already $3.3 million converted in Q1 2021,
$3.9 million cumulative.

CLOSING REMARKS
MICHEL LÉONARD
PRESIDENT & CEO
175 Rotterdam Street, Saint-Augustin de Desmaures, Quebec City
16