bses project billing process
TRANSCRIPT
SUMMER TRAINING REPORT
CONDUCTED AT
RAJDHANI POWER LTD.ON
BILLING PROCEDURE
AND
ANALYSIS OF FINANCIAL
STATEMENTS
in partial fulfillment of the requirements
for the award of degree of Masters Of Business Administration
2012-2014
Submitted By:-
Vincent Daniel Clement
1

DECLARATION
I VINCENT DANIEL CLEMENT, of GGSIPU here by declare that the project entitled
“BILLING SYSTEMS” is an original work & same has not been submitted to any other
institute for the award of any other degree. The interim report was presented to the
Supervisor Mr. Anand Ming . The feasible suggestions have been duly incorporated in
consultation with the supervisor.
Signature of Candidate
ACKNOWLEDGEMENT
2

I take this opportunity to extend my sincere thanks to BSES Power Ltd., Lajpat Nagar-2,
for offering a unique platform to earn exposure and garner knowledge in the field of
Human Resource Management
I am thankful to my superior and project guide, Mr.Anand Ming,APO, BSES Power
Ltd., Lajpat Nagar-2, for his kind support, guidance and encouragement he has extended
to me throughout the project.
I would like to thank Mr. Vinod Singh (S.O), Roop Singh(S.O) and Subhash (AG-2),
BSES Power limited, Lajpat Nagar, New Delhi for providing me all facilities during my
project and for his consistence support, perseverance and able guidance throughout the
project.
I would like to thank the entire BSES team for their direct and indirect inputs towards
this project.
Working through this project has been indeed a very enriching experience.
Vincent Daniel Clement
MBA
3

TABLE OF CONTENTS
ACKNOWLEDGEMENTS ……………………………………………………… 3
ABSTRACT ……………………………………………………………………… 7
OBJECTIVES OF REPORT ……………………………………………………. 9
INTRODUCTION TO POWER SECTOR, DELHI …………………………… 10
COMPANY PROFILE ………………………………………………………….. 14
MISSION AND VISION……………………………………………………….… 17
BILLING PROCESS …………………………………………………………….. 19
TYPES OF BILLING ……………………………………………………………. 20
BILLS …………………………………………………………………… ………. 22
WORK PERFORMED BY BILLING Dept. ………………………………… … 30
ANALYSIS OF STATEMENTS ………………………………………………… 31
CLASSIFICATIONS OF RATIOS ………………………………………………. 33
RATIO ANALYSIS …………………………………………………………… … 36
TRANSMISSION & DISTRIBUTION (T&D) LOSS ………………………….. 54
AGGREGATE TECHNICAL & COMMERCIAL (AT&C) LOSS……………… 55
REASONS FOR AT&C LOSS………………………………………………… 57
CAUSES FOR LOW REVENUE REALIZATION…………………………….. 58
MEASURES FOR CURBING POWER THEFT AND AT&C LOSS REDUCTION
STRATEGIES…………………………………………………………………….. 59
BIBLIOGRAPHY ………………………………………………………………….63
4

LIST OF TABLES
Topic Page No.
Details of BRPL and BYPL 16Details of Current Ratio 37Details of Quick Ratio 39Details of Debt- Equity Ratio 41Details of Working Capital Ratio 43Details of Debt to Total Fund Ratio 45Details of Current Cash Debt Equity Ratio 46Details of Cash Return on Sales Ratio 48Details of Cash Interest Coverage Ratio 50Details of Fixed Asset Purchase Ratio 52
5

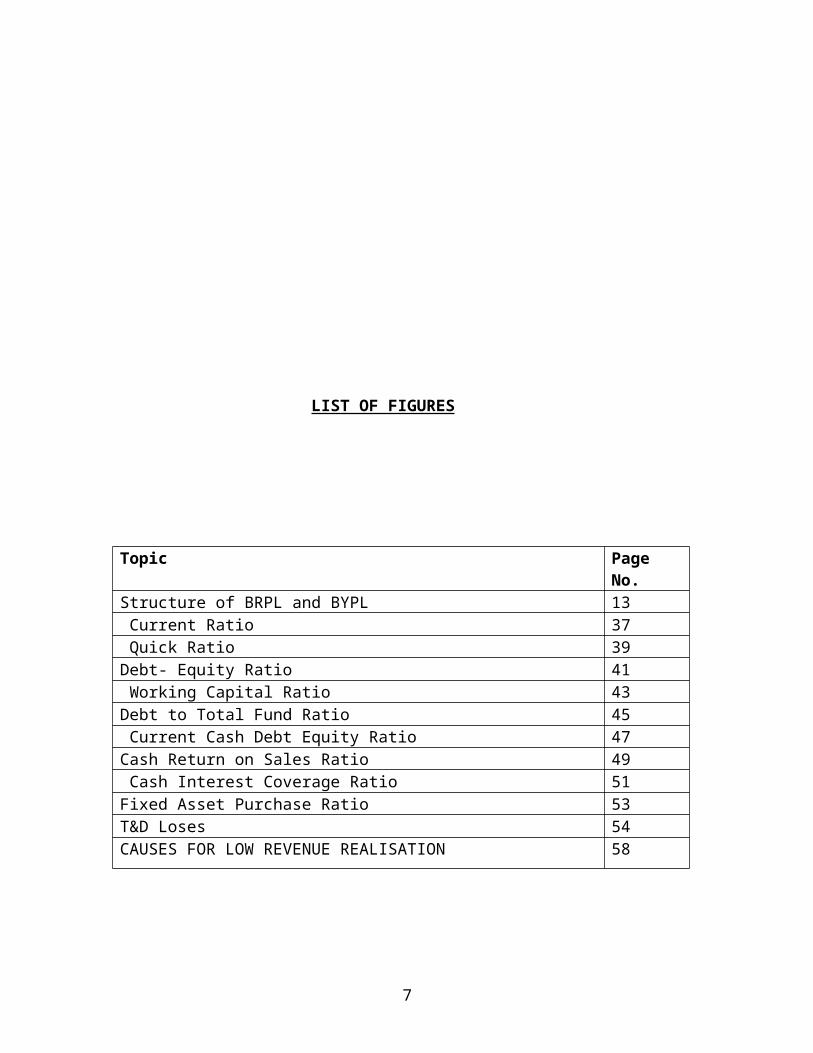
LIST OF FIGURES
Topic Page No.
Structure of BRPL and BYPL 13 Current Ratio 37 Quick Ratio 39Debt- Equity Ratio 41 Working Capital Ratio 43Debt to Total Fund Ratio 45 Current Cash Debt Equity Ratio 47Cash Return on Sales Ratio 49 Cash Interest Coverage Ratio 51Fixed Asset Purchase Ratio 53T&D Loses 54CAUSES FOR LOW REVENUE REALISATION 58
6
ABSTRACT
The Indian power sector is plagued by a number of problems. These include inadequate
generation capacities, poor capacity utilization, very high transmission losses, high
AT&C (Aggregate of technical and commercial losses) resulting from power thefts and
poor project implementation.
Not withstanding the massive increase in generation capacities over the
past decades, the history of the Indian power sector has been punctuated by shortages,
massive pilferages and a demand-supply gap, which has been growing. The shortages
have been so chronic that, at times fears have been expressed about a negative impact on
industrialization due to these shortages.
This report is the documentation of analysis of HUMAN RESOURCE
MANAGEMENT of BSES RAJDHANI POWER LTD. This report briefly describes the
systematic approach adopted to analyze the financial statements of both the companies
and compare its performance in the last four years. The report contains the financial
analysis done with the help of accounting ratios. The aggregate of technical and
commercial losses is also discussed in detail, which results in low revenue realization for
the companies and thereby resulting in lower profits. Moreover, in the report the
measures have been suggested for containing power thefts and reducing AT&C losses.
7

Objectives of the Report
First objective is to study the financial statements of BSES Power Ltd., Delhi
(BSES Rajdhani Power Ltd.), to understand the working of the company as a
whole and analyze the balance sheets on the basis of relevant parameters.
Performing a fundamental analysis on Aggregate Technical and Commercial
(AT&C) Losses and the methods to be adopted for reduction of the same in the
past years and also the years to follow.
To study the tariffs issued by Delhi Electricity Regulatory Commission (DERC)
for the billings to be made to the consumers.
To study and suggest ways for reducing AT&C losses and Transmission and
Distribution (T&D) losses in order to increase the profit of the organization.
8

INTRODUCTION TO POWER SECTOR,
DELHI
A massive investment in infrastructure is necessary for India to maintain its growth
trajectory. Traditionally, this has been a responsibility of the government. However, the
government has limited means – financially and organizationally to achieve this. As a
result, India has a huge infrastructure deficit. The Indian power sector is plagued by a
number of problems. These include inadequate generation capacities, poor capacity
utilization, very high transmission losses, high AT&C (aggregate of technical and
commercial losses) resulting from power thefts and poor project implementation. In this
environment, privatization and public–private partnerships are very important.
Privatization of electricity distribution in Delhi is an example, which has resulted in
significant improvement in all the operational parameters and consumer satisfaction
through effective management, process re-engineering and sustained capital investment.
General highlights:
The power sector at this juncture is plagued by a number of problems. These include
inadequate generation capacities, poor capacity utilization, very high transmission losses
and poor project implementation. Plant load factor (PLF) in most of the plants has been
very low compared to the power plants in other parts of the world. The sector has been
bogged down by resource constraints.
In India electricity tariffs are a politically sensitive issue and often create turmoil. This is
the reason for poor performance of most the state electricity boards (SEB) and has also
resulted in serious financial problems. Till date, the players have not started giving
adequate consideration to the alternate energy sources for power generation. Over the last
9

few years, capacity addition has been consistently falling short of demand. This has
resulted in a sharp increase in power shortage across the country.
Power sector:
For the last six decades INDIAN POWER SECTOR has achieved some remarkable
milestones:
Generation capacity has increased from 1,712 MW in 1950 to 1,28,581 MW.
The growth in the transmission lines has been from 3,708 ckm in to more than
2,50,000 ckm today.
Per capita electricity consumption has increased from 15 kwh to 606 kwh and
expected to grow to 932 kwh by 2012.
100% electrified cities.
More then 84% villages electrified.
5th largest energy consumption in the world.
Investment of Rs.25547 Cr via Five Year Plan (till IX plan).
Formation of Regional Grid and National Grid
Sector comments:
Notwithstanding the massive increase in generation capacities over the past decades, the
history of the Indian power sector has been punctuated by shortages, massive pilferages
and a demand-supply gap, which has been growing. The shortages have been so chronic
that, at times fears have been expressed
About a negative impact on industrialization due to these shortages.
Thus, while the figures for additional capacity being created may look impressive in
isolation, the fact is that the demand growth has always been higher than the supply.
Further, the capacity additions are significantly below the plan targets, particularly during
the eighth plan, where the capacity addition of about 16,000 MW showed a shortfall to
the extent of about 40 per cent from the revised plan target of around 29,000 MW.
10

Industry players and profile:
The power sector reveals that it can be largely segregated into four different categories on
the basis of type of players in the industry. These include:
Private Sector Licensees: In the private sector, some companies had been given
licenses to carry on generation and distribution activities. While some of these,
like BSES Limited, NDPL are generation and distribution companies others, like
Surat Electricity, are just distribution companies.
Independent Power Producers: The Independent Power Producers (IPPs) are
the companies that have been given a nod to set up generation capacities.
Central Government Corporations: which consist of corporations like the
National Thermal Power Corporation (NTPC), Nuclear Power Corporation,
National Hydro Electric Power Corporation (NHPC), and some other smaller
players.
State Government Corporations: which consist of the various state electricity
boards and other corporations that have been promoted by the respective
government’s Poor management, transmission and distribution (T&D) losses and
poor recoveries of dues are some of the factors, which are responsible for the
plight of these corporations. Currently, the financial health of many SEBs is
precarious and their revenue-raising capabilities are more or less dependent on
assured guarantees from the respective governments.
Finally, a look at the regulatory structure of the sector indicates that various Acts govern
the power sector. These provide for the tariff determination procedure for companies. It
also defines the various terms such as reasonable returns and capital base. However,
approvals of tariffs rest with the respective governments.
11

Figure-1
COMPANY PROFILE
Introduction to BSES (Delhi)
The privatization of Delhi’s power sector and unbundling of the Delhi Vidyut Board in
July 2002, the business of power distribution was transferred to three different
companies. Two of the three are BSES Yamuna Power Limited (BYPL) and BSES
Rajdhani Power Limited (BRPL). These two of the three successor entities distribute
electricity to 22.6 lacs customers in two thirds of Delhi. The Company acquired assets,
12

liabilities, proceedings and personnel of the Delhi Vidyut Board as per the terms and
conditions contained in the Transfer Scheme.
BSES Yamuna Power Limited (BYPL)
BYPL distributes power to an area spread over 200 sq kms with a population density of
4230 per sq km. It’s 10.4lakh customers are spread over 14 districts across Central and
East areas including Chandni Chowk, Daryaganj, Paharganj, Shankar Road, Patel Nagar,
G T Road, Karkardooma, Krishna Nagar, Laxmi Nagar, Mayur Vihar, Yamuna Vihar,
Nand Nagri and Karawal Nagar.
BSES Rajdhani Power Limited (BRPL)
BRPL distributes power to an area spread over 750 sq. km with a population density of
1360 per sq km. Its’ over 12.2 lakh customers are spread 19 districts across South and
West areas including Alaknanda, Khanpur, Vasant Kunj, Saket, Nehru Place,
Nizamuddin, Sarita Vihar, Hauz Khas, R K Puram, Janakpuri, Najafgargh, Nangloi,
Mundka, Punjabi Bagh, Tagore Garden, Vikas Puri, Palam and Dwarka.
Since taking over distribution, BSES’ singular mission has been to provide reliable and
quality electricity supply. BSES has invested over Rs 3500 crore on upgrading and
augmenting the infrastructure which has resulted in a record reduction of AT&C losses.
From a high of 63.1 % AT&C losses in BYPL area the losses have come down to 39.03%
a record reduction around 24%.
Similarly, in BRPL area AT&C losses have been reduced from 51.2% to 29.2% - a record
reduction of 22%.
13
PARTICULARS UNITS
BYPLEast & central
BRPLSouth & west
BSESDelhi
1.Area sq. km 200 750 950
2.
Customer density
Cons/sq
km
4230 1360 5590
3.Total Registered
Customers Lacs 20.8 24.4 45.2
4.
Peak Demand MW 1800 2840 46400
5.Consumption per year MU 10000 16000 26000
Table-
14

Vision and Mission
Vision
To be amongst the most admired and most trusted integrated utility companies in
the world.
To deliver reliable and quality products and services to all customers at
competitive costs, with international standards of customer care- thereby creating
superior value for all stakeholders.
To set new benchmarks in: standards of corporate performance and governance,
through the pursuit of operational and financial excellence, responsible citizenship
and profitable growth.
15

Mission
To attain global best practices and become a world-class utility
To provide: uninterrupted, affordable, quality, reliable, safe and clean power to
our customers.
To achieve excellence in: service, quality, reliability, safety and customer care.
To earn: trust and confidence of all customers and stakeholders by exceeding their
expectations, and make the company a respected household name.
To work: with vigor, dedication and innovation keeping total customer
satisfaction as the ultimate goal
To consistently achieve: high growth with the highest levels of productivity
To be: a technology driven, efficient and financially sound organization
To be a responsible corporate citizen nurturing human values and concern for
society, the environment and above all, people
To contribute: towards community development and nation building.
To promote a work culture that fosters: individual growth, team sprit and
creativity to overcome challenges and attain goals.
To encourage: ideas, talent and value systems
To uphold the guiding principles of: trust, integrity and transparency in all aspects
of interactions and dealings.
BSES’ journey
16
The legacy that BSES inherited was akin to taking over a sick unit, and also the associated risk of handling Delhi’s power distribution. Clearly, the challenge for BSES was huge. However, over the past seven years, BSES has achieved success on most fronts and is poised to have Delhi achieve global benchmarks in the years to come.
BSES discoms’ achievements:The opening bid level AT&C losses set by Delhi Electricity Regulatory Commission (DERC) in its tariff order dated February 2002 was 48.10% for BRPL and 57.20% for BYPL. At the time of takeover for BRPL, actual AT&C losses were much higher at 51.54%. This is now reduced to 27.17%. For BYPL, it was 63.16% now down at 29.82%. In fact, in FY08, BYPL was the first discom to achieve the highest reduction in an year, by approximately 10%. Averaging at 4% a year, BSES is way ahead of the national AT&C loss average of 1%. To cut its AT&C losses BSES used a combination of measures like replacing electro-mechanical meters with electronic meters, mammoth infusion of capex for entire distribution system, bringing new consumers into un-electrified areas, aggressive drive to curb theft, improved collection efficiency, speedy settlement of disputes through special courts, and recovery of dues.
Revenue growth and tariff perspective:Revenue has more than doubled in the last six years. In FY08, BSES discoms’ total income from energy billing was Rs.4, 400 crore (net of taxes). BSES also sold or banked surplus power aggregating Rs.1, 200 crore. Revenue from sale of surplus power impacts consumer tariff by lowering power purchase cost. In FY08, BSES discoms average retail tariff per unit without taxes was approximately Rs.4.27, which is quite low as compared with existing rates in the NCR and major cities.
Financial benefits from distribution reforms:BSES discoms have made a substantial investment in infrastructure of Rs.3, 240 crore (approx.). BSES has also paid loans taken in the opening Balance Sheet of Rs.864 crore to Delhi Power Corporation Limited, and Rs.465 crore in old dues of erstwhile DVB, and the Government. It has also met all payment obligations, including dues to generating companies, and secure its large payment obligation with LC and escrow arrangements. The significant reductions in AT&C losses in such a short duration have helped in better cost recovery.
Network and Infrastructure
17

System up-gradation and improvements:BSES has been upgrading and modernizing its distribution systems. It has adopted technologies and processes conforming to global benchmarks, and electrified previously un-electrified areas. It has also introduced high-voltage distribution systems to ensure there is no theft. There has been notable growth in ground facilities of new grids, power transformers, distribution transformers, extra-high voltage cable lengths, and LT lines. BSES has augmented its network strengths for Delhi distribution to cater to peak demand of 4200 MW against approximately 2900 MW in FY02. it has also shown significant improvement in reducing equipment failures and breakdown resolution. Through all these efforts the Delhi consumer is experiencing improved load shedding, voltage quality, stability in power supply, fault repairing, and response time.Success of electronic metering:With domestic consumers constituting close to 80 percent of the consumer mix, a strong meter measurement system to arrest revenue leakage was a pre-requisite. BSES has installed electronic meters, despite extensive opposition, with Government support and favorable court verdicts. Electronic meters are downloadable with no manual intervention and the quality of meter readings have improved, reducing leakage. Electronic meters also facilitate an analysis of consumer usage patterns, and the data is useful in resolving related grievances. For the high-end key consumers another milestone has been achieved by introducing automatic meter reading. BSES has also metered all the 9000-plus distribution transformers, which will enhance effective energy audits to identify high loss areas.Network and asset mapping:BSES advocates importance of network and asset mapping through global edge technologies available on SCADA and GIS platform. It has implemented SCADA across all extra high voltage grid networks with remote management through a centralized station. Further ,all electrical assets including transformers have been , or are ,in the process of GIS mapping. IT Infrastructure enhancement For end-to-end integration of various functions and processes, BSES has made major investments to bring its IT capabilities to global standards. It has developed the largest single-location IT network in North India; 330 offices are networked with 24*7*365 monitoring and uptime maintained at 99 percent. It has deployed about 3800 PCs and 800 printers across these locations. With large consumer database to manage on a round-the-clock basis, BSES has continuous database support and monitoring of 40 servers and network attached centralized storage set up of 4 TB with 200 users connected, ensuring 100 percent uptime. It has a workforce of nearly 9000 people trained in related IT capabilities. Functions of finance, materials, metering and billing are all integrated on SAP, BSES is now implementing a more advanced IT system for revenue cycle management- SAP(ISU/CCS).
18

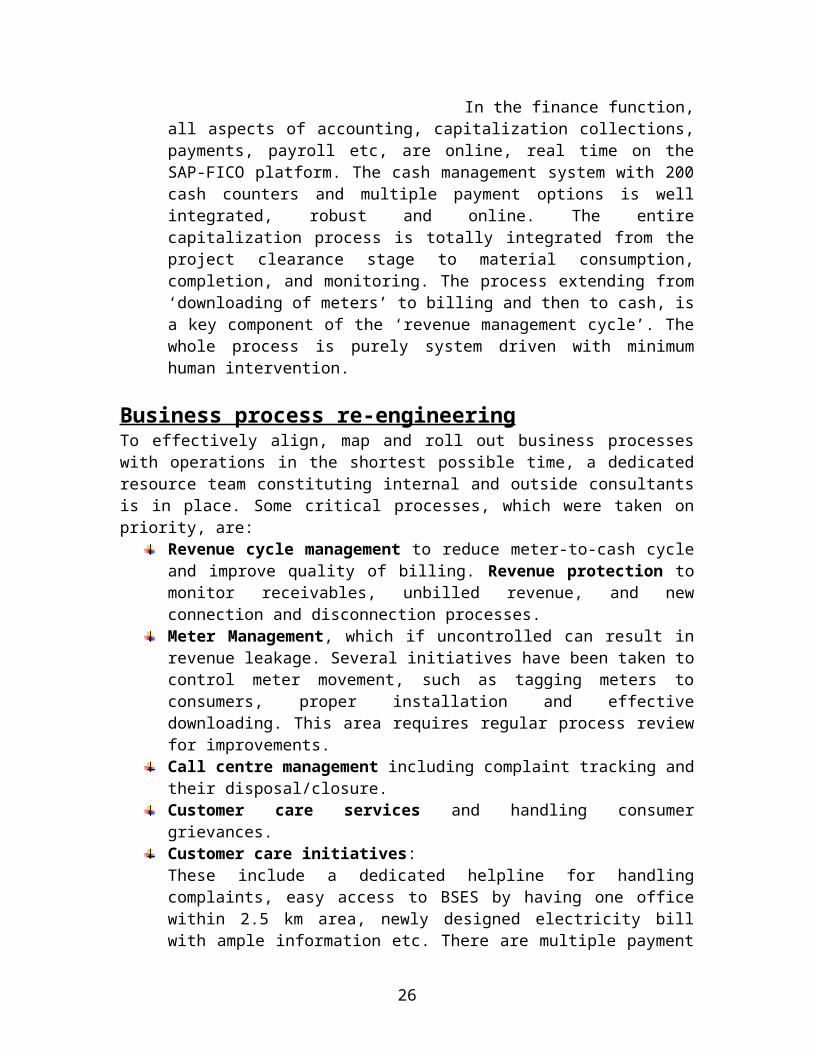
In the finance function, all aspects of accounting, capitalization collections, payments, payroll etc, are online, real time on the SAP-FICO platform. The cash management system with 200 cash counters and multiple payment options is well integrated, robust and online. The entire capitalization process is totally integrated from the project clearance stage to material consumption, completion, and monitoring. The process extending from ‘downloading of meters’ to billing and then to cash, is a key component of the ‘revenue management cycle’. The whole process is purely system driven with minimum human intervention.
Business process re-engineeringTo effectively align, map and roll out business processes with operations in the shortest possible time, a dedicated resource team constituting internal and outside consultants is in place. Some critical processes, which were taken on priority, are:
Revenue cycle management to reduce meter-to-cash cycle and improve quality of billing. Revenue protection to monitor receivables, unbilled revenue, and new connection and disconnection processes.Meter Management, which if uncontrolled can result in revenue leakage. Several initiatives have been taken to control meter movement, such as tagging meters to consumers, proper installation and effective downloading. This area requires regular process review for improvements. Call centre management including complaint tracking and their disposal/closure.Customer care services and handling consumer grievances.Customer care initiatives:These include a dedicated helpline for handling complaints, easy access to BSES by having one office within 2.5 km area, newly designed electricity bill with ample information etc. There are multiple payment options with approximately 2000 touch points through drop boxes, ‘easy bill’, credit cards, and internet etc. Customer care centers are now well equipped and provide single-window clearance for most issues. BSES website bsesdelhi.com has been re-launched with enhanced features and information.Organizational restructuring:
Post-privatization, BSES paid rs.227 crore to more than 4300 employees under a special VRS scheme. Absorbing the remaining erstwhile DVB employees has been a critical challenge, but with adequate support from the government and unions, today is’ ONE TEAM’. BSES has a planned strategy to outsource some critical activities of meter and billing management and the current strength of outsource manpower is approximately 4500. BSES discoms also have AMC manpower contracts handling operations and maintenance, security, housekeeping etc. BSES has taken major steps to define roles, responsibility and accountability at each level of operation. The entire performance management is on SAP with a well laid out goal-setting process and mid-term reviews
19

BILLING PROCESS
There are a total of Thirty Three (33) divisions under BSES.
19 in BRPL
14 in BYPL
In each division there are nine cycles. Each cycle comprises of binders that represent a
batch of consumers included in the cycle.
The consumer’s category as per tariff is given below:-
Domestic and Small Industrial Power (SIP)
Mixed Load Consumer Cell (MLCC)
Key Consumer Cell (KCC)
1. Railways
2. Water (Delhi Jal Board)
3. Large Industrial Power
4. Small Industrial Power (SIP
Government Consumer Cell (GCC)
Street Lightening (STG)
Temporary Illumination (TI)
Theft
1. Dishonest Abstraction of Energy (DAE)
2. Fraudulent Abstraction of Energy (FAE)
Consumers having load of less than 11 KW are covered under K & SIP (Domestic
Consumer) and having more than 11 KW are covered under MLCC.
K & SIP (Domestic Consumers) have nine cycles. Billing of 1 to 8 is on bimonthly basis
and of 9 is on monthly basis. The cycle of MLCC (A to H) is on monthly basis.
20

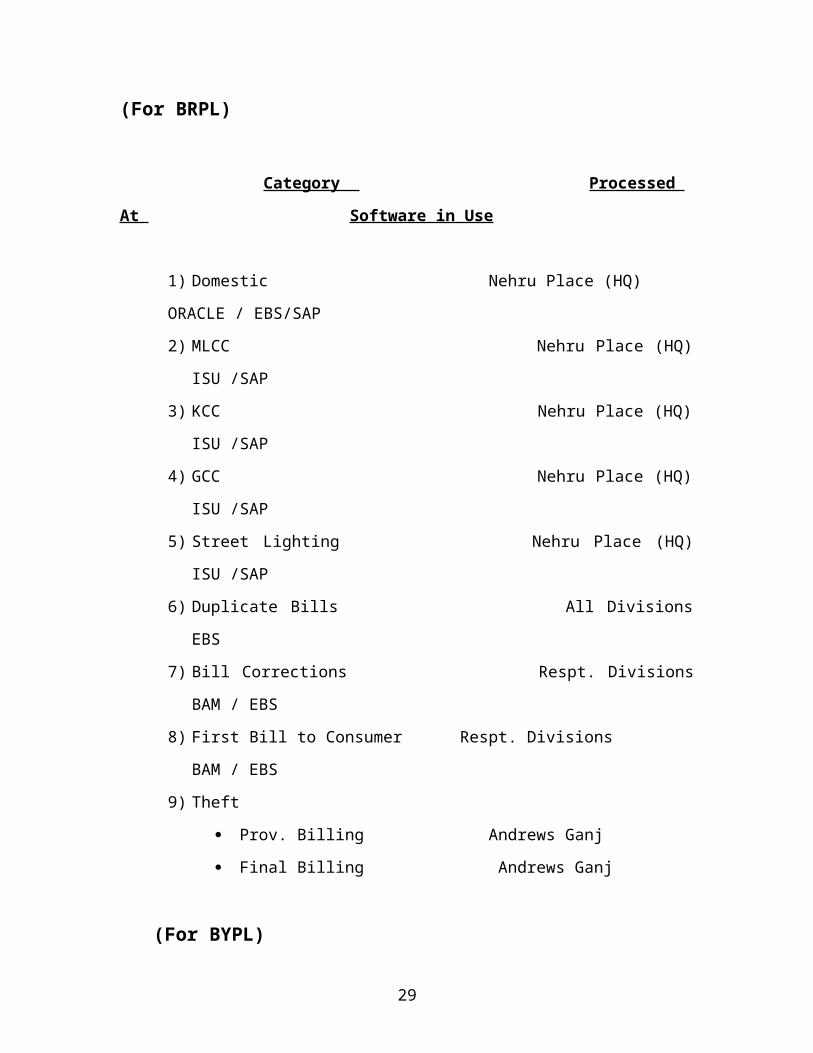
TYPES OF BILLING(For BRPL)
Category Processed At Software in Use
1) Domestic Nehru Place (HQ) ORACLE / EBS/SAP
2) MLCC Nehru Place (HQ) ISU /SAP
3) KCC Nehru Place (HQ) ISU /SAP
4) GCC Nehru Place (HQ) ISU /SAP
5) Street Lighting Nehru Place (HQ) ISU /SAP
6) Duplicate Bills All Divisions EBS
7) Bill Corrections Respt. Divisions BAM / EBS
8) First Bill to Consumer Respt. Divisions BAM / EBS
9) Theft
Prov. Billing Andrews Ganj
Final Billing Andrews Ganj
(For BYPL) Category Processed At Software in Use
1) Domestic / SIP Kadkadoma (HQ) ORACLE / EBS/SAP
2) MLCC Kadkardoma (HQ) ISU /SAP
3) KCC Kadkardoma (HQ) ISU /SAP
4) GCC Kadkardoma (HQ) ISU /SAP
5) Street Lighting Kadkardoma (HQ) ISU /SAP
6) Duplicate Bills All Divisions EBS
7) Bill Corrections Respt. Divisions BAM / EBS
8) First Bill to Consumer Respt. Divisions BAM / EBS
9) Theft
21

Prov. Billing Patpar Ganj
Final Billing Patpar Ganj
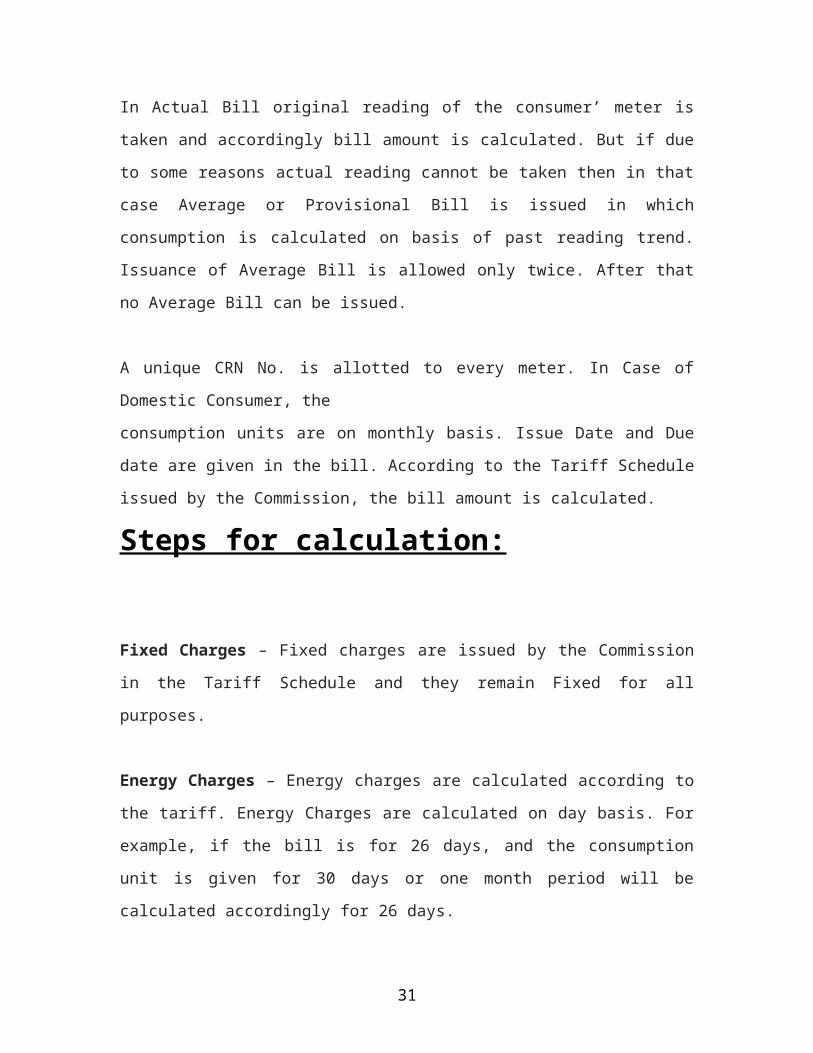
BILLSBills are of two types – Actual and Average.
In Actual Bill original reading of the consumer’ meter is taken and accordingly bill
amount is calculated. But if due to some reasons actual reading cannot be taken then in
that case Average or Provisional Bill is issued in which consumption is calculated on
basis of past reading trend. Issuance of Average Bill is allowed only twice. After that no
Average Bill can be issued.
A unique CRN No. is allotted to every meter. In Case of Domestic Consumer, the
consumption units are on monthly basis. Issue Date and Due date are given in the bill.
According to the Tariff Schedule issued by the Commission, the bill amount is
calculated.
Steps for calculation:
Fixed Charges – Fixed charges are issued by the Commission in the Tariff Schedule and
they remain Fixed for all purposes.
Energy Charges – Energy charges are calculated according to the tariff. Energy Charges
are calculated on day basis. For example, if the bill is for 26 days, and the consumption
unit is given for 30 days or one month period will be calculated accordingly for 26 days.
Electricity Tax – It is calculated on the Energy Charges.
Subsidy- It has been cancelled by the Commission in the new Tariff Schedule 2009-10.
Arrears – Any arrear amount of the consumer will be added to the current bill.
22

I. MLCC BILLING PROCEDURE
Cycle wise meter reading is conducted as per schedule given by the company. Master
Data for reading is exported by MLCC(mixed load consumer cell) bill processing team at
HQ and communicated further. Meter reader punches the readings of consumers in to the
CMRI. The meter reading is uploaded daily through updated Form Y at divisional data
centre. After pre-audit, final data for billing is exported to SAP at HQ. Edit is generated
for billing. After edit list is generated, checking is carried out to check is all binders have
been billed or not. Post audit check of ledger is carried out by the team. After post audit
clearance Bill Print File is generated and sent for printing. Printed Bills are sent to
respective MLCC circle offices for distribution. Payments are made by consumers
through various channels.
II. K & SIP BILLING PROCEDURE
Meter reading is conducted cycle wise as per schedule given by the company. The meter
reading is uploaded daily through Form 4 at Divisional Data Centre. After Pre Audit,
final Data for Billing is loaded and transferred to SAP at HQ. Edit is generated for
billing. After edit is checked and finalized due date is allotted and checking is carried out
to confirm if all the binders have been billed or not. After Post Audit clearance, bill print
file is generated and bills are sent for printing. Printed Bills are sent to respective
divisions for distribution. Consumer is given fourteen to fifteen days time for making the
payment.
Calculation of the given bill is as follows:
Fixed Charges (Monthly Basis)
23

Since the load i.e., 3 KW falls between 2 to 5 KW Load, the fixed charge is of Rs. 60 per
month. Therefore,
FIXED CHARGES = Rs. 60/month
Note: In this actual load is 3 KW but the person has revised his load which is now given
as 6.62 KW.
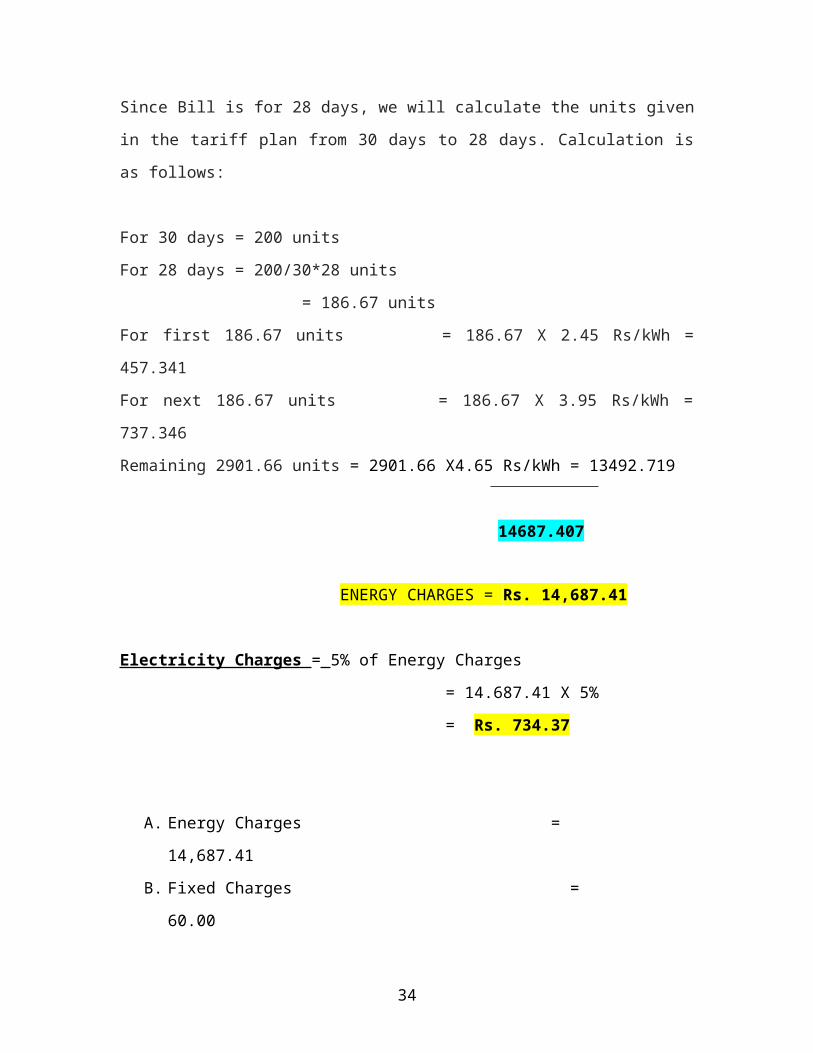
Energy Charges (Day Basis)
Since Bill is for 28 days, we will calculate the units given in the tariff plan from 30 days
to 28 days. Calculation is as follows:
For 30 days = 200 units
For 28 days = 200/30*28 units
= 186.67 units
For first 186.67 units = 186.67 X 2.45 Rs/kWh = 457.341
For next 186.67 units = 186.67 X 3.95 Rs/kWh = 737.346
Remaining 2901.66 units = 2901.66 X4.65 Rs/kWh = 13492.719
14687.407
ENERGY CHARGES = Rs. 14,687.41
Electricity Charges = 5% of Energy Charges
= 14.687.41 X 5%
= Rs. 734.37
A. Energy Charges = 14,687.41
B. Fixed Charges = 60.00
C. Electricity Tax = 734.37
D. Arrears = 7.92
E. Energy Subsidy = (1,717.92)
24

F. Amount Payable = 13,771.78
The total amount payable by the consumer by the due date is Rs. 13,771.79 If the
consumer fails to pay the amount by the due date then 1.5% of total amount will be added
to the actual amount as Late Charges and the bill will be of Rs. 13,978.37
III. STREET LIGHTING PROCEDURE
List of street lighting points energized for the particular month is received from
concerned agencies, i.e., MCD, DDA and Private Parties. Physical verification is
conducted from both sides and a Performance Report is prepared and sent to KCC for
billing. Based on the performance report and the total no. of street lighting points
energized, billing is done for the month in the succeeding month. Billing is done on the
basis of relevant tariff and on the guidelines issued by DERC from time to time. On the
basis of performance report incentive and penalties are included at the time of billing.
After necessary correction if any, bill is printed for dispatch to concerned parties through
post.
Procedure Followed:-
List of Street Lighting Points installed by various agencies is sent by the
respective agencies to BSES.
Billing done on Street Lighting Points installed by MCD, DDA and Private
Parties in their respective areas.
Physical Survey is done by BSES (i.e. , respective Journal Entry of the division)
along with the respective representation of MCD, DDA and Private Parties.
On the basis of survey done, performance report is prepared. On the basis of this
report incentives and penalties are charged/ levied and included in the billing in
the succeeding month.
25
Finally Bills are printed for dispatch to respective departments through speed post
and some times manually also.
Calculations:-
1. Formula used for calculating of Street Lighting charges :-
( No. of Points * Watts * Hours * Days ) / 100 = Consumption
2. Energy Charges = Consumption * Rs. 4.60
3. Maintenance Charges = Rs. 73/- per point
4. For Police Booths = Rs. 269/- Per Booth / Month
5. For Signal/ Blinkers = Rs. 269/- Per Point / Month
IV. BULK SUPPLY BILLING PROCEDURE
(KEY CONSUMER CELL)
Consumers with Current Transformer Meter and Load of 45 KW or more are billed in
KCC. Meter reading is taken by the Meter Management Group for KCC using common
meter reading instrument (CMRI) and automated meter reading (AMR). CMRI readings
are taken from 1st to 10th of every month. Whereas AMR readings are taken from
midnight of the previous month to the 5th of current month. Readings taken by CMRI
and AMR is uploaded in to KCC server at HQ. Edit list is generated and after checking is
done, edit list is generated in the system itself. Bills are printed from Oracle Server and
sent to consumers. Consumers are given a period of fourteen days for payment.
26

V. GOVERNMENT CONSUMER CELL BILLING
PROCEDURE
All Government consumers are billed by this department. Meter reading is taken by meter
management group by CMRI and AMR. Edit list is generated on a daily basis. After
checking of the edit list, Edit text is generated in the system. After checking is complete,
Bills are sent for printing. Printed bills are then delivered manually to the respective
consumers. Consumers are given a period of fourteen days for payment.
VI. TEMPORARY CONNECTIONS BILLING PROCEDURE
Commercial Department:
Firstly the consumers will fill an application which is checked and then sent to the
competent authority for sanction. Then the demand note for depositing security amount is
raised.
Cashier:
Security amount is deposited by the consumer against the demand note.
Commercial Office:
Progress chart is sent to the zone office for energizing the meter for the particular period.
Zonal Office:
Progress report is then sent back to the commercial department along with the Test
Report.
District Office:
File is sent to district office with all the data. File is processed and bill is raised for
payment.
27

DIRECT THEFT AND FRAUDULENT ABSTRACTION OF
ENERGY
On the basis of detection by field staff, raid is organized. Raid team is constituted. The
team inspects the concerned premises and prepares a report giving details of meter.
In case of direct theft a report is lodged with the local police along with
evidences.
In case of fraudulent abstraction, the inspection team shall disconnect the
tampered meter and shall restore the supply through a new meter. The report is handed
to the consumer.
Energy consumption for the past six months is assessed and the final assessment bill is
prepared on five times the applicable tariff.
PROCESS FOLLOWED FOR THEFT BILLING
1. Theft Cases are of two types :-
o Direct Theft (DT) Billed on 100% on the basis of load assessed.
o Fraudulent Abstraction of Energy (FAE)- generally cases of tampering of
Meter.
2. Formula used for Calculation :-
Load assessed * no. of days * no of hours * load factor * six months
Domestic = Load assessed * 30 days * 8 hrs * 0.4 (40%)
Non-Domestic = Load assessed * 25 days * 10 hrs * 0.6 (60%)
28
In case of Direct Theft Load Factor is 1 (100%)The no. of hours may vary depending upon the hrs of usage in case of Industries
i.e. single shift, double shift.
3. Electricity Tax is calculated at 5% on the figure arrived at in step 2.
4. The figure in step 2 is multiplied by five to add the penalty amount.
5. Total Billing = Step 4 + Step 3
6. In case of Direct theft if the customer doesn’t pay within the due date FIT is
lodged. In case of FAE, FIR is not lodged.
7. Collections are made through case and DD only at Andrews Gunj Office.
The Actual Work Performed by the Finance (Billing) Department:
Firstly, the IT department provide the data to finance (billing) department
consisting of the Actual Bill, the revised data i.e., adjustments (if any) received,
and the net of both that is the net bill.
Then the data that is received is checked by the finance department – Actual +
Adjustments = Net Bill
If the data is okay, then it will be informed to the IT department.
After that, IT department will send the SAP data to finance department for
checking and the SAP data is checked and it is then matched with the data
received earlier. If the SAP data is okay then IT department will post the data in
SAP.
Data from SAP is extracted to MS Excel and it will again be matched with that
actual data.
If all okay then entries will be posted in SAP.
Then Management Information Sources (MIS) report is prepared and submitted to
the department head.
29

ANALYSIS OF STATEMENTS
MEANING OF A RATIOA ratio is one figure express in terms of another figure. It is a mathematical yardstick that
measures the relationship two figures, which are related to each other and mutually
interdependent. Ratio is express by dividing one figure by the other related figure. Thus a
ratio is an expression relating one number to another. It is simply the quotient of two
numbers. It can be expressed as a fraction or as a decimal or as a pure ratio or in absolute
figures as “so many times”. As accounting ratio is an expression
Relating two figures or accounts or two sets of account heads or group contain in the
financial statements.
RATIO ANALYSISFundamental Analysis has a very broad scope. One aspect looks at the general
(qualitative) factors of a company. The other side considers tangible and measurable
factors (quantitative). This means crunching and analyzing numbers from the financial
statements. If used in conjunction with other methods,
Quantitative analysis can produce excellent results.
Ratio analysis isn't just comparing different numbers from the balance sheet,
income statement, and cash flow statement. It's comparing the number against previous
years, other companies, the
Industry or even the economy in general. Ratios look at the relationships between
individual values and relate them to how a company has performed in the past, and might
perform in the future.
30
BALANCE SHEET ANALYSISAnalyzing a balance sheet is fundamental knowledge for anyone who wishes to carefully
select solid and profitable investments. The balance sheet is the basic report of a firm's
possessions, debts and capital. The composition of these three items will vary
dramatically from firm to firm. As an investor, you need to know how to examine and
compare balance sheets of different companies in order to select the investment that
meets our needs.
NEED FOR ANALYSING A BALANCE SHEET The analysis of a balance sheet can identify potential liquidity problems. These may
signify the company's inability to meet financial obligations. An investor could also spot
the degree to which a company is leveraged, or indebted. An overly leveraged company
may have difficulties raising future capital. Even more severe, they may be headed
towards bankruptcy. These are just a few of the danger signs that can be detected with
careful analysis of a balance sheet.
Beyond liquidity and leverage, the following section will discuss other analysis such as
working capital and bankruptcy. As an investor, you will want to know if a company you
are considering is in danger of not being able to make its payments. After all, some of the
company's obligations will be to you if you choose to invest in it.
CLASSIFICATION OF RATIOS
1.) BASED ON FINANCIAL STATEMENT : Accounting ratios express the
relationship between figures taken from financial statements. Figures may be taken from
Balance Sheet, Profit & Loss A/C, or both. One-way of classification of ratios is based
upon the sources from which are taken.
A) Balance sheet ratio:
31

If the ratios are based on the figures of balance sheet, they are called Balance Sheet
Ratios. E.g. ratio of current assets to current liabilities or ratio of debt to equity. While
calculating these ratios, there is no need to refer to the Revenue statement. These ratios
study the relationship between the assets & the liabilities, of the concern. These ratio help
to judge the liquidity, solvency & capital structure of the concern. Balance sheet ratios
are Current ratio, Liquid ratio, and Proprietary ratio, Capital gearing Ratio, Debt equity
ratio, and Stock working capital ratio.
B) Revenue ratio:Ratio based on the figures from the revenue statement is called revenue statement ratios.
These ratios study the relationship between the profitability & the sales of the concern.
Revenue ratios are Gross profit ratio, Operating ratio, Expense ratio, Net profit ratio, Net
operating profit ratio, Stock turnover ratio.
C) Composite ratio:These ratios indicate the relationship between two items, of which one is found in
the balance sheet & other in revenue statement. There are two types of composite ratios:-
a) Some composite ratios study the relationship between the profits & the investments of
the concern. E.g. return on capital employed, return on proprietors fund, return on equity
capital etc.
b) Other composite ratios e.g. debtors turnover ratios, creditors turnover ratios, dividend
payout ratios, & debt service ratios.
2.) BASED ON FUNCTION: Accounting ratios can also be classified according to
their functions in to liquidity ratios, leverage ratios, activity ratios, profitability ratios &
turnover ratios.
A) Liquidity ratios:
It shows the relationship between the current assets & current liabilities of the concern.
The following liquidity ratios are all designed to measure a company's ability to cover its
short-term obligations. Companies will generally pay their interest payments and other
short-term debts with current assets. Therefore, it is essential that a firm have an adequate
32

surplus of current assets in order to meet their current liabilities. If a company has only
illiquid assets, it may not be able to make payments on their debts. To measure a firm's
ability to meet such short-term obligations, various ratios have been developed. e.g.
liquid ratios & current ratios.
B) Leverage ratios: It shows the relationship between proprietors funds & debts used
in financing the assets of the concern e.g. capital gearing ratios, debt equity ratios, &
Proprietary ratios.
C) Activity ratios:It shows relationship between the sales & the assets. It is also known as Turnover ratios
& productivity ratios e.g. stock turnover ratios, debtors turnover ratios.
D) Profitability ratios:a) It shows the relationship between profits & sales e.g. operating ratios, gross profit
ratios, operating net profit ratios, expenses ratios.
b) It shows the relationship between profit & investment e.g. return on investment, return
on equity capital.
E) Coverage ratios:It shows the relationship between the profit on the one hand & the claims of the outsiders
to be paid out of such profit e.g. dividend payout ratios & debt service ratios.
3.) BASED ON USER: These ratios are user defined.
A) Ratios for short-term creditors:Current ratios, liquid ratios, stock working capital ratios.
B) Ratios for the shareholders:Return on proprietors fund, return on equity capital.
C) Ratios for management:
33
Return on capital employed, turnover ratios, operating ratios, expenses ratios
D) Ratios for long-term creditors:Debt equity ratios, return on capital employed, proprietor ratios.
CURRENT RATIO
This ratio compares the current assets with the current liabilities. It is also known as
‘working capital ratio’ or ‘ solvency ratio’. It is expressed in the form of pure ratio. E.g.
2:1
The current assets of a firm represents those assets which can be, in the ordinary
course of business, converted into cash within a short period time, normally not
exceeding one year. The current liabilities defined as liabilities which are short term
maturing obligations to be met, as originally contemplated, with in a year.
Current ratio (CR) is the ratio of total current assets (CA) to total current liabilities
(CL). Current assets include cash and bank balances; inventory of raw materials, semi
finished and finished goods; marketable securities; debtors (net of provision for bad and
doubtful debts); bills receivable; and prepaid expenses. Current liabilities consist of trade
creditors, bills payable, bank credit, provision for taxation, dividends payable and
outstanding expenses. This ratio measures the liquidity of the current assets and the
ability of a company to meet its short-term debt obligation.
CR measures the ability of the company to meet its CL, i.e., CA gets converted into
cash in the operating cycle of the firm and provides the funds needed to pay for CL. The
higher the current ratio, the greater the short-term solvency.
Recommended current ratio is 2: 1. Any ratio below indicates that the entity may
face liquidity problem but also Ratio over 2: 1 as above indicates over trading, that is the
entity is under utilizing its
current assets. Its formula is:-
34

CURRENT RATIO= CURRENT ASSETS / CURRENT LIABILITIES
(Rs in crores)
Year BSES Rajdhani C.R.
2005-2006 784.04/ 891.36 0.879
2006-2007 664.12/ 598.28 1.110
2007-2008 883.41/ 935.62 0.944
2008-2009 659.19/ 497.19 1.326
2009-2010 1897.89/ 843.59 2.249
Table-2
35

Figure-2
The Current Ratio measures the firm's ability to pay their current obligations.
The greater extent to which current assets exceeds current liabilities, the easier the can
meet its short term obligation.
Here we can see that in year 2005-06, current liabilities increases current assets but in
years 2007-08, 2008-09 and 2009-10, there is a increase in current assets n liabilities
decrease.
Hence, the company can easily meet its short term obligations.
ACID TEST RATIO OR QUICK RATIO
Liquid ratio is also known as acid test ratio or quick ratio. Liquid ratio compare the quick
assets with the quick liabilities. It is expressed in the form of pure ratio. E.g. 1:1. The
term quick assets refer to current assets, which can be converted into, cash immediately
or at a short notice without diminution of value.
Quick Ratio (QR) is the ratio between quick current assets (QA) and CL. QA refers
to those current assets that can be converted into cash immediately without any value
36

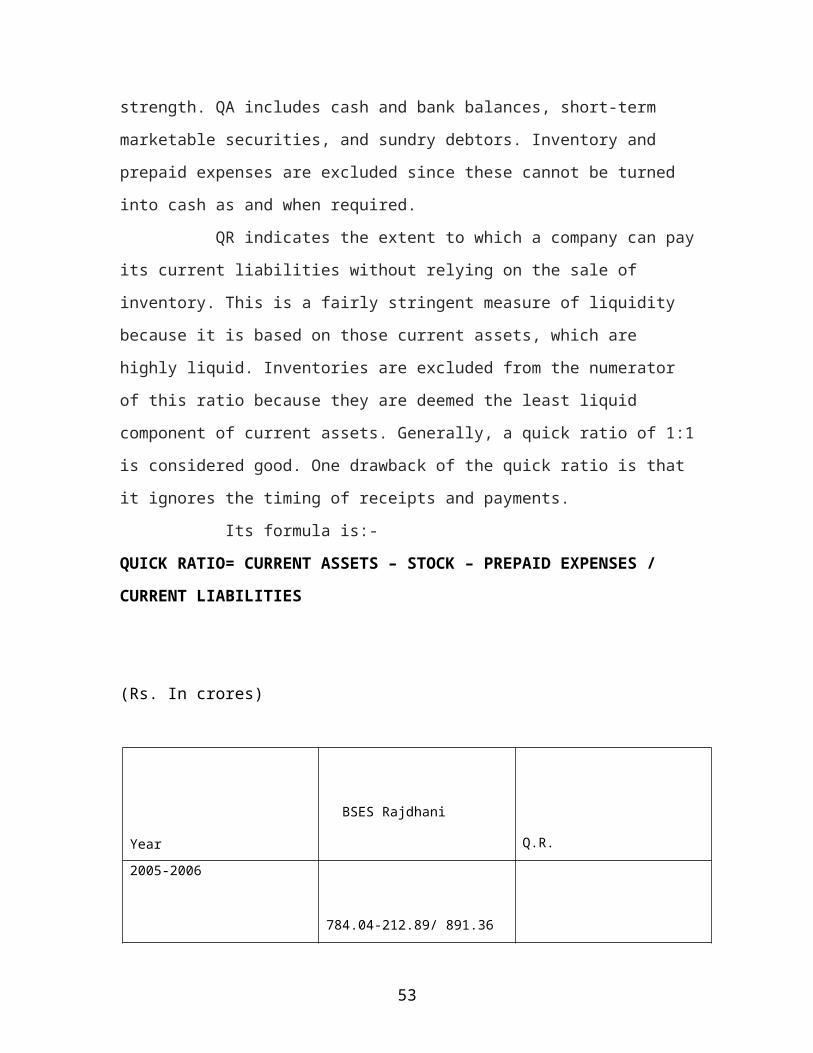
strength. QA includes cash and bank balances, short-term marketable securities, and
sundry debtors. Inventory and prepaid expenses are excluded since these cannot be turned
into cash as and when required.
QR indicates the extent to which a company can pay its current liabilities without
relying on the sale of inventory. This is a fairly stringent measure of liquidity because it
is based on those current assets, which are highly liquid. Inventories are excluded from
the numerator of this ratio because they are deemed the least liquid component of current
assets. Generally, a quick ratio of 1:1 is considered good. One drawback of the quick
ratio is that it ignores the timing of receipts and payments.
Its formula is:-
QUICK RATIO= CURRENT ASSETS – STOCK – PREPAID EXPENSES /
CURRENT LIABILITIES
(Rs. In crores)
Year BSES Rajdhani Q.R.
2005-2006 784.04-212.89/ 891.36 0.640
2006-2007 664.12-164.17/ 598.28 0.836
2007-2008 883.41-156.35/ 935.62 0.777
2008-2009 659.19-137.42/ 497.19 1.049
37
2009-2010 1897.89-127.23/ 843.59 2.099
Table-3
Figure-3
DEBT-EQUITY RATIOThis ratio compares the long-term debts with shareholders fund. The relationship between
borrowed funds & owners capital is a popular measure of the long term financial
solvency of a firm. This relationship is shown by debt equity ratio. Alternatively, this
ratio indicates the relative proportion of debt & equity in financing the assets of the firm.
It is usually expressed as a pure ratio. E.g. 2:1
Debt equity ratio is also called as leverage ratio. Leverage means the process of
the increasing the equity shareholders return through the use of debt. Leverage is also
known as ‘gearing’ or ‘trading on equity’. Debt equity ratio shows the margin of safety
for long-term creditors & the balance between debt & equity.
Its formula is :-
DEBT EQUITY RATIO = LONG TERM DEBT / TOTAL EQUITY
(Rs. In crores)
Year BSES Rajdhani L.R.
2005-2006
38

1462.79/ 718.78 2.035
2006-2007 1626.76/ 793.12 2.051
2007-2008 1955.28/ 820.20 2.380
2008-2009 2500.29/ 791.29 3.160
2009-2010 3284.09/ 882.75 3.720
Table-4
Figure-4
This ratio measures how a company finances their assets.
Being highly leveraged is generally viewed as being disadvantageous due to the increased
risk of bankruptcy, higher borrowing cost, and decreased financial flexibility.
39

WORKING CAPITALWorking Capital is simply the amount by which the current assets exceed current
liabilities. It is very similar to the current ratio. The only difference is that it gives you a
dollar amount rather than a ratio. It too is calculated to determine a firm's ability to pay
its short-term obligations. Working Capital can be viewed as somewhat of a security
blanket. The greater the amount of Working Capital, the more security and investor can
have that they will be able to meet their financial obligations.
Its formula is:-
WORKING CAPITAL = CURRENT ASSETS – CURRENT LIABILITIES
Year BSES Rajdhani W.C.
2005-2006 784.04-891.36 -107.32
2006-2007 664.12- 598.28 65.84
2007-2008 883.41-935.62 52.20
2008-2009 659.19-497.16 162.03
2009-2010 1897.89- 843.59 1054.30
Table-5
40
Figure-5
The greater the amount of Working Capital, the more security an investor can have that
they will be able to meet their financial obligations.
We see that in first two years working capital is negative i.e., current liabilities are much
higher than the company's current assets.
In 2009 and 2010 there is a considerable increase in the working capital. Therefore the
company is able to meet its short term obligations comfortably.
DEBT TO TOTAL FUNDS RATIO
This ratio is the variation of the debt equity ratio and gives the same indication as the
debt equity ratio. In this ratio, debt is expressed in relation to total funds, i.e., both equity
and debt.
Generally, debt to total funds ratio of 0.67:1 (or 67%) is considered satisfactory. In
other words, the proportion of long term loans should not be more than 67% of total
funds. A higher ratio than this is generally treated as indicator of risky financial position
from the long term point of view, because it means that the firm depends too much on
outside loans for its existence. Any withdrawal of funds by the lenders will put the
companies in difficulties. In addition, a higher ratio indicates a burden of payment of
41
large amount of interest charges periodically and the repayment of large amount of loans
at maturity. Payment of interest may become difficult it profit is reduced. Hence, good
concerns keep the debt to total funds ratio below 67%. The lower the ratio, the better it is
from the long term solvency point of view.
Its formula is:-
DEBT TO TOTAL FUNDS RATIO = LONG TERM LOANS/(EQUITY+DEBT)
(Rs. In crores)
Year BESE Rajdhani D.T.F.R
2005-2006 2354.12/ 826.1 2.849
2006-2007 2225.04/ 793.12 2.805
2007-2008 2890.90/ 435.18 6.642
2008-2009 2997.45/ 297.82 10.064
2009-2010 4127.68/ 421.28 9.79
Table-6
42

Figure-6
CURRENT CASH DEBT EQUITY RATIOIts formula is:-
CURRENT CASH DEBT EQUITY RATIO = NET CASH FROM OPERATING
ACTIVITY/ TOTAL LIABILITY
(Rs. In crores)
Year BSES Rajdhani C.C.D.E.R
2005-2006 239.95/ 891.36 0.269
2006-2007 175.45/ 598.28 0.293
2007-2008
43

169.82 / 935.62 0.1815
2008-2009 227.38/ 497.16 0.457
2009-2010 -194.72/ 843.59 - 0.230
Table-7
Figure-7
Here the ratio in 2005-06 is 0.269 and in 2006-07 is 0.293. In 2008-09 it increases to 0.45
and then it decreases in 2009-10.
The company is not able to generate enough cash to pay its short term debts.
CASH RETURN ON SALES RATIO
44

Its formula is:-
CASH RETURN ON SALES RATIO = NET CASH BY OPERATING ACTIVITY/
NET SALES
Year BSES Rajdhani C.R.S.R
2005-2006 239.95/ 2283.35 0.105
2006-2007 175.45/ 2537.65 0.069
2007-2008 169.82 / 3091.48 0.055
2008-2009 227.38/ 3600.27 0.063
2009-2010 -194.72/ 4313.78 - 0.045
Table-8
45

Figure-8
The higher the ratio, the better it is.
The cash rate of return has been very low in all the five years. From 0.11 in 2005-06, it
dropped to 0.069 and 0.063 in year 2006-07 and 2008-09 respectively and it got negative
in year 2009-10. The ratio is much below 10% in all the years.
CASH INTEREST COVERAGE RATIOIts formula is:-
CASH INTEREST COVERAGE RATIO =
CASH FROM O.A. BEFORE TAX AND INTERSET / INTEREST
(Rs. In crores)
Year BSES Rajdhani C.I.C.R
2005-2006 254.27/ 31.91 7.968
46

2006-2007 194.93/ 151.42 1.287
2007-2008 179.71 / 203.03 0.885
2008-2009 475.52/ 246.69 1.928
2009-2010 82.47/ 275.46 0.299
Table-9
Figure-9
The ratio has drastically declined from 7.968 in 2005-06 to 0.299 in 2009-10.
The lowest being in 2009-10 when company was not in a position to cover the whole
amount of interest. Ratio is low in all five years.
FIXED ASSET PURCHASE RATIO
47

The FAP ratio measures the net cash from operational activities in fixed assets. This ratio
measures the efficiency with which fixed assets are employed. A high ratio indicates a
high degree of efficiency in asset utilization while a low ratio reflects an inefficient use of
assets. However, this ratio should be used with caution because when the fixed assets of a
firm are old and substantially depreciated, the fixed assets purchase ratio tends to be high
(because the denominator of the ratio is very low).
Its formula is:-
FIXED ASSETS PURCHASE RATIO = CASH FROM OPERATIONAL
ACTIVITY / NET FIXED ASSETS
(Rs. In crores)
Year BSES Rajdhani F.A.P.R
2005-2006 239.95/ 518.88 0.462
2006-2007 175.45/ 206.58 0.849
2007-2008 169.82 / 246.96 0.685
2008-2009 227.38/ 376.52 0.604
48

2009-2010 -194.72/ 304.55 - 0.639
Table-10
Figure-10
In 2005-06 the cash generated from operating activities was able to finance only 46 % of
the fixe assests. In 2006-07 it increases to 84% and again falls down to 68% in 2007-08.
In 2008-09, it further falls to 60% and in 2009-10 it goes to negative 0.639. This means
that the company was not able to generate enough cash to finance its fixed assets.
49

TRANSMISSION & DISTRIBUTION
LOSSES (T&D Loses)
Through GENCO the electricity is generated and then it is being transmitted to DISCOM
by the TRANSCO. Further the DISCOM transmits it to the districts and then electricity is
supplied to final consumers from there. The units lost while transmitting from DISCOM
to final consumers is termed as T&D Loses.
For Example, TRANSCO transmits 100 units to DISCOM, from there all the 100 units
are transferred to districts and only 95 units out of 100 reach there. While transferring the
units to consumers further 13 units are lost. This loss of 18 units is termed as
Transmission and Distribution Loses (T&D Loses)
50
GENCO DISCOM
District
District
District
Customer
Customer
Customer
T R A N S C O
100 units
95 units
82 units

T&D Loses
Figure-11
AGGREGATE OF TECHNICAL &
COMMERCIAL LOSSES(AT&C Losses)
Aggregate Technical & Commercial (AT&C) loss is one of the most critical business
efficiency measures for power distribution companies, and is a factor of two clearly
identifiable and measurable parameters. First, the amount collected (kWhs realized) by
the Discom for energy sold, and second, the energy input (kWhs supplied) to the Discom
periphery. ‘Amount collected’ means money actually received from retail consumers as
opposed to what they were billed. Thus it captures the entire gamut of leakages in the
Revenue stream.
Technical losses are attributable to heat and friction caused by the physical operation and
design of any distribution system. Energy input at the Discom periphery is transmitted
through a complex and multi-tier distribution network before it is finally delivered to
consumers. The quantum of technical losses during transmission depends on the quality
of distribution network and infrastructure.
Commercial losses are controllable and are a combination of theft, un-metered supply,
defective and slow meters, un-billed meters, billing errors, fictitious customers and bad
debts. Commercial efficiency thus plays a significant role while measuring business
efficiency, and discom need to take all technical and commercial interventions to
contain / reduce losses.
GENCO generates energy and then through TRANSCO it is transferred to DISCOM.
DISCOM then get the electricity distributed to final consumers through district supply
offices. Then DISCOM generated bills to the consumer according to the usage. The
51

amount paid by the consumers is converted into units and then those units are compared
to the actual units transmitted by the TRANSCO. The loss of units is called AT&C
Loses.
For example, TRANSCO transmits 100 units to DISCOM. DISCOM transfers all
the units to district branches and in the process 5 units are lost. District branches
distribute the electricity to consumers and 10 more units are lost in the process. Total
units now are 85 units that are distributed among the consumers.
Then those units are multiplied bye the tariff and bill amount is calculated Like, 85x5 =
Rs.425; But Bill collection is only Rs.300. These Rs.300 are converted to units by
dividing it by the tariff rate, 300/5 = 60 units. Now, these 60 units are compared to 100
units and thus AT&C Loses will be of 40 units.
The DISCOM, viz. BRPL, BYPL and NDPL, were given AT&C Loss Reduction targets
for each year in the Control Period. At the end of Financial Year 2007-08, BRPL, BYPL
and NDPL have achieved AT&C loss of 27.51%, 30.23% and 18.29% as against the
targets of 26.69%, 34.77% and 22.03%, respectively. As regards FY 2008-09, the
available provisional figures indicate that BRPL, BYPL and NDPL have achieved AT&C
loss level of 20.87%, 24.52% and 15.10% against the targets of 23.46%, 30.52% and
20.35% respectively. The performance so far reflects a very healthy trend as all the
DISCOMs appear to have achieved the AT&C loss targets prescribed in the Multi Year
Tariff (MYT) Order.
52
REASONS FOR AT&C LOSSES
Billing/Collection/Process Deficiencies: The points mentioned below are the main
deficiencies of the company due to which high AT&C losses arise:-
1. Theft of energy in metered connections.
2. Theft by un-metered consumers.
3. Non payment of energy bills.
4. Loss in distribution of energy.
5. Consumer billed but not credited.
6. Unauthorized colonies.
7. Misuse of category.
8. Part payment.
9. Line disconnected consumer.
10. Consumer not billed.
53

11. Deliberate under billing.
12. Provisional billing.
13. Bills not delivered.
14. Bills on account of old meter when changed.
15. Collection inefficiency.
CAUSES FOR LOW REVENUE
REALISATION
54
lack of accountabilityfor energy supplied.
Un-metered supply andBypassing of meters.
Defective meters and directConnections.
Poor and inadequatedistribution network.
Low revenue realization
High % of revenue loss
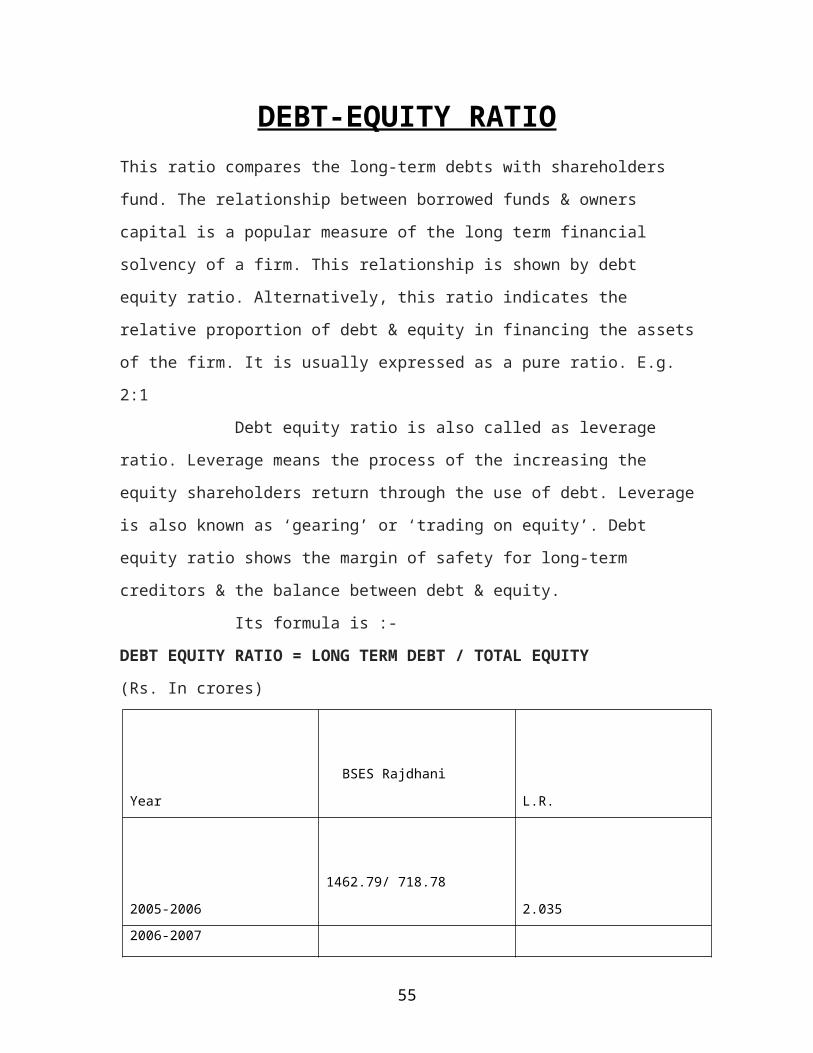
Figure-12
MEASURES FOR CURBING POWER
THEFTS AND AT&C LOSS REDUCTION
STRATEGIES
There are many ways by which the power thefts can be stopped and AT&C losses
(aggregate of technical and commercial losses) can be reduced. This reduction in AT&C
losses will result in the increased amount of revenue realized by the power distribution
companies and thereby increasing their profits. The various methods of reducing power
thefts are discussed below:-
1.) BY STRICT LEGISLATIVE PROCEDURES:
A). ELECTRICITY ACT 2003- ANTI THEFT PROVISIONS: This act was made to
have a strict control over people and have a strict binding of law on people who steal
power. It was brought in force to have the following actions:-
1). ENTRY, SEARCH AND SEIZURE: Section 135(2) provides the following
measures:-
Provides for entry, search and seizure when there is reason to believe that electricity has
been, is being or is likely to be, used unauthorized.
• Seizure of books and documents provided in addition to incriminating material used for
theft of energy
• Restriction on inspection during night time in domestic premises – inspection in the
presence of adult male member only
55

• Power to break open and search in case entry is refused.
2). PENAL ACTION FOR THEFT AND ABETMENT: Section 135 describes the
following:-
Exhaustive definition covering as many types of theft as possible.
• Imprisonment up to 3 years OR fine OR both
• Imprisonment for a minimum period of 6 months up to 5 years provided for 2nd and
subsequent
Convictions for consumers using loads in excess of 10 KW only.
• Fine to be at 3 times the gain in case of first conviction and 6 times the gain for 2nd and
subsequent convictions.
3). SPECIAL COURTS: Section 153:-Provides for constitution of Special Courts for
each area which
shall have the power of Courts of Session. Power of Suo Motto cognizance not provided
which may lead to procedural delays. Provides for summary trial (Section 154(3)).
2.) TECHNOLOGY UPGRADATION: Another way of containing power thefts
is by technology up gradation.
A). Its time to adopt the advance technologies and application specifically designed for
the power sector.
B). Technical changes that make theft difficult e.g. laying PVC coated aerial conductors
(ABC) cables that cannot be pilfered by using crocodile pins or putting up pole meters.
C). Applications such as:
Remote/Automatic Meter Reading.
Real Time Monitoring Systems such as SCADA/DMS etc.
Online Energy Accounting System.
Pre Payment System.
HT distribution.
Underground cable distribution.
56

3). STRINGENT ENFORCEMENT MECHANISM:A). ROLE OF DISCOM ENFORCEMENT WING:
Reduce T & D Losses by conducting massive raids for detection of theft of power
by unscrupulous consumers.
Keep strict vigil/surveillance of theft prone establishments/areas.
Lodge FIR in cases of Direct Theft.
B). ROLE OF CISF:
Associate the Enforcement teams.
Provide protection to the Inspecting /raiding teams while conducting inspection/
raids in difficult / theft prone areas.
Bring discipline in consumers.
4). 100% REALISATION OF ELECTRICITY BILL:
It is the role of business managers to take adequate steps and ensure that the amounts due
for power bills are fully recovered. It can be done by calling up the customers, setting a
team of recovery agents, sending reminders and notices to the customers.
5). PROACTIVE APPROACH THROUGH ADVERTISEMENT
CAMPAIGN TO EDUCATE CITIZENS AGAINST POWERTHEFT.
6). PUBLIC PARTICIPATION:Power thefts can be contained by encouraging the public in general to participate in anti
theft drive. It can be done with the help of many organizations which include: Resident
welfare associations, NGO’s, Nukkad nataks and teachings in schools.
Thus, all the methods discussed above will help the companies in containing power thefts
and reduction of AT&C losses. This will also result in increased revenue realization for
the companies.
57

BIBLIOGRAPHY
Reference Material provided by BSES Power Ltd., Nehru Place, New Delhi. Balance Sheet of BSES Yamuna Power Ltd.
Internet References
www.investopedia.com/university/ratios/ www.bsesdelhi.com www.mapsofindia.com www.netmba.com/finance/financial/ratios http://myiris.com/shares/company/notesdisplay.php
Study Material
Financial Management by Khan & Jain Financial Management by I.M. Pandey
58