broadband dielectric measurement methods for soft ... · kaolin after modified compaction with...
TRANSCRIPT

373
IACSIT International Journal of Engineering and Technology, Vol. 6, No. 5, October 2014
Abstract—Broadband dielectric measurement methods based
on vector network analyzer coupled with coaxial transmission line cell (CC) and open-ended coaxial probe (OC) are simply reviewed, by which the dielectric behaviors in the frequency range of 1 MHz to 3 GHz of two practical geomaterials are investigated. Kaolin after modified compaction with different water contents is measured by using CC. The results are consistent with previous study on standardized compacted kaolin and suggest that the dielectric properties at frequencies below 100 MHz are not only a function of water content but also functions of other soil state parameters including dry density. The hydration process of a commercial grout is monitored in real time by using OC. It is found that the time dependent dielectric properties can accurately reveal the different stages of the hydration process. These measurement results demonstrate the practicability of the introduced methods in determining dielectric properties of soft geomaterials.
Index Terms—Dielectric spectroscopy, open-ended coaxial probe, coaxial transmission line, real-time monitoring, physicochemical properties of geomaterials.
I. INTRODUCTION
Due to their intrinsic merits including non/less-invasive virtue and capability of automation and remote sensing, geophysical electromagnetic (EM) methods such as time domain reflectometry (TDR) [1] and ground penetrating radar (GPR) [2] have long been recognized as effective and practical methods in geomaterials characterization [3], [4]. Generally measuring time or frequency dependent EM properties of geomaterials as response to an applied EM field, EM methods are able to characterize geomaterials in terms of correlations between their EM properties and compositional and structural properties. Successful applications of EM methods in this regard have been massively witnessed since decades ago, among which the determination of water content of geomaterials is probably the most well-known one [5].
Despite its great success, the application of EM methods in geomaterials characterization is still confronted with many
theoretical and technical difficulties. Almost all geomaterials are heterogeneous systems composed of components with different physicochemical properties. Complex EM properties of some constituent components in addition to interface processes arising from the interaction between those components make the overall EM properties of most geomaterials extremely complicated. Theoretical consideration on their EM properties is greatly challenged by this complication because it is difficult to take all factors into account. However, carefully designed experimental studies are able to determine factors that dominate the EM properties of geomaterial at defined environments and thereby able to greatly simplify and/or optimize theoretical consideration. Experimental studies, especially in a broad frequency range, are also able to find out correlations between EM properties and other engineering parameters of geomaterials, which are practical in field investigation.
On the other hand, EM properties of a geomaterial are generally affected by a great number of factors related to environmental parameters as well as its compositional and structural nature. For civil engineering purposes, it is intended to measure EM properties of geomaterials without disturbing their engineering nature. Optimized measurement protocol in combination with non-destructive sample cells is therefore highly desirable to this end. Open-ended coaxial probe (OC) has long been used as a non-destructive sample cell in the characterization of various materials including biological tissues [6], [7], liquids [8]-[10], and geomaterials [11]-[14]. Since the sample under test has to be fully contacted with the flat end of this type of probe, it is generally only suitable for soft materials or hard materials with ideally flat surface. In addition, due to the size of this type of probe, the effective measurement volume is normally limited to the order of cm3. A non-destructive two-port coaxial transmission line cell (CC) recently developed by Lauer et al.[15] is able to measure a larger sample volume but still keep the sample undisturbed. However, this coaxial transmission line cell is not suitable for materials that are fluid or tend to shrink during measurement.
In this paper, dielectric measurement methods based on vector network analysis technique in combination with self-manufactured CC and OC is introduced, which can cover a broad frequency range from 1 MHz to 3 GHz. The calibration and calculation procedures of these two types of cells are simply reviewed. The dielectric properties of two practical geomaterials are measured, including compacted kaolin and a commercial grout. Considering the nature of these materials, the CC is chosen to measure kaolin after
Broadband Dielectric Measurement Methods for Soft Geomaterials: Coaxial Transmission Line Cell and
Open-Ended Coaxial Probe
Z. Chen, M. Schwing, J. Karlovšek, N. Wagner, and A. Scheuermann
Manuscript received November 10, 2013; revised February 12, 2014.
This work was supported by a Queensland Science Fellowship awarded to A.
Scheuermann and the German Research Foundation (DFG) projects Wa
2112/2-1 and SCHE 1604/2-1.
Z. Chen, M. Schwing, J. Karlovšek, and A. Scheuermann are with
Geotechnical Engineering Centre, School of Civil Engineering, the
University of Queensland, Brisbane, QLD 4072, Australia (e-mail:
[email protected], [email protected], [email protected],
N. Wagner is with Institute of Material Research and Testing (MFPA),
Bauhaus University, Weimar, Germany (e-mail: [email protected]).
DOI: 10.7763/IJET.2014.V6.728

modified compaction with different water contents, and the OC is employed to monitor the hydration process of the grout in real time. It will be demonstrated that the sample cells and the corresponding measurement protocol are applicable in the characterization of similar geomaterials.
II. METHODS
Since most materials are non-ferromagnetic, EM properties of a material generally refer to its dielectric properties represented by complex relative permittivity ( *
r r rjε ε ε′ ′′= − , where j is imaginary unit, and rε ′ and rε ′′ are the real and imaginary parts of the complex relative permittivity, respectively) and complex electrical conductivity ( *σ ), which are correlated by * *
02 rfσ π ε ε= with 0ε the dielectric permittivity of vacuum and f the frequency.
We use here a vector network analyzer (VNA, Agilent E5061B ENA) in combination with a CC or an OC to measure the dielectric properties in a frequency range from 1 MHz to 3 GHz. Prior to the dielectric measurements, a mechanical calibration kit (Agilent 85032F) is used to calibrate the VNA measurement port(s) so as to remove systematic errors and imperfections from the VNA and coaxial cable(s). However, the measured signals at the VNA port(s) contain information not only from the sample under test but also from sample cell and its adapter; therefore further calibration and/or algorithms approaches must be carried out to accurately determine the dielectric properties. The CC and OC used in this study and their corresponding calibration procedure and/or algorithms approaches are simply reviewed below.
A. Two-Port Coaxial Transmission Line Cell (CC) The CC used in this study and the adaptor (SPINNER
GmbH, Germany) [15]-[17] used to accommodate the CC are illustrated in Fig. 1. Prior to dielectric measurement, standard calibration is carried out at the end of the coaxial cables, which removes systematic errors and shifts the reference plane to position I as shown in Fig. 1 (c). However, dielectric measurements taken at reference plane I still contain unwanted information from the adapter units. In order to eliminate it, the reference plane is shifted to position II by a subsequent phase shift correction prior to the computation of
*rε [15], [18]. An iterative inversion technique called BIJ [15], [18], [19]
is employed to compute *rε from measured scattering
parameters Sij after calibration and pre-processing of the dataset. But the propagation matrix algorithm (PM), as a quasi-analytical method, is used in a first step to determine
*rε by using the combined propagation factor – impedance
method [20] based on the following relationship
0 0* sr
s
c Zj Z
γε
ω⎛ ⎞
= ⎜ ⎟⎝ ⎠
(1)
where Z0 and Zs are the characteristic impedances of the empty CC and the sample, respectively, γs is complex
propagation factor, and c0 is velocity of light. This *
rε is subsequently taken as an initial value to start the iterative computation with BIJ. Then, the actual *
rε is calculated iteratively for each measured frequency by the following set of equations
Fig. 1. (a) Picture showing the used measurement setup of the two-port coaxial transmission line cell mantled into an adapter unit. (b) Picture and dimensions of the cell. (c) Schematic illustration of the cell mantled into the adapter unit, where reference planes I and II are shown (see context).
2 2
1 11 22 21 12 2 2
T1
f S S S ST
ΓΓ
−= − −
− (2)
1 21 12 1 11 222
2 21 1
2 2
( ) (1 )( )2
(1 ) (1 ) (1 )1
w S S w S Sf
w wΤ Γ ΓΓ Τ
+ + − +=
− + − − Τ−
−
(3)
2 1 2 2(1 )2
w f w fD
+ −= (4)
where Γ and Τ are complex reflection and transmission coefficient, respectively, and wi with i = 1, 2 is weighting factor (0 ≤ w ≤ 1). The weighting factors w1 and w2 are set to 1 and 0.2, respectively. Γ and Τ of a sample with length d are defined by
0
0
S
S
ΓΖ − Ζ
=Ζ + Ζ
(5)
exp( )sdΤ γ= − (6) With Zs and γ s given by
2
0*r
s
ZZ
ε⎛ ⎞
= ⎜ ⎟⎝ ⎠
(7)
2
0* sr
cjγ
εω
⎛ ⎞= ⎜ ⎟
⎝ ⎠ (8)
The iteratively calculated *rε is determined by finding the
minimum of the difference D, defined in (4), between measured and numerical calculated scattering parameters Sij by means of a Levenberg-Marquardt algorithm [21], [22]. After 1000 frequencies (equal to 630 MHz) the appropriate starting value of the iteration is obtained by means of the median of the previous 100 results in order to achieve a stable starting guess for the iteration.
B. Open-Ended Coaxial Probe (OC) The OC [14] used in this study is schematically illustrated
in Fig. 2 (a), where the dimensions of the probe are also shown. When it is under measurement in combination with a
374
IACSIT International Journal of Engineering and Technology, Vol. 6, No. 5, October 2014
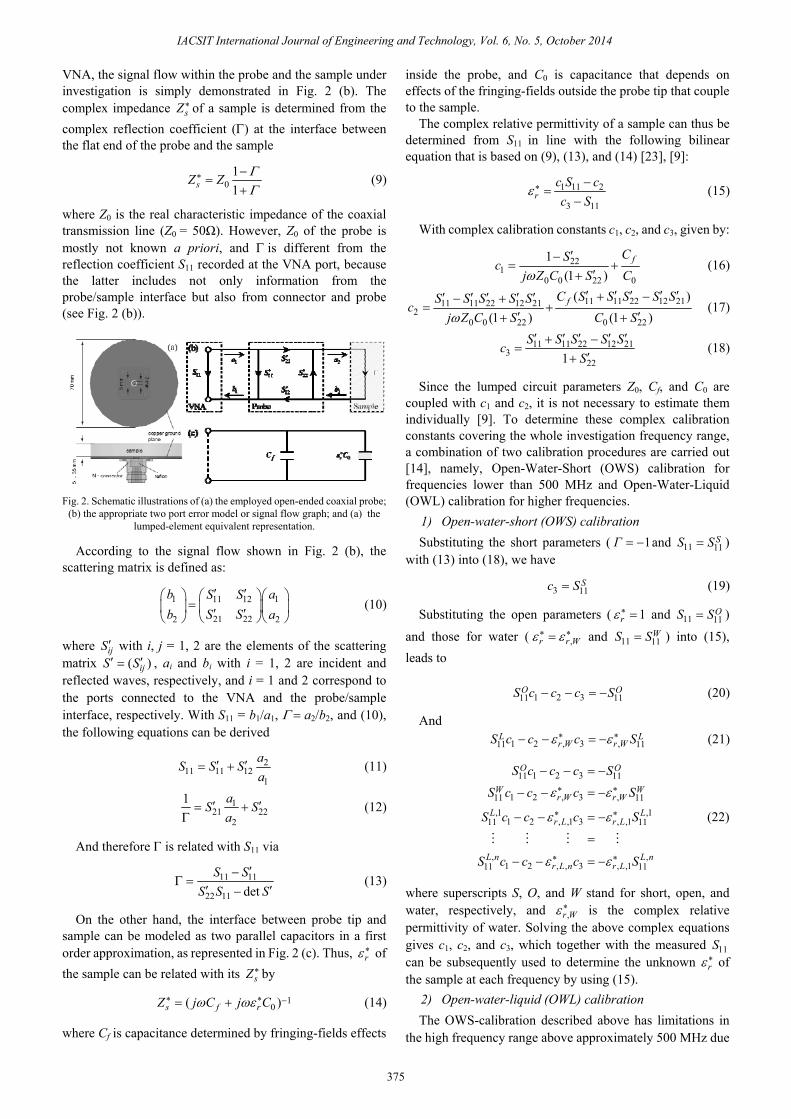
VNA, the signal flow within the probe and the sample under investigation is simply demonstrated in Fig. 2 (b). The complex impedance *
sZ of a sample is determined from the complex reflection coefficient (Γ) at the interface between the flat end of the probe and the sample
*0
11sZ Z Γ
Γ−
=+
(9)
where Z0 is the real characteristic impedance of the coaxial transmission line (Z0 = 50Ω). However, Z0 of the probe is mostly not known a priori, and Γ is different from the reflection coefficient S11 recorded at the VNA port, because the latter includes not only information from the probe/sample interface but also from connector and probe (see Fig. 2 (b)).
Fig. 2. Schematic illustrations of (a) the employed open-ended coaxial probe;
(b) the appropriate two port error model or signal flow graph; and (a) the lumped-element equivalent representation.
According to the signal flow shown in Fig. 2 (b), the scattering matrix is defined as:
1 111 12
21 222 2
b aS SS Sb a
′ ′⎛ ⎞ ⎛ ⎞⎛ ⎞=⎜ ⎟ ⎜ ⎟⎜ ⎟′ ′⎝ ⎠⎝ ⎠ ⎝ ⎠
(10)
where ijS ′ with i, j = 1, 2 are the elements of the scattering matrix ( )ijS S′ ′= , ai and bi with i = 1, 2 are incident and reflected waves, respectively, and i = 1 and 2 correspond to the ports connected to the VNA and the probe/sample interface, respectively. With S11 = b1/a1, Γ = a2/b2, and (10), the following equations can be derived
211 11 12
1
aS S S
a′ ′= + (11)
121 22
2
1 aS S
a′ ′= +
Γ (12)
And therefore Γ is related with S11 via
11 11
22 11 detS S
S S S′−
Γ =′ ′−
(13)
On the other hand, the interface between probe tip and sample can be modeled as two parallel capacitors in a first order approximation, as represented in Fig. 2 (c). Thus, *
rε of the sample can be related with its *
sZ by
* * 10( )s f rZ j C j Cω ωε −= + (14)
where Cf is capacitance determined by fringing-fields effects
inside the probe, and C0 is capacitance that depends on effects of the fringing-fields outside the probe tip that couple to the sample.
The complex relative permittivity of a sample can thus be determined from S11 in line with the following bilinear equation that is based on (9), (13), and (14) [23], [9]:
1 11 2*
3 11r
c S cc S
ε−
=−
(15)
With complex calibration constants c1, c2, and c3, given by:
221
0 0 22 0
1(1 )
fCSc
j Z C S Cω′−
= +′+
(16)
11 11 22 12 2111 11 22 12 212
0 0 22 0 22
( )(1 ) (1 )
fC S S S S SS S S S Sc
j Z C S C Sω
′ ′ ′ ′ ′+ −′ ′ ′ ′ ′− += +
′ ′+ + (17)
11 11 22 12 213
221S S S S S
cS
′ ′ ′ ′ ′+ −=
′+ (18)
Since the lumped circuit parameters Z0, Cf, and C0 are coupled with c1 and c2, it is not necessary to estimate them individually [9]. To determine these complex calibration constants covering the whole investigation frequency range, a combination of two calibration procedures are carried out [14], namely, Open-Water-Short (OWS) calibration for frequencies lower than 500 MHz and Open-Water-Liquid (OWL) calibration for higher frequencies.
1) Open-water-short (OWS) calibration Substituting the short parameters ( 1Γ = − and 11 11
SS S= ) with (13) into (18), we have
3 11Sc S= (19)
Substituting the open parameters ( * 1rε = and 11 11OS S= )
and those for water ( * *,r r Wε ε= and 11 11
WS S= ) into (15), leads to 1 2 311 11
O OS c c c S− − = − (20)
And * *
1 2 , 3 ,11 11L L
r W r WS c c c Sε ε− − = − (21)
1 2 311 11* *
1 2 , 3 ,11 11,1 ,1* *
1 2 , ,1 3 , ,111 11
, ,* *1 2 , , 3 , ,111 11
O O
W Wr W r W
L Lr L r L
L n L nr L n r L
S c c c SS c c c S
S c c c S
S c c c S
ε ε
ε ε
ε ε
− − = −
− − = −
− − = −
=
− − = −
M M M M
(22)
where superscripts S, O, and W stand for short, open, and water, respectively, and *
,r Wε is the complex relative permittivity of water. Solving the above complex equations gives c1, c2, and c3, which together with the measured 11S can be subsequently used to determine the unknown *
rε of the sample at each frequency by using (15).
2) Open-water-liquid (OWL) calibration The OWS-calibration described above has limitations in
the high frequency range above approximately 500 MHz due
375
IACSIT International Journal of Engineering and Technology, Vol. 6, No. 5, October 2014

to the inaccuracy of the short calibration. Therefore, an additional OWL-calibration is used. Several standard liquids, such as ethanol, methanol, and acetone, with known *
rε are measured in addition to open and water measurements. The following series of equations can be obtained: where the subscript or superscript L, i represents additional standard liquids. Likewise, numerically solving the above series equations gives the complex calibration constants, which are then used for determining the complex relative permittivity of the sample under investigation.
III. EXPERIMENTAL
A. Materials Kaolin used in this study consists of almost 100% kaolinite.
The liquid limit (LL = 90%) and plastic limit (PL = 35.7%) are determined according to [24], which classifies the kaolin in the Casagrande chart as inorganic clay with extremely high plasticity (CH) [25], [26]. The specific gravity of kaolin is determined to be 2.54 by using a water pycnometer [27].
The grout used in this study is Cementitious Shrinkage Compensated Grout (Emcekrete ‘HP’), purchased from a Building Chemical Supplies Pty Ltd., an official MC construction chemical products distributor for Australia. The grout consists of aggregates, mainly sand, with size smaller than 0.2 mm and bleeding characteristics [28] less than 1% up to the initial set. The material has an initial setting time within +3 hours and -15 minutes of the stated setting time [29], with a final setting time not later than 4 h after the initial setting time [29]. The restrained expansion of the grout is determined to be less than 0.1% [30].
Fig. 3. Frequency dependence of the real part of the complex relative
permittivity of the compacted kaolin with different water content.
B. Measurement Procedure Modified compaction tests on kaolin are conducted
according to [31]. Prior to the compaction, seven soil samples are prepared with water content ranging from 17.5% to 32.1%. The prepared samples are left to cure for at least 24 hours to achieve homogeneity. Then, each soil sample is compacted by putting five layers into a mould (100.0 mm in diameter and 120.0 mm in height) with each layer bearing 25 hammer (44.5 N) blows with a falling height of 457.2 mm. Once each soil sample is compacted into the mould, a CC is
pushed into the soil and subsequently extruded out by using a jack. As soon as the sample cell is taken out of the mould, soil remained in the inner conductor is removed and the outer conductor is cleaned. The whole cell with soil loaded is then put in the adapter and subject to dielectric measurement.
The grout specimens are made with a mixing ratio, chosen as a pour-to-flow consistency, with determined water/grout ratio of 0.168-0.176, with an average yield of 0.0133 m3. Dry grout is placed in a ceramic bowl, gradually adding water to prevent balling. Mixing time is 3-4 min, till a consistent grouting paste is achieved. Paste is carefully poured into a partly greased OC (grease is used for easier cleaning of the probe after the experiment is finished), covered with a matching cap and sealed with masking tape to prevent uneven hydration of the specimen.
A self-developed macro (based on Visual Basic) runs the continuous VNA measurement with 50 signal calibrations at every given measurement, every 5 minutes for the first 24 hours and every 15min for the next 48 hours. This study is focusing on the period of the initial 54 hours, which represents the main hydration process.
IV. RESULT AND DISCUSSION
A. Modified Compacted Kaolin Fig. 3 shows the spectra of the real part of complex relative
permittivity rε ′ of the compacted kaolin with different gravimetric water contents w. As can be seen, the dielectric behavior of the compacted kaolin has a strong relationship to w, characterized by the different dependence of rε ′ on frequency. For all samples, when frequency is lower than about 200 MHz, their rε ′ increases obviously with decreasing frequency, which indicates that dielectric relaxations due to certain strong polarization processes occur.
Our previous study [17] on standard compacted kaolin indicated that two dielectric relaxations can be observed in the frequency range of 1 MHz to around 200 MHz, where the high-frequency relaxation occurs at about several tens MHz and the low-frequency relaxation occurs at sub-MHz range. An equation containing two Cole-Cole equations terms [32] that account for these two dielectric relaxations were used to characterize the dielectric spectra, which gives a good fit to the experimental curves [17]. In this work, the dielectric behavior of the kaolin with modified compaction is similar to those in the previous study. Accordingly, the same equation containing two Cole-Cole terms and a direct current (DC) conductivity term is also used to characterize the spectra
2
*
01 1 ( ) i
i DCr
iij
j β
ε σε ε
ωτ ωε∞=
Δ= + −
+∑ (23)
where ε∞ is the high frequency limit of complex relative permittivity, iεΔ is the relaxation strength, ( 2 )fω π= is angular frequency, iτ is relaxation time, iβ is the stretching exponent, and DCσ is DC conductivity.
As an example, Fig. 4 shows the curve fitting by using (23) on the measured dielectric spectra of compacted kaolin with
376
IACSIT International Journal of Engineering and Technology, Vol. 6, No. 5, October 2014

w=20.5%. The discrepancy between the total fit and the experimental data at the low frequency tail in the rε ′ - spectrum (see Fig. 4 (a)) is due to the effect from electrode polarization or another dielectric relaxation occurring at lower frequencies. Furthermore, the contribution in the imaginary part at frequencies > 1 GHz (Fig. 4 (b)) due to reorientational polarization of water molecules in the aqueous pore solution with relaxation frequency > 10 GHz [33] is not considered. Despite this, we can see that (23) gives a satisfactory description on the dielectric behavior in the investigated frequency range. Two relaxations with the high-frequency relaxation located at about 10 MHz and the low-frequency one at about 1 MHz can be observed. Other samples show similar results but with different relaxation strength and relaxation time.
Fig. 4. Curve fitting on (a) the real part and (b) the imaginary part of complex relative permittivity as a function of frequency of compacted kaolin with water content of 20.5%. The inset of (b) shows the imaginary part of complex relative permittivity after subtraction of DC conductivity. The squares are experimental data and lines are fitting curve in line with (23).
As discussed in [17], the low-frequency relaxation is possibly due to the diffusion polarization of counterions in the pore water, and the high-frequency relaxation is ascribed to interfacial polarization where the Maxwell-Wagner effect [11] is dominant. For kaolin prepared at the wet side of the compaction curve, which generally has higher water content and nearly 100% saturation, we observed that only a small part of the low-frequency relaxation can be measured in the investigation frequency window. The fit on the low-frequency relaxation thereby suffers large uncertainties. However, the high-frequency relaxation can be entirely measured for all samples; therefore the fitting results on it are basically reliable, even though the fitting variables may have an error up to 10% due to the influence from the low-frequency relaxation. Note that these two relaxations are superposed with each other.
In Fig. 5, the results regarding the dry density and the high-frequency relaxation strength of this study (modified compaction) are compared with those of the previous study (standard compaction). As can be seen in Fig. 5 (a), the compaction curves are as expected, with the modified compaction test giving lower optimum water content as
compared to standard compaction but relatively higher dry density when the water content is the same. The dependence of high-frequency relaxation strength on water content of both cases shows a similar variation tendency as the compaction curve (see Fig. 5 (b)), with the maximum relaxation strength appearing right at the optimum water content. This result indicates the reliability of the current measurements and suggests once again that the high-frequency relaxation strength has a strong correlation with the dry density of the compacted kaolin.
B. Hydration of Grout The hydration process of cement has been vastly
documented but still remains not thoroughly understood [34], [35]. Nevertheless, it is generally accepted that the hydration of cement and cement-based construction materials, such as grout, mortar, and concrete, undergoes the following 4 stages: 1) an initial stage in which cement quickly dissolves in water accompanied by release of heat; 2) a slow reaction stage or induction stage during which almost no reaction occurs due to reasons still under controversy; 3) an acceleration stage where rapid reaction occurs mainly due to the hydration of C3S; and 4) a deceleration stage generally called diffusion-limited reaction period, in which the reaction is remarkably slowed down because the hydration product surrounding the unreacted cement seriously hinders the diffusion of water inward and the diffusion of dissolved ions from unreacted cement outward. Since dielectric measurement is quick and sensitive to the subtle change of composition or structure of a system, we believe that the hydration process can be effectively monitored in real time by dielectric measurement.
Fig. 5. (a) The dry density of kaolin after modified (squares) and standard (circles) compaction as a function of gravimetric water content, namely the compaction curve. (b) The high-frequency relaxation strength of kaolin after modified (squares) and standard (circles) compaction as a function of gravimetric water content.
The grout used in this study is mainly composed of cement and fine sands. When mixed with water, because the dielectric properties of sand barely change with frequency in the investigation frequency range, the dielectric behavior of the grout is almost completely determined by the hydration
377
IACSIT International Journal of Engineering and Technology, Vol. 6, No. 5, October 2014
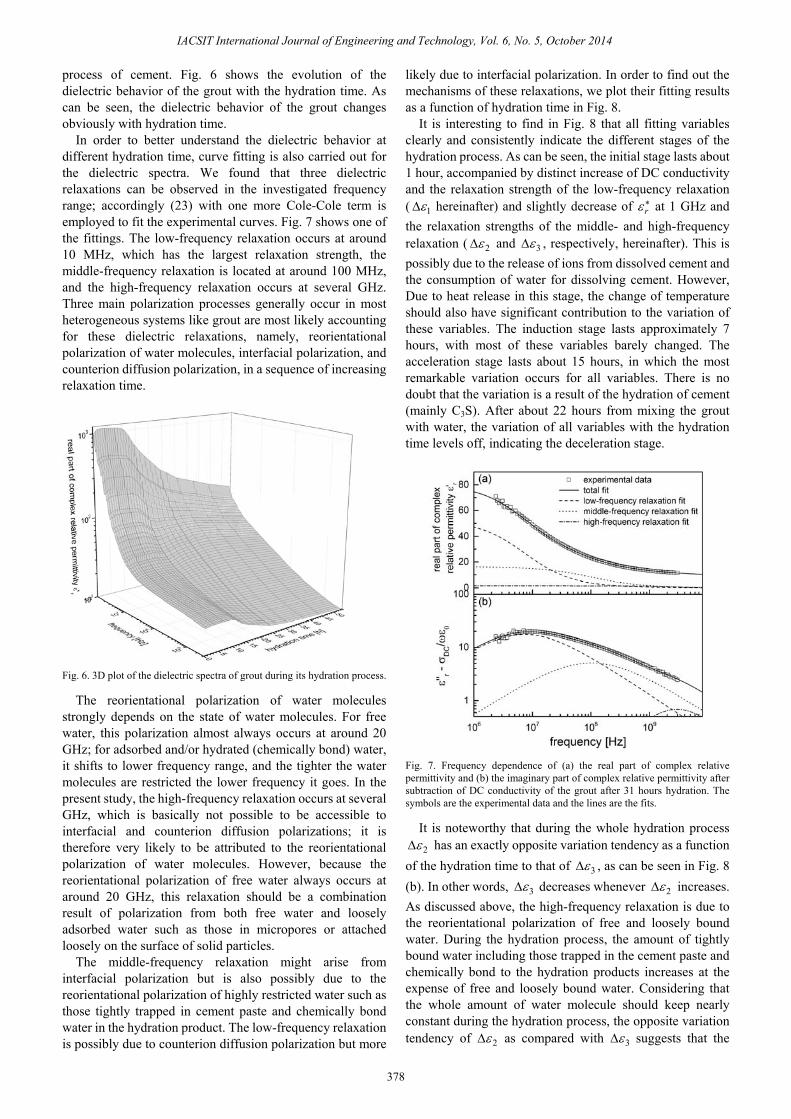
process of cement. Fig. 6 shows the evolution of the dielectric behavior of the grout with the hydration time. As can be seen, the dielectric behavior of the grout changes obviously with hydration time.
In order to better understand the dielectric behavior at different hydration time, curve fitting is also carried out for the dielectric spectra. We found that three dielectric relaxations can be observed in the investigated frequency range; accordingly (23) with one more Cole-Cole term is employed to fit the experimental curves. Fig. 7 shows one of the fittings. The low-frequency relaxation occurs at around 10 MHz, which has the largest relaxation strength, the middle-frequency relaxation is located at around 100 MHz, and the high-frequency relaxation occurs at several GHz. Three main polarization processes generally occur in most heterogeneous systems like grout are most likely accounting for these dielectric relaxations, namely, reorientational polarization of water molecules, interfacial polarization, and counterion diffusion polarization, in a sequence of increasing relaxation time.
Fig. 6. 3D plot of the dielectric spectra of grout during its hydration process.
The reorientational polarization of water molecules strongly depends on the state of water molecules. For free water, this polarization almost always occurs at around 20 GHz; for adsorbed and/or hydrated (chemically bond) water, it shifts to lower frequency range, and the tighter the water molecules are restricted the lower frequency it goes. In the present study, the high-frequency relaxation occurs at several GHz, which is basically not possible to be accessible to interfacial and counterion diffusion polarizations; it is therefore very likely to be attributed to the reorientational polarization of water molecules. However, because the reorientational polarization of free water always occurs at around 20 GHz, this relaxation should be a combination result of polarization from both free water and loosely adsorbed water such as those in micropores or attached loosely on the surface of solid particles.
The middle-frequency relaxation might arise from interfacial polarization but is also possibly due to the reorientational polarization of highly restricted water such as those tightly trapped in cement paste and chemically bond water in the hydration product. The low-frequency relaxation is possibly due to counterion diffusion polarization but more
likely due to interfacial polarization. In order to find out the mechanisms of these relaxations, we plot their fitting results as a function of hydration time in Fig. 8.
It is interesting to find in Fig. 8 that all fitting variables clearly and consistently indicate the different stages of the hydration process. As can be seen, the initial stage lasts about 1 hour, accompanied by distinct increase of DC conductivity and the relaxation strength of the low-frequency relaxation ( 1εΔ hereinafter) and slightly decrease of *
rε at 1 GHz and the relaxation strengths of the middle- and high-frequency relaxation ( 2εΔ and 3εΔ , respectively, hereinafter). This is possibly due to the release of ions from dissolved cement and the consumption of water for dissolving cement. However, Due to heat release in this stage, the change of temperature should also have significant contribution to the variation of these variables. The induction stage lasts approximately 7 hours, with most of these variables barely changed. The acceleration stage lasts about 15 hours, in which the most remarkable variation occurs for all variables. There is no doubt that the variation is a result of the hydration of cement (mainly C3S). After about 22 hours from mixing the grout with water, the variation of all variables with the hydration time levels off, indicating the deceleration stage.
Fig. 7. Frequency dependence of (a) the real part of complex relative permittivity and (b) the imaginary part of complex relative permittivity after subtraction of DC conductivity of the grout after 31 hours hydration. The symbols are the experimental data and the lines are the fits.
It is noteworthy that during the whole hydration process 2εΔ has an exactly opposite variation tendency as a function
of the hydration time to that of 3εΔ , as can be seen in Fig. 8 (b). In other words, 3εΔ decreases whenever 2εΔ increases. As discussed above, the high-frequency relaxation is due to the reorientational polarization of free and loosely bound water. During the hydration process, the amount of tightly bound water including those trapped in the cement paste and chemically bond to the hydration products increases at the expense of free and loosely bound water. Considering that the whole amount of water molecule should keep nearly constant during the hydration process, the opposite variation tendency of 2εΔ as compared with 3εΔ suggests that the
378
IACSIT International Journal of Engineering and Technology, Vol. 6, No. 5, October 2014
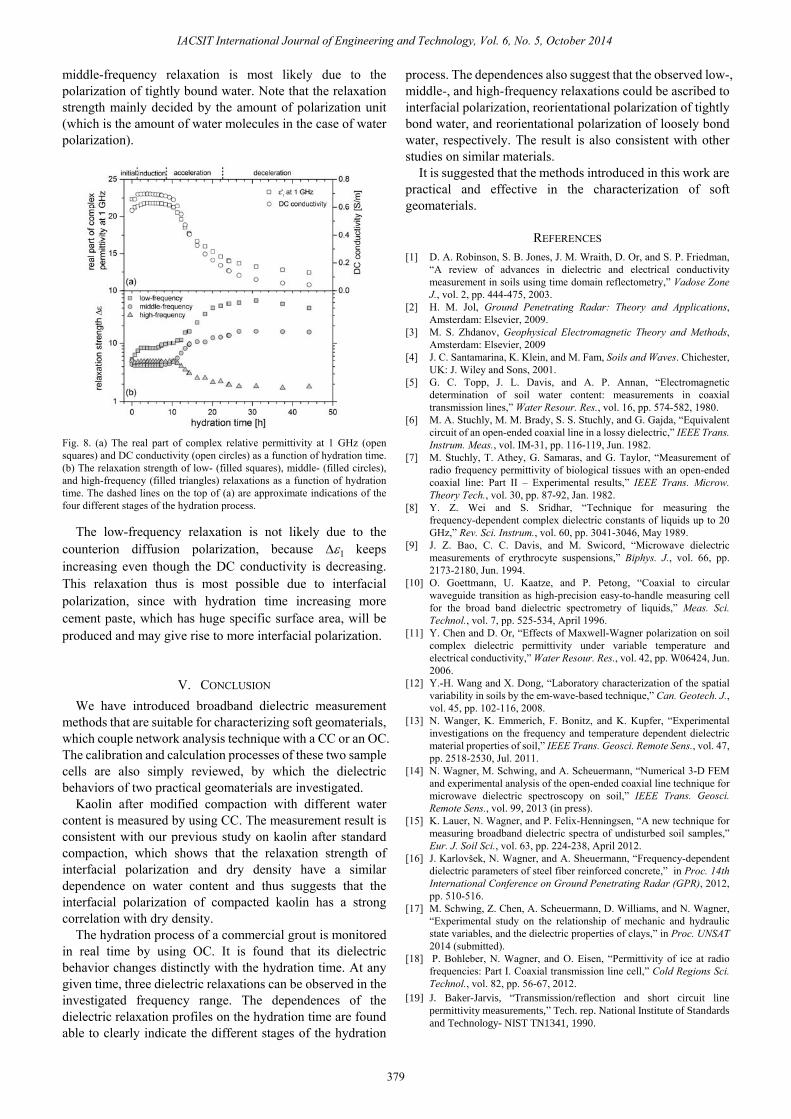
middle-frequency relaxation is most likely due to the polarization of tightly bound water. Note that the relaxation strength mainly decided by the amount of polarization unit (which is the amount of water molecules in the case of water polarization).
Fig. 8. (a) The real part of complex relative permittivity at 1 GHz (open squares) and DC conductivity (open circles) as a function of hydration time. (b) The relaxation strength of low- (filled squares), middle- (filled circles), and high-frequency (filled triangles) relaxations as a function of hydration time. The dashed lines on the top of (a) are approximate indications of the four different stages of the hydration process.
The low-frequency relaxation is not likely due to the counterion diffusion polarization, because 1εΔ keeps increasing even though the DC conductivity is decreasing. This relaxation thus is most possible due to interfacial polarization, since with hydration time increasing more cement paste, which has huge specific surface area, will be produced and may give rise to more interfacial polarization.
V. CONCLUSION We have introduced broadband dielectric measurement
methods that are suitable for characterizing soft geomaterials, which couple network analysis technique with a CC or an OC. The calibration and calculation processes of these two sample cells are also simply reviewed, by which the dielectric behaviors of two practical geomaterials are investigated.
Kaolin after modified compaction with different water content is measured by using CC. The measurement result is consistent with our previous study on kaolin after standard compaction, which shows that the relaxation strength of interfacial polarization and dry density have a similar dependence on water content and thus suggests that the interfacial polarization of compacted kaolin has a strong correlation with dry density.
The hydration process of a commercial grout is monitored in real time by using OC. It is found that its dielectric behavior changes distinctly with the hydration time. At any given time, three dielectric relaxations can be observed in the investigated frequency range. The dependences of the dielectric relaxation profiles on the hydration time are found able to clearly indicate the different stages of the hydration
process. The dependences also suggest that the observed low-, middle-, and high-frequency relaxations could be ascribed to interfacial polarization, reorientational polarization of tightly bond water, and reorientational polarization of loosely bond water, respectively. The result is also consistent with other studies on similar materials.
It is suggested that the methods introduced in this work are practical and effective in the characterization of soft geomaterials.
REFERENCES [1] D. A. Robinson, S. B. Jones, J. M. Wraith, D. Or, and S. P. Friedman,
“A review of advances in dielectric and electrical conductivity measurement in soils using time domain reflectometry,” Vadose Zone J., vol. 2, pp. 444-475, 2003.
[2] H. M. Jol, Ground Penetrating Radar: Theory and Applications, Amsterdam: Elsevier, 2009.
[3] M. S. Zhdanov, Geophysical Electromagnetic Theory and Methods, Amsterdam: Elsevier, 2009
[4] J. C. Santamarina, K. Klein, and M. Fam, Soils and Waves. Chichester, UK: J. Wiley and Sons, 2001.
[5] G. C. Topp, J. L. Davis, and A. P. Annan, “Electromagnetic determination of soil water content: measurements in coaxial transmission lines,” Water Resour. Res., vol. 16, pp. 574-582, 1980.
[6] M. A. Stuchly, M. M. Brady, S. S. Stuchly, and G. Gajda, “Equivalent circuit of an open-ended coaxial line in a lossy dielectric,” IEEE Trans. Instrum. Meas., vol. IM-31, pp. 116-119, Jun. 1982.
[7] M. Stuchly, T. Athey, G. Samaras, and G. Taylor, “Measurement of radio frequency permittivity of biological tissues with an open-ended coaxial line: Part II – Experimental results,” IEEE Trans. Microw. Theory Tech., vol. 30, pp. 87-92, Jan. 1982.
[8] Y. Z. Wei and S. Sridhar, “Technique for measuring the frequency-dependent complex dielectric constants of liquids up to 20 GHz,” Rev. Sci. Instrum., vol. 60, pp. 3041-3046, May 1989.
[9] J. Z. Bao, C. C. Davis, and M. Swicord, “Microwave dielectric measurements of erythrocyte suspensions,” Biphys. J., vol. 66, pp. 2173-2180, Jun. 1994.
[10] O. Goettmann, U. Kaatze, and P. Petong, “Coaxial to circular waveguide transition as high-precision easy-to-handle measuring cell for the broad band dielectric spectrometry of liquids,” Meas. Sci. Technol., vol. 7, pp. 525-534, April 1996.
[11] Y. Chen and D. Or, “Effects of Maxwell-Wagner polarization on soil complex dielectric permittivity under variable temperature and electrical conductivity,” Water Resour. Res., vol. 42, pp. W06424, Jun. 2006.
[12] Y.-H. Wang and X. Dong, “Laboratory characterization of the spatial variability in soils by the em-wave-based technique,” Can. Geotech. J., vol. 45, pp. 102-116, 2008.
[13] N. Wanger, K. Emmerich, F. Bonitz, and K. Kupfer, “Experimental investigations on the frequency and temperature dependent dielectric material properties of soil,” IEEE Trans. Geosci. Remote Sens., vol. 47, pp. 2518-2530, Jul. 2011.
[14] N. Wagner, M. Schwing, and A. Scheuermann, “Numerical 3-D FEM and experimental analysis of the open-ended coaxial line technique for microwave dielectric spectroscopy on soil,” IEEE Trans. Geosci. Remote Sens., vol. 99, 2013 (in press).
[15] K. Lauer, N. Wagner, and P. Felix-Henningsen, “A new technique for measuring broadband dielectric spectra of undisturbed soil samples,” Eur. J. Soil Sci., vol. 63, pp. 224-238, April 2012.
[16] J. Karlovšek, N. Wagner, and A. Sheuermann, “Frequency-dependent dielectric parameters of steel fiber reinforced concrete,” in Proc. 14th International Conference on Ground Penetrating Radar (GPR), 2012, pp. 510-516.
[17] M. Schwing, Z. Chen, A. Scheuermann, D. Williams, and N. Wagner, “Experimental study on the relationship of mechanic and hydraulic state variables, and the dielectric properties of clays,” in Proc. UNSAT 2014 (submitted).
[18] P. Bohleber, N. Wagner, and O. Eisen, “Permittivity of ice at radio frequencies: Part I. Coaxial transmission line cell,” Cold Regions Sci. Technol., vol. 82, pp. 56-67, 2012.
379
IACSIT International Journal of Engineering and Technology, Vol. 6, No. 5, October 2014
[19] J. Baker-Jarvis, “Transmission/reflection and short circuit line
permittivity measurements,” Tech. rep. National Institute of Standards
and Technology- NIST TN1341, 1990.
[20] N. Wagner and M. Loewer, “A broadband 3-D numerical FEM study on the characterization of dielectric relaxation processes in soils,” in Proc. 10th International Conference on Electromagnetic Wave Interaction with Water and Moist Substances (ISEMA), ed. Kupfer and Wagner, pp. 231-241, Weimar, Germany, 2013.
[21] K. Levenberg, “A metod for the solution of certain problems in least squares,” Quarterly of Applied Mathematics, vol. 2, pp. 164-168, 1944.
[24] Standard test method for liquid limit, plastic limit, and plasticity index of soils, ASTM D4318-10, 2010.
[25] Standard practice for classification of soils for engineering purposes (unified soil classification system), ASTM D2487-11, 2011.
[26] A. Casagrande, “Research on the Atterberg limits of soils,” United States Bureau of Public Roads, vol. 13, pp. 121-130, 1932.
[27] Standard test methods for specific gravity of soil solids by water pycnometer, ASTM D854-10, 2010.
[28] Admixtures for concrete, mortar and grout. Test methods and determination for bleeding of concrete, BS EN 480-4, 1997.
[29] Masonry cement composition, specifications and conformity criteria, BS EN 413-1, 2011.
[30] Standard test method for expansion and bleeding of freshly mixed grouts for preplaced-aggregate concrete in the laboratory, ASTM C940-10a, 2013.
[31] Standard test methods for laboratory compaction characteristics of soil using modified effort, ASTM D1557-12, 2009.
[32] K. S. Cole and R. H. Cole, “Dispersion and adsorption in dielectrics – I. alternating current characteristics,” J. Chem. Phys., vol. 9, pp. 341-352, 1942.
[33] N. Wagner, Th. Bore, J.-Ch. Robinet, D. Coehlo, F. Taillade, and S. Lesoille, “Dielectric relaxation behavior of Callovo-Oxfordian clay rock: A hydraulic-mechanical-electromagnetic coupling approach,” J. Geophys. Res – Sol. Ea., vol. 118, pp. 4729-4744, 2013.
[34] E. M. Gartner, J. F. Young, D. A. Damidot, and I. Jawed, “Hydration of Portland Cement,” in Structure and Performance of Cements, J. Bensted and P. Barnes, Ed, New York: Spon Press, 2002, pp. 57-113.
Z. Chen was born in Hubei province, China, on August 13, 1976. He received his PhD in physical chemistry from the college of chemistry, Beijing Normal University, Beijing, China, in 2007. The main research field during his doctoral course is dielectric behavior of various heterogeneous systems including colloidal suspensions, membrane, and surfactant solutions.
He is currently a Research Fellow in the school of civil engineering, the University of Queensland, Brisbane, Australia. His current research interests are focused on the characterization of geomaterials by means of broadband dielectric spectroscopy and to couple their dielectric properties with other engineering properties
M. Schwing was born in Karlsruhe, Germany, on November 11, 1983. He received the Diploma degree in civil engineering from the Karlsruhe Institute of Technology (KIT), Karlsruhe, Germany, in 2010. He is currently pursuing the Ph.D. degree with the University of Queensland, Brisbane, Australia. His current research interests include coupled mechanic, hydraulic and dielectric properties of fine-grained soils.
J. Karlovšek was born in Ljubljana, Slovenia on June 29, 1983. He started his undergraduate degree in civil engineering at the University of Ljubljana (UL), Faculty of Civil and Geodetic Engineering and finished his bachelor degree with honors at the University of Western Sydney (UWS), Sydney, Australia in 2007. He is currently pursuing his Ph.D. research degree at the University of Queensland (UQ), Brisbane Australia. His current research interests include inspecting
integrity of bored tunnels using non-destructive testing methods and continuous developing educational platforms for corporate partners within the field of geotechnical engineering. He obtained his workplace induction at the Nishimatsu Construction Co. Ltd., in 2005, Tokyo, Japan as a tunnel occupation trainee. After finishing his degree he pursued working for Elea iC, Ltd, Ljubljana, Slovenia as a Tunnel Engineer, before obtaining his current position. Mr. Karlovšek is a young tunneling professional representative on the Australian (national) and Queensland (state) committee of Australasian Tunneling Society (ATS) from 2011 and the co-creator of The International Tunneling and Underground Space Association Young Members Working Group (ITAYM), from 2013, Geneva, Switzerland.
A. Scheuermann was born in Wallduern, Germany, on November 6, 1969. He received the German Diploma degree in civil engineering, specializing in geotechnical engineering, and the Doctoral degree from the University of Karlsruhe, Karlsruhe, Germany, in 1998 and 2005, respectively, and Habilitation degree from the Karlsruhe Institute of Technology (KIT), Germany, on the topic of "Time Domain Reflectometry (TDR) in Geohydraulics and
Geomechanics" in 2012.
380
IACSIT International Journal of Engineering and Technology, Vol. 6, No. 5, October 2014
[22] D. Marquardt, “An algorithm for least-squares estimation of nonlinear
parameters,” SIAM Journal on Applied Mathematics, vol. 11, pp.
431-441, 1963.
[23] T. Marsland and S. Evans, “Dielectric measurements with an
open-ended coaxial probe,” IEEE Proc., vol. 134, pp. 341-349, 1987.
In January 2012, he started working as a senior lecturer at the School of
Civil Engineering, at The University of Queensland, Brisbane, Australia. He
is Deputy Director of the recently founded Geotechnical Engineering Centre
and leads there a research group working on geo-environmental problems.
His research interests include the use of electric and electromagnetic
measurement methods for investigating geotechnical and geo-environmental
problems, hydraulics and mechanics of unsaturated soils, multi-phase flow,
and erosion.
Dr. Scheuermann was awarded in 2012 a Queensland Science Fellowship
on the further development of Spatial TDR.
[35] J. W. Bullard et al., “Mechanisms of cement hydration,” Cement and
Concrete Research, vol. 41, pp. 1208-1223, 2011.
Norman Wagner was born in Schleiz, Germany,
on June 4, 1973. He received the Diploma degree in
geophysics from the Faculty of Physics and
Geosciences, University Leipzig, Leipzig,
Germany, and the Dr. rer. nat. degree from the
Faculty of Chemistry and Geosciences, Friedrich
Schiller University Jena, Jena, Germany, in 1999
and 2004, respectively.
He is currently a researcher in high-frequency
electromagnetic (radio to microwave) techniques
with the Institute of Material Research and Testing and Institute of
Structural Mechanics, Bauhaus-University Weimar, Weimar, Germany.
His current research interests include the experimental and numerical
analysis and the theoretical prediction of the dielectric relaxation behavior
of complex systems, such as soils, for the development of advanced
sensing techniques in geo-environmental applications.