bright rock mid cap growth fund bright rock quality … rock quality large cap fund ... the s&p...
TRANSCRIPT
Annual ReportFebruary 28, 2018
Bright Rock Mid Cap Growth FundInstitutional Class Shares (BQMGX)Investor Class Shares (BQMIX)
Bright Rock Quality Large Cap FundInstitutional Class Shares (BQLCX)Investor Class Shares (BQLIX)
Investment Adviser
Bright Rock Capital Management LLC288 Union StreetRockland, Massachusetts 02370
Phone: 1-866-273-7223

TABLE OF CONTENTS
LETTER TO SHAREHOLDERS . . . . . . . . . . . . . . . . . . . . . . . . . . . . . . . . . . . . . . . . 3
ALLOCATION OF PORTFOLIO HOLDINGS . . . . . . . . . . . . . . . . . . . . . . . . . . . . 6
EXPENSE EXAMPLES . . . . . . . . . . . . . . . . . . . . . . . . . . . . . . . . . . . . . . . . . . . . . . . 7
INVESTMENT HIGHLIGHTS . . . . . . . . . . . . . . . . . . . . . . . . . . . . . . . . . . . . . . . . . 9
SCHEDULES OF INVESTMENTS . . . . . . . . . . . . . . . . . . . . . . . . . . . . . . . . . . . . . . 13
STATEMENTS OF ASSETS AND LIABILITIES . . . . . . . . . . . . . . . . . . . . . . . . . . 19
STATEMENTS OF OPERATIONS . . . . . . . . . . . . . . . . . . . . . . . . . . . . . . . . . . . . . . 20
STATEMENTS OF CHANGES IN NET ASSETS . . . . . . . . . . . . . . . . . . . . . . . . . . 21
FINANCIAL HIGHLIGHTS . . . . . . . . . . . . . . . . . . . . . . . . . . . . . . . . . . . . . . . . . . . 23
NOTES TO FINANCIAL STATEMENTS . . . . . . . . . . . . . . . . . . . . . . . . . . . . . . . . . 27
REPORT OF INDEPENDENT REGISTERED PUBLIC ACCOUNTING FIRM . . . . . . . . . . . . . . . . . . . . . . . . . . . . . . . . . . . . . . . . 37
NOTICE OF PRIVACY POLICY & PRACTICES . . . . . . . . . . . . . . . . . . . . . . . . . . 38
ADDITIONAL INFORMATION . . . . . . . . . . . . . . . . . . . . . . . . . . . . . . . . . . . . . . . . 39

Dear Shareholder:
US & Global Economic OverviewThe last twelve months have been quite strong and remarkably stable until February2018. In fact, all of the first eleven months of our fiscal year delivered positive returns forthe S&P 500 Total Return Index (the “S&P 500”). This was a continuation of the previousyear’s market strength from February 2016 to February 2017. For the twelve monthsended February 28, 2018 the S&P 500 was up +17.10%. Our high quality bias and equal-weighted sector strategies have tended to be challenged in markets that are as stronglypositive as the one experienced for the last twelve months. Both the S&P 500 QualityIndex and the S&P 500 Low Volatility Index have underperformed significantly over thepast twelve months compared to the S&P 500 (+14.60% and +9.64%, respectively). Thedecision to equal-weight the S&P 500 sectors also hurt as the S&P 500 Equal WeightedSector Index underperformed the S&P 500 by 5.95%.
Bright Rock Fund OverviewsGiven the heightened returns in the markets over the past twelve months and ourstrategy’s focus on investing in quality, low-volatility stocks across all sectors, both of ourfunds underperformed due to portfolio construction (high quality and equal sector) andstock specific reasons that are outlined below, as applicable:
Quality Large Cap Fund (the “Fund”):For the twelve month period ended February 28, 2018, the Institutional Class shares of theFund returned +9.54% compared to the S&P 500, which returned +17.10%. Calendaryear-to-date (through 2/28/18) the Fund (-2.17%) continued to trail the S&P 500 (+1.83%)on a total return basis. There have been two major contributors to our relativeunderperformance over the past year: 1) equal-weighting the S&P 500 sectors cost usroughly 4.93%, and 2) stock selection has cost us roughly 1.40%.
Six of the eleven sectors in the S&P 500 generated positive returns over the past year. The best performing sectors (Information Technology +36.3%, Consumer Discretionary+22.2%, and Financials +19.9%) are also the three largest sectors by weight within theS&P 500. Likewise, four of the five sectors (Telecommunications -5.0%, Energy -2.8%,Utilities -2.0%, and Consumer Staples -0.3%) that finished the past year with negativereturns each represent less than 10% of the S&P 500, meaning that our structuraloverweight to these sectors and structural underweight to the largest and best-performingsectors over the past year were a leading cause of relative underperformance.
Stock selection also led to a portion of the Fund’s relative underperformance. MasterCard(+60.2%), Zoetis (+52.7%), BlackRock (+45.1%), and Cognizant (+39.6%) were amongthe leading positive contributors, while Schlumberger (-15.9%), General Mills (-13.3%),CVS Health (-13.7%), and Southern Company (-11.1%) were among the leadingdetractors to performance over the past year.
Mid Cap Growth Fund (the “Fund”):For the twelve month period ended February 28, 2018, the Institutional Class shares ofthe Fund returned +18.50%, which trailed the return on the Russell Midcap Growth TotalReturn Index of +20.60%. Year-over-year, stock selection was a strong contributor to the
3

4
Fund’s performance adding 3.22%, while our equal-weighted sector strategy detractedfrom performance by 3.69%. Calendar year-to-date (through 2/28/18) the Fund returned+2.03%, which slightly trailed the return on the Russell Midcap Growth Total ReturnIndex of +2.34%.
Eight of the nine sectors in the Russell Midcap Growth Total Return Index generatedpositive returns over the past year. The best performing sectors were Technology+40.7%, Producer Durables +23.0%, and Financial Services +22.3%, while the worstperforming sector was Energy -4.6%. Given our equal-weighted sector approach, oursignificant underweight to Technology and significant overweight to Energy (the top andbottom sector performers, respectively) were among the leading causes of the relativeunderperformance over the past year.
Offsetting the detraction from our sector allocations, our stock selection was strong and apositive contributor to performance over the past year. IPG Photonics Corp (+107.6%),Red Hat Inc. (+78.0%), Copart Inc. (+58.3%) and Monster Beverage (+52.9%) wereamong the leading positive contributors, while Oceaneering International (-34.3%), Acuity(-32.3%), Mednax (-22.8%), and EQT Corp (-15.8%) were among the leading detractors.
Thank you for your business and the confidence you have placed in us. We wish you awonderful remainder of 2018.
Sincerely,
David B. Smith, CFA Doug ButlerChief Investment Officer Director of ResearchBright Rock Capital Management Bright Rock Capital Management
Past performance is not a guarantee of future results.
The S&P 500® Total Return Index is a cap weighted index of large-cap U.S. equities. The index includes 500leading companies and captures approximately 80% coverage of available market capitalization.
The S&P 500® Quality Index is designed to track high quality stocks in the S&P 500 by quality score, which iscalculated based on return on equity, accruals ratio and financial leverage ratio.
The S&P 500® Low Volatility Index measures performance of the 100 least volatile stocks in the S&P 500. Theindex benchmarks low volatility or low variance strategies for the U.S. stock market.
The S&P 500® Equal Weighted Sector Index measures performance of 10 S&P 500 GICS Sectors (all ex RealEstate) equally weighted and rebalanced quarterly.
Russell Midcap Growth Total Return Index is an unmanaged index that measures the performance of thoseRussell Midcap companies with higher price-to-book ratios and higher forecasted growth values.
Opinions expressed are those of Bright Rock Capital Management, LLC and are subject to change, are notguaranteed and should not be considered investment advice.
Mutual fund investing involves risk. Principal loss is possible. Investments in mid cap companies caninvolve additional risks such as limited liquidity and greater volatility. Investments in foreign securitiescan exhibit greater volatility. Additional risks include political, economic, and currency risks as well asdifferences in accounting methods. These risks can be greater for investments in emerging markets. TheFunds will bear their share of the fees and expenses of investments in underlying funds or exchange-traded

funds (“ETFs”). Shareholders will pay higher expenses than would be the case if making directinvestments in underlying funds or ETFs. ETFs are subject to additional risks that do not apply toconventional mutual funds, including the risks that the market price of an ETF’s shares may trade at adiscount to its net asset value (“NAV”), an active secondary trading market may not develop or bemaintained, or trading may be halted by the exchange on which they trade, which may impact a Fund’sability to sell its shares. The Funds may use options and futures contracts, which have the risks ofunlimited losses of the underlying holdings due to unanticipated market movements and failure tocorrectly predict the direction of the securities prices, interest rates and currency exchange rates. Thisinvestment may not be suitable for all investors. The Funds may engage in short sales, which could resultin a Fund’s investment performance suffering if it is required to close out a short position earlier than ithad intended. The prices of growth stocks may be more sensitive to changes in current or expectedearnings than the prices of other stocks.
Fund holdings and sector allocations are subject to change and should not be considered a recommendation tobuy or sell any security. For a complete list of Fund holdings, please refer to the Schedule of Investmentsincluded in this report.
Must be preceded or accompanied by a prospectus.
The Bright Rock Funds are distributed by Quasar Distributors, LLC.
5

Common Stocks99.89%
Money Market Funds0.11%
Bright Rock Mid Cap Growth Fund(% of Investments)
Bright Rock Quality Large Cap Fund(% of Investments)
6
Bright Rock FundsAllocation of Portfolio Holdings as of February 28, 2018
Common Stocks97.52%
Exchange Traded Funds1.88% Money Market Funds
0.60%

As a shareholder of the Funds, you incur two types of costs: (1) transaction costs and (2) ongoing costs, including management fees, distribution and service (12b-1) fees(Investor Class only) and other Fund expenses. This Example is intended to help youunderstand your ongoing costs (in dollars) of investing in the Funds, and to comparethese costs with the ongoing costs of investing in other mutual funds. The Example isbased on an investment of $1,000 invested at the beginning of the period and held for theentire period (September 1, 2017 – February 28, 2018).
Actual Expenses
The first line of each of the following tables provides information about actual accountvalues and actual expenses. Although the Funds charge no sales load, you will beassessed fees for outgoing wire transfers, returned checks and stop payment orders atprevailing rates charged by U.S. Bancorp Fund Services, LLC, the Funds’ transfer agent.If you request that a redemption be made by wire transfer, currently a $15.00 fee ischarged by the Funds’ transfer agent. IRA accounts will be charged a $15.00 annualmaintenance fee. To the extent the Funds invest in shares of ETFs or other investmentcompanies as part of their investment strategies, you will indirectly bear yourproportionate share of any fees and expenses charged by the underlying funds in whichthe Funds invest in addition to the expenses of the Funds. Actual expenses of theunderlying funds are expected to vary among the various underlying funds. Theseexpenses are not included in the Example. The Example includes, but is not limited to,management fees, fund administration and accounting, custody and transfer agent fees.You may use the information in the first line, together with the amount you invested, toestimate the expenses that you paid over the period. Simply divide your account value by$1,000 (for example, an $8,600 account value divided by $1,000 = 8.6), then multiply theresult by the number in the first line under the heading entitled “Expenses Paid DuringPeriod” to estimate the expenses you paid on your account during this period.
Hypothetical Example for Comparison Purposes
The second line of each of the following tables provides information about hypotheticalaccount values and hypothetical expenses based on the Funds’ actual expense ratios andan assumed rate of return of 5% per year before expenses, which is not the Funds’ actualreturn. The hypothetical account values and expenses may not be used to estimate theactual ending account balance or expenses you paid for the period. You may use thisinformation to compare the ongoing costs of investing in the Funds and other funds. Todo so, compare this 5% hypothetical example with the 5% hypothetical examples thatappear in the shareholder reports of other funds. Please note that the expenses shown inthe tables are meant to highlight your ongoing costs only and do not reflect anytransactional costs, such as sales charges (loads), redemption fees or exchange fees.Therefore, the second line of the table is useful in comparing ongoing costs only, and will
7
Bright Rock FundsExpense Examples (Unaudited)

not help you determine the relative total costs of owning different funds. In addition, ifthese transactional costs were included, your costs would have been higher.
Mid Cap Growth Fund – Institutional Class___________________________________________________Expenses Paid
Beginning Ending During PeriodAccount Value Account Value September 1, 2017 –
September 1, 2017 February 28, 2018 February 28, 2018*_________________ _________________ __________________Actual $1,000.00 $1,160.00 $6.48Hypothetical (5% returnbefore expenses) $1,000.00 $1,018.79 $6.06
* Expenses are equal to the Institutional Class’ annualized expense ratio of 1.21%, multiplied by the averageaccount value over the period, multiplied by 181/365 to reflect the one-half year period.
Mid Cap Growth Fund – Investor Class___________________________________________________Expenses Paid
Beginning Ending During PeriodAccount Value Account Value September 1, 2017 –
September 1, 2017 February 28, 2018 February 28, 2018*_________________ _________________ __________________Actual $1,000.00 $1,159.40 $7.82Hypothetical (5% returnbefore expenses) $1,000.00 $1,017.55 $7.30
* Expenses are equal to the Investor Class’ annualized expense ratio of 1.46%, multiplied by the averageaccount value over the period, multiplied by 181/365 to reflect the one-half year period.
Quality Large Cap Fund – Institutional Class___________________________________________________Expenses Paid
Beginning Ending During PeriodAccount Value Account Value September 1, 2017 –
September 1, 2017 February 28, 2018 February 28, 2018*_________________ _________________ __________________Actual $1,000.00 $1,079.90 $4.59Hypothetical (5% returnbefore expenses) $1,000.00 $1,020.38 $4.46
* Expenses are equal to the Institutional Class’ annualized expense ratio of 0.89%, multiplied by the averageaccount value over the period, multiplied by 181/365 to reflect the one-half year period.
Quality Large Cap Fund – Investor Class___________________________________________________Expenses Paid
Beginning Ending During PeriodAccount Value Account Value September 1, 2017 –
September 1, 2017 February 28, 2018 February 28, 2018*_________________ _________________ __________________Actual $1,000.00 $1,078.50 $5.88Hypothetical (5% returnbefore expenses) $1,000.00 $1,019.14 $5.71
* Expenses are equal to the Investor Class’ annualized expense ratio of 1.14%, multiplied by the averageaccount value over the period, multiplied by 181/365 to reflect the one-half year period.
8
Bright Rock FundsExpense Examples (Unaudited) (Continued)

Average Annual Returns – For Periods Ended February 28, 2018
Since SinceOne Three Five Inception InceptionYear Years Years (5/26/10) (1/17/12)_____ _____ _____ ________ ________
Bright Rock Mid Cap Growth FundInstitutional Class 18.50% 10.66% 12.19% 11.52% N/AInvestor Class 18.23% 10.41% 12.32% N/A 12.03%
Russell Midcap Growth Total Return Index 20.60% 9.33% 14.23% 15.08% 14.80%
Performance data quoted represents past performance and does not guaranteefuture results. The investment return and principal value of an investment willfluctuate so that an investor’s shares, when redeemed, may be worth more or lessthan their original cost. Current performance of the Fund may be lower or higherthan the performance quoted. Performance data current to the most recent monthend may be obtained by calling 1-866-273-7223.
Short-term performance, in particular, is not a good indication of the Fund’s futureperformance, and an investment should not be made solely on returns.
Investment performance reflects fee waivers in effect. In the absence of such waivers,total return would be reduced.
The returns shown in the table and graphs assume reinvestment of Fund distributions anddo not reflect the deduction of taxes that a shareholder would pay on Fund distributionsor the redemption of Fund shares. The graphs illustrate performance of a hypotheticalinvestment made in the Fund and a broad-based securities index on May 26, 2010 andJanuary 17, 2012, the inception dates of the Institutional and Investor Classes,respectively. The graphs do not reflect any future performance.
The Russell Midcap Growth Total Return Index measures the performance of the mid-capgrowth segment of the U.S. equity universe. One cannot invest directly in an index.
9
Bright Rock Mid Cap Growth FundInvestment Highlights (Unaudited)

$8,000
$10,000
$12,000
$14,000
$16,000
$18,000
$20,000
$22,000
$24,000
Bright Rock Mid Cap Growth Fund – Investor Class
Russell Midcap Growth Total Return Index
1/17
/201
2*
8/31
/201
2
2/29
/201
2
2/28
/201
3
8/31
/201
3
2/28
/201
4
8/31
/201
4
2/28
/201
5
8/31
/201
5
8/31
/201
6
2/29
/201
6
$22,639
$20,028
2/28
/201
7
8/31
/201
7
2/28
/201
8
$60,000
$100,000
$140,000
$180,000
$220,000
$260,000
$300,000
Bright Rock Mid Cap Growth Fund – Institutional Class
Russell Midcap Growth Total Return Index
$233,045
5/26
/201
0*
8/31
/201
0
2/28
/201
1
8/31
/201
1
2/29
/201
2
8/31
/201
2
8/31
/201
3
2/28
/201
3
2/28
/201
4
8/31
/201
4
2/28
/201
5
8/31
/201
5
8/31
/201
6
2/29
/201
6
$284,308
2/28
/201
7
8/31
/201
7
2/28
/201
8
Bright Rock Mid Cap Growth Fund – Institutional ClassGrowth of $100,000 Investment
Bright Rock Mid Cap Growth Fund – Investor ClassGrowth of $10,000 Investment
* Inception Date
10
Bright Rock Mid Cap Growth FundInvestment Highlights (Unaudited) (Continued)

11
Average Annual Returns – For Periods Ended February 28, 2018
Since SinceOne Three Five Inception InceptionYear Years Years (5/26/10) (1/17/12)_____ _____ _____ ________ ________
Bright Rock Quality Large Cap FundInstitutional Class 9.54% 6.68% 10.81% 11.98% N/AInvestor Class 9.19% 6.38% 10.68% N/A 12.14%
S&P 500 Total Return Index 17.10% 11.14% 14.73% 15.17% 15.30%
Performance data quoted represents past performance and does not guaranteefuture results. The investment return and principal value of an investment willfluctuate so that an investor’s shares, when redeemed, may be worth more or lessthan their original cost. Current performance of the Fund may be lower or higherthan the performance quoted. Performance data current to the most recent monthend may be obtained by calling 1-866-273-7223.
Short-term performance, in particular, is not a good indication of the Fund’s futureperformance, and an investment should not be made solely on returns.
The returns shown in the table and graphs assume reinvestment of Fund distributions anddo not reflect the deduction of taxes that a shareholder would pay on Fund distributionsor the redemption of Fund shares. The graphs illustrate performance of a hypotheticalinvestment made in the Fund and a broad-based securities index on May 26, 2010 andJanuary 17, 2012, the inception dates of the Institutional and Investor Classes,respectively. The graphs do not reflect any future performance.
The S&P 500 Total Return Index is a broad-based unmanaged index of 500 stocks, whichis widely recognized as representative of the equity market in general. One cannot investdirectly in an index.
Bright Rock Quality Large Cap FundInvestment Highlights (Unaudited)

$8,000
$10,000
$12,000
$14,000
$16,000
$18,000
$20,000
$22,000
$24,000
$26,000
Bright Rock Quality Large Cap Fund – Investor Class
S&P 500 Total Return Index
1/17
/201
2*
8/31
/201
2
2/29
/201
2
2/28
/201
3
8/31
/201
3
2/28
/201
4
8/31
/201
4
2/28
/201
5
8/31
/201
5
8/31
/201
6
2/29
/201
6
$23,882
$20,153
2/28
/201
7
8/31
/201
7
2/28
/201
8
$60,000
$100,000
$140,000
$180,000
$220,000
$260,000
$300,000
$340,000
Bright Rock Quality Large Cap Fund – Institutional Class
S&P 500 Total Return Index
5/26
/201
0*
8/31
/201
0
2/28
/201
1
8/31
/201
1
2/29
/201
2
8/31
/201
2
2/28
/201
3
8/31
/201
3
2/28
/201
4
8/31
/201
4
2/28
/201
5
8/31
/201
5
8/31
/201
6
2/29
/201
6
$240,656
$299,275
2/28
/201
7
8/31
/201
7
2/28
/201
8
12
Bright Rock Quality Large Cap FundInvestment Highlights (Unaudited) (Continued)
Bright Rock Quality Large Cap Fund – Institutional ClassGrowth of $100,000 Investment
Bright Rock Quality Large Cap Fund – Investor ClassGrowth of $10,000 Investment
* Inception Date

Shares Value______ ______
COMMON STOCKS – 99.87%
Auto Components – 2.44%Gentex Corp. 71,000 $ 1,612,410__________
Beverages – 3.02%Monster Beverage Corp. (a) 31,500 1,996,155__________
Capital Markets – 8.28%Eaton Vance Corp. 30,000 1,587,900FactSet Research Systems, Inc. 9,000 1,828,620SEI Investments Co. 28,300 2,061,089__________
5,477,609__________
Chemicals – 6.14%International Flavors & Fragrances, Inc. 10,000 1,412,500The Sherwin-Williams Co. 6,600 2,650,428__________
4,062,928__________
Commercial Services & Supplies – 8.32%Copart, Inc. (a) 80,000 3,744,800Rollins, Inc. 35,000 1,759,450__________
5,504,250__________
Containers & Packaging – 1.01%AptarGroup, Inc. 7,500 670,650__________
Distributors – 2.94%LKQ Corp. (a) 49,200 1,942,416__________
Electrical Equipment – 1.88%Acuity Brands, Inc. 8,700 1,240,446__________
Electronic Equipment, Instruments & Components – 6.79%Amphenol Corp. – Class A 19,000 1,736,410IPG Photonics Corp. (a) 11,200 2,751,168__________
4,487,578__________
Energy Equipment & Services – 3.19%National Oilwell Varco, Inc. 30,600 1,073,754Oceaneering International, Inc. 25,000 459,500TechnipFMC PLC (b) 20,000 576,400__________
2,109,654__________
13
The accompanying notes are an integral part of these financial statements.
Bright Rock Mid Cap Growth FundSchedule of InvestmentsFebruary 28, 2018

Shares Value______ ______
Food Products – 6.52%Flowers Foods, Inc. 74,100 $ 1,536,834McCormick & Co, Inc. 6,000 640,680The Hershey Co. 21,700 2,132,242__________
4,309,756__________
Health Care Equipment & Supplies – 10.44%Edwards Lifesciences Corp. (a) 13,000 1,737,710IDEXX Laboratories, Inc. (a) 13,600 2,546,328ResMed, Inc. 20,000 1,905,400Varian Medical Systems, Inc. (a) 6,000 716,040__________
6,905,478__________
Health Care Providers & Services – 1.71%MEDNAX, Inc. (a) 20,600 1,132,588__________
Household Products – 2.08%Church & Dwight Co., Inc. 28,000 1,377,320__________
IT Services – 5.34%FleetCor Technologies, Inc. (a) 3,300 659,769Jack Henry & Associates, Inc. 24,500 2,873,850__________
3,533,619__________
Multiline Retail – 1.12%Dollar Tree, Inc. (a) 7,200 739,008__________
Oil, Gas & Consumable Fuels – 7.82%Diamondback Energy, Inc. (a) 14,100 1,757,424EQT Corp. 19,000 955,890ONEOK, Inc. 43,600 2,455,988__________
5,169,302__________
Road & Rail – 2.53%JB Hunt Transport Services, Inc. 14,100 1,671,837__________
Semiconductors & Semiconductor Equipment – 3.89%Analog Devices, Inc. 9,000 811,350Microchip Technology, Inc. 19,800 1,760,814__________
2,572,164__________
14
The accompanying notes are an integral part of these financial statements.
Bright Rock Mid Cap Growth FundSchedule of Investments (Continued)February 28, 2018

Shares Value______ ______
Software – 5.13%Red Hat, Inc. (a) 23,000 $ 3,390,200__________
Specialty Retail – 5.57%L Brands, Inc. 49,000 2,417,170Tractor Supply Co. 19,500 1,266,135__________
3,683,305__________
Trading Companies & Distributors – 3.71%Fastenal Co. 32,400 1,772,928MSC Industrial Direct Co., Inc. – Class A 7,750 677,970__________
2,450,898__________TOTAL COMMON STOCKS (Cost $38,991,534) 66,039,571__________
MONEY MARKET FUNDS – 0.11%Morgan Stanley Institutional Liquidity Funds – Government Portfolio, Institutional Class, 1.247% (c) 69,928 69,928__________
TOTAL MONEY MARKET FUNDS (Cost $69,928) 69,928__________Total Investments (Cost $39,061,462) – 99.98% 66,109,499Other Assets in Excess of Liabilities – 0.02% 12,033__________TOTAL NET ASSETS – 100.00% $66,121,532____________________
(a) Non-income producing security.(b) Foreign issued security.(c) Seven day yield as of February 28, 2018.
Abbreviations:PLC Public Limited Company.
The Global Industry Classification Standard (GICS®) was developed by and/or is the exclusive property ofMSCI, Inc. and Standard & Poors Financial Services LLC (“S&P”). GICS is a service mark of MSCI and S&Pand has been licensed for use by U.S. Bancorp Fund Services, LLC.
15
The accompanying notes are an integral part of these financial statements.
Bright Rock Mid Cap Growth FundSchedule of Investments (Continued)February 28, 2018

16
The accompanying notes are an integral part of these financial statements.
Bright Rock Quality Large Cap FundSchedule of InvestmentsFebruary 28, 2018
Shares Value______ ______
COMMON STOCKS – 97.33%
Aerospace & Defense – 2.55%United Technologies Corp. 44,000 $ 5,928,560___________
Air Freight & Logistics – 2.45%CH Robinson Worldwide, Inc. 61,000 5,694,960___________
Banks – 4.37%Wells Fargo & Co. 174,000 10,163,340___________
Beverages – 2.41%PepsiCo, Inc. 51,000 5,596,230___________
Capital Markets – 3.88%BlackRock, Inc. 8,000 4,395,440Franklin Resources, Inc. 120,000 4,640,400___________
9,035,840___________
Chemicals – 10.32%Ecolab, Inc. 38,000 4,957,100Monsanto Co. 63,000 7,772,310Praxair, Inc. 39,000 5,840,250The Sherwin-Williams Co. 13,500 5,421,330___________
23,990,990___________
Diversified Telecommunication Services – 6.24%AT&T, Inc. 151,000 5,481,300Verizon Communications, Inc. 189,000 9,022,860___________
14,504,160___________
Electric Utilities – 6.85%NextEra Energy, Inc. 31,000 4,716,650The Southern Co. 154,000 6,631,240Westar Energy, Inc. 94,000 4,580,620___________
15,928,510___________
Energy Equipment & Services – 3.39%Halliburton Co. 85,000 3,945,700Schlumberger Ltd. (a) 60,000 3,938,400___________
7,884,100___________

Shares Value______ ______
Food & Staples Retailing – 5.83%CVS Health Corp. 111,000 $ 7,518,030Walmart, Inc. 67,000 6,030,670___________
13,548,700___________
Food Products – 0.91%General Mills, Inc. 42,000 2,123,100___________
Health Care Providers & Services – 1.73%McKesson Corp. 27,000 4,029,210___________
Hotels, Restaurants & Leisure – 2.36%Starbucks Corp. 96,000 5,481,600___________
Insurance – 2.14%Chubb Ltd. (a) 35,000 4,967,200___________
Internet Software & Services – 5.67%Alphabet, Inc. – Class A (b) 7,900 8,720,968Facebook, Inc. – Class A (b) 25,000 4,458,000___________
13,178,968___________
IT Services – 5.11%Cognizant Technology Solutions Corp. – Class A 70,000 5,741,400Mastercard, Inc. – Class A 35,000 6,151,600___________
11,893,000___________
Life Sciences Tools & Services – 3.50%Thermo Fisher Scientific Inc. 39,000 8,134,620___________
Media – 2.80%Comcast Corp. – Class A 180,000 6,517,800___________
Oil, Gas & Consumable Fuels – 5.59%Chevron Corp. 77,000 8,617,840Exxon Mobil Corp. 58,000 4,392,920___________
13,010,760___________
Pharmaceuticals – 5.01%Johnson & Johnson 43,000 5,584,840Zoetis, Inc. – Class A 75,000 6,064,500___________
11,649,340___________
17
The accompanying notes are an integral part of these financial statements.
Bright Rock Quality Large Cap FundSchedule of Investments (Continued)February 28, 2018
Shares Value______ ______
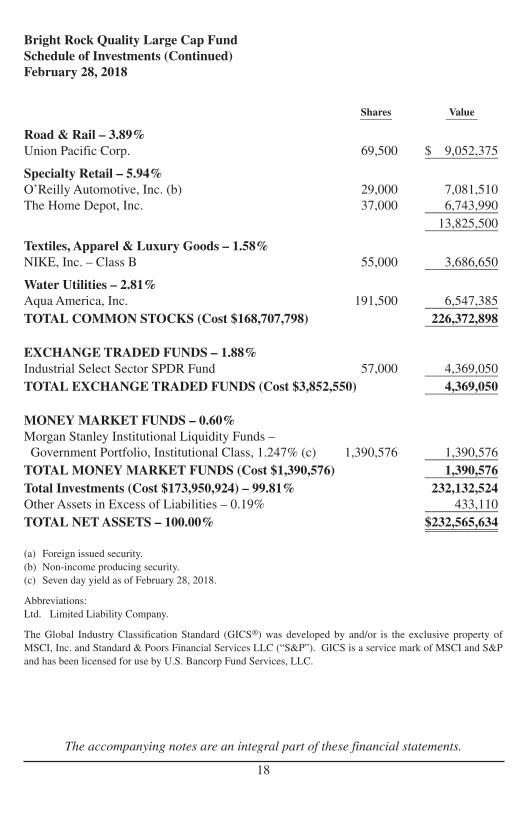
Road & Rail – 3.89%Union Pacific Corp. 69,500 $ 9,052,375___________
Specialty Retail – 5.94%O’Reilly Automotive, Inc. (b) 29,000 7,081,510The Home Depot, Inc. 37,000 6,743,990___________
13,825,500___________
Textiles, Apparel & Luxury Goods – 1.58%NIKE, Inc. – Class B 55,000 3,686,650___________
Water Utilities – 2.81%Aqua America, Inc. 191,500 6,547,385___________TOTAL COMMON STOCKS (Cost $168,707,798) 226,372,898___________
EXCHANGE TRADED FUNDS – 1.88%Industrial Select Sector SPDR Fund 57,000 4,369,050___________TOTAL EXCHANGE TRADED FUNDS (Cost $3,852,550) 4,369,050___________
MONEY MARKET FUNDS – 0.60%Morgan Stanley Institutional Liquidity Funds – Government Portfolio, Institutional Class, 1.247% (c) 1,390,576 1,390,576___________
TOTAL MONEY MARKET FUNDS (Cost $1,390,576) 1,390,576___________Total Investments (Cost $173,950,924) – 99.81% 232,132,524Other Assets in Excess of Liabilities – 0.19% 433,110___________TOTAL NET ASSETS – 100.00% $232,565,634______________________
(a) Foreign issued security.(b) Non-income producing security.(c) Seven day yield as of February 28, 2018.
Abbreviations:Ltd. Limited Liability Company.
The Global Industry Classification Standard (GICS®) was developed by and/or is the exclusive property ofMSCI, Inc. and Standard & Poors Financial Services LLC (“S&P”). GICS is a service mark of MSCI and S&Pand has been licensed for use by U.S. Bancorp Fund Services, LLC.
18
The accompanying notes are an integral part of these financial statements.
Bright Rock Quality Large Cap FundSchedule of Investments (Continued)February 28, 2018

Mid Cap Quality LargeGrowth Fund Cap Fund____________ ____________
ASSETSInvestments, at value: (Cost $39,061,462 and $173,950,924) $66,109,499 $232,132,524Receivable for Fund shares sold 21,280 200,088Dividends and interest receivable 94,626 540,598Other assets 9,925 9,578__________ ___________
TOTAL ASSETS 66,235,330 232,882,788__________ ___________
LIABILITIESPayable for Fund shares redeemed 9,107 89,274Payable to affiliates 29,148 67,982Payable to Adviser 36,694 117,396Payable to distributor 25 1,099Accrued expenses and other liabilities 38,824 41,403__________ ___________
TOTAL LIABILITIES 113,798 317,154__________ ___________
NET ASSETS $66,121,532 $232,565,634__________ _____________________ ___________Net assets consist of:
Paid-in Capital $39,611,124 $170,619,770Accumulated net investment income — 574,474Accumulated net realized gain (loss) (537,629) 3,189,790Net unrealized appreciation on investments 27,048,037 58,181,600__________ ___________
NET ASSETS $66,121,532 $232,565,634__________ _____________________ ___________
INSTITUTIONAL CLASS SHARESNet assets $66,051,559 $232,471,378Shares of beneficial interest outstanding (unlimited number of shares authorized, $0.001 par value) 3,760,657 14,299,077Net asset value, redemption price and offering price per share $17.56 $16.26______ ____________ ______
INVESTOR CLASS SHARESNet assets $ 69,973 $ 94,256Shares of beneficial interest outstanding (unlimited number of shares authorized, $0.001 par value) 3,892 5,673Net asset value, redemption price and offering price per share $17.98 $16.62(1)______ ____________ ______
(1) Net asset value does not compute due to rounding.
19
The accompanying notes are an integral part of these financial statements.
Bright Rock FundsStatements of Assets and LiabilitiesFebruary 28, 2018

Mid Cap Quality LargeGrowth Fund Cap Fund____________ ____________
INVESTMENT INCOMEDividend income $ 714,382 $ 4,884,522Interest income 5,499 11,083__________ __________
TOTAL INVESTMENT INCOME 719,881 4,895,605__________ __________
EXPENSESManagement fees 460,540 1,465,273Administration fees 73,337 219,196Fund accounting fees 43,197 97,700Transfer agent fees and expenses 41,915 59,296Federal and state registration fees 35,630 39,913Audit and tax fees 30,133 30,133Legal fees 14,445 17,903Reports to shareholders 10,610 17,881Chief Compliance Officer fees 9,673 9,657Trustees’ fees 7,530 7,524Custody fees 6,623 23,716Distribution (12b-1) fees – Investor Class 231 2,735Other expenses 7,461 13,299__________ __________
TOTAL EXPENSES 741,325 2,004,226__________ __________NET INVESTMENT INCOME (LOSS) (21,444) 2,891,379__________ __________
REALIZED AND UNREALIZED GAIN ON INVESTMENTSNet realized gain on investments 41,489 5,386,438Net change in unrealized appreciation on investments 10,656,635 12,086,587__________ __________
NET REALIZED AND UNREALIZED GAIN ON INVESTMENTS 10,698,124 17,473,025__________ __________
NET INCREASE IN NET ASSETS FROM OPERATIONS $10,676,680 $20,364,404__________ ____________________ __________
20
The accompanying notes are an integral part of these financial statements.
Bright Rock FundsStatements of OperationsFor the Year Ended February 28, 2018

Year Ended Year EndedFebruary 28, 2018 February 28, 2017_______________ _______________
FROM OPERATIONSNet investment income (loss) $ (21,444) $ 52,409Net realized gain (loss) on investments 41,489 (557,164)Net change in unrealized appreciation on investments 10,656,635 10,464,040___________ ___________Net increase in net assets from operations 10,676,680 9,959,285___________ ___________
FROM DISTRIBUTIONSNet investment income – Institutional Class (52,371) (33,741)Net investment income – Investor Class (12) (33)Net realized gain – Institutional Class — (586,327)Net realized gain – Investor Class — (1,304)___________ ___________Net decrease in net assets resulting from distributions paid (52,383) (621,405)___________ ___________
FROM CAPITAL SHARE TRANSACTIONSProceeds from shares sold – Institutional Class 6,790,144 9,981,191Proceeds from shares sold – Investor Class 6,000 234,848Payments for shares redeemed – Institutional Class (10,279,001) (6,629,866)Payments for sharesredeemed – Investor Class (85,881) (118,884)Net asset value of shares issued in reinvestment of distributions to shareholders – Institutional Class 915 581,783Net asset value of shares issued in reinvestment of distributions to shareholders – Investor Class 10 1,338___________ ___________Net increase (decrease) in net assets from capital share transactions (3,567,813) 4,050,410___________ ___________
TOTAL INCREASE IN NET ASSETS 7,056,484 13,388,290
NET ASSETSBeginning of Year 59,065,048 45,676,758___________ ___________End of Year $66,121,532 $59,065,048___________ ______________________ ___________
ACCUMULATED NET INVESTMENT INCOME $ — $ 52,383___________ ______________________ ___________
21
The accompanying notes are an integral part of these financial statements.
Bright Rock Mid Cap Growth FundStatements of Changes in Net Assets

Year Ended Year EndedFebruary 28, 2018 February 28, 2017_______________ _______________
FROM OPERATIONSNet investment income $ 2,891,379 $ 2,795,855Net realized gain on investments 5,386,438 6,226,330Net change in unrealized appreciation on investments 12,086,587 17,733,984___________ ___________Net increase in net assets from operations 20,364,404 26,756,169___________ ___________
FROM DISTRIBUTIONSNet investment income – Institutional Class (2,735,708) (2,629,649)Net investment income – Investor Class (13,081) (15,441)Net realized gain – Institutional Class (3,619,735) (4,642,345)Net realized gain – Investor Class (1,817) (59,148)___________ ___________Net decrease in net assets resulting from distributions paid (6,370,341) (7,346,583)___________ ___________
FROM CAPITAL SHARE TRANSACTIONSProceeds from shares sold – Institutional Class 32,899,439 52,990,601Proceeds from shares sold – Investor Class 288,243 2,956,849Payments for shares redeemed – Institutional Class (34,277,312) (41,493,186)Payments for shares redeemed – Investor Class (2,944,920) (884,365)Net asset value of shares issued in reinvestment of distributions to shareholders – Institutional Class 3,686,516 4,614,963Net asset value of shares issued in reinvestment of distributions to shareholders – Investor Class 14,863 74,574___________ ___________Net increase (decrease) in net assets from capital share transactions (333,171) 18,259,436___________ ___________
TOTAL INCREASE IN NET ASSETS 13,660,892 37,669,022
NET ASSETSBeginning of Year 218,904,742 181,235,720___________ ___________End of Year $232,565,634 $218,904,742___________ ______________________ ___________
ACCUMULATED NET INVESTMENT INCOME $ 574,474 $ 431,884___________ ______________________ ___________
22
The accompanying notes are an integral part of these financial statements.
Bright Rock Quality Large Cap FundStatements of Changes in Net Assets

Per Share Data for a Share Outstanding Throughout Each Year
Year Ended Year Ended Year Ended Year Ended Year EndedFebruary 28, February 28, February 29, February 28, February 28,
2018 2017 2016 2015 2014___________ ___________ ___________ ___________ ___________Net Asset Value, Beginning of Period $ 14.83 $ 12.37 $ 13.88 $ 13.61 $ 11.70_______ _______ _______ _______ _______
Income (loss) from investment operations:Net investment income (loss)(1) (0.01) 0.01 0.01 (0.03) (0.05)Net realized and unrealized gain (loss) on investments 2.75 2.61 (0.79) 1.47 2.12_______ _______ _______ _______ _______
Total from investment operations 2.74 2.62 (0.78) 1.44 2.07_______ _______ _______ _______ _______
Less distributions paid:From investment income (0.01) (0.01) — — —From net realized gain on investments — (0.15) (0.73) (1.17) (0.16)_______ _______ _______ _______ _______
Total distributions paid (0.01) (0.16) (0.73) (1.17) (0.16)_______ _______ _______ _______ _______
Net Asset Value, End of Period $ 17.56 $ 14.83 $ 12.37 $ 13.88 $ 13.61_______ _______ _______ _______ ______________ _______ _______ _______ _______
Total Return 18.50% 21.22% (5.68)% 11.41% 17.75%
Supplemental Data and Ratios:Net assets, end of period (000’s) $66,052 $58,928 $45,666 $47,851 $42,237Ratio of expenses to average net assets before waivers or recoupments 1.21% 1.20% 1.26% 1.28% 1.34%Ratio of expenses to average net assets after waiversor recoupments 1.21% 1.25% 1.25% 1.25% 1.25%Ratio of net investment income (loss) to average net assets before waivers or recoupments (0.03)% 0.14% 0.08% (0.21)% (0.52)%Ratio of net investment income (loss) to average net assets after waivers or recoupments (0.03)% 0.10% 0.09% (0.18)% (0.43)%Portfolio turnover rate 15.3% 30.2% 44.1% 62.9% 30.5%
(1) Per share net investment income (loss) was calculated using average shares outstanding.
23
The accompanying notes are an integral part of these financial statements.
Bright Rock Mid Cap Growth Fund – Institutional ClassFinancial Highlights
Per Share Data for a Share Outstanding Throughout Each Year
Year Ended Year Ended Year Ended Year Ended Year EndedFebruary 28, February 28, February 29, February 28, February 28,
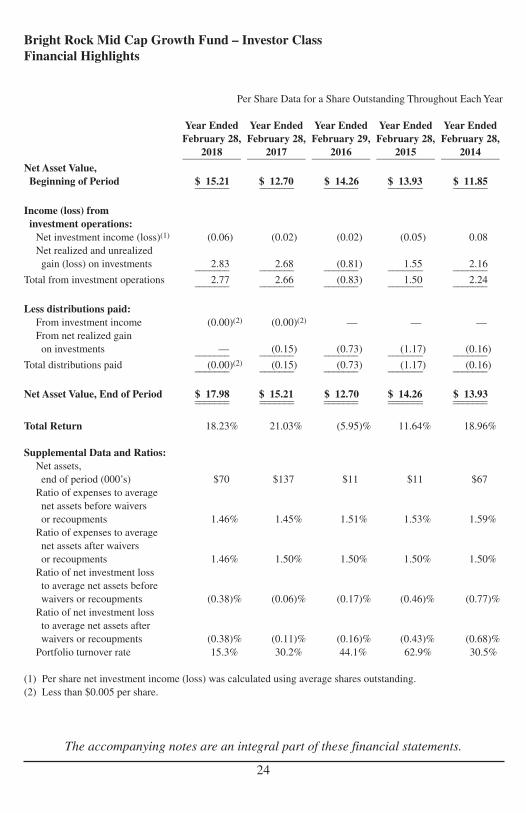
2018 2017 2016 2015 2014___________ ___________ ___________ ___________ ___________Net Asset Value, Beginning of Period $ 15.21 $ 12.70 $ 14.26 $ 13.93 $ 11.85_______ _______ _______ _______ _______
Income (loss) from investment operations:Net investment income (loss)(1) (0.06) (0.02) (0.02) (0.05) 0.08Net realized and unrealized gain (loss) on investments 2.83 2.68 (0.81) 1.55 2.16_______ _______ _______ _______ _______
Total from investment operations 2.77 2.66 (0.83) 1.50 2.24_______ _______ _______ _______ _______
Less distributions paid:From investment income (0.00)(2) (0.00)(2) — — —From net realized gain on investments — (0.15) (0.73) (1.17) (0.16)_______ _______ _______ _______ _______
Total distributions paid (0.00)(2) (0.15) (0.73) (1.17) (0.16)_______ _______ _______ _______ _______
Net Asset Value, End of Period $ 17.98 $ 15.21 $ 12.70 $ 14.26 $ 13.93_______ _______ _______ _______ ______________ _______ _______ _______ _______
Total Return 18.23% 21.03% (5.95)% 11.64% 18.96%
Supplemental Data and Ratios:Net assets, end of period (000’s) $70 $137 $11 $11 $67Ratio of expenses to average net assets before waivers or recoupments 1.46% 1.45% 1.51% 1.53% 1.59%Ratio of expenses to average net assets after waivers or recoupments 1.46% 1.50% 1.50% 1.50% 1.50%Ratio of net investment loss to average net assets before waivers or recoupments (0.38)% (0.06)% (0.17)% (0.46)% (0.77)%Ratio of net investment loss to average net assets after waivers or recoupments (0.38)% (0.11)% (0.16)% (0.43)% (0.68)%Portfolio turnover rate 15.3% 30.2% 44.1% 62.9% 30.5%
(1) Per share net investment income (loss) was calculated using average shares outstanding.(2) Less than $0.005 per share.
24
The accompanying notes are an integral part of these financial statements.
Bright Rock Mid Cap Growth Fund – Investor ClassFinancial Highlights

Per Share Data for a Share Outstanding Throughout Each Year
Year Ended Year Ended Year Ended Year Ended Year EndedFebruary 28, February 28, February 29, February 28, February 28,
2018 2017 2016 2015 2014___________ ___________ ___________ ___________ ___________Net Asset Value, Beginning of Period $ 15.26 $ 13.79 $ 14.73 $ 14.63 $ 12.98_______ _______ _______ _______ _______
Income (loss) from investment operations:Net investment income(1) 0.20 0.20 0.23 0.23 0.18Net realized and unrealized gain (loss) on investments 1.25 1.79 (0.71) 1.54 2.62_______ _______ _______ _______ _______
Total from investment operations 1.45 1.99 (0.48) 1.77 2.80_______ _______ _______ _______ _______
Less distributions paid:From investment income (0.19) (0.19) (0.23) (0.24) (0.17)From net realized gain on investments (0.26) (0.33) (0.23) (1.43) (0.98)_______ _______ _______ _______ _______
Total distributions paid (0.45) (0.52) (0.46) (1.67) (1.15)_______ _______ _______ _______ _______
Net Asset Value, End of Period $ 16.26 $ 15.26 $ 13.79 $ 14.73 $ 14.63_______ _______ _______ _______ ______________ _______ _______ _______ _______
Total Return 9.54% 14.64% (3.31)% 12.83% 21.93%
Supplemental Data and Ratios:Net assets at endof period (000’s omitted) $232,472 $216,188 $180,801 $180,571 $151,960Ratio of expenses to average net assets 0.89% 0.89% 0.90% 0.90% 0.92%Ratio of net investment income to average net assets 1.28% 1.37% 1.62% 1.54% 1.28%Portfolio turnover rate 30.9% 60.3% 58.3% 36.2% 53.3%
(1) Per share net investment income was calculated using average shares outstanding.
25
The accompanying notes are an integral part of these financial statements.
Bright Rock Quality Large Cap Fund – Institutional ClassFinancial Highlights

Per Share Data for a Share Outstanding Throughout Each Year
Year Ended Year Ended Year Ended Year Ended Year EndedFebruary 28, February 28, February 29, February 28, February 28,
2018 2017 2016 2015 2014___________ ___________ ___________ ___________ ___________Net Asset Value, Beginning of Period $ 15.56 $ 14.05 $ 15.02 $ 14.87 $ 13.11_______ _______ _______ _______ _______
Income (loss) from investment operations:Net investment income(1) 0.15 0.17 0.20 0.19 0.20Net realized and unrealized gain (loss) on investments 1.28 1.82 (0.73) 1.59 2.70_______ _______ _______ _______ _______
Total from investment operations 1.43 1.99 (0.53) 1.78 2.90_______ _______ _______ _______ _______
Less distributions paid:From investment income (0.11) (0.15) (0.21) (0.20) (0.16)From net realized gain on investments (0.26) (0.33) (0.23) (1.43) (0.98)_______ _______ _______ _______ _______
Total distributions paid (0.37) (0.48) (0.44) (1.63) (1.14)_______ _______ _______ _______ _______
Net Asset Value, End of Period $ 16.62 $ 15.56 $ 14.05 $ 15.02 $ 14.87_______ _______ _______ _______ ______________ _______ _______ _______ _______
Total Return 9.19% 14.33% (3.56)% 12.66% 22.47%
Supplemental Data and Ratios:Net assets at end of period (000’s omitted) $94 $2,717 $435 $148 $152Ratio of expenses to average net assets 1.21% 1.14% 1.15% 1.15% 1.17%Ratio of net investment income to average net assets 0.98% 1.12% 1.37% 1.79% 1.53%Portfolio turnover rate 30.9% 60.3% 58.3% 36.2% 53.3%
(1) Per share net investment income was calculated using average shares outstanding.
26
The accompanying notes are an integral part of these financial statements.
Bright Rock Quality Large Cap Fund – Investor ClassFinancial Highlights

(1) Organization
Trust for Professional Managers (the “Trust”) was organized as a Delaware statutorytrust under a Declaration of Trust dated May 29, 2001. The Trust is registered underthe Investment Company Act of 1940, as amended (the “1940 Act”), as an open-endmanagement investment company. The Bright Rock Funds (the “Funds”) arecomprised of the Bright Rock Mid Cap Growth Fund and the Bright Rock QualityLarge Cap Fund, each representing a distinct series with its own investment objectiveand policies within the Trust. The investment objective of both Funds is long-termcapital appreciation. The Trust may issue an unlimited number of shares ofbeneficial interest at $0.001 par value. The assets of the Funds are segregated, and ashareholder’s interest is limited to the Fund in which shares are held. Each Fund hastwo share classes: Institutional Class and Investor Class shares. Each Fund is a seriesof an investment company and accordingly follows the investment companyaccounting and reporting guidance of the Financial Accounting Standards Board(FASB) Accounting Standard Codification Topic 946 “Financial Services—Investment Companies”. The Institutional Class shares of each Fund commencedoperations on May 26, 2010. The Investor Class shares of each Fund commencedoperations on January 17, 2012. Bright Rock Capital Management, LLC (the“Adviser”) serves as the Funds’ investment adviser.
(2) Significant Accounting Policies
The following is a summary of significant accounting policies consistently followedby the Funds in the preparation of the financial statements. These policies are inconformity with accounting principles generally accepted in the United States ofAmerica (“GAAP”).
(a) Investment Valuation
Each security owned by the Funds that is listed on a securities exchange isvalued at its last sale price on that exchange on the date as of which assets arevalued. Debt securities are valued at the mean between the bid and ask pricesprovided by an approved independent pricing service. Forward currencycontracts are valued at the mean between the bid and asked prices by anapproved pricing service. Commodities futures contracts and options thereontraded on a commodities exchange or board of trade are valued at the last saleprice at the close of trading. Rights and warrants are valued at the last sale priceat the close of the exchange on which the security is primarily traded.
If the security is listed on more than one exchange, the Funds will use the priceof the exchange that the Funds generally consider to be the principal exchange onwhich the security is traded. Portfolio securities listed on the NASDAQ StockMarket, Inc. (“NASDAQ”) will be valued at the NASDAQ Official Closing Price,
27
Bright Rock FundsNotes to Financial StatementsFebruary 28, 2018
which may not necessarily represent the last sale price. If there has been no saleon such exchange or on NASDAQ on such day, the security is valued at the meanbetween the most recent bid and asked prices on such day or the security shall bevalued at the latest sales price on the “composite market” for the day suchsecurity is being valued. The composite market is defined as a consolidation ofthe trade information provided by national securities and foreign exchanges andover-the-counter markets as published by a pricing service.
If market quotations are not readily available, a security or other asset will bevalued at its fair value as determined under fair value pricing proceduresapproved by the Board of Trustees. These fair value pricing procedures will alsobe used to price a security when corporate events, events in the securities marketand/or world events cause the Adviser to believe that a security’s last sale pricemay not reflect its actual fair market value. The intended effect of using fairvalue pricing procedures is to ensure that the Funds are accurately priced. TheBoard of Trustees will regularly evaluate whether the Funds’ fair value pricingprocedures continue to be appropriate in light of the specific circumstances ofthe Funds and the quality of prices obtained through the application of suchprocedures by the Trust’s valuation committee.
Foreign securities will be priced in their local currencies as of the close of theirprimary exchange or market or as of the time each Fund calculates its net assetvalue (“NAV”), whichever is earlier. Foreign securities, currencies and otherassets denominated in foreign currencies are then translated into U.S. dollars atthe exchange rate of such currencies against the U.S. dollar, as provided by anapproved pricing service or reporting agency. All assets denominated in foreigncurrencies will be converted into U.S. dollars using the applicable currencyexchange rates as of the close of the New York Stock Exchange (“NYSE”),generally 4:00 p.m. Eastern Time.
Debt securities, including short-term debt instruments having a maturity of 60 daysor less, are valued at the mean in accordance with prices supplied by an approvedpricing service. Pricing services may use various valuation methodologies such asthe mean between the bid and the asked prices, matrix pricing and other analyticalpricing models as well as market transactions and dealer quotations. If a price isnot available from a pricing service, the most recent quotation obtained from oneor more broker-dealers known to follow the issue will be obtained. Quotations willbe valued at the mean between the bid and the offer. In the absence of availablequotations, the securities will be priced at fair value. Any discount or premium isaccreted or amortized using the constant yield method over the life of the security.
Money market funds, demand notes and repurchase agreements are valued atcost. If cost does not represent current market value the securities will be pricedat fair value.
28
Bright Rock FundsNotes to Financial Statements (Continued)February 28, 2018

Redeemable securities issued by open-end, registered investment companies arevalued at the NAVs of such companies for purchase and/or redemption ordersplaced on that day. All exchange-traded funds are valued at the last reported saleprice on the exchange on which the security is principally traded.
FASB Accounting Standards Codification, “Fair Value Measurement” Topic 820(“ASC 820”), establishes an authoritative definition of fair value and sets out ahierarchy for measuring fair value. ASC 820 requires an entity to evaluate certainfactors to determine whether there has been a significant decrease in volume andlevel of activity for the security such that recent transactions and quoted pricesmay not be determinative of fair value and further analysis and adjustment maybe necessary to estimate fair value. ASC 820 also requires enhanced disclosureregarding the inputs and valuation techniques used to measure fair value in thoseinstances as well as expanded disclosure of valuation levels for major securitytypes. These inputs are summarized in the three broad levels listed below:
Level 1—Quoted prices in active markets for identical securities.
Level 2—Other significant observable inputs (including quoted prices for similarsecurities, interest rates, prepayment speeds, credit risk, etc.).
Level 3—Significant unobservable inputs (including the Funds’ ownassumptions in determining the fair value of investments).
The inputs or methodology used for valuing securities are not necessarily anindication of the risk associated with investing in those securities. The followingis a summary of the inputs used to value the Funds’ investments carried at fairvalue as of February 28, 2018:
Mid Cap Growth FundLevel 1 Level 2 Level 3 Total______ ______ ______ _____
EquityCommon Stocks $66,039,571 $ — $ — $66,039,571Money Market Funds 69,928 — — 69,928__________ ________ ________ __________Total Investments in Securities $66,109,499 $ — $ — $66,109,499__________ ________ ________ ____________________ ________ ________ __________
Quality Large Cap FundLevel 1 Level 2 Level 3 Total______ ______ ______ _____
EquityCommon Stocks $226,372,898 $ — $ — $226,372,898Exchange Traded Fund 4,369,050 — — 4,369,050Money Market Funds 1,390,576 — — 1,390,576___________ ________ ________ ___________Total Investments in Securities $232,132,524 $ — $ — $232,132,524___________ ________ ________ ______________________ ________ ________ ___________
29
Bright Rock FundsNotes to Financial Statements (Continued)February 28, 2018
During the year ended February 28, 2018, there were no transfers between levelsfor the Funds. It is the Funds’ policy to record transfers between levels at the endof the year. The Funds did not hold any Level 3 securities during the year. TheFunds did not hold financial derivative instruments during the year presented.
(b) Federal Income Taxes
The Funds comply with the requirements of Subchapter M of the InternalRevenue Code necessary to qualify as a regulated investment company and makethe requisite distributions of income and capital gains to their shareholderssufficient to relieve them from all or substantially all federal income taxes.Therefore, no federal income tax provision has been provided.
(c) Distributions to Shareholders
The Funds will distribute any net investment income and any net realized long- orshort-term capital gains at least annually. Distributions from net realized gains forbook purposes may include short-term capital gains. All short-term capital gainsare included in ordinary income for tax purposes. Distributions to shareholders arerecorded on the ex-dividend date. The Funds may also pay a special distribution atthe end of the calendar year to comply with federal tax requirements.
The amount of the dividends from net investment income and distributions fromnet realized gains are determined in accordance with federal income taxregulations, which may differ from GAAP. These differences are eithertemporary or permanent in nature. To the extent these differences are permanentin nature, such amounts are reclassified within the composition of net assetsbased on their federal tax-basis treatment.
(d) Use of Estimates
The preparation of financial statements in conformity with GAAP requiresmanagement to make estimates and assumptions that affect the reportedamounts of assets and liabilities and disclosure of contingent assets andliabilities at the date of the financial statements and the reported amounts ofrevenues and expenses during the reporting period. Actual results could differfrom those estimates.
(e) Share Valuation
The NAV per share of each Fund is calculated by dividing the sum of the value ofthe securities held by each Fund, plus cash or other assets, minus all liabilities(including estimated accrued expenses) by the total number of shares outstandingfor each Fund, rounded to the nearest cent. The Funds’ shares will not be pricedon the days on which the NYSE is closed for trading. The offering andredemption price per share for each Fund is equal to the Fund’s NAV per share.
30
Bright Rock FundsNotes to Financial Statements (Continued)February 28, 2018

(f) Allocation of Income, Expenses and Gains/Losses
Income, expenses (other than those deemed attributable to a specific shareclass), and gains and losses of the Funds are allocated daily to each class ofshares based upon the ratio of net assets represented by each class as apercentage of the net assets of each Fund. Expenses deemed directly attributableto a class of shares are recorded by the specific class. Most Fund expenses areallocated by class based on relative net assets. Distribution (12b-1) fees areexpensed at 0.25% of average daily net assets of the Investor Class shares ofeach Fund. Expenses associated with a specific fund in the Trust are charged tothat fund. Common Trust expenses are typically allocated evenly between thefunds of the Trust, or by other equitable means.
(g) Other
Investment transactions are recorded on the trade date. The Funds determine thegain or loss from investment transactions using the best tax relief order.Dividend income is recognized on the ex-dividend date and interest income isrecognized on an accrual basis.
(3) Federal Tax Matters
The tax character of distributions paid to shareholders for the years ended February 28, 2018 and February 28, 2017 were as follows:
Ordinary Long-termIncome Capital Gain________ ___________
Mid Cap Growth FundYear ended February 28, 2018 $ 52,383 $ —Year ended February 28, 2017 $ 33,800 $ 587,605
Quality Large Cap FundYear ended February 28, 2018 $2,748,789 $3,621,552Year ended February 28, 2017 $2,645,090 $4,701,493
31
Bright Rock FundsNotes to Financial Statements (Continued)February 28, 2018

As of February 28, 2018, the components of accumulated earnings (losses) on a taxbasis were as follows:
Mid Cap Quality LargeGrowth Fund Cap Fund____________ ____________
Cost basis of investments forfederal income tax purposes $39,083,416 $174,032,430__________ _____________________ ___________Gross tax unrealized appreciation $27,891,281 $ 59,484,099Gross tax unrealized depreciation (865,198) (1,384,005)__________ ___________Net tax unrealized appreciation $27,026,083 $ 58,100,094__________ ___________Undistributed ordinary income $ — $ 574,474Undistributed long-term capital gain — 3,271,296__________ ___________Total distributable earnings $ — $ 3,845,770__________ ___________Other accumulated loss (515,675) —__________ ___________Total accumulated earnings $26,510,408 $ 61,945,864__________ _____________________ ___________
The difference between book-basis and tax-basis cost of investments is attributable tothe tax deferral of wash sale losses.
At February 28, 2018, the Mid Cap Growth Fund had short term capital losscarryforwards of $515,675.
On the Statement of Assets and Liabilities, the following adjustments were made forpermanent tax adjustments:
Mid Cap Quality LargeGrowth Fund Cap Fund____________ ____________
Undistributed Net Investment Income $ 21,444 $ —Paid-In Capital $(21,444) $ —
The Funds had no material uncertain tax positions and had not recorded a liability forunrecognized tax benefits as of February 28, 2018. Also, the Funds recognized nointerest and penalties related to uncertain tax benefits in fiscal year 2018. AtFebruary 28, 2018, the fiscal years 2015 through 2018 remained open to examinationin the Funds’ major tax jurisdictions.
(4) Investment Adviser
The Trust has entered into an Investment Advisory Agreement (the “Agreement”)with the Adviser to furnish investment advisory services to the Funds. Under theterms of the Agreement, the Trust, on behalf of the Mid Cap Growth Fund,compensates the Adviser for its management services at the annual rate of 0.75% ofthe Fund’s average daily net assets. The Trust, on behalf of the Quality Large CapFund, compensates the Adviser for its management services at the annual rate of0.65% of the Fund’s average daily net assets.
32
Bright Rock FundsNotes to Financial Statements (Continued)February 28, 2018

The Adviser has contractually agreed to waive its management fee and/or reimbursethe Funds’ other expenses at least through June 28, 2019, at the discretion of theAdviser and the Board of Trustees, to the extent necessary to ensure that the Funds’total operating expenses (exclusive of front-end or contingent deferred sales loads,Rule 12b-1 fees, shareholder servicing plan fees, taxes, leverage expenses, interest,brokerage commissions, expenses incurred in connection with any merger orreorganization, dividends or interest on short positions, acquired fund fees andexpenses and extraordinary expenses such as litigation) do not exceed 1.25% of eachFund’s average daily net assets. Any such waiver or reimbursement is subject to lateradjustment to allow the Adviser to recoup amounts waived or reimbursed withinthree years from the date such amount was waived or reimbursed, subject to theoperating expense limitation agreement, if such reimbursements will not cause aFund to exceed the lesser of: (1) the expense limitation in place at the time of thewaiver and/or expense payment; or (2) the expense limitation in place at the time ofthe recoupment. The Funds did not have any previously waived expenses subject topotential recoupment at year end.
(5) Distribution Plan
The Trust has adopted a plan pursuant to Rule 12b-1 under the 1940 Act (the “12b-1Plan”), on behalf of the Funds, which authorizes them to pay Quasar Distributors,LLC (the “Distributor”) a distribution (12b-1) fee of 0.25% of each Fund’s InvestorClass shares’ average daily net assets for services to prospective Fund shareholdersand distribution of Fund shares. During the year ended February 28, 2018, the Mid Cap Growth Fund and the Quality Large Cap Fund incurred expenses of $231and $2,735 pursuant to the 12b-1 Plan, respectively.
(6) Related Party Transactions
U.S. Bancorp Fund Services, LLC (“USBFS” or the “Administrator”) acts as the Funds’administrator under an Administration Agreement. The Administrator prepares variousfederal and state regulatory filings, reports and returns for the Funds; prepares reportsand materials to be supplied to the Trustees; monitors the activities of the Funds’custodian, transfer agent and accountants; and coordinates the preparation and paymentof the Funds’ expenses and reviews the Funds’ expense accruals. USBFS also serves asthe fund accountant and transfer agent to the Funds. U.S. Bank, N.A. (“US Bank”), anaffiliate of USBFS, serves as each Fund’s custodian. Fees incurred for the year endedFebruary 28, 2018, and owed as of February 28, 2018, are as follows:
Administration Incurred Owed______________ ________ ______
Bright Rock Mid Cap Growth Fund $ 73,337 $12,257Bright Rock Quality Large Cap Fund $219,196 $37,075
33
Bright Rock FundsNotes to Financial Statements (Continued)February 28, 2018

Fund Accounting Incurred Owed_______________ ________ ______
Bright Rock Mid Cap Growth Fund $43,197 $ 7,350Bright Rock Quality Large Cap Fund $97,700 $16,083
Transfer Agency Incurred* Owed______________ _________ ______
Bright Rock Mid Cap Growth Fund $40,636 $6,625Bright Rock Quality Large Cap Fund $52,239 $8,983
Custody Incurred Owed_______ ________ ______
Bright Rock Mid Cap Growth Fund $ 6,623 $1,165Bright Rock Quality Large Cap Fund $23,716 $4,099
* These amounts do not include sub-transfer agency fees, and therefore may notagree to the Statements of Operations.
The Funds each have a line of credit with US Bank (see Note 9).
The Distributor acts as the Funds’ principal underwriter in a continuous publicoffering of the Funds’ shares. The Distributor is an affiliate of USBFS and US Bank.
Certain officers of the Funds are also employees of USBFS. A Trustee of the Trust isaffiliated with USBFS and US Bank. This same Trustee is a board member and aninterested person of the Distributor.
The Trust’s Chief Compliance Officer (“CCO”) is also an employee of USBFS.Each Fund’s allocation of the Trust’s Chief Compliance Officer fee incurred for theyear ended February 28, 2018, and owed as of February 28, 2018, is as follows:
CCO Incurred Owed_____ ________ ______
Bright Rock Mid Cap Growth Fund $9,673 $1,751Bright Rock Quality Large Cap Fund $9,657 $1,742
34
Bright Rock FundsNotes to Financial Statements (Continued)February 28, 2018

(7) Capital Share Transactions
Transactions in shares of the Funds were as follows:
Year Ended Year EndedMid Cap Growth Fund – Institutional Class February 28, 2018 February 28, 2017
Shares Sold 436,019 718,012Shares Issued to Holders in Reinvestment of Distributions 54 40,514Shares Redeemed (648,325) (478,416)________ ________Net Increase (Decrease) (212,252) 280,110________ ________________ ________
Year Ended Year EndedMid Cap Growth Fund – Investor Class February 28, 2018 February 28, 2017
Shares Sold 393 16,462Shares Issued to Holders in Reinvestment of Distributions 1 91Shares Redeemed (5,512) (8,389)________ ________Net Increase (Decrease) (5,118) 8,164________ ________________ ________
Year Ended Year EndedQuality Large Cap Fund – Institutional Class February 28, 2018 February 28, 2017
Shares Sold 2,087,343 3,562,485Shares Issued to Holders in Reinvestment of Distributions 223,111 311,005Shares Redeemed (2,175,811) (2,819,155)_________ _________Net Increase 134,643 1,054,335_________ __________________ _________
Year Ended Year EndedQuality Large Cap Fund – Investor Class February 28, 2018 February 28, 2017
Shares Sold 18,404 197,324Shares Issued to Holders in Reinvestment of Distributions 934 4,933Shares Redeemed (188,253) (58,632)________ ________Net Increase (Decrease) (168,915) 143,625________ ________________ ________
35
Bright Rock FundsNotes to Financial Statements (Continued)February 28, 2018
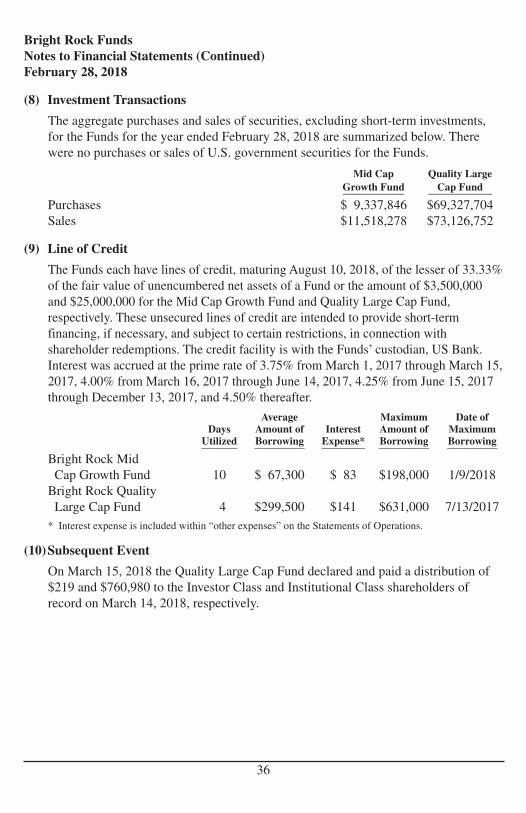
(8) Investment Transactions
The aggregate purchases and sales of securities, excluding short-term investments,for the Funds for the year ended February 28, 2018 are summarized below. Therewere no purchases or sales of U.S. government securities for the Funds.
Mid Cap Quality LargeGrowth Fund Cap Fund____________ ____________
Purchases $ 9,337,846 $69,327,704Sales $11,518,278 $73,126,752
(9) Line of Credit
The Funds each have lines of credit, maturing August 10, 2018, of the lesser of 33.33%of the fair value of unencumbered net assets of a Fund or the amount of $3,500,000and $25,000,000 for the Mid Cap Growth Fund and Quality Large Cap Fund,respectively. These unsecured lines of credit are intended to provide short-termfinancing, if necessary, and subject to certain restrictions, in connection withshareholder redemptions. The credit facility is with the Funds’ custodian, US Bank.Interest was accrued at the prime rate of 3.75% from March 1, 2017 through March 15,2017, 4.00% from March 16, 2017 through June 14, 2017, 4.25% from June 15, 2017through December 13, 2017, and 4.50% thereafter.
Average Maximum Date ofDays Amount of Interest Amount of Maximum
Utilized Borrowing Expense* Borrowing Borrowing_______ __________ _________ __________ __________
Bright Rock MidCap Growth Fund 10 $ 67,300 $ 83 $198,000 1/9/2018Bright Rock QualityLarge Cap Fund 4 $299,500 $141 $631,000 7/13/2017
* Interest expense is included within “other expenses” on the Statements of Operations.
(10)Subsequent Event
On March 15, 2018 the Quality Large Cap Fund declared and paid a distribution of$219 and $760,980 to the Investor Class and Institutional Class shareholders ofrecord on March 14, 2018, respectively.
36
Bright Rock FundsNotes to Financial Statements (Continued)February 28, 2018
To the Shareholders of Bright Rock Funds andBoard of Trustees of Trust for Professional Managers:
Opinion on the Financial Statements and Financial Highlights
We have audited the accompanying statement of assets and liabilities, including the schedule ofinvestments, of the Bright Rock Funds, comprising Bright Rock Mid Cap Growth Fund and BrightRock Quality Large Cap Fund (collectively, the “Funds”), each portfolios of the diversified seriesconstituting Trust for Professional Managers, as of February 28, 2018, the related statements ofoperations for the year then ended, the statements of changes in net assets for each of the two yearsin the period then ended, the financial highlights for each of the five years in the period then ended,and the related notes. In our opinion, the financial statements and financial highlights present fairly,in all material respects, the financial position of each of the portfolios constituting the Bright RockFunds as of February 28, 2018, and the results of their operations for the year then ended, thechanges in their net assets for each of the two years in the period then ended, and the financialhighlights for each of the five years in the period then ended, in conformity with accountingprinciples generally accepted in the United States of America.
Basis for Opinion
These financial statements and financial highlights are the responsibility of the Funds’management. Our responsibility is to express an opinion on the Funds’ financial statements andfinancial highlights based on our audits. We are a public accounting firm registered with the PublicCompany Accounting Oversight Board (United States) (PCAOB) and are required to beindependent with respect to the Funds in accordance with the U.S. federal securities laws and theapplicable rules and regulations of the Securities and Exchange Commission and the PCAOB.
We conducted our audits in accordance with the standards of the PCAOB. Those standards requirethat we plan and perform the audits to obtain reasonable assurance about whether the financialstatements and financial highlights are free of material misstatement, whether due to error or fraud.The Funds are not required to have, nor were we engaged to perform, an audit of their internal controlover financial reporting. As part of our audits we are required to obtain an understanding of internalcontrol over financial reporting but not for the purpose of expressing an opinion on the effectivenessof the Funds’ internal control over financial reporting. Accordingly, we express no such opinion.
Our audits included performing procedures to assess the risks of material misstatement of the financialstatements and financial highlights, whether due to error or fraud, and performing procedures thatrespond to those risks. Such procedures included examining, on a test basis, evidence regarding theamounts and disclosures in the financial statements and financial highlights. Our audits also includedevaluating the accounting principles used and significant estimates made by management, as well asevaluating the overall presentation of the financial statements and financial highlights. Our proceduresincluded confirmation of securities owned as of February 28, 2018, by correspondence with thecustodian and brokers. We believe that our audits provide a reasonable basis for our opinion.
/s/ Deloitte & Touche, LLP
Milwaukee, WisconsinApril 27, 2018
We have served as the auditor of one or more Trust for Professional Managers’ investmentcompanies since 2002.
37
Bright Rock FundsReport of Independent Registered Public Accounting Firm
We collect non-public personal information about you from the following sources:
• information we receive about you on applications or other forms;
• information you give us orally; and
• information about your transactions with us or others.
We do not disclose any non-public personal information about our shareholders or formershareholders without the shareholder’s authorization, except as permitted by law or inresponse to inquiries from governmental authorities. We may share information withaffiliated parties and unaffiliated third parties with whom we have contracts for servicingthe Funds. We will provide unaffiliated third parties with only the information necessaryto carry out their assigned responsibility. All shareholder records will be disposed of inaccordance with applicable law. We maintain physical, electronic and proceduralsafeguards to protect your non-public personal information and require third parties totreat your non-public personal information with the same high degree of confidentiality.
In the event that you hold shares of the Funds through a financial intermediary, including,but not limited to, a broker-dealer, bank or trust company, the privacy policy of yourfinancial intermediary would govern how your non-public personal information would beshared with unaffiliated third parties.
38
Bright Rock FundsNotice of Privacy Policy & Practices

Tax Information
For the fiscal year ended February 28, 2018, certain dividends paid by the Funds may besubject to a maximum tax rate of 20%, as provided for by the Jobs and Growth Tax ReliefReconciliation Act of 2003. The percentage of dividends declared from ordinary incomedesignated as qualified dividend income was as follows:
Bright Rock Quality Large Cap 100.00%Bright Rock Mid Cap Growth 100.00%
For corporate shareholders, the percent of ordinary income distributions qualifying forthe corporate dividends received deduction for the fiscal year ended February 28, 2018,was as follows:
Bright Rock Quality Large Cap 100.00%Bright Rock Mid Cap Growth 100.00%
Indemnification
Under the Trust’s organizational documents, its officers and Trustees are indemnifiedagainst certain liabilities arising out of the performance of their duties to the Funds. Inaddition, in the normal course of business, the Funds enter into contracts that providegeneral indemnifications to other parties. The Funds’ maximum exposure under thesearrangements is unknown, as this would involve future claims that may be made againstthe Funds that have not yet occurred. However, the Funds have not had prior claims orlosses pursuant to these contracts and expect the risk of loss to be remote.
Information about Trustees
The business and affairs of the Trust are managed under the direction of the Trust’s Boardof Trustees. Information pertaining to the Trustees of the Trust is set forth below. TheFunds’ Statement of Additional Information includes additional information about theTrustees and is available, without charge, upon request by calling 1-866-273-7223.
39
Bright Rock FundsAdditional Information(Unaudited)

Independent TrusteesNumber of Other
Term of Portfolios Principal DirectorshipsName, Position(s) Office and in Trust Occupation(s) Held by Trustee
Address and Held with Length of Overseen During the During theYear of Birth the Trust Time Served by Trustee Past Five Years Past Five Years____________ __________ ____________ __________ _____________ ______________
Michael D. Akers, Ph.D. Trustee Indefinite 30 Professor, Independent 615 E. Michigan St. Term; Since Department of Trustee, USA Milwaukee, WI 53202 August 22, Accounting, MUTUALSYear of Birth: 1955 2001 Marquette University (an open-end
(2004–present); investment Chair, Department company with of Accounting, three portfolios).Marquette University (2004–2017).
Gary A. Drska Trustee Indefinite 30 Pilot, Frontier/ Independent 615 E. Michigan St. Term; Since Midwest Airlines, Trustee, USA Milwaukee, WI 53202 August 22, Inc. (airline company) MUTUALSYear of Birth: 1956 2001 (1986–present). (an open-end
investment company with three portfolios).
40
Bright Rock FundsAdditional Information (Continued)(Unaudited)

Number of OtherTerm of Portfolios Principal Directorships
Name, Position(s) Office and in Trust Occupation(s) Held by TrusteeAddress and Held with Length of Overseen During the During theYear of Birth the Trust Time Served by Trustee Past Five Years Past Five Years____________ __________ ____________ __________ _____________ ______________
Jonas B. Siegel Trustee Indefinite 30 Retired Independent 615 E. Michigan St. Term; Since (2011–present); Trustee, Gottex Milwaukee, WI 53202 October 23, Managing Director, Trust (an open-Year of Birth: 1943 2009 Chief Administrative end investment
Officer (“CAO”) and company with Chief Compliance one portfolio) Officer (“CCO”), (2010–2016); Granite Capital Independent International Group, Manager, L.P. (an investment Ramius IDF management firm) fund complex (1994–2011). (two closed-end
investment companies) (2010–2015); Independent Trustee, Gottex Multi-Asset Endowment fundcomplex (three closed-end investment companies) (2010–2015); Independent Trustee, Gottex Multi-Alternatives fund complex (three closed-endinvestment companies) (2010–2015).
41
Bright Rock FundsAdditional Information (Continued)(Unaudited)
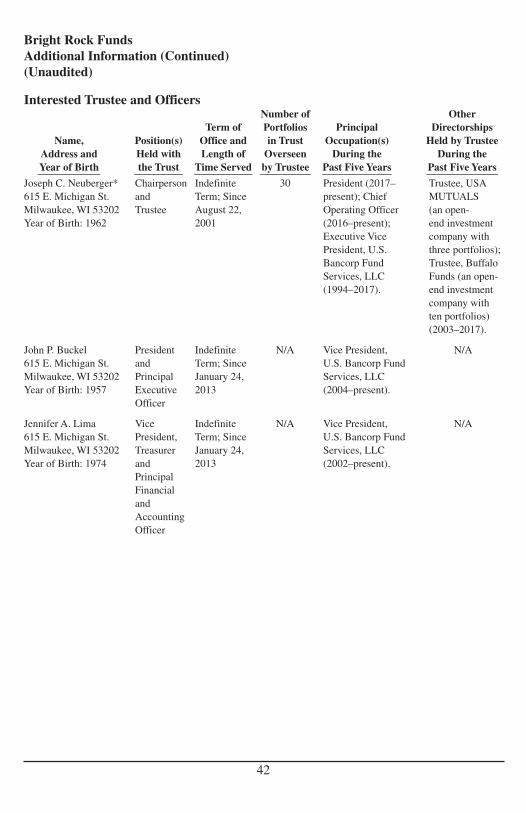
Interested Trustee and OfficersNumber of Other
Term of Portfolios Principal DirectorshipsName, Position(s) Office and in Trust Occupation(s) Held by Trustee
Address and Held with Length of Overseen During the During theYear of Birth the Trust Time Served by Trustee Past Five Years Past Five Years____________ __________ ____________ __________ _____________ ______________
Joseph C. Neuberger* Chairperson Indefinite 30 President (2017– Trustee, USA615 E. Michigan St. and Term; Since present); Chief MUTUALSMilwaukee, WI 53202 Trustee August 22, Operating Officer (an open-Year of Birth: 1962 2001 (2016–present); end investment
Executive Vice company with President, U.S. three portfolios);Bancorp Fund Trustee, Buffalo Services, LLC Funds (an open-(1994–2017). end investment
company with ten portfolios) (2003–2017).
John P. Buckel President Indefinite N/A Vice President, N/A615 E. Michigan St. and Term; Since U.S. Bancorp Fund Milwaukee, WI 53202 Principal January 24, Services, LLC Year of Birth: 1957 Executive 2013 (2004–present).
Officer
Jennifer A. Lima Vice Indefinite N/A Vice President, N/A615 E. Michigan St. President, Term; Since U.S. Bancorp Fund Milwaukee, WI 53202 Treasurer January 24, Services, LLC Year of Birth: 1974 and 2013 (2002–present).
Principal Financial andAccounting Officer
42
Bright Rock FundsAdditional Information (Continued)(Unaudited)
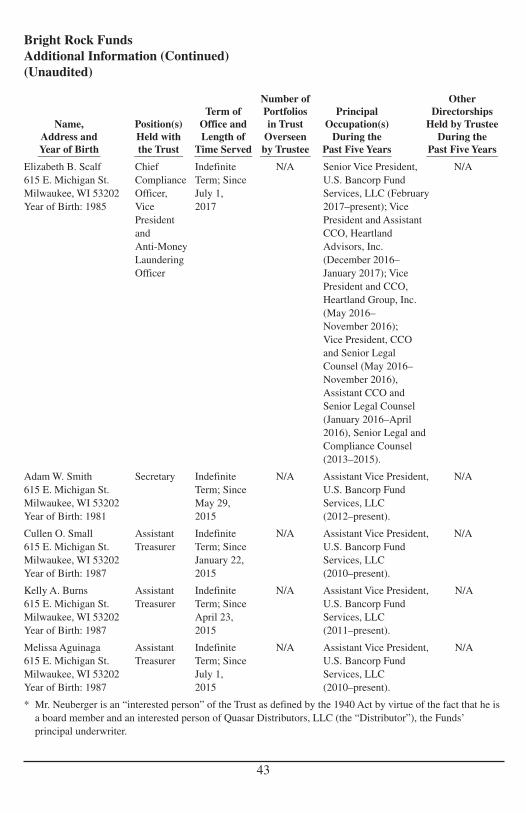
Number of OtherTerm of Portfolios Principal Directorships
Name, Position(s) Office and in Trust Occupation(s) Held by TrusteeAddress and Held with Length of Overseen During the During theYear of Birth the Trust Time Served by Trustee Past Five Years Past Five Years____________ __________ ____________ __________ _____________ ______________
Elizabeth B. Scalf Chief Indefinite N/A Senior Vice President, N/A615 E. Michigan St. Compliance Term; Since U.S. Bancorp Fund Milwaukee, WI 53202 Officer, July 1, Services, LLC (February Year of Birth: 1985 Vice 2017 2017–present); Vice
President President and Assistantand CCO, HeartlandAnti-Money Advisors, Inc. Laundering (December 2016–Officer January 2017); Vice
President and CCO, Heartland Group, Inc. (May 2016–November 2016); Vice President, CCO and Senior Legal Counsel (May 2016–November 2016), Assistant CCO and Senior Legal Counsel (January 2016–April 2016), Senior Legal andCompliance Counsel (2013–2015).
Adam W. Smith Secretary Indefinite N/A Assistant Vice President, N/A615 E. Michigan St. Term; Since U.S. Bancorp Fund Milwaukee, WI 53202 May 29, Services, LLC Year of Birth: 1981 2015 (2012–present).
Cullen O. Small Assistant Indefinite N/A Assistant Vice President, N/A615 E. Michigan St. Treasurer Term; Since U.S. Bancorp Fund Milwaukee, WI 53202 January 22, Services, LLC Year of Birth: 1987 2015 (2010–present).
Kelly A. Burns Assistant Indefinite N/A Assistant Vice President, N/A615 E. Michigan St. Treasurer Term; Since U.S. Bancorp Fund Milwaukee, WI 53202 April 23, Services, LLC Year of Birth: 1987 2015 (2011–present).
Melissa Aguinaga Assistant Indefinite N/A Assistant Vice President, N/A615 E. Michigan St. Treasurer Term; Since U.S. Bancorp Fund Milwaukee, WI 53202 July 1, Services, LLC Year of Birth: 1987 2015 (2010–present).
* Mr. Neuberger is an “interested person” of the Trust as defined by the 1940 Act by virtue of the fact that he isa board member and an interested person of Quasar Distributors, LLC (the “Distributor”), the Funds’principal underwriter.
43
Bright Rock FundsAdditional Information (Continued)(Unaudited)

(This Page Intentionally Left Blank.)


A NOTE ON FORWARD LOOKING STATEMENTS (Unaudited)
The matters discussed in this report may constitute forward-looking statements madepursuant to the safe-harbor provisions of the Securities Litigation Reform Act of 1995. Theseinclude any Adviser or portfolio manager predictions, assessments, analyses or outlooks forindividual securities, industries, market sectors and/or markets. These statements involverisks and uncertainties. In addition to the general risks described for the Funds in the currentProspectus, other factors bearing on this report include the accuracy of the Adviser’s orportfolio managers’ forecasts and predictions, and the appropriateness of the investmentprograms designed by the Adviser or portfolio managers to implement their strategiesefficiently and effectively. Any one or more of these factors, as well as other risks affectingthe securities markets and investment instruments generally, could cause the actual results ofthe Funds to differ materially as compared to benchmarks associated with the Funds.
PROXY VOTING POLICIES AND PROCEDURES (Unaudited)
The Funds have adopted proxy voting policies and procedures that delegate to theAdviser the authority to vote proxies. A description of the Funds’ proxy voting policiesand procedures is available without charge, upon request, by calling the Funds toll free at 1-866-273-7223. A description of these policies and procedures is also included in theFunds’ Statement of Additional Information, which is available on the SEC’s website athttp://www.sec.gov.
The Funds’ proxy voting record for the most recent 12-month period ended June 30 isavailable without charge, upon request, by calling 1-866-273-7223, or by accessing theSEC’s website at http://www.sec.gov.
The Funds file their complete schedule of portfolio holdings with the SEC four timeseach fiscal year at quarter-ends. The Funds file the schedule of portfolio holdings with theSEC on Form N-CSR (second and fourth quarters) and on Form N-Q (first and thirdquarters). Shareholders may view the Funds’ Forms N-CSR and N-Q on the SEC’swebsite at www.sec.gov. Forms N-CSR and N-Q may also be reviewed and copied at theSEC’s Public Reference Room in Washington, D.C. Information on the SEC’s PublicReference Room may be obtained by calling 1-800-SEC-0330 (general SEC number).
HOUSEHOLDING (Unaudited)
In an effort to decrease costs, the Funds intend to reduce the number of duplicateprospectuses and annual and semi-annual reports you receive by sending only one copyof each to those addresses shared by two or more accounts and to shareholders wereasonably believe are from the same family or household. If you would like todiscontinue householding for your accounts, please call toll-free at 1-866-273-7223 torequest individual copies of these documents. Once the Funds receive notice to stophouseholding, we will begin sending individual copies 30 days after receiving yourrequest. This policy does not apply to account statements.
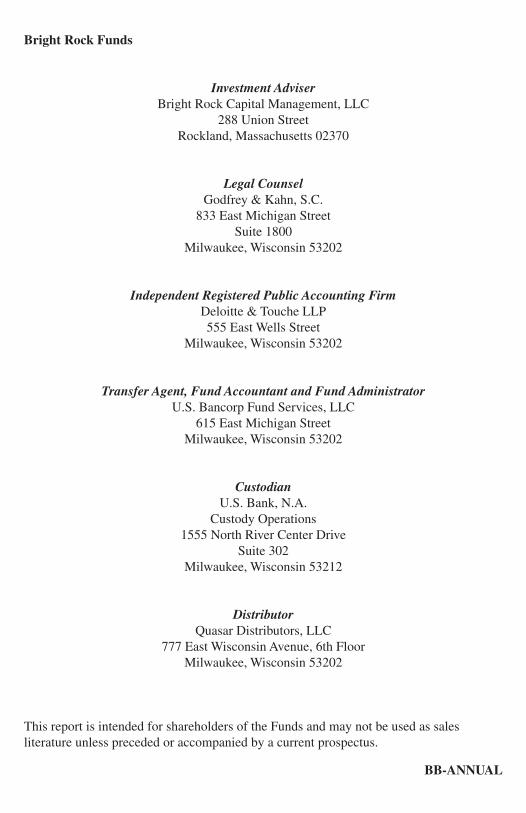
Bright Rock Funds
Investment Adviser Bright Rock Capital Management, LLC
288 Union StreetRockland, Massachusetts 02370
Legal Counsel Godfrey & Kahn, S.C.
833 East Michigan StreetSuite 1800
Milwaukee, Wisconsin 53202
Independent Registered Public Accounting Firm Deloitte & Touche LLP555 East Wells Street
Milwaukee, Wisconsin 53202
Transfer Agent, Fund Accountant and Fund Administrator U.S. Bancorp Fund Services, LLC
615 East Michigan StreetMilwaukee, Wisconsin 53202
Custodian U.S. Bank, N.A.
Custody Operations1555 North River Center Drive
Suite 302Milwaukee, Wisconsin 53212
Distributor Quasar Distributors, LLC
777 East Wisconsin Avenue, 6th FloorMilwaukee, Wisconsin 53202
This report is intended for shareholders of the Funds and may not be used as salesliterature unless preceded or accompanied by a current prospectus.
BB-ANNUAL