water quality monitoring and assessment rock river, dead
TRANSCRIPT

Water Quality Monitoring and Assessment –
Rock River, Dead Creek and Lake Sinissippi
Dodge County
2015
Report to the Board of Commissioners
Lake Sinissippi Improvement District
By Greg Farnham, MS
Commissioner (2000-2015) Lake Sinissippi Improvement District
Hustisford, Wisconsin November 12, 2015

1
Table of Contents
Summary and Conclusions 2
Background 5
Water Quality Criteria and Standards 8
Federal 8
Wisconsin 9
Sampling Protocol and Methodology 11
Sampling Methodologies 11
Analysis of Water Samples 11
Weather Data 12
Results - Water Chemistry 13
Dissolved Oxygen 16
Trophic State Index and Water Quality 18
Total Phosphorus for 2015 and Trends 20
Results - Microbiology 23
Sediment Dredging and Phosphorus Removal 25
Appendix A Water Inflow Volume and 27
Loading of Pollutants to Lake Sinissippi
Luna Leopold Quotation 28

2
Summary and Conclusions
Lake Sinissippi Improvement District established a water quality monitoring program in
2002 to assess the conditions of Lake Sinissippi, Rock River and Dead Creek. This report
provides the results of water testing in 2015 and discusses water quality trends and
conclusions.
Water samples were collected at seven sites on the Rock River, Dead Creek and Lake
Sinissippi during May to October 2015 and analyzed for contaminants. Figure 1 shows the
site locations ― four of the seven sites were used for testing the microbiological quality of
the lake and river and three sites were sampled for water chemistry analyses.
Test results indicate these surface water resources are polluted, with elevated levels of
nutrients ― nitrogen and phosphorus compounds ― and suspended solids. The waters
have a high biochemical oxygen demand. And Secchi depth is minimal, an indicator of low
water transparency. Such values are indicative of eutrophic conditions which materially
degrade surface waters, impair fish habitat, reduce biodiversity, eliminate desirable fish
stocks and submerged macrophytes, and negatively impact recreational use and aesthetic
quality of the waters. The cumulative effect of eutrophic conditions may adversely affect
the social and economic well-being of the community.
Based on levels of E. coli at four sampling sites on the lake and river, the microbiological
quality of the open waters is generally good with areas of concern.
Evaluation of the trophic state index for Lake Sinissippi shows the waters are of a
hypereutrophic condition with heavy algal blooms of planktonic green and blue-green algae,
excessive levels of nutrients, reduced water transparency and rough fish dominance.
"Test results indicate these surface water
resources are polluted."

3
Figure 1. Sampling sites on Rock River, Dead Creek and Lake Sinissippi.

4
The water bodies do not meet state and federal minimum water quality standards and
as a result they appear on the federal EPA 303(d) list of impaired waters. In addition these
waters do not meet narrative criteria articulated in § NR 102.04(1), Wis. Admin. Code that
apply to all surface waters of the state.
o Excessive sediment is considered an objectionable deposit,
o Excessive phosphorus results in algal blooms that may be considered floating scum,
producing odor, color and unsightliness that interfere with public rights,
o Algal blooms may include explosive growth of blue-green algae that produce toxins
of public health concern and which limit recreational use, and
o Degraded habitat and low dissolved oxygen caused by high concentrations of
phosphorus and suspended solids imperil fish and other aquatic life. 1
These surface waters are under federal and state directives to halt further deterioration in
quality and reverse loading of contaminants to the waters. The concentration of total
phosphorus in these waters is a leading indicator of water quality ― low phosphorus,
reasonably good quality water; high phosphorus, poor quality and eutrophication. Trend
data for total phosphorus in Lake Sinissippi and the Rock River during the period 2002-
2015 demonstrate that efforts by federal, state and county agencies to reduce pollution have
been insufficient to achieve water quality objectives.
The challenge to the lake district going forward will be to more effectively engage with
agency partners as articulated in the authorizing statutes, to wit, Wis. Stats. §§ 33.21 and
33.29:
o Plan and implement lake protection and rehabilitation programs designed to
reduce nonpoint pollution to the lake, river and lake tributaries, remove
sediment from the lake basin and decrease internal phosphorus loading,
o Maintain liaison with elected officials and federal, state and local agency officials
to advocate for funding and practices to protect and rehabilitate the lake and
river, and
o Secure the cooperation of government officials for the purpose of enacting
ordinances and regulations necessary to achieve water quality objectives.
1 Wisconsin Department of Natural Resources, Rock River Basin TMDL Final Report, 2011, p. 18

5
Background
Lake Sinissippi is an impoundment of the Rock River and thus the condition of the river
determines to a large degree the quality of the lake water. The Rock River contributes 65.0
percent of the water inflow volume to the lake, 89.7 percent of the phosphorus loading and
90.0 percent of the suspended solids. Dead Creek is a tributary of the lake that provides 4.0
percent of the water volume, 4.4 percent of the phosphorus and 3.9 percent of the sediment
loading.2
Eutrophic waters are characterized by high fertility (excessive amounts of nutrients), low
transparency and frequent algal blooms, normally of planktonic green algae but frequently
associated with nuisance blooms of blue-green algae. Water clarity is normally less than
half a meter in such waters, reducing sunlight penetration through the water column and
inhibiting growth of submerged aquatic vegetation.
Phosphorus and nitrogen are essential nutrients for plant growth. At high concentrations
in surface waters, however, these nutrients can result in excessive growth of algae and
eutrophic conditions. In surface waters of Dodge County phosphorus is a limiting nutrient.
The extent of algae growth and the severity of the eutrophication process, therefore,
directly depends on the concentration of phosphorus in the water ― low phosphorus, low
algae growth; high phosphorus, high algae growth and eutrophication.
Biochemical oxygen demand (5 day) (BOD5) of eutrophic waters is usually high as a result
of elevated concentrations of organic matter. BOD5 is a measure of the quantity of oxygen
used by aerobic bacteria in the decomposition (oxidation) of organic matter. Abnormally
high levels of aerobic bacterial activity in surface waters can lead to reduced concentration
of dissolved oxygen and put at risk the survival of fish and other aquatic life. Limitations
on BOD in point-source effluent discharges to surface waters must be restrictive enough to
insure the receiving water will still meet minimum standards for dissolved oxygen [5 mg/L
for all surface waters of the state except lower for intermediate and marginal surface
waters (§§ NR 102.04 and NR 104.02(3), Wis. Admin. Code)].
2 See Appendix A

6
High values of total suspended solids reflect high concentrations of organic matter and
inorganic solids ― primarily sediment ― in the water column, causing turbidity and
sedimentation. Accumulation and deposition of sediment on existing sediment strata on
the river and lake bottom covers aquatic habitat, destroys fish spawning grounds, fills deep
water refuges sought by fish and impedes navigation. Suspended particulate matter can
also function as a binding substrate for other pollutants such as metals, chemicals and
bacteria. High suspended solids can be used as an indicator of other potential pollutants.
Resuspension of benthic sediments in shallow lacustrine systems like Lake Sinissippi add
to turbid conditions, reducing transparency and limiting the depth of light penetration.
Wind-induced resuspension and turbulence induced by recreational boat traffic also
contribute to internal nutrient loading by creating a flux of phosphorus-bound particulate
matter from the sediment layer into the water column. 3
Turbid conditions in the lake are also exacerbated by the dominance of common carp in the
fish population. Carp is an invasive species and primarily a benthic feeder, stirring up lake
bottom sediments and uprooting vegetation. Forage activity of the large number of carp in
the lake is a factor in resuspension of sediment and reduced water clarity.
The quality of the Rock River, Dead Creek and Lake Sinissippi is negatively impacted by
nonpoint source pollution from the watershed, primarily as a consequence of excessive
runoff of sediment and nutrients from agricultural fields. Levels of pollutants in these
surface waters exceed federal and state water quality standards and reference conditions.
As a result the three water bodies appear on the federal EPA 303(d) list of impaired waters
for pollutants of nutrients (phosphorus), sediment and other suspended solids with
impairments of eutrophication and habitat degradation, and low dissolved oxygen for Dead
Creek.
3 Anthony, J., J. M. Farre and J. Downing. 2002. Physical limnology of Clear Lake. Clear Lake Report, Iowa
State University.

7
These waters are under federal and state directives for total maximum daily loads
("TMDL") of phosphorus and suspended solids which require action by the Wisconsin
Department of Natural Resources to reduce loading of these contaminants and halt further
deterioration in water quality. In addition Dodge County is responsible for action to
reverse the depletion of county soil resources and halt pollution of county waters. (Wis.
Stats. Chapter 92, Soil and Water Conservation and Animal Waste Management) Further,
Lake Sinissippi is under a state-approved management plan to restore water quality,
implementation of which is the responsibility of Lake Sinissippi Improvement District.
Allowing polluted waters and other wastes from the watershed to flow into the Rock River,
Dead Creek and Lake Sinissippi is contrary to federal and state directives.
"The quality of the Rock River, Dead Creek and Lake Sinissippi is
negatively impacted by nonpoint source pollution from the watershed,
primarily as a consequence of excessive runoff of sediment and nutrients
from agricultural fields."

8
Water Quality Criteria and Standards
Water quality criteria, standards and reference conditions for surface waters have been
established by state and federal authorities. Numeric and narrative standards exist for
nutrients, toxic compounds, dissolved oxygen, temperature, pH, fecal bacteria and other
substances and conditions which are harmful to human, animal, plant and aquatic life.
Federal
The US Environmental Protection Agency has developed ambient water quality criteria
recommendations for rivers and streams in nutrient ecoregion VII, which are shown in
Table 1. These criteria are based on 25th percentile data of actual reference conditions
existing within sublevel ecoregion 53, Southeastern Wisconsin Till Plains, and include
values for parameters of nitrogen compounds, phosphorus and turbidity.
Table 1. Federal reference conditions for contaminants in surface waters.
Parameter Reported Values
Min Max 25th Percentile Reference
Conditions
Total Kjeldahl Nitrogen mg/L 0.05 4.3 0.65
Nitrite + Nitrate Nitrogen mg/L 0.37 5.6 0.94
Total Nitrogen (calculated) mg/L 0.42 9.9 1.59
Phosphorus (Total as P) µg/L 5 1465 80
Turbidity (FTU) 0.49 28.78 2.74
Source: Federal level III ecoregion 53, Ambient Water Quality Criteria Recommendations for Rivers and Streams in Nutrient Ecoregion VII. US Environmental Protection Agency, Washington, DC, EPA 822-B-00-018, December 2000.
"The water bodies do not meet state and federal
minimum water quality standards."

9
Wisconsin
Rule making for amending Chapters NR 102, 216 and 217, Wisconsin Administrative Code,
was finalized in September 2010. The rules established numeric standards for phosphorus
in surface waters of the state. Under these standards the limit of total phosphorus in
waters upstream of the Hustisford Dam is 75 µg/L [§ NR 102.06(3)(b), Wis. Admin. Code].
Standards and reference values for selected contaminants are given in Table 2.
Wisconsin does not presently have numeric standards for nitrogen compounds, total
suspended solids or BOD5 in surface waters. The need for standards to cover nitrogen
compounds and total suspended solids is part of the WNDR triennial standards review
2015-2017. The review is also considering criteria and standards for cyanobacterial (Blue-
green algae) toxin and cell density. The TMDL plan for the Rock River Basin includes a
concentration target value for total suspended solids in surface waters.
A number of states have adopted numeric chlorophyll α criteria as water quality standards
with limitation values ranging from 10 µg/L to 40 µg/L. Wisconsin does not have a numeric
or narrative standard for chlorophyll α.
Wisconsin regulations include narrative water quality criteria that apply to all surface
waters (§ NR 102.04(1), Wis. Admin. Code).
Practices attributable to municipal, industrial, commercial, domestic, agricultural,
land development or other activities shall be controlled so that all surface waters
including the mixing zone meet the following conditions at all times and under all
flow and water level conditions:
(a) Substances that will cause objectionable deposits on the shore or in the bed of
a body of water, shall not be present in such amounts as to interfere with public
rights in waters of the state.
(b) Floating or submerged debris, oil, scum or other material shall not be present
in such amounts as to interfere with public rights in waters of the state.
(c) Materials producing color, odor, taste or unsightliness shall not be present in

10
such amounts as to interfere with public rights in waters of the state.
(d) Substances in concentrations or combinations which are toxic or harmful to
humans shall not be present in amounts found to be of public health significance,
nor shall substances be present in amounts which are acutely harmful to animal,
plant or aquatic life.
Table 2. Wisconsin water quality standards, criteria and reference values for contaminants in surface waters.
Parameter Wisconsin Water Quality
Standard/Reference
Phosphorus (Total as P) µg/L ≤ 75
Total Suspended Solids (1) mg/L < 26 (2)
Biochemical Oxygen Demand (3) mg/L ≤ 20 (3)
Fecal Coliform (1) CFU/100 ml Escherichia coli MPN/100 ml
≤ 200 ≤ 235
Ammonia (1) mg/L Acute Toxicity Criteria
Wisconsin does not have a numeric standard for nitrogen compounds in surface waters. (1)Under evaluation as part of WDNR triennial standards review (2)The average TSS concentration target for surface waters of the Rock River Basin, Rock River Basin TMDL Final Report, 2011, p. 19 (3) Presently there is no state numeric standard for BOD5 in surface waters. Reference value is WPDES permit condition for maximum monthly average concentration in effluent from Juneau wastewater treatment facility, which is discharged to Dead Creek. The Horicon wastewater treatment facility has a BOD5 limit in effluent of 21 mg/L and discharges to the Rock River.
Turbidity (federal reference condition) and total suspended solids (state TMDL
concentration value) both provide a measure of the amount of solids suspended in the
water; however, determination of turbidity may miss solids with a high rate of settleability.
TSS concentrations can be used to calculate total quantities of material within or entering a
waterway, while turbidity values cannot be used for calculating material loading.
11
Assessment of the quality of surface waters and the potential impact of pollutants to the
Rock River, Dead Creek and Lake Sinissippi can be made by comparing the test results of
samples taken from these waters with federal and state water quality criteria, standards
and reference conditions.
Sampling Protocol and Methodology
Water samples were collected from sites on the Rock River, Dead Creek and Lake Sinissippi
during May to October 2015 and analyzed for contaminants. Field measurements of Secchi
depth were taken at the sampling sites in full light during mid-day hours.
Sampling Methodologies
Methodologies for water sampling are based on Volunteer Stream Monitoring: A Methods
Manual, US Environmental Protection Agency, Office of Water, EPA 841-B-97-003,
November 1997.
Analyses of Water Samples
Water samples were tested for the following parameters:
Phosphorus (Total as P) Total Kjeldahl Nitrogen
Total Suspended Solids Ammonia Nitrogen
Biochemical Oxygen Demand (5 day) Nitrite + Nitrate Nitrogen
Escherichia coli (E. coli) Organic Nitrogen (by calculation)
Chlorophyll α * Total Nitrogen (by calculation)
The state-certified laboratories for analyses of water samples are Northern Lake Service,
Inc., Crandon and Waukesha, Wisconsin, and Wisconsin State Laboratory of Hygiene,
Madison, Wisconsin. * Chlorophyll α determinations were made by the lake district in 2007
and the results are included in this report in order to calculate the trophic state index for

12
the lake. Archival water quality data are available on the lake district website at
http://www.lakesinissippi.org/2014%20LSID%20Water%20Quality%20Report.pdf
Weather Data
The weather data for mean temperature and precipitation for the sampling day and the day
prior to sampling are given in Table 3.
Table 3. Climatological data of mean temperature and precipitation recorded in Juneau, Wisconsin during the sampling period May-October 2015. Date (2015) 5/26 5/27 6/3 6/4 6/7 6/8 6/21 6/22 7/5 7/6 Mean Temperature °F 68 65 61 67 65 71 63 71 69 71
Precipitation inch 0.40 0.10 0.00 0.00 0.05 0.00 0.64 0.04 0.00 0.12 Samples Taken X X X X X
Date (2015) 7/12 7/13 7/19 7/20 8/2 8/3 8/11 8/12 8/17 8/18 Mean Temperature °F 69 73 74 70 72 73 70 67 76 75
Precipitation inch 0.00 3.72 0.00 0.00 0.00 0.00 0.00 0.00 0.14 0.02 Samples Taken X X X X X
Date (2015) 9/7 9/8 9/9 10/5 10/6 Mean Temperature °F 76 77 66 51 54 Precipitation inch 0.29 0.27 0.23 0.00 0.00
Samples Taken X X X Source: National Weather Service NOAA Online Weather Data
Analysis of samples taken following a period of zero to little precipitation provides data of
general baseline conditions. Test data of samples taken during or immediately following
periods of heavy precipitation offer a meaningful representation of the concentrations of
pollutants in near-shore waters.

13
Results - Water Chemistry
Analytical results are reported for samples collected on various dates May to October 2015
at three sites:
o Rock River at CTH "S" Bridge
o Dead Creek at Arrowhead Trail Culvert
o Lake Sinissippi at the public dock near the Hustisford Dam
Test results that exceed established state standards and/or federal reference conditions are
shown in bold.
Table 4. Test results of water samples taken from the Rock River at CTH "S" Bridge.
Parameter/ Sampling Date
6/4 7/13 8/12 9/9 10/6 State
Standard Federal
Reference
BOD-5 Day mg/L
11 16 23 16 ≤ 20
Total Suspended Solids mg/L 90 73 79 59 < 26 2.74 1
Phosphorus, Total as P µg/L 180 420 460 320 ≤ 75 80
Ammonia Nitrogen mg/L
0.13 0.14 0.17 0.44 0.11
Total Kjeldahl Nitrogen mg/L 4.0 5.0 5.7 4.5 4.0 0.65
Organic Nitrogen mg/L (by calculation)
3.87 4.86 5.53 4.06 3.89
Nitrite + Nitrate mg/L 0.03 0.94
Total Nitrogen mg/L (by calculation)
4.03 1.59
Secchi Depth m < 0.5 < 0.5 < 0.5 < 0.5 < 0.5
Chlorophyll α 2
µg/L 285 73.8 40 3
1 Federal reference condition for total suspended solids is given as turbidity (Formazin Turbidity Units), not directly convertible to TSS units. 2 Chlorophyll α determination was made in August and September 2007 with analysis by Wisconsin State Laboratory of Hygiene. 3 A number of states - not Wisconsin - have adopted numeric chlorophyll α standards. The value of 40 µg/L is a maximum of those standards and is shown as a reference.

14
Table 5. Test results of water samples taken from Dead Creek at Arrowhead Trail Culvert.
Parameter/ Sampling Date
6/4 7/13 8/12 9/9 10/6 State
Standard Federal
Reference
BOD-5 Day mg/L 3.3 6.6 13 5.1 ≤ 20
Total Suspended Solids mg/L 42 35 41 15 < 26 2.74 1
Phosphorus, Total as P µg/L 240 400 270 480 ≤ 75 80
Ammonia Nitrogen mg/L 0.31 0.25 0.18 0.93 0.46
Total Kjeldahl Nitrogen mg/L 4.5 2.2 3.8 2.7 2.7 0.65
Organic Nitrogen mg/L (by calculation)
4.19 1.95 3.62 1.77 2.24
Nitrite + Nitrate mg/L 5.1 0.94
Total Nitrogen mg/L (by calculation)
7.8 1.59
Secchi Depth m < 0.5 < 0.5 < 0.5 < 0.5 < 0.5
1 Federal reference condition for total suspended solids is given as turbidity (Formazin Turbidity Units), not directly convertible to TSS units.

15
Table 6. Test results of water samples taken from Lake Sinissippi at the public dock near the Hustisford Dam.
Parameter/ Sampling Date
6/4 7/13 8/12 9/9 10/6 State
Standard Federal
Reference
BOD-5 Day mg/L 10 12 16 8.9 ≤ 20
Total Suspended Solids mg/L 63 82 76 49 < 26 2.74 1
Phosphorus, Total as P µg/L 150 390 350 230 ≤ 75 80
Ammonia Nitrogen mg/L 0.13 0.13 0.16 0.61 0.80
Total Kjeldahl Nitrogen mg/L 5.3 5.3 4.9 4.4 5.7 0.65
Organic Nitrogen mg/L (by calculation)
5.17 5.17 4.74 3.79 4.9
Nitrite + Nitrate mg/L 0.1 0.94
Total Nitrogen mg/L (by calculation)
5.8 1.59
Secchi Depth m < 0.5 < 0.5 < 0.5 < 0.5 < 0.5
Chlorophyll α 2
µg/L 259 102 40 3
1 Federal reference condition for total suspended solids is given as turbidity (Formazin Turbidity Units), not directly convertible to TSS units. 2 Chlorophyll α determination was made in August and September 2007 with analysis by Wisconsin State Laboratory of Hygiene. 3 A number of states - not Wisconsin - have adopted numeric chlorophyll α standards. The value of 40 µg/L is a maximum of those standards and is shown as a reference.

16
Dissolved Oxygen
Surface waters produce and consume oxygen, gaining oxygen from the atmosphere and as
the result of photosynthesis of aquatic vegetation and losing oxygen from respiration by
aquatic animals and plants, decomposition of organic matter and various chemical
reactions. All aquatic life depends on a sufficient level of dissolved oxygen (DO).
The concentration of DO in a water body varies inversely with temperature ― cold water
can hold more DO than warm water. DO levels fluctuate seasonal and diurnally based on
the time and duration of photosynthesis by planktonic algae and submerged aquatics. And
DO levels vary throughout the water column depending on algal biomass, turbidity and
water flow.
A DO-water depth profile of the Rock River at River Bend Park was determined in August
2007. Figure 4 shows the DO curve by plotting water depth against DO concentration in
mg/L. The DO profile shows a typical clinograde curve with higher DO concentrations in
the upper water layer and low concentrations in the lower water layer. Near the river
bottom at 1.5 meters the DO value was 3.1 mg/L, below the state minimum standard of 5
mg/L, a level necessary to support fish and other aquatic life. These data are included in
this report to illustrate the effects of eutrophic conditions on oxygen depletion and water
quality.
Oxygen depletion plays a key role in retention and release of phosphorus from benthic
sediments, a process that depends on the redox potential at the sediment-water interface.
Under oxic conditions, phosphorus (as orthophosphate) is generally bound to sediment
particles and unavailable in a soluble ionic form. However, in summer months oxygen in
the lower water layer becomes depleted as a result of decomposition of high BOD organic
matter, creating conditions at the sediment-water interface that tend towards anoxia. In
the absence of oxygen a reducing environment is created and bound phosphorus is released
from the sediment layer into the water column. The soluble phosphorus then adds to the
nutrient load to stimulate further growth of algae. This phenomenon may be an important
factor in the stimulation of algal blooms in late summer when nutrient runoff from
agricultural fields is reduced. 4

17
Table 7. Dissolved oxygen-water depth profile showing a clinograde curve with high
DO in the epilimnion and low DO at the river bottom. Determination made by DO
probe and meter August 12, 2007 at River Bend Park on the Rock River.
Source: http://www.lakesinissippi.org/2014%20LSID%20Water%20Quality%20Report.pdf
4 White, D. J., J. C. Makarewicz and T. W. Lewis. 2002. The significance of phosphorus released from the
sediment under anoxic conditions in Sodus Bay, NY. Technical Reports, http://works.bepress.com/joseph_makarewicz/34
18
Trophic State Index and Water Quality
Trophic state is an expression of the primary production of a lake ecosystem based on a
measure of the biomass of algae in the lake. Nutrient enrichment as a result of human
activities generally leads to an increase in algal biomass. Metrics of nutrient
concentrations and level of chlorophyll a vary directly with algal biomass, while water
transparency as measured by Secchi depth varies inversely with biomass.
Carlson's Trophic State Index ("TSI") is a widely used index for quantifying the level of
primary production in a water body based on concentrations of epilimnetic chlorophyll a,
total phosphorus, total nitrogen and Secchi depth. 5 TSI values range from zero (ultra-
oligotrophic condition of low nutrients, low chlorophyll a and high transparency) to 100
(hypereutrophic condition of high nutrients, high chlorophyll a and low transparency).
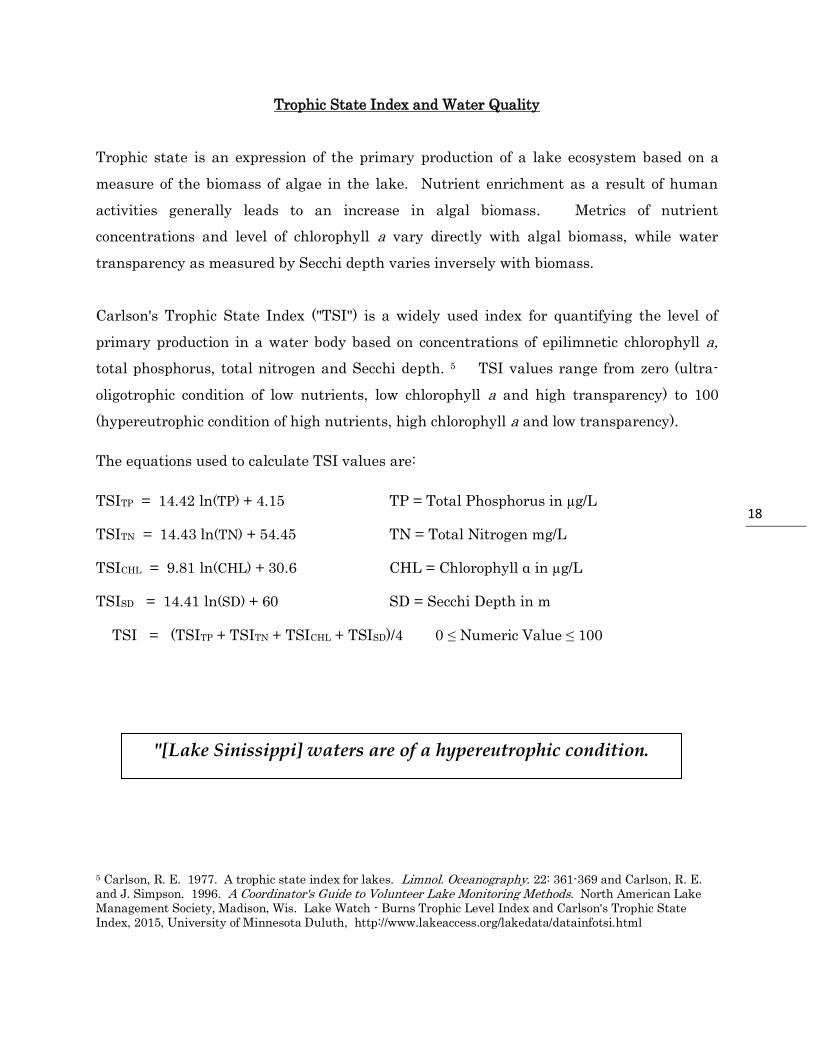
The equations used to calculate TSI values are:
TSITP = 14.42 ln(TP) + 4.15 TP = Total Phosphorus in µg/L
TSITN = 14.43 ln(TN) + 54.45 TN = Total Nitrogen mg/L
TSICHL = 9.81 ln(CHL) + 30.6 CHL = Chlorophyll α in µg/L
TSISD = 14.41 ln(SD) + 60 SD = Secchi Depth in m
TSI = (TSITP + TSITN + TSICHL + TSISD)/4 0 ≤ Numeric Value ≤ 100
5 Carlson, R. E. 1977. A trophic state index for lakes. Limnol. Oceanography. 22: 361-369 and Carlson, R. E.
and J. Simpson. 1996. A Coordinator's Guide to Volunteer Lake Monitoring Methods. North American Lake
Management Society, Madison, Wis. Lake Watch - Burns Trophic Level Index and Carlson's Trophic State
Index, 2015, University of Minnesota Duluth, http://www.lakeaccess.org/lakedata/datainfotsi.html
"[Lake Sinissippi] waters are of a hypereutrophic condition.

19
TSI values for Lake Sinissippi utilizing 2015 data for total phosphorus, total nitrogen and
Secchi depth, and 2007 data for chlorophyll α are:
TSITP 86.4
TSITN 79.8
TSICHL 81.5
TSISD 70
Average TSI 79.4
Water quality characteristics typically seen in water bodies with a TSI value greater than
70 reflect a hypereutrophic condition of high nutrients, low transparency, high chlorophyll
α, heavy algal blooms with occasional blue-green algae and rough fish dominance. These
characteristics describe summer conditions of Lake Sinissippi.
Table 7. Trophic State Index and water quality of Lake Sinissippi.
Trophic State
Index Value Water Quality Characteristics
< 30 Oligotrophic, clear water, high dissolved oxygen throughout the year
in the entire hypolimnion
30 - 40 Oligotrophic, clear water, possible periods of limited hypolimnetic
dissolved oxygen
40 - 50 Moderately clear water, increasing chance of hypolimnetic anoxia in
summer, fully supportive of all swimmable/aesthetic uses
50 - 60 Mildly eutrophic, decreased transparency, anoxic hypolimnion in
summer, warm water fisheries,
60 - 70 Green algae blooms with blue-green algae possible,
swimmable/aesthetic uses threatened
70 - 80 Heavy algal blooms possible throughout summer, hypereutrophic
> 80 Green and blue-green algal scums, rough fish dominance,
summer fish kills
Source: Adapted from Carlson 1977 in Lake Watch - Burns Trophic Level Index and Carlson's Trophic State Index, 2015, University of Minnesota Duluth, http://www.lakeaccess.org/lakedata/datainfotsi.html

20
Total Phosphorus for 2015 and Trends
In surface waters where phosphorus is a limiting nutrient the concentration of total
phosphorus is the leading indicator of water quality. As seen in the determination of
trophic state index for Lake Sinissippi, the higher the concentration of total phosphorus in
a waterbody the poorer the quality and condition of the waters. Lake Sinissippi is of a
hypereutrophic state due the excessive amount of phosphorus in the water and the
resulting increase in algal biomass.
Figure 2 shows the total phosphorus results for the three water bodies during 2015. Not
one of the twelve samples had a phosphorus value within the state standard of 75 µg/L ― all
values exceeded the state standard by a large measure.
Figure 3 shows data for total phosphorus in Lake Sinissippi during the period 2002-2015.
Not one of the samples collected over the 14-year period met the state phosphorus standard
for surface waters. These trend data demonstrate that efforts by federal, state and county
agencies to reduce nonpoint pollution in the watershed have been insufficient to achieve
water quality objectives.
The underlying impediment to reducing nonpoint pollution runoff is the lack of political
consensus at county, state and federal levels to require landowners to take action to control
runoff. The federal Clean Water Act of 1972 provides for mandatory action to control point
source pollution to surface waters. However, the Act relies on a voluntary approach to
control runoff from nonpoint sources such as farm fields and agricultural operations, and
does not give the federal EPA direct authority to compel landowners to take prescribed
actions. More than 40 years after passage of the Act many of the nation's waters are still
impaired ― all surface waters in Dodge County are impaired. Indeed, the U.S.
Government Accountability Office said in 2014 that "without changes to the Act's approach
to nonpoint source pollution, the Act's goals are likely to remain unfulfilled." 6
6 U.S. Government Accountability Office. 2014. Clean Water Act: Changes needed if key EPA program is to help
fulfill the nation's water quality goals. GAO-14-80. http://www.gao.gov/products/GAO-14-80

21
Figure 2. Total phosphorus in micrograms per liter (µg/L) in surface water at three sampling sites: Rock River at Highway S Bridge, Dead Creek at Arrowhead Trail culvert and Lake Sinissippi at the Hustisford Dam. Samples collected June - September 2015 and analyzed by Northern Lake Service, Inc., Crandon, Wis.
The state water quality standard for phosphorus in streams and rivers upstream of the village of Hustisford is for total phosphorus concentration to not exceed 75 µg/L [§ NR 102.06(3)(b), Wis. Admin. Code].

22
0
100
200
300
400
500
600
2002 2003 2004 2005 2006 2007 2008 2009 2010 2011 2012 2013 2014 2015
Maximum
Minimum
Average
Figure 3. Annual range and average of total phosphorus in Lake Sinissippi for years 2002-
2015 (samples were not collected in 2010, 2012 and 2014). Data are given in micrograms
per liter (µg/L). Samples analyzed by Test America, Watertown, Wis., and Northern Lake
Service, Inc., Crandon, Wis.
The green rectangle at the bottom of the graph represents the Wisconsin water quality
standard for phosphorus not to exceed 75 µg/L in lakes, rivers and streams above the village
of Hustisford.
None of the samples collected over the 14-year period met the state phosphorus standard
for surface waters [§ NR 102.06(3)(b), Wis. Admin. Code].

23
Results - Microbiology
Lake Sinissippi is used for recreational water contact activities such as water skiing,
swimming and paddling. Monitoring lake water for possible microbial contamination is
important to promote water safety and health for residents and visitors. The lake district
works in conjunction with the Dodge County Public Health Unit and Wisconsin DNR in this
regard.
The bacterium Escherichia coli is used as an indicator organism of potential fecal
contamination. A high E. coli value may indicate the presence of pathogens in the water
that can cause gastrointestinal illness, respiratory problems, skin rashes and other
infections.
Results of water quality monitoring for the public health parameter in 2015 are shown in
Table 7. In general the bacteriological quality of the open waters of the lake is at a safe
level. However, there were exceedances of the advisory index on June 22 and September 8
when E. coli levels were above the level of 235 MPN per 100-ml sample. During rain
events runoff of fecal deposits of Canada geese and other organic waste left on shore can
cause high levels of E. coli in nearshore waters until wave action disperses the
contaminants.
Public health and water safety officials urge caution and advise users to wait a day or two
after a heavy rain event before going in the water.
Large animal feeding operations in the watershed store, process and dispose of livestock
manure and other wastes on surrounding fields. Improper storage and land application of
manure have resulted in polluted runoff to the Rock River and Lake Sinissippi and its
tributaries. The lake district would be advised to monitor large farm field ditches in
proximity of manure spreading fields that drain to the river and lake tributaries.
See http://www.lakesinissippi.org/2014%20LSID%20Water%20Quality%20Report.pdf
"The microbiological quality of the open waters is generally good with areas of concern."

24
Table 7. Water quality monitoring (public health bacteriological parameter) of recreational waters at public access sites of Lake Sinissippi and Rock River. 2015 Data reported for E. coli MPN (Most Probable Number) per 100-ml sample. Sampling Sites
Date River Bend Park Hustisford Ski
Club Butternut Island
Neider Park
Landing
May 27 69 21 24 122
June 8 91 6 38 23
June 22 * 87 14 461 2,420
July 6 47 5 8 58
July 20 30 13 16 78
August 3 70 3 15 131
August 18 133 15 14 40
September 8 * 687 19 38 2,420
Reported data: E. coli MPN (Most Probably Number) per 100 ml sample to assess risk of acquiring gastrointestinal illness as a result of using recreational waters. EPA and WDNR recommend posting beach advisories whenever sample results for E. coli exceed 235 MPN for a single sample or 126 MPN as a geometric mean of at least 5 samples collected over a 30-day period. Beach closures whenever the level of E. coli exceeds 1,000 MPN. * Rain event prior to sampling
"The lake district would be advised to monitor large farm
field ditches in proximity of manure spreading fields that
drain to the river and lake tributaries."
25
Sediment Dredging and Phosphorus Removal
This report has focused on the detrimental effects on the quality of surface waters from
excessive inflow of nutrients and sediment from the watershed. There is a second critical
causative factor in the mechanism of phosphorus loading to the lake, namely, the retention
and release of phosphorus in lake sediments. Studies have shown that the sediment of
shallow lakes is a complex dynamic of chemical and biological processes that can have
material effects on the phosphorus budget and water quality. 7
As discussed in previous sections the interaction of resuspension of benthic sediments and
the influence of oxygen depletion at the sediment-water interface on phosphorus release
may be a significant factor in the internal loading of phosphorus in Lake Sinissippi.
Phosphorus release from sediment may be so persistent that any noticeable effect from a
reduction in external loading of nutrients is masked for a considerable period of time. And
it is also true that reduction of nutrient concentrations in the lake cannot be accomplished
without a substantial decrease in external loading of phosphorus and other nutrients to the
Rock River and lake tributaries.
Assessing the consequences of internal loading of phosphorus from lake bottom sediment
must also consider the sorption of phosphorus to sediment particles and sediment transport
in surface waters. Fine sediments (silt and clay) have a high binding capacity for
phosphorus and are transported the furthest distances in a waterway. Once the solids
settle out in the water column they add to the phosphorus-rich sediment layer.
Internal loading can be reduced by removing the phosphorus-rich sediment layer by
dredging ― a reasonable task on a small pond but a major and often times prohibitively
expensive challenge on a lake the size of Lake Sinissippi. Smaller steps can be taken,
however, which in the aggregate have a positive effect on lake rehabilitation. This was the
rationale behind the dredging program for the lake district.
7 Sondergaard, M., J. P. Jensen and E. Jeppesen. 2003. Role of sediment and internal loading of phosphorus in
shallow lakes. Hydrobiologia 506-509: 135-145. and other studies

26
Dredging of Lake Sinissippi by both hydraulic and mechanical means was done to increase
water depth, enhance navigation, remove nutrient-rich sediments, improve water clarity
and create fish and aquatic plant habitat. The sediment removed from the lake bottom was
returned to the land and used beneficially for wetland restoration. The lake district
conducted four dredging projects during the period 2006 - 2010, which in total removed
10,000 cubic yards of sediment from the lake. And along with the dredged sediment about
24,000 pounds of phosphorus were removed from the lake system. 8
The lake district may also wish to revisit the adaptive management program of Wisconsin
DNR as a phosphorus compliance option. Earlier discussions with the agency indicated
that phosphorus removal by means of dredging may qualify as a credit for phosphorus
reduction that can be used by an upstream point source, such as the Horicon wastewater
treatment facility. The treatment facility would, in turn, pay the lake district an agreed-
upon price based on the value of the phosphorus credit and the amount of phosphorus
removed from the lake.
8 The average value of data for total phosphorus in sediment on a dry weight basis quoted in the literature is
0.12 %.

27
Appendix A Water Inflow Volume and Loading of Pollutants to Lake Sinissippi
Water Inflow to Lake Sinissippi
Source Volume (acre-feet) Percent
Rock River at Horicon 179,238 65.0
Dead Creek 11,025 4.0
Ungaged Tributaries 9,050 3.3
Direct Precipitation 7,397 2.7
Wastewater Treatment Plants 590 0.2
Groundwater Inflow 68,270 24.8
Total Inflow 275,570 100.0
Phosphorus Inputs to Lake Sinissippi
Source Phosphorus Load
(pounds per year)
(pounds per year)
Percent
Rock River at Horicon 123,027 89.7
Dead Creek 6,019 4.4
Ungaged Tributaries 4,900 3.6
Atmospheric Deposition 488 0.3
Point Source Discharges 2,745 2.0
Total Influent Phosphorus 137,179 100.0
Sediment Inputs to Lake Sinissippi
Source Sediment Load
(tons per year)
(tons per year)
Percent
Rock River at Horicon 8,606 90.0
Dead Creek 375 3.9
Ungaged Tributaries 302 3.2
Atmospheric Deposition 278 2.9
Point Source Discharges 6 -
Total Influent Sediment 9,567 100.0
Source: USGS Data 2002 Study Year in Water, Sediment and Nutrient Budget for Lake Sinissippi, Dodge County, Wisconsin. Hey and Associates, Inc., 2003.

28
― Neosho Pond, Dodge County, summer 2015 ―
"Water is the most critical resource issue of our
lifetime and our children's lifetime.
The health of our waters is the principal measure
of how we live on the land."
― Luna Leopold