brief communication: twelve-year cyclic surging episodes at
TRANSCRIPT
The Cryosphere, 10, 1427–1432, 2016www.the-cryosphere.net/10/1427/2016/doi:10.5194/tc-10-1427-2016© Author(s) 2016. CC Attribution 3.0 License.
Brief Communication: Twelve-year cyclic surging episodes atDonjek Glacier in Yukon, CanadaTakahiro Abe1, Masato Furuya1, and Daiki Sakakibara2,3
1Graduate School of Science, Hokkaido University, Sapporo, Japan2Graduate School of Environmental Science, Hokkaido University, Sapporo, Japan3Institute of Low Temperature Science, Hokkaido University, Sapporo, Japan
Correspondence to: Takahiro Abe ([email protected])
Received: 9 October 2015 – Published in The Cryosphere Discuss.: 2 November 2015Revised: 7 June 2016 – Accepted: 13 June 2016 – Published: 11 July 2016
Abstract. Surge-type glaciers repeat their short active phaseand their much longer quiescent phase usually every severaldecades or longer, but detailed observations of the evolutioncycles have been limited to only a few glaciers. Here we re-port three surging episodes in 1989, 2001, and 2013 at Don-jek Glacier in the Yukon, Canada, indicating remarkably reg-ular and short repeat cycles of 12 years. The surging area islimited within the ∼ 20 km section from the terminus, origi-nating in an area where the flow width significantly narrowsdownstream, suggesting a strong control of the valley con-striction on the surge dynamics.
1 Introduction
During their short (1–15 years) active phase, surge-typeglaciers typically speed up severalfold to over an order ofmagnitude, resulting in significant thickness changes andkilometre-scale terminus advance (Meier and Post, 1969;Raymond, 1987; Harrison and Post, 2003). In their quiescentphase (tens to hundreds of years), they flow slowly or becomestagnant. Meanwhile, ice accumulates in the upstream areaand the imbalanced flow causes retreating and thinning in thedownstream area, which produces a steeper glacier surface inthe upstream. This part of the quiescent phase is sometimescalled the build-up phase (Dolgoushin and Osipova, 1975;Jiskoot, 2011). As to the cause of the surge, two generationmechanisms have been proposed: the Alaskan-type and theSvalbard-type (e.g. Murray et al., 2003).
In Alaskan temperate glaciers, the active phase is rela-tively short, lasting a few months to years, and can have a
rapid speed-up and slow-down. The Alaskan-type surge of-ten initiates in winter (Raymond, 1987; Harrison and Post,2003). The initiation mechanism is thought to be a hydrologi-cal transition from efficient tunnel-like drainage to inefficientlinked-cavity drainage with a corresponding increase in wa-ter pressure (Kamb et al., 1985; Harrison and Post, 2003).In contrast, in Svalbard polythermal glaciers, the speed-upis gradual, leading to years-long active surging. For theseglaciers, the active-phase duration and the recurrence intervalare much longer than those in the temperate Alaskan-type.Moreover, for Svalbard polythermal glaciers, the surge gen-eration mechanism has been considered to be thermal reg-ulation (e.g. Murray et al., 2003). However, recent observa-tions have shown seasonal modulation in ice speed during theyears-long active surging, which indicates the importance ofthe hydrological process, originating from the surface melt-water, for maintaining a multi-year active phase (Yasuda andFuruya, 2015).
Near the border of Alaska and the Yukon, Canada, thereare many surge-type glaciers (Meier and Post, 1969; Ray-mond, 1987; Harrison and Post, 2003). The surge cycles inthis area have been examined (e.g. Eisen et al., 2001, 2005;Frappé and Clarke, 2007; Burgess et al., 2012; Bevingtonand Copland, 2014), but many questions remain about the de-tailed surging dynamics (Raymond, 1987; Harrison and Post,2003; Cuffey and Paterson, 2010).
Recent advances in spaceborne remote sensing can pro-vide insight into surging glacier dynamics. In particular, syn-thetic aperture radar (SAR) images have revealed spatial andtemporal changes in ice velocity at surge-type glaciers inAlaska and the Yukon (Burgess et al., 2013; Abe and Furuya,
Published by Copernicus Publications on behalf of the European Geosciences Union.
1428 T. Abe et al.: Twelve-year cyclic surging episodes at Donjek Glacier
2015). The temporal coverage of spaceborne SAR data is stilltoo short to investigate long-term evolution in ice speed, al-though SAR allows us to image remote areas regardless ofweather conditions and acquisition time (i.e. SAR data ac-quisition can be done both daytime and nighttime). Landsatoptical images distributed by the United States GeologicalSurvey (USGS) have been available since 1972. While opti-cal images have their limitations in local weather conditions,they have revealed the long-term changes in terminus posi-tions and velocities of mountain glaciers around the world(e.g. McNabb and Hock, 2014; Sakakibara and Sugiyama,2014).
To reveal the long-term evolution of Donjek Glacier, weuse Landsat optical images acquired between 1973 and 2014to derive the spatial–temporal changes in ice speed (1986–2014) and the terminus areas (1973–2014). As a conse-quence, here we report our findings of three surging eventsas well as a likely surging event pre-1985.
2 Donjek Glacier
Donjek Glacier is located in southwest Yukon (Fig. 1a).Steele, Spring, and Kluane glaciers are major surge-typeglaciers located around Donjek (Clarke and Holdsworth,2002). The entire length and area of Donjek Glacier are55 km and 448 km2, respectively. Donjek Glacier lies at anelevation of 1000–3000 m, and the valley width significantlyconstricts 20 km downstream of the terminus. The terminusspreads out as it flows into the river valley to form a smallpiedmont lobe. Former surges have caused this lobe to ex-pand to the east against the Donjek Range, which blocked theflow in the river (e.g. Clarke and Mathews, 1981). Recent air-borne laser altimetry revealed that the mass balance of Don-jek Glacier was −0.29 mw.e.yr−1 (Larsen et al., 2015). Pre-vious studies mentioned past surging events in 1935, 1961,1969, and 1978 (Johnson, 1972a, b; Clarke and Holdsworth,2002). The earliest three events were recognized using aerialphotogrammetry and morphological features. However, thedetails of the observations (e.g. data source and the obser-vation frequency) and even the duration of the active phaseare unclear. Moreover, surges since the 1980s have beenunreported, and the long-term evolution remains uncertain.Donjek’s last tributary (Fig. 1a) is also known as a surge-type glacier that was active in 1974 (Clarke and Holdsworth,2002), but there is no recent report of this tributary’s surge.
3 Data and method
We used Landsat optical images to examine terminuschanges from 1973 to 2014 and flow-speed evolution from1986 to 2014. Because of the lower spatial resolution of theimages prior to 1986, we could not derive the velocities be-tween 1973 and 1985, but the images were helpful to exam-ine the terminus changes even in the 1970s. These images
were acquired by the Landsat 1–5 Multi-Spectral Scanner(MSS), the Landsat 4–5 Thematic Mapper (TM), the Land-sat 7 Enhanced Thematic Mapper Plus (ETM+), and theLandsat 8 Operational Land Imager (OLI), all of which aredistributed by the USGS (http://landsat.usgs.gov/).
While there are a variety of image matching (i.e. fea-ture tracking) methods to derive glacier surface speed (e.g.Heid and Kääb, 2012), we used the Cross-Correlation in Fre-quency domain on Orientation images (CCF-O) algorithm(Fitch et al., 2002) to derive surface velocity in this studybecause for Alaskan glaciers, the CCF-O algorithm performsbetter than the other methods (Heid and Kääb, 2012). Fordetails of how we applied this method, see the Supplement.
We also examined the fluctuation of the terminus area as-sociated with the surging events using the false colour com-posite images (see the Supplement). The spatial resolution ofa composite image is 60 m for the MSS images and 30 m forthe others. We calculated the terminus area changes using areference line set about 5 km upstream to create a polygonrepresenting the edge of the terminus. Moreover, we investi-gated the behaviour of the tributary and examined the inter-action of it to the main stream by the composite images.
4 Results
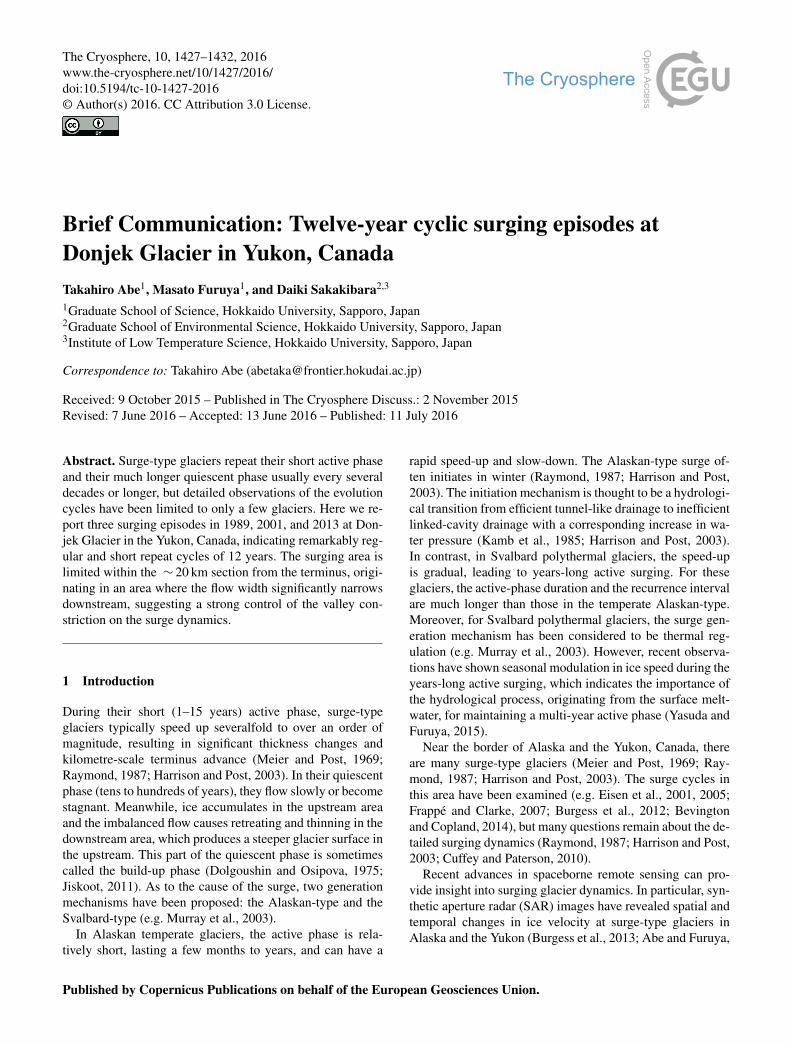
Figure 1b shows the ice speed map for the 2001 surge asan example, and Fig. 1c indicates the spatial–temporal ve-locity evolution along the flow line shown in Fig. 1a from1986 to 2014. In 1989, 2001, and 2013, the speed near theterminus appears much greater, by up to 2, 4.5, and 3 md−1,respectively, than that during the other years (i.e. quiescentphases), which is about 0.5 md−1 or less. During the threeactive phases, the speed-up regions are mostly limited to the∼ 20 km section from the terminus (see also Fig. 1b), whichwe associate below with the shape of the glacier.
We compare the width of the valley with the velocitiesassociated with the three surging episodes (Fig. 1d). Theinitiation of the three surging episodes occurred in the val-ley at the section between 18 and 22 km from the terminus,where it is about 33 % narrower than upstream (Fig. 1c),and which is also an S-shaped valley. Meanwhile, the veloc-ities further upstream do not show any significant temporalchanges throughout the analysed period, maintaining a speedof about 1.0 md−1 (Fig. 1c, d). In addition, the velocity frontof ∼ 0.5 md−1 (i.e. the boundary between the stagnant andmoving part near the terminus) propagates downstream forthe 5-year or longer period prior to the 2001 and 2013 ac-tive phases (red arrows in Fig. 1c). The active phase seems toinitiate when this front reaches the terminus. In addition, thevelocities behind the front clearly indicate a gradual accel-eration toward the peak active phases. However, we cannotidentify a clear timing of the surge initiation and terminationseason, which could be due to the multi-year precursory ac-
The Cryosphere, 10, 1427–1432, 2016 www.the-cryosphere.net/10/1427/2016/
T. Abe et al.: Twelve-year cyclic surging episodes at Donjek Glacier 1429
Figure 1. Glacier flow speeds and glacier extent. (a) Location of Donjek Glacier. The background is a Landsat 8 image acquired on 22 July2014. The white line is the flow line used in (c) and (d). The red and blue dots show the start and end points, whereas the black dots mark10 km intervals. The red arrow indicates a significantly narrower area of the valley and the dotted orange curves outline the last tributary.(b) A sample ice-speed map derived from two images acquired in August and September 2001. The colour scale (logarithmic) is the same asthat in (c). (c) Spatial-temporal velocity evolution along the flow line in (a) from 1986 to 2014. The red arrows indicate the propagation ofthe velocity front. (d) The black line shows the change in the valley width between 8 and 30 km along the flow line. The blue, red, and greenlines show the ice velocity associated with surging episodes in 1989, 2001, and 2003, respectively. The pink line is the averaged velocitybetween 2003 and 2011 (i.e. the quiescent phase).
celeration or a lack of temporal resolution in the availabledata.
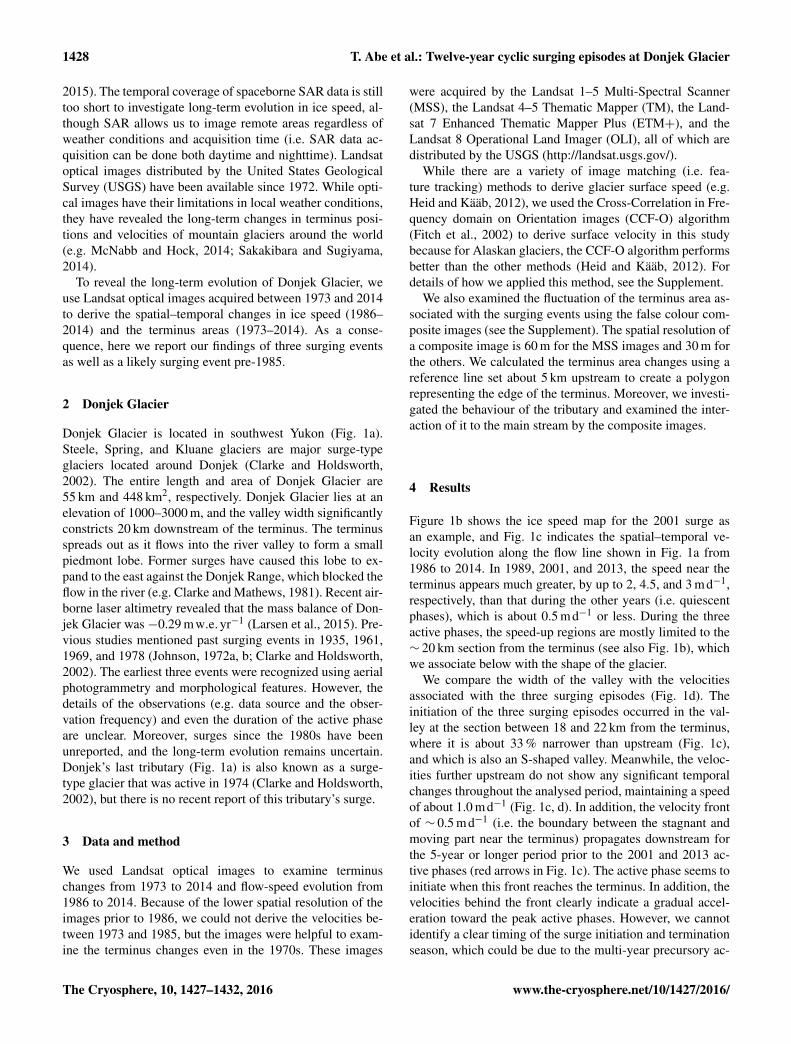
The red curve in Fig. 2a shows the temporal changes of theice speed averaged over the section between 0 and 5 km fromthe terminus. This curve has three significant peaks, whichcorrespond to the active phases in 1989, 2001, and 2013(Fig. 1c, d). The peak magnitudes all differ, but the differ-ences are likely due mainly to the coarse temporal samplingof the velocities. In the 2001 event (Fig. 2b), the speed startsto gradually increase in late 1998–1999, rapidly increasing inlate 2000–2001, and rapidly decreasing in 2003. The evolu-tion of the speed for the 2013 event (Fig. 2c) is similar to thatfor the 2001 event; namely, the speed starts to gradually in-crease in late 2011–2012, rapidly increasing in late 2012 andthen terminates in late 2013. Although the data do not resolvethe exact month or season of the initiation, the duration of theactive phase is about 1 year.
The terminus area also changes from 1973 to 2014, withdecadal fluctuations superimposed on a gradual decrease.The black line in Fig. 2a indicates a long-term rate of de-crease of −0.2 km2 yr−1, which presumably indicates thenegative mass balance trend from recent climate warming(e.g. Luthcke et al., 2013; Larsen et al., 2015). The decadalfluctuations in blue show peaks around 1980, 1991, 2002,
and 2014. Comparing those peaks with the speed changes inred, the last three peaks in blue coincide with the last threepeaks in the speed data, with a 0- to 2-year time lag (Fig. 2a).These correspondences indicate that the decadal fluctuationsin terminus area are attributable to the sudden speed-up of asurge event. During a surge, a significant volume of ice mustbe rapidly transported to the terminus area, and thus the waxand wane of the terminus area occur with the surge cycle.Although our speed measurements do not go back to before1985, such a surge is likely the reason for the temporal in-crease of the terminus area around 1980 as well.
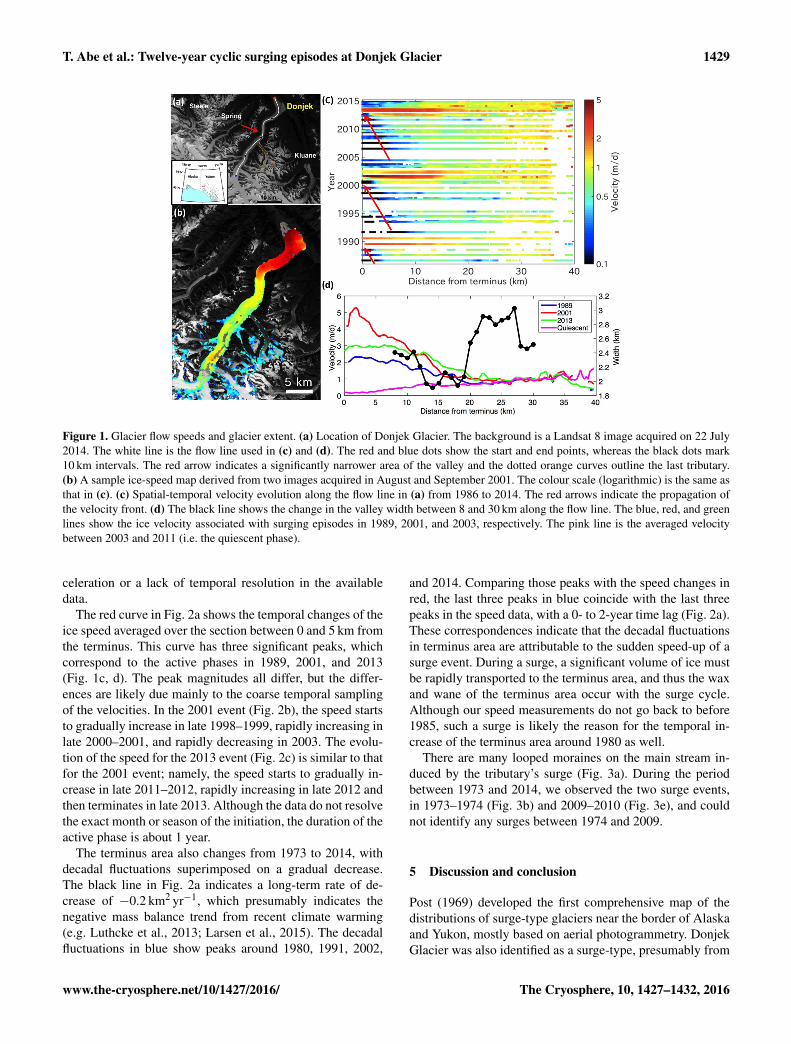
There are many looped moraines on the main stream in-duced by the tributary’s surge (Fig. 3a). During the periodbetween 1973 and 2014, we observed the two surge events,in 1973–1974 (Fig. 3b) and 2009–2010 (Fig. 3e), and couldnot identify any surges between 1974 and 2009.
5 Discussion and conclusion
Post (1969) developed the first comprehensive map of thedistributions of surge-type glaciers near the border of Alaskaand Yukon, mostly based on aerial photogrammetry. DonjekGlacier was also identified as a surge-type, presumably from
www.the-cryosphere.net/10/1427/2016/ The Cryosphere, 10, 1427–1432, 2016

1430 T. Abe et al.: Twelve-year cyclic surging episodes at Donjek Glacier
Figure 2. Ice speeds and area near the terminus. (a) Temporal changes of the ice speed (red) and the terminus area (blue). The ice speeddata are averaged over the section between 0 and 5 km along the flow line shown in Fig. 1a. The error bars indicate the mean speed in thenon-glacial region. The black line indicates the long-term change of the terminus area. The dotted line boxes mark the areas shown in (b)and (c). (b) Temporal change of the ice speed associated with the 2001 event. (c) Same as (b) except for the 2013 event. The black dottedline marks the peak in ice speed during each event.
Figure 3. Spatial patterns of the looped moraines induced by thetributary surges shown in the Landsat images. (a) The near-terminusregion of Donjek Glacier shown in Landsat 7 ETM+ false colourcomposite image acquired on 6 June 2012. The white dotted boxshows the enlarged areas shown in (b–e). (b) Snapshot on 19 July1974 of the moraine movements (red arrow) generated by the1973–1974 tributary’s surge. (c) Same as (b) except 25 July 1986.(d) Same as (b) except 7 July 2000. (e) Same as (b) except 6 June2012.
its 1961 surge. However, the timing of past surging eventsat Donjek Glacier from previous studies includes large un-certainties. Those data sources have very different spatialand temporal coverages than ours, and the active surgingwas largely judged from morphological observations. For in-stance, we could not find any descriptions of the activity ofthe surge at Donjek Glacier in the 1960s. Regarding the 1969surge, Johnson (1972b) noted that the terminus advance wasless than 500 m, which was much smaller than about 1 kmadvances of the earlier surges in 1935, 1961, and the recentthree surges in 1989, 2001, and 2013. However, given therecent observations, we may argue that a mini-surge-like ac-celeration (so-called pulse) could cause the slight advance ofthe terminus in 1969, a mini event like the pulse-like eventsin 1995 and 2009 (Fig. 1c). In addition, according to John-son (1972a), there were no observations before 1935. Thus,we cannot say the surge initiated in 1935. Therefore, we donot merge these past events with our findings.
The recurrence intervals between the 1989 and 2001events and between the 2001 and 2013 events are 12 years(Figs. 1c, 2a). Although we cannot derive the velocity databefore 1985, the similar 12-year fluctuation in terminus areathat extends before 1985 strongly suggests that previoussurging occurred in the late 1970s. Such a surge is consis-tent with the previous report of the surge in 1978 (Clarke
The Cryosphere, 10, 1427–1432, 2016 www.the-cryosphere.net/10/1427/2016/

T. Abe et al.: Twelve-year cyclic surging episodes at Donjek Glacier 1431
and Holdsworth, 2002). The 12-year recurrence interval isas short as the latest interval at Lowell Glacier (Bevingtonand Copland, 2014). Lowell Glacier experienced five surgesbetween 1948 and 2013, and the surge-cycle recurrence in-terval (12–20 years) has been shortening over time, which isinterpreted as being due to a strongly negative mass balancesince the 1970s or earlier (Bevington and Copland, 2014).Variegated Glacier is one of the most famous surge-typeglaciers in Alaska, and its surge cycle has been well stud-ied (Eisen et al., 2001, 2005). Eisen et al. (2001) attributedthe variability in the recurrence intervals to the variable an-nual mass balance. However, in contrast to the Lowell andVariegated glaciers, whose average recurrence intervals are15.25 (Bevington and Copland, 2014) and 15 years (Eisenet al., 2005), respectively, the recurrence interval at DonjekGlacier is not only shorter but also apparently less variableover time, which we consider as significant differences de-spite the three surge-type glaciers sharing a similar climate.
The behaviour of Donjek Glacier is similar to MedvezhiyGlacier in Tajikistan (Dolgoushin and Osipova, 1975; Cuf-fey and Paterson, 2010), in that both have a short recurrenceinterval (10–14 years) and both have apparent geometricalcontrol of the surging area. Medvezhiy Glacier lies in thewest Pamir Mountains, and its surging activity was exten-sively monitored in the 1960s–1970s (Dolgoushin and Os-ipova, 1975). Medvezhiy Glacier has a wider accumulationarea at an elevation of 4600–5500 m, but the surges are con-fined to the 8 km long ice tongue in the narrow valley, sepa-rated by a steep ice fall that drops by 800 m per 1 km (Dol-goushin and Osipova, 1975). Although the slope changes onDonjek Glacier are smaller, the significant valley constrictionmay generate a steep surface slope in the quiescent phasearound the narrowing zone due to the mass transport fromupstream (see the Supplement). As such, the apparent reg-ularity of the recurrence interval may be due to the rathersteady flow speed upstream. Moreover, we consider that thesurge is independent from the tributary’s surge. This is be-cause the interval of the tributary’s surge is 36 years, whichis much longer than that of the main stream’s.
At Medvezhiy Glacier, the observed maximum speed ex-ceeds 100 md−1, and the active phase initiates in winter, last-ing about 3 months (Cuffey and Paterson, 2010). At Varie-gated Glacier, the surge also initiates from autumn to win-ter and the maximum speed is 50 md−1 during the 1982–1983 surge (Kamb et al., 1985). At Bering Glacier, a sim-ilar behaviour (speed exceeding 10 md−1, and winter ini-tiation) is observed in the 2008–2011 surge (Burgess etal., 2012). The recurrence interval is about 18 years. Sim-ilar behaviour has also been confirmed at Lowell Glacier(Bevington and Copland, 2014). These sudden speed-ups inautumn–winter and rapid slow-downs in early summer arethought to arise from the hydrological regulation mechanism.The mechanism, which involves a destruction of tunnel-likechannels and subsequent change into a linked-cavity sys-tem that increases the water pressure, has been proposed
based on detailed observations of the 1982–1983 surge atVariegated Glacier (Kamb et al., 1985). Thus, such surgesare often termed an Alaskan-type surge. Meanwhile, our ob-served maximum speed reached ∼ 5 md−1 at most, and wecould not determine the initiation season. It is likely, how-ever, that we have missed much higher speeds and winterinitiation due to the coarse temporal resolution in our veloc-ity data and difficulties for optical image matching causedby the lack of identifiable surface features when the glacieris snow-covered. The 12-year recurrence interval is appar-ently shorter than that in a Svalbard-type surge, whose cy-cle is thought to be 50 years or much longer (Murray etal., 2003; Jiskoot, 2011). Moreover, the active duration ismuch shorter than that of Svalbard-type, and the flow speedseems to have rapidly slowed down after the active phase.The observed multi-year acceleration may include small ac-celeration events or mini-surges that redistribute thickeningand thinning (Raymond and Harrison, 1988; Harrison andPost, 2003) during the build-up phase. Thus, we consider thatthe surge phase of the two events is about 1 year, and thatDonjek Glacier presumably has the Alaskan-type surge.
Based on these findings, we argue that the cyclic surging atDonjek Glacier occurs as follows. In the quiescent phase, icedelivered from the upstream area stores up at the highly nar-rowed area (Fig. 1a), causing local thickening. The ice thick-ening generates a steeper slope (Fig. S3 in the Supplement)with a corresponding higher driving stress. When the icethickness reaches a critical value, the glacier starts to speedup. We do not claim, however, that this driving stress itselfis high enough to initiate the surging; that is, the thickeningof ice and steeper slope are not the direct cause of surging.Rather, thickened ice upstream is just a pre-condition priorto surging. However, as the ice thickness increases, the vol-ume of englacial water storage will also increase, which cansupply a greater basal water flux and increase its pressure,thereby allowing the higher speed during the surging event(Lingle and Fatland, 2003; Abe and Furuya, 2015). Duringthe surge, the inefficient subglacial drainage system and thesufficient englacial water volume can maintain higher veloc-ity. After the mass redistribution terminates, the thickness inthe reservoir zone will again increase for the next event.
The next event of Donjek Glacier is likely to occur around2025. To test the model proposed here, we need detailed ob-servations of not only ice velocities but also the associatedgeometric and hydrological changes.
6 Data availability
Landsat images were downloaded from USGS EarthExplorer(http://earthexplorer.usgs.gov). Glacier outlines were down-loaded from the Randolph Glacier Inventory version 4.0 (Pf-effer et al., 2014, http://www.glims.org/RGI/rgi40_dl.html).
www.the-cryosphere.net/10/1427/2016/ The Cryosphere, 10, 1427–1432, 2016

1432 T. Abe et al.: Twelve-year cyclic surging episodes at Donjek Glacier
The Supplement related to this article is available onlineat doi:10.5194/tc-10-1427-2016-supplement.
Acknowledgements. We acknowledge JSPS-KAKENHI grantnumber 24651001 (Masato Furuya) and grant-in-aid for JSPSfellows (Takahiro Abe: 15J01952 and Daiki Sakakibara: 14J02632)for supporting this study. The comments from Luke Copland andDan Shugar were helpful to improve the original manuscript.
Edited by: J. O. Hagen
References
Abe, T. and Furuya, M.: Winter speed-up of quiescent surge-type glaciers in Yukon, Canada, The Cryosphere, 9, 1183–1190,doi:10.5194/tc-9-1183-2015, 2015.
Bevington, A. and Copland, L.: Characteristics of the last five surgesof Lowell Glacier, Yukon, Canada, since 1948, J. Glaciol, 60,113–123, 2014.
Burgess, E. W., Forster, R. R., Larsen, C. F., and Braun, M.:Surge dynamics on Bering Glacier, Alaska, in 2008–2011, TheCryosphere, 6, 1251–1262, doi:10.5194/tc-6-1251-2012, 2012.
Burgess, E. W., Foster, R. R., and Larsen C. F.: Flow veloc-ities of Alaskan glaciers, Nature Communications, 4, 2146,doi:10.1038/ncomms3146, 2013.
Clarke, G. K. C. and Holdsworth, G.: Glaciers of the St. EliasMountains, in: Satellite Image Atlas of Glaciers of the World,edited by: Williams Jr., R. S. and Ferrigno, J. G., USGS, Denver,Colorado, USA, USGS Professional Paper 1386-J, J301-J327,2002.
Clarke, G. K. C., and Matthews, W. H.: Estimates of the magnitudeof glacier outburst floods from Lake Donjek, Yukon Territory,Canada, Can. J. Earth Sci., 18, 1452–1463, 1981.
Cuffey, K. M. and Paterson, W. S. B.: The Physics of Glaciers, 4thEdn., Elsevier, Oxford, UK, 2010.
Dolgoushin, L. D. and Osipova, G. B.: Glacier surges and the prob-lem of their forecasting, IAHS-AISH Publ. No. 104, 292–304,1975.
Eisen, O., Harrison, W. D., and Raymond, C. F.: The surges of Var-iegated Glacier, Alaska, U.S.A., and their connection to climateand mass balance, J. Glaciol., 47, 351–358, 2001.
Eisen, O., Harrison, W. D., Raymond, C. F., Echelmeyer, K. A.,Bender, G. A., and Gorda, J. L. D.: Variegated Glacier, Alaska,USA: a century of surges, J. Glaciol., 51, 399–406, 2005.
Fitch, A. J., Kadyrov, A., Christmas, W. J., and Kittler, J.: Orienta-tion Correlation. in British Machine Vision Conference, Cardiff,UK, 133–142, 2002.
Frappé, T.-P. and Clarke, G. K. C.: Slow surge of Trapridge Glacier,Yukon Territory, Canada, J. Geophys. Res., 112, F03S32,doi:10.1029/2006JF000607, 2007.
Harrison, W. D., and Post, A. S.: How much do we really knowabout glacier surging?, Ann. Glaciol., 36, 1-6, 2003.
Heid, T. and Kääb, A.: Evaluation of existing image matching meth-ods for deriving glacier surface displacements globally from op-tical satellite imagery, Remote Sens. Environ., 118, 339–355,doi:10.1016/j.rse.2011.11.024, 2012.
Jiskoot, H.: Glacier surging, in: Encyclopedia of snow, ice andglaciers, edited by: Singh, V. P., Singh, P., and Haritashya, U. K.,Springer, Dordrecht, The Netherlands, 2011.
Johnson, P. G.: A possible advanced hypsithermal position of theDonjek Glacier, Arctic, 25, 302–305, 1972a.
Johnson, P. G.: The morphological effects of surges of the DonjekGlacier, St. Elias Moutains, Yukon Territory, Canada, J. Glaciol.,11, 227–234, 1972b.
Kamb, B., Raymond, C. F., Harrison, W. D., Engelhardt, H.,Echelmeyer, K. A., Humphrey, N., Brugman, M. M., and Pfeffer,T.: Glacier Surge Mechanism: 1982–1983 Surge of VariegatedGlacier, Alaska, Science, 227, 469–479, 1985.
Larsen, C. F., Burgess, E., Arendt, A. A., O’Neel, S., John-son, A. J., and Kienholz, C.: Surface melt dominates Alaskaglacier mass balance, Geophys. Res. Lett., 42, 5902–5908,doi:10.1002/2015GL064349, 2015.
Lingle, C. S. and Fatland, D. R.: Does englacial water storage drivetemperate glacier surge?, Ann. Glaciol., 36, 14–20, 2003.
Luthcke, S. B., Sabaka, T. J., Loomis, B. D., Arendt, A. A., Mc-Carthy, J. J., and Camp, J.: Antarctica, Greenland and Gulf ofAlaska land-ice evolution from an iterated GRACE global mas-con solution, J. Glaciol., 59, 613–631, 2013.
McNabb, R. W. and Hock, R.: Alaska tidewater glacier terminus po-sitions, 1948–2012, J. Geophys. Res.-Earth, 119, 153–167, 2014.
Meier, M. F. and Post, A.: What are glacier surges?, Can. J. EarthSci., 6, 807–817, 1969.
Murray, T., Strozzi, T., Luckman, A., Jiskoot, H., and Christakos,P.: Is there a single surge mechanism? Contrasts in dynamics be-tween glacier surges in Svalbard and other regions, J. Geophys.Res., 108, 2237, doi:10.1029/2002JB001906, 2003.
NSIDC (National Snow and Ice Data Center): The RandolphGlacier Inventory version 4.0, available at: http://www.glims.org/RGI/rgi40_dl.html, last access: July 2016.
Pfeffer, W. T., Arendt, A. A., Bliss, A., Bolch, T., Cogley, J. G.,Gardner, A. S., Hagen, J.-O., Hock, R., Kaser, G., Kienholz,C., Miles, E. S., Moholdt, G., Mölg, N., Paul, F., Radic, V.,Rastner, P., Raup, B. H., Rich, J., Sharp, M. J., and the Ran-dolph consortium: The Randolph Glacier Inventory: a glob-ally complete inventory of glaciers, J. Glaciol., 60, 537–552,doi:10.3189/2014JoG13J176, 2014.
Post, A.: Distribution of surging glaciers in western North America,J. Glaciol., 8, 229–240, 1969.
Raymond, C. F.: How do glaciers surge? A review, J. Geophys. Res.,92, 9121–9134, 1987.
Raymond, C. F. and Harrison, W. D.: Evolution of VariegatedGlacier, Alaska, U.S.A., prior to its surge, J. Glaciol., 34, 154–169, 1988.
Sakakibara, D. and Sugiyama, S.: Ice-front variations and speedchanges of calving glaciers in the Southern Patagonia Icefieldfrom 1984 to 2011, J. Geophys. Res.-Earth, 119, 2541–2554,2014.
USGS (U.S. Geological Survey) EarthExplorer: Landsat images,available at: http://earthexplorer.usgs.gov, last access: 5 June2016.
Yasuda, T. and Furuya, M.: Dynamics of surge-type glaciers in WestKunlun Shan, Northwestern Tibet, J. Geophys. Res.-Earth, 120,2393–2405, 2015.
The Cryosphere, 10, 1427–1432, 2016 www.the-cryosphere.net/10/1427/2016/