india surging ahead - dubai
TRANSCRIPT

INDIA – SURGING AHEAD
Economic Diplomacy Division Ministry of External Affairs New Delhi
MEA-ED Aug 2017

“Diplomacy for Development”

Economy • $2.45 trillion economy. • Economic Growth: 7.9% (2015-16); 7.1% in (2016-17) • Sectoral contribution to GDP
Agriculture ~ 17.5%
Industry ~ 29.6% (Manufacturing ~ 16.6%) Services ~ 53%
• Moderate inflation @ 4~5%. • Population @ 1.25 billion
Unemployment Rate – 4.9% Labour Participation Rate ~ 52.5%
Trade (2016-17): Exports ~ $275 Billion; Imports ~ $380 Billion
Large Trading Partners: China, U.S., UAE, Hong Kong, Switzerland
Central Bank Interest Rate ~ 6.5% Bank Lending Rate ~ 9.1-9.6% Yield on 10-yr Govt. Securities: 6.53% (June 2017) Credit Rating:
Moody’s : Baa3 (Positive) S&P : BBB- (Stable)
World Bank Growth Estimates: 7.6% (2018), 7.8% (2019) India’s share in global GDP (2016): 2.99% (Nominal GDP)
and 7.32% (GDP in PPP). India’s share in global exports – 2% (2016). FDI ~ $60 Billion (2016-17)…+8% FOREX reserves ~ $393 Billion (5 Aug 2017) Current account deficit ~ 0.7% of GDP (2016); Expected 1.3%
in 2017 Govt. Debt to GDP @ 67% Household Debt to GDP ~ 10.1%
6.9
6.7 6.5
6
7.6
6.6
7.2 7.7
5
10
2015 2016 2017 2018
China India
IMF Forecast till 2018
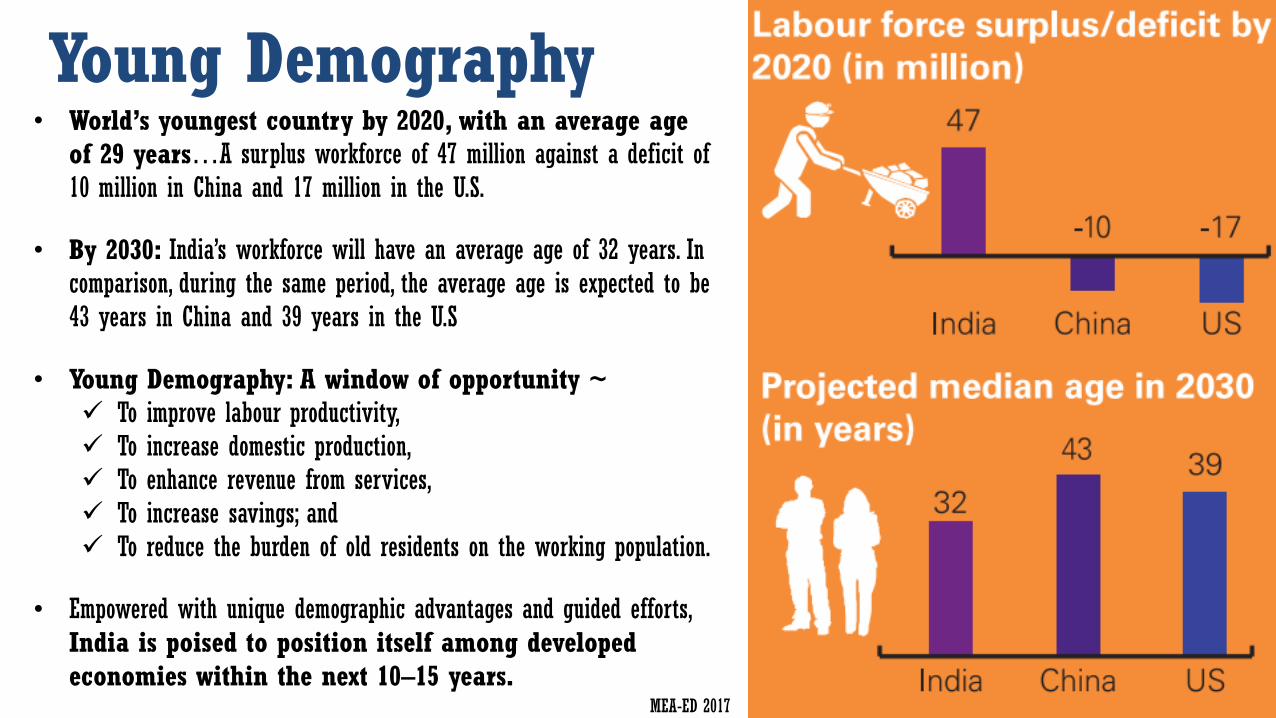
Young Demography • World’s youngest country by 2020, with an average age
of 29 years…A surplus workforce of 47 million against a deficit of 10 million in China and 17 million in the U.S.
• By 2030: India’s workforce will have an average age of 32 years. In comparison, during the same period, the average age is expected to be 43 years in China and 39 years in the U.S
• Young Demography: A window of opportunity ~
To improve labour productivity, To increase domestic production, To enhance revenue from services, To increase savings; and To reduce the burden of old residents on the working population.
• Empowered with unique demographic advantages and guided efforts, India is poised to position itself among developed economies within the next 10–15 years.
MEA-ED 2017
Ease of doing business 20 Services of Central Government have been integrated with the
E-Biz single window IT Platform. 14 services of Andhra Pradesh, 14 services of Odisha and 2 services of NCT of Delhi have been integrated with eBiz.
Cooperative and Competitive Federalism 42% share for states in the divisible pool of taxes. States assessed on 8 broad parameters of Ease of Doing
Business. Goods and Services Tax implemented on 1st July 2017. New Bankruptcy Law Passed. New IPR policy announced. Investor Facilitation Cell – INVEST INDIA, established to guide,
assist and handhold investors during the entire life cycle of a business.
Road-map to reduce corporate tax from 30% to 25% laid down. Time taken for obtaining PAN and TAN on E-Biz portal has been
brought down to T+1 days
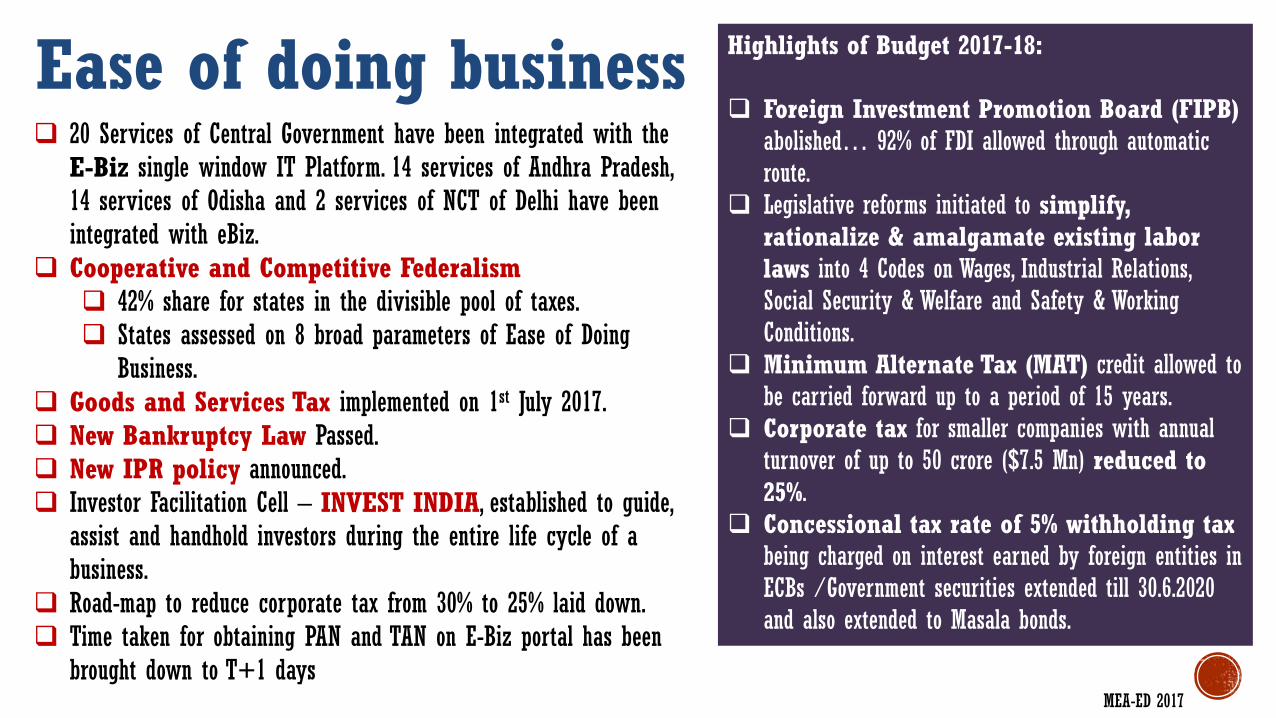
Highlights of Budget 2017-18: Foreign Investment Promotion Board (FIPB)
abolished… 92% of FDI allowed through automatic route.
Legislative reforms initiated to simplify, rationalize & amalgamate existing labor laws into 4 Codes on Wages, Industrial Relations, Social Security & Welfare and Safety & Working Conditions.
Minimum Alternate Tax (MAT) credit allowed to be carried forward up to a period of 15 years.
Corporate tax for smaller companies with annual turnover of up to 50 crore ($7.5 Mn) reduced to 25%.
Concessional tax rate of 5% withholding tax being charged on interest earned by foreign entities in ECBs /Government securities extended till 30.6.2020 and also extended to Masala bonds.
MEA-ED 2017

Make in India As part of the Ease of Doing Business, the Make-in-India (MII) program was launched on 25 Sept 2014.
MII focuses on: Attracting investment into manufacturing by introducing a
business friendly regulatory environment, fostering innovation, enhancing skill development, protect IPR, and build best-in-class manufacturing infrastructure.
Increase manufacturing share in GDP from 16% to 25% by 2022.
Create 100 Million jobs by 2022. Completely overhaul the FDI regime. 25 Sectors identified: Automobile, Auto Components, Aviation,
Biotechnology, Chemicals, Construction, Defence, Electrical Machinery, Electronic Systems, Food Processing, IT & BPM, Leather, Media & Entertainment, Mining, Oil & Gas, Pharma, Ports & Shipping, Railways, Renewable Energy, Roads, Space, Textiles & Garments, Thermal Power, Tourism & Hospitality, and Wellness.
A pentagon of corridors is being envisaged to facilitate manufacturing and to project India as a global manufacturing destination.
1. Amritsar Kolkata Industrial Corridor 2. Bengaluru Mumbai Economic Corrido 3. Chennai Bengaluru Industrial Corridor 4. Delhi Mumbai Industrial Corridor 5. Vizag Chennai Industrial Corridor
MEA-ED 2017
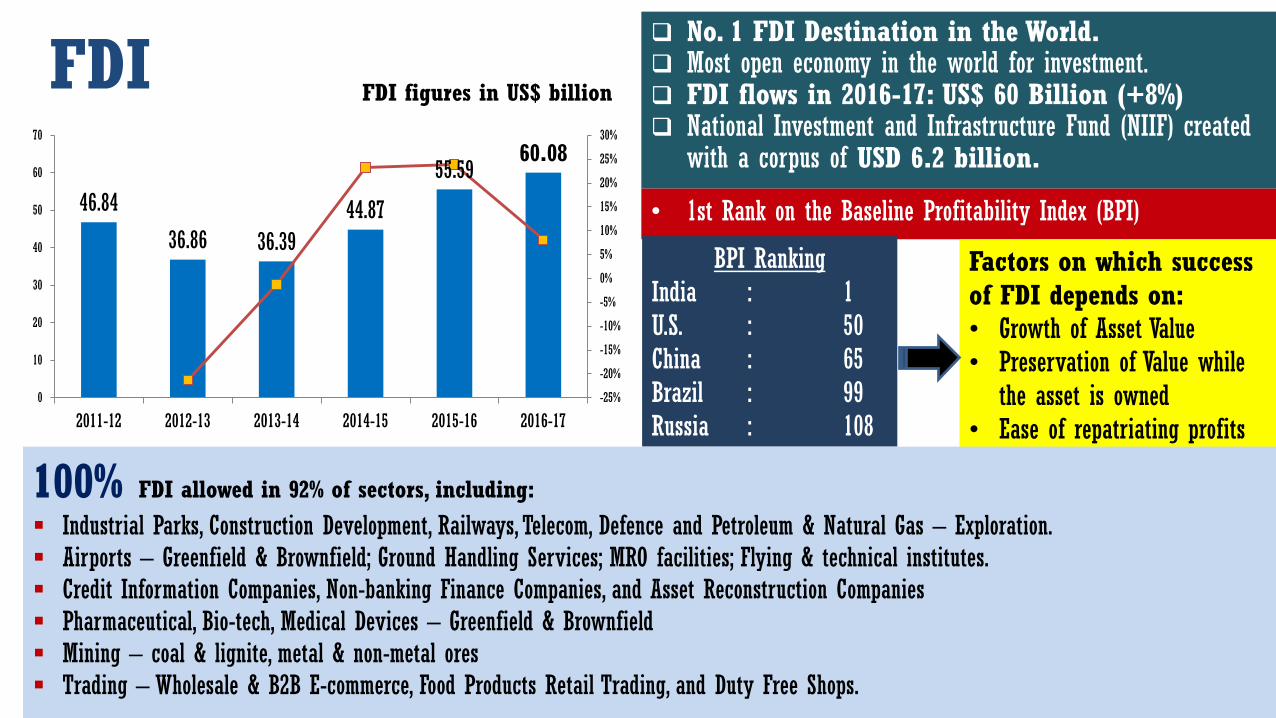
FDI No. 1 FDI Destination in the World. Most open economy in the world for investment. FDI flows in 2016-17: US$ 60 Billion (+8%) National Investment and Infrastructure Fund (NIIF) created
with a corpus of USD 6.2 billion.
• 1st Rank on the Baseline Profitability Index (BPI)
BPI Ranking India : 1 U.S. : 50 China : 65 Brazil : 99 Russia : 108
Factors on which success of FDI depends on: • Growth of Asset Value • Preservation of Value while
the asset is owned • Ease of repatriating profits
MEA-ED 2017
46.84
36.86 36.39
44.87
55.59 60.08
-25%
-20%
-15%
-10%
-5%
0%
5%
10%
15%
20%
25%
30%
0
10
20
30
40
50
60
70
2011-12 2012-13 2013-14 2014-15 2015-16 2016-17
FDI figures in US$ billion
100% FDI allowed in 92% of sectors, including:
Industrial Parks, Construction Development, Railways, Telecom, Defence and Petroleum & Natural Gas – Exploration. Airports – Greenfield & Brownfield; Ground Handling Services; MRO facilities; Flying & technical institutes. Credit Information Companies, Non-banking Finance Companies, and Asset Reconstruction Companies Pharmaceutical, Bio-tech, Medical Devices – Greenfield & Brownfield Mining – coal & lignite, metal & non-metal ores Trading – Wholesale & B2B E-commerce, Food Products Retail Trading, and Duty Free Shops.
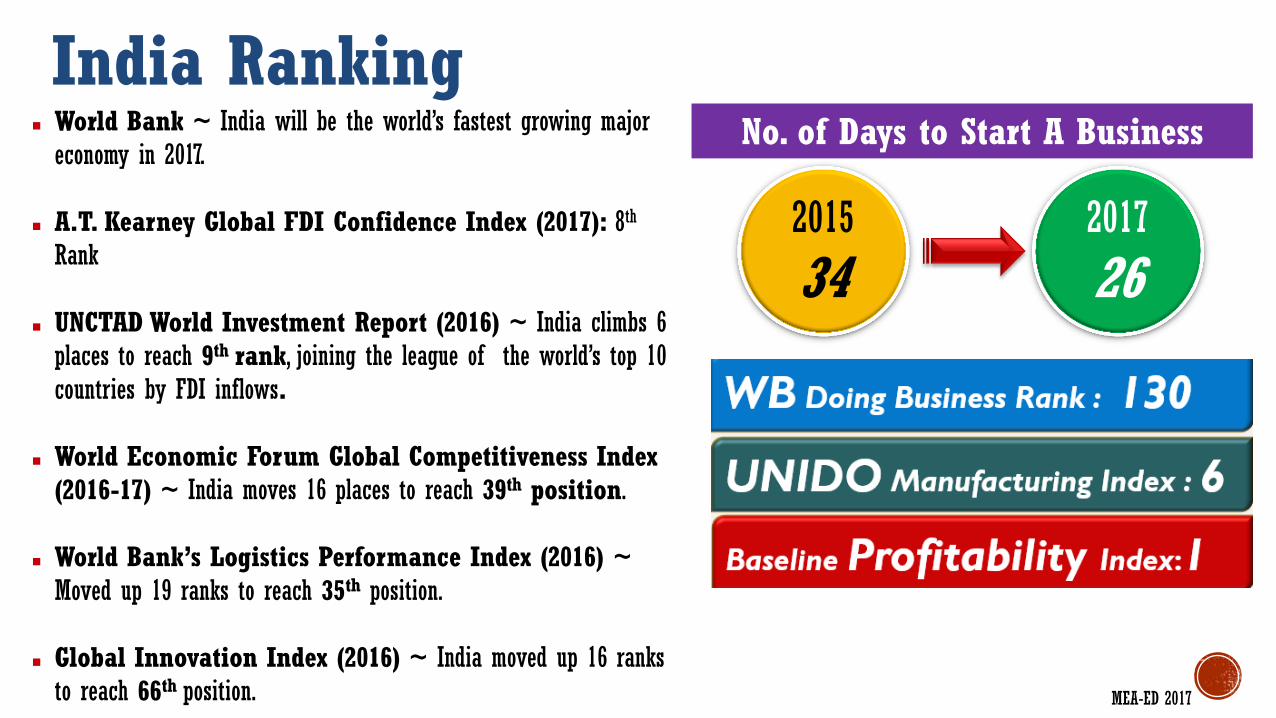
India Ranking World Bank ~ India will be the world’s fastest growing major
economy in 2017.
A.T. Kearney Global FDI Confidence Index (2017): 8th Rank
UNCTAD World Investment Report (2016) ~ India climbs 6 places to reach 9th
rank, joining the league of the world’s top 10 countries by FDI inflows.
World Economic Forum Global Competitiveness Index (2016-17) ~ India moves 16 places to reach 39th position.
World Bank’s Logistics Performance Index (2016) ~
Moved up 19 ranks to reach 35th position.
Global Innovation Index (2016) ~ India moved up 16 ranks to reach 66th
position.
MEA-ED 2017
2015
34 2017
26
No. of Days to Start A Business
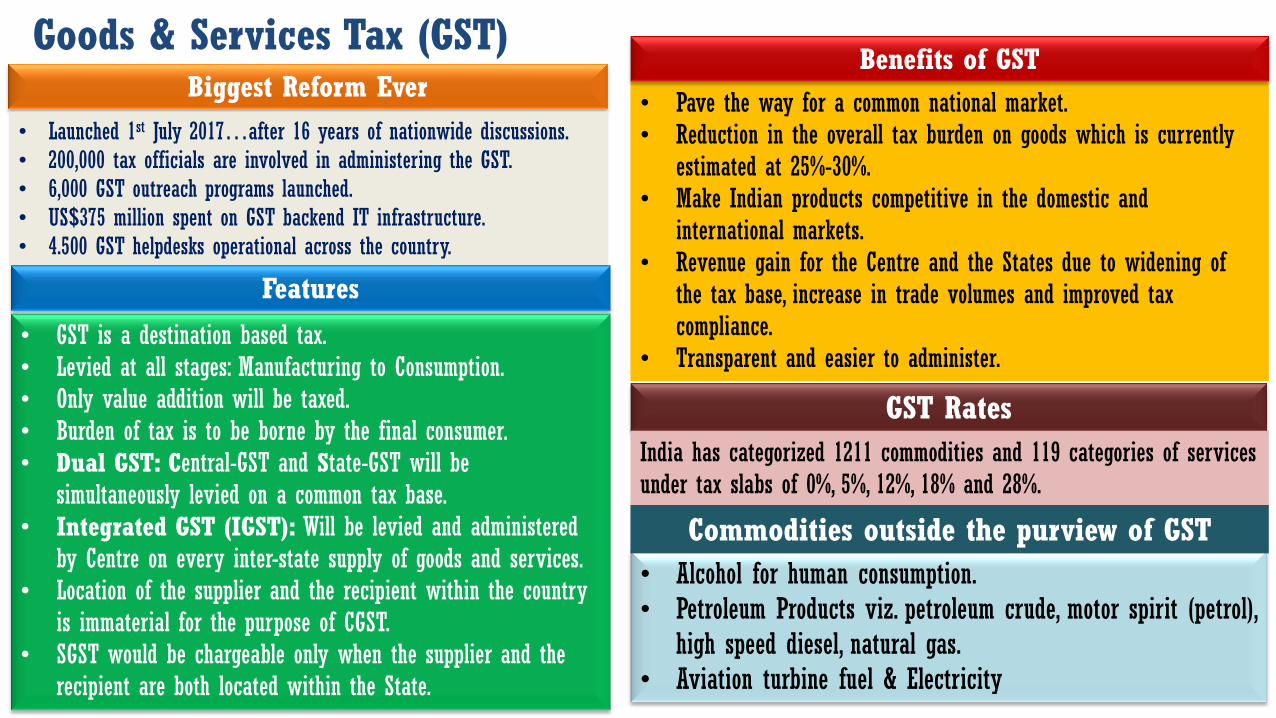
Goods & Services Tax (GST)
• GST is a destination based tax. • Levied at all stages: Manufacturing to Consumption. • Only value addition will be taxed. • Burden of tax is to be borne by the final consumer. • Dual GST: Central-GST and State-GST will be
simultaneously levied on a common tax base. • Integrated GST (IGST): Will be levied and administered
by Centre on every inter-state supply of goods and services. • Location of the supplier and the recipient within the country
is immaterial for the purpose of CGST. • SGST would be chargeable only when the supplier and the
recipient are both located within the State.
• Pave the way for a common national market. • Reduction in the overall tax burden on goods which is currently
estimated at 25%-30%. • Make Indian products competitive in the domestic and
international markets. • Revenue gain for the Centre and the States due to widening of
the tax base, increase in trade volumes and improved tax compliance.
• Transparent and easier to administer.
Benefits of GST Biggest Reform Ever
GST Rates
India has categorized 1211 commodities and 119 categories of services under tax slabs of 0%, 5%, 12%, 18% and 28%.
• Alcohol for human consumption. • Petroleum Products viz. petroleum crude, motor spirit (petrol),
high speed diesel, natural gas. • Aviation turbine fuel & Electricity
• Launched 1st July 2017…after 16 years of nationwide discussions. • 200,000 tax officials are involved in administering the GST. • 6,000 GST outreach programs launched. • US$375 million spent on GST backend IT infrastructure. • 4.500 GST helpdesks operational across the country.
Features
Commodities outside the purview of GST

Railways Indian Railway Facts: 115,883 km of tracks: Caters to 15% of public transport & 30% of total freight 12,500 trains ferrying 23 Mn passengers and 7,400 trains carrying 3 Mn tons of
freight every day respectively. Employs 1.4 Mn people – world’s 7th largest employer with revenues: US$28 Bn
(2016-17)
New Initiatives: 100% FDI allowed under the automatic route in construction, operation, and
maintenance of suburban corridor projects, high-speed train, dedicated freight lines, railway electrification, mass rapid transit systems, passenger/freight terminals and signalling systems.
Mumbai-Ahmedabad 508 km High Speed Railway Corridor: Japan to fund 80% of the US$ 15 billion project @ 0.1% interest with a 15-year moratorium on a 50-year repayment period.
Project Nilgiri (Wifi Services at Stations): In partnership with Google, wifi hotspots will be set up in 400 stations in the 1st phase. In 2nd phase wifi on running trains.
Locomotive and wagon manufacturing: Contracts worth US$ 6.2 billion signed with GE & Alstom for diesel and electric locomotives.
New Objectives: Increase investments Decongesting heavy haul routes Speed up trains Better amenities & safety Improving railway systems
Investment Planned: USD 133.5 billion over the next 5 years ending 2019
MEA-ED 2017

Railways…2 Railway Investment opportunities: Dedicated Freight Corridors (DFC) Railway lines to and from coal mines
and ports Development of high-speed tracks and
suburban corridors Re-development of railway stations
and freight terminals Power generation and energy saving Setting up wagon, coaches and
locomotive unit Gauge conversion Network expansion.
• Increasing track length by 20% to 138,000 km; daily passenger carrying capacity from 23 Mn to 30 Mn; and annual freight carrying capacity from 1 billion tonnes to 1.5 billion tonnes.
• Replace 3,450 railway crossings with 920 under and over-bridges through an investment of US$1 billion.
• Redevelop/Modernize 400 railway stations through PPP model. • Introduction of bio-toilets and vacuum toilets, waste-to-energy plants at stations,
conducting energy audits etc. • Installation of train protection warning systems and train collision avoidance
systems. • Installation of surveillance cameras in trains and railway stations.
• Increase speed of 9 railway corridors from 110-130 kmph to 160-200 kmph. • Increase the average speed of freight trains to 100 kmph (unloaded trains) and 75 kmph (loaded trains). • Diamond quadrilateral network of high-speed rail to connect major cities. • Introduction of bullet trains (350 kmph speed).
FOCUS ON SPEED:
TARGETS:
MEA-ED 2017

Station Redevelopment
Indian Railways has 51,648 hectares of vacant land…10,000 hectares available for commercial development…1092 hectares identified near railway stations.
400 stations identified for modernization…cost $15 Billion. Stations redeveloped on PPP model by modifying the Swiss
challenge model.
Companies interested: IL&FS, GMR, Tata Realty & Infra., Brigade Group, Mantri Developers, Raheja, Shapoorji Pallonji, Reliance Infra, Lanco Infratech, Essel Group.
Malaysia, UK, South Korea and France have shown interest; roadshows organized in UAE and Malaysia.
Boston Consulting Group is preparing the overall strategy; EY also roped in.
12 stations to be developed by Indian Railway Stations Development Corp. (IRSDC) – work commenced on Habibganj and Gandhinagar Railway Stations.
23 stations to be developed by Zonal Railways. 18 Mumbai Suburban Railway stations to be developed by
Mumbai Railway Vikas Corp. (MRVC) and Railway Land Development Authority (RLDA).
10 Stations to be developed by National Buildings Construction Corp. (NBCC)
Progress:
Pic: Habibganj Railway Station
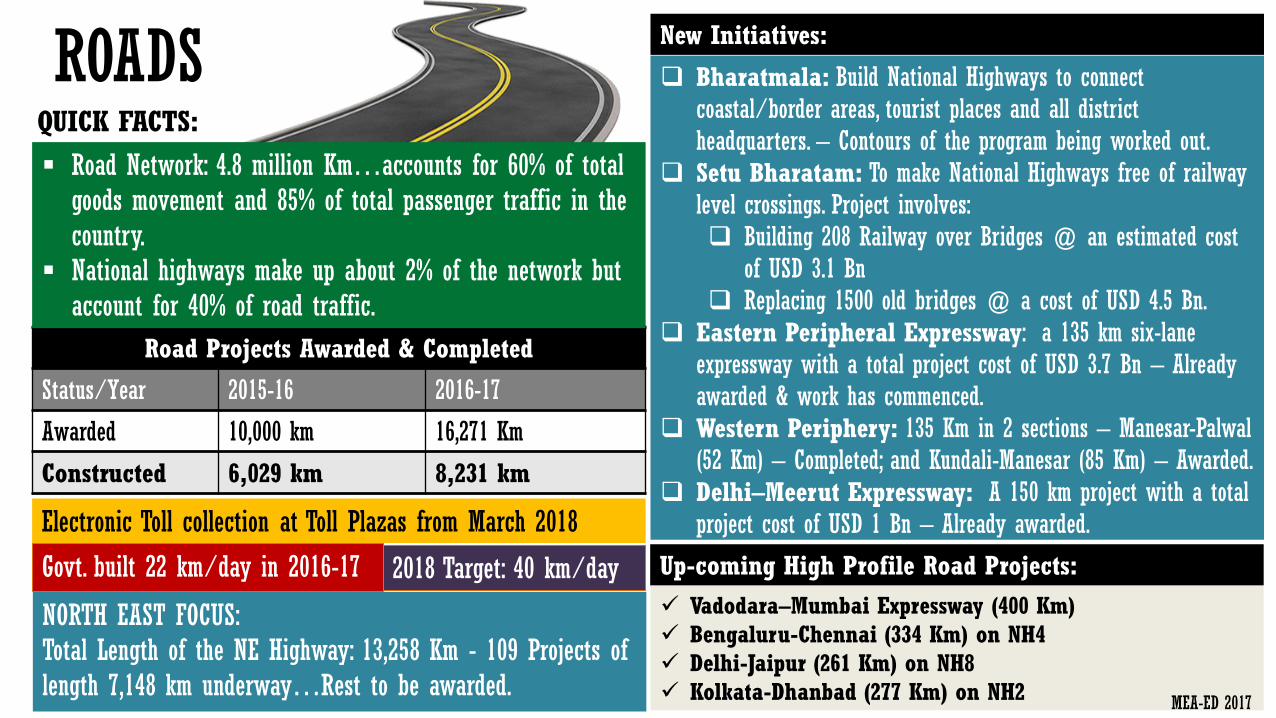
ROADS QUICK FACTS:
ITP&ES 2016
Electronic Toll collection at Toll Plazas from March 2018
Govt. built 22 km/day in 2016-17
Bharatmala: Build National Highways to connect coastal/border areas, tourist places and all district headquarters. – Contours of the program being worked out.
Setu Bharatam: To make National Highways free of railway level crossings. Project involves: Building 208 Railway over Bridges @ an estimated cost
of USD 3.1 Bn Replacing 1500 old bridges @ a cost of USD 4.5 Bn.
Eastern Peripheral Expressway: a 135 km six-lane expressway with a total project cost of USD 3.7 Bn – Already awarded & work has commenced.
Western Periphery: 135 Km in 2 sections – Manesar-Palwal (52 Km) – Completed; and Kundali-Manesar (85 Km) – Awarded.
Delhi–Meerut Expressway: A 150 km project with a total project cost of USD 1 Bn – Already awarded.
New Initiatives:
Road Projects Awarded & Completed
Status/Year 2015-16 2016-17
Awarded 10,000 km 16,271 Km
Constructed 6,029 km 8,231 km
Vadodara–Mumbai Expressway (400 Km) Bengaluru-Chennai (334 Km) on NH4
Delhi-Jaipur (261 Km) on NH8 Kolkata-Dhanbad (277 Km) on NH2
Up-coming High Profile Road Projects:
NORTH EAST FOCUS: Total Length of the NE Highway: 13,258 Km - 109 Projects of length 7,148 km underway…Rest to be awarded.
Road Network: 4.8 million Km…accounts for 60% of total goods movement and 85% of total passenger traffic in the country.
National highways make up about 2% of the network but account for 40% of road traffic.
2018 Target: 40 km/day
MEA-ED 2017
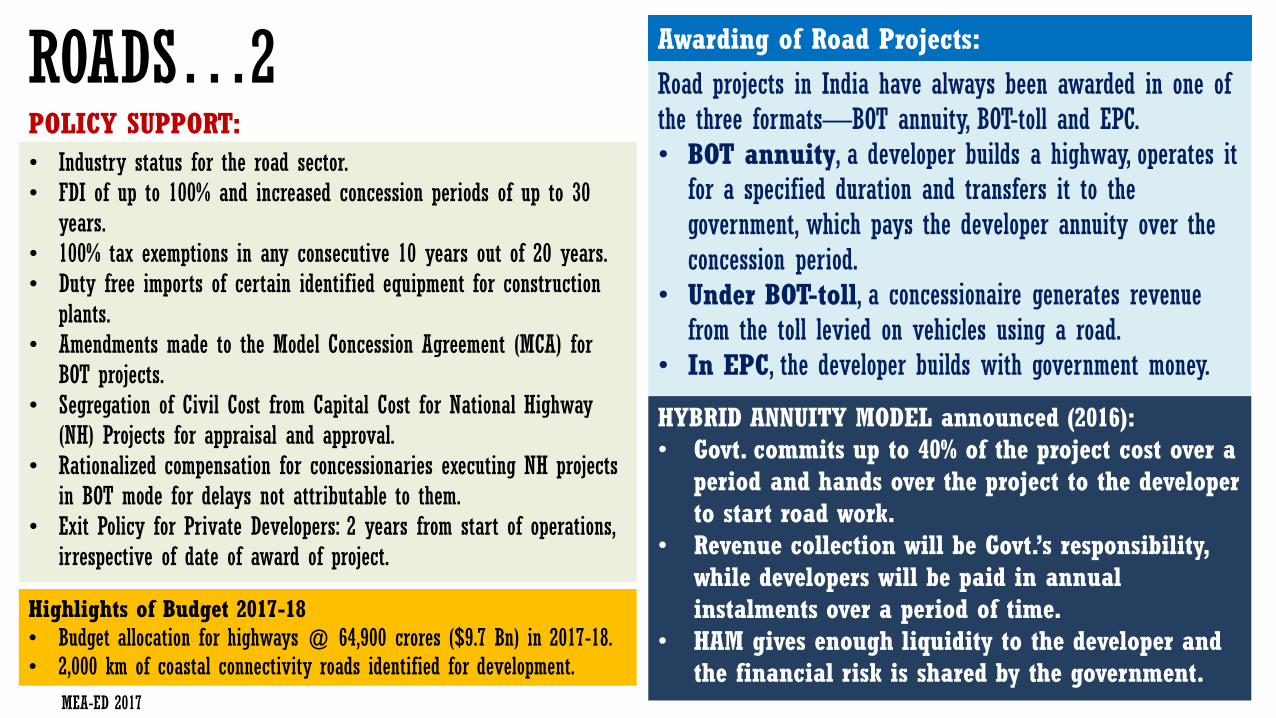
ROADS…2
• Industry status for the road sector. • FDI of up to 100% and increased concession periods of up to 30
years. • 100% tax exemptions in any consecutive 10 years out of 20 years. • Duty free imports of certain identified equipment for construction
plants. • Amendments made to the Model Concession Agreement (MCA) for
BOT projects. • Segregation of Civil Cost from Capital Cost for National Highway
(NH) Projects for appraisal and approval. • Rationalized compensation for concessionaries executing NH projects
in BOT mode for delays not attributable to them. • Exit Policy for Private Developers: 2 years from start of operations,
irrespective of date of award of project.
POLICY SUPPORT:
Road projects in India have always been awarded in one of the three formats—BOT annuity, BOT-toll and EPC. • BOT annuity, a developer builds a highway, operates it
for a specified duration and transfers it to the government, which pays the developer annuity over the concession period.
• Under BOT-toll, a concessionaire generates revenue from the toll levied on vehicles using a road.
• In EPC, the developer builds with government money.
Awarding of Road Projects:
HYBRID ANNUITY MODEL announced (2016): • Govt. commits up to 40% of the project cost over a
period and hands over the project to the developer to start road work.
• Revenue collection will be Govt.’s responsibility, while developers will be paid in annual instalments over a period of time.
• HAM gives enough liquidity to the developer and the financial risk is shared by the government.
Highlights of Budget 2017-18 • Budget allocation for highways @ 64,900 crores ($9.7 Bn) in 2017-18. • 2,000 km of coastal connectivity roads identified for development.
MEA-ED 2017
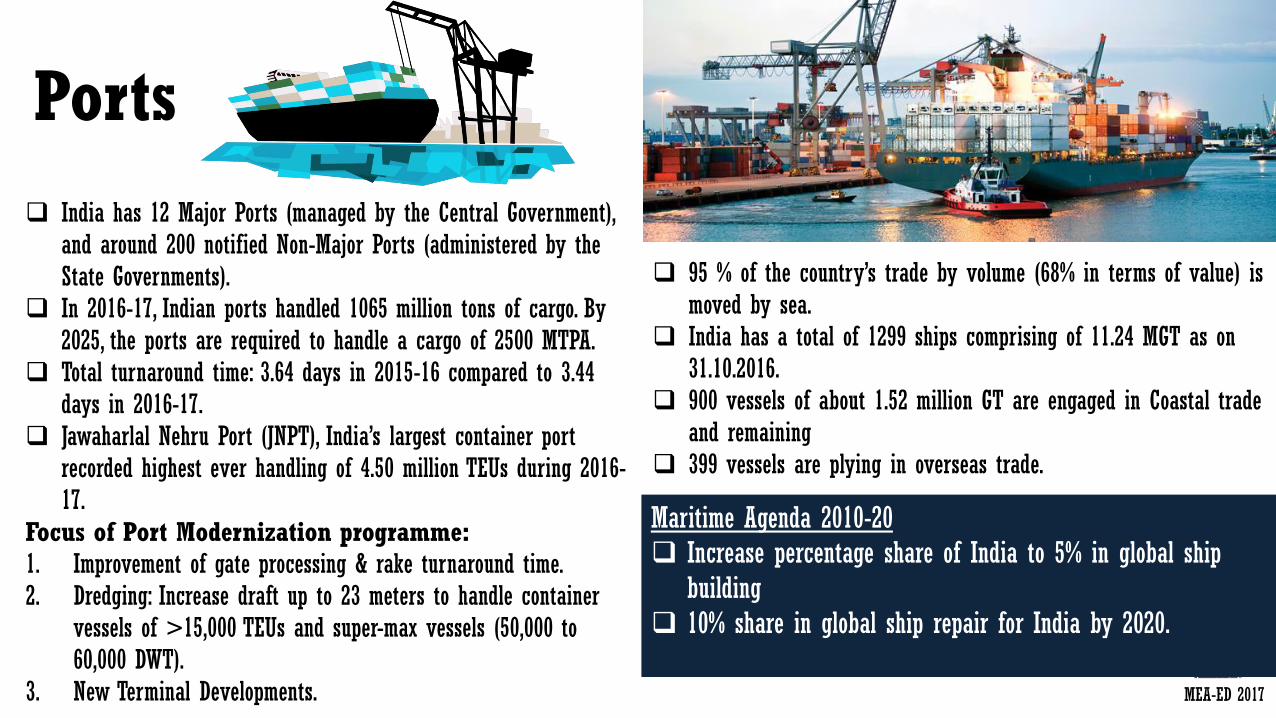
Ports
India has 12 Major Ports (managed by the Central Government), and around 200 notified Non-Major Ports (administered by the State Governments).
In 2016-17, Indian ports handled 1065 million tons of cargo. By 2025, the ports are required to handle a cargo of 2500 MTPA.
Total turnaround time: 3.64 days in 2015-16 compared to 3.44 days in 2016-17.
Jawaharlal Nehru Port (JNPT), India’s largest container port recorded highest ever handling of 4.50 million TEUs during 2016-17.
Focus of Port Modernization programme: 1. Improvement of gate processing & rake turnaround time. 2. Dredging: Increase draft up to 23 meters to handle container
vessels of >15,000 TEUs and super-max vessels (50,000 to 60,000 DWT).
3. New Terminal Developments.
95 % of the country’s trade by volume (68% in terms of value) is moved by sea.
India has a total of 1299 ships comprising of 11.24 MGT as on 31.10.2016.
900 vessels of about 1.52 million GT are engaged in Coastal trade and remaining
399 vessels are plying in overseas trade.
Maritime Agenda 2010-20 Increase percentage share of India to 5% in global ship
building 10% share in global ship repair for India by 2020.
MEA-ED 2017

Sagarmala SAGARMALA project aims at: • Optimizing multi-modal transport to
reduce the cost of domestic cargo, • Minimizing the time and cost of
export-import cargo logistics, • Lowering costs for bulk industries
by locating them closer to the coast, and
• Improving export competitiveness by locating discrete manufacturing clusters near ports.
Time period: 2015-35 415 projects
Budget: US$120 billion
New ports: • 5-6 new ports have been proposed to be built. • Over 40 port-capacity enhancement projects – modern port infrastructure –
mechanization of berths and deepening of drafts to accommodate larger vessels.
Rail-Port connectivity: • Over 80 projects are being planned • Focus: Heavy-haul rail corridor to evacuate large volumes of coal, freight-
friendly expressways to enable efficient movement of containers on key routes, and the development of strategic inland waterways.
Port-led industrialization: • 14 Coastal Economic Zones (CEZs) along the coastline. • Clusters to have industries from the energy, bulk materials as well as discrete
manufacturing segments. Coastal communities: • Developing opportunities for fishermen and other coastal communities as well
as development of the numerous islands along India’s coastline. MEA-ED 2017

Flagship infrastructure Projects:
Bharatmala Project: A 51,000 km road building project that will link Gujarat in the west to Mizoram in the northeast.
Mumbai Trans Harbour Link: $2.7 Billion sea-bridge (22.5 km) to link Mumbai’s eastern suburbs with the mainland.
Bogibeel bridge: India’s longest rail-cum-road bridge - 4.94-km long Bogibeel bridge over Brahmaputra in Assam.
Railway lines in Arunachal Pradesh: Location survey to connect Tawang, Aalo, Pasighat with broad gauge railway networks already started.
Setu Bharatam project: $7.6 billion project aims to build 208 rail over bridges (ROBs) by 2019 ($3.1 Billion) and replace 1,500 bridges of the British era ($4.5 Billion).
Bogibeel Bridge
Mumbai Trans Harbor Link

Chardham-Highway Project: 900 km of national highways will be built at a cost of $1.8 billion in Uttarakhand to improve connectivity to the Char Dham pilgrimage centres in the Himalayas.
Rashtriya Rajmarg Zila Sanjoyokta Pariyojna: 6,600 km of highways at an estimated cost of about $9 Billion to connect 100 of the 676 district headquarters in the country with world-class highways.
Gujarat-Gorakhpur gas pipeline: Indian Oil Corporation (IOC) is laying India’s longest 1987-km LPG pipeline from Kandla coast in Gujarat to Gorakhpur in eastern Uttar Pradesh to carry 3.75 MTPA of LPG.
Bridge on river Chenab: The government is building the tallest bridge in the world over river Chenab at Doda (359 metre above the river) at a cost of $180 Million.
CHARDHAM Highway Project
Chenab Bridge

Urban development
Investment Outlay: • Smart Cities Mission from FY2015-16 to FY2019-20 is
more than US$15 billion.
• Atal Mission for Rejuvenation and Urban Transformation (AMRUT) from FY2015-16 to FY2019-20 is appx. US$7.5 billion
• 100 Smart Cities – Retrofit/Redevelop or build Greenfield cities planned.
• Growing Urbanization~75% of GDP by 2030. • Smart City Mission: Drive economic growth and
improve the quality of life in the country by enabling local area development and harnessing technology
• 60 cities already approved. • Projects that commit at least 30% of the total cost
for low-cost affordable housing ~ exempted from the minimum built-up area and capitalisation requirements.
• 100% FDI in automatic route permitted for operation of townships, malls, and business centres. Floor area restriction and minimum capitalisation removed; easy exit option for foreign investors.
MEA-ED 2017
Gurugram Cyber Hyb

Total Winning Proposals
90
Urban Population Impacted
95 Million
Total Cost of Projects
$28 Billion
Total Area-based development cost
$23 Billion
Total Pan-city solution
$5.5 Billion
For Smart City Tenders Visit: http://smartcities.gov.in/content/
100 Smart Cities Initiative … Progress

Urban development…2 Sector Investment Potential
Smart Energy Implementation of 8 smart grid pilot projects with an investment of US$10 million for energy storage
Power Grid Corporation of India has planned to invest US$ 26 billion in the next 5 years; about 130 million smart meters would be installed by 2021.
Smart Environment The Ministry of Water Resources plans to invest US$ 50 billion in the water sector.
Smart Transportation
Govt. of India has approved a US$4.13 billion plan to spur electric and hybrid vehicle production by setting up an ambitious target of 6 million vehicles by 2020.
Smart ICT Cloud computing is expected to involve into a US$4.5 billion market in India by end-2016. US$333 million allocated to 7 cities (Delhi, Mumbai, Kolkata, Chennai, Ahmedabad, Bengaluru and
Hyderabad) under the Safe City Project.
Smart Building India is expected to emerge as the world’s 3rd largest construction market by 2020 by adding 11.5 million homes every year.
Intelligent Building Management System market estimated to reach US$ 2 billion by end-2016.
MEA-ED 2017

AMRUT
AMRUT envisages urban India’s transformation by focusing on: Water supply. Sewerage facilities and septage
management. Storm water drains to reduce flooding. Pedestrian, non-motorized and public
transport facilities, parking spaces etc. Enhancing amenity value of cities by
creating and upgrading green spaces, parks and recreation centers, especially for children.
• 500 cities selected. • Total estimated outlay: USD7.5 billion till 2019
Water treatment plants, pipelines, metering and grid management solutions, de-silting, ground-water recharge, etc.
Waste management: decentralized underground sewerage networks, sewage treatment plants, waste collection-transport treatment integration, septage cleaning-transport treatment, storm water drainage and reuse, etc.
Urban transportation: Ferry vessels, pathways, skywalks, non-motorised transport, multi-level smart parking, bus rapid transport system, etc.
Green zone components: Landscaping, creating of green infrastructure (parks, ponds, etc.), vertical greening, etc.
Reform implementation would need services like implementation, consulting, monitoring and evaluation services
BUSINESS OPPORTUNITIES Atal Mission for Rejuvenation and Urban Transformation
MEA-ED 2017

Global ~ 13,276 MTOE (Mn. tons oil equivalent) India ~ 724 MTOE…+5.4% over 2015.
Or 5.5% of global annual energy consumption
Coal, 56.70% Oil, 29.30%
Gas, 6.20%
Hydro, 4.01%
Renewables, 2.27%
Nuclear, 1.18%
Energy Mix (2016)
Primary Energy Consumption
Energy intensity (the amount of energy required per unit of GDP) declined by 1.3% in 2016, a slower decline than the 10-year average of 1.6%.
India has 18% of the world’s population…consumes only 6% of the world’s primary energy.
Structural dependence on energy imports Crude Oil Dependency – 82% Gas import dependency – 44%

Oil
Strategic Oil Reserves: Phase-I: Underground rock caverns for storage of 5.33 MT (10.5 days of crude requirement) at Vizag (1.33
MT), Mangalore (1.50 MT) and Padur (2.5 MT) have been created. Phase-2: Two more caverns to be set up in Chandikhole, Odisha & Bikaner, Rajasthan ~ 10 MT each. Phase 1 + Phase 2 = 15.33 MT of Strategic reserve capacity of 63 days of estimated commercial reserve of crude oil, petroleum products and gas in India. MEA-ED 2017
Imports ~ 212.7 MTPA Growth of +7.8% over 2015 3rd largest consumer 4.6% of global consumption.
Domestic Production ~ 41.2 MTPA
Decline of -2.3% over 2015. 0.9% of global production.
Crude Suppliers: Middle East – 61.1% Africa – 19% South America – 16% Russia – 0.1%.
230 MMTPA spread across 23 refineries.
Rise to 310 MMTPA in next few years.
Refining Capacity: Growth in capacity and throughput largest in the world in 2016. Contributed 72% to the net growth in global refining capacity and
57% of global throughput growth.
March 30, 2017: India became an “Associate member of the IEA

To boost domestic oil and gas production, Government of India announced the Hydrocarbon Exploration and Licensing Policy (HELP) on March 10, 2016:
Uniform license: Enabling exploration and
production of all forms of hydrocarbon - conventional as well as unconventional oil and gas resources including CBM, shale gas/oil, tight gas and gas hydrates.
Open acreage policy: To enable E&P companies choose the blocks from the designated area.
Cess and import duty will not be applicable on blocks awarded under the new policy.
Marketing and pricing freedom for the crude oil and natural gas produced.
National Data Depository: Centralized database of geological and hydrocarbon information has been inaugurated in July 2017.
Revenue sharing model Government not concerned with the cost incurred &
will receive a share of the gross revenue from the sale of oil, gas etc.
Lower royalty rates for offshore areas.
MEA-ED 2017

Gas Government Targets: Move towards a gas based economy. Share of natural gas to rise to 15%.
4th largest LNG importer in the world: Sources: Qatar – 61%, Nigeria – 14.7%, Others – 24.3% 2014-1: 18.5 bcm 2015-16: 21.3 bcm 2016-17: 22.4 bcm LPG Imports (2016-17) @ 12 million tonnes Major Suppliers: Qatar, Saudi, and UAE
MEA-ED 2017
India Gas Reserves: 1.2 trillion cubic meters (2015) or 0.7% of global reserves. Reserves to Production (R/P) ratio of 44.4.
India natural gas production (2016): 27.6 billion cubic meters, -6%. …share about 0.8% of global production.
Gas consumption (2016): 50.1 billion cubic meters…growth of 9.2%...share about 1.4% of global natural gas consumption.
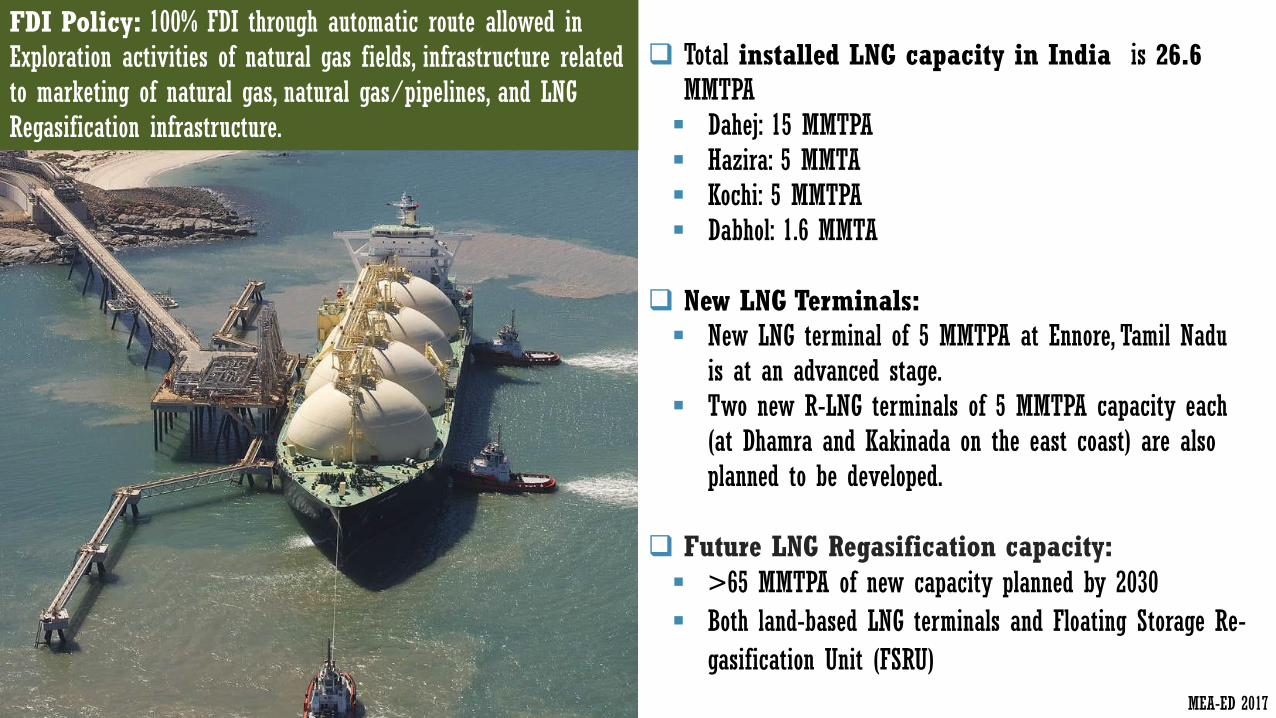
Total installed LNG capacity in India is 26.6 MMTPA Dahej: 15 MMTPA Hazira: 5 MMTA Kochi: 5 MMTPA Dabhol: 1.6 MMTA
New LNG Terminals: New LNG terminal of 5 MMTPA at Ennore, Tamil Nadu
is at an advanced stage. Two new R-LNG terminals of 5 MMTPA capacity each
(at Dhamra and Kakinada on the east coast) are also planned to be developed.
Future LNG Regasification capacity:
>65 MMTPA of new capacity planned by 2030
Both land-based LNG terminals and Floating Storage Re-
gasification Unit (FSRU)
FDI Policy: 100% FDI through automatic route allowed in Exploration activities of natural gas fields, infrastructure related to marketing of natural gas, natural gas/pipelines, and LNG Regasification infrastructure.
MEA-ED 2017

1 May 2016: Pradhan Mantri Ujjwala Yojana (PMUY) Scheme was launched in Balia, Uttar Pradesh.
$1.2 Bn scheme for providing 50 million new LPG connections for BPL families from 2016 to 2019.
How does the Subsidy work? Subsidy of Rs. 1600/- per household covering the security deposit
charges of one cylinder, pressure regulator, hose pipe (1.2 meters), installation charges, and domestic gas consumer card (DGCC) Booklet is given to the Oil Marketing Companies.
Beneficiaries buy the gas stove or the Oil Marketing Companies can finance purchase of LPG stove on installment basis.
12 cylinders (14.2-kg) supplied to each household in a year. Director Benefit Transfer (DBT): 1/3 of the market price of
the LPG cylinder is transferred in advance directly into bank accounts of individuals, who then buys the gas at market rates.
Beneficiaries: June 20, 2017: 23.75 million LPG connections given
Why Free LPG connection to BPL families? Access to clean cooking fuel. Addresses health problems caused by use of traditional
sources of cooking fuel such as fire wood, coal, cow dung, etc. Enhance productivity of woman and raise their quality of life
by removing drudgery associated with collection of wood.
Free LPG scheme

“Give it up” & “Give back” Under the “Give it up” and “Give back” – affluent
consumers who could afford to buy LPG at the market price, were encouraged to give up their entitlement to subsidy.
Over 12 million consumers have given up their LPG subsidy which has helped in ensuring access to LPG connections to the under-privileged people.
LPG coverage in India has now increased to 72%.
USD 6.5 billion of subsidy has been transferred directly to the beneficiaries bank accounts in the last two years. Estimated saving of over USD 3.2 billion in two years to the government.
Benefits of providing 100% access to clean energy: Would impact 6 of the 8 millennium development goals: (1) Eradicate extreme hunger and poverty by increasing
economic potential of women & reducing economic loss due to bad health
(2) Empower our women (3) Reduce child mortality (4) Improve maternal health (5) Ensure environmental sustainability and (6) Combat tuberculosis.
Households with annual incomes of US$15,000 plus no longer eligible for subsidized LPG

Power for All (PFA) 24x7 power to all households, industry, commercial businesses, agriculture
farm holdings, and any other electricity consuming entity by 2018-19.
Integrated Power Development Scheme:
Outlay: $9.8 Billion – smart metering, underground cabling, infrastructure upgrading, GIS substations, IT enablement for energy accounting etc., in urban areas.
Extending Transmission Capacity:
Projects worth $15 Billion initiated in 2015-16.
50,215 Km of transmission lines laid during 2014-16 – 69 Km of circuit laying per day.
128,403 MVA of sub-station capacity added during 2014-16.
Central Govt. scheme to reform State Distribution companies (UDAY): Aimed at taking over the debts of Distribution companies, lowering the cost of debt servicing and improving operational efficiency through infra. augmenting, smart metering, and improved collection efficiency through public participation.

Total Installed Power Capacity: 330 GW
Installed Coal-based capacity: 194 GW…thermal still mainstay.
Peak Demand: 165.2 GW
Issues: Coal Supply; T&D Losses; and poor health of Power Utilities.
Efforts being made to adopt HELE technologies – SC, ASC, USC, AUSC, Coal Liquefaction, Coal Gasification, Carbon Capture & Utilization to keep carbon-dioxide intensity as low as possible.
41 GW of Supercritical capacity installed…46 GW under construction.
Thermal capacity addition after 2018 will mandatorily use Supercritical technology… 3 GW of inefficient thermal capacity has been retired.
From 2027 all new thermal fleet will be Ultra Super Critical.
Indigenous Research ongoing to develop Advanced Ultra Super Critical Technology (Steam parameters: 300 kg/cm2 pressure and temperature of 700°C.)
MEA-ED 2017
Role of Coal
Coal remains the dominant fuel, accounting for 57% of India’s energy
consumption.
India’s coal consumption fell to nearly half the 10-
year average to only 15 mtoe…despite this share
in global consumption rose to 11% in 2016.
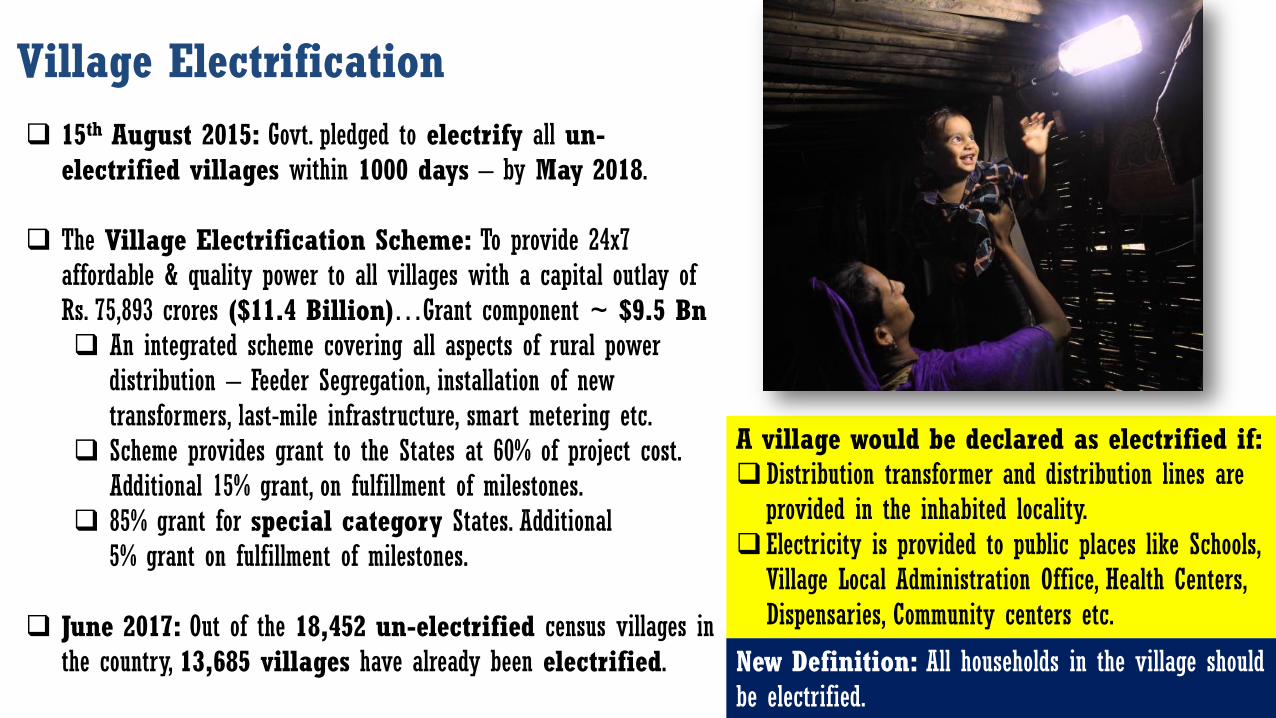
A village would be declared as electrified if: Distribution transformer and distribution lines are
provided in the inhabited locality. Electricity is provided to public places like Schools,
Village Local Administration Office, Health Centers, Dispensaries, Community centers etc.
15th August 2015: Govt. pledged to electrify all un-electrified villages within 1000 days – by May 2018.
The Village Electrification Scheme: To provide 24x7 affordable & quality power to all villages with a capital outlay of Rs. 75,893 crores ($11.4 Billion)…Grant component ~ $9.5 Bn An integrated scheme covering all aspects of rural power
distribution – Feeder Segregation, installation of new transformers, last-mile infrastructure, smart metering etc.
Scheme provides grant to the States at 60% of project cost. Additional 15% grant, on fulfillment of milestones.
85% grant for special category States. Additional 5% grant on fulfillment of milestones.
June 2017: Out of the 18,452 un-electrified census villages in
the country, 13,685 villages have already been electrified. New Definition: All households in the village should be electrified.
Village Electrification
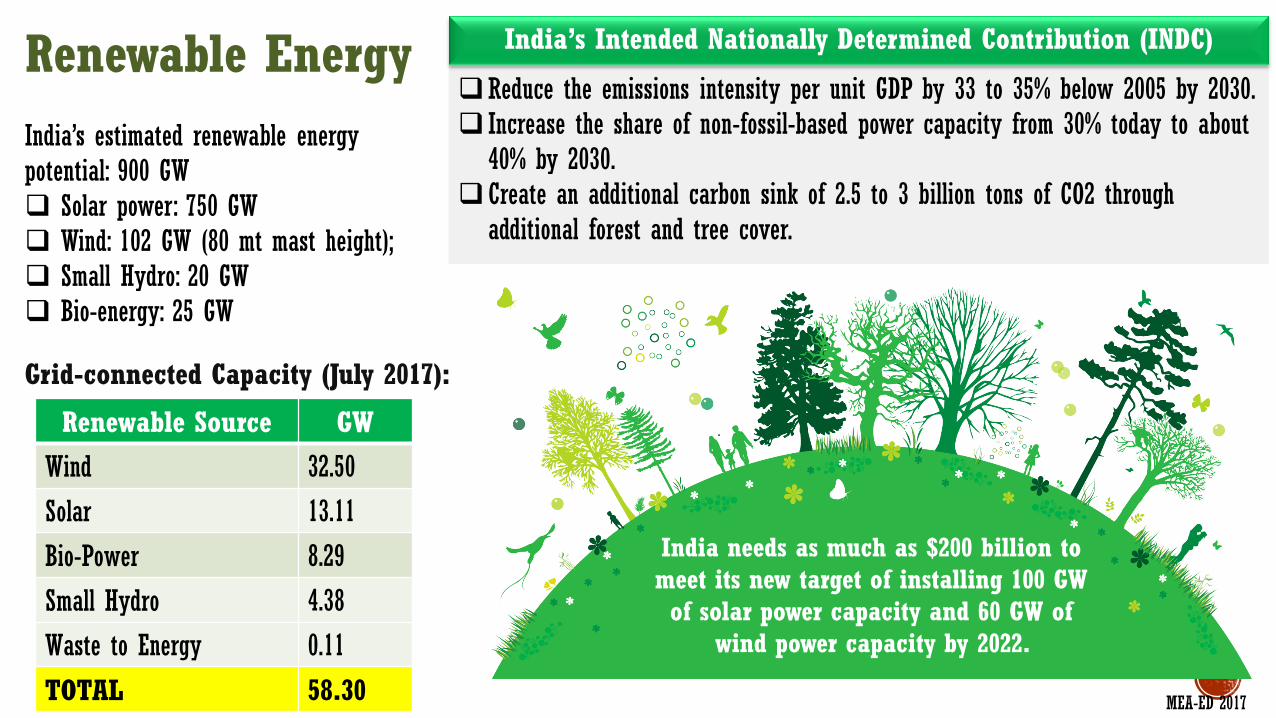
Renewable Energy
Grid-connected Capacity (July 2017):
Renewable Source GW
Wind 32.50
Solar 13.11
Bio-Power 8.29
Small Hydro 4.38
Waste to Energy 0.11
TOTAL 58.30
Reduce the emissions intensity per unit GDP by 33 to 35% below 2005 by 2030. Increase the share of non-fossil-based power capacity from 30% today to about
40% by 2030. Create an additional carbon sink of 2.5 to 3 billion tons of CO2 through
additional forest and tree cover.
India’s Intended Nationally Determined Contribution (INDC)
India needs as much as $200 billion to meet its new target of installing 100 GW of solar power capacity and 60 GW of
wind power capacity by 2022.
India’s estimated renewable energy potential: 900 GW Solar power: 750 GW Wind: 102 GW (80 mt mast height); Small Hydro: 20 GW Bio-energy: 25 GW
MEA-ED 2017
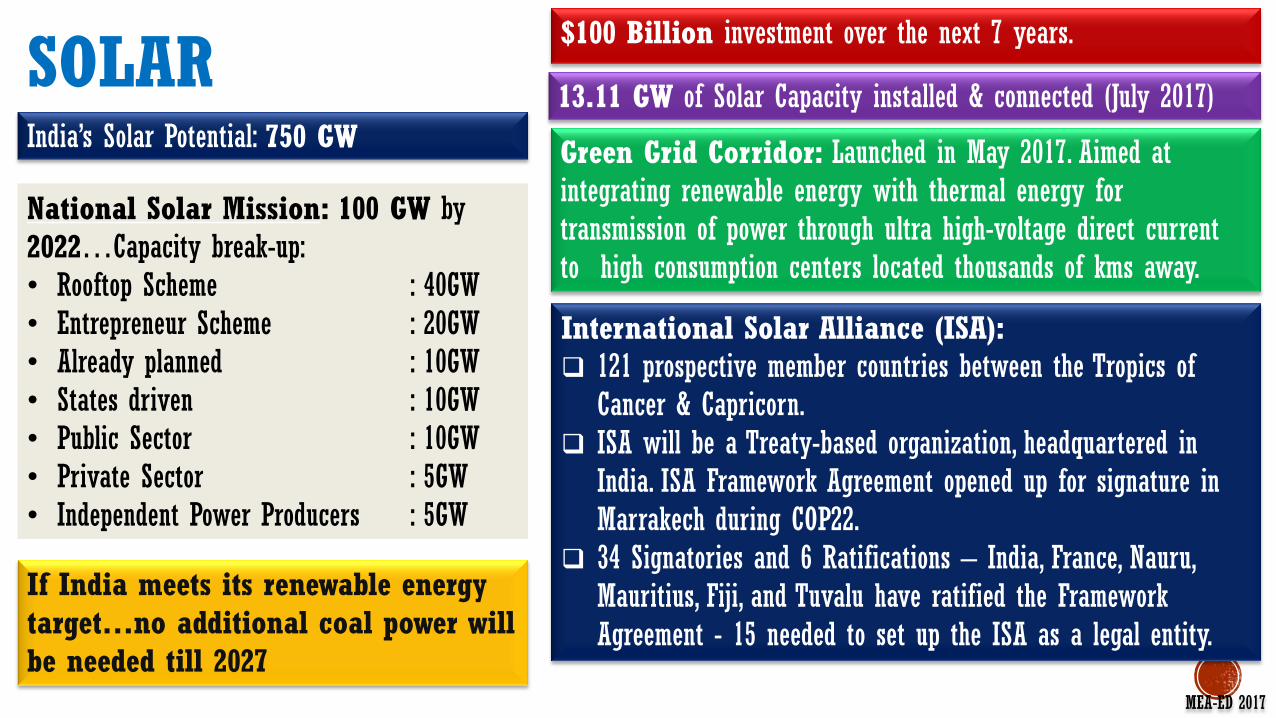
SOLAR
National Solar Mission: 100 GW by 2022…Capacity break-up: • Rooftop Scheme : 40GW
• Entrepreneur Scheme : 20GW
• Already planned : 10GW
• States driven : 10GW
• Public Sector : 10GW
• Private Sector : 5GW
• Independent Power Producers : 5GW
$100 Billion investment over the next 7 years.
India’s Solar Potential: 750 GW
MEA-ED 2017
13.11 GW of Solar Capacity installed & connected (July 2017)
International Solar Alliance (ISA): 121 prospective member countries between the Tropics of
Cancer & Capricorn. ISA will be a Treaty-based organization, headquartered in
India. ISA Framework Agreement opened up for signature in Marrakech during COP22.
34 Signatories and 6 Ratifications – India, France, Nauru, Mauritius, Fiji, and Tuvalu have ratified the Framework Agreement - 15 needed to set up the ISA as a legal entity.
If India meets its renewable energy target…no additional coal power will be needed till 2027
Green Grid Corridor: Launched in May 2017. Aimed at integrating renewable energy with thermal energy for transmission of power through ultra high-voltage direct current to high consumption centers located thousands of kms away.
17.9 15
12.96 8.79
8.3 6.4 6 5.17 4.34
2.62
2008 2009 2010 2011 2012 2013 2014 2015 2016 2017
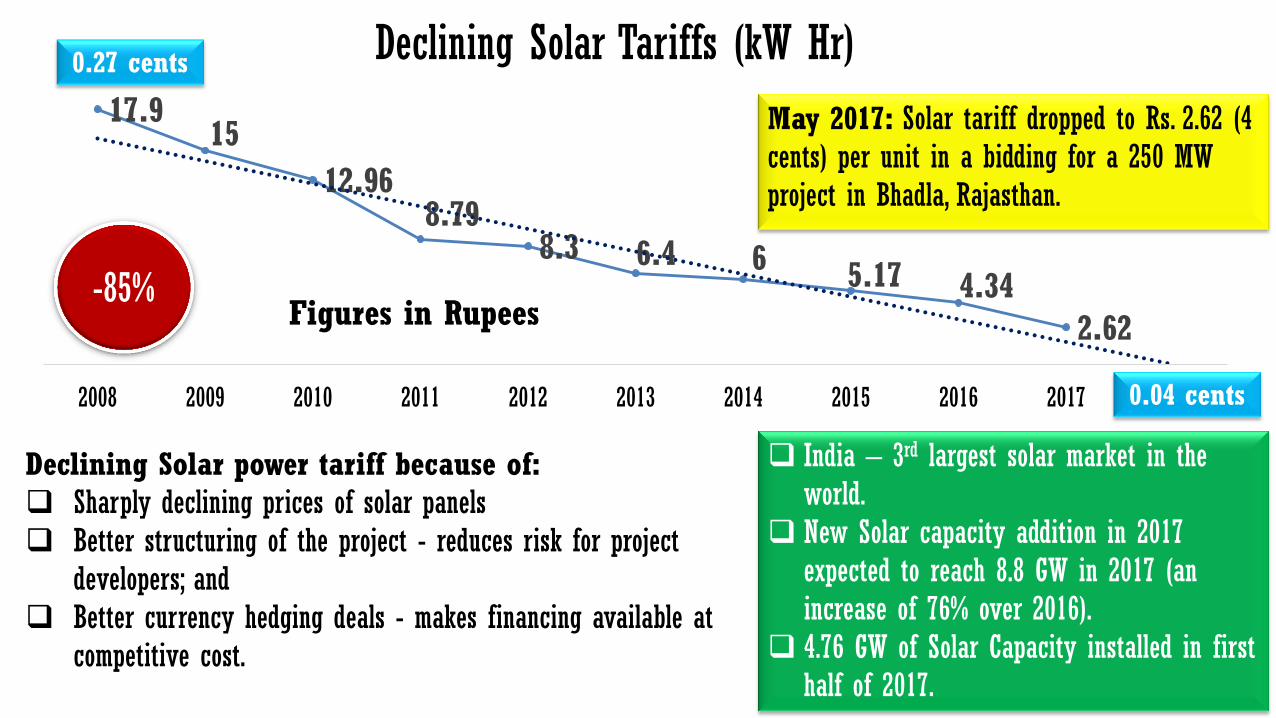
India – 3rd largest solar market in the world.
New Solar capacity addition in 2017 expected to reach 8.8 GW in 2017 (an increase of 76% over 2016).
4.76 GW of Solar Capacity installed in first half of 2017.
Declining Solar Tariffs (kW Hr)
Figures in Rupees -85%
Declining Solar power tariff because of: Sharply declining prices of solar panels Better structuring of the project - reduces risk for project
developers; and Better currency hedging deals - makes financing available at
competitive cost.
May 2017: Solar tariff dropped to Rs. 2.62 (4 cents) per unit in a bidding for a 250 MW project in Bhadla, Rajasthan.
0.27 cents
0.04 cents

SOLAR…3 Majority of Indian projects adopted
crystalline silicon technology, with an average efficiency of 16-17%.
India has 2.9GW of cell and 5.2GW of module production capacity.
Photo-Voltaic industry dependent on imports of critical raw materials and components.
Low capacity to manufacture silicon material & solar thermal.
Opportunity for Manufacture: Concentrator collectors, receivers,
crystalline silicon technology components etc.
Off-grid technologies: Micro grids of 150 watts (powering 20 households) to 5 kilo watt (40 households and commercial use like water pumps) in villages; lanterns, street lighting; refrigeration etc.
• 100% FDI for solar cell manufacture. • 10-year tax-holiday for solar projects. • Viability Gap Funding. • Accelerated depreciation @40% within first 2 years of commercial operation.
• Exemption from Open Access Charges, Wheeling & Banking Charges etc.
• Developers get a fixed sum per unit energy generated in addition to tariff.
• No Excise Duty for RE generation components.
• Customs Duty @ 5% for selected components of RE generation power projects.
• 30% subsidy for off-grid PV & Solar Thermal.
• Payment Security Mechanism to cover defaults by state utilities/distribution companies.
Solar Business Models in India:
Policy Support:
• Feed-in-tariff: Developers sign a PPA at fixed tariffs.
• Renewable Energy Certificates. • Open Access – Developer supplies to
any 3rd party at negotiated rates. • Captive & Group Captive: Consumers
offtake the majority of the output from the captive & own at least 26% of equity.
• Sites & Parks - Developer develops the infrastructure and charges a rental fee from users.
MEA-ED 2017
Current status of manufacturing:
RE-Invest: The second edition of the biennial Renewable Energy Investors Meet & Expo, will be held from 7 – 9 December 2017 at Greater Noida, India.

WIND National Offshore Wind Energy Policy, 2015 (NOWEP) Guidelines allow for setting up offshore wind farms within territorial waters
that extend up to 200 nautical miles from the coastal baselines of India. NIWE will allocate the blocks to the project developers through an open
international competitive bidding process. NIWE will give single window clearance. Environmental Impact Assessment, oceanographic surveys, environmental audit
etc. to be done before the blocks of offshore wind energy can be demarcated. Policy Support: Raw material used in manufacturing of wind turbine generators have been
exempted from the Special Additional Duty of 4%. No excise duty and Customs duty @ 5% on import of forged steel rings used
in the manufacture of bearings used in wind operated electricity generators. Accelerated depreciation (AD) @40% (to save income tax) and Generation
Based Incentive (GBI) Scheme: 50 paise per kWhr of electricity generated for at least 4 years and up to 10 years. Incentive will stop once pay-out reaches INR 1 crore (US$ 163,000) per MW of capacity. Scheme ends 2017. Companies can opt either for AD or GBI, but not both.
The tax on coal for the National Clean Energy Fund (NCEF) doubled to Rs. 400 per ton. NCEF is used for supporting research and clean energy technology solutions.
Facts: Accord. To National Institute of Wind Energy (NIWE)
India’s installable wind energy potential is 102 GW @ 80 metre height & 302 GW with towers of a height of 100 metres.
India ranks No.4 in terms of installation capacity after China, the US and Germany. Installed Capacity: 32.5 GW (July 2017)
New Capacity Installation Target: 60 GW by 2022. Domestic wind manufacturing capacity: 10,000 MW
Turbine suppliers: Gamesa, Suzlon, Inox, Regen, Wind World, LM Wind and Senvion.
Grid integration challenges: Green Corridor programme: Objective is to
improve linkage between India’s regional (southern) grids with its national grid.
This will facilitate interstate transmission.
MEA-ED 2017

Standards & Labelling
Bureau of Energy Efficiency initiated the S&L program for Equipment and Appliances in 2006.
The Scheme invoked for 21 appliances…8 have been notified under mandatory labelling since 2010.
India’s Bureau of Energy Efficiency has designed the Super Efficient Equipment Program (SEEP) to bring accelerated transformation for super-efficient appliances by providing financial stimulus innovatively at critical points of intervention.
Sets minimum energy standards for new commercial buildings having a connected load of 100 kW or contract demand of 120 KVA and above.
Currently, 8 States and Union Territories have notified and adopted the code.
Bureau of Energy Efficiency has also developed a voluntary Star-Rating Program based on the actual performance of a building for 4 categories of buildings – Residential, Commercial, Hospitality, and Retail.
Energy Conservation Building Code (ECBC)

CONSTRUCTION
Each phase of construction development project will be considered as a separate project for the purposes of FDI.
A foreign investor will be permitted to exit and repatriate foreign investment before the completion of project under automatic route, subject to a lock-in-period of three years.
Lock-in period will not apply for FDI into hotels and resorts, hospitals, SEZs, educational institutions, old age homes and NRI investments.
FDI is not permitted in an entity which is engaged or proposes to engage in real estate business, construction of farm houses and trading in transferable development rights (TDRs).
Budget 2017-18: Affordable housing will be given ―infrastructure‖ status…enabling low-cost housing to avail associated benefits.
100% FDI by automatic route is allowed in construction development of the following: Townships Roads & Bridges Residential & Commercial premises Hotels & resorts Hospitals Educational institutions Recreational facilities City and regional level infrastructure.
ED 2017
MEA-ED 2017

Textiles & Garments • Textiles contribute 5% to GDP; 14% to overall Index of
Industrial Production (IIP) and 15% to exports. • 2nd largest employer after agriculture ~ employs over 45
million people directly and 60 million indirectly. • 2nd largest producer of textiles and garments in the world. • Availability of complete value chain – from fibre to fashion. • 1st in global jute & cotton production; and 2nd largest producer
of silk & manmade fibres. • India accounts for almost 24% of the world’s spindle capacity
and 8% of global rotor capacity. • 100% FDI allowed in Textiles. • 60%+ of textile & garments exported to the U.S. and EU. • India has FTA with ASEAN • Current market size is $127 Billion (Domestic~$87 Billion and
Exports~$40 Billion)…expected to grow to $223 Billion by 2021.
• Global textile/garment sourcing houses have offices in India.
• Govt. of India approved a Rs 6,000 crore (US$900 million) package for textiles and apparel sector with an aim to create 10 million new jobs in three years and attract investments of $11 billion with an eye on $30 billion in exports.
• Technology Upgradation Fund Scheme (TUFS): Rolled out in Jan 2016 with a budget provision of Rs.17,822 crores ($2.3 Billion) for the next 7 years; expected to attract an investment of Rs. 1 lakh crore ($15 Billion) and generate 3 million jobs.
• Apparel and Garment Centres set up in all the 8 North Eastern States to promote entrepreneurship in apparel manufacturing and provide employment to the local population
• Integrated Processing Development Scheme rolled out to provide up to 50% assistance for Common Effluent Treatment Plants with Zero Liquid Discharge system, subject to a ceiling of Rs.75 crore; six projects sanctioned to support processing clusters. MEA-ED 2017

• Market size for textile machinery sub-sector is Rs 12,308 crore (appx. $1.8 Billion).
• The sector has been growing at 5.1% p.a over last 3 years. • Production, currently at Rs 6,960 Cr (appx. $1 Billion) has
grown by 9.6% p.a. • Import constitutes a significant portion of total demand at
63%; also 35% of total production is exported.
WEAVING • Shuttleless looms (rapier >400 rpm; air jet > 800 rpm; water
jet > 800 rpm) KNITTING • High speed circular knitting machinery (Micro -processors) • Warp knitting PROCESSING • Environmentally sustainable processing, • High speed wide width processing and • Special purpose processing and finishing machinery (e.g.
plasma-finishing) INDUSTRIAL STICHING • Hi-tech industrial stitching/sewing machinery (lockstitch, over-
lock, Cover stitch, bar tacking, pocket set, button holes, etc.)
Technology Gaps in India Textile Machinery
MEA-ED 2017

Space ISRO: Indian Space Research Organization (Est.
1969) is headquartered in Bengaluru. Vision: "harness space technology for national development".
ANTRIX: Commercial arm of ISRO. Provides launch services for satellites on-board ISRO’s launch vehicles - Polar Satellite Launch Vehicle (PSLV) and Geo-Synchronous Satellite Launch Vehicle (GSLV).
MEA-ED 2017
Feb 15, 2017: Launched 104 satellites in one go using PSLV… Of the 104 satellites, 101 belong to foreign countries – 96 from U.S. and one each from Israel, Kazakhstan, the Netherlands, and Switzerland.
June 05, 2017: Launched the GSLV-MK III rocket with a capability to carry payloads of up to 4 Tons into the Geostationary orbit or up to 10 Tons into the Low Earth Orbit.
Pathbreaking 2017 Launches:
GSLV-MK 3

1960s: Beginning of the Indian space program. 1975: Launched 1st satellite –ARYABHATTA. 2008/09 Chandrayaan-1: India’s 1st unmanned
moon mission carried the Moon Impact Probe payload and made the discovery of water on the moon.
2014: 1st country to reach Mars in its 1st attempt. 2014: Successfully tested the “crew module”
aboard the GSLV MK3. May 2016: Successfully tested the Reusable Launch
Vehicle-Technology Demonstrator (RLV-TD). June 22, 2016: ISRO launched 20 satellites in one
mission. Aug 2016: ISRO successfully tested the indigenously
developed Scram Set (or air breathing) engine.. The engine will be used to power India’s Reusable Launch Vehicle at hypersonic speed.
April 2016: India completed launching 7 satellites as part of the Indian Regional Navigation Satellite System to offer GPS services.
RLV-TD
MEA-ED 2017

• 4th largest defence spender @ US$ 50.7Bn (2016-17)…estimated to reach US$ 64Bn by 2020.
• 36% of defence spend assigned to capital acquisitions. • Only 25% of defence equipment is manufactured in India.
Defence Production – Self reliance • All naval ships & submarines are being built in India. • 75% of the total acquisition orders of the Indian Army are
with Indian firms. • Examples: Tejas LCA; Naval Warships – INS Kochi & INS
Kolkata; Submarine – INS Kalvari; Akash Missile System; HTT40 – Basic Trainer aircraft; Dhanush-155mm/45 calibre artillery gun system etc.
New Defence Deals concluded: • 36 Rafale jets – Deliveries between Sept 2019 to Apr
2022 – Provision for offsets ~50% of value. • 2 Phalcon/IL-76 AWACS valued and 10 Heron TP UAVs.
Defence Procurement Policy – DPP 2016 • Highest preference for Indigenous Designed Developed
and Manufactured (IDDM) equipment. • Sourcing Norms: 60% to be locally sourced if design not
Indian; and 40% local content if design is Indian. • Offsets policy liberalized for foreign vendors: Obligation
to invest at least 30% of the contract value in India will kick in at Rs.2,000 crore, a significant increase from the (previously @ Rs.300-crore)
• Special focus on MSMEs, and on ―Make in India‖. • 10% weightage for superior technology, instead of
selecting the lowest bidder only in financial terms.
Defence
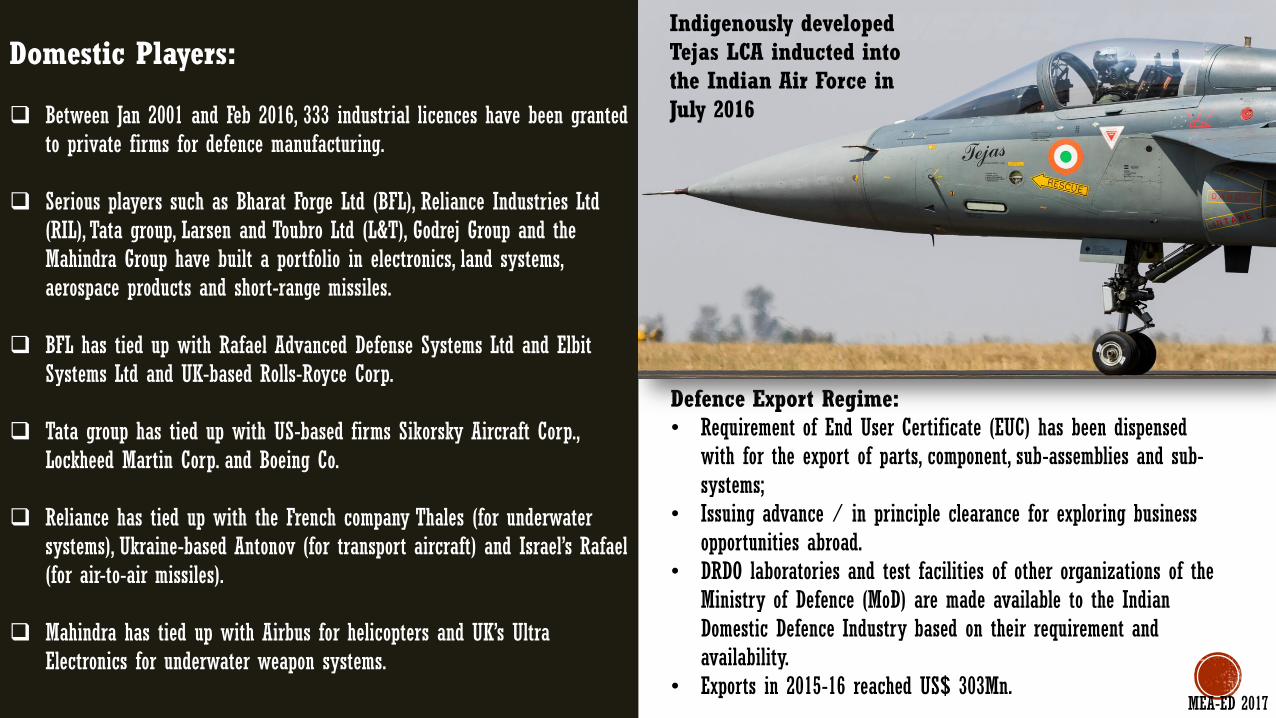
Domestic Players:
Between Jan 2001 and Feb 2016, 333 industrial licences have been granted to private firms for defence manufacturing.
Serious players such as Bharat Forge Ltd (BFL), Reliance Industries Ltd (RIL), Tata group, Larsen and Toubro Ltd (L&T), Godrej Group and the Mahindra Group have built a portfolio in electronics, land systems, aerospace products and short-range missiles.
BFL has tied up with Rafael Advanced Defense Systems Ltd and Elbit Systems Ltd and UK-based Rolls-Royce Corp.
Tata group has tied up with US-based firms Sikorsky Aircraft Corp., Lockheed Martin Corp. and Boeing Co.
Reliance has tied up with the French company Thales (for underwater systems), Ukraine-based Antonov (for transport aircraft) and Israel’s Rafael (for air-to-air missiles).
Mahindra has tied up with Airbus for helicopters and UK’s Ultra Electronics for underwater weapon systems.
Defence Export Regime: • Requirement of End User Certificate (EUC) has been dispensed
with for the export of parts, component, sub-assemblies and sub-systems;
• Issuing advance / in principle clearance for exploring business opportunities abroad.
• DRDO laboratories and test facilities of other organizations of the Ministry of Defence (MoD) are made available to the Indian Domestic Defence Industry based on their requirement and availability.
• Exports in 2015-16 reached US$ 303Mn.
Indigenously developed Tejas LCA inducted into the Indian Air Force in July 2016
MEA-ED 2017

Growth Drivers: Growing economy and rising disposable incomes. Increased competition among airlines, especially among low-cost carriers. Fall in prices of Aviation Turbine Fuel. Rise tourism flows – E-visa scheme extended to 150 countries. Modern airports, and greater use of technology.
New Civil Aviation Policy 2016: Airlines can commence international operations provided they deploy 20
aircraft or 20% of total capacity, whichever is higher. Open Skies Policy for SAARC and countries beyond 5000 km from Delhi. Focus on Regional Connectivity.
9th largest aviation market in the world with a market size of US$ 16 Billion...3rd largest by 2020.
Highest passenger traffic growth rate in the world. : 2016 Passenger Traffic: 99 Mn (+23.8%) Jan-Jun 2017 Passenger Traffic: 57 Mn (+18%)
Combined fleet size of all airlines about 430 planes...Airbus and Boeing estimate India will need 1,610 and 1,740 jets, respectively, over the next 20 years.
Only 75 airports in the country have a scheduled airline service. There are 350 unused airstrips – reviving these airports are high on government agenda.
Govt. is planning to invest around $120 Billion in airport infrastructure and aviation navigation services over the next decade.
UDAN or Regional Connectivity Scheme Operationalized: Flights cover distances of up to 800 km through a market-based mechanism. 43 cities are expected to be connected. Fares capped @ Rs. 2,500 ($40) per seat per hour. Five airlines — Alliance Air, SpiceJet, Turbo Megha, Air Odisha and Air Deccan —
were awarded 128 routes under the scheme. MEA-ED 2017
Civil Aviation

Liberalized FDI Policy: 100% FDI through automatic route in greenfield airports. 100% FDI in brownfield – automatic route up to 74% and government
route beyond 74%. 49% FDI through automatic route in Scheduled Air Transport /
Domestic Passenger Airline...100% for NRIs. 100% FDI through automatic route in non-scheduled air transport
service 100% FDI through automatic route in Helicopter / Seaplane services. 100% FDI through automatic route in MRO operations, flying training
institutes, and technical training institutions. 100% FDI through automatic route in Ground Handling Operations.
NEW MRO POLICY: Tools and tool-kits used by the MRO have been exempted
from Customs and Excise duty. Restriction of one year for utilisation of duty free parts
removed. Import of unserviceable parts by MROs for providing
exchange / advance exchange allowed. Foreign aircraft brought to India for MRO work will be
allowed to stay up to 6 months or as extended by the Directorate General of Civil Aviation (DGCA). The aircraft can carry passengers in the flights at the beginning and end of the stay period in India.
MRO business opportunity: • The Maintenance, Repair and Overhauling (MRO) business
of Indian carriers is around US$ 750Mn;
• 90% of Indian airplanes are serviced outside India – in Sri Lanka, Singapore, Malaysia, UAE etc.
MEA-ED 2017
Civil Aviation…MRO business
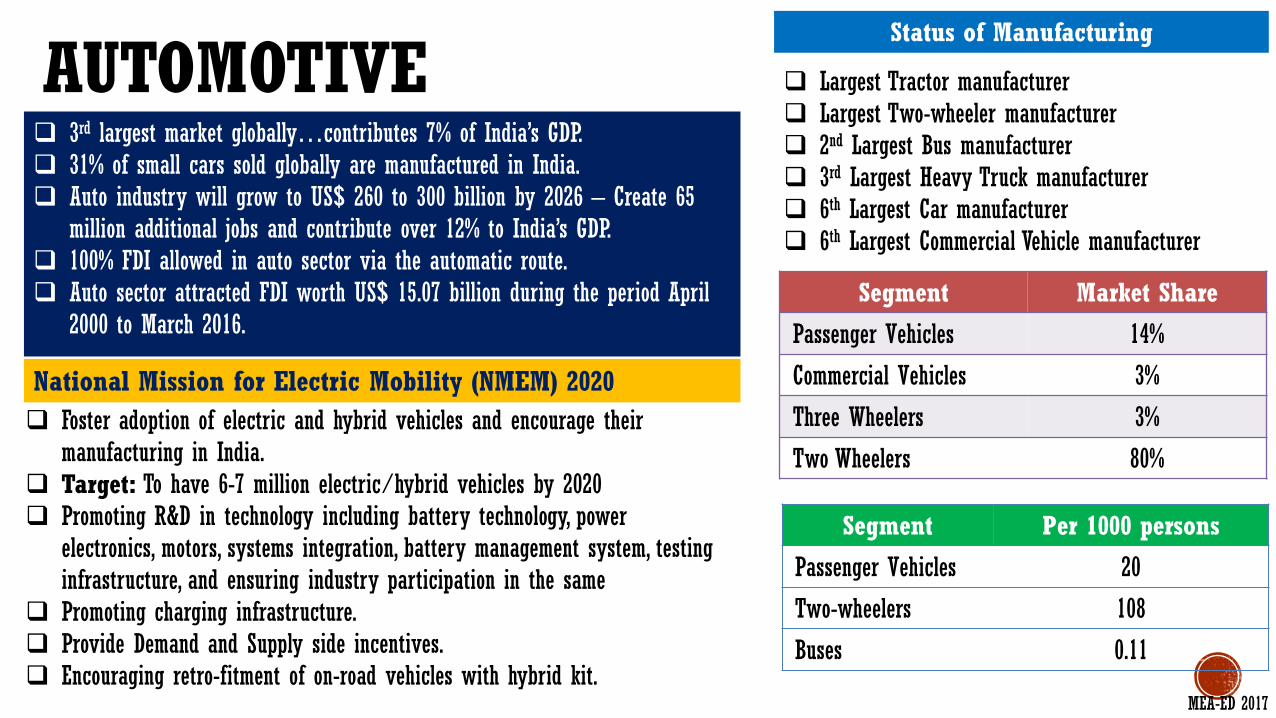
AUTOMOTIVE 3rd largest market globally…contributes 7% of India’s GDP. 31% of small cars sold globally are manufactured in India. Auto industry will grow to US$ 260 to 300 billion by 2026 – Create 65
million additional jobs and contribute over 12% to India’s GDP. 100% FDI allowed in auto sector via the automatic route. Auto sector attracted FDI worth US$ 15.07 billion during the period April
2000 to March 2016.
MEA-ED 2017
Largest Tractor manufacturer Largest Two-wheeler manufacturer 2nd Largest Bus manufacturer 3rd Largest Heavy Truck manufacturer 6th Largest Car manufacturer 6th Largest Commercial Vehicle manufacturer
Segment Market Share
Passenger Vehicles 14%
Commercial Vehicles 3%
Three Wheelers 3%
Two Wheelers 80%
Segment Per 1000 persons
Passenger Vehicles 20
Two-wheelers 108
Buses 0.11
Foster adoption of electric and hybrid vehicles and encourage their manufacturing in India.
Target: To have 6-7 million electric/hybrid vehicles by 2020 Promoting R&D in technology including battery technology, power
electronics, motors, systems integration, battery management system, testing infrastructure, and ensuring industry participation in the same
Promoting charging infrastructure. Provide Demand and Supply side incentives. Encouraging retro-fitment of on-road vehicles with hybrid kit.
National Mission for Electric Mobility (NMEM) 2020
Status of Manufacturing

Auto Clusters
West
North
East
South
Bajaj Auto Fiat Force Motors GM John Deere Mahindra Suzuki Ford
Honda Motorcycle Mercedes Benz Skoda Tata Hitachi Tata Motors Volkswagen Volvo Eicher
Illustrative list of manufacturing facilities of Indian and Global OEMs
Eicher Escorts Hero Motor Honda Motorcycle Honda Cars ICML JCB Maruti Suzuki
Mahindra Mazda New Holland Suzuki Motorcycles Tata Motors Yamaha
Cities: Delhi, Gurgaon, Noida, Ghaziabad, Ludhiana, Haridwar
Cities: Baroda, Halol, Sanand, Mumbai, Pune, Nashik, Aurangabad.
Tata Cummins Tata Motors
City: Kolkata
Ashok Leyland BMW Caterpillar Daimler Ford Hyundai Nissan Renault
Royal Enfield Same Deutz TAFE Tata Motors Toyota Kirloskar TVS Volvo Buses
Cities: Chennai, Hosur, Bengaluru

Automotive Sector…2
Turnover: US$ 39 Billion Contribution to GDP: 3.5-4% Component Exports: US$10.81 billion Domestic Aftermarket: US$6.8 billion Direct Employment: 1.50 million
Auto Component Industry (2016-17)
Auto Component Export Destinations (%)
USA 25 Thailand 3.18
Germany 6.96 UAE 3.15
Turkey 6.22 France 2.99
UK 5.43 Brazil 2.62
Italy 3.86 Mexico 2.59
Industry fast embracing modern shop-floor practices: Kaizen, TQM, TPM, 6 Sigma, Lean Manufacturing etc.
Achieve top-line of US$ 260-300 billion
Increase export intensity to 35 - 40% Attract investments of US$ 70 - 90 billion over next 10 yrs. Provide incremental employment to 65 million persons Foster the promotion of “Brand India” by developing a
sophisticated ecosystem of research, design, engineering and manufacturing that is conducive for a variety of players - both mass market and niche seekers.
To rank within the top three of the world in engineering, manufacture and export of vehicles and components
Harmonisation: Clear roadmap to adhere to 1998 Agreement of UN Global Technical Regulations (WP.29)
Fuel Efficiency: Define roadmap for all categories of vehicles Road Safety: Reduction in accidents and fatalities as per norms
specified in Road Transport & Safety Bill.
Automotive Mission Plan 2026
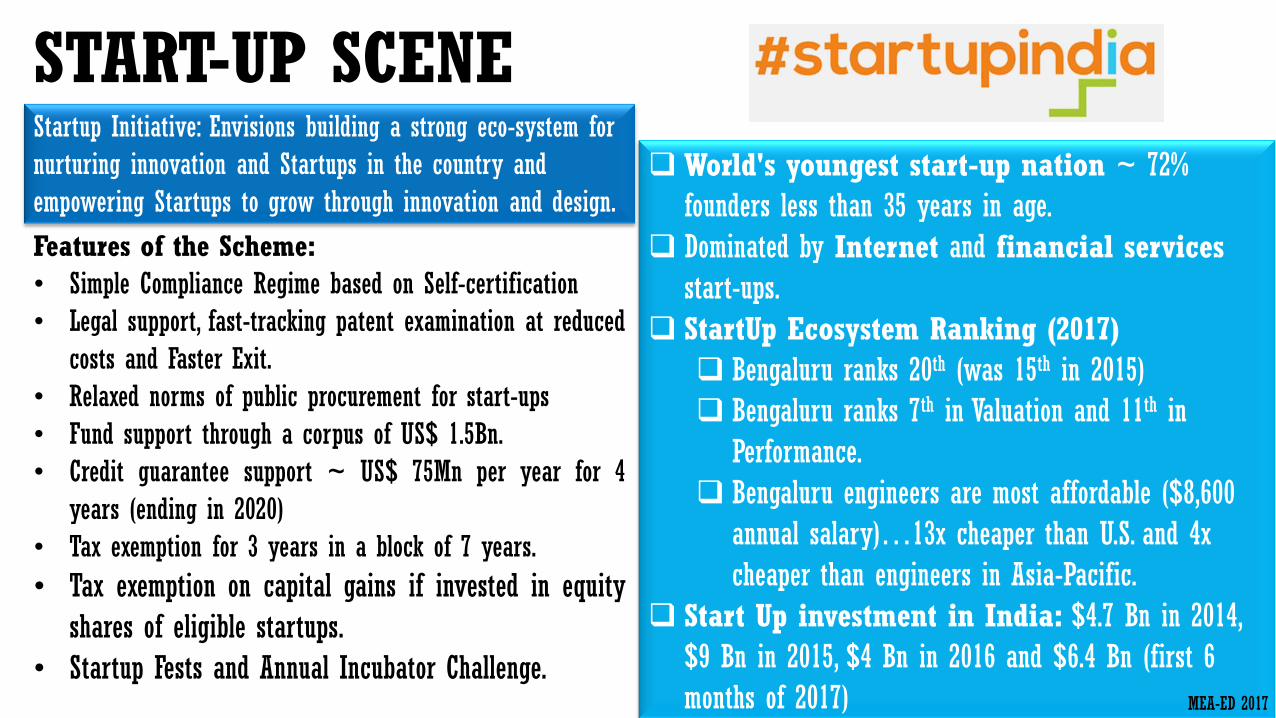
START-UP SCENE
World's youngest start-up nation ~ 72%
founders less than 35 years in age.
Dominated by Internet and financial services
start-ups.
StartUp Ecosystem Ranking (2017)
Bengaluru ranks 20th (was 15th in 2015)
Bengaluru ranks 7th in Valuation and 11th in
Performance.
Bengaluru engineers are most affordable ($8,600
annual salary)…13x cheaper than U.S. and 4x
cheaper than engineers in Asia-Pacific.
Start Up investment in India: $4.7 Bn in 2014,
$9 Bn in 2015, $4 Bn in 2016 and $6.4 Bn (first 6
months of 2017)
Startup Initiative: Envisions building a strong eco-system for
nurturing innovation and Startups in the country and
empowering Startups to grow through innovation and design.
Features of the Scheme:
• Simple Compliance Regime based on Self-certification
• Legal support, fast-tracking patent examination at reduced
costs and Faster Exit.
• Relaxed norms of public procurement for start-ups
• Fund support through a corpus of US$ 1.5Bn.
• Credit guarantee support ~ US$ 75Mn per year for 4
years (ending in 2020)
• Tax exemption for 3 years in a block of 7 years.
• Tax exemption on capital gains if invested in equity
shares of eligible startups.
• Startup Fests and Annual Incubator Challenge.
MEA-ED 2017
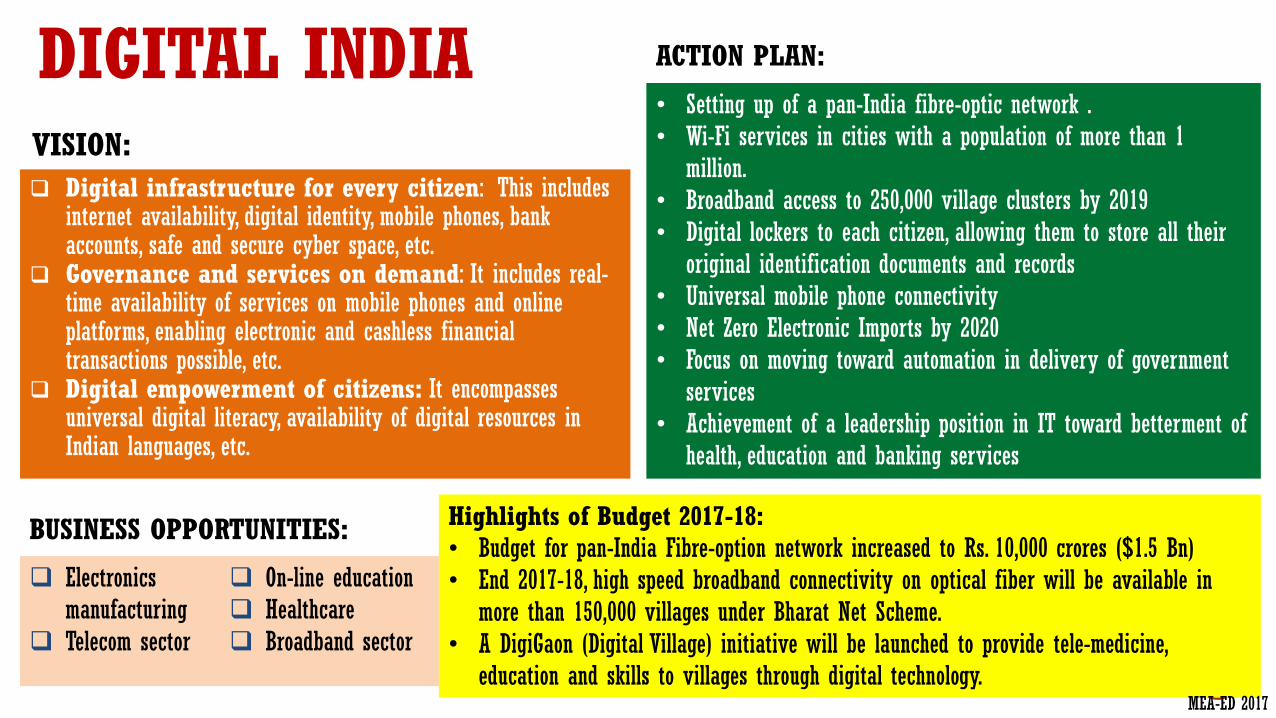
DIGITAL INDIA
Digital infrastructure for every citizen: This includes internet availability, digital identity, mobile phones, bank accounts, safe and secure cyber space, etc.
Governance and services on demand: It includes real-time availability of services on mobile phones and online platforms, enabling electronic and cashless financial transactions possible, etc.
Digital empowerment of citizens: It encompasses universal digital literacy, availability of digital resources in Indian languages, etc.
ACTION PLAN:
• Setting up of a pan-India fibre-optic network . • Wi-Fi services in cities with a population of more than 1
million. • Broadband access to 250,000 village clusters by 2019 • Digital lockers to each citizen, allowing them to store all their
original identification documents and records • Universal mobile phone connectivity • Net Zero Electronic Imports by 2020 • Focus on moving toward automation in delivery of government
services • Achievement of a leadership position in IT toward betterment of
health, education and banking services
VISION:
Electronics manufacturing
Telecom sector
On-line education Healthcare Broadband sector
BUSINESS OPPORTUNITIES: Highlights of Budget 2017-18: • Budget for pan-India Fibre-option network increased to Rs. 10,000 crores ($1.5 Bn) • End 2017-18, high speed broadband connectivity on optical fiber will be available in
more than 150,000 villages under Bharat Net Scheme. • A DigiGaon (Digital Village) initiative will be launched to provide tele-medicine,
education and skills to villages through digital technology. MEA-ED 2017

DEMONETIZATION Nov 8, 2016: Demonetisation of high denomination bank notes (Rs. 500 and Rs. 1000) announced. Reasons for Demonetization: Rampant Tax evasion. Bred a parallel economy; unacceptable for an inclusive society. What will demonetisation achieve? Eliminate corruption, black money, counterfeit currency and terror
funding. Promote digitisation of the economy. Increased flow of financial savings and greater formalisation of the
economy, all of which would eventually lead to cleaner and higher GDP growth and tax revenues.
Will Demonetization slow down the Indian Economy? To have only a transient impact on the economy. Surplus liquidity, created by demonetisation, will lower borrowing costs
and increase the access to credit. This will boost economic activity, with multiplier effects.
BHIM App: A unified payment interface (directly linked to the bank account – no need to load money) and which allows wire transfers between two bank accounts has been launched.
Schemes to promote the usage of BHIM: Referral Bonus Scheme for Individuals and Cash Back Scheme for Merchants.
Aadhar Pay: A merchant version of Aadhar (National Identification Card) enabled payment system will be launched…to benefit those without debit cards, and mobile phones.
Transaction above Rs. 300,000 will not be permitted in cash. Exemption of Customs and Excise on Micro ATMs as per
standards version 1.5.1, Fingerprint reader / scanner, Iris Scanner, Miniaturised POS card reader for m-POS (other than Mobile phone or Tablet Computer), Parts and components for manufacture of the above mentioned devices.
Government Efforts to Promote Digital Payments
IMF while revising India’s GDP forecast for 2016, has projected a GDP growth of 7.2% and 7.7% in 2017 and 2018 respectively.
MEA-ED 2017

IT • India is fast emerging as a digital
economy…Digital India, Make in India, Skilling India are creating a renewed thrust on the domestic market.
• Indian IT companies can offer solutions in the following segments: Social Mobile Analytics & Cloud
(SMAC), ERP, CRM, mobility and user
experience technologies. Business Process Management
sector, which is being driven by greater automation, expanding omni-channel presence, application of analytics across entire value chain.
• The Indian IT and ITeS industry is divided into 4 major segments – IT services, Business Process Management (BPM), software products & engineering services, and hardware.
• The IT-Business Process Management (IT-BPM) industry constitutes 8.1% of India’s GDP, adding about USD115 to 120 billion to the Indian economy.
• Largest export market for IT Services: U.S. & EU.
• India - world's largest sourcing destination for IT industry, accounting for 67% of the US$ 124-130 billion market.
• Cost competitive in providing IT services – 3 to 4 times cheaper than the US.
• India is also gaining prominence in terms of intellectual capital with several global IT firms setting up their innovation centres in India.
INDIA for IT
2016: Indian IT Industry clocked revenues of USD 155 Bn…Exports segment USD 98.5 Bn…Domestic market grew by 14%- fuelled by ecommerce
2017: Exports to grow by 5-6%; Domestic market – 15-17%.
MEA-ED 2017
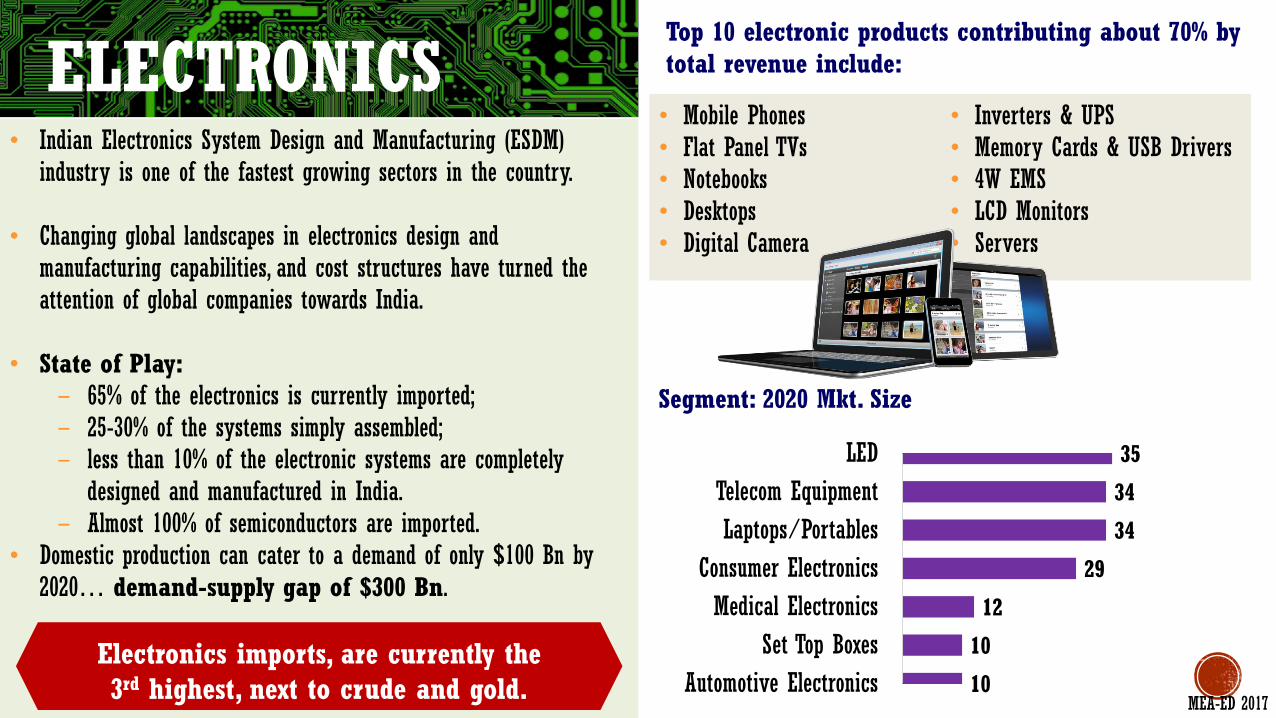
ELECTRONICS Top 10 electronic products contributing about 70% by total revenue include:
• Mobile Phones • Flat Panel TVs • Notebooks • Desktops • Digital Camera
• Inverters & UPS • Memory Cards & USB Drivers • 4W EMS • LCD Monitors • Servers
Segment: 2020 Mkt. Size
35
34
34
29
12
10
10
LED
Telecom Equipment
Laptops/Portables
Consumer Electronics
Medical Electronics
Set Top Boxes
Automotive Electronics
• Indian Electronics System Design and Manufacturing (ESDM) industry is one of the fastest growing sectors in the country.
• Changing global landscapes in electronics design and manufacturing capabilities, and cost structures have turned the attention of global companies towards India.
• State of Play: − 65% of the electronics is currently imported; − 25-30% of the systems simply assembled; − less than 10% of the electronic systems are completely
designed and manufactured in India. − Almost 100% of semiconductors are imported.
• Domestic production can cater to a demand of only $100 Bn by 2020… demand-supply gap of $300 Bn.
Electronics imports, are currently the 3rd highest, next to crude and gold.
MEA-ED 2017
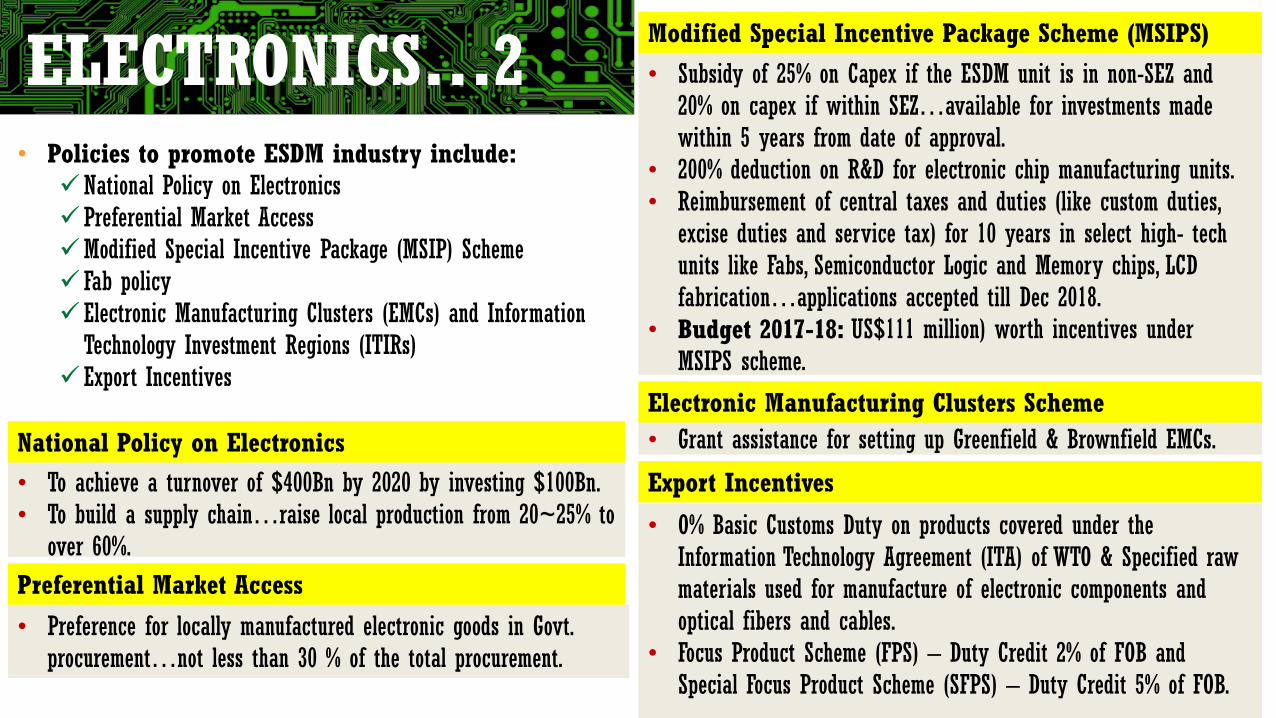
• Policies to promote ESDM industry include: National Policy on Electronics Preferential Market Access Modified Special Incentive Package (MSIP) Scheme Fab policy Electronic Manufacturing Clusters (EMCs) and Information
Technology Investment Regions (ITIRs) Export Incentives
• To achieve a turnover of $400Bn by 2020 by investing $100Bn. • To build a supply chain…raise local production from 20~25% to
over 60%.
• Preference for locally manufactured electronic goods in Govt. procurement…not less than 30 % of the total procurement.
National Policy on Electronics
Preferential Market Access
ELECTRONICS…2 • Subsidy of 25% on Capex if the ESDM unit is in non-SEZ and 20% on capex if within SEZ…available for investments made within 5 years from date of approval.
• 200% deduction on R&D for electronic chip manufacturing units. • Reimbursement of central taxes and duties (like custom duties,
excise duties and service tax) for 10 years in select high- tech units like Fabs, Semiconductor Logic and Memory chips, LCD fabrication…applications accepted till Dec 2018.
• Budget 2017-18: US$111 million) worth incentives under MSIPS scheme.
• Grant assistance for setting up Greenfield & Brownfield EMCs.
Modified Special Incentive Package Scheme (MSIPS)
Electronic Manufacturing Clusters Scheme
• O% Basic Customs Duty on products covered under the Information Technology Agreement (ITA) of WTO & Specified raw materials used for manufacture of electronic components and optical fibers and cables.
• Focus Product Scheme (FPS) – Duty Credit 2% of FOB and Special Focus Product Scheme (SFPS) – Duty Credit 5% of FOB.
Export Incentives

Pharmaceuticals • Recognized globally for high quality medicines at
affordable prices. • US$ 30 Billion plus turnover [50% domestic and 50%
exports]…CAGR of around 14% since last 5 years. • Around 10,500 registered manufacturing units.
• 2500 bulk drug manufacturing units and • 8000 formulation units.
• India has 10% of the global bulk drugs market which is @ US$ 110 Billion.
• Ranked 3rd globally in volume and 14th in value. • Compared to U.S., R&D cost is just 12.5%, Clinical
Trials 10% and Manufacturing cost at 35%. • India supplies:
• 10% of total global Pharmaceutical production. • 20% of total volume of global generics. • 30% of the world requirement of Anti-HIV
drugs.
• India produces medicines under all therapeutic categories: Anti-infective, Cardio-vascular, Anti-cancer, Anti-AIDs, Gynaecology, Neurological, Dermatology, Gastro-intestinal, Respiratory, Analgesics, Anti Diabetic, Vitamins/ Minerals/ Nutrients etc.
• Exports to 200+ countries. Top markets - U.S., Russia, Germany, Austria & UK.
• India has the largest US-FDA, WHO-GMP, EDQM, TGA, MHRA and Health Canada compliant pharma plants outside USA.
• 1400 WHO-GMP approved plants, and 253 EDQM approved plants are located in India.
• Track and trace system (barcoding) for export of pharmaceuticals and drug consignments.
• 100% FDI allowed in Greenfield & Brownfield pharma projects.
New Initiatives:
• India Pharma Vision 2020: Making India one of the leading destinations for end-
to-end drug discovery and innovation. Catapult India into one of the top five pharmaceutical
innovation hubs by 2020. MEA-ED 2017
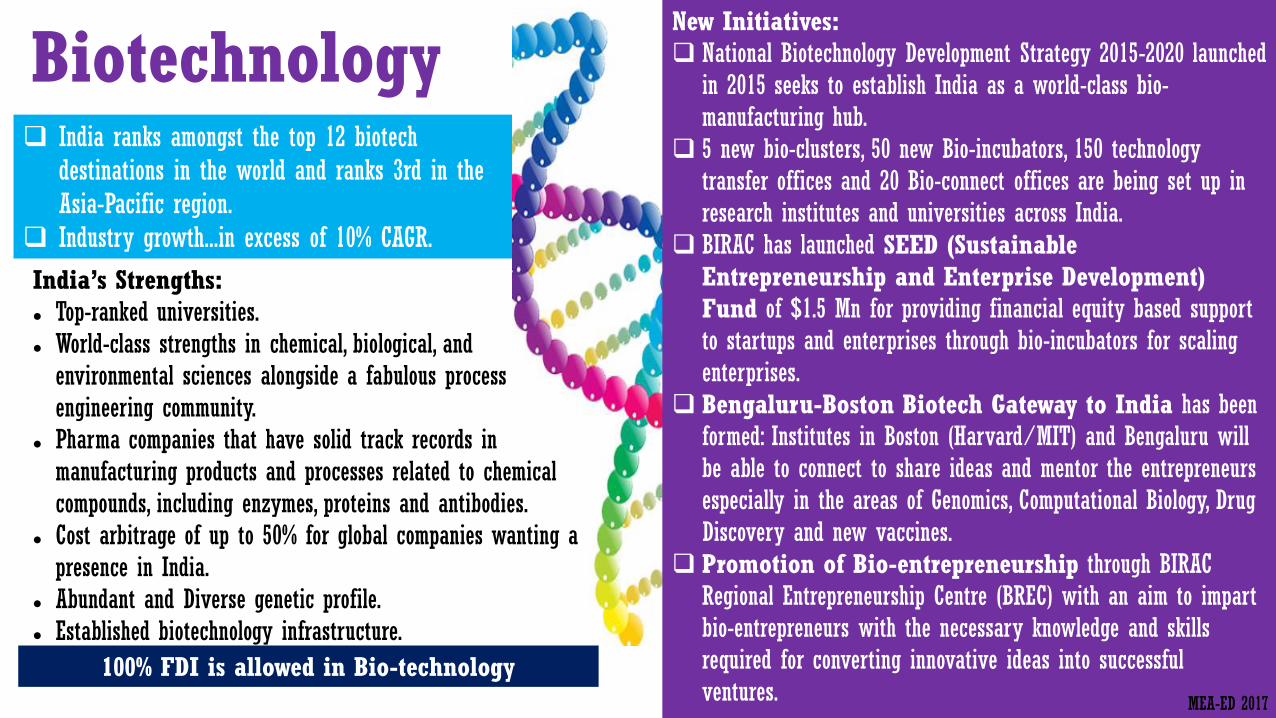
Biotechnology
India’s Strengths: Top-ranked universities. World-class strengths in chemical, biological, and
environmental sciences alongside a fabulous process engineering community.
Pharma companies that have solid track records in manufacturing products and processes related to chemical compounds, including enzymes, proteins and antibodies.
Cost arbitrage of up to 50% for global companies wanting a presence in India.
Abundant and Diverse genetic profile. Established biotechnology infrastructure.
100% FDI is allowed in Bio-technology
New Initiatives: National Biotechnology Development Strategy 2015-2020 launched
in 2015 seeks to establish India as a world-class bio-manufacturing hub.
5 new bio-clusters, 50 new Bio-incubators, 150 technology transfer offices and 20 Bio-connect offices are being set up in research institutes and universities across India.
BIRAC has launched SEED (Sustainable Entrepreneurship and Enterprise Development) Fund of $1.5 Mn for providing financial equity based support to startups and enterprises through bio-incubators for scaling enterprises.
Bengaluru-Boston Biotech Gateway to India has been formed: Institutes in Boston (Harvard/MIT) and Bengaluru will be able to connect to share ideas and mentor the entrepreneurs especially in the areas of Genomics, Computational Biology, Drug Discovery and new vaccines.
Promotion of Bio-entrepreneurship through BIRAC Regional Entrepreneurship Centre (BREC) with an aim to impart bio-entrepreneurs with the necessary knowledge and skills required for converting innovative ideas into successful ventures.
India ranks amongst the top 12 biotech destinations in the world and ranks 3rd in the Asia-Pacific region.
Industry growth...in excess of 10% CAGR.
MEA-ED 2017

Bio-Tech 2 Bio-similar Policy of 2016: Addresses the regulatory pathway regarding manufacturing process
and safety, efficacy and quality aspects. Allows a reference biologic (for which the bio-similar is being
developed) not marketed in India, to be licensed in any International Council for Harmonization of Technical Requirements for Pharmaceuticals (ICH) country (i.e. EU, Japan, US, Canada and Switzerland).
The guidelines advocates for post-marketing studies within 2 years of receiving marketing permission/manufacturing license. It also provides information on when a confirmatory clinical safety and efficacy study can be waived.
Ease of Doing Business: Norms for import and export of human biological samples have been relaxed; no license required to import or export biological samples w.e.f August 4, 2016.
Regional Centre for Biotechnology: An Act has been enacted in 2016
to set up a Regional Centre for Biotechnology to facilitate transfer of technology and knowledge.
Aim is for India to be a biotechnology expertise hub in the Asian region
Fiscal Incentives for Bio-tech sector: The turnover limit to avail the Presumptive Tax Scheme under
section 44AD has been increased to Rs. 20 Mn ($300,000). New manufacturing companies incorporated on or after March
1, 2016 to be given an option to be taxed at 25% + surcharge and cess on fulfillment of certain conditions.
100% deduction of profits for 3 out of 5 years for startups setup between April 2016 and March 2019.
10% rate of tax on income from worldwide exploitation of patents developed and registered in India by a resident.
Exemption of service tax on services provided by Biotechnology Industry Research Assistance Council (BIRAC)2 approved biotechnology incubators to incubatees with effect from April 1, 2016.

• US$ 5.5 Bn Indian medical equipment market ~ 4th in Asia after Japan, China and South Korea.
• Expected to be a USD 25-30Bn industry by 2025…growing at a CAGR of around 15%.
• Imports constitute around 75% of sales (30% from U.S.).
• 750+ medical devices manufacturers present in India ~ SMEs and MSMEs (90% with annual turnover >USD10M) have a 25% market share.
• MNC ~ share of 40%–50% in consumables, instruments and appliances and, 80%–90% in all other sub-segments.
• Several MNCs have been increasing their manufacturing footprint and locating research centres in India to serve both the Indian and global markets.
Medical Equipment Indigenous Manufacturing: • Haryana: Low-end consumables, dental equipment • Gujarat: Stent manufacturing • Karnataka: Medical IT, Implants, PCR machines • Tamil Nadu: Diagnostics, Critical Life Support systems,
Ophthalmology. • Indian manufacturers are producing low-cost, high-quality
devices and are also exporting to specific regions:
Indigenous Product Export Destination
Heart Valve Thailand, Kenya, Myanmar
Low Cost ACT Scanner Southeast Asia
Ultrasound & Color Doppler Japan
Intra-ocular Lens African countries
MEA-ED 2017
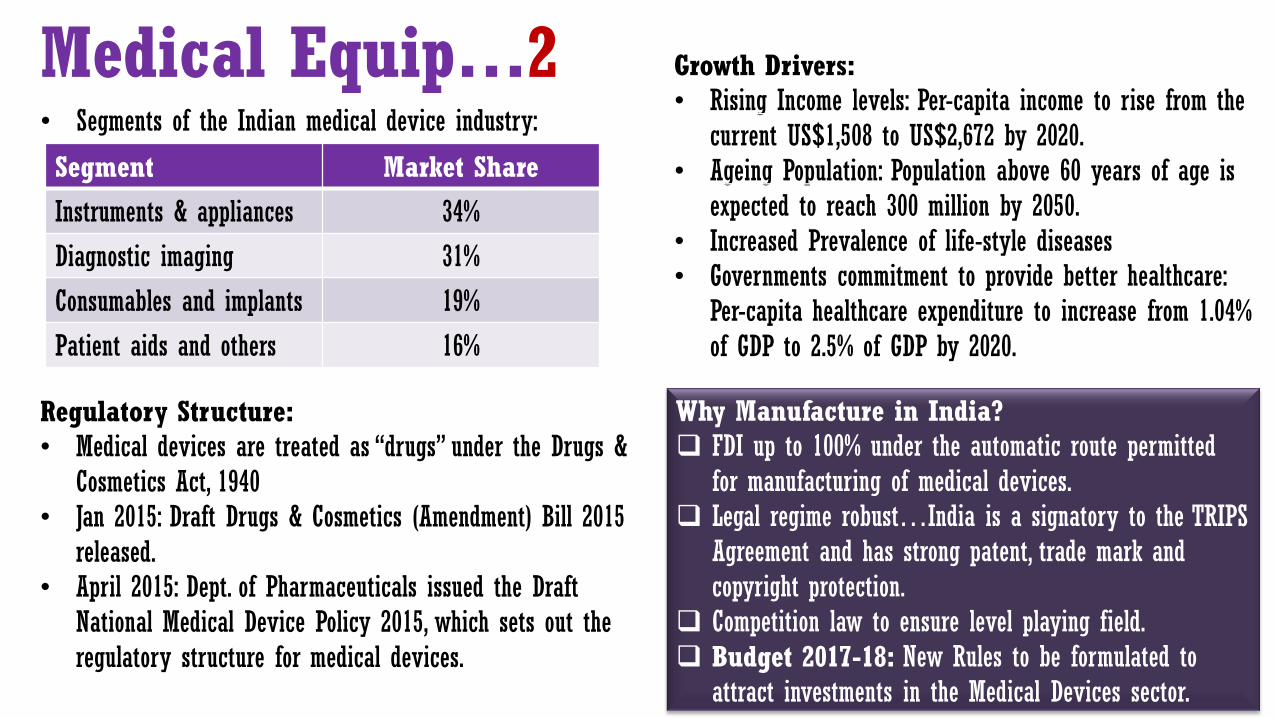
Why Manufacture in India? FDI up to 100% under the automatic route permitted
for manufacturing of medical devices. Legal regime robust…India is a signatory to the TRIPS
Agreement and has strong patent, trade mark and copyright protection.
Competition law to ensure level playing field. Budget 2017-18: New Rules to be formulated to
attract investments in the Medical Devices sector.
• Segments of the Indian medical device industry:
Segment Market Share
Instruments & appliances 34%
Diagnostic imaging 31%
Consumables and implants 19%
Patient aids and others 16%
Regulatory Structure: • Medical devices are treated as ―drugs‖ under the Drugs &
Cosmetics Act, 1940 • Jan 2015: Draft Drugs & Cosmetics (Amendment) Bill 2015
released. • April 2015: Dept. of Pharmaceuticals issued the Draft
National Medical Device Policy 2015, which sets out the regulatory structure for medical devices.
Medical Equip…2 Growth Drivers: • Rising Income levels: Per-capita income to rise from the
current US$1,508 to US$2,672 by 2020. • Ageing Population: Population above 60 years of age is
expected to reach 300 million by 2050. • Increased Prevalence of life-style diseases • Governments commitment to provide better healthcare:
Per-capita healthcare expenditure to increase from 1.04% of GDP to 2.5% of GDP by 2020.
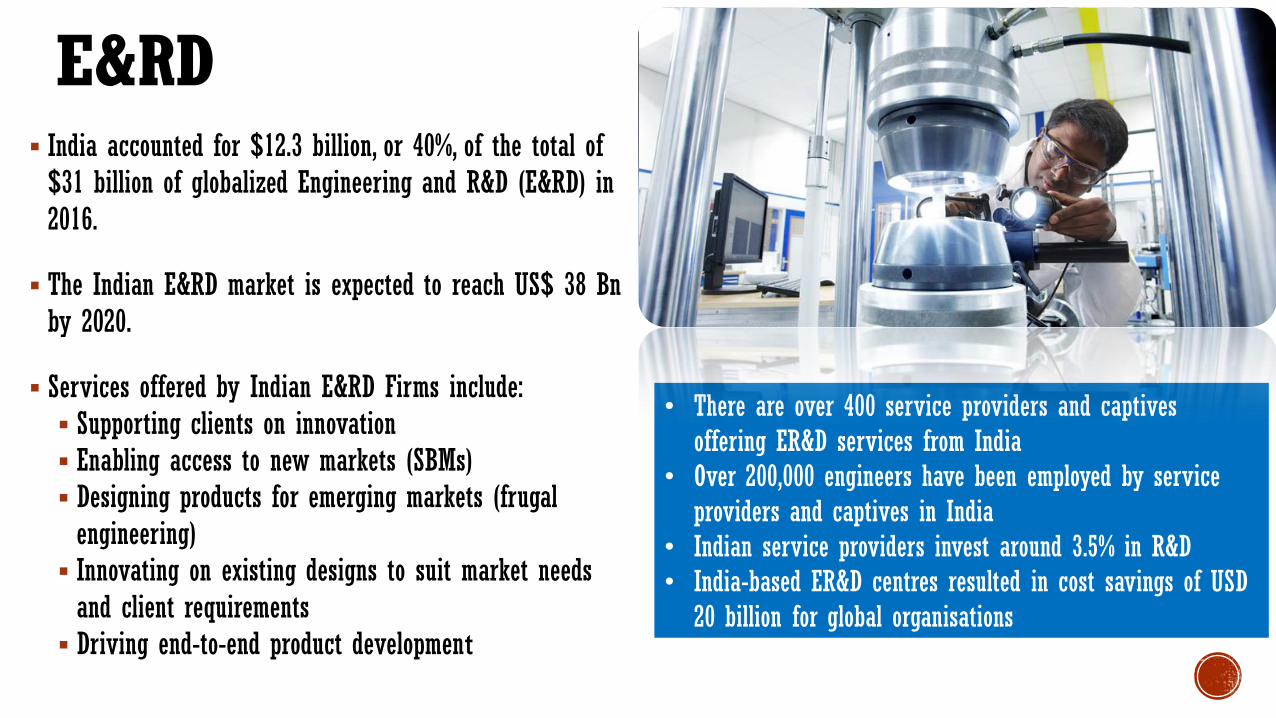
E&RD India accounted for $12.3 billion, or 40%, of the total of $31 billion of globalized Engineering and R&D (E&RD) in 2016.
The Indian E&RD market is expected to reach US$ 38 Bn by 2020.
Services offered by Indian E&RD Firms include: Supporting clients on innovation Enabling access to new markets (SBMs) Designing products for emerging markets (frugal engineering) Innovating on existing designs to suit market needs and client requirements Driving end-to-end product development
• There are over 400 service providers and captives offering ER&D services from India
• Over 200,000 engineers have been employed by service providers and captives in India
• Indian service providers invest around 3.5% in R&D
• India-based ER&D centres resulted in cost savings of USD 20 billion for global organisations
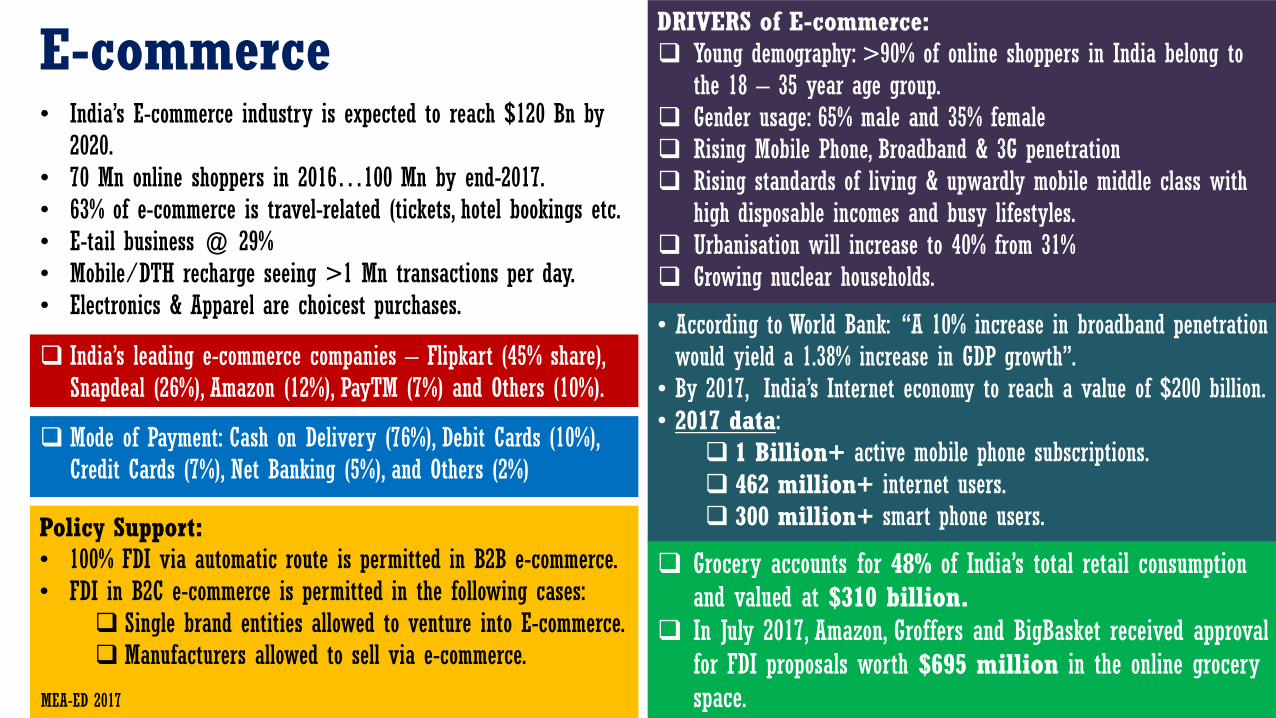
E-commerce • India’s E-commerce industry is expected to reach $120 Bn by
2020. • 70 Mn online shoppers in 2016…100 Mn by end-2017. • 63% of e-commerce is travel-related (tickets, hotel bookings etc. • E-tail business @ 29% • Mobile/DTH recharge seeing >1 Mn transactions per day. • Electronics & Apparel are choicest purchases.
Policy Support: • 100% FDI via automatic route is permitted in B2B e-commerce. • FDI in B2C e-commerce is permitted in the following cases:
Single brand entities allowed to venture into E-commerce. Manufacturers allowed to sell via e-commerce.
DRIVERS of E-commerce: Young demography: >90% of online shoppers in India belong to
the 18 – 35 year age group. Gender usage: 65% male and 35% female Rising Mobile Phone, Broadband & 3G penetration Rising standards of living & upwardly mobile middle class with
high disposable incomes and busy lifestyles. Urbanisation will increase to 40% from 31%
Growing nuclear households.
India’s leading e-commerce companies – Flipkart (45% share), Snapdeal (26%), Amazon (12%), PayTM (7%) and Others (10%).
Mode of Payment: Cash on Delivery (76%), Debit Cards (10%), Credit Cards (7%), Net Banking (5%), and Others (2%)
• According to World Bank: ―A 10% increase in broadband penetration would yield a 1.38% increase in GDP growth‖.
• By 2017, India’s Internet economy to reach a value of $200 billion. • 2017 data:
1 Billion+ active mobile phone subscriptions. 462 million+ internet users. 300 million+ smart phone users.
MEA-ED 2017
Grocery accounts for 48% of India’s total retail consumption and valued at $310 billion.
In July 2017, Amazon, Groffers and BigBasket received approval for FDI proposals worth $695 million in the online grocery space.

Retail
Market Size: India’s retail market (Organized and unorganized) is about US$ 600 Billion…expected to reach over $1 Trillion by 2020.
Organized Retail Stands at 8% today…to grow to 15-17% by 2020.
Growth Drivers: Favourable demographics Increasing urbanization Nuclear families Rising affluence Growing preference for branded
products; and Higher aspirations
Multi-Brand Retail: 51% FDI allowed (through Govt. route). Minimum FDI: $100 Million. 50% of FDI to be invested in 'backend
infrastructure' within 3 years of the first tranche of FDI.
Back-end infrastructure: Investment towards processing, manufacturing, distribution, design improvement, quality control, packaging, logistics, storage, ware-house, and agriculture market produce infrastructure.
Investment in Land and payment of Rent not counted as ―Back-end‖.
At least 30% domestic sourcing from small industries (with investments of US$ 1 Million).
Cash & Carry / Wholesale: 100% FDI allowed through the Automatic route; Brand owners can wholesale activities.
Single Brand Retail: 100% FDI allowed through the Govt. route. 30% of local sourcing mandatory. Requirement to
be reached over a period of 5 years the date of opening of first outlet.
30% local sourcing requirement relaxed for High technology products (e.g., Apple products) subject to government approval
Single-brand retail trade permitted to undertake ecommerce activities.
Duty Free:
100% FDI permitted under automatic route in Duty
Free Shops located and operated in the Customs
bonded areas. MEA-ED 2017

Food Processing A 2012 study (adjusted for 2014 wholesale prices) estimated that the annual value of harvest and post-harvest losses of major agricultural produce in India was of the order of US$ 14 Billion. Size of the Indian Food Market @ US$ 191 Bn.
Processed Food Market over US$ 100 Bn. Low-level of food processing: Less than 10%
Fruits & Vegetables – 2%
Poultry – 6%
Marine – 8%
Milk – 35% India has an arable land of 184 million hectares,
20 agro-climatic regions and 46 of the 60 soil types in the world. No. 1 producer of milk in the world at 155.5
MT per annum. 2nd largest producer of fruits & vegetables
– 254 MT per annum. 2rd largest producer of food grains & fish. Largest livestock population – 512 million
Growth Drivers: Large raw material base, over 1 Billion consumer base, and proximity to food importing nations.
Organic Food Market:
High unorganized. Dominated by pulses and foodgrains. Growing at 25-30% annually. Current market size @ US$ 360
million…Projected to reach US$ 1.36 Billion by 2020.
Practiced in 12 states in about 4.72 million hectares.
Govt. plans to bring an additional 200,000 hectares of land under organic farming by 2018.
State of Sikkim is the first 100% producer of organic food in India.
Infrastructure Support: 42 Mega Food Parks - $750 Mn
138 Cold Chain Projects - $500 Mn
60 Modern Abattoirs
Production of Food Maps
Ministry of Food Processing Industry along with YES Bank released Food Maps on India.
The maps provide details on availability of fruits and vegetables; and cover all major agri commodity classes - Cereals, Oilseeds, F&V, Meat, Poultry, Fish and Dairy.
Graphs on annual food wastage, current food processing levels across major perishables and state-wise share of food processing industries are included.
Premier Event: WORLD FOOD INDIA – November 3-5, 2017

100% FDI is allowed under automatic route in food processing industry and food infrastructure including food parks, distillation & brewing of alcohol, cold storage chain and warehousing.
100% FDI is allowed through the Govt. route in the marketing of food products produced and manufactured in India.
150% deduction allowed for setting and operating cold chain facility or warehousing facility for agricultural produce.
100% deduction allowed for beekeeping and production of honey and beewax.
100% Tax exemption for first 5 years of operation, and after that 25% of profits are exempted from tax. Benefit allowed for 10 years.
No excise duty on machinery for installation of cold storage or for preservation, storage, or processing of agricultural, apiary, horticultural, dairy, poultry, aquatic and meat products.
Customs Duty @ 5% for all goods related to food processing imported as part of a project.
FDI Policy & List of select Incentives:
MFPS are modern infrastructure facilities for food processing along the value chain from farm to market based on hub and spokes model.
Each MFPS is spread over 50 acres of land and will have 30-35 units with an investment of about Rs. 250 Crore or US$ 37.5 million.
Financial assistance provided in the form of grant-in-aid @ 50% of eligible project cost in general areas and @ 75% of eligible project cost in North East Region and difficult areas subject to maximum of Rs. 50 crore (US$ 7.5 million) per project.
42 MFPS approved – 5 operational.
Mega Food Parks Scheme (MFPS)
Food Processing…2
Financial assistance in the form of grant-in-aid @ 50% of the total cost of plant and machinery and technical civil works in general areas and 75% for difficult areas subject to a maximum of $1.5 Mn.
Cold Chain Scheme (CCS)
E-market platform for farmers to sell produce to licensed traders at any wholesale market in India.
Platform launched on April 14, 2016 and at present links 21 wholesale markets in 8 states.
585 wholesale markets to be linked by March 2018.
Expected to benefit small farmers. www.enam.gov.in
National Agricultural Market – E-market Platform launched.
Policy Support:
MEA-ED 2017

Tourism & Hospitality Ranks 40th in the 2017 World Economic
Forum Travel & Tourism Competitiveness Index.
Tourism sector accounts for 7.5% of GDP. Foreign Tourist Arrivals (FTA): 8.89
million (2016)… ranks 24th in FTA. E-Visa: 161 countries…2 month stay
with dual entry (for business and tourism)…triple entry (for medical).
Film (F) visa: One-year with multiple entry.
Hotel and Tourism industry declared a high priority sector. FDI is allowed up to 100% under the automatic route.
Extension of Investment Linked tax incentives under Section 35AD of the Income Tax Act to new hotels of 2-Star category and above anywhere in India.
Reserve Bank of India (RBI) has de-linked credit for hotel projects from Commercial Real Estate (CRE), thereby enabling hotel projects to avail credit at relaxed norms and reduced interest rates.
Ministry of Finance has included the following two categories of hotels in the ―Harmonized List of Infrastructure Sub-sector‖. Three Star or higher category classified hotels located
outside cities with population of more than 1 million. Hotels with a project cost of more than Rs.200 crore
($30 Mn) each in any place in India and of any star rating.
Policy Support:
Wellness/Medical Tourism
Currently a $3 Bn market…expected to reach US$ 8 Bn by 2020. India is well-known for its quality and affordable surgeries for heart bypass, heart valve replacement,
angioplasty, hip replacement, knee replacement, spinal fusion etc. World class hospital infrastructure. MEA - Economic Diplomacy Division - 2017

Economic Diplomacy Division Contact List
Mr. K. Nagaraj Naidu Joint Secretary [email protected] Ms. Priya Nair (US, Canada, LAC, ASEAN, ANZ) Director [email protected] Mr. Gautam Wahi (Europe/CIS/Russia) Deputy Secretary [email protected] Mr. Rajesh Parihar (East Asia/Gulf) Under Secretary [email protected] Mr. Mukul Arya (Africa) Under Secretary [email protected] Mr. Arun Kr Singh (South Asia) Under Secretary [email protected]
Address:
Economic Diplomacy Division Ministry of External Affairs Jawaharlal Nehru Bhavan Janpath Road, New Delhi 110001
MEA-ED 2017

ED 2017
Economic Diplomacy Division Ministry of External Affairs Jawaharlal Nehru Bhavan
Janpath Road, New Delhi 110001