bridges grade 5 supplement washington sets · 5.2.g estimate sums and differences of fractions,...
TRANSCRIPT

B5SUPWA-B P0111
Activities & Worksheets
Introduction 1–6
Unit Planners 7–14
Materials List 15–16
Set A3—Number & Operations: Estimating to Multiply & Divide A3.1–A3.6
Set A4—Number & Operations: Long Division A4.1–A4.18
Set A5—Number & Operations: Adding & Subtracting Fractions A5.1–A5.12
Set A6—Number & Operations: Fraction Concepts A6.1–A6.24
Set B1—Algebra: Diagrams & Equations B1.1–B1.14
Set C1—Geometry: Triangles & Quadrilaterals C1.1–C1.56
Set E1—Data Analysis: Probability & Technology E1.1–E1.16
Bridges Correlations to Washington Math Performance Expectations i–xii
BRIDGES GRADE 5 SUPPLEMENT Washington Sets

Bridges in Mathematics Grade 5 Supplement Washington Sets
The Math Learning Center, PO Box 12929, Salem, Oregon 97309. Tel. 1 800 575–8130.
© 2010 by The Math Learning Center
All rights reserved.
Prepared for publication on Macintosh Desktop Publishing system.
Printed in the United States of America.
QP903 B5SUPWA-B P0111
The Math Learning Center grants permission to classroom teachers to reproduce blackline
masters in appropriate quantities for their classroom use.
Bridges in Mathematics is a standards-based K–5 curriculum that provides a unique blend
of concept development and skills practice in the context of problem solving. It incorpo-
rates the Number Corner, a collection of daily skill-building activities for students.
The Math Learning Center is a nonprofit organization serving the education community.
Our mission is to inspire and enable individuals to discover and develop their mathematical
confidence and ability. We offer innovative and standards-based professional development,
curriculum, materials, and resources to support learning and teaching. To find out more,
visit us at www.mathlearningcenter.org.
© The Math Learning Center www.mathlearningcenter.org Bridges in Mathematics Grade 5 Supplement • 1
Bridges in Mathematics Grade 5 Supplement
Washington Sets
IntroductionThe Bridges Grade Five Supplement is a collection of activities and independent worksheets written to enable teachers in Washington to fully meet the Performance Standards adopted in the spring of 2008. This material is published online as downloadable files on the Math Learning Center website. See www.gotomlc.org/wa.
The activities included here are designed to be used in place of selected sessions in Bridges Grade Five, starting toward the end of Unit Three. All of the activities are listed on pages 2–3 in the order in which they appear in the supplement. They are listed in recommended teaching order on pages 4–5. On pages 6–13, you’ll also find a set of sheets designed to replace the Planning Guides found at the beginning of Units 3, 4, 5, and 7 in the Bridges Teacher’s Guides. These sheets show exactly how the Supplement activities fit into the flow of instruction for fifth grade. We suggest you insert these sheets into your Bridges guides so you can see at a glance when to teach the Supplement activities through the school year.
The majority of activities and worksheets in this supplement come in sets of three or more, providing several in-depth experiences around a particular grade level expectation or cluster of expectations. Most of the activities will take an hour of instructional time, though some are shorter, requiring 30–45 min-utes.
Almost all of the activities are hands-on and require various math manipulatives and/or common class-room supplies. The blacklines needed to make any overheads, game materials, and/or student sheets are included after each activity. Many of the supplement sets in this collection include independent worksheets, designed to be completed by students in class or assigned as homework after related activi-ties. See page 15 for a complete list of materials required to teach the activities in each Supplement set.
Note Fifth grade standards not listed on pages 2–3 are adequately addressed in Bridges and/or Number Corner sessions. For a full correlation of Bridges Grade Five to the Washington Performance Expecta-tions, see pages i-xii.

Washington Supplement Sets
2 • Bridges in Mathematics Grade 5 Supplement www.mathlearningcenter.org © The Math Learning Center
Activities & Washington Mathematics Performance Expectations(Listed in Order of Appearance in the Supplement)
SET A3 NUMBER & OPERATIONS: ESTIMATING TO MULTIPLY & DIVIDEPage Name Washington Performance Expectations
A3.1 Independent Worksheet 1–Using Compatible
Numbers
5.1.B Determine quotients for multiples of 10 and 100 by applying knowl-
edge of place value and properties of operations.
5.1.D Estimate quotients to approximate solutions and determine reason-
ableness of answers in problems involving up to two-digit divisors.
5.6.H Analyze and evaluate whether a solution is reasonable, is mathemati-
cally correct, and answers the question.
A3.3 Independent Worksheet 2–More Compatible
Numbers
A3.5 Independent Worksheet 3–Reasonable Esti-
mates
SET A4 NUMBER & OPERATIONS: LONG DIVISIONPage Name Washington Performance Expectations
A4.1 Activity 1–Introducing the Standard Algorithm 5.1.C Fluently and accurately divide up to a four-digit number by one- and
two- digit divisors accurately using the standard long division algorithm.
5.1.D Estimate quotients to approximate solutions and determine reason-
ableness of answers in problems involving up to two-digit divisors.
5.1.F Solve single- and multi-step work problems involving multi-digit divi-
sion and verify the solutions.
5.5.B Determine and interpret the mean of a small data set of whole numbers.
A4.11 Activity 2–Extending the Standard Algorithm
SET A5 NUMBER & OPERATIONS: ADDING & SUBTRACTING FRACTIONSPage Name Washington Performance Expectations
A5.1 Independent Worksheet 1–Fractions through the
School Day
5.2.A Represent addition and subtraction of fractions and mixed numbers
using visual and numerical models, and connect the representation to the
related equation.
5.2.E Fluently and accurately add and subtract fractions, including mixed
numbers.
5.2.H Solve single- and multi-step word problems involving addition and
subtraction of whole numbers, fractions (including mixed numbers) and
decimals and verify their solutions.
A5.5 Independent Worksheet 2–Fractions on the Trail
A5.9 Independent Worksheet 3–Adding & Subtract-
ing Fractions
SET A6 NUMBER & OPERATIONS: FRACTION CONCEPTSPage Name Washington Performance Expectations
A6.1 Activity 1–Simplify & Compare 5.2.C Given two fractions with unlike denominators, rewrite the fractions
with a common denominator.
5.2.D Determine the greatest common factor and the least common multiple
of two or more whole numbers.
5.2.E Fluently and accurately add and subtract fractions, including mixed
numbers.
5.2.G Estimate sums and differences of fractions, mixed numbers, and
decimals to predict solutions to problems or determine reasonableness of
answers.
5.2.H Solve single- and multi-step word problems involving addition and
subtraction of whole numbers, fractions (including mixed numbers) and
decimals and verify their solutions.
A6.9 Activity 2–Same-Sized Pieces
A6.19 Independent Worksheet 1–Using the Greatest
Common Factor to Simplify Fractions
A6.21 Independent Worksheet 2–Finding the Least
Common Denominator
A6.23 Independent Worksheet 3–LCM and GCF

Washington Supplement Sets
© The Math Learning Center www.mathlearningcenter.org Bridges in Mathematics Grade 5 Supplement • 3
Activities & Washington Mathematics Performance Expectations (cont.)
SET B1 ALGEBRA: DIAGRAMS & EQUATIONSPage Name Washington Performance Expectations
B1.1 Activity 1–The Carnival 5.4.C Write algebraic expressions that represent simple situations and evalu-
ate the expressions, using substitution when variables are involved. B1.7 Independent Worksheet 1–Padre’s Pizza
B1.11 Independent Worksheet 2–Choosing Equations
& Diagrams
SET C1 GEOMETRY: TRIANGLES & QUADRILATERALSPage Name Washington Performance Expectations
C1.1 Activity 1–Classifying Triangles 5.3.A Classify quadrilaterals.
5.3.C Identify, describe, and classify triangles by angle measure and number
of congruent sides.
5.3.D Determine the formula for the area of a parallelogram by relating it to
the area of a rectangle.
5.3.E Determine the formula for the area of a triangle by relating it to the area
of a parallelogram.
5.3.F Determine the perimeters and areas of triangles and parallelograms.
5.3.G Draw quadrilaterals and triangles from given information about sides
and angles.
5.3.I Solve single- and multi-step word problems about the perimeters and
areas of quadrilaterals and triangles and verify the solutions.
C1.13 Activity 2–Sorting & Classifying Quadrilaterals
C1.25 Activity 3–Finding the Perimeter and Area of a
Parallelogram
C1.35 Activity 4–Three Mathematical Ideas
C1.43 Independent Worksheet 1–More Geoboard
Triangles
C1.45 Independent Worksheet 2–Color & Construct
Triangles
C1.47 Independent Worksheet 3–Classifying Quadri-
laterals
C1.51 Independent Worksheet 4–Quad Construction
C1.51 Independent Worksheet 5–Perimeter & Area
Puzzles
C1.55 Independent Worksheet 6–Ebony’s Quilt
SET E1 DATA ANALYSIS: PROBABILITY & TECHNOLOGYPage Name Washington Performance Expectations
E1.1 Activity 1–Introducing Virtual Spinners 5.6.A Determine the question(s) to be answered given a problem situation.
5.6.I Summarize mathematical information, draw conclusions, and explain
reasoning.
5.6.J Make and test conjectures based on data (or information) collected
from explorations and experiments.
E1.7 Activity 2–The 6-4-2 Spinner
E1.13 Independent Worksheet 1– Make & Test Your
Own Spinner

Washington Supplement Sets
4 • Bridges in Mathematics Grade 5 Supplement www.mathlearningcenter.org © The Math Learning Center
Activities & Recommended Timings (Listed in Recommended Teaching Order)
REPLACE SELECTED SESSIONS IN BRIDGES, UNIT 3Page Set, Strand & Topic Name Recommended Timing
C1.1 Set C1 Geometry: Triangles & Quadrilaterals Activity 1–Classifying Triangles Replaces Unit 3, Session 18
C1.13 Set C1 Geometry: Triangles & Quadrilaterals Activity 2–Sorting & Classifying Quad-
rilaterals
Replaces Unit 3, Session 19
C1.25 Set C1 Geometry: Triangles & Quadrilaterals Activity 3–Finding the Perimeter and
Area of a Parallelogram
Replaces Unit 3, Session 20
C1.35 Set C1 Geometry: Triangles & Quadrilaterals Activity 4–Three Mathematical Ideas Replaces Unit 3, Session 21
C1.43 Set C1 Geometry: Triangles & Quadrilaterals Independent Worksheet 1–More Geo-
board Triangles
Any time after Set C1, Activity 1
C1.45 Set C1 Geometry: Triangles & Quadrilaterals Independent Worksheet 2–Color &
Construct Triangles
Any time after Set C1, Activity 1
C1.47 Set C1 Geometry: Triangles & Quadrilaterals Independent Worksheet 3–Classifying
Quadrilaterals
Any time after Set C1, Activity 2
C1.51 Set C1 Geometry: Triangles & Quadrilaterals Independent Worksheet 4–Quad
Construction
Any time after Set C1, Activity 2
C1.51 Set C1 Geometry: Triangles & Quadrilaterals Independent Worksheet 5–Perimeter &
Area Puzzles
Any time after Set C1, Activity 4
C1.55 Set C1 Geometry: Triangles & Quadrilaterals Independent Worksheet 6–Ebony’s
Quilt
Any time after Set C1, Activity 4
USE ANY TIME AFTER BRIDGES, UNIT 4, SESSION 10 Page Set, Strand & Topic Name Recommended Timing
A3.1 Set A3 Number & Operations: Estimating
to Multiply & Divide
Independent Worksheet 1–Using Com-
patible Numbers
Any time after Bridges, Unit 4, Ses-
sion 10
A3.3 Set A3 Number & Operations: Estimating
to Multiply & Divide
Independent Worksheet 2–More Com-
patible Numbers
Any time after Bridges, Unit 4, Ses-
sion 10
A3.5 Set A3 Number & Operations: Estimating
to Multiply & Divide
Independent Worksheet 3–Reasonable
Estimates
Any time after Bridges, Unit 4, Ses-
sion 10
USE ANY TIME AFTER BRIDGES, UNIT 4, SESSION 23
Page Set, Strand & Topic Name Recommended Timing
A5.1 Set A5 Number & Operations: Adding &
Subtracting Fractions
Independent Worksheet 1–Fractions
through the School Day
Any time after Bridges, Unit 4, Ses-
sion 23
A5.5 Set A5 Number & Operations: Adding &
Subtracting Fractions
Independent Worksheet 2–Fractions on
the Trail
Any time after Bridges, Unit 4, Ses-
sion 23
A5.9 Set A5 Number & Operations: Adding &
Subtracting Fractions
Independent Worksheet 3–Adding &
Subtracting Fractions
Any time after Bridges, Unit 4, Ses-
sion 23
Washington Supplement Sets
© The Math Learning Center www.mathlearningcenter.org Bridges in Mathematics Grade 5 Supplement • 5
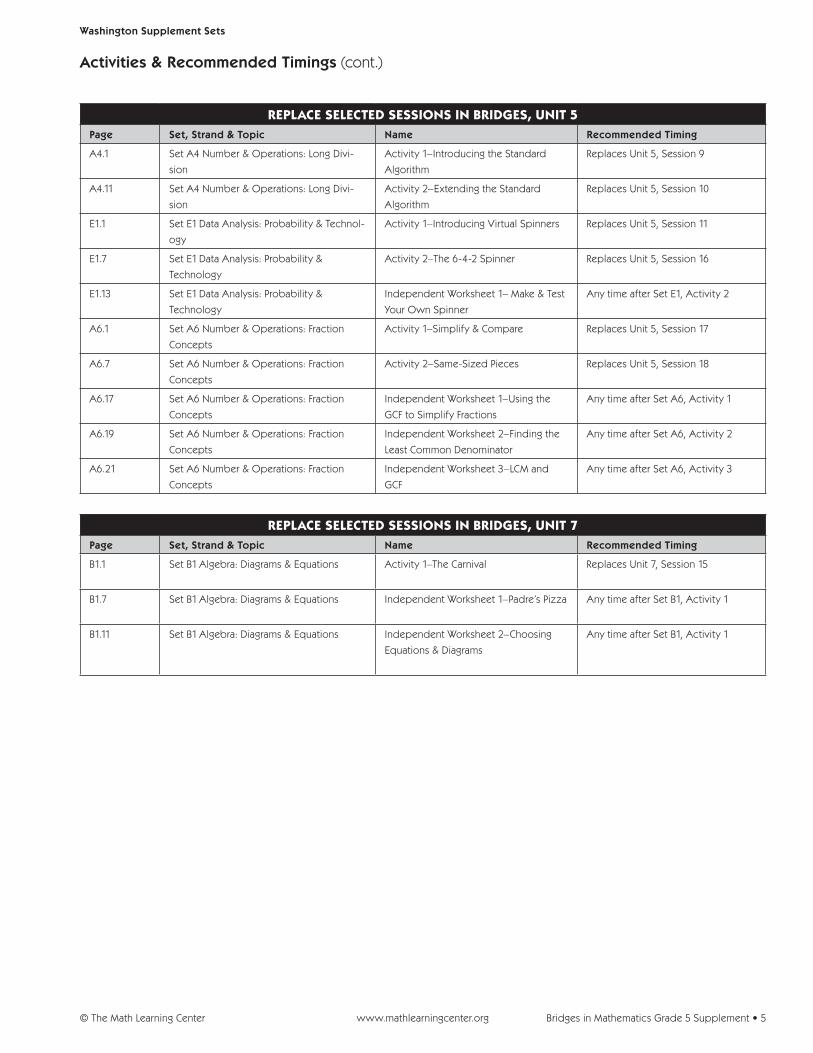
REPLACE SELECTED SESSIONS IN BRIDGES, UNIT 5Page Set, Strand & Topic Name Recommended Timing
A4.1 Set A4 Number & Operations: Long Divi-
sion
Activity 1–Introducing the Standard
Algorithm
Replaces Unit 5, Session 9
A4.11 Set A4 Number & Operations: Long Divi-
sion
Activity 2–Extending the Standard
Algorithm
Replaces Unit 5, Session 10
E1.1 Set E1 Data Analysis: Probability & Technol-
ogy
Activity 1–Introducing Virtual Spinners Replaces Unit 5, Session 11
E1.7 Set E1 Data Analysis: Probability &
Technology
Activity 2–The 6-4-2 Spinner Replaces Unit 5, Session 16
E1.13 Set E1 Data Analysis: Probability &
Technology
Independent Worksheet 1– Make & Test
Your Own Spinner
Any time after Set E1, Activity 2
A6.1 Set A6 Number & Operations: Fraction
Concepts
Activity 1–Simplify & Compare Replaces Unit 5, Session 17
A6.7 Set A6 Number & Operations: Fraction
Concepts
Activity 2–Same-Sized Pieces Replaces Unit 5, Session 18
A6.17 Set A6 Number & Operations: Fraction
Concepts
Independent Worksheet 1–Using the
GCF to Simplify Fractions
Any time after Set A6, Activity 1
A6.19 Set A6 Number & Operations: Fraction
Concepts
Independent Worksheet 2–Finding the
Least Common Denominator
Any time after Set A6, Activity 2
A6.21 Set A6 Number & Operations: Fraction
Concepts
Independent Worksheet 3–LCM and
GCF
Any time after Set A6, Activity 3
REPLACE SELECTED SESSIONS IN BRIDGES, UNIT 7Page Set, Strand & Topic Name Recommended Timing
B1.1 Set B1 Algebra: Diagrams & Equations Activity 1–The Carnival Replaces Unit 7, Session 15
B1.7 Set B1 Algebra: Diagrams & Equations Independent Worksheet 1–Padre’s Pizza Any time after Set B1, Activity 1
B1.11 Set B1 Algebra: Diagrams & Equations Independent Worksheet 2–Choosing
Equations & Diagrams
Any time after Set B1, Activity 1
Activities & Recommended Timings (cont.)

6 • Bridges in Mathematics Grade 5 Supplement www.mathlearningcenter.org © The Math Learning Center

Washington Supplement Sets
© The Math Learning Center www.mathlearningcenter.org Bridges in Mathematics Grade 5 Supplement • 7
Unit Three Planner (Bridges & WA Grade 5 Supp. Set C1)
SESSION 1 SESSION 2 SESSION 3 SESSION 4 SESSION 5
Problems &
Investigations
Which Is Bigger?
Work Sample
Problems &
Investigations
Dividing a Rectangle
Home Connection 22
Shape Puzzles
Problems &
Investigations
Area of a Rectangle
Work Sample
Problems &
Investigations Areas of
Triangles & Parallelograms
Work Sample
Home Connection 23
Areas of Geoboard Figures
Assessment
Unit Three Pre-Assessment
SESSION 6 SESSION 7 SESSION 8 SESSION 9 SESSION 10 Problems &
Investigations
Pattern Block Angles
Home Connection 24
Thinking about Quadri-
laterals
Problems &
Investigations Angle
Measures Triangles &
Quadrilaterals
Problems &
Investigations
Sir Cumference and the
Great Knight of Angleland
Home Connection 25
Finding Angle Measures
Problems &
Investigations Angle
Measure: From Pattern
Blocks to Protractors
Work Sample
Problems &
Investigations Parallels,
Perpendiculars & Angles
Home Connection 26
Protractor Practice & Clock
Angles
SESSION 11 SESSION 12 SESSION 13 SESSION 14 SESSION 15 Problems &
Investigations
Congruence
Problems &
Investigations Symmetry
Work Sample
Home Connection 27
Reflections, Symmetry &
Congruence
Problems &
Investigations
Guess My Polygon
Problems &
Investigations
Writing Polygon Riddles
Home Connection 28
Area Bingo Practice
Problems &
Investigations
Drawing Stars
SESSION 16 SESSION 17 SUPPLEMENT SUPPLEMENT SUPPLEMENTWork Places
3A Area Bingo
3B Polygon Riddles
Work Sample
Problems &
Investigations Similarity
Home Connection 29
Drawing Similar Figures
Supplement Set C1
Geometry: Triangles &
Quadrilaterals
Activity 1–Classifying
Triangles
Home Connection
Supp Set C1 Ind.
Worksheet 1: More
Geoboard Triangles and
Worksheet 2: Color &
Construct Triangles
Supplement Set C1
Geometry: Triangles &
Quadrilaterals
Activity 2–Sorting & Clas-
sifying Quadrilaterals
Home Connection
Supp Set C1 Ind.
Worksheet 3: Classifying
Quadrilaterals
Supplement Set C1
Geometry: Triangles &
Quadrilaterals
Activity 3–Finding the
Perimeter and Area of a
Parallelogram
Home Connection
Supp Set C1 Ind.
Worksheet 4: Quad Con-
struction
SUPPLEMENT SESSION 22 Supplement Set C1
Geometry: Triangles &
Quadrilaterals
Activity 4–Three Math-
ematical Ideas
Home Connection
Supp Set C1 Ind.
Worksheet 5: Perimeter &
Area Puzzles
Assessment Unit Three
Post-Assessment
Home Connection
Supp Set C1 Ind.
Worksheet 6: Ebony’s
Quilt

8 • Bridges in Mathematics Grade 5 Supplement www.mathlearningcenter.org © The Math Learning Center

Washington Supplement Sets
© The Math Learning Center www.mathlearningcenter.org Bridges in Mathematics Grade 5 Supplement • 9
Unit Four Planner (Bridges & WA Grade 5 Supp. Set A3)
SESSION 1 SESSION 2 SESSION 3 SESSION 4 SESSION 5 Assessment
Unit Four Pre-Assessment
Problems &
Investigations
Estimate & Check
Home Connection 32
Estimation Interviews
Problems &
Investigations
Multiplication Menus
Problems &
Investigations Using
Menus to Solve Long Divi-
sion Problems
Home Connection 33
Multiplication Menus
Problems &
Investigations
Making Menus & Solving
Problems
SESSION 6 SESSION 7 SESSION 8 SESSION 9 SESSION 10 Problems &
Investigations Water
Conservation Division
Problems &
Investigations Lowest
Remainder Wins
Home Connection 34
Multiplication & Division
Practice
Work Places
4A Estimate & Check
4B Lowest Remainder
Wins
Work Places
4C Measure & Convert
4D Go for Zero
Home Connection 35
The Tangerine Problem
Problems &
Investigations
Same Dividend, Double
the Divisor
Home Connection
Supp Set A3 Ind.
Worksheet 1: Using
Compatible Numbers to
Multiply & Divide
SESSION 11 SESSION 12 SESSION 13 SESSION 14 SESSION 15 Problems &
Investigations
Making Fraction Kits
Problems &
Investigations
Race to Two & Back
Home Connection 36
Lady Liberty
Problems &
Investigations The Lico-
rice & Trail Mix Problems
Problems &
Investigations
Quilt Block Fractions
Home Connection 37
Fractions & Division Story
Problems
Problems &
Investigations Fractions
on the Geoboard
Work Sample Home Connection
Supp Set A3 Ind.
Worksheet 2: More Multi-
plication with Compatible
Numbers
Home Connection
Supp Set A3 Ind.
Worksheet 3: Reasonable
Estimates in Multiplication
& Division
SESSION 16 SESSION 17 SESSION 18 SESSION 19 SESSION 20 Problems &
Investigations
Designing Quilt Blocks
Work Sample
Home Connection 38
The Mini-Quilt Project
Problems &
Investigations
Egg Carton Fractions
Problems &
Investigations
Name That Fraction
Home Connection 39
Egg Carton Fractions &
More
Problems &
Investigations
Combining Egg Carton
Fractions
Problems &
Investigations
Fraction Story Problems
Work Sample
Home Connection 40
More Fraction Story
Problems
SESSION 21 SESSION 22 SESSION 23 Work Places
4E Dozens of Eggs
4F Measuring to Fractions
of an Inch
Work Places
Unit Four Work Places
4G Target Practice
Home Connection 41
Unit Four Review
Assessment
Unit Four Post-
Assessment

10 • Bridges in Mathematics Grade 5 Supplement www.mathlearningcenter.org © The Math Learning Center

Washington Supplement Sets
© The Math Learning Center www.mathlearningcenter.org Bridges in Mathematics Grade 5 Supplement • 11
Unit Five Planner (Bridges & WA Grade 5 Supp. Sets A4, A5, E1, A6)
SESSION 1 SESSION 2 SESSION 3 SESSION 4 SESSION 5
Problems &
Investigations
Graphing Shirt Colors
Assessment
Unit Five Pre-Assessment
Problems &
Investigations
Pet Survey
Home Connection 42
Bar & Circle Graphs
Problems &
Investigations Creating
Double Bar Graphs
Problems &
Investigations More
about Names & Double
Bar Graphs
Home Connection 43
Presidents’ Names
SESSION 6 SESSION 7 SESSION 8 SUPPLEMENT SUPPLEMENTProblems &
Investigations
What Is Probability?
Problems &
Investigations
The Odd Coin Game
Problems &
Investigations
A Closer Look at the Odd
Coin Game
Supplement Set A4
Number & Operations:
Long Division
Activity 1–Introducing the
Standard Algorithm
Supplement Set A4
Number & Operations:
Long Division
Activity 2–Extending the
Standard AlgorithmHome Connection
Supp Set A5 Ind.
Worksheet 1: Fractions
through the School Day
Home Connection
Supp Set A5 Ind.
Worksheet 2: Fractions on
the Trail
SUPPLEMENT SESSION 12 SESSION 13 SESSION 14 SESSION 15 Supplement Set E1 Data
Analysis: Probability &
Technology
Activity 1–Introducing
Virtual Spinners
Problems &
Investigations
The Dragon’s Lair, Part 1 of 2
Problems &
Investigations
The Dragon’s Lair, Part 2 of 2
Work Sample
Home Connection 46
Spinner & Dice
Probabilities
Problems &
Investigations
Secret Sacks, Part 1 of 2
Problems &
Investigations
Secret Sacks, Part 2 of 2
Home Connection
Supp Set A5 Ind.
Worksheet 3: Adding &
Subtracting Fractions
SUPPLEMENT SUPPLEMENT SUPPLEMENT SESSION 19 Supplement Set E1 Data
Analysis: Probability &
Technology
Activity 2–The 6–4–2
Spinner
Home Connection
Supp Set E1 Ind.
Worksheet 1: Make & Test
Your Own Spinner
Supplement Set A6
Number & Operations:
Fraction Concepts
Activity 1–Simplify &
Compare
Home Connection
Supp Set A6 Ind.
Worksheet 1: Using the
Greatest Common Factor
to Simplify Fractions
Supplement Set A6
Number & Operations:
Fraction Concepts
Activity 2–Same-Sized
Pieces
Home Connection
Supp Set A6 Ind.
Worksheet 2: Finding
the Least Common
Denominator
Assessment Unit Five
Post-Assessment

12 • Bridges in Mathematics Grade 5 Supplement www.mathlearningcenter.org © The Math Learning Center

Washington Supplement Sets
© The Math Learning Center www.mathlearningcenter.org Bridges in Mathematics Grade 5 Supplement • 13
Unit Seven Planner (Bridges & WA Grade 5 Supp. Set B1)
SESSION 1 SESSION 2 SESSION 3 SESSION 4 SESSION 5 Problems &
Investigations
The Operations Game
Home Connection 59
The Operations Game
Problems &
Investigations
Exploring Equations
Assessment Unit Seven
Pre-Assessment
Home Connection 60
Operations, Equations &
Puzzles
Problems &
Investigations A Tale of
Two Patterns, part 1 of 2
Problems &
Investigations A Tale of
Two Patterns, part 2 of 2
Work Sample
Home Connection 61
More Tile Patterns
SESSION 6 SESSION 7 SESSION 8 SESSION 9 SESSION 10 Problems &
Investigations
Pattern Posters
Problems &
Investigations
Anthony’s Problem
Work Sample
Problems &
Investigations
The King’s Chessboard
Work Sample
Home Connection 62
Thinking About The King’s
Chessboard
Problems &
Investigations The
Function Machine Game
Problems &
Investigations
Modeling Situations
Home Connection 63
The Function Machine
Strikes Again
SESSION 11 SESSION 12 SESSION 13 SESSION 14 SUPPLEMENTProblems &
Investigations
Secret Numbers
Problems &
Investigations
More Secret Numbers
Work Sample
Home Connection 64
The Lemonade Stand
Problems &
Investigations
Solving Problems &
Making Posters
Problems &
Investigations
Completing & Sharing
Our Posters
Home Connection 65
Picturing Problems
Supplement Set B1
Algebra: Diagrams &
Equations Activity 1:
The Carnival
Home Connection
Supp Set B1 Ind.
Worksheet 1: Padre’s Pizza
SESSION 16 Assessment Unit Seven
Post-Assessment
Home Connection
Supp Set B1 Ind.
Worksheet 2: Choosing
Equations & Diagrams

14 • Bridges in Mathematics Grade 5 Supplement www.mathlearningcenter.org © The Math Learning Center

Washington Supplement Sets
© The Math Learning Center www.mathlearningcenter.org Bridges in Mathematics Grade 5 Supplement • 15
Grade 5 Washington Supplement Materials List
MANIPULATIVES ITEM # A3 A4 A5 A6 B1 C1 E1Color Tile (1 set of 400)* T400T √
Clear geoboards & bands (class set plus 1)* GBC √
More/Less cubes (15)* Part of D45NUM √
Overhead double spinner overlay* SPOH-TEMP √
Rulers that show inches & centimeters (class set)* RLC √ √
Protractors (class set)* PRO180 √
All manipulatives available from Math Learning Center. Those items marked with an asterisk are included in the Grade 5 Bridges Grade Level Package.
GENERAL MATERIALS (PROVIDED BY THE TEACHER) A3 A4 A5 A6 B1 C1 E1Computers/Internet Access √
Computer projection equipment √
Overhead or document camera √ √ √ √
Blank overhead transparencies if you are using an overhead projector rather
than a doc camera
4 5 4 1
8.5" x 11" white copy paper, sheets per student 6 4 11 10 9 23 8
8.5" x 11" lined or grid paper, sheets per student 2 1
9" x 12" and 12" x 18" construction paper √
3" x 5" index cards (3 per student) √
Overhead pens (black, blue, red) √ √
Scissors, class set √
Scotch tape (several rolls) √

Washington Supplement Sets
16 • Bridges in Mathematics Grade 5 Supplement www.mathlearningcenter.org © The Math Learning Center

Grade 5 supplementset a3 Number & Operations: Estimating to Multiply & Divide
IncludesIndependent Worksheet 1: Using Compatible Numbers to Multiply & Divide A3.1
Independent Worksheet 2: More Multiplication & Division with Compatible Numbers A3.3
Independent Worksheet 3: Reasonable Estimates in Multiplication & Division A3.5
skills & ConceptsH develop and use strategies to estimate the results of multi-digit multiplication and division
and judge the reasonableness of such results
P1108

Bridges in mathematics Grade 5 supplement
set a3 Numbers & Operations: Estimating to Multiply & Divide
The Math Learning Center, PO Box 12929, Salem, Oregon 97309. Tel. 1 800 575–8130.
© 2008 by The Math Learning Center
All rights reserved.
Prepared for publication on Macintosh Desktop Publishing system.
Printed in the United States of America.
P1108
The Math Learning Center grants permission to classroom teachers to reproduce blackline
masters in appropriate quantities for their classroom use.
Bridges in Mathematics is a standards-based K–5 curriculum that provides a unique blend
of concept development and skills practice in the context of problem solving. It incorpo-
rates the Number Corner, a collection of daily skill-building activities for students.
The Math Learning Center is a nonprofit organization serving the education community.
Our mission is to inspire and enable individuals to discover and develop their mathematical
confidence and ability. We offer innovative and standards-based professional development,
curriculum, materials, and resources to support learning and teaching. To find out more,
visit us at www.mathlearningcenter.org.

Bridges in Mathematics Grade 5 Supplement • a3.1© The Math Learning Center
name date
set a3 number & Operations: estimating to multiply & divide Blackline Run a class set.
set a3 H Independent Worksheet 1
Independent Worksheet
using Compatible numbers to multiply & divide
Mathematicians sometimes estimate answers to multiplication and division prob-lems by using compatible numbers. Compatible numbers are numbers that work well together.
example 1 A page in my chapter book has 12 words in each line and 32 lines on the page. About how many words on the whole page? Change 12 and 32 to nearby numbers that are easi-er to multiply in your head.
12 is close to 10 32 is close to 30 10 x 30 = 300, so the page has about 300 words.
example 2 Mr. Gomez had 396 cray-ons left over at the end of the year. He’s putting them in bags to send home with the kids. He has 20 students in his class. About how many crayons will each stu-dent get? Change 396 to a nearby num-ber that is easier to divide by 20.
396 is close to 400. 20 is already a friendly number. You don’t always have to change both numbers. 400 ÷ 20 = 20, so each student will get about 20 crayons.
1 Choose a chapter book from your classroom. Turn to a page in the middle of the book. About how many words do you think there are on the page? To find out, count the number of words in one line. Next, count the number of lines on the page. Record the information:
Words in one line _______________ Lines on the page ________________
2 Use compatible numbers to estimate the number of words on the page. Show your work.
(Continued on back.)

© The Math Learning Centera3.2 • Bridges in Mathematics Grade 5 Supplement
set a3 number & Operations: estimating to multiply & divide Blackline Run a class set.
3 All the fourth and fifth graders at King School are going on a field trip with their teachers and some parent helpers. In all, there will be 197 people. The bus company plans to use 4 buses. Estimate how many people will ride in each bus. Use compatible numbers to help you. Show your work.
4 Use compatible numbers to estimate the answer to each problem below. To use this estimation strategy, change the actual numbers to nearby numbers that are compatible. The first two are done for you.
multiplication example 21 × 19
21 is close to _______.
19 is close to _______.
_______ × _______ = _______,
so the answer is about _______.
division example 249 ÷ 24
249 is close to _______.
24 is close to _______.
_______ ÷ _______ = _______,
so the answer is about _______.
a 32 × 29
32 is close to _______.
29 is close to _______.
_______ × _______ = _______,
so the answer is about _______.
b 153 ÷ 9
153 is close to _______.
9 is close to _______.
_______ ÷ _______ = _______,
so the answer is about _______.
c 49 × 19
49 is close to _______.
19 is close to _______.
_______ × _______ = _______,
so the answer is about _______.
d 119 ÷ 9
119 is close to _______.
9 is close to _______.
_______ ÷ _______ = _______,
so the answer is about _______.
Independent Worksheet 1 Using Compatible Numbers to Multiply & Divide (cont.)
20
2020 20 400
400
250
2525250 10
10

Bridges in Mathematics Grade 5 Supplement • a3.3© The Math Learning Center
name date
set a3 number & Operations: estimating to multiply & divide Blackline Run a class set.
set a3 H Independent Worksheet 2
Independent Worksheet
more multiplication & division with Compatible numbers
1 Which 2 numbers in the box could you multiply to come closest to 600? Circle them. Show your thinking.
39 47 5 62 87 11 5 26
2 Estimate the answers to the following multiplication problems. Use compatible numbers to help. Show your work. The first one is done for you.
example 31 × 28
31 is close to _____.
28 is close to _____.
_____ × _____ = _____,
so the answer is about _____.
a 39 × 22
b 84 × 11 c 48 × 18
(Continued on back.)
30
3030 30 900
900

© The Math Learning Centera3.4 • Bridges in Mathematics Grade 5 Supplement
set a3 number & Operations: estimating to multiply & divide Blackline Run a class set.
3 Estimate the answers to the following division problems. Use compatible num-bers to help you. Show your work.
a About how much does each can of sugar-free soda cost if a case of 24 costs $5.99?
b 9 scouts want to split a bag of 262 peanuts equally. About how many peanuts will each of the scouts get?
c The scouts in Lincoln City collected 594 cans of food Now they’re going to put the cans into bags to take to the Food Bank. If they put 21 cans in each bag, about how many bags of food can they make?
Independent Worksheet 2 More Multiplication & Division with Compatible Numbers (cont.)

Bridges in Mathematics Grade 5 Supplement • a3.5© The Math Learning Center
name date
set a3 number & Operations: estimating to multiply & divide Blackline Run a class set.
set a3 H Independent Worksheet 3
Independent Worksheet
reasonable estimates in multiplication & division
1 Fill in the bubble in front of the answer that gives a reasonable estimate for each problem. (Hint: Try using compatible numbers to help.) To the right of the problem, use words, numbers and/or pictures to explain why you think it is a reasonable estimate. The first one is done for you.
example 19 × 22
229
290
400
500
a 28 × 21
400
500
600
700
b 26 × 9
180
260
300
540
c 206 ÷ 19 =
10
16
20
26
d 598 ÷ 18 =
18
21
25
30
e 994 ÷ 19 =
40
45
50
60
(Continued on back.)
19 is close to 20. 22 is close to 20.
20 x 20 =400, so 400 is the
best estimate.

© The Math Learning Centera3.6 • Bridges in Mathematics Grade 5 Supplement
set a3 number & Operations: estimating to multiply & divide Blackline Run a class set.
2 Brianna has $9.00. Baseball trading cards cost $0.49 each. She estimates that she will be able to buy about 27 cards with her money. Is this a reasonable esti-mate? Use words, numbers and/or pictures to explain your answer.
Independent Worksheet 3 Reasonable Estimates in Multiplication & Division (cont.)

Grade 5 supplementset a4 Numbers & Operations: Long Divison
IncludesActivity 1: Introducing the Standard Algorithm A4.1
Activity 2: Extending the Standard Algorithm A4.11
skills & ConceptsH fluently and accurately divide up to a 4-digit number by 1- and 2-digit divisors accurately
using the standard long division algorithm
H estimate quotients to approximate solutions and determine reasonableness of answers in
problems involving up to 2-digit divisors
H determine and interpret the mean of a small data set of whole numbers
P0509

Bridges in mathematics Grade 5 supplement
set a4 Numbers & Operations: Long Division
The Math Learning Center, PO Box 12929, Salem, Oregon 97309. Tel. 1 800 575–8130.
© 2008 by The Math Learning Center
All rights reserved.
Prepared for publication on Macintosh Desktop Publishing system.
Printed in the United States of America.
P0509
The Math Learning Center grants permission to classroom teachers to reproduce blackline
masters in appropriate quantities for their classroom use.
Bridges in Mathematics is a standards-based K–5 curriculum that provides a unique blend
of concept development and skills practice in the context of problem solving. It incorpo-
rates the Number Corner, a collection of daily skill-building activities for students.
The Math Learning Center is a nonprofit organization serving the education community.
Our mission is to inspire and enable individuals to discover and develop their mathematical
confidence and ability. We offer innovative and standards-based professional development,
curriculum, materials, and resources to support learning and teaching. To find out more,
visit us at www.mathlearningcenter.org.

set a4 H Activity 1
activity
Introducing the standard algorithm
OverviewChances are, many of your students are using the strate-
gies taught in Unit Four with pretty good success by now.
There are times, however, when the multiplication menu is
not the most efficient or effective method to divide one
number by another. This activity introduces the standard
algorithm for long division as another method.
skills & ConceptsH fluently and accurately divide up to a 4-digit number
by 1- and 2-digit divisors accurately using the standard
long division algorithm
H estimate quotients to approximate solutions and
determine reasonableness of answers in problems
involving up to 2-digit divisors
H determine and interpret the mean of a small data set
of whole numbers
You’ll needH Schools in Two Towns (pages A4.5 and A4.6, run one
copy of each sheet on a transparency)
H More Long Division Problems (page A4.7, run one
copy on a transparency)
H Using the Standard Algorithm for Long Division (pages
A4.8 and A4.9, run a class set)
H a piece of paper to mask parts of the transparency
H overhead pens
H Student Math Journals or 1 piece of lined or grid
paper per student
Instructions for Introducing the standard algorithm1. Let students know that you are going to introduce a strategy for long division that may be new to some of them, and familiar to others. Place the top portion of the first overhead on display as students get out their journals and pencils.
Set A4 Numbers & Operations: Long Division Blackline Run one copy on a transparency.
Schools in Two Towns page 1 of 2
1 There are 3 elementary schools in Jewel. The chart below shows how many students there are in each school.
School Number of Students
Lincoln Elementary 296
Washington Elementary 322
King Elementary 245
a What is the average (mean) number of students in the Jewel elementary schools?
b Estimate the average.
c Find the average.
83 6 3 296322
+ 245863
2. Read the information on the overhead with the class. Review the definition of the term mean, and ask students to record an estimate in their journals, along with a brief explanation of their thinking. After a minute or two, ask them to pair-share their estimates. Then call on volunteers to share their estimates with the class and explain their thinking.
set a4 numbers & Operations: long division
Bridges in Mathematics Grade 5 Supplement • a4.1© The Math Learning Center
Marcus I said the average is going to be around 280. The first school is almost 300. The second one is more than 300, but the third school is a little less than 250. I think the third school is going to bring the average down to around 280.
Elisha I pretty much agree with Marcus, but I think the average is going to be around 275.
3. Now show the bottom portion of the overhead. Review with students how to find the mean by adding and then dividing. Ask them to add the three numbers in their journals, but go no further for now. Have them raise their hands when they have the total. When most hands are raised, call on a few students to share their answers. When there is general consensus that the total is 863, work with student input to record the division problem on the grid that has been provided.
Set A4 Numbers & Operations: Long Division Blackline Run one copy on a transparency.
Schools in Two Towns page 1 of 2
1 There are 3 elementary schools in Jewel. The chart below shows how many students there are in each school.
School Number of Students
Lincoln Elementary 296
Washington Elementary 322
King Elementary 245
a What is the average (mean) number of students in the Jewel elementary schools?
b Estimate the average.
c Find the average.
83 6 3 296322
+ 245863
4. Think with students about how using the multiplication menu would play out for this problem. What if you started with 10 × 3, then 20 × 3, then 5 × 3, as you have so many times in solving long division problems this year. Would this information be useful and helpful? Does it seem as if the multiplication menu would be an effective and efficient strategy for solving this problem? Let students pair-share for a minute about these questions.
5. Then explain that there is another strategy that might be easier in this situation. It is called the “stan-dard algorithm” for long division because it is a common paper-and-pencil method for finding a quotient. When people use this strategy, they work with the numbers in the divisor separately. Tell students you are going to demonstrate the strategy. Ask them to watch closely to see if they can understand what you are doing. Challenge them to watch for some of the differences and likenesses between the standard algo-rithm and the multiplication menu strategy.
Teacher First I look at the 8 in 863 and think, “8 divided by 3 is more than 2, just not more than 3, because 2 × 3 is 6, and 3 × 3 is too much.” So I write a 2 in the hundreds place. Then I write 6 un-der the 8 and subtract. That’s 2, so I bring down the 6. Now I divide 26 by 3. I get 8 with 2 left over since 8 × 3 is 24. So I write an 8 in the tens place and subtract 24 from 26. Does it look like the av-erage is going to be close to your estimate?
Students I’ve seen this way to divide from my sister. It looks like it’s going to come out to two eighty-something. I think maybe 275 is a little too low.
6. Continue until the problem is complete. Then discuss the remainder with the students. What does a remainder of 2 mean in this context? Would it make best sense to express the remainder as a whole number, a decimal, or a fraction? Why?
activity 1 Introducing the Standard Algorithm (cont.)
set a4 numbers & Operations: long division
© The Math Learning Centera4.2 • Bridges in Mathematics Grade 5 Supplement
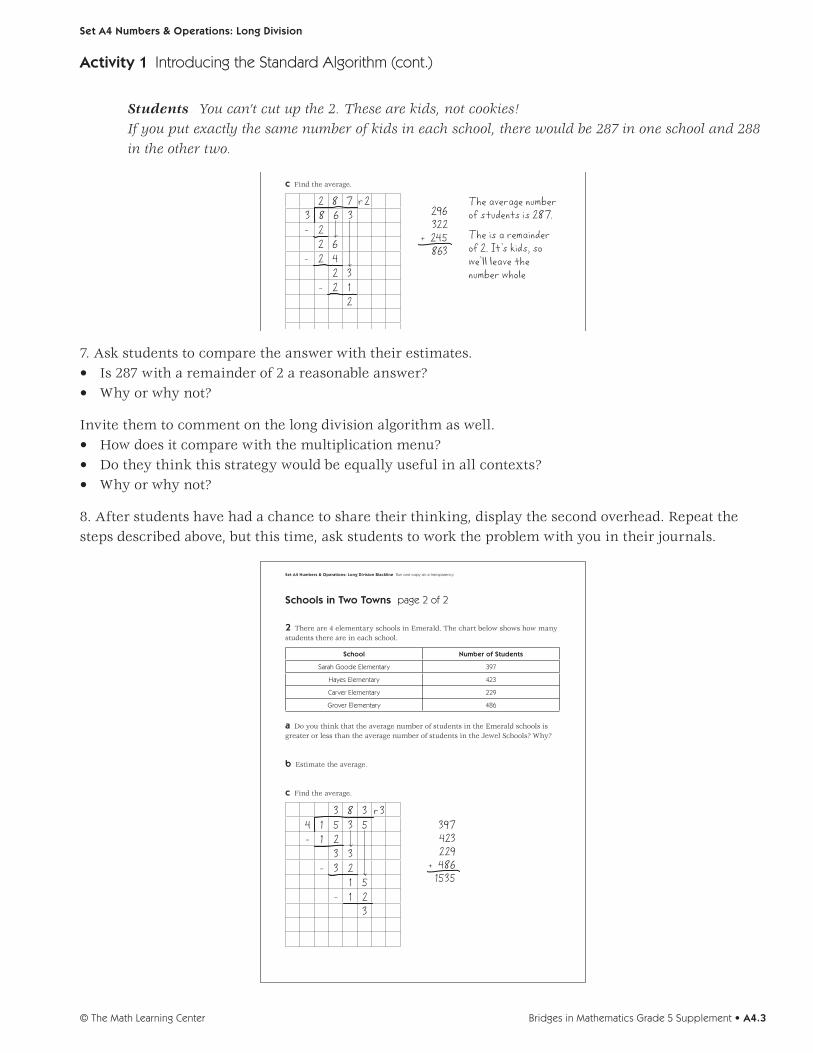
Students You can’t cut up the 2. These are kids, not cookies! If you put exactly the same number of kids in each school, there would be 287 in one school and 288 in the other two.
Set A4 Numbers & Operations: Long Division Blackline Run one copy on a transparency.
Schools in Two Towns page 1 of 2
1 There are 3 elementary schools in Jewel. The chart below shows how many students there are in each school.
School Number of Students
Lincoln Elementary 296
Washington Elementary 322
King Elementary 245
a What is the average (mean) number of students in the Jewel elementary schools?
b Estimate the average.
c Find the average.
83 6 3 296322
+ 245863
2 8 7 r 2
2-2 6
- 2 42 3
- 2 12
The average number of students is 287.
The is a remainder of 2. It’s kids, so we’ ll leave the number whole
7. Ask students to compare the answer with their estimates. • Is287witharemainderof2areasonableanswer?• Whyorwhynot?
Invite them to comment on the long division algorithm as well. • Howdoesitcomparewiththemultiplicationmenu?• Dotheythinkthisstrategywouldbeequallyusefulinallcontexts?• Whyorwhynot?
8. After students have had a chance to share their thinking, display the second overhead. Repeat the steps described above, but this time, ask students to work the problem with you in their journals.
Set A4 Numbers & Operations: Long Division Blackline Run one copy on a transparency.
Schools in Two Towns page 2 of 2
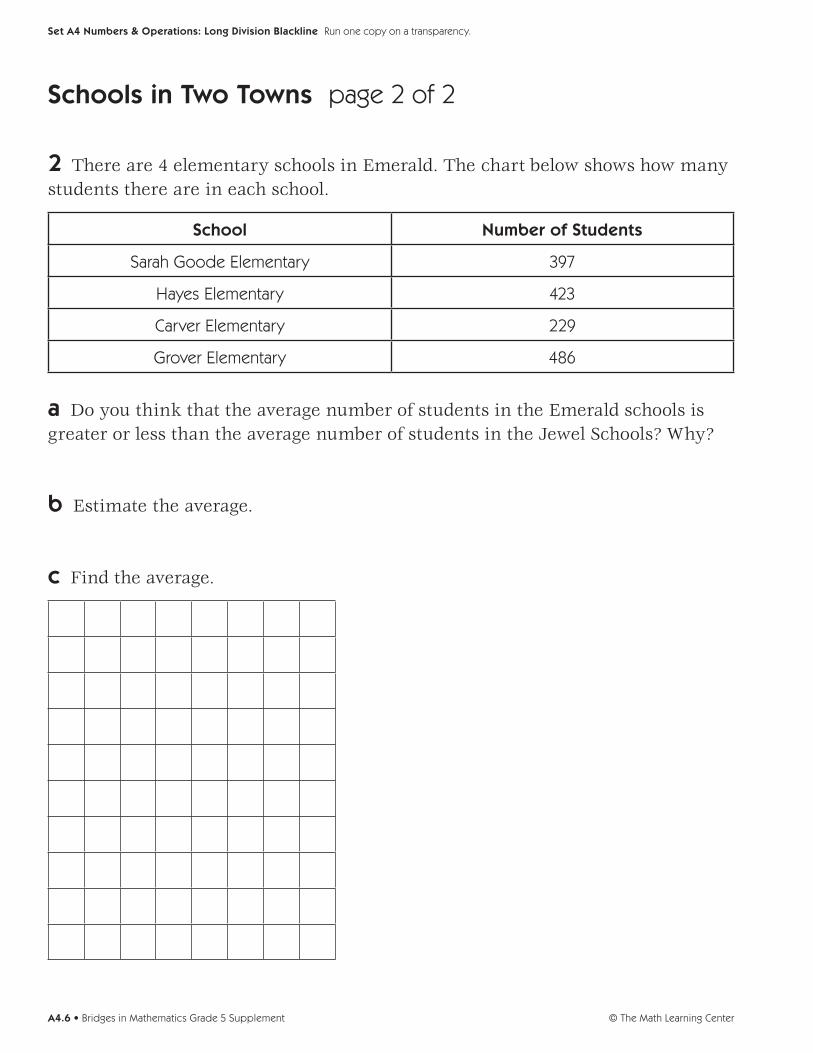
2 There are 4 elementary schools in Emerald. The chart below shows how many students there are in each school.
School Number of Students
Sarah Goode Elementary 397
Hayes Elementary 423
Carver Elementary 229
Grover Elementary 486
a Do you think that the average number of students in the Emerald schools is greater or less than the average number of students in the Jewel Schools? Why?
b Estimate the average.
c Find the average.
3 8 3 r 314 5 3 51- 2
3 3- 3 2
1 5- 1 2
3
397423229
+ 4861535
activity 1 Introducing the Standard Algorithm (cont.)
set a4 numbers & Operations: long division
Bridges in Mathematics Grade 5 Supplement • a4.3© The Math Learning Center
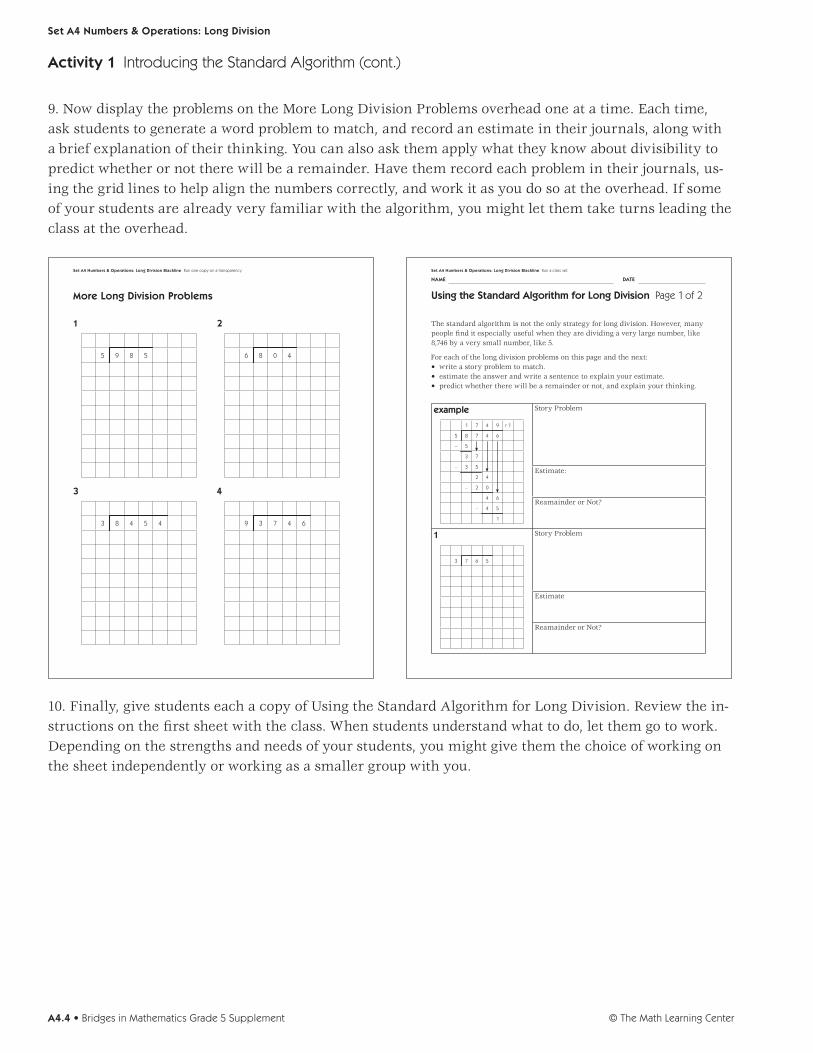
9. Now display the problems on the More Long Division Problems overhead one at a time. Each time, ask students to generate a word problem to match, and record an estimate in their journals, along with a brief explanation of their thinking. You can also ask them apply what they know about divisibility to predict whether or not there will be a remainder. Have them record each problem in their journals, us-ing the grid lines to help align the numbers correctly, and work it as you do so at the overhead. If some of your students are already very familiar with the algorithm, you might let them take turns leading the class at the overhead.
Set A4 Numbers & Operations: Long Division Blackline Run one copy on a transparency.
More Long Division Problems
1
5 9 8 5
3
3 8 4 5 4
2
6 8 0 4
4
9 3 7 4 6
NAME DATE
Set A4 Numbers & Operations: Long Division Blackline Run a class set.
Using the Standard Algorithm for Long Division Page 1 of 2
The standard algorithm is not the only strategy for long division. However, many people fi nd it especially useful when they are dividing a very large number, like 8,746 by a very small number, like 5.
For each of the long division problems on this page and the next:• write a story problem to match.• estimate the answer and write a sentence to explain your estimate.• predict whether there will be a remainder or not, and explain your thinking.
example
1 7 4 9 r 1
5 8 7 4 6
– 5
3 7
– 3 5
2 4
– 2 0
4 6
– 4 5
1
Story Problem
Estimate:
Reamainder or Not?
1
3 7 6 5
Story Problem
Estimate
Reamainder or Not?
10. Finally, give students each a copy of Using the Standard Algorithm for Long Division. Review the in-structions on the first sheet with the class. When students understand what to do, let them go to work. Depending on the strengths and needs of your students, you might give them the choice of working on the sheet independently or working as a smaller group with you.
activity 1 Introducing the Standard Algorithm (cont.)
set a4 numbers & Operations: long division
© The Math Learning Centera4.4 • Bridges in Mathematics Grade 5 Supplement

Bridges in Mathematics Grade 5 Supplement • a4.5© The Math Learning Center
set a4 numbers & Operations: long division Blackline Run one copy on a transparency.
schools in two towns page 1 of 2
1 There are 3 elementary schools in Jewel. The chart below shows how many students there are in each school.
school number of students
Lincoln Elementary 296
Washington Elementary 322
King Elementary 245
a What is the average (mean) number of students in the Jewel elementary schools?
b Estimate the average.
c Find the average.
© The Math Learning Centera4.6 • Bridges in Mathematics Grade 5 Supplement
set a4 numbers & Operations: long division Blackline Run one copy on a transparency.
schools in two towns page 2 of 2
2 There are 4 elementary schools in Emerald. The chart below shows how many students there are in each school.
school number of students
Sarah Goode Elementary 397
Hayes Elementary 423
Carver Elementary 229
Grover Elementary 486
a Do you think that the average number of students in the Emerald schools is greater or less than the average number of students in the Jewel Schools? Why?
b Estimate the average.
c Find the average.
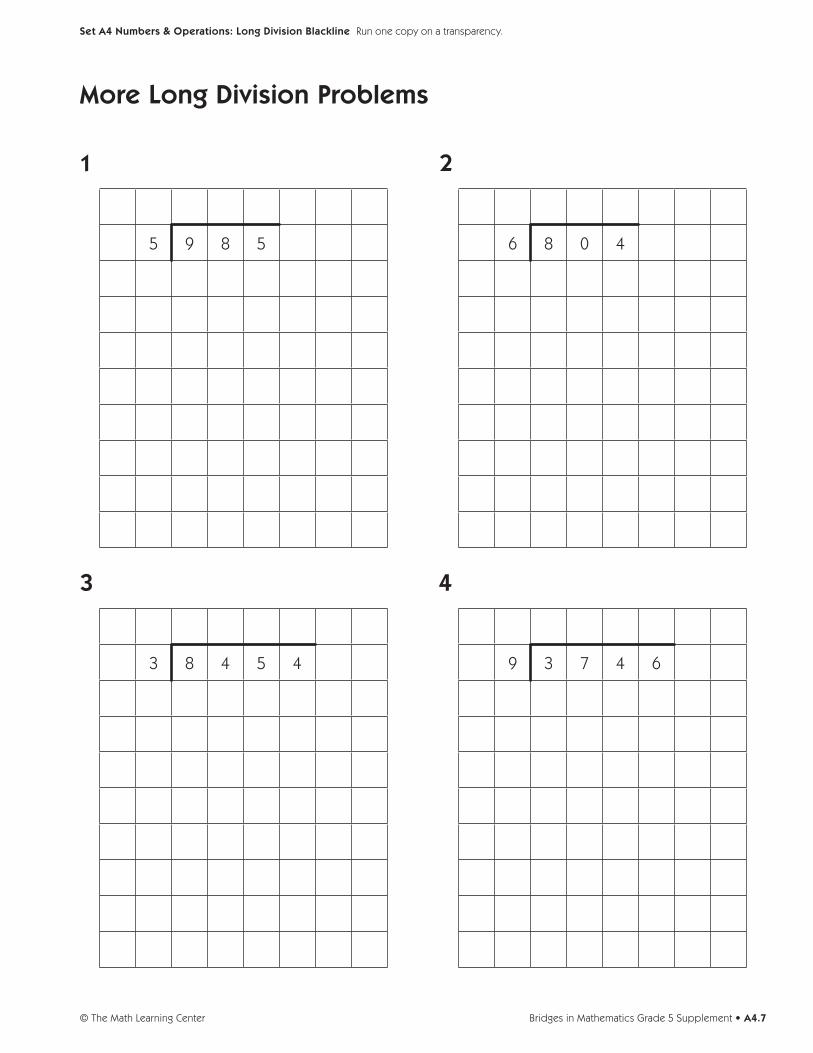
Bridges in Mathematics Grade 5 Supplement • a4.7© The Math Learning Center
set a4 numbers & Operations: long division Blackline Run one copy on a transparency.
more long division problems
1
5 9 8 5
3
3 8 4 5 4
2
6 8 0 4
4
9 3 7 4 6

© The Math Learning Centera4.8 • Bridges in Mathematics Grade 5 Supplement
name date
set a4 numbers & Operations: long division Blackline Run a class set.
using the standard algorithm for long division Page 1 of 2
The standard algorithm is not the only strategy for long division. However, many people find it especially useful when they are dividing a very large number, like 8,746 by a very small number, like 5.
For each of the long division problems on this page and the next: • writeastoryproblemtomatch. • estimatetheanswerandwriteasentencetoexplainyourestimate. • predictwhethertherewillbearemainderornot,andexplainyourthinking.
example
1 7 4 9 r 1
5 8 7 4 6
– 5
3 7
– 3 5
2 4
– 2 0
4 6
– 4 5
1
Story Problem
Estimate:
Remainder or Not?
1
3 7 6 5
Story Problem
Estimate
Remainder or Not?

Bridges in Mathematics Grade 5 Supplement • a4.9© The Math Learning Center
name date
set a4 numbers & Operations: long division Blackline Run a class set.
using the standard algorithm for long division Page 2 of 2
2
6 8 2 7
Story Problem
Estimate:
Remainder or Not?
3
5 7 4 2 0
Story Problem
Estimate
Remainder or Not?

© The Math Learning Centera4.10 • Bridges in Mathematics Grade 5 Supplement

set a4 H Activity 2
activity
extending the standard algorithm
OverviewStudents use the standard algorithm to divide 3- and
4-digit numbers by 2-digit numbers. In the process, they
explore the idea of using a “mini” multiplication menu if
and when needed.
skills & ConceptsH fluently and accurately divide up to a 4-digit number
by 1- and 2-digit divisors accurately using the standard
long division algorithm
H estimate quotients to approximate solutions and
determine reasonableness of answers in problems
involving up to 2-digit divisors
H read and interpret a line plot
H determine and interpret the mean of a small data set
of whole numbers
You’ll needH Family Math Night (page A4.15, run one copy on a
transparency)
H Family Math Night Worksheet (pages A4.16 and A4.17,
run a class set)
H a piece of paper to mask parts of the overhead
H overhead pens
H Student Math Journals or 1 piece of lined or grid
paper per student
Instructions for extending the standard algorithm1. Open the activity by explaining that the class is going to think some more about strategies for han-dling long division problems today. Then place the top portion of the Family Math Night overhead on display. Read the text with the class, and give students a minute or two to examine the line plot quietly. Ask them to think of at least two observations they can share with a partner in a minute.
Family Math Night
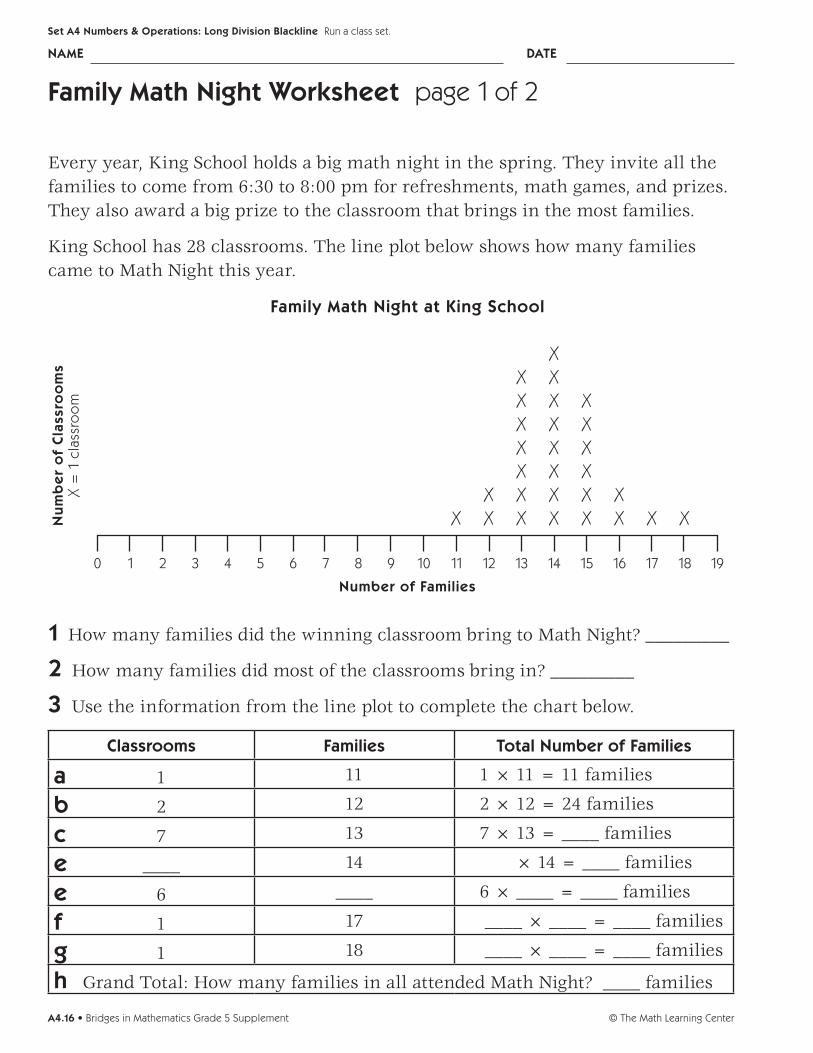
Every year, King School holds a big math night in the spring. They invite all the families to come from 6:30 to 8:00 pm for refreshments, math games, and prizes. They also award a big prize to the classroom that brings in the most families.
King School has 28 classrooms. The line plot on your sheet shows how many families came to Math Night this year.
Family Math Night at King School
Nu
mb
er
of
Cla
ssro
om
sX
= 1
cla
ssro
om
XX XX X XX X XX X XX X X
X X X X XX X X X X X X X
0 1 2 3 4 5 6 7 8 9 10 11 12 13 14 15 16 17 18 19
Number of Families
Use the information on the line plot to answer the questions on Family Math Night, sheets 1 and 2. STOP after question 4b.
Set A4 Numbers & Operations: Long Division Blackline Run one copy on a transparency.
set a4 numbers & Operations: long division
Bridges in Mathematics Grade 5 Supplement • a4.11© The Math Learning Center

activity 2 Extending the Standard Algorithm (cont.)
2. Have students pair-share their observations about the line plot. Then pose the following questions about the line plot.• Whatinformationdoesthelineplotprovide?• Whomightbeinterestedinthisinformation?• Whatdoeseachxstandfor?(aclassroom)• Howmanyclassroomsbrought14familiestoMathNight?(8classrooms)• Howmanyfamilieswasthatinall?(112families)• AbouthowmanyfamiliesinallcametoMathNight?• Canyoufindtheexacttotalbycountingupthex’s?Whynot?• WhatdoyouneedtodotofindthetotalnumberoffamiliesthatcametoMathNight?
Besurestudentsunderstandthattheycan’tfindthetotalnumberoffamiliesbysimplycountingthex’sonthelineplot,becauseeachxstandsforaclassroom.Thereare6x’sabovethe15,whichmeansthat6classroomsbroughtin15familieseach.6×15is90,andthat’sonlypartofthetotal.
3. Now give students each a copy of the Family Math Night Worksheets, and display the prompt toward the bottom of the Family Math Night overhead that instructs students to use the information on theline plot to answer the questions on their sheets. Be sure students undertand they need to stop after ques-tion 4b on the second sheet.
Family Math Night Worksheet page 1 of 2
Every year, King School holds a big math night in the spring. They invite all the families to come from 6:30 to 8:00 pm for refreshments, math games, and prizes. They also award a big prize to the classroom that brings in the most families.
King School has 28 classrooms. The line plot below shows how many families came to Math Night this year.
Family Math Night at King School
Nu
mb
er
of
Cla
ssro
om
sX
= 1
cla
ssro
om
XX XX X XX X XX X XX X X
X X X X XX X X X X X X X
0 1 2 3 4 5 6 7 8 9 10 11 12 13 14 15 16 17 18 19
Number of Families
1 How many families did the winning classroom bring to Math Night? _________
2 How many families did most of the classrooms bring in? _________
3 Use the information from the line plot to complete the chart below.
Classrooms Families Total Number of Families
a 1 11 1 × 11 = 11 families
b 2 12 2 × 12 = 24 families
c 7 13 7 × 13 = ____ families
d ____ 14 × 14 = ____ families
e 6 ____ 6 × ____ = ____ families
f 1 17 ____ × ____ = ____ families
gh
1 18 ____ × ____ = ____ families
Grand Total: How many families in all attended Math Night? ____ families
NAME DATE
Set A4 Numbers & Operations: Long Division Blackline Run a class set.
Family Math Night Worksheets page 2 of 2
4a Sara thinks the average number of families that came to Math Night from each classroom is 14. Do you agree with Sara? (Circle your answer.)
Yes No
b If you think the average is 14 families per classroom, explain why. If you think the average is not 14 families, tell what you think it is and explain why.
c Use the standard algorithm for long division to fi nd the average number of families per classroom that came to Math Night at King School.
5 Copy each of the problems below into your Math Journal. Use the standard algorithm for long division to solve each. Make mini-menus when you need them.
a
2 6 9 7 8
d
3 2 7 9 6
g
2 3 8 5 9 4
b
2 4 7 8 4
e
4 3 9 9 2
h
2 6 7 4 0 2
c
1 7 6 3 1
f
1 4 5 0 7 7
i
3 8 9 4 1 0
NAME DATE
Set A4 Numbers & Operations: Long Division Blackline Run a class set.
The average number offamilies per classroom was _______________
4. Read the information on the overhead to the class, and review the worksheets with them. When they understand what to do, let them go to work. Encourage them to share and compare their answers to problems3,4a,and4b,andusescratchpapertomakeorchecktheircalculations.Iftheirsolutionsdon’tmatch, challenge them to work together until they can come to consensus.
set a4 numbers & Operations: long division
© The Math Learning Centera4.12 • Bridges in Mathematics Grade 5 Supplement
activity 2 Extending the Standard Algorithm (cont.)
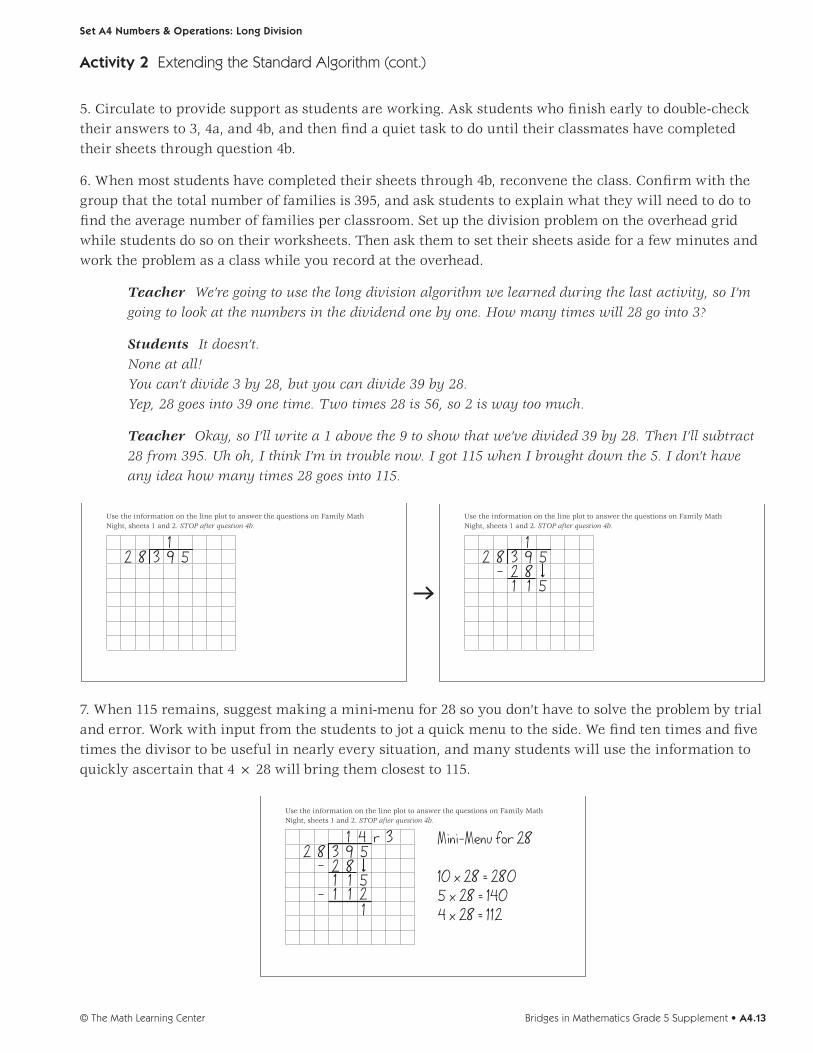
5. Circulate to provide support as students are working. Ask students who finish early to double-check their answers to 3, 4a, and 4b, and then find a quiet task to do until their classmates have completed their sheets through question 4b.
6. When most students have completed their sheets through 4b, reconvene the class. Confirm with the group that the total number of families is 395, and ask students to explain what they will need to do to find the average number of families per classroom. Set up the division problem on the overhead grid while students do so on their worksheets. Then ask them to set their sheets aside for a few minutes and work the problem as a class while you record at the overhead.
Teacher We’re going to use the long division algorithm we learned during the last activity, so I’m going to look at the numbers in the dividend one by one. How many times will 28 go into 3?
Students It doesn’t. None at all! You can’t divide 3 by 28, but you can divide 39 by 28. Yep, 28 goes into 39 one time. Two times 28 is 56, so 2 is way too much.
Teacher Okay, so I’ll write a 1 above the 9 to show that we’ve divided 39 by 28. Then I’ll subtract 28 from 395. Uh oh, I think I’m in trouble now. I got 115 when I brought down the 5. I don’t have any idea how many times 28 goes into 115.
Family Math Night
Every year, King School holds a big math night in the spring. They invite all the families to come from 6:30 to 8:00 pm for refreshments, math games, and prizes. They also award a big prize to the classroom that brings in the most families.
King School has 28 classrooms. The line plot on your sheet shows how many families came to Math Night this year.
Family Math Night at King School
Nu
mb
er
of
Cla
ssro
om
sX
= 1
cla
ssro
om
XX XX X XX X XX X XX X X
X X X X XX X X X X X X X
0 1 2 3 4 5 6 7 8 9 10 11 12 13 14 15 16 17 18 19
Number of Families
Use the information on the line plot to answer the questions on Family Math Night, sheets 1 and 2. STOP after question 4b.
Set A4 Numbers & Operations: Long Division Blackline Run one copy on a transparency.
2 8 3 9 51
Family Math Night
Every year, King School holds a big math night in the spring. They invite all the families to come from 6:30 to 8:00 pm for refreshments, math games, and prizes. They also award a big prize to the classroom that brings in the most families.
King School has 28 classrooms. The line plot on your sheet shows how many families came to Math Night this year.
Family Math Night at King School
Nu
mb
er
of
Cla
ssro
om
sX
= 1
cla
ssro
om
XX XX X XX X XX X XX X X
X X X X XX X X X X X X X
0 1 2 3 4 5 6 7 8 9 10 11 12 13 14 15 16 17 18 19
Number of Families
Use the information on the line plot to answer the questions on Family Math Night, sheets 1 and 2. STOP after question 4b.
Set A4 Numbers & Operations: Long Division Blackline Run one copy on a transparency.
2 8 3 9 52 8
1
1 1 5
7.When115remains,suggestmakingamini-menufor28soyoudon’thavetosolvetheproblembytrialand error. Work with input from the students to jot a quick menu to the side. We find ten times and five times the divisor to be useful in nearly every situation, and many students will use the information to quickly ascertain that 4 × 28 will bring them closest to 115.
Family Math Night
Every year, King School holds a big math night in the spring. They invite all the families to come from 6:30 to 8:00 pm for refreshments, math games, and prizes. They also award a big prize to the classroom that brings in the most families.
King School has 28 classrooms. The line plot on your sheet shows how many families came to Math Night this year.
Family Math Night at King School
Nu
mb
er
of
Cla
ssro
om
sX
= 1
cla
ssro
om
XX XX X XX X XX X XX X X
X X X X XX X X X X X X X
0 1 2 3 4 5 6 7 8 9 10 11 12 13 14 15 16 17 18 19
Number of Families
Use the information on the line plot to answer the questions on Family Math Night, sheets 1 and 2. STOP after question 4b.
Set A4 Numbers & Operations: Long Division Blackline Run one copy on a transparency.
2 8 3 9 52 8
1 4 r 3 Mini-Menu for 28
10 x 28 = 2805 x 28 = 1404 x 28 = 1121
1 1 21 1 5
set a4 numbers & Operations: long division
Bridges in Mathematics Grade 5 Supplement • a4.13© The Math Learning Center

activity 2 Extending the Standard Algorithm (cont.)
8. When you have finished working the problem at the overhead, ask students to replicate your work on their sheets. What did the average number of families per classroom turn out to be? Were their esti-mates close? Should the remainder of 3 be left as a whole number, or converted to a fraction or a deci-mal? Why?
Students You can’t split up families. You have to the leave the remainder whole. It’s like each classroom brought 14 families, and then 3 of the rooms had 15 if you take the average.
9. Before students complete the rest of the second sheet, erase the grid at the bottom of the overhead. Write 684 ÷ 23 into the grid, ask students to copy the problem into their journals, and work it with you, reviewing each step carefully. Chances are, students will agree that a �mini-menu� is helpful for this problem as soon as they get to the second step, 224 ÷ 23.
10. Repeat step 9 with several other problems. Here are some possibilities:
509 ÷ 19 835 ÷ 23 5,604 ÷ 17 6,003 ÷ 24
11. When most students are working comfortably with the algorithm, have them complete their second worksheet, or give them time to do so during a designated seatwork period the following day.
extensions• HomeConnections52,60and61alloffermorepracticewithlongdivision.Askstudentstousethe
long division algorithm to solve the problems on these sheets. • Encouragestudentstoexperimentwiththefull-blownmultiplicationmenu,thelongdivisionalgo-
rithm, and the mini-menu strategy you introduced today. When is each strategy most useful? Is the standard algorithm for long division always the most efficient and effective?
• Askstudentstosolveasmallsetof3–4longdivisionproblemstwiceorthreetimesaweekduringseatwork periods throughout the rest of the school year.
set a4 numbers & Operations: long division
© The Math Learning Centera4.14 • Bridges in Mathematics Grade 5 Supplement

Family math night
Every year, King School holds a big math night in the spring. They invite all the families to come from 6:30 to 8:00 pm for refreshments, math games, and prizes. They also award a big prize to the classroom that brings in the most families.
King School has 28 classrooms. The line plot on your sheet shows how many families came to Math Night this year.
Family math night at King school
nu
mb
er
of
Cla
ssro
om
s X
= 1
cla
ssro
om
XX XX X XX X XX X XX X X
X X X X XX X X X X X X X
0 1 2 3 4 5 6 7 8 9 10 11 12 13 14 15 16 17 18 19
number of Families
Use the information on the line plot to answer the questions on Family Math Night, sheets 1 and 2. STOP after question 4b.
Bridges in Mathematics Grade 5 Supplement • a4.15© The Math Learning Center
set a4 numbers & Operations: long division Blackline Run one copy on a transparency.
Family math night Worksheet page 1 of 2
Every year, King School holds a big math night in the spring. They invite all the families to come from 6:30 to 8:00 pm for refreshments, math games, and prizes. They also award a big prize to the classroom that brings in the most families.
King School has 28 classrooms. The line plot below shows how many families came to Math Night this year.
Family math night at King school
nu
mb
er
of
Cla
ssro
om
s X
= 1
cla
ssro
om
XX XX X XX X XX X XX X X
X X X X XX X X X X X X X
0 1 2 3 4 5 6 7 8 9 10 11 12 13 14 15 16 17 18 19
number of Families
1 How many families did the winning classroom bring to Math Night? _________
2 How many families did most of the classrooms bring in? _________
3 Use the information from the line plot to complete the chart below.
Classrooms Families total number of Families
a 1 11 1 × 11 = 11 families
b 2 12 2 × 12 = 24 families
c 7 13 7 × 13 = ____ families
e ____ 14 × 14 = ____ families
e 6 ____ 6 × ____ = ____ families
f 1 17 ____ × ____ = ____ families
g 1 18 ____ × ____ = ____ families
h Grand Total: How many families in all attended Math Night? ____ families
© The Math Learning Centera4.16 • Bridges in Mathematics Grade 5 Supplement
name date
set a4 numbers & Operations: long division Blackline Run a class set.

Family math night Worksheets page 2 of 2
4a Sara thinks the average number of families that came to Math Night from each classroom is 14. Do you agree with Sara? (Circle your answer.)
Yes No
b If you think the average is 14 families per classroom, explain why. If you think the average is not 14 families, tell what you think it is and explain why.
c Use the standard algorithm for long division to find the average number of families per classroom that came to Math Night at King School.
5 Copy each of the problems below into your Math Journal. Use the standard algorithm for long division to solve each. Make mini-menus when you need them.
a
2 6 9 7 8
d
3 2 7 9 6
g
2 3 8 5 9 4
b
2 4 7 8 4
e
4 3 9 9 2
h
2 6 7 4 0 2
c
1 7 6 3 1
f
1 4 5 0 7 7
i
3 8 9 4 1 0
Bridges in Mathematics Grade 5 Supplement • a4.17© The Math Learning Center
name date
set a4 numbers & Operations: long division Blackline Run a class set.
The average number of families per classroom was _______________

© The Math Learning Centera4.18 • Bridges in Mathematics Grade 5 Supplement

GRADE 5 SUPPLEMENTSet A5 Number & Operations: Adding & Subtracting Fractions
IncludesIndependent Worksheet 1: Fractions through the School Day A5.1
Independent Worksheet 2: Fractions on the Trail A5.5
Independent Worksheet 3: Adding & Subtracting Fractions A5.9
Skills & ConceptsH use fraction models to represent the addition and subtraction of fractions with like denominators
H solve problems involving the addition and subtraction of fractions with like denominators
H convert improper fractions to mixed numbers
P0310
Bridges in Mathematics Grade 5 Supplement
Set A5 Numbers & Operations: Adding & Subtracting Fractions
The Math Learning Center, PO Box 12929, Salem, Oregon 97309. Tel. 1 800 575–8130.
© 2010 by The Math Learning Center
All rights reserved.
Prepared for publication on Macintosh Desktop Publishing system.
Printed in the United States of America.
P0310
The Math Learning Center grants permission to classroom teachers to reproduce blackline
masters in appropriate quantities for their classroom use.
Bridges in Mathematics is a standards-based K–5 curriculum that provides a unique blend
of concept development and skills practice in the context of problem solving. It incorpo-
rates the Number Corner, a collection of daily skill-building activities for students.
The Math Learning Center is a nonprofit organization serving the education community.
Our mission is to inspire and enable individuals to discover and develop their mathematical
confidence and ability. We offer innovative and standards-based professional development,
curriculum, materials, and resources to support learning and teaching. To find out more,
visit us at www.mathlearningcenter.org.
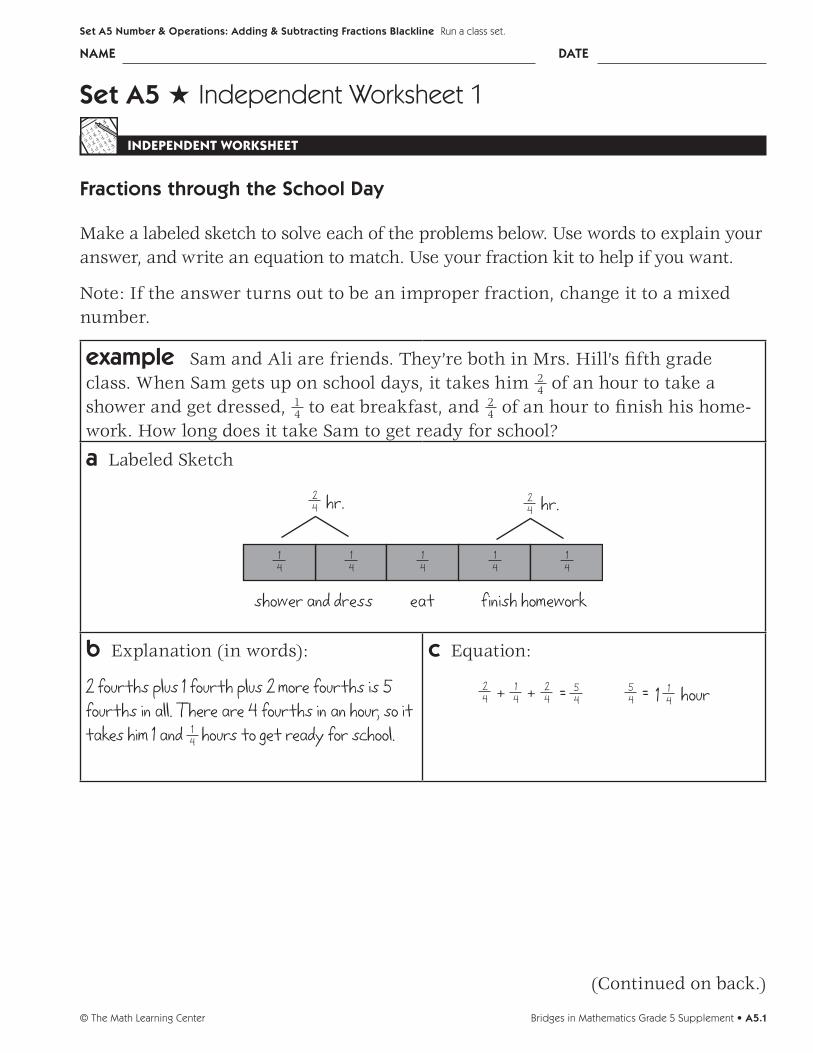
Bridges in Mathematics Grade 5 Supplement • A5.1© The Math Learning Center
NAME DATE
Set A5 Number & Operations: Adding & Subtracting Fractions Blackline Run a class set.
Set A5 H Independent Worksheet 1
INDEPENDENT WORKSHEET
Fractions through the School Day
Make a labeled sketch to solve each of the problems below. Use words to explain your answer, and write an equation to match. Use your fraction kit to help if you want.
Note: If the answer turns out to be an improper fraction, change it to a mixed number.
example Sam and Ali are friends. They’re both in Mrs. Hill’s fifth grade class. When Sam gets up on school days, it takes him 2
4 of an hour to take a shower and get dressed, 1
4 to eat breakfast, and 2 4 of an hour to finish his home-
work. How long does it take Sam to get ready for school?
a Labeled Sketch
14
14
14
14
24
14
shower and dress eat finish homework
24hr. hr.
b Explanation (in words):
2 fourths plus 1 fourth plus 2 more fourths is 5 fourths in all. There are 4 fourths in an hour, so it takes him 1 and 1
4 hours to get ready for school.
c Equation:
24 hour 1
4 + 2
4 + 5
4 = 5
4 = 1
4
1
(Continued on back.)
© The Math Learning CenterA5.2 • Bridges in Mathematics Grade 5 Supplement
Set A5 Number & Operations: Adding & Subtracting Fractions Blackline Run a class set.
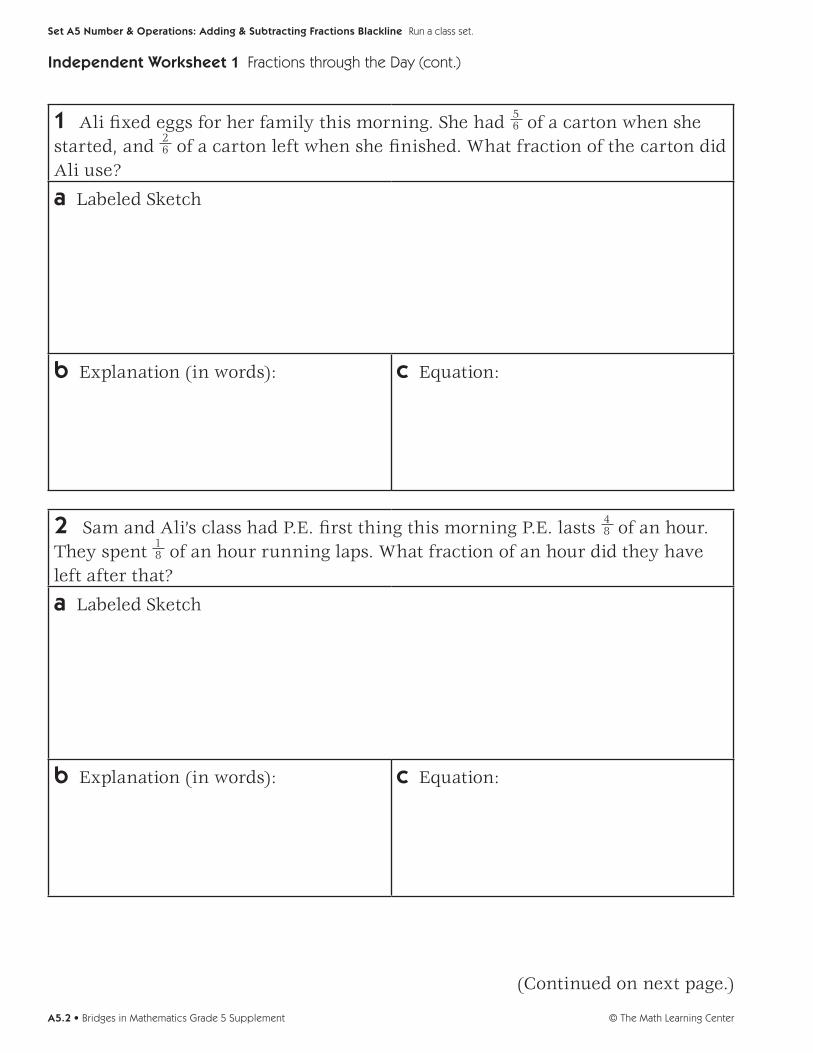
1 Ali fixed eggs for her family this morning. She had 5 6 of a carton when she
started, and 2 6 of a carton left when she finished. What fraction of the carton did
Ali use?
a Labeled Sketch
b Explanation (in words): c Equation:
2 Sam and Ali’s class had P.E. first thing this morning P.E. lasts 4 8 of an hour.
They spent 1 8 of an hour running laps. What fraction of an hour did they have
left after that?
a Labeled Sketch
b Explanation (in words): c Equation:
Independent Worksheet 1 Fractions through the Day (cont.)
(Continued on next page.)

Bridges in Mathematics Grade 5 Supplement • A5.3© The Math Learning Center
Set A5 Number & Operations: Adding & Subtracting Fractions Blackline Run a class set.
Independent Worksheet 1 Fractions through the Day (cont.)
3 Ali had 5 6 of a granola bar in her lunchbox. She ate 3
6 of the bar at recess. What fraction of the bar did she have left for lunch?
a Labeled Sketch
b Explanation (in words): c Equation:
4 They had a math test after recess. Mrs. Hill said, “You have 8 12 of an hour to
complete the test.” After 6 12 of an hour, Sam only had 1 page left to go. How much
of an hour did he have left to finish the last page?
a Labeled Sketch
b Explanation (in words): c Equation:
(Continued on back.)

© The Math Learning CenterA5.4 • Bridges in Mathematics Grade 5 Supplement
Set A5 Number & Operations: Adding & Subtracting Fractions Blackline Run a class set.
Independent Worksheet 1 Fractions through the Day (cont.)
5 The 5th graders at Sam and Ali’s school take turns picking up trash on the playground after lunch each day. The chart below shows how many pounds of trash each class has picked up so far this week. How many pounds have they collected in all?
Fifth Grade Class Pounds of trash
Mrs. Hill’s Class 2 1 6 pounds
Mr. Wong’s Class 1 2 6 pounds
Mrs. Tejada’s Class 1 4 6 pounds
a Labeled Sketch
b Explanation (in words): c Equation:
6 The 5th graders are painting a mural about recycling on one of the walls by the playground. So far, they’ve used 1 2
8 gallons of red paint, 2 5 8 gallons of yel-
low paint, and 2 3 8 gallon of green paint. How many gallons of paint have they
used in all?
a Labeled Sketch
b Explanation (in words): c Equation:

Bridges in Mathematics Grade 5 Supplement • A5.5© The Math Learning Center
NAME DATE
Set A5 Number & Operations: Adding & Subtracting Fractions Blackline Run a class set.
Set A5 H Independent Worksheet 2
INDEPENDENT WORKSHEET
Fractions on the Trail
There is a 2-mile hiking trail behind Kennedy School. Make a labeled sketch on the map to solve each of the problems below. Add more marks and fractions to the line if you need to. Use words to explain your answer, and write an equation to match.
Note: If the answer turns out to be an improper fraction, change it to a mixed number.
example Marissa and her mom ran the first 1 1 4 miles of the trail. They got
tired, so they walked the rest of the way. How far did they walk?
a Labeled Sketch
mi.14
Ran 1
12Start mile 1 mile 2 miles
12 mile1
mi.14mi.1
4
mi.14
1 mi.14
Walked mi.34
b Explanation (in words):
They walked 3 4 of a mile because 2 – 1 leaves 1 mile,
and then they ran another 1 4 of a mile. That left
3 4 of mile to go.
c Equation
mile14 = 3
4 2 - 1
(Continued on back.)

© The Math Learning CenterA5.6 • Bridges in Mathematics Grade 5 Supplement
Set A5 Number & Operations: Adding & Subtracting Fractions Blackline Run a class set.
1 Tonio took his little brother for a walk on the trail. They walked 3 4 of a mile
Then they turned around and went back to the start. How many miles did they walk in all?
a Labeled Sketch
12Start mile 1 mile 2 miles
12 mile1
b Explanation (in words): c Equation:
2 Troy and Eric decided to run the whole 2 miles. Eric twisted his ankle after they’d gone 1 1
8 of a mile. They decided to walk the rest of the way and call Er-ic’s dad to come get them. How many eighths of a mile did they have to walk to get to the end of the trail?
a Labeled Sketch
12Start mile 1 mile 2 miles
12 mile1
b Explanation (in words): c Equation:
Independent Worksheet 2 Fractions on the Trail (cont.)
(Continued on next page.)

Bridges in Mathematics Grade 5 Supplement • A5.7© The Math Learning Center
Set A5 Number & Operations: Adding & Subtracting Fractions Blackline Run a class set.
3 Kendra and her grandma walked 1 3 8 of a mile down the trail. Then they turned
around and walked back to the start. How many miles did they walk in all?
a Labeled Sketch
12Start mile 1 mile 2 miles
12 mile1
b Explanation (in words): c Equation:
4 Carter was walking down the trail. When he got to the 3 4 mile marker, he
realized that his glasses had slipped out of his pocket. He turned around and started to go back. He found his glasses right beside the 2
4 mile marker. Then he turned around and walked to the end of the trail to meet his friend. How many miles did he walk in all?
a Labeled Sketch
12Start mile 1 mile 2 miles
12 mile1
b Explanation (in words): c Equation:
Fractions Independent Worksheet 2 Fractions on the Trail (cont.)
(Continued on back.)

© The Math Learning CenterA5.8 • Bridges in Mathematics Grade 5 Supplement
Set A5 Number & Operations: Adding & Subtracting Fractions Blackline Run a class set.
5 Everyday, Mrs. Goodman starts at the beginning of the trail and walks 1 1
4 miles. Then she turns around and walks back to the start. How many miles does she walk in 1 week (7 days)?
a Labeled Sketch
12Start mile 1 mile 2 miles
12 mile1
b Explanation (in words): c Equation:
CHALLENGE
6 Make up your own story problem about the hiking trail. Then give it to a classmate to solve. Be sure to check it first to make sure it works.
a My problem:
b Labeled Sketch
c Explanation (in words): d Equation:
Independent Worksheet 2 Fractions on the Trail (cont.)

Bridges in Mathematics Grade 5 Supplement • A5.9© The Math Learning Center
NAME DATE
Set A5 Number & Operations: Adding & Subtracting Fractions Blackline Run a class set.
Set A5 H Independent Worksheet 3
INDEPENDENT WORKSHEET
Adding & Subtracting Fractions
Use numbers, words, and labeled sketches to solve each of the problems below. Show all of your work. Use your fraction kit to help if you want.
Note: If the answer turns out to be an improper fraction, change it to a mixed number.
Problem Explanation
example381
68+ 2 1
8= 41
1
1
18
18
18
18
18
18
18
18
18
38
68
98
3 + 1 = 4
+ =
18
38
1 + 2 = 3
makes 1 because there are in 1,
and then you have left over.
98
18
18
88
68
1
2
1 56
36+ =
(Continued on back.)

© The Math Learning CenterA5.10 • Bridges in Mathematics Grade 5 Supplement
Set A5 Number & Operations: Adding & Subtracting Fractions Blackline Run a class set.
Problem Explanation
27 8
4 8
+ =
3342
34+ 3 =
4
781
58– =
Independent Worksheet 3 Adding & Subtracting Fractions (cont.)
(Continued on next page.)

Bridges in Mathematics Grade 5 Supplement • A5.11© The Math Learning Center
Set A5 Number & Operations: Adding & Subtracting Fractions Blackline Run a class set.
Problem Explanation
556336+ 2
648328– 2
CHALLENGE
726456– 2
Independent Worksheet 3 Adding & Subtracting Fractions (cont.)

© The Math Learning CenterA5.12 • Bridges in Mathematics Grade 5 Supplement

GRADE 5 SUPPLEMENTSet A6 Numbers & Operations: Fraction Concepts
IncludesActivity 1: Simplify & Compare A6.1
Activity 2: Same-Sized Pieces A6.9
Independent Worksheet 1: Using the Greatest Common Factor to Simplify Fractions A6.19
Independent Worksheet 2: Finding the Least Common Denominator A6.21
Independent Worksheet 3: LCM & GCF A6.23
Skills & ConceptsH compare fractions
H given two fractions with unlike denominators, rewrite the fractions with a common
denominator
H determine the greatest common factor and the least common multiple of two or more
whole numbers
H simplify fractions using common factors
H fluently and accurately subtract fractions (find the difference)
H estimate differences of fractions to predict solutions to problems or determine reasonable-
ness of answers.
H solve single- and multi-step word problems involving subtraction of fractions and verify
their solutions
P0310

Bridges in Mathematics Grade 5 Supplement
Set A6 Numbers & Operations: Fraction Concepts
The Math Learning Center, PO Box 12929, Salem, Oregon 97309. Tel. 1 800 575–8130.
© 2010 by The Math Learning Center
All rights reserved.
Prepared for publication on Macintosh Desktop Publishing system.
Printed in the United States of America.
P0310
The Math Learning Center grants permission to classroom teachers to reproduce blackline
masters in appropriate quantities for their classroom use.
Bridges in Mathematics is a standards-based K–5 curriculum that provides a unique blend
of concept development and skills practice in the context of problem solving. It incorpo-
rates the Number Corner, a collection of daily skill-building activities for students.
The Math Learning Center is a nonprofit organization serving the education community.
Our mission is to inspire and enable individuals to discover and develop their mathematical
confidence and ability. We offer innovative and standards-based professional development,
curriculum, materials, and resources to support learning and teaching. To find out more,
visit us at www.mathlearningcenter.org.

Set A6 H Activity 1
ACTIVITY
Simplify & Compare
OverviewDuring this activity, students learn to simplify fractions by
finding the greatest common factor of the numerator and
the denominator. Then the teacher introduces a game
to provide more practice with these new skills. Simplify
& Compare can be used as a partner game once it has
been introduced to the class, or played several times as a
whole group.
Skills & ConceptsH determine the greatest common factor of two whole
numbers
H simplify fractions using common factors
You’ll needH Simplify & Compare Game Board (page A6.7, run one
copy on a transparency)
H Simplify & Compare Record Sheets (page A6.8, run a
class set)
H students’ fraction kits (see Advance Preparation)
H 1 1/2˝ x 12˝ construction paper strips, class set plus a
few extra in each of the following colors: white, light
brown, purple, green, orange, pink, blue, and yellow
H class set of 6˝ x 9˝ manila or legal size envelopes
H class set of scissors
H class set of rulers
H overhead double spinner
H a more/less cube
H overhead pens
Advance Preparation: Making Construction Paper Fraction KitsGive each student a set of 5 construction paper strips, one each in the following colors: white, light brown, purple, green,
and orange. Reserve a set of strips for yourself as well. Holding up the white strip, label it with a 1 as students do the
same on their white strips.
1
Ask students to fold their light brown strip in half and cut it along the fold line as you do the same with your light brown
strip. Ask students to identify the value of these two pieces relative to the white strip. Then have them label each light
brown piece 1⁄2.
12
12
Note If some of your students are already quite proficient with fractions, you might increase the challenge level of this
activity by asking them to predict the length in inches of each fractional part as they cut and fold their strips.
Now ask students to fold the purple strip in half and then in half again. Before they unfold the strip, ask students to pair-
share the number of segments they’ll see and the value of each, relative to the white strip. Then ask them to unfold the
strip, check their predictions, cut along the fold lines, and label each part, as you do the same with your purple strip.
Set A6 Numbers & Operations: Fraction Concepts
Bridges in Mathematics Grade 5 Supplement • A6.1© The Math Learning Center

14
14
14
14
Next, ask students to fold their green strip in half, in half again, and in half a third time. Before they unfold it, have them
pair-share their ideas about how many segments they’ll see and how the size of each will compare to the white strip.
Some students might believe there will be 8 segments, while others are equally convinced that there will be 6. In either
case, ask students to explain their thinking, although there’s no need to reach consensus right now. When students unfold
their green strips, they’ll see 8 segments. If there’s been debate beforehand, you might continue the discussion as stu-
dents cut and label each of the green pieces.
Teacher So we got 8 parts instead of 6, even though we only folded the green strip 3 times. Why is that?
Students Because you can see when you fold it that it’s half the size of a purple piece.I think what’s doubling is the number of pieces. Every time you fold the strip, you get double the number of pieces you got the last time, like 2 is double 1, 4 is double 2, and 8 is double 4. So it is a doubling pattern, just different from how some of us thought.
Once they have cut out and labeled the eighths, ask students to consider how the purple pieces (the fourths) compare to
the whole and half strips. Students’ responses may provide some sense of their current understandings (and misconcep-
tions) about fractions.
Students The purple ones, the fourths, are half the size of the halves.Yeah, a fourth is like half of a half. Right! It’s like a half folded in half again. If you put 2 of the fourths together, they’re the same as a half.
Teacher That’s very interesting. So how could we complete this equation? 1⁄4 + 1⁄4 =
Students It’s 1⁄2.You can see the answer if you put 2 of the purples together.
Teacher I’ve had students tell me the answer is 2⁄8. What do you think of that?
Students Maybe they didn’t understand about fractions.Maybe they didn’t have these strips to look at. I know what they did. They added the numbers on top and the numbers on the bottom.
Teacher Why doesn’t it work to do it that way?
Students It’s hard to explain. I think fractions don’t work the same as regular numbers.I think it’s because they’re pieces, like parts of something else. I mean, if you added 2 of the white strips together, you’d get 2 because 1 + 1 is 2. But if you add 2 fourths together, it makes a larger piece—a half. And if you show two-eighths, two of the green pieces together, you can see it’s not the same as one-fourth plus one-fourth.
Now ask students to fold their orange strip in half 4 times. Again, ask them to make predictions about the number of
segments they’ll see when they unfold the strip and how big each segment will be relative to the others they’ve cut and
labeled. After a bit of discussion, have them cut the orange strip along the folds and label each piece.
Activity 1 Simplify & Compare (cont.)
Set A6 Numbers & Operations: Fraction Concepts
© The Math Learning CenterA6.2 • Bridges in Mathematics Grade 5 Supplement

Finally, ask students to work in pairs to arrange one of their sets as shown on the next page. Give them a couple minutes to
pair-share mathematical observations about the pieces, and then invite volunteers to share their thinking with the class.
1
12
12
14
14
14
14
18
18
18
18
18
18
18
18
116
116
116
116
116
116
116
116
116
116
116
116
116
116
116
116
Students The number of pieces in each row doubles. It goes 1, 2, 4, 8, then 16.Whatever the number is on the bottom, that’s how many there are of that piece, like there are 4 fourths, 8 eighths, and 16 sixteenths. And they all match up. You can see that 2 fourths make a half, 4 eighths make a half, and 8 six-teenths make a half. Remember when you said that you had some kids who thought that if you added 1⁄4 + 1⁄4 you’d get 2⁄8? But you can see that 2⁄8 is the same as 1⁄4.There’s stuff that doesn’t match up too, like there’s no bigger piece that’s exactly the same size as 3⁄16 or 3⁄8.
Making Thirds, Sixths, and Twelfths to Add to the Fraction KitsNext, give each student a set of 3 new construction paper strips, one each in the following colors: pink, blue, and yellow.
Ask students to use their rulers to find and mark thirds on the pink strip before they fold and cut. Then ave them label
each piece with the fraction 1⁄3.
13
13
13
Now ask students to fold the blue strip in thirds and then in half. Before they unfold the strip, ask them to pair-share the
number of segments they will see and the value of each relative to the white strip. Then ask them to unfold the strip,
check their predictions, cut it along the fold lines, and label each part.
16
16
16
16
16
16
Finally, ask the students to describe and then try any methods they can devise to fold the yellow strip into twelfths. Let
them experiment for a few minutes. Some students may reason that they will be able to make twelfths by folding the strip
into thirds, then in half, and then in half again. Others may use their rulers, reasoning that if the length of the whole is 12
inches, each twelfth must be 1". Still others may work entirely by trial and error and will need an extra yellow strip or two.
When they are finished, give students each an envelope to store all their fraction pieces. (It’s fine to fold the white strip so
it will fit.)
Activity 1 Simplify & Compare (cont.)
Set A6 Numbers & Operations: Fraction Concepts
Bridges in Mathematics Grade 5 Supplement • A6.3© The Math Learning Center

Instructions for Simplify & Compare1. Explain that students are going to use their fraction kits to learn more about fractions and play a new game today. Have them take all the fraction strips out of their envelopes and stack them in neat piles by size on their desks.
2. Write the fraction 6⁄8 at the overhead. Read it with the students and ask them to build the fraction with their pieces. Then challenge them to lay out an equivalent fraction with fewer pieces, all the same size as one another. Most children will set out three fourths in response. If some students set out one half and one fourth, remind them that all the pieces in the equivalent fraction have to be the same size.
18
14
14
14
18
18
18
18
18
3. Ask students to share any observations they can make about the two sets of pieces. Record the equa-tion 6⁄8 = 3⁄4 on the overhead, and have students return the pieces they have just used to their stacks. Then write 8⁄16, and have students show this fraction with their pieces. When most have finished, ask them to build all the equivalent fractions they can find, using only same-sized pieces for each one. Give them a minute to work and talk with one another, and then invite volunteers to share their results.
116
18
14
14
12
18
18
18
116
116
116
116
116
116
116
Students I got 8 16 , 4
8 , 2 4 , and 1
2 .They’re all the same as 1
2 . When you use bigger pieces, you don’t need as many.
4. Write a series of numbers and arrows on the board to represent the sequence. Ask students to pair-share any observations they can make about the sequence of fractions, and then have volunteers share their ideas with the class. Can they find and describe any patterns? How do the numbers relate to one another? Which requires the fewest pieces to build?
816
48
24
12
Students The numbers on the top, the numerators, go 8, 4, 2, and 1. It’s like they keep getting cut in half. It’s the same with the numbers on the bottom. 16 ÷ 2 is 8. 8 ÷ 2 is 4. 4 ÷ 2 is 2. A half was the fastest way to build the fraction. I knew
8 16 was a half to begin with because 8 is half of 16.
Every number on the top is half of the number on the bottom.
5. Explain that 1⁄2 is the simplest way to show 8⁄16 because the numerator (1) and denominator (2) have no common factors other than 1.
Activity 1 Simplify & Compare (cont.)
Set A6 Numbers & Operations: Fraction Concepts
© The Math Learning CenterA6.4 • Bridges in Mathematics Grade 5 Supplement

6. Remind students that a factor is a whole number that divides exactly into another number. One way people find factors is to think of the pairs of numbers that can be multiplied to make a third number. Work with input from the students to list the factors of 8 and 16.
Factors of 8 are 1, 2, 4, and 8. You can divide 8 by each of these numbers.
1 x 8 = 8 2 x 4 = 8
Factors of 16 are 1, 2, 4, 8, and 16. You can divide 16 by each of these numbers.
1 x 16 = 16 2 x 8 = 16 4 x 4 = 16
7. Work with input from the class to identify and circle the factors 8 and 16 have in common: 1, 2, 4, and 8. Then draw students’ attention back to 1⁄2. What are the factors of 1 and 2? What factors do the two num-bers have in common? Only 1, so there’s no way to simplify the fraction any further.
8. Explain that you can find the simplest form of a fraction by building it with the fewest number of pieces. But you can also simplify a fraction by identifying the greatest common factor, or the biggest num-ber by which you can divide both the numerator and the denominator. Write 12⁄16 on the board. Can this fraction be simplified? Ask students to pair-share ideas about the largest number by which both 12 and 16 can be divided. When they have identified 4 as the greatest common factor of 12 and 16, record the operation shown below at the overhead, and ask students to confirm it with their pieces. Is it true that 12⁄16 cannot be built with any fewer pieces than 3 fourths?
÷÷
= =1216
1216
44
34
34
116
14
14
14
116
116
116
116
116
116
116
116
116
116
116
9. Repeat step 8 with 10⁄12, 3⁄16, and 12⁄8. Students will note that 3⁄16 cannot be simplified because 3 and 16 have no factors in common other than 1. They will also discover that 12⁄8 simplifies to 3⁄2 and then con-verts to a mixed number, 11⁄2.
10. Now explain that you’re going to play a new game with students that will give them more opportuni-ties to simplify fractions by finding the greatest common factor. Ask them to carefully re-stack all their fraction strips by size while you place the Simplify & Compare game board on display at the overhead. Give students a few moments to examine it quietly, and then read the game rules with the class. Explain that they are going to play as Team 2, and you will play as Team 1. You will play a trial round so every-one can learn the rules, and then play the whole game with them.
11. Place the double spinner overlay on top of the spinners, spin both, and record the results under “Team 1”. Work with students to simplify your fraction by finding the greatest common factor for the nu-merator and denominator. Invite them to check the results with their fraction pieces as well.
12. Invite a volunteer up to the overhead to spin for the class. Record the students’ fraction under “Team 2” and work with their input to simplify it. Then ask students to compare their fraction with yours. If they are not sure which fraction is greater, have them build both with their fraction pieces. Use a <, >,
Set A6 Numbers & Operations: Fraction Concepts
Bridges in Mathematics Grade 5 Supplement • A6.5© The Math Learning Center

or = sign to show the results. Then have a second volunteer roll the more/less cube to determine the winner. Circle the winning fraction on the overhead.
Teacher I really lucked out on this first trial. I thought you were going to win because 3 4 is greater
than 1 2 , but Kendra rolled “less” instead of “more”.
23
4
68
10
12
1
34
6
812
16
12
16
Scoreboard
Team 1
Team 2
Team 1 Team 2
Simplifyand
Compare
Simplify & Compare Game Board
Take turns:
1. Spin the top spinner to get your numer-ator. Spin the bottom spinner to get your denominator.
2. Record your fraction. Simplify it if you can. Change it to a mixed number if it is greater than 1.
3. After each of you have had a turn,use a <, =, or > sign to compare the two fractions.
4. Play 6 rounds. Then roll a More/Less cube to see which team wins each round. Circle the winning fraction and mark a point for the correct team on the score board each time.
Set A6 Numbers & Operations: Fraction Concepts Blackline Run a copy on a transparency.
68816
<12
34
MORE
LESS
LESS
13. Once the trial round is completed, erase the overhead. Give students each a copy of the Simplify & Compare record sheet and play 6 rounds with the class. You will need to erase the overhead between each round, but students will have a record of the complete game on their sheets. At the end of the game, have students take turns rolling the more/less cube for each pair of fractions. Have them circle the winning fraction for each round, fill in the scoreboard on their papers, and determine the winning team. If any of the pairs of fractions are equal, both teams score a point for the round.
Extensions • Play Simplify & Compare several times with the class. The game provides an engaging context in
which to practice simplifying and comparing fractions, and you don’t have to play all 6 rounds at once. • Run extra copies of the record sheet and game board, and have the students play the game in pairs.
Encourage them to use their fraction kits to confirm their answers if necessary.
INDEPENDENT WORKSHEET
Use Set A6 Independent Worksheets 1 and 3 to provide students more practice simplifying fractions by finding the greatest common factor for the numerator and denominator.
Set A6 Numbers & Operations: Fraction Concepts
© The Math Learning CenterA6.6 • Bridges in Mathematics Grade 5 Supplement

23
4
68
10
12
1
34
6
812
16
12
16
Scoreboard
Team 1
Team 2
Team 1 Team 2
Simplifyand
Compare
Simplify & Compare Game Board
Take turns:
1 Spin the top spinner to get your numer-ator. Spin the bottom spinner to get your denominator.
2 Record your fraction. Simplify it if you can. Change it to a mixed number if it is greater than 1.
3 After each of you have had a turn, use a <, =, or > sign to compare the two fractions.
4 Play 6 rounds. Then roll a More/Less cube to see which team wins each round. Circle the winning fraction and mark a point for the correct team on the score board each time.
Bridges in Mathematics Grade 5 Supplement • A6.7© The Math Learning Center
Set A6 Numbers & Operations: Fraction Concepts Blackline Run a copy on a transparency.

Simplify & Compare Record Sheet
Round 1 Round 2
Team 1 Team 2
Simplifyand
Compare
Team 1 Team 2
Simplifyand
Compare
Round 3 Round 4
Team 1 Team 2
Simplifyand
Compare
Team 1 Team 2
Simplifyand
Compare
Round 5 Round 6
Team 1 Team 2
Simplifyand
Compare
Team 1 Team 2
Simplifyand
Compare
Scoreboard
Team 1 Team 2
© The Math Learning CenterA6.8 • Bridges in Mathematics Grade 5 Supplement
NAME DATE
Set A6 Numbers & Operations: Fraction Concepts Blackline Run a class set.

Set A6 H Activity 2
ACTIVITY
Same-Sized Pieces
OverviewStudents use sketches to compare fractions with unlike
denominators. The teacher then introduces the idea of
finding the least common multiple to rewrite fractions so
they have common denominators. Students practice and
apply this skill as a whole group and then independently.
Skills & ConceptsH find the difference between two fractions
H find the least common multiple of two or more whole
numbers
H given two fractions with unlike denominators, rewrite
the fractions with a common denominator
You’ll needH Square Sandwiches & Bedroom Walls (page A6.14, run
one copy on a transparency)
H Same-Sized Pieces (page A6.15, run a class set)
H Fraction Equivalents Worksheet (pages A6.16 and A6.17
run a class set)
H piece of paper to mask parts of the overhead
H overhead pens
H rulers
Instructions for Same-Sized Pieces1. Let students know that during this activity the class is going to develop some strategies for comparing fractions. Then display the top portion of the Square Sandwiches overhead. Keep the bottom part of the overhead covered for now.
Square Sandwiches & Bedroom Walls
1 Carlos had 2 extra square sandwiches. They were exactly the same size. He gave 1
4 of the fi rst sandwich to his friend Ben and 13 of the second sandwich to his
friend Corey.
Ben said, “Hey, that’s not fair! Corey got more than I did!”
Exactly how much more did Corey get? Divide each sandwich into same-sized pieces to fi nd out.
14
13
2 Jasmine and Raven were painting 2 walls in Jasmine’s bedroom. The 2 walls were exactly the same size. Jasmine painted 1
2 of the fi rst wall. Raven painted 23
of the other wall.
Exactly how much more did Raven paint than Jasmine? Divide each wall into same-sized pieces to fi nd out. Is there more than one answer?
12
23
Set A6 Numbers & Operations: Fraction Concepts Blackline Run one copy on a transparency.
2. Read the text to the class and ask students to pair-share ideas about the situation. Is it true that Corey got more than Ben? Exactly how much more did Corey get? How might dividing each of the sandwiches into same-sized pieces help students solve the problem?
Set A6 Numbers & Operations: Fraction Concepts
Bridges in Mathematics Grade 5 Supplement • A6.9© The Math Learning Center

Students A third is more than a fourth, but it’s hard to tell how much more. If you could cut both of the sandwiches into smaller pieces, you could maybe count up the pieces to see how many more of them are in a third. I don’t get it! I think we’re supposed to figure out a way to cut the sandwiches so they both have the same number of pieces. Right now, the first sandwich is cut into 4 pieces. The second sandwich is cut into 3 pieces. How could we make more cuts so they both have the same number?
3. Give students each a copy of the Same-Sized Pieces blackline. Note with students that there are 2 cop-ies of the sandwich squares so they can try at least two different ideas. Some children might want to cut out and fold the sandwich squares, while others may want to draw lines on the squares.
4. After they have had a few minutes to work ask students to share their thinking and compare their an-swers with neighbors. Then invite several volunteers to share their thinking at the overhead.
Nick I saw that if you divide each section of the first sandwich up and down you would get 8 pieces so Ben got 2⁄8 of a sandwich. I divided the other sandwich with a line across and saw that you would get 6 pieces and two of those would be the same as the third, so Corey got 2⁄6 of a sandwich. Sixths are bigger than eighths, so 2⁄6 is more than 2⁄8.
14
13
Jade But that still doesn’t tell us how much more Corey got than Ben. I thought we were supposed to make both sandwiches into the same sized pieces.
Teacher How did you solve the problem, Jade?
Jade Well, I kind of thought about how fourths and thirds go together, and I realized you could cut both of the sandwiches into 12 pieces, like this.
14
13
Teacher Let’s look at the situation again. Should we end up with more pieces all the same size for each sandwich like Nick did or should we cut both sandwiches so they both have the same number of pieces, like Jade did? Talk to the person next to you about this.
Steven It’s easier to compare if both sandwiches are cut the same. I did the same thing as Jade. You can see that Corey got 4⁄12 of a sandwich, and Ben only got 3⁄12. Corey got 1⁄12 more than Ben did.
Activity 2 Same-Sized Pieces (cont.)
Set A6 Numbers & Operations: Fraction Concepts
© The Math Learning CenterA6.10 • Bridges in Mathematics Grade 5 Supplement
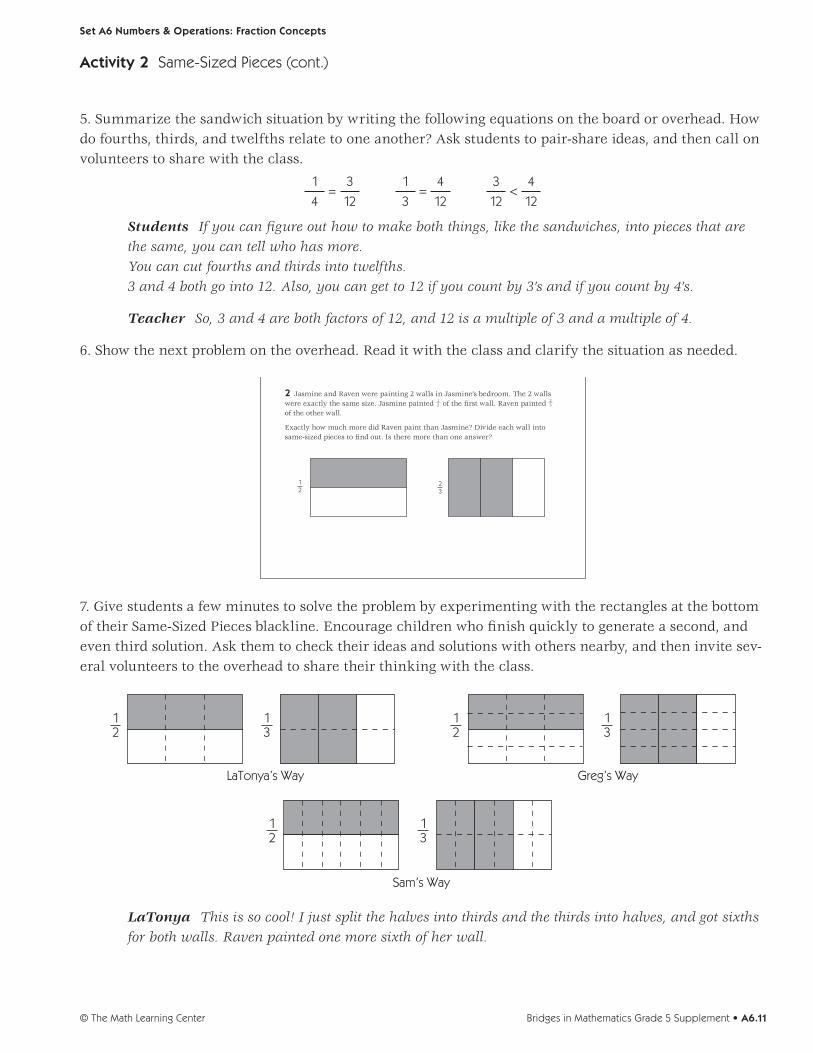
Activity 2 Same-Sized Pieces (cont.)
5. Summarize the sandwich situation by writing the following equations on the board or overhead. How do fourths, thirds, and twelfths relate to one another? Ask students to pair-share ideas, and then call on volunteers to share with the class.
1
4 =
3
12
1
3 =
4
12
3
12 <
4
12
Students If you can figure out how to make both things, like the sandwiches, into pieces that are the same, you can tell who has more. You can cut fourths and thirds into twelfths. 3 and 4 both go into 12. Also, you can get to 12 if you count by 3’s and if you count by 4’s.
Teacher So, 3 and 4 are both factors of 12, and 12 is a multiple of 3 and a multiple of 4.
6. Show the next problem on the overhead. Read it with the class and clarify the situation as needed.
Square Sandwiches & Bedroom Walls
1 Carlos had 2 extra square sandwiches. They were exactly the same size. He gave 1
4 of the fi rst sandwich to his friend Ben and 13 of the second sandwich to his
friend Corey.
Ben said, “Hey, that’s not fair! Corey got more than I did!”
Exactly how much more did Corey get? Divide each sandwich into same-sized pieces to fi nd out.
14
13
2 Jasmine and Raven were painting 2 walls in Jasmine’s bedroom. The 2 walls were exactly the same size. Jasmine painted 1
2 of the fi rst wall. Raven painted 23
of the other wall.
Exactly how much more did Raven paint than Jasmine? Divide each wall into same-sized pieces to fi nd out. Is there more than one answer?
12
23
Set A6 Numbers & Operations: Fraction Concepts Blackline Run one copy on a transparency.
7. Give students a few minutes to solve the problem by experimenting with the rectangles at the bottom of their Same-Sized Pieces blackline. Encourage children who finish quickly to generate a second, and even third solution. Ask them to check their ideas and solutions with others nearby, and then invite sev-eral volunteers to the overhead to share their thinking with the class.
12
13
12
13
12
13
Greg’s WayLaTonya’s Way
Sam’s Way
LaTonya This is so cool! I just split the halves into thirds and the thirds into halves, and got sixths for both walls. Raven painted one more sixth of her wall.
Set A6 Numbers & Operations: Fraction Concepts
Bridges in Mathematics Grade 5 Supplement • A6.11© The Math Learning Center
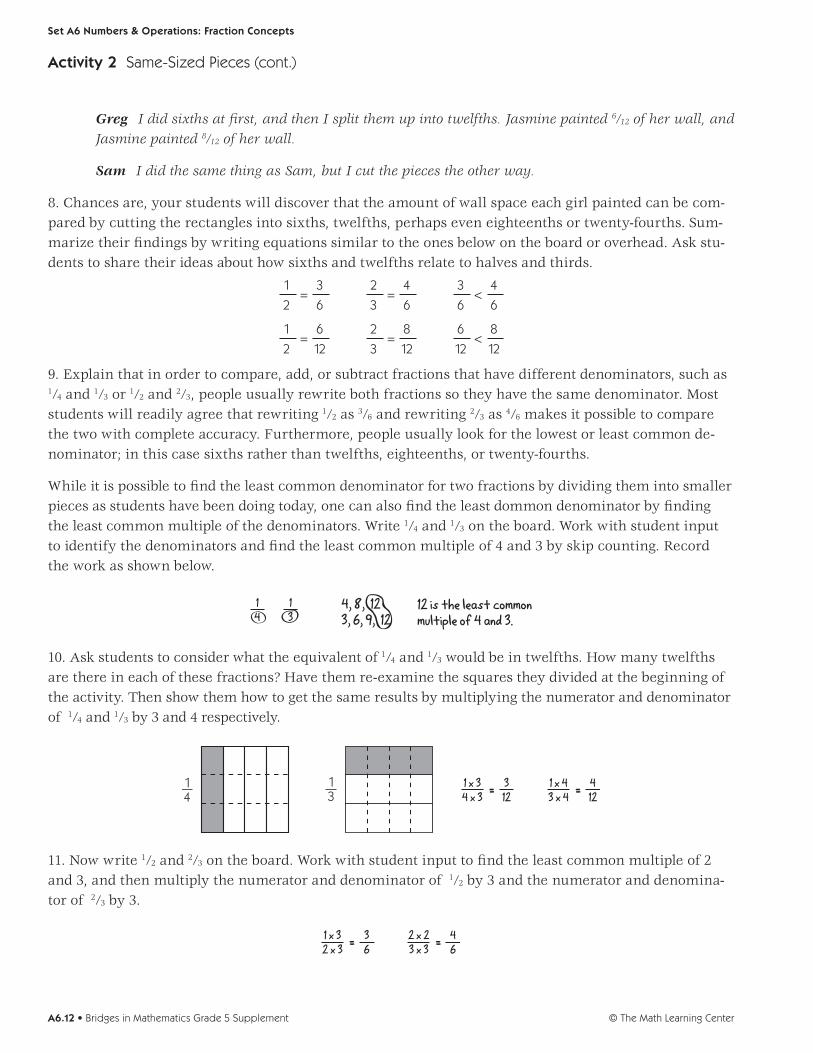
Greg I did sixths at first, and then I split them up into twelfths. Jasmine painted 6⁄12 of her wall, and Jasmine painted 8⁄12 of her wall.
Sam I did the same thing as Sam, but I cut the pieces the other way.
8. Chances are, your students will discover that the amount of wall space each girl painted can be com-pared by cutting the rectangles into sixths, twelfths, perhaps even eighteenths or twenty-fourths. Sum-marize their findings by writing equations similar to the ones below on the board or overhead. Ask stu-dents to share their ideas about how sixths and twelfths relate to halves and thirds.
1
2 =
3
6
2
3 =
4
6
3
6 <
4
6
1
2 =
6
12
2
3 =
8
12
6
12 <
8
12
9. Explain that in order to compare, add, or subtract fractions that have different denominators, such as 1⁄4 and 1⁄3 or 1⁄2 and 2⁄3, people usually rewrite both fractions so they have the same denominator. Most students will readily agree that rewriting 1⁄2 as 3⁄6 and rewriting 2⁄3 as 4⁄6 makes it possible to compare the two with complete accuracy. Furthermore, people usually look for the lowest or least common de-nominator; in this case sixths rather than twelfths, eighteenths, or twenty-fourths.
While it is possible to find the least common denominator for two fractions by dividing them into smaller pieces as students have been doing today, one can also find the least dommon denominator by finding the least common multiple of the denominators. Write 1⁄4 and 1⁄3 on the board. Work with student input to identify the denominators and find the least common multiple of 4 and 3 by skip counting. Record the work as shown below.
14
13
4, 8, 123, 6, 9, 12
12 is the least commonmultiple of 4 and 3.
10. Ask students to consider what the equivalent of 1⁄4 and 1⁄3 would be in twelfths. How many twelfths are there in each of these fractions? Have them re-examine the squares they divided at the beginning of the activity. Then show them how to get the same results by multiplying the numerator and denominator of 1⁄4 and 1⁄3 by 3 and 4 respectively.
14
13
1 x 34 x 3
312= 1 x 4
3 x 4412=
11. Now write 1⁄2 and 2⁄3 on the board. Work with student input to find the least common multiple of 2 and 3, and then multiply the numerator and denominator of 1⁄2 by 3 and the numerator and denomina-tor of 2⁄3 by 3.
1 x 32 x 3
36= 2 x 2
3 x 346=
Activity 2 Same-Sized Pieces (cont.)
Set A6 Numbers & Operations: Fraction Concepts
© The Math Learning CenterA6.12 • Bridges in Mathematics Grade 5 Supplement

12. Write 1⁄4 and 2⁄6 on the board. Which of the two fractions is greater? Exactly how much greater? Ask students to work in pairs to find the least common multiple of 4 and 6, and use the information to re-write 1⁄4 and 2⁄6 so they have a common denominator. After they have had a minute or two to work, ask volunteers to share their solutions and strategies with the class.
13. Repeat step 12 with two or three other pairs of fractions. Possibilities include 2⁄6 and 3⁄8, 3⁄4 and 7⁄12, and 3⁄5 and 4⁄6. Then give students each a copy of the Fraction Equivalents Worksheets. Review both sheets with the class and clarify as needed. When students understand what to do, have them go to work. Encourage them to help one another, and circulate to provide help as needed. You might also want to give students a choice of working on the sheet independently, or working with you in a more sup-ported small group setting.
NAME DATE
Set A6 Numbers & Operations: Fraction Concepts Blackline Run a class set.
Fraction Equivalents Worksheet 1 of 2
1 For each of the following pairs of fractions, draw in lines so they have the same number of pieces. Then write the equivalen fraction name beside both.
example
a
b
c
12
13
16
12
34
25
26
38
36
26
NAME DATE
Set A6 Numbers & Operations: Fraction Concepts Blackline Run a class set.
Fraction Equivalents Worksheet 2 of 2
2 Teri and Jon each got a granola bar from their dad. Teri ate 35 of hers. Jon ate
23 of his. Who ate more? Exactly how much more? Use the rectangles below to help solve the problem. Show all of your work.
____________ ate exactly ________ more than ____________.
3 Ryan rode his bike 56 of a mile. James rode his bike 7
8 of a mile. Who rode farther? Exactly how much farther? Use the rectangles below to help solve the problem. Show all of your work.
____________ rode exactly ________ more of a mile than ____________
4 Find the least common multiple (LCM) of each pair of numbers.
ex. 6 and 8
6, 12, 18, 24 8, 16, 24 24 is the LCM of 6 and 8
a 3 and 5 b 4 and 5
5 Circle the fraction you think is greater in each pair. Then fi nd out for sure by re-writing the fractions so they have common denominators. (Hint: Use the informa-tion from problem 4 to help. Put a star by the fraction that turns out to be greater.)
ex. 38
26
3 x 38 x 3
= 9
24
2 x 46 x 4 =
824
a 23
45 b
14
25
INDEPENDENT WORKSHEET
Use Set A6 Independent Worksheets 2 and 3 to provide students more practice finding the difference be-tween two fractions by rewriting them so they have common denominators.
Activity 2 Same-Sized Pieces (cont.)
Set A6 Numbers & Operations: Fraction Concepts
Bridges in Mathematics Grade 5 Supplement • A6.13© The Math Learning Center

Square Sandwiches & Bedroom Walls
1 Carlos had 2 extra square sandwiches. They were exactly the same size. He gave 1
4 of the first sandwich to his friend Ben and 1 3 of the second sandwich to his
friend Corey.
Ben said, “Hey, that’s not fair! Corey got more than I did!”
Exactly how much more did Corey get? Divide each sandwich into same-sized pieces to find out.
14
13
2 Jasmine and Raven were painting 2 walls in Jasmine’s bedroom. The 2 walls were exactly the same size. Jasmine painted 1
2 of the first wall. Raven painted 2 3
of the other wall.
Exactly how much more did Raven paint than Jasmine? Divide each wall into same-sized pieces to find out. Is there more than one answer?
12
23
© The Math Learning CenterA6.14 • Bridges in Mathematics Grade 5 Supplement
Set A6 Numbers & Operations: Fraction Concepts Blackline Run one copy on a transparency.

Bridges in Mathematics Grade 5 Supplement • A6.15© The Math Learning Center
NAME DATE
Set A6 Numbers & Operations: Fraction Concepts Blackline Run a class set single-sided plus a few extra.
Same-Sized Pieces

© The Math Learning CenterA6.16 • Bridges in Mathematics Grade 5 Supplement
NAME DATE
Set A6 Numbers & Operations: Fraction Concepts Blackline Run a class set.
Fraction Equivalents Worksheet 1 of 2
1 For each of the following pairs of fractions, draw in lines so they have the same number of pieces. Then write the equivalen fraction name beside both.
example
a
b
c
12
13
16
12
34
25
26
38
36
26

Bridges in Mathematics Grade 5 Supplement • A6.17© The Math Learning Center
NAME DATE
Set A6 Numbers & Operations: Fraction Concepts Blackline Run a class set.
Fraction Equivalents Worksheet 2 of 2
2 Teri and Jon each got a granola bar from their dad. Teri ate 3 5 of hers. Jon ate
2 3 of his. Who ate more? Exactly how much more? Use the rectangles below to help solve the problem. Show all of your work.
____________ ate exactly ________ more than ____________.
3 Ryan rode his bike 5 6 of a mile. James rode his bike 7
8 of a mile. Who rode farther? Exactly how much farther? Use the rectangles below to help solve the problem. Show all of your work.
____________ rode exactly ________ more of a mile than ____________
4 Find the least common multiple (LCM) of each pair of numbers.
ex. 6 and 8
6, 12, 18, 24 8, 16, 24 24 is the LCM of 6 and 8
a 3 and 5 b 4 and 5
5 Circle the fraction you think is greater in each pair. Then find out for sure by re-writing the fractions so they have common denominators. (Hint: Use the informa-tion from problem 4 to help. Put a star by the fraction that turns out to be greater.)
ex.
3 8
2 6
3 x 3 8 x 3 = 9
24
2 x 4 6 x 4 =
8 24
a
2 3
4 5
b
1 4
2 5

© The Math Learning CenterA6.18 • Bridges in Mathematics Grade 5 Supplement

Set A6 H Independent Worksheet 1
INDEPENDENT WORKSHEET
Using the Greatest Common Factor to Simplify Fractions
1 Write all the factors of each number below. Try to think of the factors in pairs.
ex. 2 _______________ a 4 _______________ b 8 _______________
c 3 _______________ d 6 _______________ e 12 _______________
2 You can simplify a fraction by dividing the numerator and the denominator by the same number. If you divide the numerator and denominator by the larg-est factor they have in common (the greatest common factor), you can show the fraction in its simplest form. Look carefully at the example below. Then fill in the rest of the table.
FractionFactors of the
Numerator (Top Number)
Factors of the Denominator (Bottom Number)
Greatest Common
Factor
Divide to Get the Simplest
Form
Picture and Equation
ex.4 12
1, 2, 4 1, 2, 3 4, 6, 12
4 4÷4 12÷4
= 1 3
4 12 = 1
3
a8 12
8÷ 12÷
=
8 12 =
b4 6
4÷ 6÷
=
4 6 =
1, 2
(Continued on back.)Bridges in Mathematics Grade 5 Supplement • A6.19© The Math Learning Center
NAME DATE
Set A6 Numbers & Operations: Fraction Concepts Blackline Use anytime after Set A6, Activity 1. Run a class set.

Independent Worksheet 1 Using the Greatest Common Factor to Simplify Fractions (cont.)
3 Find the greatest common factor of each pair of numbers below.
example 6 and 16
Factors of 6 ___________________
Factors of 16 ___________________
Greatest Common Factor of 6 and 16 ________
a 6 and 21
Factors of 6 ___________________
Factors of 21 ___________________
Greatest Common Factor of 6 and 21 ________
b 8 and 24
Factors of 8 ___________________
Factors of 24 ___________________
Greatest Common Factor of 8 and 24 ________
c 18 and 24
Factors of 18 ___________________
Factors of 24 ___________________
Greatest Common Factor of 18 and 24 ________
4 Use your answers from problem 3 to simplify these fractions.
example 6 16
÷ 2 ÷ 2
= 3 8
6 16
= 3 8
a 6 21
b 8 24
c 18 24
5 A fraction is in its simplest form when its numerator and denominator have no common factor other than 1. Look at the fractions below. • Circle the fractions that can be simplified.• Put a line under the fractions that are already in simplest form.
3 6
5 8
4 10
12 15
2 7
8 14
3 13
6 Choose three of the fractions in problem 5 that can be simplified. Simplify them below. Show your work.
© The Math Learning CenterA6.20 • Bridges in Mathematics Grade 5 Supplement
Set A6 Numbers & Operations: Fraction Concepts Blackline Run a class set.
1, 2, 3, 6
1, 2, 4, 8, 16
2

(Continued on back.)Bridges in Mathematics Grade 5 Supplement • A6.21© The Math Learning Center
NAME DATE
Set A6 Numbers & Operations: Fraction Concepts Blackline Use anytime after Set A6, Activity 2. Run a class set.
Set A6 H Independent Worksheet 2
INDEPENDENT WORKSHEET
Finding the Least Common Denominator
Which is greater, 2 3 or 4
5 ? Exactly how much difference is there between thesetwo fractions? If you want to compare, add, or subtract two fractions, it is easier if you rewrite them so they both have the same denominator.
To do this: • Find the least common multiple of the denominators of the fractions.
multiples of 3 3, 6, 9, 12, 15 multiples of 5 5, 10, 15 The least common multiple of 3 and 5 is 15.
• Multiply the numerator and denominator of each fraction by the same number so the denominators are equal.
2 × 5 3 × 5
= 10 15
4 × 3 5 × 3
= 12 15
4 5
is greater than 2 3
by exactly 2 15
1 Find the least common multiple (LCM) of each pair of numbers.
ex. 4 and 10
4, 8, 12, 16, 20 10, 20 20 is the LCM of 4 and 10
a 5 and 6 b 2 and 7
2 Circle the fraction you think is greater in each pair. Then find out for sure by re-writing the fractions so they have common denominators. Hint: Use the informa-tion from problem 1 to help. Put a star by the fraction that turns out to be greater.
ex.
3 4
7 10
3 x 5 4 x 5 = 15
20
7 x 2 10 x 2 =
14 20
a
4 5
5 6
b
1 2
4 7

Independent Worksheet 2 Finding the Least Common Denominator (cont.)
© The Math Learning CenterA6.22 • Bridges in Mathematics Grade 5 Supplement
Set A6 Numbers & Operations: Fraction Concepts Blackline Run a class set.
3 Find the least common multiple (LCM) of each pair of numbers.
a 5 and 10 b 6 and 9 c 5 and 7
4 Circle the fraction you think is greater in each pair. Then find out for sure by rewriting the fractions so they have common denominators. Hint: Use the informa-tion from problem 3 to help. Put a star by the fraction that turns out to be greater.
a
2 5
3 10
b
4 6
7 9
c
4 5
5 7
5 Erica swam 6 8 of a mile on Monday. She swam 10
12 of a mile on Tuesday. Did she swim farther on Monday or Tuesday. Exactly how much farther? Use numbers, words, and/or labeled sketches to solve this problem. Show all your work.
Erica swam exactly ________ of a mile farther on _______________.
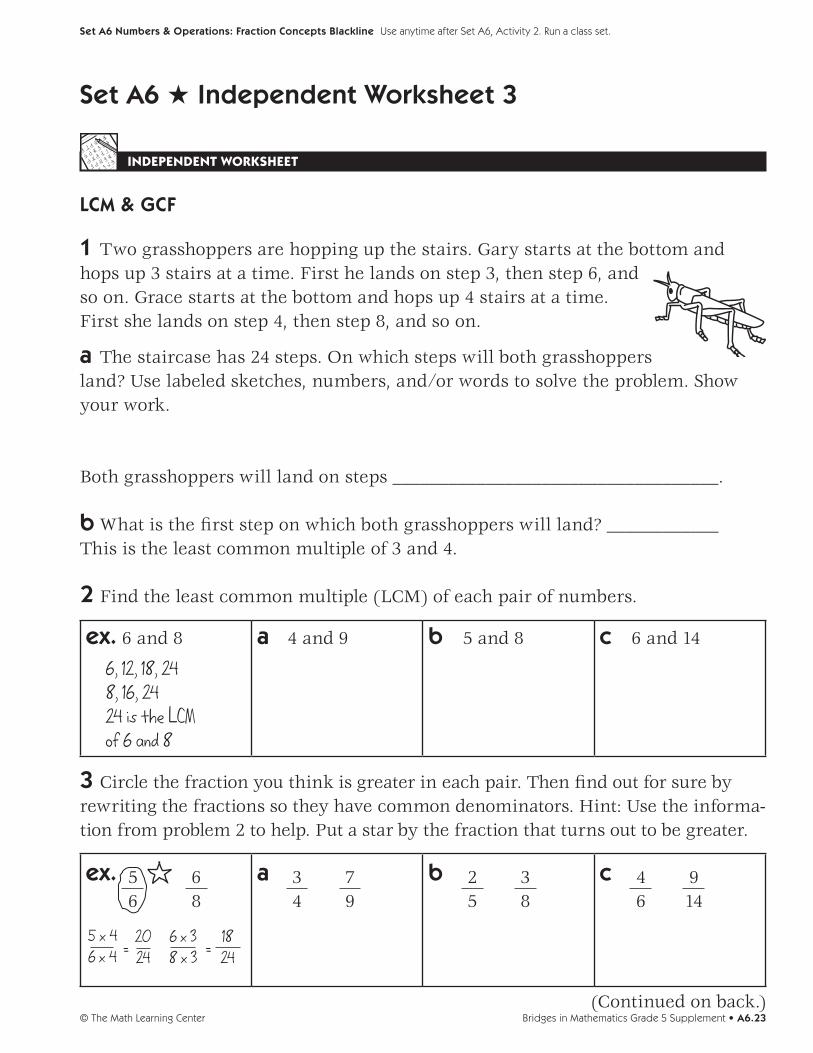
(Continued on back.)Bridges in Mathematics Grade 5 Supplement • A6.23© The Math Learning Center
Set A6 Numbers & Operations: Fraction Concepts Blackline Use anytime after Set A6, Activity 2. Run a class set.
Set A6 H Independent Worksheet 3
INDEPENDENT WORKSHEET
LCM & GCF
1 Two grasshoppers are hopping up the stairs. Gary starts at the bottom and hops up 3 stairs at a time. First he lands on step 3, then step 6, and so on. Grace starts at the bottom and hops up 4 stairs at a time. First she lands on step 4, then step 8, and so on.
a The staircase has 24 steps. On which steps will both grasshoppers land? Use labeled sketches, numbers, and/or words to solve the problem. Show your work.
Both grasshoppers will land on steps ___________________________________.
b What is the first step on which both grasshoppers will land? ____________This is the least common multiple of 3 and 4.
2 Find the least common multiple (LCM) of each pair of numbers.
ex. 6 and 8
6, 12, 18, 24 8, 16, 24 24 is the LCM of 6 and 8
a 4 and 9 b 5 and 8 c 6 and 14
3 Circle the fraction you think is greater in each pair. Then find out for sure by rewriting the fractions so they have common denominators. Hint: Use the informa-tion from problem 2 to help. Put a star by the fraction that turns out to be greater.
ex.
5 6
6 8
5 x 4 6 x 4 = 20
24 6 x 3 8 x 3 = 18
24
a
3 4
7 9
b
2 5
3 8
c
4 6
9 14

Independent Worksheet 3 LCM & GCF (cont.)
4 You can use the greatest common factor (GCF) to help simplify fractions.
Find the greatest common factor of each pair of numbers.
ex. 12 and 24 Factors of 12 are 1, 2, 3, 4, 6, 12 Factors of 24 are 1, 2, 3, 4, 6, 8, 12, 24 12 is the GCF of 12 and 24
a 8 and 20
b 12 and 18 c 10 and 15
5 Use your answers from problem 4 to simplify these fractions.
ex. 12 24
÷ 12 ÷ 12
= 1 2
12 24
= 1 2
a 8 20
b 12 18
c 10 15
6 Ebony got 3 4 of a yard of red ribbon and 10
12 of a yard of purple ribbon. Which piece of ribbon was longer? Exactly what fraction of a yard longer was it? Use numbers, words, and/or labeled sketches to solve this problem. Make sure your answer is in simplest form.
The __________ piece of ribbon was exactly _______ of a yard longer than the
____________ piece of ribbon.
© The Math Learning CenterA6.24 • Bridges in Mathematics Grade 5 Supplement
Set A6 Numbers & Operations: Fraction Concepts Blackline Run a class set.

Grade 5 supplementset B1 Algebra: Diagrams & Equations
IncludesActivity 1: The Carnival B1.1
Independent Worksheet 1: Padre’s Pizza B1.7
Independent Worksheet 2: Choosing Equations & Diagrams B1.11
skills & ConceptsH represent an unknown quantity using a letter or a symbol
H express mathematical relationships using equations
H use diagrams and equations to draw conclusions about problem situations
P0509

Bridges in mathematics Grade 5 supplement
set B1 Algebra: Diagrams & Equations
The Math Learning Center, PO Box 12929, Salem, Oregon 97309. Tel. 1 800 575–8130.
© 2008 by The Math Learning Center
All rights reserved.
Prepared for publication on Macintosh Desktop Publishing system.
Printed in the United States of America.
P0509
The Math Learning Center grants permission to classroom teachers to reproduce blackline
masters in appropriate quantities for their classroom use.
Bridges in Mathematics is a standards-based K–5 curriculum that provides a unique blend
of concept development and skills practice in the context of problem solving. It incorpo-
rates the Number Corner, a collection of daily skill-building activities for students.
The Math Learning Center is a nonprofit organization serving the education community.
Our mission is to inspire and enable individuals to discover and develop their mathematical
confidence and ability. We offer innovative and standards-based professional development,
curriculum, materials, and resources to support learning and teaching. To find out more,
visit us at www.mathlearningcenter.org.
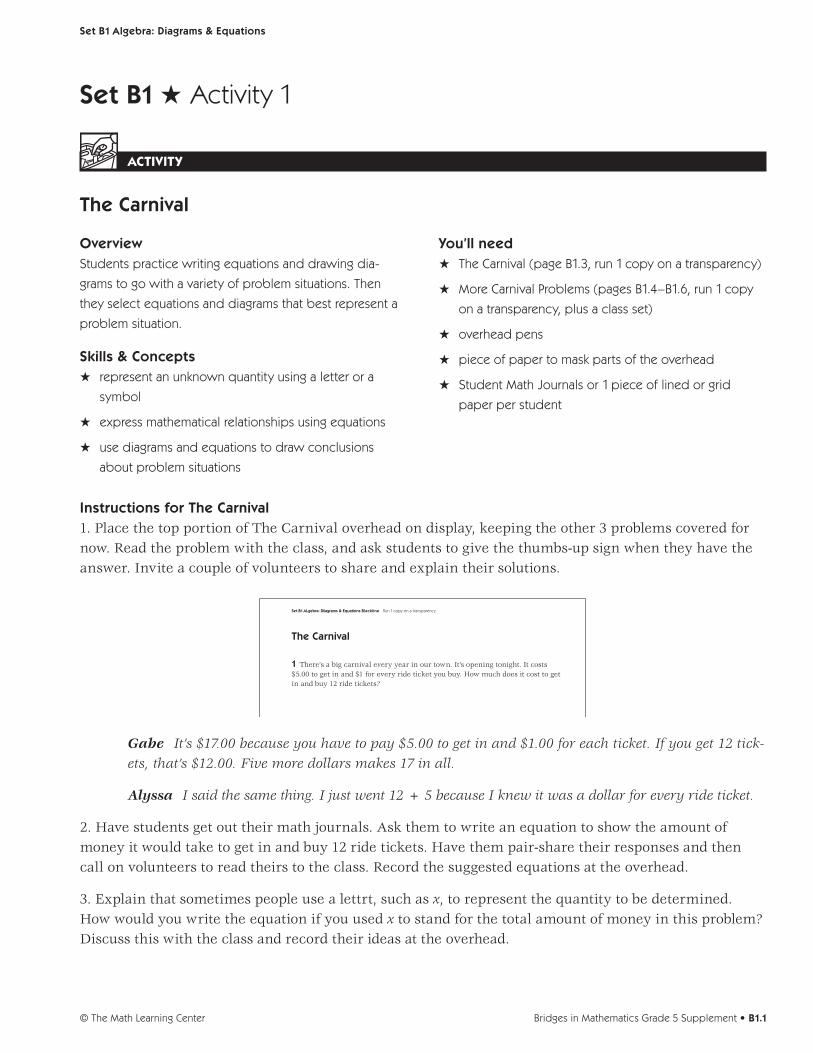
set B1 algebra: diagrams & equations
Bridges in Mathematics Grade 5 Supplement • B1.1© The Math Learning Center
set B1 H Activity 1
Activity
the Carnival
OverviewStudents practice writing equations and drawing dia-
grams to go with a variety of problem situations. Then
they select equations and diagrams that best represent a
problem situation.
skills & ConceptsH represent an unknown quantity using a letter or a
symbol
H express mathematical relationships using equations
H use diagrams and equations to draw conclusions
about problem situations
You’ll needH The Carnival (page B1.3, run 1 copy on a transparency)
H More Carnival Problems (pages B1.4–B1.6, run 1 copy
on a transparency, plus a class set)
H overhead pens
H piece of paper to mask parts of the overhead
H Student Math Journals or 1 piece of lined or grid
paper per student
Instructions for the Carnival1. Place the top portion of The Carnival overhead on display, keeping the other 3 problems covered for now. Read the problem with the class, and ask students to give the thumbs-up sign when they have the answer. Invite a couple of volunteers to share and explain their solutions.
The Carnival
1 There’s a big carnival every year in our town. It’s opening tonight. It costs $5.00 to get in and $1 for every ride ticket you buy. How much does it cost to get in and buy 12 ride tickets?
2 Miguel is going with his friend, Corey. Miguel is planning to buy 16 ride tick - ets. Which equation could be used to find x , the amount of money he’ll need to get in and buy ride tickets?
a x = $5.00 + (16 × $1.00)
b x = $5.00 × (16 × $1.00)
c x = $16.00 – $5.00
d x = (16 × $1.00) ÷ $5.00
3 Corey has $27.00 to spend on admission and tickets. How many tickets will he be able to buy? Write an equation in your journal to show. Use the letter x to stand for the number of tickets Corey will be able to buy.
4 Miguel’s favorite ride is the Teacup. Some of the cups hold 2 people. Others hold 4 people. There are 9 cups in all, and when the ride is full, it holds 24 people. Which diagram best represents this problem? Why?
a b
c d
Set B1 ALgebra: Diiagrams & Equations Blackline Run 1 copy on a transparency.
Gabe It’s $17.00 because you have to pay $5.00 to get in and $1.00 for each ticket. If you get 12 tick-ets, that’s $12.00. Five more dollars makes 17 in all.
Alyssa I said the same thing. I just went 12 + 5 because I knew it was a dollar for every ride ticket.
2. Have students get out their math journals. Ask them to write an equation to show the amount of money it would take to get in and buy 12 ride tickets. Have them pair-share their responses and then call on volunteers to read theirs to the class. Record the suggested equations at the overhead.
3. Explain that sometimes people use a lettrt, such as x, to represent the quantity to be determined. How would you write the equation if you used x to stand for the total amount of money in this problem? Discuss this with the class and record their ideas at the overhead.

set B1 algebra: diagrams & equations
© The Math Learning CenterB1.2 • Bridges in Mathematics Grade 5 Supplement
$5.00 + $12.00 = $17.00 $5.00 + $12.00 = x
$5.00 + (12 x $1.00) = $17.00 x = $5.00 + (12 x $1.00)
x = $27.00 - $5.00
The Carnival
1 There’s a big carnival every year in our town. It’s opening tonight. It costs $5.00 to get in and $1 for every ride ticket you buy. How much does it cost to get in and buy 12 ride tickets?
2 Miguel is going with his friend, Corey. Miguel is planning to buy 16 ride tick - ets. Which equation could be used to find x , the amount of money he’ll need to get in and buy ride tickets?
a x = $5.00 + (16 × $1.00)
b x = $5.00 × (16 × $1.00)
c x = $16.00 – $5.00
d x = (16 × $1.00) ÷ $5.00
3 Corey has $27.00 to spend on admission and tickets. How many tickets will he be able to buy? Write an equation in your journal to show. Use the letter x to stand for the number of tickets Corey will be able to buy.
4 Miguel’s favorite ride is the Teacup. Some of the cups hold 2 people. Others hold 4 people. There are 9 cups in all, and when the ride is full, it holds 24 people. Which diagram best represents this problem? Why?
a b
c d
Set B1 Algebra: Diagrams & Equations Blackline Run 1 copy on a transparency.
4. Reveal each of the other 3 problems one by one. In each case, have students respond in their journals and pair-share their responses before asking volunteers to share their thinking with the class. Press stu-dents to explain how they made their selections in problems 2 and 4, and why some of the other choices don’t work. (The answers have been marked on the copy below for your reference. Some of your stu-dents may have other valid responses to problem 3.)
$5.00 + $12.00 = $17.00 $5.00 + $12.00 = x
$5.00 + (12 x $1.00) = $17.00 x = $5.00 + (12 x $1.00)
x = $27.00 - $5.00
The Carnival
1 There’s a big carnival every year in our town. It’s opening tonight. It costs $5.00 to get in and $1 for every ride ticket you buy. How much does it cost to get in and buy 12 ride tickets?
2 Miguel is going with his friend, Corey. Miguel is planning to buy 16 ride tick - ets. Which equation could be used to find x , the amount of money he’ll need to get in and buy ride tickets?
a x = $5.00 + (16 × $1.00)
b x = $5.00 × (16 × $1.00)
c x = $16.00 – $5.00
d x = (16 × $1.00) ÷ $5.00
3 Corey has $27.00 to spend on admission and tickets. How many tickets will he be able to buy? Write an equation in your journal to show. Use the letter x to stand for the number of tickets Corey will be able to buy.
4 Miguel’s favorite ride is the Teacup. Some of the cups hold 2 people. Others hold 4 people. There are 9 cups in all, and when the ride is full, it holds 24 people. Which diagram best represents this problem? Why?
a b
c d
Set B1 Algebra: Diagrams & Equations Blackline Run 1 copy on a transparency.
5. Ask students to use the information in problem 4, including diagram c to solve the following problem: How many of the teacups seat 2 people, and how many seat 4 people?
6. Give students each a copy of More Carnival Problems. Review the sheets with the class. When stu-dents understand what to do, have them go to work. Encourage them to share and compare strategies and solutions as they work.
7. Reconvene the class as time allows to discuss solutions and strategies for some or all of the problems.
independent Worksheet
See Set B1 Independent Worksheets 1 and 2 for more practice selecting equations and diagrams to repre-sent meaningful problem situations.
activity 1 The Carnival (cont.)

Bridges in Mathematics Grade 5 Supplement • B1.3© The Math Learning Center
set B1 algebra: diagrams & equations Blackline Run 1 copy on a transparency.
the Carnival
1 There’s a big carnival every year in our town. It’s opening tonight. It costs $5.00 to get in and $1 for every ride ticket you buy. How much does it cost to get in and buy 12 ride tickets?
2 Miguel is going with his friend, Corey. Miguel is planning to buy 16 ride tick-ets. Which equation could be used to find x, the amount of money he’ll need to get in and buy ride tickets?
x = $5.00 + (16 × $1.00)
x = $5.00 × (16 × $1.00)
x = $16.00 – $5.00
x = (16 × $1.00) ÷ $5.00
3 Corey has $27.00 to spend on admission and tickets. How many tickets will he be able to buy? Write an equation in your journal to show. Use the letter x to stand for the number of tickets Corey will be able to buy.
4 Miguel’s favorite ride is the Teacup. Some of the cups hold 2 people. Others hold 4 people. There are 9 cups in all, and when the ride is full, it holds 24 people. Which diagram best represents this problem? Why?

© The Math Learning CenterB1.4 • Bridges in Mathematics Grade 5 Supplement
name date
set B1 algebra: diagrams & equations Blackline Run a class set plus 1 copy on a transparency.
more Carnival problems page 1 of 3
1 Each of the seats on the giant ferris wheel holds 3 people. There are 26 seats in all. Which equation could be used to find x, the number of people riding when the ferris wheel is full?
3 ÷ 26 = x
x + 26 = 3
3 × 26 = x
x – 3 = 26
2 After they rode on the Teacup, Miguel and Corey wanted to go on the Yoyo. In order to get there, they had to walk past the Whip. It is three times as far from the Teacup to the Whip as it is from the Whip to the Yoyo. It is 840 yards from the Teacup to the Yoyo. How far is it from the Teacup to the Whip?
a Which diagram below best shows this problem?
840 yards
Teacup Whip YoYo
840 yards
Teacup Whip YoYo
840 yards
Teacup Whip YoYo
420 yards
Teacup Whip YoYo
b Use the diagram you picked to help solve the problem. Show all of your work.

Bridges in Mathematics Grade 5 Supplement • B1.5© The Math Learning Center
set B1 algebra: diagrams & equations Blackline Run a class set plus 1 copy on a transparency.
more Carnival problems page 2 of 3
3 Some of the rides take 2 tickets and some of them take 3 tickets.
a If Marisa had 17 tickets and used all of them, how many 2-ticket and 3-ticket rides did she take?
5 two-ticket rides and 4 three-ticket rides
10 two-ticket rides and 7 three-ticket rides
3 two-ticket rides and 3 three-ticket rides
4 two-ticket rides and 3 three-ticket rides
b Use numbers, words, and/or labeled sketches to explain your answer to part a.
4 Darius has 9 rides tickets. His sister Deja has 3 more ride tickets than Darius. Their friend Camila has twice as many ride tickets as Deja.
a Which equation could be used to find x, the number of tickets Camila has?
(9 + 3) × 2 = x
9 × 3 = x
(9 + 3) ÷ 2 = x
9 × 3 ÷ 2 = x
b Use numbers, words, and/or labeled sketches to explain your answer to part a.

© The Math Learning CenterB1.6 • Bridges in Mathematics Grade 5 Supplement
name date
set B1 algebra: diagrams & equations Blackline Run a class set plus 1 copy on a transparency.
more Carnival problems page 3 of 3
5 There is a bumper-car ride for little kids next to the hotdog stand. The fence around the ride is a hexagon with 2 long sides that are equal and 4 short sides that are equal.
a Which diagram below best shows the fence around the bumper car ride?
10 feet
10 feet
10 feet
10 feet
10 feet
10 feet
9 feet
12 feet
12 feet
9 feet
9 feet
9 feet
7 feet
10 feet15 feet
9 feet
9 feet
b Use the diagram you picked to write and solve an equation for the perimeter of the fence.
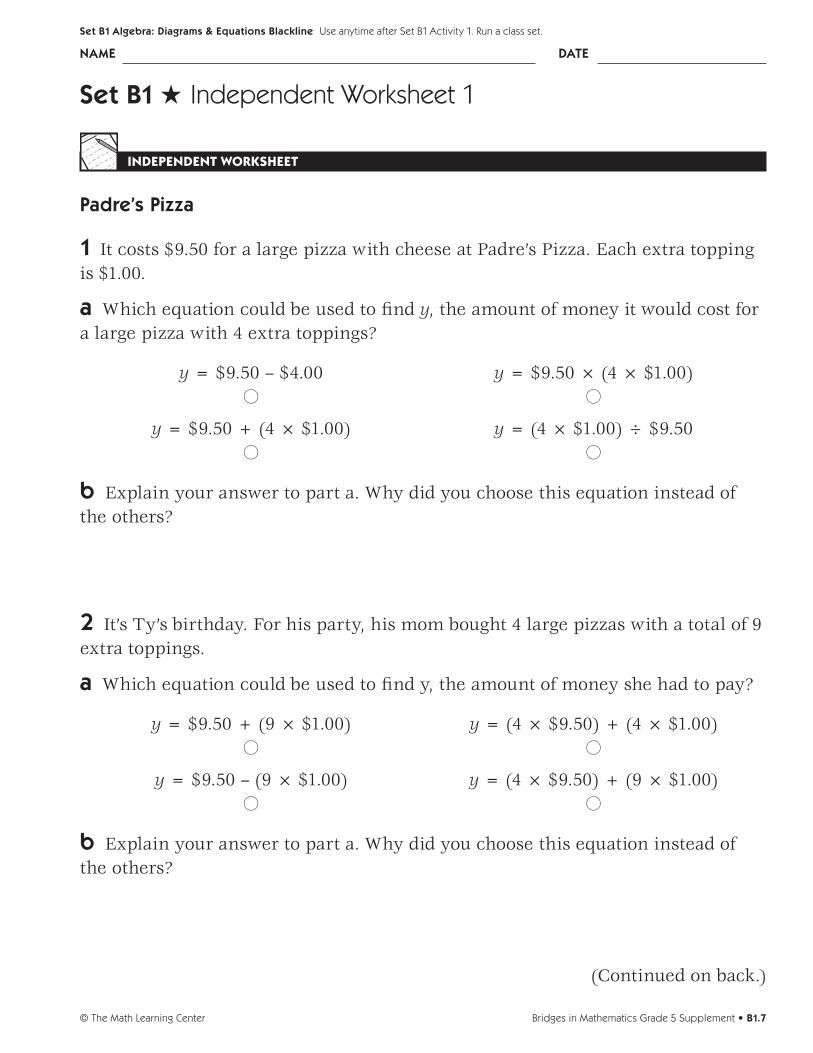
Bridges in Mathematics Grade 5 Supplement • B1.7© The Math Learning Center
name date
set B1 algebra: diagrams & equations Blackline Use anytime after Set B1 Activity 1. Run a class set.
set B1 H Independent Worksheet 1
independent Worksheet
padre’s pizza
1 It costs $9.50 for a large pizza with cheese at Padre’s Pizza. Each extra topping is $1.00.
a Which equation could be used to find y, the amount of money it would cost for a large pizza with 4 extra toppings?
y = $9.50 – $4.00
y = $9.50 × (4 × $1.00)
y = $9.50 + (4 × $1.00)
y = (4 × $1.00) ÷ $9.50
b Explain your answer to part a. Why did you choose this equation instead of the others?
2 It’s Ty’s birthday. For his party, his mom bought 4 large pizzas with a total of 9 extra toppings.
a Which equation could be used to find y, the amount of money she had to pay?
y = $9.50 + (9 × $1.00)
y = (4 × $9.50) + (4 × $1.00)
y = $9.50 – (9 × $1.00)
y = (4 × $9.50) + (9 × $1.00)
b Explain your answer to part a. Why did you choose this equation instead of the others?
(Continued on back.)

© The Math Learning CenterB1.8 • Bridges in Mathematics Grade 5 Supplement
set B1 algebra: diagrams & equations Blackline Run a class set.
3 The marching band went to Padre’s after the Friday night football game They ordered 7 large pizzas with 3 extra toppings each and 4 large pizzas with 4 extra toppings each.
a Which equation could be used to find t, the total number of extra toppings?
t = (7 × 3) + (4 × 4)
t = 7 × 3 × 4 × 4
t = (7 + 3) × (4 + 4)
t = 7 + 3 + 4 + 4
b Use the equation you picked to solve the problem. How many extra toppings did they order in all? Show your work.
c How much did they have to pay for all the pizzas they ordered? Show all your work.
4 The cook at Padre’s Pizza has 12 pizzas lined up for a special order. She put cheese and sausage on all of them. She added pineapple to every second pizza and olives to every third pizza.
a Which pizzas in the line will have all 4 toppings (cheese, sausage, pineapple, and olives)? Mark the row you could use to solve this problem.
P PC
PO PC T
P PC O
P PC T
PO PC
P PC OT
C
CS CP CS O
C CS P
C CS O
CP CS C CS PO
CS CS P
CS O
CS P
CS CS PO
CS CS P
CS O
CS P
CS CS PO
�
�
�
Independent Worksheet 1 Padre’s Pizza (cont.)
(Continued on next page.)

Bridges in Mathematics Grade 5 Supplement • B1.9© The Math Learning Center
name date
set B1 algebra: diagrams & equations Blackline Run a class set.
4b Which of the 12 pizzas got all 4 toppings?
5 The boy’s basketball team came into Padre’s on Wednesday night after prac-tice. Half the boys on this team also play soccer, play baseball, and are in the school band. The remaining 3 boys aren’t in any other activities. No one is in more than 2 activities.
a How many boys are there on the basketball team? Circle the diagram that will give you the most help solving this problem.
3
33
b Use the diagram you picked to help solve the problem. Show all of your work.
Independent Worksheet 1 Padre’s Pizza (cont.)
14
18

© The Math Learning CenterB1.10 • Bridges in Mathematics Grade 5 Supplement

Bridges in Mathematics Grade 5 Supplement • B1.11© The Math Learning Center
name date
set B1 algebra: diagrams & equations Blackline Uae anytime after Set B1 Activity 1. Run a class set.
set B1 H Independent Worksheet 2
independent Worksheet
Choosing equations & diagrams
Select the diagram and equation that best represent each problem situation below.
1 There are 5 rows of 6 desks in the classroom. Today, 3 of the desks are empty. How many students are in class today?
a Which diagram below best shows this problem?
b If x represents the number of students in class, which equation could be used to solve the problem?
5 + 3 + 6 = x
(5 × 6) – 3 = x
(5 × 3) + 6 = x
(5 × 6) + 3 = x
c Explain your answer to part b. Why did you choose this equation instead of the others?
(Continued on back.)

© The Math Learning CenterB1.12 • Bridges in Mathematics Grade 5 Supplement
set B1 algebra: diagrams & equations Blackline Run a class set.
2 A pentagon has three longer sides that are all the same length and two shorter sides that are both the same length.
a Which diagram shows the pentagon described above?
a
a
ab
b
a
b c
de
b
b
c
a
a
a
a
a a
a
b Which equation could be used to find the perimeter of the pentagon?
P = 5 × a
P = 3 + a + 2 + b
P = (2 × a) + (2 × b)
P = (3 × a) + (2 × b)
3 Destiny is having a party. She wants to get two cookies for each of the 8 peo-ple, including herself, who will be at the party. If each cookie costs 50¢, how much money will she spend on cookies?
a Which diagram below best shows this problem?
0.50¢ 0.50¢
0.50¢ 0.50¢
0.50¢ 0.50¢
0.50¢ 0.50¢
0.50¢ 0.50¢
0.50¢ 0.50¢
0.50¢ 0.50¢
0.50¢ 0.50¢
0.50¢ 0.50¢
0.50¢ 0.50¢
0.50¢ 0.50¢
0.50¢ 0.50¢
0.50¢ 0.50¢
0.50¢ 0.50¢
0.50¢ 0.50¢
0.50¢ 0.50¢
0.50¢ 0.50¢
0.50¢ 0.50¢
0.50¢ 0.50¢
0.50¢ 0.50¢
0.50¢ 0.50¢
0.50¢ 0.50¢
0.50¢ 0.50¢
0.50¢ 0.50¢
0.50¢ 0.50¢
0.50¢
0.50¢
b Explain your answer to part a. Why did you choose this diagram instead of the others?
Independent Worksheet 2 Choosing Equations & Diagrams (cont.)
(Continued on next page.)

Bridges in Mathematics Grade 5 Supplement • B1.13© The Math Learning Center
name date
set B1 algebra: diagrams & equations Blackline Run a class set.
c If x represents the amount of money Destiny is going to spend, which equation could be used to solve the problem?
(2 + 8) × 0.50 = x
(2 × 8) × 1.00 = x
(2 × 8) – 0.50 = x
(2 × 8) × 0.50 = x
4 There are 4 bikes, 2 skateboards, and a tricycle in Milo’s garage How many wheels are there altogether?
a Which diagram below best shows this problem?
b If x represents the number of wheels in Milo’s garage, which equation could be used to solve the problem?
2 × (4 + 2 + 1) = x
(2 + 4 + 3) × 2 = x
2 × 4 × 3 = x
(4 × 2) + (2 × 4) + 3 = x
c Explain your answer to part b. Why did you choose this equation instead of the others?
5 There are some bikes and trikes on the playground. There are 36 wheels in all, and 15 bikes and trikes. How many bikes are there? How many trikes are there? Make a labeled diagram to solve the problem. Show your work. Use the back of the page if you need more room.
Independent Worksheet 2 Choosing Equations & Diagrams (cont.)

© The Math Learning CenterB1.14 • Bridges in Mathematics Grade 5 Supplement

Grade 5 supplementset C1 Geometry: Triangles & Quadrilaterals
IncludesActivity 1: Classifying Triangles C1.1
Activity 2: Sorting & Classifying Quadrilaterals C1.13
Activity 3: Finding the Perimeter & Area of a Parallelogram C1.25
Activity 4: Three Mathematical Ideas C1.35
Independent Worksheet 1: More Geoboard Triangles C1.43
Independent Worksheet 2: Color & Construct Triangles C1.45
Independent Worksheet 3: Classifying Quadrilaterals C1.47
Independent Worksheet 4: Quad Construction C1.51
Independent Worksheet 5: Perimeter & Area Puzzles C1.53
Independent Worksheet 6: Ebony’s Quilt C1.55
skills & ConceptsH classify quadrilaterals
H identify, describe, and classify triangles by angle measure and number of congruent sides
H determine the formula for the area of a parallelogram by relating it to the area of a rectangle
H determine the formula for the area of a triangle by relating it to the area of a parallelogram
H use formulas to determine the perimeters and areas of rectangles and parallelograms
H draw quadrilaterals and triangles from given information about sides and angles
H solve single- and multi-step word problems about the perimeters and areas of quadrilater-
als and triangles, and verify the solutions
P0509

Bridges in mathematics Grade 5 supplement
set C1 Geometry: Triangles & Quadrilaterals
The Math Learning Center, PO Box 12929, Salem, Oregon 97309. Tel. 1 800 575–8130.
© 2008 by The Math Learning Center
All rights reserved.
Prepared for publication on Macintosh Desktop Publishing system.
Printed in the United States of America.
P0509
The Math Learning Center grants permission to classroom teachers to reproduce blackline
masters in appropriate quantities for their classroom use.
Bridges in Mathematics is a standards-based K–5 curriculum that provides a unique blend
of concept development and skills practice in the context of problem solving. It incorpo-
rates the Number Corner, a collection of daily skill-building activities for students.
The Math Learning Center is a nonprofit organization serving the education community.
Our mission is to inspire and enable individuals to discover and develop their mathematical
confidence and ability. We offer innovative and standards-based professional development,
curriculum, materials, and resources to support learning and teaching. To find out more,
visit us at www.mathlearningcenter.org.

set C1 H Activity 1
activity
Classifying triangles
OverviewStudents build and record four different triangles on their
geoboards. Then they classify their triangles, first by angle
size and then by side length.
skills & ConceptsH classify triangles by the length of their sides as either
scalene, isosceles, or equilateral
H classify triangles by the size of their angles as either
acute, obtuse, or right
H classify angles as either right, acute, or obtuse
You’ll needH Triangles Record Sheet (page C1.5, run a class set plus
a few extra and one copy on a transparency)
H Types of Triangles (page C1.6, run one copy on a trans-
parency)
H overhead geoboard
H class set of geoboards and rubber bands
H class set of rulers
H a piece of paper to mask parts of the overhead
H access to protractors
H Word Resource Cards: acute angle, obtuse angle, right
angle (pages D6.7–D6.12, run 1 copy back to back on
cardstock, cut out each card. See Advance Preparation)
advance preparation Post the Word Resource Cards
where all the students can see them clearly before you
conduct this activity.
Instructions for Classifying triangles1. Ask students to get out their rulers and pencils. Then give them each a geoboard and a copy of the Triangles Record Sheet. Explain that they are going to make and record 4 different types of triangles today. Demonstrate by making a triangle on a geoboard at the overhead. If necessary, review any guide-lines you have established with the class for handling the rubber bands carefully. Then copy your trian-gle onto the Triangles Record Sheet transparency. Solicit advice from students about how to do this care-fully and accurately as you are working.
NAME DATE
Set C1 G eometry: Triangles & Quadrilaterals Blacklines Run a class set plus a few extra and one on a transparency.
Triangles Record Sheet
Mr. Black
Right Triangle, Scalene Triangle
Dec. 12
set C1 Geometry: triangles & Quadrilaterals
Bridges in Mathematics Grade 5 Supplement • C1.1© The Math Learning Center

2. When students understand what to do, pass out the rubber bands and let them get started. Remind them to make 4 different triangles. Encourage them to make triangles that are different than the one you made, and different from the ones their neighbors are making. Circulate as they are working to talk with them about their triangles. What kinds of angles do they notice as they create their triangles? Can they point out acute, obtuse, and/or right angles in their work?
3. When most students have finished, reconvene the class. Explain that they are going to classify by type, and record, the triangles they have just created. Show just the top portion of Types of Triangles at the overhead.
Set C2 Geometry: Triangles & More Blackline Run one copy on a transparency.
Types of Triangles
You can classify triangles by the size of their angles.
Acute Triangle
All 3 angles are acute.
Right Triangle
One of the angles is a right angle.
Obtuse Triangle
One of the angles is obtuse.
You can also classify triangles by the length of their sides.
Isosceles Triangle
Two sides are thesame length.
Scalene Triangle
Each side is adifferent length.
Equilateral Triangle
Each side is the samelength.
Are any of the triangles you
made on the geoboard equilaterals?
Can you make an equilateraltriangle on a geobaord?
4. Read and discuss the information with the class. Ask volunteers to work with the support of the pic-tures on the Word Resource Cards to describe each type of angle and label an example of each on the overhead. Then have the students help you classify the triangle you made on your geoboard.
Teacher What kind of triangle did I make when I introduced this activity? I’ll hold up my geoboard so you can see it while you look at the different types of triangles on the overhead. Pair-share with the person next to you, and raise your hand when you have an idea.
Students I think it’s an acute triangle because it’s so skinny. It’s none of those because it doesn’t look like any of the triangles on the overhead. I’m almost sure the angle at the bottom is a right angle. I think it’s a right triangle. Can we test it out? Let’s see if a square pattern block will fit in that corner.
You may have to help students understand that a triangle doesn’t have to look exactly like the ones on the overhead to fit into one of the three categories. If necessary, build several more triangles on your board and have the students work together to classify them.
activity 1 Classifying Triangles (cont.)
set C1 Geometry: triangles & Quadrilaterals
© The Math Learning CenterC1.2 • Bridges in Mathematics Grade 5 Supplement

5. When students understand what to do, have them work in pairs to classify the triangles on their record sheets by angle size. Ask them to record the classification on the first line in the box below each triangle.
6. As students finish their work, have them confer with others nearby. If there are disagreements, encour-age students to work together to resolve them. How can they be certain an angle is acute, right, or obtuse?
7. When most students have finished, reconvene the class and display the other half of the Triangle Types overhead. Read and discuss the information with students.
Set C2 Geometry: Triangles & More Blackline Run one copy on a transparency.
Types of Triangles
You can classify triangles by the size of their angles.
Acute Triangle
All 3 angles are acute.
Right Triangle
One of the angles is a right angle.
Obtuse Triangle
One of the angles is obtuse.
You can also classify triangles by the length of their sides.
Isosceles Triangle
Two sides are thesame length.
Scalene Triangle
Each side is adifferent length.
Equilateral Triangle
Each side is the samelength.
Are any of the triangles you
made on the geoboard equilaterals?
Can you make an equilateraltriangle on a geobaord?
8. Ask students to help you classify the triangle you made on your geoboard by the lengths of its sides. Remind them that a triangle doesn’t have to look exactly like one of the examples on the overhead to fit one of the categories. When they have come to agreement, record the information on your record sheet.
NAME DATE
Set C2 Geometry: Triangles & More Blackline Run a class set plus a few extra and one on a transparency.
Triangles Record Sheet
Mr. Gonzalez
Right Triangle, Scalene Triangle
May 18
9. Have students work in pairs to classify their own triangles by side length and record the information on their sheets. Keep the Types of Triangle overhead posted for their reference.
activity 1 Classifying Triangles (cont.)
set C1 Geometry: triangles & Quadrilaterals
Bridges in Mathematics Grade 5 Supplement • C1.3© The Math Learning Center

10. A time allows, ask students to share and compare some of the triangles they made. Let them know that it is, in fact, impossible to create an equilateral triangle on this geoboard. If any of the students be-lieve they have created an equilateral triangle, have them share it with the class, and work together to measure the sides very carefully. While the side lengths may be very close, they will not be equal.
independent Worksheet
Use Set C1 Independent Worksheets 1 and 2 to provide students with more practice identifying, describ-ing, and classifying triangles by angle size and side length. These sheets also ask students to draw tri-angles from given information about sides and angles.
activity 1 Classifying Triangles (cont.)
set C1 Geometry: triangles & Quadrilaterals
© The Math Learning CenterC1.4 • Bridges in Mathematics Grade 5 Supplement
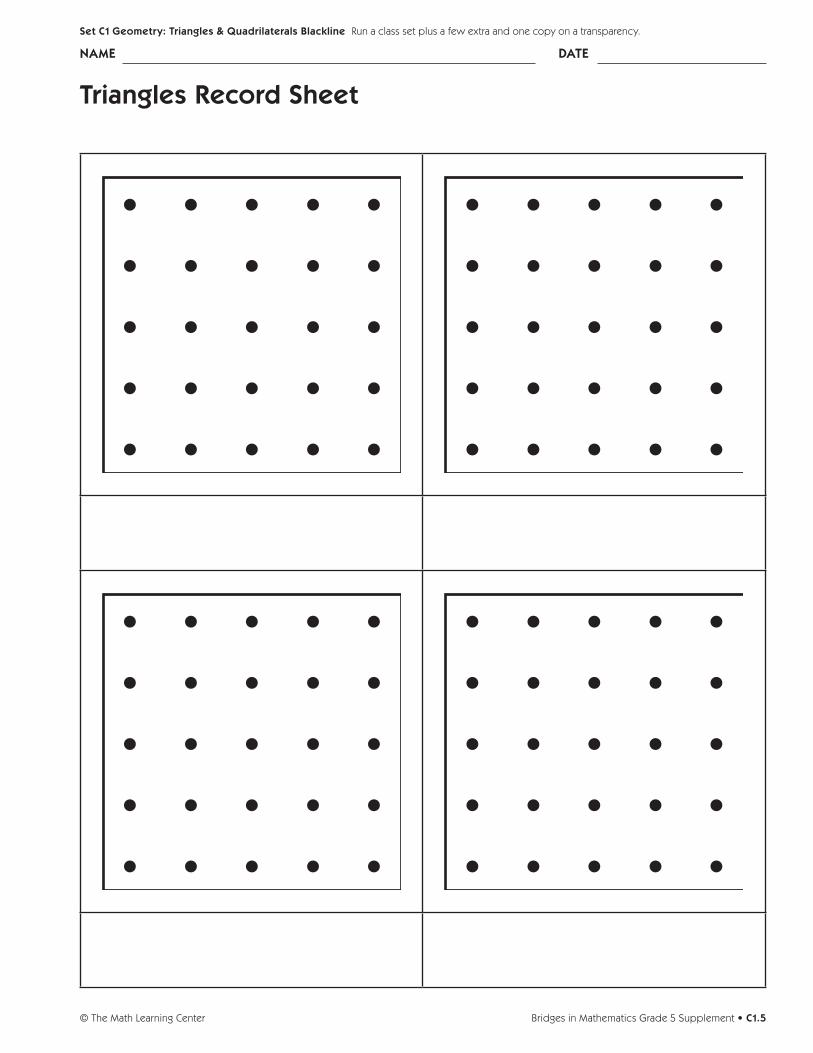
triangles record sheet
Bridges in Mathematics Grade 5 Supplement • C1.5© The Math Learning Center
name date
set C1 Geometry: triangles & Quadrilaterals Blackline Run a class set plus a few extra and one copy on a transparency.

types of triangles
1 You can classify triangles by the size of their angles.
acute triangle
All 3 angles are acute.
right triangle
One of the angles is a right angle
Obtuse triangle
One of the angles is obtuse.
2 You can also classify triangles by the length of their sides.
Isosceles triangle
Two sides are the same length.
scalene triangle
Each side is a different length.
equilateral triangle
Each side is the same length.
Are any of the triangles you made on the geoboard
equilaterals?
Can you make an equilateral triangle on a geoboard?
© The Math Learning CenterC1.6 • Bridges in Mathematics Grade 5 Supplement
set C1 Geometry: triangles & Quadrilaterals Blackline Run one copy on a transparency.
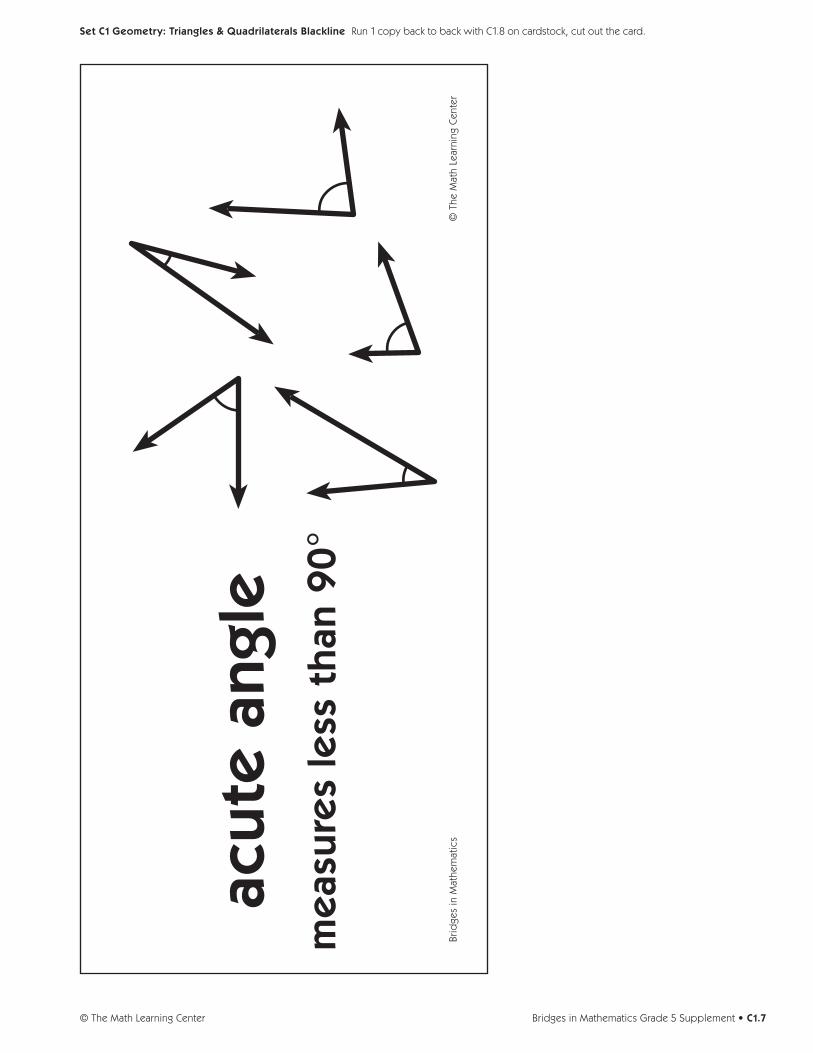
Bridges in Mathematics Grade 5 Supplement • C1.7© The Math Learning Center
set C1 Geometry: triangles & Quadrilaterals Blackline Run 1 copy back to back with C1.8 on cardstock, cut out the card.
© T
he M
ath
Lear
ning
Cen
ter
Brid
ges
in M
athe
mat
ics
acut
e an
gle
mea
sure
s le
ss t
han
90°

© The Math Learning CenterC1.8 • Bridges in Mathematics Grade 5 Supplement
set C1 Geometry: triangles & Quadrilaterals Blackline Run 1 copy back to back with C1.7 on cardstock, cut out the card.
Wo
rking Definitio
n
acute angle: an angle that has a m
easure less than 90°

Bridges in Mathematics Grade 5 Supplement • C1.9© The Math Learning Center
set C1 Geometry: triangles & Quadrilaterals Blackline Run 1 copy back to back with C1.10 on cardstock, cut out the card.
© T
he M
ath
Lear
ning
Cen
ter
Brid
ges
in M
athe
mat
ics
ob
tuse
ang
lem
easu
res
mo
re t
han
90°
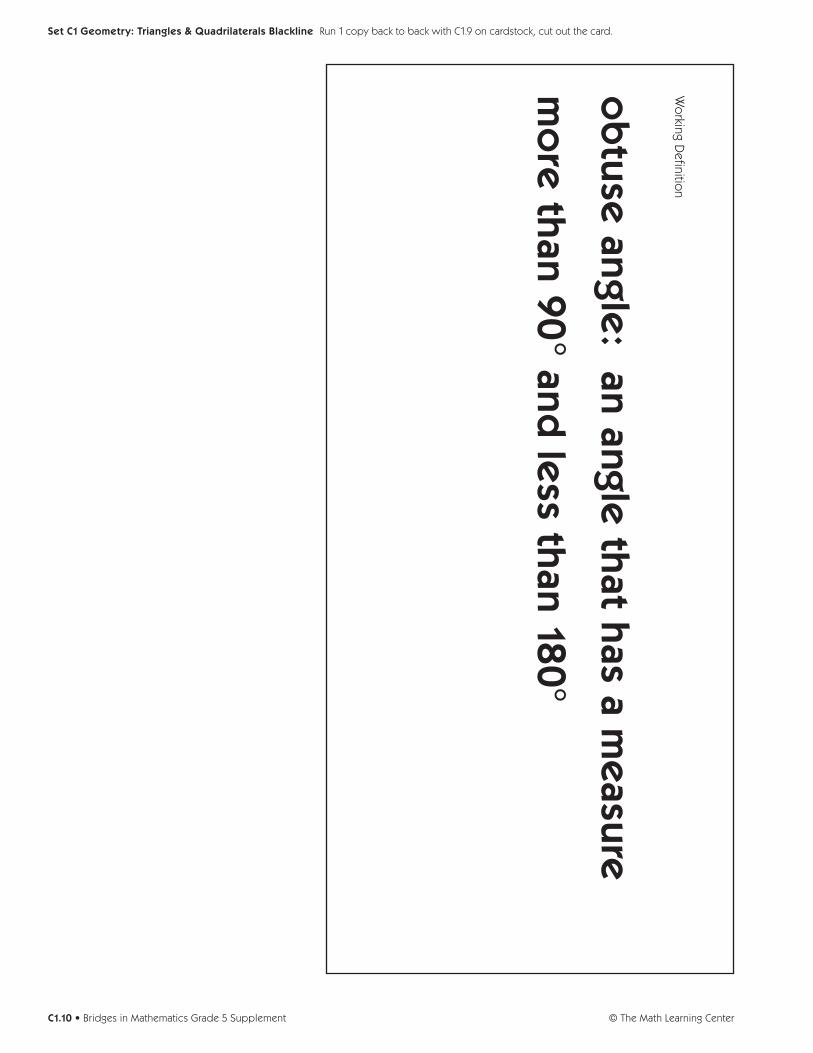
© The Math Learning CenterC1.10 • Bridges in Mathematics Grade 5 Supplement
set C1 Geometry: triangles & Quadrilaterals Blackline Run 1 copy back to back with C1.9 on cardstock, cut out the card.
Wo
rking Definitio
n
ob
tuse angle
: an angle that has a m
easure
mo
re than 90° and less than 180°
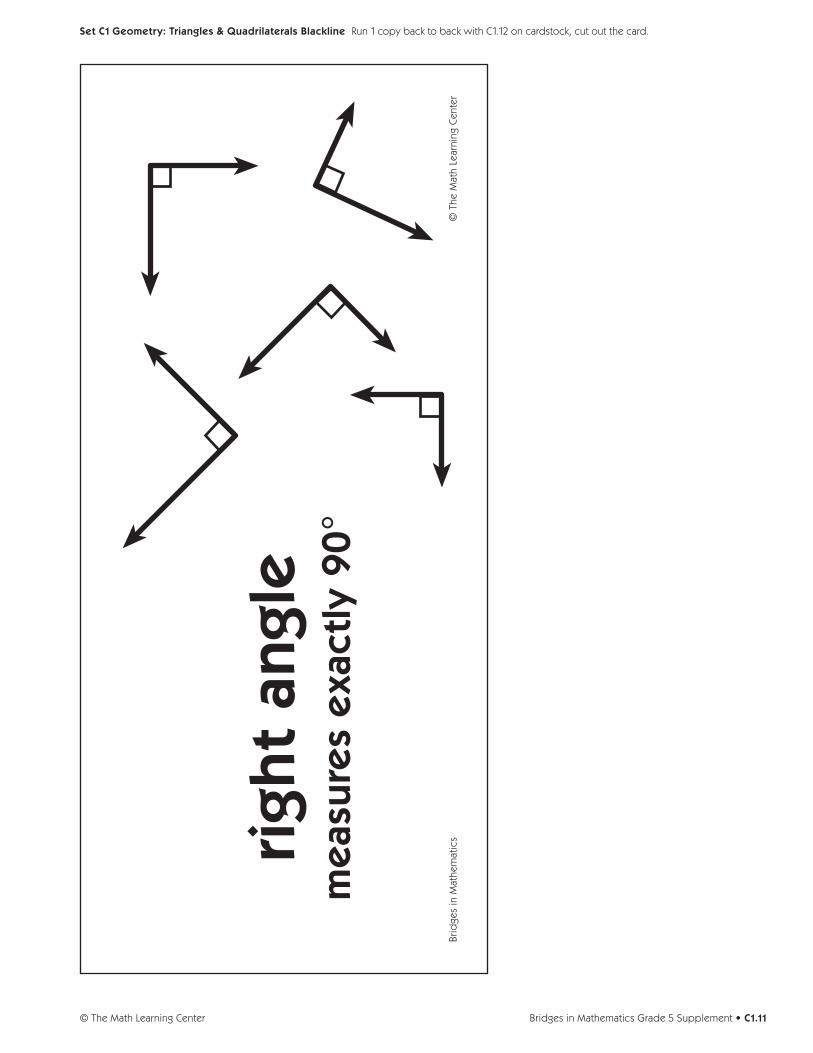
Bridges in Mathematics Grade 5 Supplement • C1.11© The Math Learning Center
set C1 Geometry: triangles & Quadrilaterals Blackline Run 1 copy back to back with C1.12 on cardstock, cut out the card.
© T
he M
ath
Lear
ning
Cen
ter
Brid
ges
in M
athe
mat
icsrigh
t an
gle
mea
sure
s e
xact
ly 9
0°

© The Math Learning CenterC1.12 • Bridges in Mathematics Grade 5 Supplement
set C1 Geometry: triangles & Quadrilaterals Blackline Run 1 copy back to back with C1.11 on cardstock, cut out the card.
Wo
rking Definitio
n
right angle
: an angle that has a 90° m
easure

set C1 H Activity 2
activity
sorting & Classifying Quadrilaterals
OverviewStudents review what they have learned about quadrilat-
erals, and use the information to sort and classify quadri-
laterals in a variety of ways.
skills & ConceptsH classify quadrilaterals
H measure length with accuracy
You’ll needH Different Kinds of Quadrilaterals (page C1.19, run a
copy on a transparency)
H Sorting Quadrilaterals (page C1.20, run a copy on a
transparency)
H Paper Quadrilaterals (page C1.21, run a half-class set
plus a few extra)
H Venn Diagram Mat (page C1.22, run a half-class set)
H The Logic of Quadrilaterals (page A1.23, optional, run
a class set)
H paper to mask parts of the overhead and overhead pens
H class sets of scissors, rulers and protractors
Instructions for sorting & Classifying Quadrilaterals1. Write the word quadrilateral on the board or overhead. Ask students to pair-share what they know about this term right now. Then invite a few volunteers to share their ideas with the class. If it doesn’t emerge from the group, solicit agreement that a quadrilateral is a 4-sided polygon. Then work with stu-dent input to list several examples of different quadrilaterals.
2. Explain that the class is going to do some more work with quadrilaterals today. Display the top por-tion of Different Kinds of Quadrilaterals on the overhead. Read and discuss the name and description of each shape with students. Here are some questions you might pose as you review the terms with the class. Encourage students to use the information on the overhead as they formulate their answers.• Whatisthedifferencebetweenarhombusandasquare?• Whydopeoplesaythatasquareisaspecialkindofrectangle?• Woulditbefairtosaythatasquareisaspecialkindofrhombus?Why?• Isatrapezoidalsoaparallelogram?Whyorwhynot?(No,becauseitonlyhas1pairofparallelsides.)• Whyisarhombusclassifiedasaparallelogram?(Becauseithas2pairsofparallelsidesopposite
eachother.)• Isarhombusalsoakite?Whyorwhynot?(Yes,becauseithastwopairsofadjacentsidesthatare
congruent;infact,all4ofitssidesarecongruent.)• Arethereanyotherquadrilateralsthatcouldbecalledkites?Whichone(s),andwhy?(Asquareis
alsoakitebecauseithastwopairsofadjacentsidesthatarecongruent.)• Whichoneoftheseshapescouldbegiventhemostnames?Why?(Asquare,becauseiscanalsobe
calledaquadrilateral,akite,aparallelogram,arectangle,andarhombus!)
set C1 Geometry: triangles & Quadrilaterals
Bridges in Mathematics Grade 5 Supplement • C1.13© The Math Learning Center

Different Kinds of Quadrilaterals
A Quadrilateral is any polygon with 4 sides
trapezoida quadrilateral with exactly
1 pair of parallel sides
parallelograma quadrilateral with 2 pairs of parallel sides opposite
each other
rectanglea parallelogram with
4 right angles
rhombusa parallelogram with 4
congruent sides
squarea parallelogram with 4 congruent sides and 4
right angles
kitea quadrilateral with two
pairs of adjacent sides that are congruent
True or false?
1 This shape is a quadrilateral.
2 This shape is a trapezoid.
3 This shape is a rhombus.
4 This shape is a parallelogram.
5 This shape is a rectangle.
Set C1 Geometry: Triangles & Quadrilaterals Blackline Run one copy on a transparency.
3. Display the bottom portion of the overhead, and have students pair-share their responses to all five questions. Ask them to jot their answers down on a piece of scratch paper, and be prepared to explain and justify each. After a minute or two, reconvene the class. Invite a different volunteer to answer and explain his or her response to each question.
Different Kinds of Quadrilaterals
quadrilateral any polygon with 4 sides
trapezoid a quadrilateral with exactly 1 pair of parallel sides
parallelogram a quadrilateral with 2 pairs of parallel sides opposite each other
rectangle a parallelogram with 4 right angles
rhombus a parallelogram with 4 congruent sides
square a parallelogram with 4 congruent sides and 4 right angles
kite a quadrilateral with two pairs of adjacent sides that are congruent
True or false?
1 This shape is a quadrilateral.
2 This shape is a trapezoid.
3 This shape is a rhombus.
4 This shape is a parallelogram.
5 This shape is a rectangle.
Set C1 Geometry: Triangles & Quadrilaterals Blackline Run one copy on a transparency.
4.Next,askstudentsifanyoftheotherquadrilateralnamesonthelistappliestotheshapeatthebot-tom of the overhead. The shape is a rectangle, but it can also be called a quadrilateral and a parallelo-gram. It cannot be called a trapezoid or a rhombus. • Canitbecalledasquareorakite?Whyorwhynot?(Neither,becauseitdoesnothave4congruent
sides,nordoesithavecongruentsidesthatareadjacenttooneanother.)• Whichofthenamesdescribestheshapethemostexactlyandspecifically?Why?(Rectangle,because
aquadrilateralcouldbeany4-sidedfigure,andaparallelogramdoesn’thavetohave4rightangles.)
5.Nowexplainthatthestudentsaregoingtoworkinpairstolabelandcutoutasetofpaperquadrilat-erals. They will be sorting these quadrilaterals in a few minutes, but their first task is to label each with the name that describes it most exactly and specifically. Have students pair up and get out their scissors. They may also need rulers and protractors because they will probably have to measure the angles and side lengths of some of the shapes to identify them accurately.
Give each pair a copy of the Paper Quadrilaterals sheet. Ask them to cut it in half so each partner can la-bel and cut out half the shapes in the set.
activity 2 Sorting & Classifying Quadrilaterals (cont.)
set C1 Geometry: triangles & Quadrilaterals
© The Math Learning CenterC1.14 • Bridges in Mathematics Grade 5 Supplement

Paper Quadrilaterals
Label each quadrilateral with the most specifi c name you can fi nd for it. Then cut out the shapes.
a
b
c
d
e
f
g
h
m
l
i
j
k
n
Set C1 Geometry: Triangles & Quadrilaterals Blackline Run a half class set single-sided on colored copy paper.
6. Once students understand the labeling and cutting procedures, have them go to work. Leave the Quadrilaterals overhead on display for their reference. Circulate to provide assistance as needed, but en-courage students to help their partners and confirm their answers with other pairs nearby.
7. When most students have finished labeling and cutting out their shapes, confirm the name of each with the class. One simple way to do this is to have volunteers list the letters that belong in each shape group as you record at the overhead.
Different Kinds of Quadrilaterals
A Quadrilateral is any polygon with 4 sides
trapezoida quadrilateral with exactly
1 pair of parallel sides
parallelograma quadrilateral with 2 pairs of parallel sides opposite
each other
rectanglea parallelogram with
4 right angles
rhombusa parallelogram with 4
congruent sides
squarea parallelogram with 4 congruent sides and 4
right angles
kitea quadrilateral with two
pairs of adjacent sides that are congruent
True or false?
1 This shape is a quadrilateral.
2 This shape is a trapezoid.
3 This shape is a rhombus.
4 This shape is a parallelogram.
5 This shape is a rectangle.
Set C1 Geometry: Triangles & Quadrilaterals Blackline Run one copy on a transparency.
activity 2 Sorting & Classifying Quadrilaterals (cont.)
set C1 Geometry: triangles & Quadrilaterals
Bridges in Mathematics Grade 5 Supplement • C1.15© The Math Learning Center

8.Next,giveeachstudentpairaVennDiagramMat,andexplainthattheyaregoingtoworktogethertosort their shapes in a variety of ways. Place the first prompt at the top of the Sorting Quadrilaterals over-head on display.
Sorting Quadrilaterals
1 Quadrilaterals/Trapezoids
2 Trapezoids/Parallelograms
3 Parallelograms/Rectangles
4 Rectangles/Rhombuses
5 Kites/Rectangles
6 Kites/Parallelograms
Set C1 Geometry: Triangles & Quadrilaterals Blackline Run one copy on a transparency.
Read the prompt with the class, and ask students to sort their shapes onto the mat, quadrilaterals in one circle and trapezoids in the other. If there are any shapes that qualify as both quadrilaterals and trap-ezoids, ask students to place them between the circles, at the intersection of the two sets. If there are shapes that don’t fit either description, ask students to place them off to one side.
9. Encourage students to share and compare their results with other pairs nearby. When most pairs have finished,callonvolunteerstoshareandexplaintheirresults.YoumaywanttosketchaVenndiagramon the overhead and invite volunteers to sort their shapes for the class to see. You can also ask students to examine the speakers’ work from where they are sitting, or stand if necessary.
Students There are only 4 trapezoids, and they had to go in the middle because they are also quadrilaterals. All the shapes went on the mat because they all have 4 sides. The ones in the middle are quadrilat-erals and trapezoids.
Venn Diagram Mat
Set
C1 G
eo
me
try:
Tri
ang
les
& Q
uad
rila
tera
ls B
lack
line
Run
a h
alf c
lass
set
10. Repeat steps 8 and 9 as you display each of the other sorting prompts on the overhead one by one. Some of the prompts are more challenging than others, and may result in lively discussion and debate.
activity 2 Sorting & Classifying Quadrilaterals (cont.)
set C1 Geometry: triangles & Quadrilaterals
© The Math Learning CenterC1.16 • Bridges in Mathematics Grade 5 Supplement

Sorting Quadrilaterals
1 Quadrilaterals/Trapezoids
2 Trapezoids/Parallelograms
3 Parallelograms/Rectangles
4 Rectangles/Rhombuses
5 Kites/Rectangles
6 Kites/Parallelograms
Set C1 Geometry: Triangles & Quadrilaterals Blackline Run one copy on a transparency.
extension• GivestudentseachacopyofTheLogicofQuadrilaterals.Thediagramonthissheetillustratesthe
relationships between the various quadrilaterals in a very succinct way. Students are asked to label each of the shapes, and then answer a series of questions designed to help them think about how the shapes have been placed in relation to one another, and why. After reviewing the instructions to-gether,havestudentscompletethesheetindependently.Thendiscussitasagroup.(Thereisacopyof the diagram at the bottom of the Sorting Quadrilaterals overhead you can use to focus and direct thediscussion.)
The Logic of Quadrilaterals
1 Label each shape in this diagram with the name that describes it most exactly.
2 Why is the trapezoid inside the quadrilateral but outside the parallelogram?
3 Why are there a rhombus and a rectangle inside the parallelogram?
4 Why are there two squares, one inside the rhombus and one inside the rectangle?
5 Write at least 2 other observations to explain why the shapes in this diagram have been placed where they are in relation to each other.
NAME DATE
Set C1 Geometry: Triangles & Quadrilaterals Blackline Optional, run a class set.
activity 2 Sorting & Classifying Quadrilaterals (cont.)
set C1 Geometry: triangles & Quadrilaterals
Bridges in Mathematics Grade 5 Supplement • C1.17© The Math Learning Center

independent Worksheet
Use Set C1 Independent Worksheets 3 and 4 to provide students with more practice classifying and drawing quadrilaterals from information given about sides and angles.
activity 2 Sorting & Classifying Quadrilaterals (cont.)
set C1 Geometry: triangles & Quadrilaterals
© The Math Learning CenterC1.18 • Bridges in Mathematics Grade 5 Supplement

different Kinds of Quadrilaterals
A Quadrilateral is any polygon with 4 sides
trapezoida quadrilateral with exactly
1 pair of parallel sides
parallelograma quadrilateral with 2 pairs of parallel sides opposite
each other
rectanglea parallelogram with
4 right angles
rhombusa parallelogram with 4
congruent sides
squarea parallelogram with 4 congruent sides and 4
right angles
kitea quadrilateral with two
pairs of adjacent sides that are congruent
true or false?
1 This shape is a quadrilateral.
2 This shape is a trapezoid.
3 This shape is a rhombus.
4 This shape is a parallelogram.
5 This shape is a rectangle.
Bridges in Mathematics Grade 5 Supplement • C1.19© The Math Learning Center
set C1 Geometry: triangles & Quadrilaterals Blackline Run one copy on a transparency.

sorting Quadrilaterals
1 Quadrilaterals/Trapezoids
2 Trapezoids/Parallelograms
3 Parallelograms/Rectangles
4 Rectangles/Rhombuses
5 Kites/Rectangles
6 Kites/Parallelograms
© The Math Learning CenterC1.20 • Bridges in Mathematics Grade 5 Supplement
set C1 Geometry: triangles & Quadrilaterals Blackline Run one copy on a transparency.

paper Quadrilaterals
Label each quadrilateral with the most specific name you can find for it. Then cut out the shapes.
a
b
c
d
e
f
g
h
m
l
i
j
k
n
Bridges in Mathematics Grade 5 Supplement • C1.21© The Math Learning Center
set C1 Geometry: triangles & Quadrilaterals Blackline Run a half class set single-sided on colored copy paper.

Venn
dia
gra
m m
at
© The Math Learning CenterC1.22 • Bridges in Mathematics Grade 5 Supplement
set C1 Geometry: triangles & Quadrilaterals Blackline Run a half class set

the logic of Quadrilaterals
1 Label each shape in this diagram with the name that describes it most exactly.
2 Why is the trapezoid inside the quadrilateral but outside the parallelogram?
3 Why are there a rhombus and a rectangle inside the parallelogram?
4 Why are there two squares, one inside the rhombus and one inside the rectangle?
5 Write at least 2 other observations to explain why the shapes in this diagram have been placed where they are in relation to each other.
Bridges in Mathematics Grade 5 Supplement • C1.23© The Math Learning Center
name date
set C1 Geometry: triangles & Quadrilaterals Blackline Optional, run a class set.

© The Math Learning CenterC1.24 • Bridges in Mathematics Grade 5 Supplement

set C1 H Activity 3
activity
Finding the perimeter & area of a parallelogram
OverviewStudents find the perimeter and area of an index card,
then cut the card and tape the two resulting pieces
together to form a parallelogram that is not a rectangle.
Then they find the perimeter and area of the parallelo-
gram. As they do so, they discover that multiplying the
length of one side by the other does not yield the area of
a non-rectangular parallelogram. After students investigate
further by creating two more parallelograms, the teacher
shares the formula for finding the area of a parallelogram,
and asks the class to explain and apply it.
skills & ConceptsH classify quadrilaterals
H determine the formula for the area of a parallelogram
by relating it to the area of a rectangle
H use formulas to determine the perimeters and areas of
rectangles and parallelograms
H use appropriate tools and units to measure objects to
the precision of one-eighth inch
You’ll needH Start with a Rectangle (page C1.30, run a copy on a
transparency)
H Square Inch Grid Paper (page C1.31, run several class
sets and one copy on a transparency)
H Finding the Area of Parallelograms (pages C1.32 and
C1.33 , run a class set)
H paper to mask parts of the overhead
H overhead pens
H 3" x 5" index cards or pieces of construction paper, 3
per student
H class set of rulers
H scissors
H several rolls of scotch tape
Instructions for Finding the perimeter & area of a parallelogram1. Write the words perimeter and area on the board. Have students pair-share the definition of each term, andthenaskvolunteerstosharetheirdefinitionswiththeclass.Brieflyreviewtheformulasforfindingtheperimeter(2l + 2w)andarea(l × w)ofarectangle,andgivestudentseachanindexcard.Askstu-dents to measure the length and the width of the index card in inches, and use the information to find its perimeter and the area. Have them use a piece of scratch paper or the card itself if they need to do any writing as they determine these measurements.
2. When most students have finished, display just the first instruction on the Start with a Rectangle overhead, and work with input from the class to record the perimeter and area of the index card. Then reveal the second task on the overhead. Write 3" in the blank as you read the instruction with the class, and give students time to measure and mark their cards as specified. Ask them to be as precise as pos-sible in their measurements. Show the rest of the tasks on the overhead one by one. Read each task with the class and give students time to complete it before moving on to the next. Take time to discuss each question, and record the answers on the overhead. Ask students to be certain they have formed a paral-lelogram that is not a rectangle before they use any scotch tape.
set C1 Geometry: triangles & Quadrilaterals
Bridges in Mathematics Grade 5 Supplement • C1.25© The Math Learning Center

Start with a Rectangle
1 Find the perimeter of your rectangle in inches. Find the area of your rectangle in square inches.
Perimeter = __________ Area = __________
2 Measure over ______ along the top of your rectangle and make a small mark.
3 Draw a diagonal line from the lower left-hand corner to the mark.
4 Cut along the line. What 2 shapes do you have now? How do you know?
5 Combine the 2 shapes to make a parallelogram that is not a rectangle. Tape the edges together.
6 Find the perimeter of your parallelogram to the nearest eighth of an inch. Find the area of your parallelogram in square inches.
Perimeter = __________ Area = __________
7 Here is the formula for fi nding the area of a paralellogram that is not a rect-angle. Explain how and why it works.
Area of paralellogram = base × height or bh
height (h)
base (b)
h
Set C1 Geometry: Triangles & Quadrilaterals Blackline Run one copy on a transparency.
16"3"
15 sq in
right isosceles triangle, trapezoid
3. The last question on the overhead asks students to find the perimeter and area of the parallelogram they formed when they cut and taped the index card. When you reach this point, make square-inch grid paper available, and give students some time to investigate at their tables. Some may believe that the area is still 15 square inches because they didn’t add anything or take anything away when they formed their parallelogram. Press them to find a way to prove this, using the grid paper or some other method. Other students may need to trace the parallelogram onto the grid paper and count the squares and tri-angles to discover that the area has remained the same, even though the perimeter has changed.
4. When most students have found the perimeter and area of the parallelogram, reconvene the class. Askvolunteerstosharetheirresultsandstrategies.Mostwilllikelyreportthattheperimeteris181/2 inches, and the area is 15 square inches. Here are some questions to pose during the discussion:• Istheperimeteroftheparallelogramthesameastheperimeteroftheoriginalrectangle?Whyor
why not?• Istheareathesame?Whyorwhynot?• Doestheformulaforfindingtheperimeterofarectanglestillworkwiththisparallelogram?• Doestheformulaforfindingtheareaofarectanglehelpyoufindtheareaoftheparallelogram?Ifso,
how? If not, why?
Students The perimeter changed when we made the card into a parallelogram. It was 3 by 5, so the perimeter was 16 inches. Now it’s about 4 1/4 inches along the diagonal side and still 5 inches along the top. Two times 5 is 10, and two times 4 1/4 is 8 1/2, so that’s 18 1/2 inches now instead of 16. When you cut it on the diagonal like that, it definitely makes the sides longer.
Students It’s still 15 square inches for the area, though. We traced it on the grid paper and counted the squares and triangles. It came out to be exactly 15 square inches.
activity 3 Finding the Perimeter & Area of a Parallelogram (cont.)
set C1 Geometry: triangles & Quadrilaterals
© The Math Learning CenterC1.26 • Bridges in Mathematics Grade 5 Supplement
You can’t use the regular formula to find the area of the parallelogram. If you multiply 4 1/4 times 5, it’s more than 20 square inches. But you can see that the area is really 15 square inches, not 20 square inches. I know one-fourth is .25, so I put in 5 × 4.25 on my calculator. It came out to be 21.25. That’s 21 1/4 square inches, but the parallelogram is really only 15 square inches.
5. Work with students’ input to summarize their findings by sketching the rectangle and the parallelo-gram on the whiteboard and recording the perimeter and area of each.
P = 16 inA = 15 sq in
P = 18 1/2 inA = 15 sq in
6. Erase the overhead. Give students each another index card. Repeat the process a second time, but have them measure and mark over 2 inches instead of 3 inches this time. When they cut along the line, they will discover that they have formed a right scalene triangle and a trapezoid. Have them combine these two shapes to make a second parallelogram, and find the perimeter and area of this figure. Invite a couple of volunteers to trace their new parallelograms on the Square Inch Grid overhead and share their strategies for determining the area.
3 9
3 + 9 + 3 = 15 sq. in.
3
Toby’s Strategy Eric’s Strategy
Toby I just imagined cutting off the triangle at this end and sliding it over to the other side. You can see it will still be 15 square inches.
Eric I surrounded the triangle at this end with a rectangle. That rectangle is 6, so the triangle is 3 square inches. If you do that with the triangles at both ends, and then add their areas to the square in the middle, it comes out to be 3 + 9 + 3, and that’s 15 square inches.
activity 3 Finding the Perimeter & Area of a Parallelogram (cont.)
set C1 Geometry: triangles & Quadrilaterals
Bridges in Mathematics Grade 5 Supplement • C1.27© The Math Learning Center

7. Summarize students’ findings on the whiteboard. Then give them another index card, erase the over-head, and repeat the process once more. This time, have students measure and mark one inch over alongthetopofthecard,drawthediagonal,makethecut,identifythetwoshapesthatresult(arightscalenetriangleandatrapezoid),combinethetwoshapestomakeaparallelogram,andfindtheperim-eter and area. Invite a couple of volunteers to trace their parallelograms and share their strategies for finding the area.
8. Summarize the third set of findings on the whiteboard, and ask students to share any observations they can make. How and why did the perimeter change from one parallelogram to the next? Why did the area remain the same each time?
P = 16 inA = 15 sq in
P = 18 1/2 inA = 15 sq in
P = 16 inA = 15 sq in
P = 17 inA = 15 sq in
P = 16 inA = 15 sq in
P = 16 1/2 inA = 15 sq in
9. Display the information at the bottom of the overhead, which gives the formula for finding the area of a parallelogram that is not a rectangle. Ask students to discuss and explain how the formula works, based on their experiences during this activity.
Start with a Rectangle
1 Find the perimeter of your rectangle in inches. Find the area of your rectangle in square inches.
Perimeter = __________ Area = __________
2 Measure over ______ along the top of your rectangle and make a small mark.
3 Draw a diagonal line from the lower left-hand corner to the mark.
4 Cut along the line. What 2 shapes do you have now? How do you know?
5 Combine the 2 shapes to make a parallelogram that is not a rectangle. Tape the edges together.
6 Find the perimeter of your parallelogram to the nearest eighth of an inch. Find the area of your parallelogram in square inches.
Perimeter = __________ Area = __________
7 Here is the formula for fi nding the area of a paralellogram that is not a rect-angle. Explain how and why it works.
Area of paralellogram = base × height or bh
height (h)
base (b)
h
Set C1 Geometry: Triangles & Quadrilaterals Blackline Run one copy on a transparency.
16"3"
15 sq in
right isosceles triangle, trapezoid
10. Give students each a copy of Finding the Area of Parallelograms. Review the instructions on both sheets with the class. When students understand what to do, let them get started. Plan to assign unfin-ished work as homework or seatwork the following day.
activity 3 Finding the Perimeter & Area of a Parallelogram (cont.)
set C1 Geometry: triangles & Quadrilaterals
© The Math Learning CenterC1.28 • Bridges in Mathematics Grade 5 Supplement

Finding the Area of Parallelograms page 1 of 2
The height (h) of a parallelogram tells how far one side is from its opposite side. Theheight of a parallelogram must be perpendicular to the base (b) of the parallelogram.
h
b
1 Use the letter h to label the height of each parallelogram below. Use the letter b to label the base. If the height is not shown, use your ruler to draw it in, and then label it.
2 To fi nd the area of a parallelogram, multiply base times height. Try it for your-self. Measure the base and the height of the parallelogram below in centimeters. Multiply the two measurements. Is the answer correct? Use a labeled sketch, numbers, and words to explain.
ab
d
c
NAME DATE
Set C1 Geometry: Triangles & Quadrilaterals Blackline Run a class set
Finding the Area of Parallelograms page 2 of 2
Here are the formulas for the area of a rectangle and the area of a parallelogram.
• The area of a rectangle = length × width or l × w or lw.• The area of a parallelogram = base × height or b × h or bh.
3 Find the area of each fi gure below. Use the formulas. Show your work.
a 6 cm
4 cm
Area = __________ sq cm
b
4 cm
6 cm
Area = __________ sq cm
4 For each of the parallelograms below:• draw in the height.• measure and label the height and the base to the nearest centimeter.• fi nd and record the area and show your work..
a
Area = __________ sq cm
b
Area = __________ sq cm
NAME DATE
Set C1 Geometry: Triangles & Quadrilaterals Blackline Run a class set
activity 3 Finding the Perimeter & Area of a Parallelogram (cont.)
set C1 Geometry: triangles & Quadrilaterals
Bridges in Mathematics Grade 5 Supplement • C1.29© The Math Learning Center

start with a rectangle
1 Find the perimeter of your rectangle in inches. Find the area of your rectangle in square inches.
Perimeter = __________ Area = __________
2Measureover______alongthetopofyourrectangleandmakeasmallmark.
3 Draw a diagonal line from the lower left-hand corner to the mark.
4 Cut along the line. What 2 shapes do you have now? How do you know?
5 Combine the 2 shapes to make a parallelogram that is not a rectangle. Tape the edges together.
6 Find the perimeter of your parallelogram to the nearest eighth of an inch. Find the area of your parallelogram in square inches.
Perimeter = __________ Area = __________
7 Here is the formula for finding the area of a paralellogram that is not a rect-angle. Explain how and why it works.
Area of paralellogram = base × height or bh
height (h)
base (b)
h
© The Math Learning CenterC1.30 • Bridges in Mathematics Grade 5 Supplement
set C1 Geometry: triangles & Quadrilaterals Blackline Run one copy on a transparency.
square Inch Grid paper
Bridges in Mathematics Grade 5 Supplement • C1.31© The Math Learning Center
set C1 Geometry: triangles & Quadrilaterals Blackline Run several class sets and one copy on a transparency.

Finding the area of parallelograms page 1 of 2
Theheight(h)ofaparallelogramtellshowfaronesideisfromitsoppositeside.The heightofaparallelogrammustbeperpendiculartothebase(b)oftheparallelogram.
h
b
1 Use the letter h to label the height of each parallelogram below. Use the letter b to label the base. If the height is not shown, use your ruler to draw it in, and then label it.
2 To find the area of a parallelogram, multiply base times height. Try it for your-self.Measurethebaseandtheheightoftheparallelogrambelowincentimeters.Multiplythetwomeasurements.Istheanswercorrect?Usealabeledsketch,numbers, and words to explain.
ab
d
c
© The Math Learning CenterC1.32 • Bridges in Mathematics Grade 5 Supplement
name date
set C1 Geometry: triangles & Quadrilaterals Blackline Run a class set

Finding the area of parallelograms page 2 of 2
Here is the formula for finding the area of a parallelogram.
• Theareaofaparallelogram=base×heightorb×horbh.(Sincearectangleisaspecial kind of parallelogram, this is also the formula for the area of a rectangle.)
3 Find the area of each figure below. Use the formulas. Show your work.
a 6 cm
4 cm
Area = __________ sq cm
b
4 cm
6 cm
Area = __________ sq cm
4 For each of the parallelograms below:• drawintheheight.• measureandlabeltheheightandthebasetothenearestcentimeter.• findandrecordtheareaandshowyourwork..
a
Area = __________ sq cm
b
Area = __________ sq cm
Bridges in Mathematics Grade 5 Supplement • C1.33© The Math Learning Center
name date
set C1 Geometry: triangles & Quadrilaterals Blackline Run a class set

© The Math Learning CenterC1.34 • Bridges in Mathematics Grade 5 Supplement
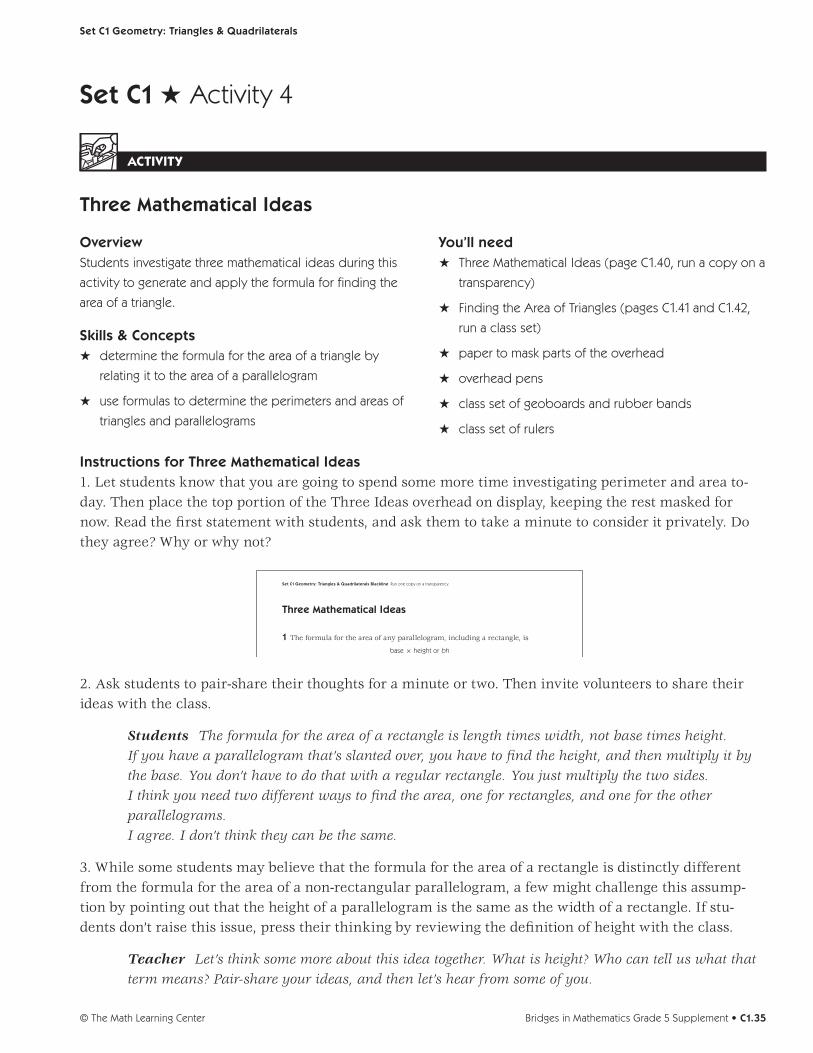
set C1 H Activity 4
activity
three mathematical Ideas
OverviewStudents investigate three mathematical ideas during this
activity to generate and apply the formula for finding the
area of a triangle.
skills & ConceptsH determine the formula for the area of a triangle by
relating it to the area of a parallelogram
H use formulas to determine the perimeters and areas of
triangles and parallelograms
You’ll needH Three Mathematical Ideas (page C1.40, run a copy on a
transparency)
H Finding the Area of Triangles (pages C1.41 and C1.42,
run a class set)
H paper to mask parts of the overhead
H overhead pens
H class set of geoboards and rubber bands
H class set of rulers
Instructions for three mathematical Ideas1. Let students know that you are going to spend some more time investigating perimeter and area to-day. Then place the top portion of the Three Ideas overhead on display, keeping the rest masked for now. Read the first statement with students, and ask them to take a minute to consider it privately. Do they agree? Why or why not?
Three Mathematical Ideas
1 The formula for the area of any parallelogram, including a rectangle, is
base × height or bh
2 Any triangle is half of a parallelogram.
3 If any triangle is half of a parallelogram, and the area of any parallelogram is base x height, the formula for the area of any triangle must be
1⁄2 base × height, or 1⁄2 bh.
Set C1 Geometry: Triangles & Quadrilaterals Blackline Run one copy on a transparency.
2. Ask students to pair-share their thoughts for a minute or two. Then invite volunteers to share their ideas with the class.
Students The formula for the area of a rectangle is length times width, not base times height. If you have a parallelogram that’s slanted over, you have to find the height, and then multiply it by the base. You don’t have to do that with a regular rectangle. You just multiply the two sides. I think you need two different ways to find the area, one for rectangles, and one for the other parallelograms. I agree. I don’t think they can be the same.
3. While some students may believe that the formula for the area of a rectangle is distinctly different from the formula for the area of a non-rectangular parallelogram, a few might challenge this assump-tion by pointing out that the height of a parallelogram is the same as the width of a rectangle. If stu-dents don’t raise this issue, press their thinking by reviewing the definition of height with the class.
Teacher Let’s think some more about this idea together. What is height? Who can tell us what that term means? Pair-share your ideas, and then let’s hear from some of you.
set C1 Geometry: triangles & Quadrilaterals
Bridges in Mathematics Grade 5 Supplement • C1.35© The Math Learning Center
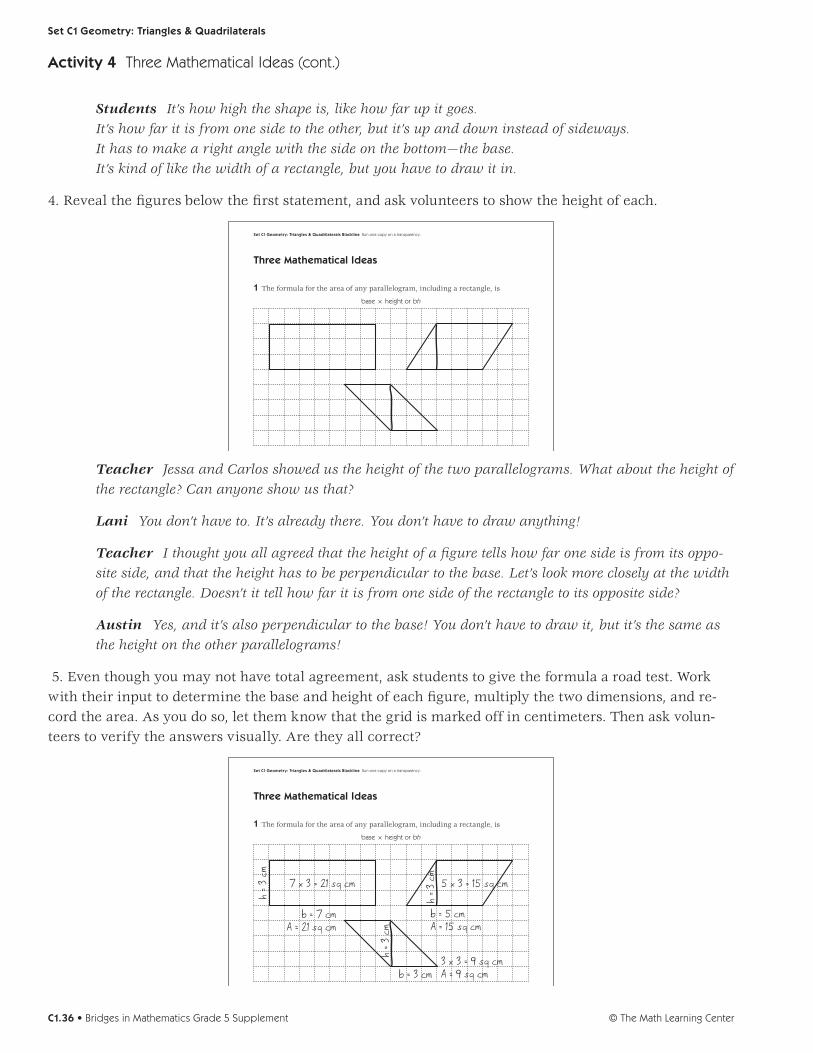
Students It’s how high the shape is, like how far up it goes. It’s how far it is from one side to the other, but it’s up and down instead of sideways. It has to make a right angle with the side on the bottom—the base. It’s kind of like the width of a rectangle, but you have to draw it in.
4. Reveal the figures below the first statement, and ask volunteers to show the height of each.
Three Mathematical Ideas
1 The formula for the area of any parallelogram, including a rectangle, is
base × height or bh
2 Any triangle is half of a parallelogram.
3 If any triangle is half of a parallelogram, and the area of any parallelogram is base x height, the formula for the area of any triangle must be
1⁄2 base × height, or 1⁄2 bh.
Set C1 Geometry: Triangles & Quadrilaterals Blackline Run one copy on a transparency.
Teacher Jessa and Carlos showed us the height of the two parallelograms. What about the height of the rectangle? Can anyone show us that?
Lani You don’t have to. It’s already there. You don’t have to draw anything!
Teacher I thought you all agreed that the height of a figure tells how far one side is from its oppo-site side, and that the height has to be perpendicular to the base. Let’s look more closely at the width of the rectangle. Doesn’t it tell how far it is from one side of the rectangle to its opposite side?
Austin Yes, and it’s also perpendicular to the base! You don’t have to draw it, but it’s the same as the height on the other parallelograms!
5. Even though you may not have total agreement, ask students to give the formula a road test. Work with their input to determine the base and height of each figure, multiply the two dimensions, and re-cord the area. As you do so, let them know that the grid is marked off in centimeters. Then ask volun-teers to verify the answers visually. Are they all correct?
Three Mathematical Ideas
1 The formula for the area of any parallelogram, including a rectangle, is
base × height or bh
2 Any triangle is half of a parallelogram.
3 If any triangle is half of a parallelogram, and the area of any parallelogram is base x height, the formula for the area of any triangle must be
1⁄2 base × height, or 1⁄2 bh.
Set C1 Geometry: Triangles & Quadrilaterals Blackline Run one copy on a transparency.
7 x 3 = 21 sq cm 5 x 3 = 15 sq cm
b = 7 cmA = 21 sq cm
b = 5 cmA = 15 sq cm
b = 3 cm3 x 3 = 9 sq cmA = 9 sq cm
h = 3
cm
h = 3
cm
h = 3
cm
activity 4 Three Mathematical Ideas (cont.)
set C1 Geometry: triangles & Quadrilaterals
© The Math Learning CenterC1.36 • Bridges in Mathematics Grade 5 Supplement
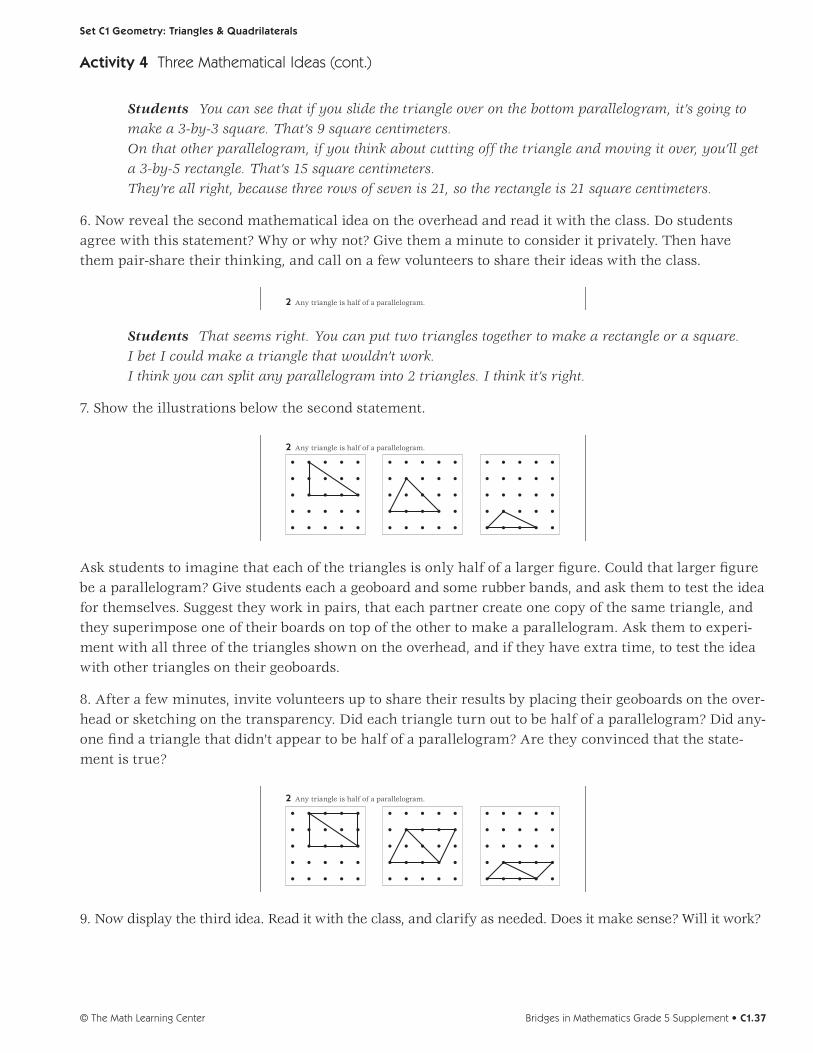
Students You can see that if you slide the triangle over on the bottom parallelogram, it’s going to make a 3-by-3 square. That’s 9 square centimeters. On that other parallelogram, if you think about cutting off the triangle and moving it over, you’ll get a 3-by-5 rectangle. That’s 15 square centimeters. They’re all right, because three rows of seven is 21, so the rectangle is 21 square centimeters.
6.Nowrevealthesecondmathematicalideaontheoverheadandreaditwiththeclass.Dostudentsagree with this statement? Why or why not? Give them a minute to consider it privately. Then have them pair-share their thinking, and call on a few volunteers to share their ideas with the class.
Three Mathematical Ideas
1 The formula for the area of any parallelogram, including a rectangle, is
base × height or bh
2 Any triangle is half of a parallelogram.
3 If any triangle is half of a parallelogram, and the area of any parallelogram is base x height, the formula for the area of any triangle must be
1⁄2 base × height, or 1⁄2 bh.
Set C1 Geometry: Triangles & Quadrilaterals Blackline Run one copy on a transparency.
Students That seems right. You can put two triangles together to make a rectangle or a square. I bet I could make a triangle that wouldn’t work. I think you can split any parallelogram into 2 triangles. I think it’s right.
7. Show the illustrations below the second statement.
Three Mathematical Ideas
1 The formula for the area of any parallelogram, including a rectangle, is
base × height or bh
2 Any triangle is half of a parallelogram.
3 If any triangle is half of a parallelogram, and the area of any parallelogram is base x height, the formula for the area of any triangle must be
1⁄2 base × height, or 1⁄2 bh.
Set C1 Geometry: Triangles & Quadrilaterals Blackline Run one copy on a transparency.
Ask students to imagine that each of the triangles is only half of a larger figure. Could that larger figure be a parallelogram? Give students each a geoboard and some rubber bands, and ask them to test the idea for themselves. Suggest they work in pairs, that each partner create one copy of the same triangle, and they superimpose one of their boards on top of the other to make a parallelogram. Ask them to experi-ment with all three of the triangles shown on the overhead, and if they have extra time, to test the idea with other triangles on their geoboards.
8. After a few minutes, invite volunteers up to share their results by placing their geoboards on the over-head or sketching on the transparency. Did each triangle turn out to be half of a parallelogram? Did any-one find a triangle that didn’t appear to be half of a parallelogram? Are they convinced that the state-ment is true?
Three Mathematical Ideas
1 The formula for the area of any parallelogram, including a rectangle, is
base × height or bh
2 Any triangle is half of a parallelogram.
3 If any triangle is half of a parallelogram, and the area of any parallelogram is base x height, the formula for the area of any triangle must be
1⁄2 base × height, or 1⁄2 bh.
Set C1 Geometry: Triangles & Quadrilaterals Blackline Run one copy on a transparency.
9.Nowdisplaythethirdidea.Readitwiththeclass,andclarifyasneeded.Doesitmakesense?Willitwork?
activity 4 Three Mathematical Ideas (cont.)
set C1 Geometry: triangles & Quadrilaterals
Bridges in Mathematics Grade 5 Supplement • C1.37© The Math Learning Center
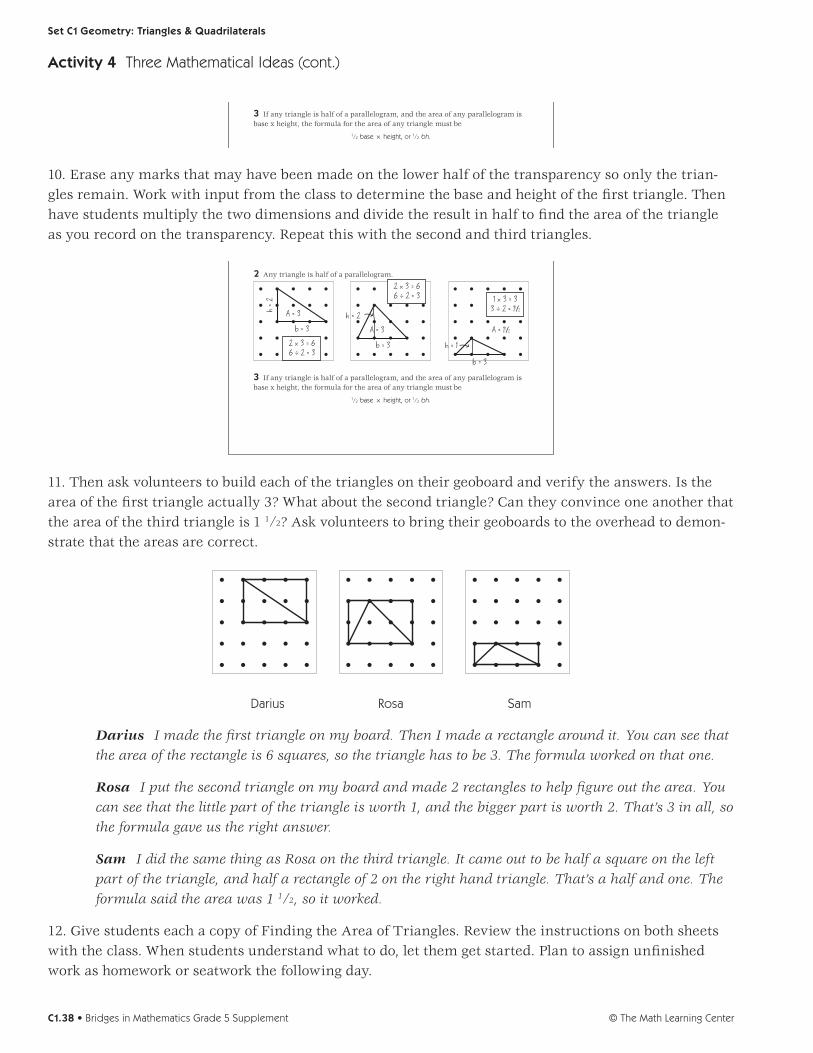
Three Mathematical Ideas
1 The formula for the area of any parallelogram, including a rectangle, is
base × height or bh
2 Any triangle is half of a parallelogram.
3 If any triangle is half of a parallelogram, and the area of any parallelogram is base x height, the formula for the area of any triangle must be
1⁄2 base × height, or 1⁄2 bh.
Set C1 Geometry: Triangles & Quadrilaterals Blackline Run one copy on a transparency.
10. Erase any marks that may have been made on the lower half of the transparency so only the trian-gles remain. Work with input from the class to determine the base and height of the first triangle. Then have students multiply the two dimensions and divide the result in half to find the area of the triangle as you record on the transparency. Repeat this with the second and third triangles.
Three Mathematical Ideas
1 The formula for the area of any parallelogram, including a rectangle, is
base × height or bh
2 Any triangle is half of a parallelogram.
3 If any triangle is half of a parallelogram, and the area of any parallelogram is base x height, the formula for the area of any triangle must be
1⁄2 base × height, or 1⁄2 bh.
Set C1 Geometry: Triangles & Quadrilaterals Blackline Run one copy on a transparency.
b = 3
A = 3
b = 3
b = 3
A = 3 A = 11/2
h = 2
2 x 3 = 66 ÷ 2 = 3
2 x 3 = 66 ÷ 2 = 3 1 x 3 = 3
3 ÷ 2 = 11/2
h = 2
h = 1
11. Then ask volunteers to build each of the triangles on their geoboard and verify the answers. Is the area of the first triangle actually 3? What about the second triangle? Can they convince one another that the area of the third triangle is 1 1/2? Ask volunteers to bring their geoboards to the overhead to demon-strate that the areas are correct.
Darius Rosa Sam
Darius I made the first triangle on my board. Then I made a rectangle around it. You can see that the area of the rectangle is 6 squares, so the triangle has to be 3. The formula worked on that one.
Rosa I put the second triangle on my board and made 2 rectangles to help figure out the area. You can see that the little part of the triangle is worth 1, and the bigger part is worth 2. That’s 3 in all, so the formula gave us the right answer.
Sam I did the same thing as Rosa on the third triangle. It came out to be half a square on the left part of the triangle, and half a rectangle of 2 on the right hand triangle. That’s a half and one. The formula said the area was 1 1/2, so it worked.
12. Give students each a copy of Finding the Area of Triangles. Review the instructions on both sheets with the class. When students understand what to do, let them get started. Plan to assign unfinished work as homework or seatwork the following day.
activity 4 Three Mathematical Ideas (cont.)
set C1 Geometry: triangles & Quadrilaterals
© The Math Learning CenterC1.38 • Bridges in Mathematics Grade 5 Supplement

Finding the Area of Triangles page 1 of 2
The formula for fi nding the area of all parallelograms, including rectangles is base x height, or bh.
1 Use the formula to fi nd the area of the two parallelograms below.
a b
Area = __________ sq cm Area = __________ sq cm
2 Find the area of Triangle ABC and Triangle DEF. Use numbers, words, and labels on the sketches to explain your answers.
a b
6 cm
4 cm
6 cm
4 cm
4 cm
6 cm
4 cm
6 cm
Area = __________ sq cm Area = __________ sq cm
A
B CE
D
F
NAME DATE
Set C1 Geometry: Triangles & Quadrilaterals Blackline Run a class set
independent Worksheet
Use Set C1 Independent Worksheets 5 & 6 to provide students with more practice using formulas to de-termine the perimeters and areas of triangles and parallelograms.
activity 4 Three Mathematical Ideas (cont.)
Finding the Area of Triangles page 2 of 2
3 The formula for the area of a triangle is 1⁄2 base x height, or 1⁄2 bh. Use labeled sketches, numbers, and words to explain why this works.
4 For each of the triangles below:• draw in the height.• measure and label the height and the base to the nearest centimeter.• fi nd and record the area.• show your work.
a b
Area = __________ sq cm Area = __________ sq cm
NAME DATE
Set C1 Geometry: Triangles & Quadrilaterals Blackline Run a class set
set C1 Geometry: triangles & Quadrilaterals
Bridges in Mathematics Grade 5 Supplement • C1.39© The Math Learning Center

three mathematical Ideas
1 The formula for the area of any parallelogram, including a rectangle, is
base × height or bh
2 Any triangle is half of a parallelogram.
3 If any triangle is half of a parallelogram, and the area of any parallelogram is base × height, the formula for the area of any triangle must be 1⁄2 base × height, or 1⁄2 bh.
© The Math Learning CenterC1.40 • Bridges in Mathematics Grade 5 Supplement
set C1 Geometry: triangles & Quadrilaterals Blackline Run one copy on a transparency.
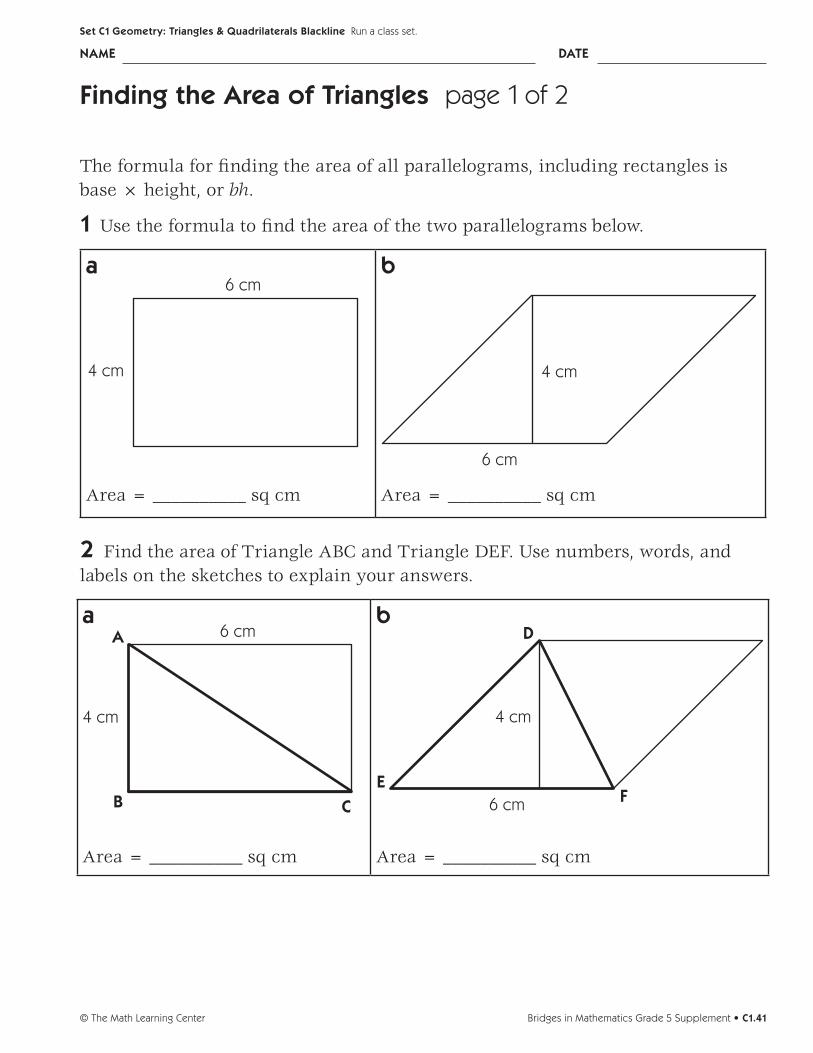
Finding the area of triangles page 1 of 2
The formula for finding the area of all parallelograms, including rectangles is base × height, or bh.
1 Use the formula to find the area of the two parallelograms below.
a
Area = __________ sq cm
b
Area = __________ sq cm
2FindtheareaofTriangleABCandTriangleDEF.Usenumbers,words,andlabels on the sketches to explain your answers.
a
Area = __________ sq cm
b
Area = __________ sq cm
4 cm
6 cme
d
F
6 cm
4 cm
a
B C
6 cm
4 cm 4 cm
6 cm
Bridges in Mathematics Grade 5 Supplement • C1.41© The Math Learning Center
name date
set C1 Geometry: triangles & Quadrilaterals Blackline Run a class set.

Finding the area of triangles page 2 of 2
3 The formula for the area of a triangle is 1⁄2 base × height, or 1⁄2 bh. Use labeled sketches, numbers, and words to explain why this works.
4 For each of the triangles below:• drawintheheight.• measureandlabeltheheightandthebasetothenearestcentimeter.• findandrecordthearea.• showyourwork.
a
Area = __________ sq cm
b
Area = __________ sq cm
© The Math Learning CenterC1.42 • Bridges in Mathematics Grade 5 Supplement
name date
set C1 Geometry: triangles & Quadrilaterals Blackline Run a class set.

set C2 H Independent Worksheet 1
independent Worksheet
more Geoboard triangles
Remember that you can classify and describe triangles in two different ways: • bythesizeoftheirangles
acute triangleAll 3 angles are acute.
right triangleOne of the angles
is a right angle
Obtuse triangleOne of the angles is obtuse.
• bythelengthoftheirsides
Isosceles triangleTwo sides are the
same length
scalene triangle
Each side is a different length.
equilateral triangle All 3 sides are
the same length
Follow the instructions below each geoboard to draw some different triangles Hint Buildyourtrianglesonageoboardfirst.Thencopythemontothepaper.
1 A Right Triangle 2 An Isosceles Triangle 3 An Acute Triangle
acute angle right
angleobtuse angle
(Continuedonback.)Bridges in Mathematics Grade 5 Supplement • C1.43© The Math Learning Center
name date
set C1 Geometry: triangles & Quadrilaterals Blackline Use anytime after Set C1, Activity 1. Run a class set.
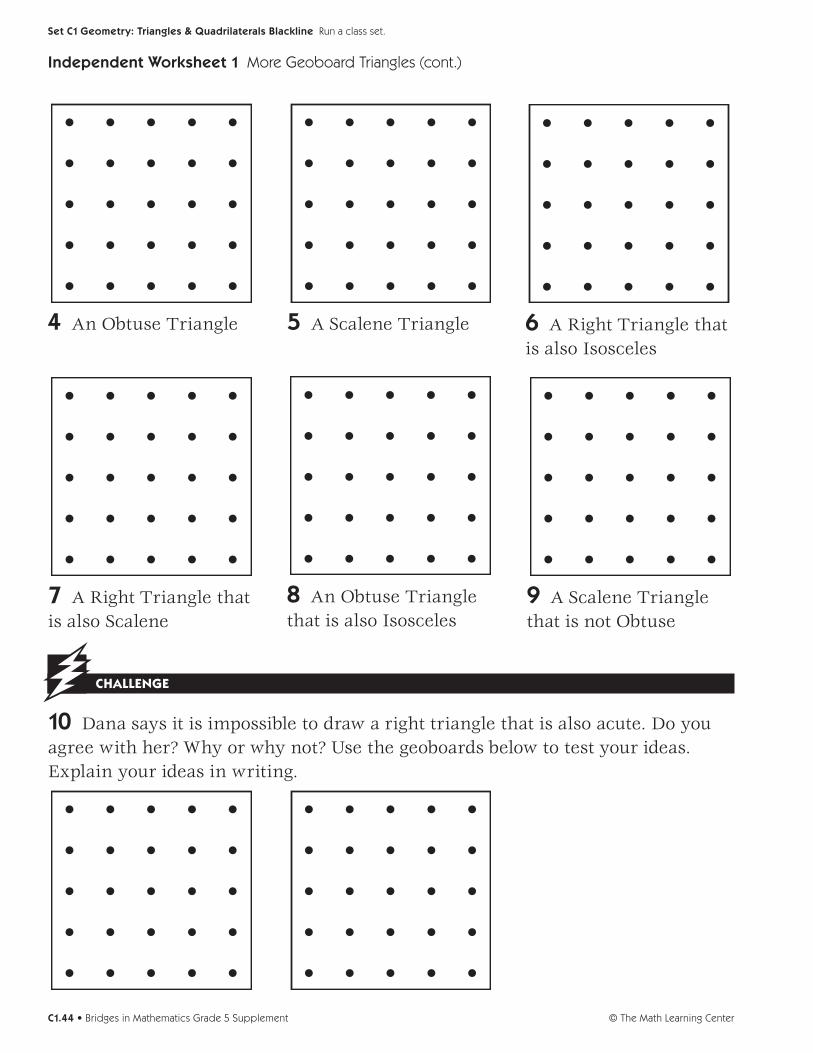
4 An Obtuse Triangle
Independent Worksheet 1 More Geoboard Triangles (cont.)
5 A Scalene Triangle 6 A Right Triangle that is also Isosceles
7 A Right Triangle that is also Scalene
8 An Obtuse Triangle that is also Isosceles
9 A Scalene Triangle that is not Obtuse
challenge
10 Dana says it is impossible to draw a right triangle that is also acute. Do you agree with her? Why or why not? Use the geoboards below to test your ideas. Explain your ideas in writing.
© The Math Learning CenterC1.44 • Bridges in Mathematics Grade 5 Supplement
set C1 Geometry: triangles & Quadrilaterals Blackline Run a class set.

set C1 H Independent Worksheet 2
independent Worksheet
Color & Construct triangles
You can classify triangles by the size of their angles,
acute triangleAll 3 angles are acute.
right triangleOne of the angles is a right angle.
Obtuse triangleOne of the angles is obtuse
1 Look at the triangles below. Color: • theacutetrianglesgreen. • therighttrianglesred. • theobtusetrianglesorange.
Hint Use the corner of a piece of paper, a tile, or a square pattern block to help test the angles. Some of these triangles might fool you!
2 Follow the instructions below to draw your own triangles.
a Draw a right triangle with no congruent sides.
b Draw an acute triangle with 3 congruent sides.
c Draw an obtuse triangle with 2 congruent sides.
acute angle right
angleobtuse angle
(Continuedonback.)Bridges in Mathematics Grade 5 Supplement • C1.45© The Math Learning Center
name date
set C1 Geometry: triangles & Quadrilaterals Blackline Use anytime after Set C1, Activity 1. Run a class set.

You can also classify triangles by the length of their sides.
Isosceles triangleTwo sides are the
same length.
scalene triangle
Each side is a different length.
equilateral triangleAll 3 sides are
the same length.
Independent Worksheet 2 Color & Construct Triangles (cont.)
3 Look at the triangles below. Color: •theisoscelestrianglespurple. •thescalenetrianglesyellow. •theequilateraltrianglesblue.
Hint If you are not sure whether the side lengths are equal or not, use your rulertohelp.Measuretothenearesthalf inch, or even the nearest centime-ter.
4 Draw an isosceles triangle that is also a right triangle.
5 Draw a scalene triangle that is not an obtuse triangle.
6Measureandlabelthistriangletoshow the length of each side and the measure of each angle.
7 Is the triangle in problem 6 acute, right, or obtuse? Is it isosceles, scalene, or equilateral? How do you know?
© The Math Learning CenterC1.46 • Bridges in Mathematics Grade 5 Supplement
set C1 Geometry: triangles & Quadrilaterals Blackline Run a class set.

set C1 H Independent Worksheet 3
independent Worksheet
Classifying Quadrilaterals
A quadrilateral is any polygon that has 4 sides. There are many kinds of quadri-laterals, including:
trapezoida quadrilateral with exactly 1 pair
of parallel sides
parallelograma quadrilateral with 2 pairs
of parallel sides opposite each other
rectanglea parallelogram with
4 right angles
rhombusa parallelogram with 4
congruent sides
squarea parallelogram with 4 congru-
ent sides and 4 right angles
1 Look carefully at the figures below. Find out how many right angles, pairs of parallel sides, and pairs of congruent sides each has. Then circle all the words that describe the figure.
FigureHow many
right angles?
How many pairs of
congruent sides?
How many pairs of parallel sides?
Circle the word(s) that describe(s) the
figure.
a trapezoid
parallelogram
rectangle
rhombus
square
(Continuedonback.)
Bridges in Mathematics Grade 5 Supplement • C1.47© The Math Learning Center
name date
set C1 Geometry: triangles & Quadrilaterals Blackline Use anytime after Set C1, Activity 2. Run a class set.

FigureHow many
right angles?
How many pairs of
congruent sides?
How many pairs of
parallel sides?
Circle the word(s) that
describe(s) the figure.
b trapezoid
parallelogram
rectangle
rhombus
square
c trapezoid
parallelogram
rectangle
rhombus
square
d trapezoid
parallelogram
rectangle
rhombus
square
e trapezoid
parallelogram
rectangle
rhombus
square
Independent Worksheet 3 Classifying Quadrilaterals (cont.)
(Continuedonnextpage.)
© The Math Learning CenterC1.48 • Bridges in Mathematics Grade 5 Supplement
set C1 Geometry: triangles & Quadrilaterals Blackline Run a class set.

Independent Worksheet 3 Classifying Quadrilaterals (cont.)
Use a ruler marked in inches and the grid lines below to draw the following figures.
2 A rectangle with 4 congruent sides that are each 14⁄8 inches long
3 A parallelogram with two sides that are each 22⁄8 inches long
Bridges in Mathematics Grade 5 Supplement • C1.49© The Math Learning Center
name date
set C1 Geometry: triangles & Quadrilaterals Blackline Run a class set.

© The Math Learning CenterC1.50 • Bridges in Mathematics Grade 5 Supplement
set C1 Geometry: triangles & Quadrilaterals Blackline

set C1 H Independent Worksheet 4
independent Worksheet
Quad Construction
A quadrilateral is any polygon that has 4 sides. There are many kinds of quadri-laterals, including:
trapezoida quadrilateral with exactly 1 pair
of parallel sides
parallelograma quadrilateral with 2 pairs
of parallel sides opposite each other
rectanglea parallelogram with
4 right angles
rhombusa parallelogram with 4
congruent sides
squarea parallelogram with 4 congru-
ent sides and 4 right angles
Use a ruler marked in inches and the grid lines below to draw the following figures.
1 A trapzoid with one right angle, one side length of 17⁄8 inches and one side length of 25⁄8 inches.
2 A parallelogram that is not a rect-angle with an area of 18 square units. (Thesmallestsquareonthegridhasanareaof1squareunit.)Labelyourdrawing to prove that the area is 18 square units.
(Continuedonback.)Bridges in Mathematics Grade 5 Supplement • C1.51© The Math Learning Center
name date
set C1 Geometry: triangles & Quadrilaterals Blackline Use anytime after Set C1, Activity 2. Run a class set.

3 A parallelogram with 4 right angles and an area of 32 square units. Label your drawing to prove that the area is 32 square units.
Independent Worksheet 4 Quad Construction (cont.)
4 A parallelogram that is not a rect-angle with an area of 32 square units. Label your drawing to prove that the area is 32 square units.
challenge
5 Darius says it is impossible for a trapezoid to have parallel sides that are also the same length. Remember that a trapzoid is any quadrilateral with exactly 1 pair of parallel sides. Explain why you agree or disagree with Darius. Draw on the grid to help explain your answer.
© The Math Learning CenterC1.52 • Bridges in Mathematics Grade 5 Supplement
set C1 Geometry: triangles & Quadrilaterals Blackline Run a class set.
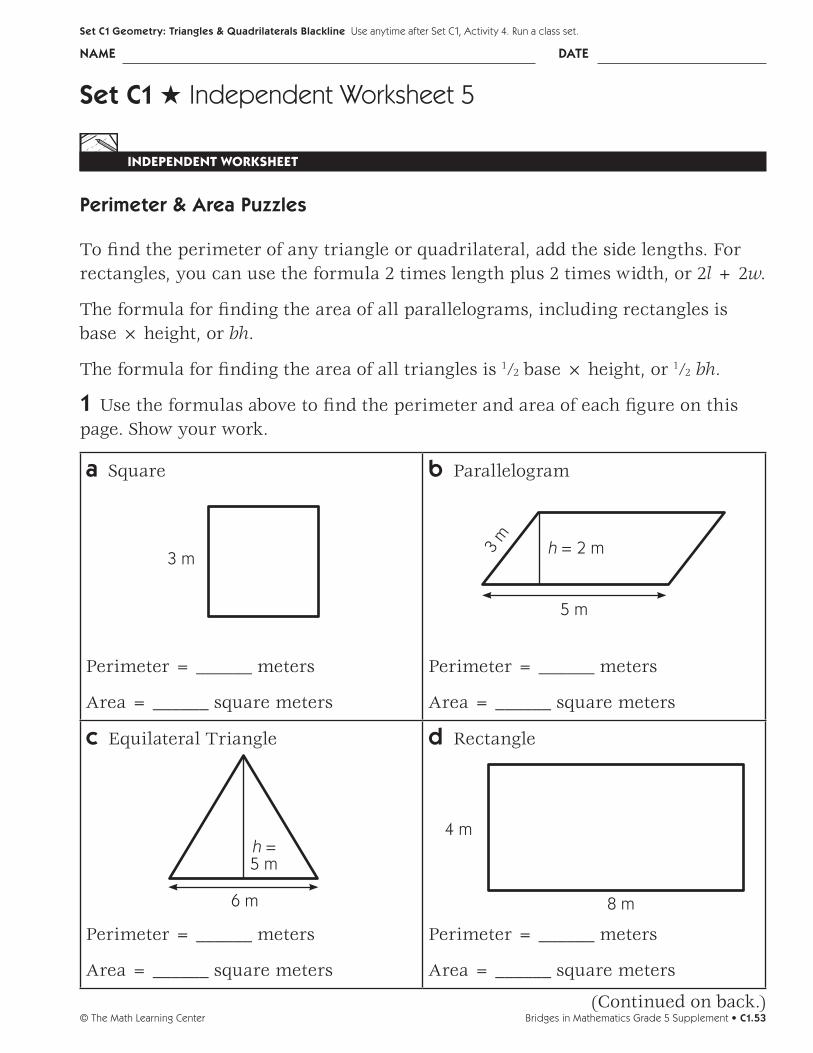
3 m
set C1 H Independent Worksheet 5
independent Worksheet
perimeter & area puzzles
To find the perimeter of any triangle or quadrilateral, add the side lengths. For rectangles, you can use the formula 2 times length plus 2 times width, or 2l + 2w.
The formula for finding the area of all parallelograms, including rectangles is base × height, or bh.
The formula for finding the area of all triangles is 1⁄2 base × height, or 1⁄2 bh.
1 Use the formulas above to find the perimeter and area of each figure on this page. Show your work.
a Square
Perimeter = ______ meters
Area = ______ square meters
b Parallelogram
Perimeter = ______ meters
Area = ______ square meters
c Equilateral Triangle
Perimeter = ______ meters
Area = ______ square meters
d Rectangle
Perimeter = ______ meters
Area = ______ square meters
5 m
3 m
h = 2 m
4 m
8 m6 m
h = 5 m
(Continuedonback.)Bridges in Mathematics Grade 5 Supplement • C1.53© The Math Learning Center
name date
set C1 Geometry: triangles & Quadrilaterals Blackline Use anytime after Set C1, Activity 4. Run a class set.
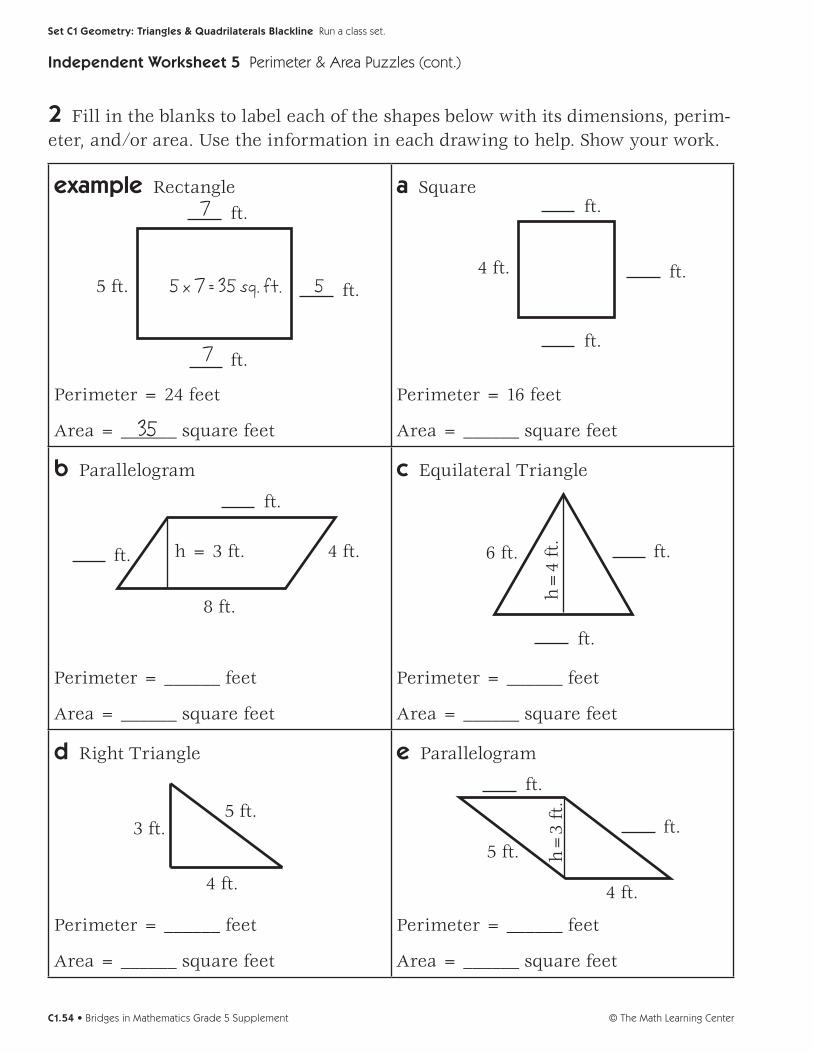
2 Fill in the blanks to label each of the shapes below with its dimensions, perim-eter, and/or area. Use the information in each drawing to help. Show your work.
example Rectangle
Perimeter = 24 feet
Area = ______ square feet
a Square
Perimeter = 16 feet
Area = ______ square feet
b Parallelogram
Perimeter = ______ feet
Area = ______ square feet
c Equilateral Triangle
Perimeter = ______ feet
Area = ______ square feet
d Right Triangle
Perimeter = ______ feet
Area = ______ square feet
e Parallelogram
Perimeter = ______ feet
Area = ______ square feet
Independent Worksheet 5 Perimeter & Area Puzzles (cont.)
5 ft.
ft.
ft.
ft.
7
5 x 7 = 35 sq. ft. 5
7
35
4 ft.
ft.
ft.
ft.
4 ft.h = 3 ft.
ft.
8 ft.
ft.h
=4
ft.
ft.
ft.6 ft.h
=3
ft.
4 ft.
5 ft.ft.
ft.
3 ft.
4 ft.
5 ft.
© The Math Learning CenterC1.54 • Bridges in Mathematics Grade 5 Supplement
set C1 Geometry: triangles & Quadrilaterals Blackline Run a class set.

set C1 H Independent Worksheet 6
independent Worksheet
ebony’s Quilt
Ebony and her mom are going to make a quilt for Ebony’s bed. When it is fin-ished, the quilt will be 72 inches by 90 inches.
1 How many square inches will Ebony’s quilt be in all? Show your work.
2 Ebony and her mom went to the store to buy fabric for the quilt. They picked out 4 colors they liked. The fabric was 45 inches wide. Ebony said, “Let’s buy 4 feet of each color.”
Will that be enough fabric to make the quilt? Show all your work.
Here is one of the 4 pieces of fabric they bought.
4 feet
45 inches
(Continuedonback.)
Bridges in Mathematics Grade 5 Supplement • C1.55© The Math Learning Center
name date
set C1 Geometry: triangles & Quadrilaterals Blackline Use anytime after Set C1, Activity 4. Run a class set.

3Ebony’squiltwillbemadeoutofsquaresthatare9inchesoneachside.Makea labeled sketch on the grid below to show how Ebony and her mom will have to arrange the squares to make a 72" by 90" quilt.
4 Ebony is planning how she wants each 9-inch square to look. Here is her first plan. What is the area of the light grey triangle? Show your work.
9 inches
The area of the light grey triangle is ________ square inches.
5HerbrotherNoahsaid,“Whydon’tyouuseall4colorsineachquiltsquare?Here’sadifferentplan.”WhatistheareaofthelightgreytriangleinNoah’splan?Show your work.
9 inches
The area of the light grey triangle is ________ square inches.
Independent Worksheet 6 Ebony’s Quilt (cont.)
© The Math Learning CenterC1.56 • Bridges in Mathematics Grade 5 Supplement
set C1 Geometry: triangles & Quadrilaterals Blackline Run a class set

Grade 5 supplementset e1 Data Analysis: Probability & Technology
IncludesActivity 1: Introducing Virtual Spinners E1.1
Activity 2: The 6-4-2 Spinner E1.7
Independent Worksheet 1: Make & Test Your Own Spinner E1.13
skills & ConceptsH describe events as likely or unlikely and discuss the degree of likelihood using such words
as certain, equally likely, and impossible
H predict the probability of outcomes of simple experiments and test the predictions
H collect data using observations and experiments
H propose and justify conclusions and predictions that are based on data
P1108

Bridges in mathematics Grade 5 supplement
set e1 Data Analysis: Probability & Technology
The Math Learning Center, PO Box 12929, Salem, Oregon 97309. Tel. 1 800 575–8130.
© 2008 by The Math Learning Center
All rights reserved.
Prepared for publication on Macintosh Desktop Publishing system.
Printed in the United States of America.
P1108
The Math Learning Center grants permission to classroom teachers to reproduce blackline
masters in appropriate quantities for their classroom use.
Bridges in Mathematics is a standards-based K–5 curriculum that provides a unique blend
of concept development and skills practice in the context of problem solving. It incorpo-
rates the Number Corner, a collection of daily skill-building activities for students.
The Math Learning Center is a nonprofit organization serving the education community.
Our mission is to inspire and enable individuals to discover and develop their mathematical
confidence and ability. We offer innovative and standards-based professional development,
curriculum, materials, and resources to support learning and teaching. To find out more,
visit us at www.mathlearningcenter.org.

set e1 data analysis: probability & technology
Bridges in Mathematics Grade 5 Supplement • e1.1© The Math Learning Center
set e1 H Activity 1
Activity
Introducing Virtual spinners
Overview During this activity you’ll go online with the class to intro-
duce a virtual spinner that can be set up in a variety of
ways. Today, you and the students will set up a spinner
that’s 2/3 one color and 1/3 another. Then students will
work in pairs to conduct and record the results of an
experiment with the spinner.
skills & ConceptsH describe events as likely or unlikely and discuss the
degree of likelihood using such words as certain,
equally likely, and impossible
H predict the probability of outcomes of simple experi-
ments and test the predictions
H collect data using observations and experiments
H propose and justify conclusions and predictions that
are based on data
You’ll needH Spinner Experiment (pages E1.4 and E1.5, run a class
set not back-to-back)
H computer(s)
H access to the Internet (see Advance Preparation)
H computer projection equipment (optional)
advance preparation Utah State University has devel-
oped a library of free virtual manipulatives that includes
a spinner feature that’s fun and easy to use. You’ll need
to familiarize yourself with their web site and the spinner
before you teach the activity. Go to http://nlvm.usu.edu/
en/nav/vlibrary.html. Click on Data Analysis and Probabil-
ity, and select Spinners. When the Spinners feature comes
up, click on the “Instructions” button in the top right-hand
corner and follow the directions to explore this virtual
manipulative.
note If you have the capacity to project the computer
screen, you can conduct this activity with your whole
class at the same time. If not, plan to work with small
groups as time allows.
Instructions for Introducing Virtual spinners1. Explain to students that you’re going to introduce a web site that will enable them to do spinner ex-periments on the computer. Have them sit where they can see the screen and demonstrate how to ac-cess the Virtual Manipulatives web site. Then show them how to open Spinners.
2. When you reach the Spinners screen, take a few minutes to demonstrate how to spin the spinner and how to change the number and color of regions on the spinner.
3. Then work with input from the class to set up a spinner that’s 2⁄3 purple and 1⁄3 yellow. Ask students to pair-share the probability of landing on purple if you spin the spinner just once. Invite volunteers to share their thinking with the class.
Students You have a better chance of landing on purple because it takes up more than half the spinner. You have a 2⁄3 chance of getting purple, but only a 1⁄3 chance of getting yellow.

set e1 data analysis: probability & technology
© The Math Learning Centere1.2 • Bridges in Mathematics Grade 5 Supplement
4. If students don’t mention the terms more and less likely than, review the fact that purple is more likely than yellow to come up on one spin, and yellow is less likely than purple to come up. Two-thirds, 66.66%, and 2 out of 3 are other ways of expressing the theoretical probability of getting purple on a single spin. One-third, 33.33%, and 1 out of 3 are other ways to express the theoretical probability of get-ting yellow on a single spin. Spin the spinner once. What happens?
5. Now click on the Record Results button so the bar graph is visible. Ask students to make conjectures about the results of spinning the spinner 12 times. Because the spinner is two-thirds purple and one-third yellow, some may hypothesize that the spinner will land on purple 8 times and on yellow 4 times. While these figures reflect 2⁄3 and 1⁄3 of 12, remind students that the results of experiments don’t always match the theoretical probabilities.
6. Ask students to help you list all the possible outcomes of 12 spins on the board.
Our spinner is purple and yellow.What are the possible outcomes of 12 spins?
• 0 P, 12 Y• 1 P, 11 Y• 2 P, 10 Y• 3 P, 9 Y• 4 P, 8 Y• 5 P, 7 Y• 6 P, 6 Y
• 7 P, 5 Y• 8 P, 4 Y• 9 P, 3 Y• 10 P, 2 Y• 11 P, 1 Y• 12 P, 0 Y
23
13
7. Invite 12 different volunteers to click the Spin button. Then discuss the data displayed on the bar graph screen.
Students It came out 7 purples and 5 yellows. I knew it would come out more purple. I was sure we’d get 8 and 4, though. Can we do it again?
8. Click the Clear button on the bar graph screen. Then repeat step 7 and record the results of both sets of 12 spins on the board.
7 P, 5 Y 10 P, 2 Y
9. Ask students to pair up or assign partners. Explain that you’re going to have them continue this ex-periment on their own. Give each pair a copy of the Spinner Experiment sheets. Review the instructions with the class and spend a little time discussing students’ conjectures before they get started.
Teacher Which outcomes do you think you’ll get most and which least if you do 20 sets of 12 spins, and why?
activity 1 Introducing Virtual Spinners (cont.)

set e1 data analysis: probability & technology
Bridges in Mathematics Grade 5 Supplement • e1.3© The Math Learning Center
activity 1 Introducing Virtual Spinners (cont.)
Students We should get 8 and 4 the most because the spinner is 2⁄3 and 1⁄3. I don’t think it’s all that easy to get 8 and 4. I think maybe we’ll get 7 and 5 or 9 and 3 the most. You just hardly ever get exactly what you’re supposed to with spinners. You can get almost anything, but I don’t think we’re going to get all purples or all yellows very much. That just seems almost impossible.
10. Ask student pairs to complete questions 1–3 right now and to finish the rest of the assignment when they have access to one of the computers in your classroom or in the lab.
extensions• Whenallthepairshavecompletedtheirsheets,poolanddiscusstheclassdata.Whatoutcomescame
up the most frequently? Which came up least? Encourage students to reflect on their results and ex-plain them the best they can.
• HavestudentsusetheBarChartfeatureontheNLVMwebsitetocreateandprintoutagraphoftheir own, or even the pooled data from the whole class. They might set up the graph to show how many times they got the 3 or 4 most frequent outcomes. The Bar Chart feature includes a place to title the graph and label the columns.
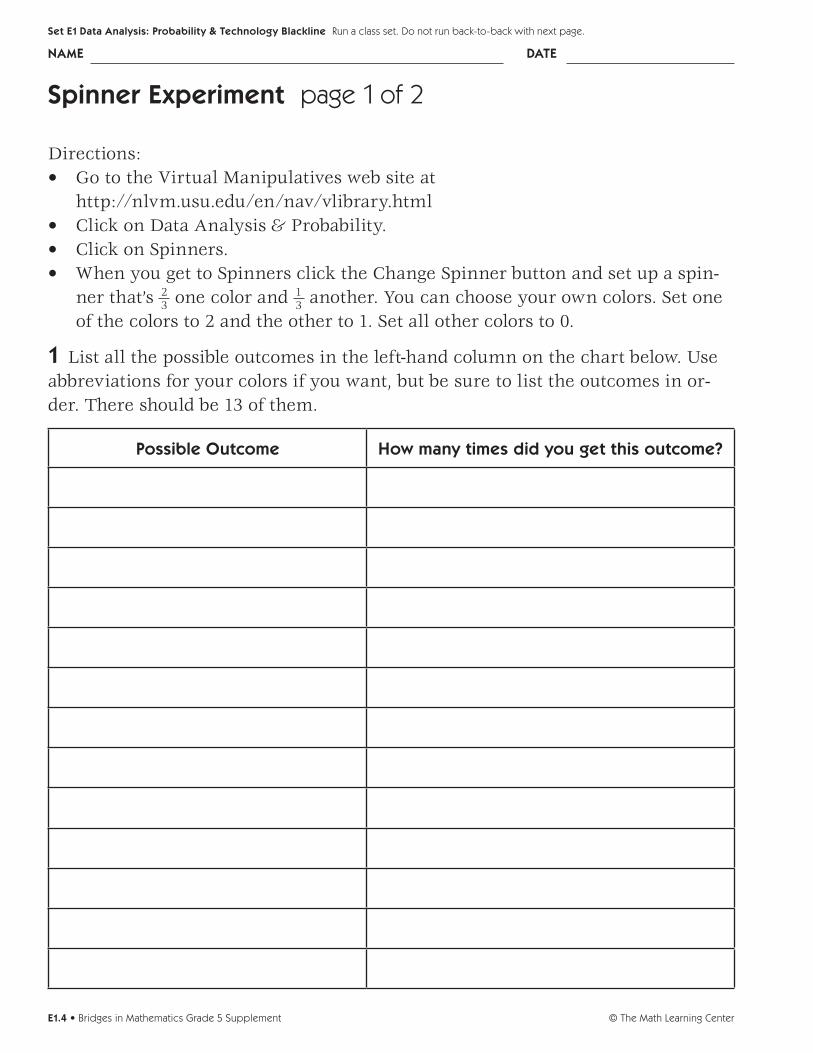
© The Math Learning Centere1.4 • Bridges in Mathematics Grade 5 Supplement
name date
set e1 data analysis: probability & technology Blackline Run a class set. Do not run back-to-back with next page.
spinner experiment page 1 of 2
Directions:• GototheVirtualManipulativeswebsiteat
http://nlvm.usu.edu/en/nav/vlibrary.html• ClickonDataAnalysis&Probability.• ClickonSpinners.• WhenyougettoSpinnersclicktheChangeSpinnerbuttonandsetupaspin-
ner that’s 23 one color and 1
3 another. You can choose your own colors. Set one of the colors to 2 and the other to 1. Set all other colors to 0.
1Listallthepossibleoutcomesintheleft-handcolumnonthechartbelow.Useabbreviations for your colors if you want, but be sure to list the outcomes in or-der. There should be 13 of them.
possible Outcome How many times did you get this outcome?

Bridges in Mathematics Grade 5 Supplement • e1.5© The Math Learning Center
name date
set e1 data analysis: probability & technology Blackline Run a class set. Do not run back-to-back with previsous page.
spinner experiment page 2 of 2
2a Before you start spinning, put stars beside the three outcomes on the chart you think you’ll get most often. Record them in the space below also.
b Explain your answer. Why do you think you’ll get those outcomes the most?
3a Circle the two outcomes on the chart you think you’ll get least often. Record them in the space below also.
b Explain your answer. Why did you circle the 2 outcomes you did?
4 Now start spinning. Stop at the end of 12 spins and record the outcome on the chart on the previous page. When you’re finished, click the Clear button on the bar graph screen and start over. Record the outcome of each set of 12 spins on the chart until you’ve done 20 sets of spins. Be sure to click the Clear button after each set.
5 Which outcome did you get the most? Which outcomes came in second and third place?
6Listatleast3otherobservationsaboutyourresultsbelow.
7 How well did your results match what you thought was going to happen? Why do you think this experiment turned out the way it did?

© The Math Learning Centere1.6 • Bridges in Mathematics Grade 5 Supplement
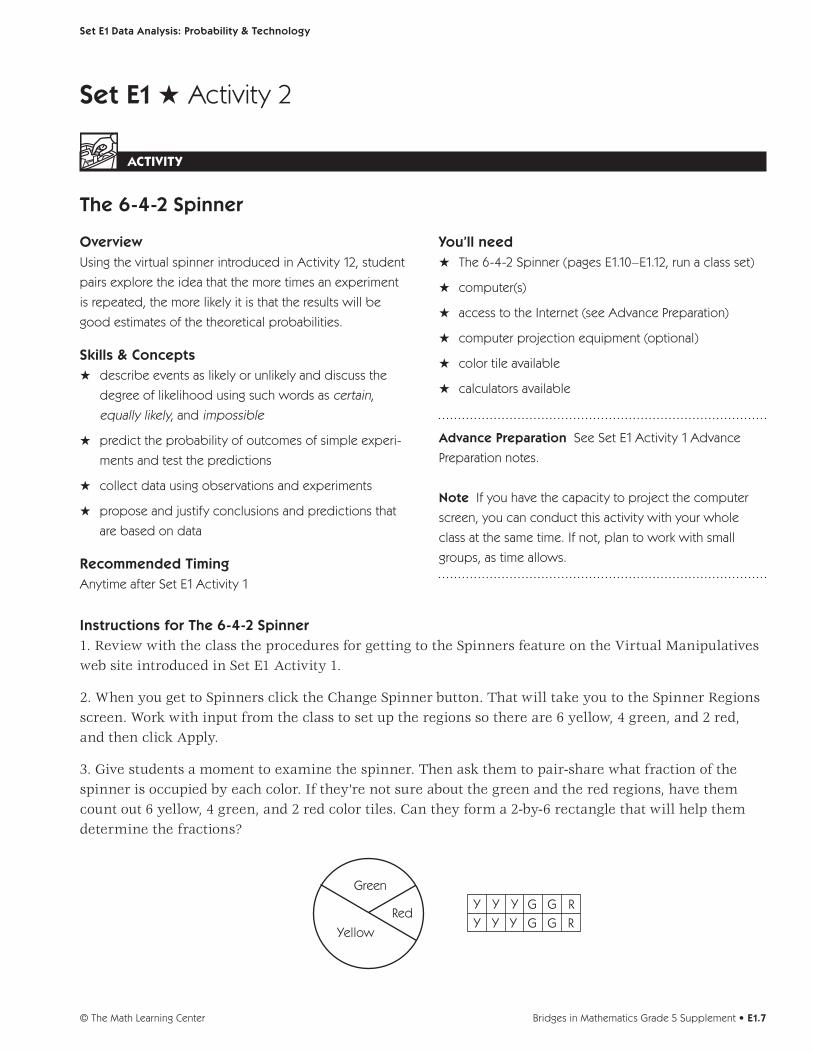
set e1 data analysis: probability & technology
Bridges in Mathematics Grade 5 Supplement • e1.7© The Math Learning Center
set e1 H Activity 2
Activity
the 6-4-2 spinner
Overview Using the virtual spinner introduced in Activity 12, student
pairs explore the idea that the more times an experiment
is repeated, the more likely it is that the results will be
good estimates of the theoretical probabilities.
skills & ConceptsH describe events as likely or unlikely and discuss the
degree of likelihood using such words as certain,
equally likely, and impossible
H predict the probability of outcomes of simple experi-
ments and test the predictions
H collect data using observations and experiments
H propose and justify conclusions and predictions that
are based on data
recommended timingAnytime after Set E1 Activity 1
You’ll needH The 6-4-2 Spinner (pages E1.10–E1.12, run a class set)
H computer(s)
H access to the Internet (see Advance Preparation)
H computer projection equipment (optional)
H color tile available
H calculators available
advance preparation See Set E1 Activity 1 Advance
Preparation notes.
note If you have the capacity to project the computer
screen, you can conduct this activity with your whole
class at the same time. If not, plan to work with small
groups, as time allows.
Instructions for the 6-4-2 spinner1. Review with the class the procedures for getting to the Spinners feature on the Virtual Manipulatives web site introduced in Set E1 Activity 1.
2. When you get to Spinners click the Change Spinner button. That will take you to the Spinner Regions screen. Work with input from the class to set up the regions so there are 6 yellow, 4 green, and 2 red, and then click Apply.
3. Give students a moment to examine the spinner. Then ask them to pair-share what fraction of the spinner is occupied by each color. If they’re not sure about the green and the red regions, have them count out 6 yellow, 4 green, and 2 red color tiles. Can they form a 2-by-6 rectangle that will help them determine the fractions?
Yellow
Red
Green
YY
YY
YY G
GGG R
R

set e1 data analysis: probability & technology
© The Math Learning Centere1.8 • Bridges in Mathematics Grade 5 Supplement
Students Oh yeah! This is like when we did the tile experiment in the Number Corner. It’s easy to see that half is yellow on the spinner. I wasn’t sure about the green, but 4 is 1⁄3 of 12, and 2 is 1⁄6 of 12. It’s kind of like the egg carton fractions too. I remember 2⁄12 is the same as 1⁄6 and 4⁄12 is the same as 1⁄3 when I look at the tiles.
4. Now click on the Record Results button so the bar graph is visible. Ask students to make conjectures about the results of spinning the spinner 12 times. Chances are, some will believe that you’ll get 6 yel-lows, 4 greens, and 2 reds. Others may know that the experimental results will probably not match the theoretical probabilities exactly, especially given such a small number of spins.
5. After a bit of discussion, change the number of spins on the spinner screen to read 12 instead of 1 and have a volunteer click the Spin button. What happens?
Students Cool! It did all 12 spins really fast! It came out 7 yellow, 3 green, and 2 red. That’s not too far away from 6, 4, and 2. Do it again!
6. Click the Clear button on the bar graph screen. Then repeat step 5 six more times as a volunteer re-cords the results. Your outcomes may resemble those listed below.
Trial 1: 7 Y, 3 G, 2 R
Trial 2: 4 Y, 6 G, 2 R
Trial 3: 8 Y, 4 G, 0 R
Trial 4: 8 Y, 1 G, 3 R
Trial 5: 6 Y, 4 G, 2 R
Trial 6: 4 Y, 4 G, 4 R
Trial 7: 8 Y, 2 G, 2 R
7. Discuss the results of the 7 trials with the class. What do they notice?
Students It hardly ever matches 6, 4, 2. It only did that once. It went kind of backwards on Trial 4. It got 4, 6, 2 on that one. Trial 2 was weird because the spinner never landed on red at all. I think Trial 6 was pretty strange too because they all came out the same. It seems like almost anything can happen, but I bet we’ll never get 0 yellows.
8. Now ask students to speculate about what would happen if you set the number of spins at 30 instead of 12. Although half the spinner is yellow, a third is green and a sixth is red. Will these fractions be re-flected in the experimental data? Some students may be fairly convinced by now that the experimental results won’t match the theoretical probabilities, while others may assert that with a larger number of spins,theexperimentalresultsmightbecloser.Presstheissuebyaskingstudentstoconsidertheprob-able results of increasing the number of spins to 60, 120, 240, and 480.
Students I think the more spins you do, the closer you’ll get to half of them coming out yellow, a third green, and a sixth red. I think it doesn’t matter. Sometimes you’ll get an exact match, but most of the time it’ll be way off like it was with 12 spins.
activity 2 The 6-4-2 Spinner (cont.)

set e1 data analysis: probability & technology
Bridges in Mathematics Grade 5 Supplement • e1.9© The Math Learning Center
9. Ask students to pair up or assign partners. Explain that you’re going to have them continue this ex-periment on their own. Give each pair a copy of The 6-4-2 Spinner sheets. Review the instructions with the class and clarify them as needed.
10. Ask student pairs to complete question 1 right now and to finish the rest of the assignment when they have access to one of the computers in your classroom or in the lab.
extension• Whenallthepairshavecompletedtheirsheets,asktheclasstodiscusstheirfindings.Doesincreas-
ing the number of spins produce data that is closer to the theoretical probabilities?
independent Worksheet
See Set E1 Independent Worksheet 1 for another probability experiment that enables students to use ex-perimental results to make predictions.
activity 2 The 6-4-2 Spinner (cont.)

© The Math Learning Centere1.10 • Bridges in Mathematics Grade 5 Supplement
name date
set e1 data analysis: probability & technology Blackline Run a class set.
the 6-4-2 spinner page 1 of 3
1 Computers make it possible to collect a lot of data very quickly and easily. You’re going to use a virtual 6-4-2 spinner to find out what happens as you increase the number of spins from 30 to 480. To start, fill in the chart below to show the num-ber of times you would land on each color if you always got exactly half yellow, one-third green, and one-sixth red. The first row is done for you.
number of spins 12 of the number 1
3 of the number 16 of the number
30 spins 15 10 560 spins
120 spins
240 spins
480 spins
2 Follow the steps below to set up your 6-4-2 spinner. • GototheVirtualManipulativeswebsiteat
http://nlvm.usu.edu/en/nav/vlibrary.html• ClickonDataAnalysis&Probability.• ClickonSpinners.• WhenyougettoSpinners,clicktheChangeSpinnerbutton.Thatwilltake
you to the Spinner Regions screen. Set up the regions so there are 6 yellow, 4 blue, and 2 green, and then click Apply.
3 Click the Record Results button on the spinner screen, and drag the 2 screens apart so you can see your spinner and the bar graph at the same time. On the spinner screen, change the number of spins from 1 to 30 spins.

Bridges in Mathematics Grade 5 Supplement • e1.11© The Math Learning Center
name date
set e1 data analysis: probability & technology Blackline Run a class set.
the 6-4-2 spinner page 2 of 3
4 Click the Spin button and watch what happens. Record the outcome on the chart below. Then click the Clear button on the bar graph screen and start over. Repeat this 6 more times. Be sure to click the Clear button after each trial.
spins
30 Yellow Green red
Trial 1
Trial 2
Trial 3
Trial 4
Trial 5
Trial 6
Trial 7
5 Compare the data you just collected with the class data for 12 spins. Do you think taking a larger number of spins makes it more likely that you’ll get closer to spinning 1
2 yellow, 13 green, and 1
6 red? Explain your answer.

© The Math Learning Centere1.12 • Bridges in Mathematics Grade 5 Supplement
name date
set e1 data analysis: probability & technology Blackline Run a class set.
the 6-4-2 spinner page 3 of 3
6 Now test your hypothesis. Repeat step 4 for 60 spins, 120 spins, 240 spins, and 480 spins. Record all your results on the charts below.
spins spins
60 Yellow Green red 120 Yellow Green red
Trial 1 Trial 1
Trial 2 Trial 2
Trial 3 Trial 3
Trial 4 Trial 4
Trial 5 Trial 5
Trial 6 Trial 6
Trial 7 Trial 7
spins spins
240 Yellow Green red 480 Yellow Green red
Trial 1 Trial 1
Trial 2 Trial 2
Trial 3 Trial 3
Trial 4 Trial 4
Trial 5 Trial 5
Trial 6 Trial 6
Trial 7 Trial 7
7 What do you think now? Does increasing the number of spins make it more likely that you’ll get closer to spinning 1
2 yellow, 13 green, and 1
6 red? Explain your answer.

Bridges in Mathematics Grade 5 Supplement • e1.13© The Math Learning Center
name date
set e1 data analysis: probability & technology Blackline Use anytime after Set E1 Activity 2. Run a class set.
set e1 H Independent Worksheet 1
independent Worksheet
make & test Your Own spinner
Directions:• GototheVirtualManipulativeswebsiteat:
http://nlvm.usu.edu/en/nav/vlibrary.html• ClickonDataAnalysis&Probability.• ClickonSpinners.• WhenyougettoSpinnersclicktheChangeSpinnerbutton.Thatwilltakeyou
to the Spinner Regions screen. Choose 3 different colors. Then decide how many regions you want for each color. The number of regions has to add up to exactly 12. For instance, you may decide to have 4 purple, 4 red, and 4 orange. Or maybe you’ll choose 7 green, 3 blue, and 2 yellow. It’s up to you. Click Apply.
1Tellwhatfractionofthespinnerturnedouttobeeachcolor.(Hint:Lookbackat the Spinner Regions screen. Remember that the number of regions you as-signed was 12 in all. You can also use the color tile to help figure it out.)
a My spinner is __________ __________. (fraction) (color)
b My spinner is __________ __________. (fraction) (color)
c My spinner is __________ __________. (fraction) (color)
2 What color do you think the arrow will land on if you spin the spinner 1 time? Explain your answer.
3 Click the Spin button once What color did the arrow land on? ___________
(Continued on back.)
© The Math Learning Centere1.14 • Bridges in Mathematics Grade 5 Supplement
set e1 data analysis: probability & technology Blackline Run a class set.
4 Which color do you think will come up most often if you make 100 spins? Why?
5 Which color do you think will come up least often if you make 100 spins? Why?
6 About how many times do you think you’ll get each color if you spin the spin-ner 100 times? Explain your answers.
a I think I’ll get _____________ about _____________ times because:
b I think I’ll get _____________ about _____________ times because:
c I think I’ll get _____________ about _____________ times because:
7 Click the Record Results button on the spinner screen, and drag the 2 screens apart so you can see your spinner and the bar graph at the same time On the spinner screen, change the number of spins from 1 to 100 spins.
(Continued on next page.)
Independent Worksheet 1 Make & Test Your Own Spinner (cont.)

Bridges in Mathematics Grade 5 Supplement • e1.15© The Math Learning Center
name date
set e1 data analysis: probability & technology Blackline Run a class set.
8 Click the Spin button and watch what happens. Record the outcome on the chart below. Then click the Clear button on the bar graph screen and start over. Make 100 spinds ten times and record the data on the chart. Be sure to click the Clear button after each set.
Color: Color: Color:
______ out of 100 ______ out of 100 ______ out of 100
______ out of 100 ______ out of 100 ______ out of 100
______ out of 100 ______ out of 100 ______ out of 100
______ out of 100 ______ out of 100 ______ out of 100
______ out of 100 ______ out of 100 ______ out of 100
______ out of 100 ______ out of 100 ______ out of 100
______ out of 100 ______ out of 100 ______ out of 100
______ out of 100 ______ out of 100 ______ out of 100
______ out of 100 ______ out of 100 ______ out of 100
______ out of 100 ______ out of 100 ______ out of 100
9Listatleast3differentobservationsaboutyourdata.
10 How well did your results match what you thought was going to happen? Why do you think this experiment turned out the way it did?
Independent Worksheet 1 Make & Test Your Own Spinner (cont.)

© The Math Learning Centere1.16 • Bridges in Mathematics Grade 5 Supplement
P1108
BRIDGES GRADE 5
PUBLISHER’S CORRELATIONS TO WASHINGTON
MATHEMATICS STANDARDS


© T
he M
ath
Lear
ning
Cen
ter,
Sale
m, O
R 8
00 5
75-8
130
ww
w.m
athl
earn
ingc
ente
r.org
1
108
Brid
ges
in M
athe
mat
ics
Gra
de
5 W
ashi
ngto
n Co
rrel
atio
ns •
i
Bri
dge
s G
rad
e 5
Corr
elat
ions
to
Was
hing
ton
Mat
hem
atic
s Pe
rfo
rman
ce E
xpec
tati
ons
OPE
RA
TIO
NS,
ALG
EBR
AM
ULT
I-D
IGIT
DIV
ISIO
N
WA
Pe
rfo
rman
ce E
xpe
ctat
ion
sB
rid
ge
sH
om
e C
on
ne
ctio
ns
Nu
mb
er
Co
rne
rB
rid
ge
s Su
pp
lem
en
tA
sse
ssm
en
t
5.1.
A R
epre
sent
mul
ti-d
igit
div
i-
sio
n us
ing
pla
ce v
alue
mo
del
s
and
co
nnec
t th
e re
pre
sent
atio
n
to t
he re
late
d e
qua
tion.
Uni
t 2,
Ses
sio
ns 1
3–19
Uni
t 4,
Ses
sio
ns 2
, 4–1
0
Ho
me
Conn
ectio
ns, V
ol.
1:
HC
’s 1
9, 2
1, 3
4, 4
1
Feb
ruar
y Co
mp
utat
iona
l
Flue
ncy
Brid
ges
Prac
tice
Boo
k, p
ages
35, 6
8, 7
9, 8
5, 9
1, 9
9, 1
31
Info
rmal
Uni
t 2,
Ses
sio
ns 1
7 &
20
(Wo
rk S
amp
les)
Brid
ges
Prac
tice
Boo
k, p
ages
22, 6
1, 7
9, 8
1, 8
5, 9
1, 9
9, 1
31
Form
al
Uni
t 2,
Ses
sio
ns 4
& 2
1 (U
nit
Pre-
and
Po
st-A
sses
smen
t,
and
Stu
den
t Re
flect
ion
Shee
t)
5.1.
B D
eter
min
e q
uotie
nts
for
mul
tiple
s o
f 10
and
100
by
ap-
ply
ing
kno
wle
dge
of
pla
ce v
alue
and
pro
per
ties
of
op
erat
ions
.
Uni
t 2,
Ses
sio
ns 1
5, 1
9H
om
e Co
nnec
tions
, Vo
l. 1:
HC
’s 2
1, 2
3
Dec
emb
er C
om
put
atio
nal
Flue
ncy
Set
A3
Num
ber
& O
per
a-
tions
: Est
imat
ing
to M
ultip
ly
& D
ivid
e, In
dep
end
ent
Wo
rksh
eets
1, 2
& 3
Brid
ges
Prac
tice
Boo
k, p
ages
22, 3
8, 8
1,
5.1.
C F
luen
tly a
nd a
ccur
atel
y
div
ide
up to
a fo
ur-d
igit
num
ber
by
one
- an
d t
wo
- d
igit
div
iso
rs
accu
rate
ly u
sing
the
sta
ndar
d
long
div
isio
n al
gorit
hm.
Ho
me
Conn
ectio
ns, V
ol.
2:
HC
’s 4
2, 4
7–49
, 52,
60
–61
May
Co
mp
utat
iona
l Flu
ency
Set A
4 N
umb
er &
Op
erat
ions
:
Long
Div
isio
n, A
ctiv
ities
1 &
2
Form
al
Uni
t 4,
Ses
sio
n 21
(U
nit
Post
-
Ass
essm
ent,
and
Stu
den
t
Refle
ctio
n Sh
eet)
5.1.
D E
stim
ate
quo
tient
s to
app
roxi
mat
e so
lutio
ns a
nd d
eter
-
min
e re
aso
nab
lene
ss o
f an
swer
s
in p
rob
lem
s in
volv
ing
up to
tw
o-
dig
it d
ivis
ors
.
Uni
t 2,
Ses
sio
ns 1
4–17
Uni
t 4,
Ses
sio
ns 2
, 4–1
0
Ho
me
Conn
ectio
ns, V
ol.
1:
HC
’s 1
9, 3
2, 3
5, 3
6, 4
1
May
Co
mp
utat
iona
l Flu
ency
Set
A3
Num
ber
& O
per
a-
tions
: Est
imat
ing
to M
ultip
ly
& D
ivid
e, In
dep
end
ent
Wo
rksh
eets
1, 2
& 3
Set A
4 N
umb
er &
Op
era-
tions
: Lo
ng D
ivis
ion,
Act
iviti
es
1 &
2
Brid
ges
Prac
tice
Boo
k, p
ages
37, 3
8, 3
9, 6
4, 8
5, 9
1, 9
9, 1
31
Info
rmal
Brid
ges
Prac
tice
Boo
k, p
ages
1, 3
7, 3
8, 3
9, 7
2, 9
1, 1
31
Form
al
Uni
t 4,
Ses
sio
n 21
(U
nit
Post
-
Ass
essm
ent,
and
Stu
den
t
Refle
ctio
n Sh
eet)
5.1.
E M
enta
lly d
ivid
e tw
o-d
igit
num
ber
s b
y o
ne-d
igit
div
iso
rs
and
exp
lain
the
str
ateg
ies
used
.
Uni
t 2,
Ses
sio
ns 1
4, 1
5
Uni
t 4,
Ses
sio
ns 2
, 7–9

© The M
ath Learning Center, Salem, O
R 800 575-8130 ww
w.m
athlearningcenter.org
1108 Bridges in M
athematics G
rade 5 W
ashington Co
rrelations • ii
Brid
ges Grad
e 5 Correlatio
ns to W
ashingto
n Mathem
atics Perform
ance Expectatio
ns (cont.)
OPER
ATIO
NS, A
LGEB
RA
MU
LTI-DIG
IT DIV
ISION
WA
Perfo
rman
ce Expe
ctation
sB
ridg
es
Ho
me C
on
ne
ction
sN
um
be
r Co
rne
rB
ridg
es Su
pp
lem
en
tA
ssessm
en
t
5.1.F Solve single- and
multi-
step w
ork p
rob
lems invo
lving
multi-d
igit divisio
n and verify the
solutio
ns.
Unit 2, Sessio
ns 13–15, 17
Unit 2, p
age 289 (Divisio
n
Challenge Pro
blem
s)
Unit 4, Sessio
ns 4, 6, 10
Unit 6, Sessio
n 10
Ho
me Co
nnections, V
ol. 1:
HC
’s 2–4, 34–35, 37, 41
Ho
me Co
nnections, V
ol. 2:
HC
’s 49, 52, 57–58, 61, 64
Set A4 N
umb
er & O
pera-
tions: Lo
ng Divisio
n, Activi-
ties 1 & 2
Bridges Practice Bo
ok, p
ages
30, 32, 34, 36, 64, 70, 72, 90,
92, 100
Inform
al
Unit 2, Sessio
ns 17 & 20
(Wo
rk Samp
les)
Unit 5, Sessio
n 13 (Wo
rk
Samp
le)
Form
al
Unit 2, Sessio
ns 4 & 21 (U
nit
Pre- and Po
st-Assessm
ent
and Stud
ent Reflection
Sheet)
NU
MB
ERS, O
PERA
TION
S, ALG
EBR
AA
DD
ITION
AN
D SU
BTR
AC
TION
OF FR
AC
TION
S AN
D D
ECIM
ALS
WA
Perfo
rman
ce Expe
ctation
sB
ridg
es
Ho
me C
on
ne
ction
sN
um
be
r Co
rne
rB
ridg
es Su
pp
lem
en
tA
ssessm
en
t
5.2.A Rep
resent add
ition and
subtractio
n of fractio
ns and
mixed
numb
ers using visual and
numerical m
od
els, and co
nnect
the representatio
n to the related
equatio
n.
Unit 4, Sessio
ns 11–16,
18–19, 22
Unit 6, Sessio
ns 5–7
Ho
me Co
nnections, V
ol. 1:
HC
’s 23, 40, 41
Ho
me Co
nnections, V
ol. 2:
HC
51
No
vemb
er Calend
ar Grid
Novem
ber C
alendar Collecto
r
March Co
mp
utational Fluency
Ap
ril Com
putatio
nal Fluency
Num
ber Co
rner Student
Boo
k, page 58
Supp
ort A
ctivities 27,
Set A5 N
umb
er & O
pera-
tions: A
dd
ing & Sub
tracting
Fractions, Ind
epend
ent
Wo
rksheets 1, 2 & 3
Bridges Practice Bo
ok, p
ages
76, 77, 79, 107, 109
Inform
al
Unit 4, Sessio
ns 15–16 (Wo
rk
Samp
les)
Unit 6, Sessio
n 6 (Wo
rk
Samp
le)
Bridges Practice Bo
ok, p
ages
76, 77, 107, 109
Form
al
Unit 4, Sessio
n 1 (Unit Pre-
Assessm
ent)
Unit 4, Sessio
n 23 (Unit
Post-A
ssessment and
Stu-
dent Reflectio
n Sheet)

© T
he M
ath
Lear
ning
Cen
ter,
Sale
m, O
R 8
00 5
75-8
130
ww
w.m
athl
earn
ingc
ente
r.org
1
108
Brid
ges
in M
athe
mat
ics
Gra
de
5 W
ashi
ngto
n Co
rrel
atio
ns •
iii
Bri
dge
s G
rad
e 5
Corr
elat
ions
to
Was
hing
ton
Mat
hem
atic
s Pe
rfo
rman
ce E
xpec
tati
ons
(co
nt.)
NU
MB
ERS,
OPE
RA
TIO
NS,
ALG
EBR
AA
DD
ITIO
N A
ND
SU
BTR
AC
TIO
N O
F FR
AC
TIO
NS
AN
D D
ECIM
ALS
WA
Pe
rfo
rman
ce E
xpe
ctat
ion
sB
rid
ge
sH
om
e C
on
ne
ctio
ns
Nu
mb
er
Co
rne
rB
rid
ge
s Su
pp
lem
en
tA
sse
ssm
en
t
5.2.
B Re
pre
sent
ad
diti
on
and
sub
trac
tion
of
dec
imal
s us
ing
pla
ce v
alue
mo
del
s an
d c
onn
ect
the
rep
rese
ntat
ion
to t
he re
late
d
equa
tion.
(Gra
de
4, U
nit
6, S
essi
ons
15–1
7)
Uni
t 6,
Ses
sio
n 14
No
vem
ber
Cal
end
ar G
rid
Mar
ch C
om
put
atio
nal F
luen
cy
sup
po
rt A
ctiv
ities
23,
27,
33,
34, 3
5 (S
ee G
rad
e 5
Num
ber
Corn
er B
lack
lines
)
Brid
ges
Prac
tice
Boo
k, p
ages
112,
113
, 130
Info
rmal
Uni
t 6,
Ses
sio
n 14
(W
ork
Sam
ple
)
Brid
ges
Prac
tice
Boo
k, p
ages
112,
113
, 130
Form
al
Uni
t 6,
Ses
sio
n 1
(Uni
t Pr
e-
Ass
essm
ent)
Uni
t 6,
Ses
sio
n 19
(U
nit
Post
-
Ass
essm
ent
and
Stu
den
t
Refle
ctio
n Sh
eet)
5.2.
C G
iven
tw
o f
ract
ions
with
unlik
e d
eno
min
ato
rs, r
ewrit
e
the
frac
tions
with
a c
om
mo
n
den
om
inat
or.
Uni
t 4,
Ses
sio
ns 1
8–19
Uni
t 6,
Ses
sio
ns 3
–7
Ho
me
Conn
ectio
ns, V
ol.
2:
HC
51
Ap
ril C
om
put
atio
nal F
luen
cySe
t A
6 N
umb
er &
Op
-
erat
ions
: Fra
ctio
n Co
ncep
ts,
Act
ivit
y 2
and
Ind
epen
den
t
Wo
rksh
eets
2 &
3
Brid
ges
Prac
tice
Boo
k, p
ages
103,
104
, 106
, 107
, 108
, 109
,
110,
117
, 127
, 129
, 133
, 135
Form
al
Uni
t 6,
Ses
sio
n 19
(U
nit
Po
st-
Ass
essm
ent
and
Stu
den
t
Refle
ctio
n Sh
eet)
5.2.
D D
eter
min
e th
e gr
eate
st
com
mo
n fa
cto
r an
d t
he le
ast
com
mo
n m
ultip
le o
f tw
o o
r m
ore
who
le n
umb
ers.
Uni
t 6,
Ses
sio
ns 3
–7Fe
bru
ary
Cal
end
ar G
ridSe
t A
6 N
umb
er &
Op
-
erat
ions
: Fra
ctio
n Co
ncep
ts,
Act
ivit
y 1
and
Ind
epen
den
t
Wo
rksh
eets
1 &
3
Brid
ges
Prac
tice
Boo
k, p
ages
101,
102
, 103
, 104
, 106
, 108
,
127,
129
, 133
, 135

© The M
ath Learning Center, Salem, O
R 800 575-8130 ww
w.m
athlearningcenter.org
1108 Bridges in M
athematics G
rade 5 W
ashington Co
rrelations • iv
Brid
ges Grad
e 5 Correlatio
ns to W
ashingto
n Mathem
atics Perform
ance Expectatio
ns (cont.)
NU
MB
ERS, O
PERA
TION
S, ALG
EBR
AA
DD
ITION
AN
D SU
BTR
AC
TION
OF FR
AC
TION
S AN
D D
ECIM
ALS
WA
Perfo
rman
ce Expe
ctation
sB
ridg
es
Ho
me C
on
ne
ction
sN
um
be
r Co
rne
rB
ridg
es Su
pp
lem
en
tA
ssessm
en
t
5.2.E Fluently and accurately ad
d
and sub
tract fractions, includ
ing
mixed
numb
ers.
Unit 6, Sessio
ns 5–7, 14
Unit 6, p
age 890 (Challenge)
Unit 6, p
age 895 (Challenge)
Ho
me Co
nnections, V
ol. 2:
HC
’s 51, 56, 58
Novem
ber C
alendar Collecto
r
March Co
mp
utational Fluency
Ap
ril Com
putatio
nal Fluency
Set A5 N
umb
er & O
pera-
tions: A
dd
ing & Sub
tracting
Fractions, Ind
epend
ent
Wo
rksheets 1, 2 & 3
Set A6 N
umb
er & O
p-
erations: Fractio
n Concep
ts,
Activity 2 and
Indep
endent
Wo
rksheet 3
Bridges Practice Bo
ok, p
ages
108, 110, 118, 127, 129, 133,
134, 135
Inform
al
Unit 6, Sessio
ns 6 & 14 (W
ork
Samp
les)
Bridges Practice Bo
ok, p
ages
108, 110, 118, 127, 129, 133,
134, 135
Form
al
Unit 6, Sessio
ns 1 & 19 (U
nit
Pre- and Post-A
ssessments
and Stud
ent Reflection Sheet)
Num
ber Co
rner Teacher’s
Guid
e, pages 57–60,
320–324, 400–404 (Baseline
Assessm
ent, Checkups 3 &
4)
5.2.F Fluently add
and sub
tract
decim
al numb
ers.
Unit 6, Sessio
n 14
Unit 6, p
ages 887–890 and
894–895 (Wo
rk Place 6C)
Ho
me Co
nnections, V
ol. 2:
HC
’s 55, 56, 58
Num
ber Co
rner Student
Boo
k pages 167, 175
Bridges Practice Bo
ok, p
ages
114, 115, 137
Inform
al
Bridges Practice Bo
ok, p
ages
114, 115, 137
Form
al
Unit 6, Sessio
n 1 (Unit Pre-
Assessm
ent)
Unit 6, Sessio
n 19 (Unit Po
st-
Assessm
ent and Stud
ent
Reflection Sheet)
Num
ber Co
rner Teacher’s
Guid
e, pages 320
–324,
400–404 (C
heckups 3 &
4)
5.2.G Estim
ate sums and
differ-
ences of fractio
ns, mixed
num-
bers, and
decim
als to p
redict so
-
lutions to
pro
blem
s or d
etermine
reasonab
leness of answ
ers.
Unit 4, Sessio
n 12
Unit 6, Sessio
n 14
Ap
ril Com
putatio
nal Fluency
Supp
ort A
ctivity 35 (See
Grad
e 5 Num
ber Co
rner
Blacklines)
Set A6 N
umb
er & O
p-
erations: Fractio
n Concep
ts,
Activity 2 and
Indep
endent
Wo
rksheets 2 & 3
Bridges Practice Bo
ok, p
ages
113, 114, 118
Inform
al
Bridges Practice Bo
ok, p
ages
113, 114, 118

© T
he M
ath
Lear
ning
Cen
ter,
Sale
m, O
R 8
00 5
75-8
130
ww
w.m
athl
earn
ingc
ente
r.org
1
108
Brid
ges
in M
athe
mat
ics
Gra
de
5 W
ashi
ngto
n Co
rrel
atio
ns •
v
Bri
dge
s G
rad
e 5
Corr
elat
ions
to
Was
hing
ton
Mat
hem
atic
s Pe
rfo
rman
ce E
xpec
tati
ons
(co
nt.)
NU
MB
ERS,
OPE
RA
TIO
NS,
ALG
EBR
AA
DD
ITIO
N A
ND
SU
BTR
AC
TIO
N O
F FR
AC
TIO
NS
AN
D D
ECIM
ALS
WA
Pe
rfo
rman
ce E
xpe
ctat
ion
sB
rid
ge
sH
om
e C
on
ne
ctio
ns
Nu
mb
er
Co
rne
rB
rid
ge
s Su
pp
lem
en
tA
sse
ssm
en
t
5.2.
H S
olv
e si
ngle
- an
d m
ulti-
step
wo
rd p
rob
lem
s in
volv
ing
add
i-
tion
and
sub
trac
tion
of
who
le
num
ber
s, f
ract
ions
(in
clud
ing
mix
ed n
umb
ers)
and
dec
imal
s
and
ver
ify
thei
r so
lutio
ns.
Uni
t 4,
Ses
sio
ns 1
3, 2
0
Uni
t 6,
Ses
sio
ns 5
–6,
14
Ho
me
Conn
ectio
ns, V
ol.
2:
HC
52,
55,
58
Mar
ch C
om
put
atio
nal F
luen
cy
Num
ber
Co
rner
Stu
den
t
Boo
k p
ages
50,
151
–153
,
158–
159,
188
, 193
, 196
Set
A5
Num
ber
& O
per
a-
tions
: Ad
din
g &
Sub
trac
ting
Frac
tions
, Ind
epen
den
t
Wo
rksh
eets
1, 2
& 3
Set
A6
Num
ber
& O
p-
erat
ions
: Fra
ctio
n Co
ncep
ts,
Act
ivit
y 2
and
Ind
epen
den
t
Wo
rksh
eet
3
Brid
ges
Prac
tice
Boo
k, p
ages
78, 8
0, 1
16, 1
19, 1
20, 1
27, 1
29,
133,
134
, 135
Info
rmal
Uni
t 4,
Ses
sio
n 20
(W
ork
Sam
ple
)
Uni
t 6,
Ses
sio
ns 5
, 6, 1
4
(Wo
rk S
amp
les)
Brid
ges
Prac
tice
Boo
k, p
ages
78, 8
0, 1
16, 1
19, 1
20, 1
27, 1
29,
133,
134
, 135
Form
al
Uni
t 4, S
essi
ons
1 &
23
(Uni
t
Pre-
and
Pos
t-A
sses
smen
ts
and
Stu
den
t Refl
ectio
n Sh
eet)
Uni
t 6, S
essi
ons
1 &
19
(Uni
t
Pre-
and
Pos
t-A
sses
smen
ts
and
Stu
den
t Refl
ectio
n Sh
eet)
Num
ber
Co
rner
Tea
cher
’s
Gui
de,
pag
es 3
20–3
24,
400
–404
(C
heck
ups
3 &
4)
GEO
MET
RY/M
EASU
REM
ENT.
ALG
EBR
A
TRIA
NG
LES
AN
D Q
UA
DR
ILA
TER
ALS
WA
Pe
rfo
rman
ce E
xpe
ctat
ion
sB
rid
ge
sH
om
e C
on
ne
ctio
ns
Nu
mb
er
Co
rne
rB
rid
ge
s Su
pp
lem
en
tA
sse
ssm
en
t
5.3.
A C
lass
ify
qua
dril
ater
als.
Uni
t 3,
Ses
sio
ns 1
–4, 7
,
12–1
4, 1
6
Ho
me
Conn
ectio
ns, V
ol.
1:
HC
’s 2
4
Oct
ob
er C
alen
dar
Grid
Set
C1
Geo
met
ry: T
riang
les
&
Qua
dril
ater
als,
Act
ivit
y 2
and
Ind
epen
den
t Wo
rksh
eets
3-4
Brid
ges
Prac
tice
Book
, pag
es
41, 9
7
Form
al
Uni
t 3,
Ses
sio
ns 5
& 2
2 (U
nit
Pre-
and
Po
st-A
sses
smen
ts
and
Stu
den
t Re
flect
ion
Shee
t)
5.3.
B Id
entif
y, s
ketc
h, a
nd
mea
sure
acu
te, r
ight
, and
ob
tuse
angl
es.
Uni
t 3,
Ses
sio
ns 6
–10,
13–1
6
Uni
t 8,
Ses
sio
n 1
Ho
me
Conn
ectio
n, V
ol.
1:
HC
’s 2
5–26
Sep
tem
ber
Cal
end
ar G
rid
May
Cal
end
ar G
rid
Num
ber
Co
rner
Stu
den
t
Boo
k, p
ages
180
–181
, 197
Brid
ges
Prac
tice
Boo
k, p
ages
43, 4
4
Info
rmal
Uni
t 3, S
essi
on
9 (W
ork
Sam
ple
)
Form
al
Uni
t 3,
Ses
sio
ns 5
& 2
2 (U
nit
Pre-
and
Pos
t-A
sses
smen
ts
and
Stu
den
t Refl
ectio
n Sh
eet)

© The M
ath Learning Center, Salem, O
R 800 575-8130 ww
w.m
athlearningcenter.org
1108 Bridges in M
athematics G
rade 5 W
ashington Co
rrelations • vi
Brid
ges Grad
e 5 Correlatio
ns to W
ashingto
n Mathem
atics Perform
ance Expectatio
ns (cont.)
GEO
METRY/M
EASU
REM
ENT. A
LGEB
RA
TR
IAN
GLES A
ND
QU
AD
RILA
TERA
LS
WA
Perfo
rman
ce Expe
ctation
sB
ridg
es
Ho
me C
on
ne
ction
sN
um
be
r Co
rne
rB
ridg
es Su
pp
lem
en
tA
ssessm
en
t
5.3.C Id
entify, describ
e, and clas-
sify triangles by angle m
easure
and num
ber o
f congruent sid
es.
Unit 3, Sessio
ns 4, 7, 12–14, 16 O
ctob
er Calend
ar Grid
Set C1 Geom
etry: Triangles &
Quad
rilaterals, Activity 1 and
Indep
endent W
orksheets 1 & 2
Bridges Practice Bo
ok, p
ages
43, 44, 97, 140
5.3.D D
etermine the fo
rmula fo
r
the area of a p
arallelogram
by re-
lating it to the area o
f a rectangle.
Unit 3, Sessio
ns 1, 4, 16
Unit 3, p
age 336 (Challenge)
Ho
me Co
nnections, V
ol. 1:
HC
’s 28,
Octo
ber C
alendar G
rid
Num
ber Co
rner Student
Boo
k pages 27, 34
Set C1 G
eom
etry: Triangles &
Quad
rilaterals, Activities
3 & 4 and
Indep
endent
Wo
rksheet 5
5.3.E Determ
ine the form
ula for
the area of a triangle b
y relating it
to the area o
f a parallelo
gram.
Unit 3, Sessio
ns 4, 16H
om
e Connectio
ns, Vo
l. 1:
HC
’s 28,
Octo
ber C
alendar G
rid
Num
ber Co
rner Student
Boo
k pages 27, 34
Set C1 G
eom
etry: Triangles &
Quad
rilaterals, Activity 4 &
Indep
endent W
orksheet 5
5.3.F Determ
ine the perim
eters
and areas o
f triangles and p
aral-
lelogram
s.
Unit 3, Sessio
ns 1, 4, 16
Unit 3, p
age 336 (Challenge)
Ho
me Co
nnections, V
ol. 1:
HC
’s 23, 28, 34
Septem
ber Pro
blem
Solving
January Prob
lem So
lving
March Pro
blem
Solving
Num
ber Co
rner Student
Boo
k pages 8, 14, 27, 34, 86,
94, 139–141
Set C1 G
eom
etry: Triangles &
Quad
rilaterals, Activities
3 & 4 and
Indep
endent
Wo
rksheets 5 & 6
Bridges Practice Bo
ok, p
ages
45, 47, 51, 53, 54, 58, 72,
85, 91
Inform
al
Bridges Practice Bo
ok, p
ages
45, 47, 51, 53, 54, 58, 72,
85, 91
Form
al
Unit 3, Sessio
n 22 (Unit Po
st-
Assessm
ent and Stud
ent
Reflection Sheet)
Num
ber Co
rner Teacher’s
Guid
e, pages 110
–114,
232–236, 320–324, 400
–404
(Checkup
s 1, 2, 3, and 4)
5.3.G D
raw q
uadrilaterals and
triangles from
given inform
ation
abo
ut sides and
angles.
Unit 3, Sessio
ns 7, 12 H
om
e Connectio
ns, Vo
l. 2:
HC
65
Num
ber Co
rner Student
Boo
k pages 8, 14
Set C1 G
eom
etry: Triangles
& Q
uadrilaterals, A
ctivities 1
& 3 and
Indep
endent W
ork-
sheets 1-4
Bridges Practice Bo
ok, p
ages
42, 44
Form
al
Unit 3, Sessio
ns 5 & 22 (U
nit
Pre- and Po
st-Assessm
ents
and Stud
ent Reflection
Sheet)
© T
he M
ath
Lear
ning
Cen
ter,
Sale
m, O
R 8
00 5
75-8
130
ww
w.m
athl
earn
ingc
ente
r.org
1
108
Brid
ges
in M
athe
mat
ics
Gra
de
5 W
ashi
ngto
n Co
rrel
atio
ns •
vii
Bri
dge
s G
rad
e 5
Corr
elat
ions
to
Was
hing
ton
Mat
hem
atic
s Pe
rfo
rman
ce E
xpec
tati
ons
(co
nt.)
GEO
MET
RY/M
EASU
REM
ENT.
ALG
EBR
A
TRIA
NG
LES
AN
D Q
UA
DR
ILA
TER
ALS
WA
Pe
rfo
rman
ce E
xpe
ctat
ion
sB
rid
ge
sH
om
e C
on
ne
ctio
ns
Nu
mb
er
Co
rne
rB
rid
ge
s Su
pp
lem
en
tA
sse
ssm
en
t
5.3.
H D
eter
min
e th
e nu
mb
er a
nd
loca
tion
of
lines
of
sym
met
ry in
tria
ngle
s an
d q
uad
rilat
eral
s.
Uni
t 3,
Ses
sio
ns 1
2–14
, 16
Ho
me
Conn
ectio
ns, V
ol.
1:
HC
’s 2
7
Sep
tem
ber
Cal
end
ar G
rid
Dec
emb
er C
alen
dar
Grid
Num
ber
Co
rner
Stu
den
t
Boo
k p
ages
15–
18
Brid
ges
Prac
tice
Boo
k, p
ages
139,
140
Form
al
Uni
t 3,
Ses
sio
ns 5
& 2
2 (U
nit
Pre-
and
Pos
t-A
sses
smen
ts
and
Stu
den
t Refl
ectio
n Sh
eet)
Num
ber
Co
rner
Tea
cher
’s
Gui
de,
pag
es 1
10–1
14
(Che
ckup
1)
5.3.
I So
lve
sing
le-
and
mul
ti-st
ep
wo
rd p
rob
lem
s ab
out
the
pe-
rimet
ers
and
are
as o
f q
uad
rilat
er-
als
and
tria
ngle
s an
d v
erif
y th
e
solu
tions
.
Uni
t 3,
Ses
sio
n 1
Uni
t 7,
Ses
sio
ns 1
0-14
Ho
me
Conn
ectio
ns, V
ol.
1:
HC
20
Ho
me
Conn
ectio
ns, V
ol.
2:
HC
65
Sep
tem
ber
Pro
ble
m S
olv
ing
Janu
ary
Pro
ble
m S
olv
ing
Mar
ch P
rob
lem
So
lvin
g
Num
ber
Co
rner
Stu
den
t
Boo
k p
ages
8, 1
4, 8
6, 9
4,
139–
141,
143
, 164
, 166
, 185
Set
C1
Geo
met
ry: T
riang
les
&
Qua
dril
ater
als,
Ind
epen
den
t
Wo
rksh
eet
5 &
6
Brid
ges
Prac
tice
Boo
k, p
ages
20, 4
0, 4
6, 4
8, 5
2, 5
4, 7
2, 8
5,
91,1
34
Info
rmal
Brid
ges
Prac
tice
Boo
k, p
ages
20, 4
0, 4
6, 4
8, 5
2, 5
4, 7
2, 8
5,
91, 1
34
OPE
RA
TIO
NS,
GEO
MET
RY/M
EASU
REM
ENT,
ALG
EBR
AR
EPR
ESEN
TATI
ON
S O
F A
LGEB
RA
IC R
ELA
TIO
NSH
IPS
WA
Pe
rfo
rman
ce E
xpe
ctat
ion
sB
rid
ge
sH
om
e C
on
ne
ctio
ns
Nu
mb
er
Co
rne
rB
rid
ge
s Su
pp
lem
en
tA
sse
ssm
en
t
5.4.
A D
escr
ibe
and
cre
ate
a ru
le
for
num
eric
al a
nd g
eom
etric
pat
-
tern
s an
d e
xten
d t
he p
atte
rns.
Uni
t 1,
Ses
sio
ns 5
–6,
16
–18
Uni
t 7,
Ses
sio
ns 4
–9
Ho
me
Conn
ectio
ns, V
ol.
1:
HC
’s 2
, 3, 8
Ho
me
Conn
ectio
ns, V
ol.
2:
HC
61
Sep
tem
ber
–May
Cal
end
ar
Grid
Feb
ruar
y Pr
ob
lem
So
lvin
g
Num
ber
Co
rner
Stu
den
t
Boo
k p
ages
102
–105
,
112–
115,
120
–123
Brid
ges
Prac
tice
Boo
k, p
ages
123,
124
, 128
Info
rmal
Uni
t 1, S
essi
on
6 (W
ork
Sam
ple
)
Uni
t 7,
Ses
sio
ns 5
, 7 (
Wo
rk
Sam
ple
s)
Form
al
Uni
t 1,
Ses
sio
ns 4
& 2
1 (U
nit
Pre-
and
Po
st-A
sses
smen
t)
Uni
t 7,
Ses
sio
ns 3
& 1
6 (U
nit
Pre-
and
Po
st-A
sses
smen
t)

© The M
ath Learning Center, Salem, O
R 800 575-8130 ww
w.m
athlearningcenter.org
1108 Bridges in M
athematics G
rade 5 W
ashington Co
rrelations • viii
Brid
ges Grad
e 5 Correlatio
ns to W
ashingto
n Mathem
atics Perform
ance Expectatio
ns (cont.)
OPER
ATIO
NS, G
EOM
ETRY/MEA
SUR
EMEN
T, ALG
EBR
AR
EPRESEN
TATIO
NS O
F ALG
EBR
AIC R
ELATIO
NSH
IPS
WA
Perfo
rman
ce Expe
ctation
sB
ridg
es
Ho
me C
on
ne
ction
sN
um
be
r Co
rne
rB
ridg
es Su
pp
lem
en
tA
ssessm
en
t
5.4.B Write a rule to
describ
e the
relationship
betw
een two
sets of
data that are linearly related
.
Unit 1, Sessio
ns 5–6, 16
–18
Unit 7, Sessio
ns 4–9
Ho
me Co
nnections, V
ol. 1:
HC
8
Ho
me Co
nnections, V
ol. 2:
HC
’s 61–64
Inform
al
Unit 1, Sessio
n 6 (Wo
rk
Samp
le)
Unit 7, Sessio
n 5 (Wo
rk
Samp
le)
Form
al
Unit 1, Sessio
ns 4 & 21 (U
nit
Pre- and Po
st-Assessm
ent)
Unit 7, Sessio
ns 3 & 16 (U
nit
Pre- and Po
st-Assessm
ent)
5.4.C W
rite algebraic exp
ressions
that represent sim
ple situatio
ns
and evaluate the exp
ressions,
using substitutio
n when variab
les
are involved
.
Unit 1, Sessio
n 16–17
Unit 3, Sessio
n 6
Unit 4, Sessio
n 9
Unit 6, Sessio
ns 2, 4
Unit 7, Sessio
ns 2, 4–7,
9–13
Ho
me Co
nnections, V
ol. 1:
HC
8, 25
Ho
me Co
nnections, V
ol. 2:
HC
’s 60–
64
No
vemb
er Prob
lem So
lving
Num
ber Co
rner Student
Boo
k pages 36
Set B1Algeb
ra: Diagram
s &
Equatio
ns, Activity 1 and
Indep
endent W
orksheets
1 & 2
Bridges Practice Bo
ok, p
ages
124, 125, 126
Inform
al
Unit 1, Sessio
n18 (Wo
rk
Samp
le)
Unit 7, Sessio
n 12 (Wo
rk
Samp
le)
Form
al
Unit 7, Sessio
ns 3 & 16 (U
nit
Pre- and Po
st-Assessm
ents
and Stud
ent Reflection
Sheet)
5.4.D G
raph o
rdered
pairs in the
coo
rdinate p
lane for tw
o sets o
f
data related
by a linear rule and
draw
the line they determ
ine.
Unit 1, Sessio
n 18
Unit 7, Sessio
ns 4–7
Ho
me Co
nnections, V
ol. 1:
HC
29
Ho
me Co
nnections, V
ol. 2:
HC
64
Inform
al
Unit 1, Sessio
n 18 (Wo
rk
Samp
le)
Unit 7, Sessio
n 5 (Wo
rk
Samp
le)
Form
al
Unit 7, Sessio
n 16 (Unit Po
st-
Assessm
ent and Stud
ent
Reflection Sheet)
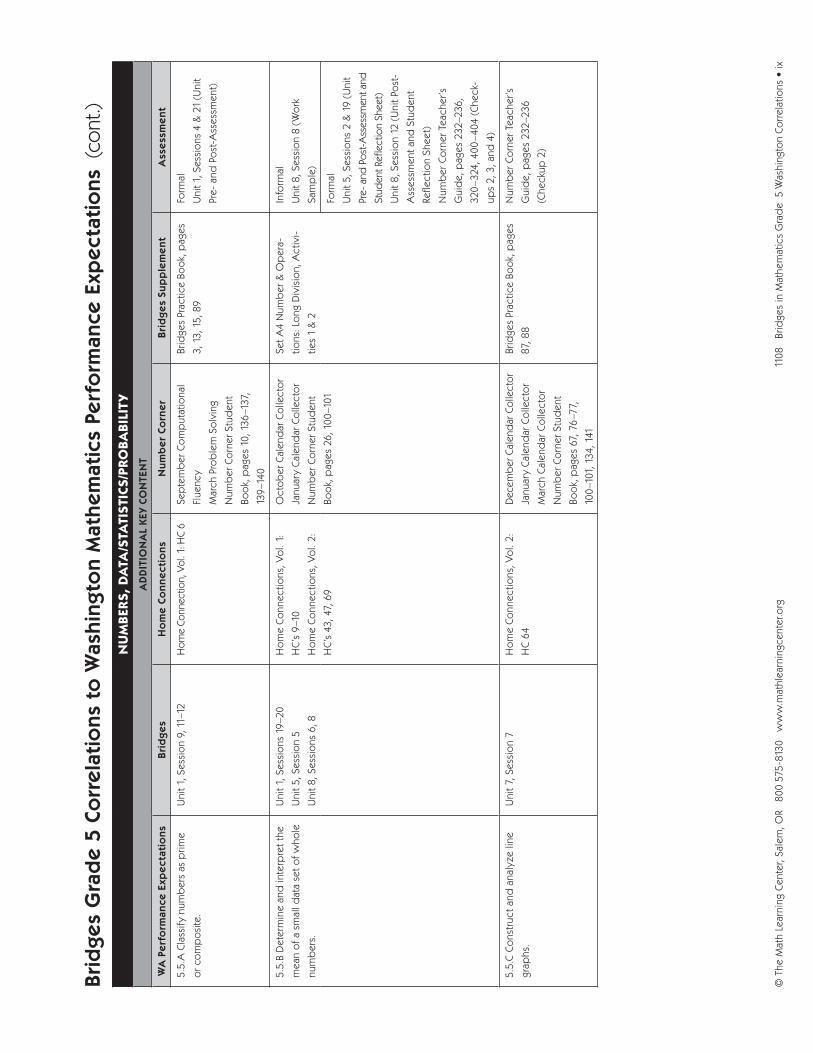
© T
he M
ath
Lear
ning
Cen
ter,
Sale
m, O
R 8
00 5
75-8
130
ww
w.m
athl
earn
ingc
ente
r.org
1
108
Brid
ges
in M
athe
mat
ics
Gra
de
5 W
ashi
ngto
n Co
rrel
atio
ns •
ix
Bri
dge
s G
rad
e 5
Corr
elat
ions
to
Was
hing
ton
Mat
hem
atic
s Pe
rfo
rman
ce E
xpec
tati
ons
(co
nt.)
NU
MB
ERS,
DA
TA/S
TATI
STIC
S/PR
OBA
BIL
ITY
AD
DIT
ION
AL
KEY
CO
NTE
NT
WA
Pe
rfo
rman
ce E
xpe
ctat
ion
sB
rid
ge
sH
om
e C
on
ne
ctio
ns
Nu
mb
er
Co
rne
rB
rid
ge
s Su
pp
lem
en
tA
sse
ssm
en
t
5.5.
A C
lass
ify
num
ber
s as
prim
e
or
com
po
site
.
Uni
t 1,
Ses
sio
n 9,
11–
12H
ome
Conn
ectio
n, V
ol. 1
: HC
6Se
pte
mb
er C
om
put
atio
nal
Flue
ncy
Mar
ch P
rob
lem
So
lvin
g
Num
ber
Co
rner
Stu
den
t
Boo
k, p
ages
10,
136
–137
,
139–
140
Brid
ges
Prac
tice
Boo
k, p
ages
3, 1
3, 1
5, 8
9
Form
al
Uni
t 1,
Ses
sio
ns 4
& 2
1 (U
nit
Pre-
and
Po
st-A
sses
smen
t)
5.5.
B D
eter
min
e an
d in
terp
ret
the
mea
n o
f a
smal
l dat
a se
t o
f w
hole
num
ber
s.
Uni
t 1,
Ses
sio
ns 1
9–20
Uni
t 5,
Ses
sio
n 5
Uni
t 8,
Ses
sio
ns 6
, 8
Ho
me
Conn
ectio
ns, V
ol.
1:
HC
’s 9
–10
Ho
me
Conn
ectio
ns, V
ol.
2:
HC
’s 4
3, 4
7, 6
9
Oct
ob
er C
alen
dar
Co
llect
or
Janu
ary
Cal
end
ar C
olle
cto
r
Num
ber
Co
rner
Stu
den
t
Boo
k, p
ages
26,
100
–101
Set
A4
Num
ber
& O
per
a-
tions
: Lo
ng D
ivis
ion,
Act
ivi-
ties
1 &
2
Info
rmal
Uni
t 8,
Ses
sio
n 8
(Wo
rk
Sam
ple
)
Form
al
Uni
t 5,
Ses
sio
ns 2
& 1
9 (U
nit
Pre-
and
Pos
t-A
sses
smen
t and
Stud
ent R
eflec
tion
Shee
t)
Uni
t 8,
Ses
sio
n 12
(U
nit
Post
-
Ass
essm
ent
and
Stu
den
t
Refle
ctio
n Sh
eet)
Num
ber
Co
rner
Tea
cher
’s
Gui
de,
pag
es 2
32–2
36,
320
–324
, 400
–404
(C
heck
-
ups
2, 3
, and
4)
5.5.
C C
ons
truc
t an
d a
naly
ze li
ne
grap
hs.
Uni
t 7,
Ses
sio
n 7
Ho
me
Conn
ectio
ns, V
ol.
2:
HC
64
Dec
emb
er C
alen
dar
Col
lect
or
Janu
ary
Cal
end
ar C
olle
cto
r
Mar
ch C
alen
dar
Co
llect
or
Num
ber
Co
rner
Stu
den
t
Boo
k, p
ages
67,
76
–77,
100
–101
, 134
, 141
Brid
ges
Prac
tice
Boo
k, p
ages
87, 8
8
Num
ber
Co
rner
Tea
cher
’s
Gui
de,
pag
es 2
32–2
36
(Che
ckup
2)

© The M
ath Learning Center, Salem, O
R 800 575-8130 ww
w.m
athlearningcenter.org
1108 Bridges in M
athematics G
rade 5 W
ashington Co
rrelations • x
Brid
ges Grad
e 5 Correlatio
ns to W
ashingto
n Mathem
atics Perform
ance Expectatio
ns (cont.)
REA
SON
ING
, PROB
LEM SO
LVIN
G, A
ND
COM
MU
NIC
ATIO
NW
A Pe
rform
ance Exp
ectatio
ns
Brid
ge
sH
om
e Co
nn
ectio
ns
Nu
mb
er C
orn
er
Brid
ge
s Sup
ple
me
nt
Asse
ssme
nt
5.6.A D
etermine the q
uestion(s)
to b
e answered
given a pro
blem
situation.
Unit 1, Sessio
n 8
Unit 2, Sessio
ns 11, 15
Unit 3, Sessio
ns 1, 19–21
Unit 4, Sessio
n 20
Unit 5, Sessio
ns 12–15
Unit 6, p
age 795 (Pattern
Block Fractio
n Challenge)
Unit 7, Sessio
ns 7, 10–13
Unit 8, Sessio
ns 3–5, 7
Septem
ber–M
ay Prob
lem
Solving
Num
ber Co
rner Student
Boo
k, pages 2, 5–8, 13–14,
20–24, 28–31, 35–38, 45–48,
63–65, 69–71, 78–81, 84–87,
92–95, 102–105, 112–115,
120–123, 127–128, 132–133,
136–137, 139–140, 144–147,
150–157, 164–167, 175–178,
185–188, 193, 196
Set E1 Data A
nalysis: Prob
-
ability &
Technolo
gy, Activi-
ties 1 & 2, and
Indep
endent
Wo
rksheet 1
Bridges Practice Bo
ok, p
ages
10, 18, 20, 34, 40, 65, 92,
100, 132, 136
Inform
al
Unit 5, Sessio
n 13 (Wo
rk
Samp
le)
5.6.B Identify info
rmatio
n that
is given in a pro
blem
and
decid
e whether it is essential o
r
extraneous to
the solutio
n of the
pro
blem
.
Unit 1, Sessio
ns 5–6, 16
–17
Unit 3, Sessio
ns 1, 13–14
Unit 4, Sessio
n 20
Unit 5, Sessio
ns 12–13
Unit 6, p
age 795 (Pattern
Block Fractio
n Challenge)
Unit 7, Sessio
ns 4–5, 7, 10–13
Unit 8, Sessio
ns 3–5, 7
Septem
ber–M
ay Prob
lem
Solving
Septem
ber–M
ay Calend
ar
Grid
Num
ber Co
rner Student
Boo
k, pages 2, 5–8, 13–14,
20–24, 28–31, 35–38, 45–48,
63–65, 69–71, 78–81, 84–87,
92–95, 102–105, 112–115,
120–123, 127–128, 132–133,
136–137, 139–140, 144–147,
150–157, 164–167, 175–178,
185–188, 193, 196
Bridges Practice Bo
ok, p
ages
10, 18, 34, 65, 92
Inform
al
Bridges Practice Bo
ok, p
ages
10, 18, 34, 65, 92
5.6.C D
etermine w
hether ad-
ditio
nal inform
ation is need
ed to
solve the p
rob
lem.
Unit 1, Sessio
ns 5–6, 16
–17
Unit 3, Sessio
ns 13–14, 19–21
Unit 7, Sessio
ns 2, 4–5, 7, 9–13
May Pro
blem
Solving
Bridges Practice Bo
ok, p
ages
65, 132, 134, 136
Inform
al
Bridges Practice Bo
ok, p
ages
65, 132, 134, 136
5.6.D D
etermine w
hether a
pro
blem
to b
e solved
is similar to
previo
usly solved
pro
blem
s, and
identify p
ossib
le strategies for
solving the p
rob
lem.
Unit 1, Sessio
ns 16–17
Unit 3, Sessio
ns 3–4, 6–7,
9–10, 19–21
Unit 4, Sessio
n 20
Unit 6, Sessio
ns 4–7
Unit 7, Sessio
ns 4–7, 10–13
Unit 8, Sessio
n 9
Septem
ber–M
ay Prob
lem
Solving

© T
he M
ath
Lear
ning
Cen
ter,
Sale
m, O
R 8
00 5
75-8
130
ww
w.m
athl
earn
ingc
ente
r.org
1
108
Brid
ges
in M
athe
mat
ics
Gra
de
5 W
ashi
ngto
n Co
rrel
atio
ns •
xi
Bri
dge
s G
rad
e 5
Corr
elat
ions
to
Was
hing
ton
Mat
hem
atic
s Pe
rfo
rman
ce E
xpec
tati
ons
(co
nt.)
REA
SON
ING
, PR
OB
LEM
SO
LVIN
G,
AN
D C
OM
MU
NIC
ATI
ON
WA
Pe
rfo
rman
ce E
xpe
ctat
ion
sB
rid
ge
sH
om
e C
on
ne
ctio
ns
Nu
mb
er
Co
rne
rB
rid
ge
s Su
pp
lem
en
tA
sse
ssm
en
t
5.6.
E S
elec
t an
d u
se o
ne o
r
mo
re a
pp
rop
riate
str
ateg
ies
to
solv
e a
pro
ble
m, a
nd e
xpla
in t
he
cho
ice
of
stra
tegy
.
Uni
t 1,
Ses
sio
ns 5
–6,
10,
16–1
7
Uni
t 3,
Ses
sio
n 1,
6–7
, 9–1
1
Uni
t 4,
Ses
sio
ns 6
, 10,
13,
20
Uni
t 5,
Ses
sio
ns 4
–5, 1
2–13
Uni
t 7,
Ses
sio
ns 7
, 10
–13
Ho
me
Conn
ectio
ns, V
ol.
2:
HC
65
Sep
tem
ber
–May
Pro
ble
m
Solv
ing
Num
ber
Co
rner
Stu
den
t
Boo
k, p
ages
2, 5
–8, 1
3–14
,
20–2
4, 2
8–31
, 35–
38, 4
5–48
,
63–
65, 6
9–71
, 78–
81, 8
4–87
,
92–9
5, 1
02–1
05, 1
12–1
15,
120
–123
, 127
–128
, 132
–133
,
136
–137
, 139
–140
, 144
–147
,
150
–157
, 164
–167
, 175
–178
,
185–
188,
193
, 196
Info
rmal
Uni
t 7,
Ses
sio
n 14
(Po
ster
Resp
ons
e Fo
rm)
Num
ber
Co
rner
Tea
cher
’s
Gui
de,
Vo
l. 2,
pag
es
210-
212,
258
, 341
–342
,
377–
378
(Sco
ring
Each
Oth
er’s
Wo
rk)
5.6.
F R
epre
sent
a p
rob
lem
situ
atio
n us
ing
wo
rds,
num
ber
s,
pic
ture
s, p
hysi
cal o
bje
cts,
or
sym
bo
ls.
Uni
t 1,
Ses
sio
ns 5
–8, 1
0, 1
2
Uni
t 2,
Ses
sio
ns 8
–9, 1
1–14
,
16–1
7
Uni
t 3,
Ses
sio
ns 1
, 11,
13–
14
Uni
t 4,
Ses
sio
ns 2
, 4–
6, 1
0,
12–1
4, 1
7–20
Uni
t 5,
Ses
sio
ns 4
–5, 1
2–15
Uni
t 6,
Ses
sio
ns 3
, 7, 1
7,
20–2
1
Uni
t 7,
Ses
sio
ns 4
–13
Uni
t 8,
Ses
sio
ns 1
, 4
Ho
me
Conn
ectio
ns, V
ol.
2:
HC
65
Sep
tem
ber
–May
Pro
ble
m
Solv
ing
Num
ber
Co
rner
Stu
den
t
Boo
k, p
ages
2, 5
–8, 1
3–14
,
20–2
4, 2
8–31
, 35–
38, 4
5–48
,
63–
65, 6
9–71
, 78–
81, 8
4–87
,
92–9
5, 1
02–1
05, 1
12–1
15,
120
–123
, 127
–128
, 132
–133
,
136
–137
, 139
–140
, 144
–147
,
150
–157
, 164
–167
, 175
–178
,
185–
188,
193
, 196
Brid
ges
Prac
tice
Boo
k, p
ages
10, 1
7, 1
8, 2
0, 2
6, 2
8, 3
0, 3
2,
34, 3
6, 4
0, 4
6, 5
2, 5
4, 6
4, 6
5,
69, 7
0, 7
2, 7
4, 7
8, 8
0, 8
5, 8
6,
90, 9
1, 9
2, 1
00, 1
16, 1
19, 1
20,
126,
128
, 132
, 133
, 134
, 135
,
136,
138
Info
rmal
Uni
t 7,
Ses
sio
n 14
(Po
ster
Resp
ons
e Fo
rm)
Num
ber
Co
rner
Tea
cher
’s
Gui
de,
Vo
l. 2,
pag
es
210-
212,
258
, 341
–342
,
377–
378
(Sco
ring
Each
Oth
er’s
Wo
rk)
5.6.
G E
xpla
in w
hy a
sp
ecifi
c
pro
ble
m-s
olv
ing
stra
tegy
or
pro
-
ced
ure
was
use
d to
det
erm
ine
a
solu
tion.
Uni
t 1,
Ses
sio
ns 5
–6,
16
–17
Uni
t 2,
Ses
sio
n 8,
11–
12
Uni
t 3,
Ses
sio
n 6
–7, 9
–10,
19–2
1
Uni
t 5,
Ses
sio
ns 1
2–15
Uni
t 7,
Ses
sio
ns 1
0–1
4
Sep
tem
ber
–May
Pro
ble
m
Solv
ing
Janu
ary
Com
put
atio
nal
Flue
ncy

© The M
ath Learning Center, Salem, O
R 800 575-8130 ww
w.m
athlearningcenter.org
1108 Bridges in M
athematics G
rade 5 W
ashington Co
rrelations • xii
REA
SON
ING
, PROB
LEM SO
LVIN
G, A
ND
COM
MU
NIC
ATIO
NW
A Pe
rform
ance Exp
ectatio
ns
Brid
ge
sH
om
e Co
nn
ectio
ns
Nu
mb
er C
orn
er
Brid
ge
s Sup
ple
me
nt
Asse
ssme
nt
5.6.H A
nalyze and evaluate
whether a so
lution is reaso
nable,
is mathem
atically correct, and
answers the q
uestion.
Unit 2, Sessio
ns 8, 14–17
Unit 3, Sessio
ns 1, 6–7
Unit 4, Sessio
ns 2, 4–5, 6,
10, 20
Unit 5, Sessio
ns 12–15
Unit 6, Sessio
ns 5–6, 14
Unit 7, Sessio
ns 7, 10–13
Septem
ber–M
ay Prob
lem
Solving
Num
ber Co
rner Student
Boo
k, pages 175–178,
185–188, 193–196
Set A3 N
umb
er & O
pera-
tions: Estim
ating to M
ultiply
& D
ivide, Ind
epend
ent
Wo
rksheets 1, 2 & 3
Bridges Practice Bo
ok, p
ages
10, 18, 34, 40, 64, 92, 100, 116
Inform
al
Unit 7, Sessio
n 14 (Poster
Respo
nse Form
)
Num
ber Co
rner Teacher’s
Guid
e, Vo
l. 2, pages
210-212, 258, 341–342,
377–378 (Scoring Each
Other’s W
ork)
Bridges Practice Bo
ok, p
ages
10, 18, 34, 40, 64, 92, 100, 116
5.6.I Summ
arize mathem
atical
inform
ation, d
raw co
nclusions,
and exp
lain reasoning.
Unit 3, Sessio
ns 1, 3, 18, 20
Unit 4, Sessio
ns 7,10
Unit 5, Sessio
ns 1, 4, 5, 8, 11,
13–15, 17
Unit 7, Sessio
n 7
Unit 8, Sessio
ns 6, 8
Septem
ber–
Octo
ber C
alen-
dar Co
llector
Decem
ber–M
arch Calend
ar
Collecto
r
Set E1 Data A
nalysis: Prob
-
ability &
Technolo
gy, Activi-
ties 1 & 2, and
Indep
endent
Wo
rksheet 1
Bridges Practice Bo
ok, p
ages
38, 87, 88, 93, 95, 116, 120,
123, 124, 128, 136
5.6.J Make and
test conjectures
based
on d
ata (or info
rmatio
n)
collected
from
explo
rations and
experim
ents.
Unit 1, Sessio
n 9, 12, 16–17,
19Unit 3, Sessio
n 7
Unit 4, Sessio
ns 7, 10
Unit 5, Sessio
ns 1, 3, 5,
7–16
Unit 6, Sessio
ns 3–4
Unit 7, Sessio
n 7
Unit 8, Sessio
ns 4–9
Septem
ber–
Octo
ber C
alen-
dar Co
llector
Decem
ber–M
arch Calend
ar
Collecto
r
Set E1 Data A
nalysis: Prob
-
ability &
Technolo
gy, Activi-
ties 1 & 2, and
Indep
endent
Wo
rksheet 1
Bridges Practice Bo
ok, p
ages
3, 7, 8, 15, 20, 33, 44, 48, 50,
87, 123, 124