bridges after site selection and before data analysis: sampling
TRANSCRIPT

658
J. N. Am. Benthol. Soc., 2001, 20(4):658–682q 2001 by The North American Benthological Society
BRIDGES
BRIDGES is a recurring feature of J-NABS intended to provide a forum for the interchange of ideas andinformation between basic and applied researchers in benthic science. Articles in this series focus on topicalresearch areas and linkages between basic and applied aspects of research, monitoring, policy, and education.Readers with ideas for topics should contact Associate Editors, Nick Aumen and Marty Gurtz.
Biomonitoring streams using macroinvertebrate community composition is an integral part of water-qualityprograms throughout the USA. Carter and Resh use a questionnaire-based survey to evaluate biomonitoringmethods used by state programs. They conclude that most programs use a similar suite of techniques both inthe field and in the laboratory; however, significant differences among the programs in the specifics of individualsteps (e.g., mesh size used for collecting, number of organisms sorted) affect comparability among programs.Carter and Resh suggest a need for increased research to address methods issues, and provide a list of questionsas a starting point for determining the influences of differences in methods on biomonitoring data.
After site selection and before data analysis: sampling,sorting, and laboratory procedures used in stream benthic
macroinvertebrate monitoring programs by USAstate agencies
JAMES L. CARTER1
US Geological Survey, 345 Middlefield Road, MS 465, Menlo Park, California 94025 USA
VINCENT H. RESH
Environmental Science, Policy, and Management, 201 Wellman Hall, University of California, Berkeley,California 94702 USA
Abstract. A survey of methods used by US state agencies for collecting and processing benthicmacroinvertebrate samples from streams was conducted by questionnaire; 90 responses were receivedand used to describe trends in methods. The responses represented an estimated 13,000–15,000 sam-ples collected and processed per year. Kicknet devices were used in 64.5% of the methods; othersampling devices included fixed-area samplers (Surber and Hess), artificial substrates (Hester–Dendyand rock baskets), grabs, and dipnets. Regional differences existed, e.g., the 1-m kicknet was usedmore often in the eastern US than in the western US. Mesh sizes varied among programs but 80.2%of the methods used a mesh size between 500 and 600 mm. Mesh size variations within US Environ-mental Protection Agency regions were large, with size differences ranging from 100 to 700 mm.Most samples collected were composites; the mean area sampled was 1.7 m2. Samples rarely werecollected using a random method (4.7%); most samples (70.6%) were collected using ‘‘expert opin-ion’’, which may make data obtained operator-specific. Only 26.3% of the methods sorted all theorganisms from a sample; the remainder subsampled in the laboratory. The most common methodof subsampling was to remove 100 organisms (range 5 100–550). The magnification used for sortingranged from 1 (sorting by eye) to 303, which results in inconsistent separation of macroinvertebratesfrom detritus. In addition to subsampling, 53% of the methods sorted large/rare organisms from asample. The taxonomic level used for identifying organisms varied among taxa; Ephemeroptera, Ple-coptera, and Trichoptera were generally identified to a finer taxonomic resolution (genus and species)than other taxa. Because there currently exists a large range of field and laboratory methods used bystate programs, calibration among all programs to increase data comparability would be exceptionallychallenging. However, because many techniques are shared among methods, limited testing could bedesigned to evaluate whether procedural differences affect the ability to determine levels of environ-mental impairment using benthic macroinvertebrate communities.
Key words: bioassessment, biomonitoring, macroinvertebrate, sampling, processing, methods,streams.
1 E-mail address: [email protected]
2001] 659BRIDGES
Benthic biologists choose study sites and plandata analyses based on study objectives. How-ever, the steps in between—the collection ofsamples, the separation of organisms from thesubstrate, the level of identifications used—areoften a product of tradition or convenience. Yet,decisions concerning the choice of sampling de-vice, where to take samples, whether to subsam-ple, and how to sort samples, may greatly influ-ence study conclusions and subsequent man-agement considerations.
Studies comparing various sampling devicesor proposing new ones, along with descriptionsof sorting techniques, were a staple of benthol-ogical publications and meeting presentations inthe 1960s and 1970s. As the science has devel-oped, more emphasis has been placed on ex-perimental approaches and less on descriptiveapproaches. However, although methodologicaltopics have become of less interest, they are cer-tainly not of less importance.
We present the results of a questionnaire sur-vey conducted among benthic biologists con-nected with US state agencies that use macroin-vertebrates for stream biomonitoring. The pur-pose of the survey was to examine what pro-cedures are used in both the field and thelaboratory for collecting and processing benthicmacroinvertebrate samples from streams. Wediscuss the responses of these agencies in termsof potential sources of bias and cost, and spec-ulate on how the approaches used in this essen-tial aspect of experimental design can affect theinterpretation of results obtained and the con-clusions reached.
Methods
The questionnaire consisted of 4 parts (see theAppendix for the questions asked). The 1st partaddressed procedures associated with samplecollection. Questions ranged from what deviceis used for collecting macroinvertebrates, tospecification of the length of stream that definesthe sampled reach. The 2nd part addressed theprocessing of samples in the field. Questionsranged from whether the sample is sorted onlyby eye in the field, to the sample-preservationtechniques used. The 3rd part addressed labo-ratory procedures. Questions asked whetherand how samples are subsampled, and includedan assessment of the level of taxonomic identi-fication used. The final part of the questionnaire
assessed aspects related to an evaluation of dataquality. Questions ranged from whether Quali-ty Assurance/Quality Control procedures areused, to whether and how reference collectionsare maintained.
The data used for the analyses represent theresponses from 48 states and the District of Co-lumbia. Analyses were limited to US state pro-grams because we suspected that their devel-opment was influenced by similar factors (i.e.,both within-state and federal water-quality in-formation needs). State programs were contact-ed based on the list of participants in Davis etal. (1996). Programs were requested to submitone questionnaire for each unique combinationof field collecting method and field and/or lab-oratory processing method. Results are basedon the responses from 90 questionnaires. Per-centages were calculated based on the numberof responses to each specific question. Becausesome questions eliminated the need to answerother questions, not all questions were an-swered on each questionnaire. In addition, somerespondents did not answer all the possiblequestions. Therefore, the total number of re-sponses varied among questions. Regional dif-ferences in methods were evaluated with AN-OVA by partitioning states based on location.First, states were separated into groups east orwest of the Mississippi River. Second, stateswere assigned to the 10 USEPA regions. Statis-tical analyses and percentages were calculatedusing STATISTICA (1999, STATISTICA for Win-dows, StatSoft Inc., Tulsa, Oklahoma).
Several previous studies have analyzed trendsin methods used in benthic research (Winter-bourn 1985, Voshell et al. 1989, Resh and Mc-Elravy 1993). The results of our survey are notdirectly comparable because the agency person-nel we solicited are mandated to conduct bioas-sessments or do biomonitoring rather than re-search, per se. However, we recognize that it of-ten is difficult to distinguish between specificaspects of the methods used in research studiesaddressing environmental influences on benthiccommunities and those used in biomonitoring.
Results and Discussion
Sample collection
Type of sampler used. It is often said that thenumber of different samplers used in studying

660 [Volume 20J. L. CARTER AND V. H. RESH
FIG. 1. Percentage (above each bar) of methods using each sampling device (n 5 90).
benthic macroinvertebrates in lotic systems isproportional to the number of investigators(Cummins 1962, Resh 1979, Merritt and Cum-mins 1996). However, this statement does notapply to sampling devices used in the state pro-grams surveyed (Fig. 1). Kick-type devices, suchas a D-frame sampler (0.3 m wide), Slack sam-pler (0.5 m wide), and/or kicknet (1 m wide),in which a predetermined effort (e.g., area ofsubstrate, collection time, or number of sweepsor jabs) is used for sample collection comprised64.5% of the devices. In contrast, the delineated,fixed-quadrat samplers such as the Surber andHess comprised only 8.9% of the responses. Ar-tificial substrates such as multiplates and rockbaskets comprised 13.3% of the devices used.
Kick-type samplers have been the most com-monly used devices in rapid bioassessment ap-proaches (Resh and Jackson 1993), but they arefar less used than fixed-quadrat samplers in theassessment of pollution, based on the results ofearlier surveys (Winterbourn 1985, Voshell et al.1989, Resh and McElravy 1993). Advantages ofkick-type samplers include low cost, ease oftransport, and usefulness in sampling a varietyof habitats (including deep-water habitats) moreeasily than most commonly used fixed-quadratsamplers. The latter often are considered to havean advantage because numbers of organisms
collected can be related to a more precisely de-fined sample area, thereby providing an abso-lute (rather than relative) measure of density pertaxon. Furthermore, fixed-quadrat replicates areconsidered to have higher precision as repre-sented by lower coefficients of variation (but seeHornig and Pollard 1978).
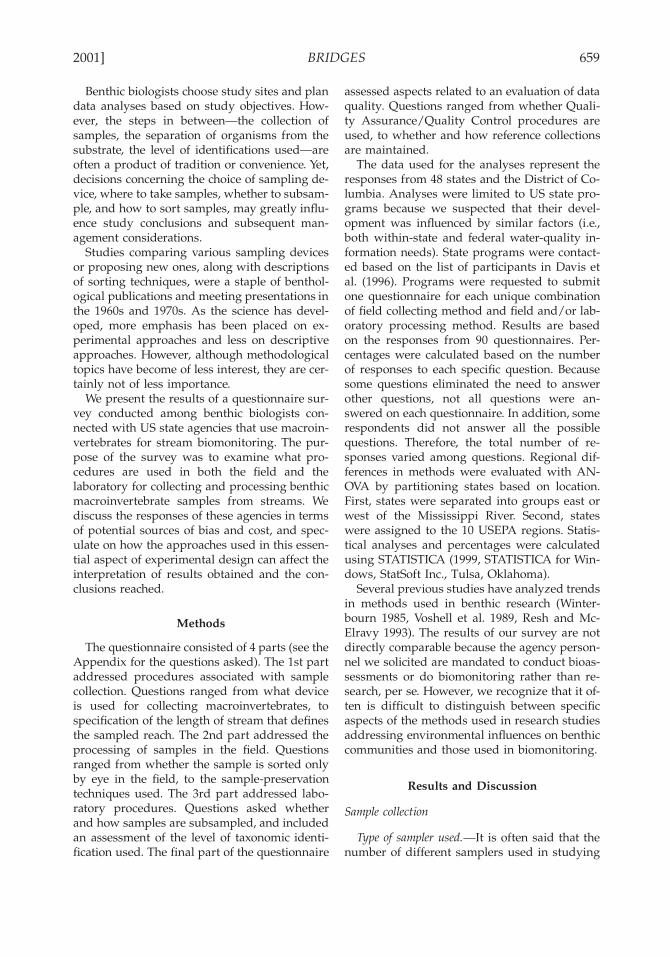
Mesh size. The size of the openings in thesampler net or in the sieves used for cleaning asample determines the lower size limit of theorganisms collected. However, the size of themesh also affects the efficiency of the sampler(e.g., the backwash created if the mesh is toofine can sweep organisms out of the net). Oursurvey indicated that the most common meshsize used by US state agencies was 500 mm(38.3% or 31/81 of respondents) followed by 600mm (21.0% or 17/81). However, the 500 to 600mm range covered 80.2% (65/81) of all pro-grams (Fig. 2). Earlier surveys of benthic ma-croinvertebrate research studies in streams re-ported the use of smaller mesh sizes (201–300mm: Winterbourn 1985, 300–500 mm: Resh andMcElravy 1993). However, earlier surveys of len-tic studies (Downing 1984) indicated mesh sizesof 450 to 600 mm being used in lake investiga-tions, which are close to the ranges reported inour survey.
More early instars of aquatic insects and
2001] 661BRIDGES
FIG. 2. Percentage (above each bar) of methods using each mesh size (n 5 81).
smaller organisms such as microcrustaceans arecollected when netted collecting devices havefiner meshes (Slack et al. 1991). However, thesesmaller organisms are often difficult for mostbenthic biologists to identify, and are simply in-cluded in taxa lists at higher taxonomic levels(family or even order). The inclusion (or exclu-sion) of early instars may greatly influence theresults of some quantitative descriptions of thebenthos (e.g., secondary production) (Hurynand Wallace 2000). In biomonitoring studies,metrics dependent on estimates of density or %composition also will be affected.
There is also an effective mesh size that variesover the time in which a sample is being col-lected. For example, small organisms that wouldnot normally be retained given a certain meshsize, are retained as the net becomes filled withdebris or clogged with silt. Different rates ofclogging will lead to inconsistencies in the col-lection of organisms smaller than the mesh size.
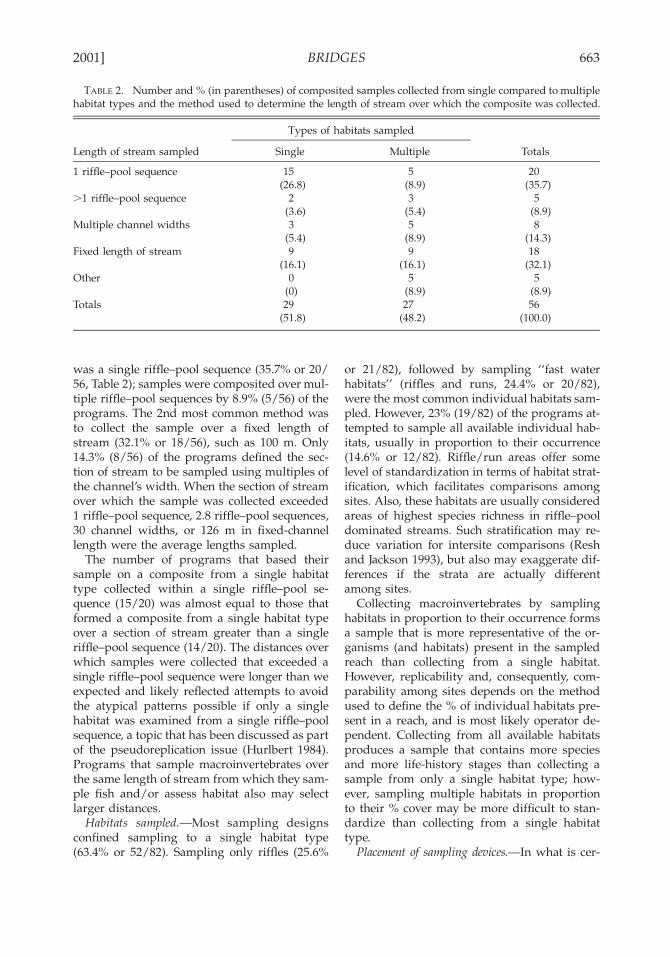
Compositing of samples. The formation of sin-gle sample units by compositing .1 collectionwas not done typically in earlier benthic studies(e.g., in only 10% of the studies reviewed byResh and McElravy 1993). However, our surveyindicated that compositing is now a commonpractice (74.4% or 64/86). The number of collec-tions composited varied with different samplers
(Table 1). For example, survey results indicatedthat 3 collections were composited to form a sin-gle sample unit with Hess samplers, 3 to 5 withmultiplates, 3 to 8 with Surber samplers, and 2to 20 with D-frame samplers.
Most bioassessments described the benthos ata site using a single sample formed by collectingover a relatively large, contiguous area ($1 m2)or by combining several smaller noncontiguouscollections. However, there was large variationin the area covered (Fig. 3). There are numerousadvantages to large samples. They combine theassemblages representing individual microhab-itat patches and reduce the high intersample (5intersite when a single sample represents a site)variation in benthic composition attributed tothe often-described, high variance of small, in-dividual, fixed-quadrat samples (e.g., Needhamand Usinger 1956, Resh 1979, Merritt and Cum-mins 1996). In addition, samples compositedfrom all available habitats within a reach maydetect generalized habitat impairment.
The disadvantage of compositing is that ameasure of within-site variance is lost, whichlimits the traditional use of inferential statisticsfor comparing among sites. However, individualreplicates collected from within a single habitat(e.g., one riffle) are not true replicates but rep-resent pseudoreplicates (Hurlbert 1984). Com-
662 [Volume 20J. L. CARTER AND V. H. RESH
TABLE 1. Number of samples composited per sampling device. SD 5 standard deviation. (No respondentsreported compositing rock baskets.)
Samplingdevice
Numberof
responses
Meannumber of
samples SD Range
KicknetSlackD-frameDipnetSurberHessMultiplateEkman
98
1813221
2.310.012.618.04.73.04.0
12.0
0.507.018.3702.8901.410
2–32–202–20
18–183–83–33–5
12–12
FIG. 3. Sequential frequency distribution of the total area sampled per site (from small to large area). Meanarea sampled 5 1.7 m2.
positing also tends to create large-volume sam-ples that need to be subsampled.
Length of stream section sampled. The length ofstream (and the diversity of habitats) overwhich a sample is composited influences boththe number of species encountered and the spe-cies-abundance distribution of the sample (Vin-son and Hawkins 1996, Larsen and Herlihy1998). Our data indicated that samples were col-lected over 3 principal lengths of stream: 1) theshortest length of stream sampled was when asingle kick or Surber-type sample was collectedfrom within a single habitat; 2) the next waswhen a composite was formed from $2 collec-
tions from $1 habitats within a single riffle–pool sequence; and 3) the largest was when acomposite was formed from $2 collections from$1 habitats over distances of multiple riffle–pool sequences. We suspect most bioassessmentprograms expect that their sample representslengths of stream that are at least the reach scaleif not the segment scale (sensu Frissell et al.1986).
The length of the stream section sampled wasmost often based on channel morphology; how-ever, many programs collected their samplefrom a predetermined fixed length of stream.The most commonly sampled stream section
2001] 663BRIDGES
TABLE 2. Number and % (in parentheses) of composited samples collected from single compared to multiplehabitat types and the method used to determine the length of stream over which the composite was collected.
Length of stream sampled
Types of habitats sampled
Single Multiple Totals
1 riffle–pool sequence
.1 riffle–pool sequence
Multiple channel widths
Fixed length of stream
Other
Totals
15(26.8)
2(3.6)3
(5.4)9
(16.1)0
(0)29
(51.8)
5(8.9)3
(5.4)5
(8.9)9
(16.1)5
(8.9)27
(48.2)
20(35.7)
5(8.9)8
(14.3)18
(32.1)5
(8.9)56
(100.0)
was a single riffle–pool sequence (35.7% or 20/56, Table 2); samples were composited over mul-tiple riffle–pool sequences by 8.9% (5/56) of theprograms. The 2nd most common method wasto collect the sample over a fixed length ofstream (32.1% or 18/56), such as 100 m. Only14.3% (8/56) of the programs defined the sec-tion of stream to be sampled using multiples ofthe channel’s width. When the section of streamover which the sample was collected exceeded1 riffle–pool sequence, 2.8 riffle–pool sequences,30 channel widths, or 126 m in fixed-channellength were the average lengths sampled.
The number of programs that based theirsample on a composite from a single habitattype collected within a single riffle–pool se-quence (15/20) was almost equal to those thatformed a composite from a single habitat typeover a section of stream greater than a singleriffle–pool sequence (14/20). The distances overwhich samples were collected that exceeded asingle riffle–pool sequence were longer than weexpected and likely reflected attempts to avoidthe atypical patterns possible if only a singlehabitat was examined from a single riffle–poolsequence, a topic that has been discussed as partof the pseudoreplication issue (Hurlbert 1984).Programs that sample macroinvertebrates overthe same length of stream from which they sam-ple fish and/or assess habitat also may selectlarger distances.
Habitats sampled. Most sampling designsconfined sampling to a single habitat type(63.4% or 52/82). Sampling only riffles (25.6%
or 21/82), followed by sampling ‘‘fast waterhabitats’’ (riffles and runs, 24.4% or 20/82),were the most common individual habitats sam-pled. However, 23% (19/82) of the programs at-tempted to sample all available individual hab-itats, usually in proportion to their occurrence(14.6% or 12/82). Riffle/run areas offer somelevel of standardization in terms of habitat strat-ification, which facilitates comparisons amongsites. Also, these habitats are usually consideredareas of highest species richness in riffle–pooldominated streams. Such stratification may re-duce variation for intersite comparisons (Reshand Jackson 1993), but also may exaggerate dif-ferences if the strata are actually differentamong sites.
Collecting macroinvertebrates by samplinghabitats in proportion to their occurrence formsa sample that is more representative of the or-ganisms (and habitats) present in the sampledreach than collecting from a single habitat.However, replicability and, consequently, com-parability among sites depends on the methodused to define the % of individual habitats pre-sent in a reach, and is most likely operator de-pendent. Collecting from all available habitatsproduces a sample that contains more speciesand more life-history stages than collecting asample from only a single habitat type; how-ever, sampling multiple habitats in proportionto their % cover may be more difficult to stan-dardize than collecting from a single habitattype.
Placement of sampling devices. In what is cer-
664 [Volume 20J. L. CARTER AND V. H. RESH
tainly a departure from traditional randomsampling, most state programs chose the spotto place the sampling device by using ‘‘expertopinion’’ (70.6% or 60/85) and rarely (4.7% or4/85) by using random techniques (e.g., with arandom numbers table and a mapped grid). Ex-pert choice of a collecting location may lead tolower replicability among collectors (unless cri-teria are detailed and those choosing locationshave sufficient training or experience). Errors injudgment about best spots also could rank 2 sitesas being different or similar when they are not,simply because judgments about what are therichest sampling locations can be different. Al-though using expert opinion to choose samplinglocations may maximize the number of speciescollected, it also may compromise the ability toobtain unbiased estimates of the relative com-position of individual taxa or functional feedinggroups among sites.
Nevertheless, the bias resulting from pur-posely choosing a sampling location is inten-tional: the programs using this approach are de-signed to collect in microhabitats with the high-est species richness. Personnel thoroughlytrained in the habitat requirements of benthicmacroinvertebrates will most likely collect asample that better represents the taxa present ata site by collecting expertly than by collectingrandomly given the fixed, limited effort (fixedarea sampled, fixed time for sampling, etc.) persite that is characteristic of most bioassessmentsampling protocols.
Replicates. Over ½ of the programs (56.1% or46/82) collected replicates, with a mean of 2.3replicates collected per site. However, most pro-grams (67.4% or 31/46) collected only a singlesample per site. The lack of sample replicationin almost ½ of the programs is a major depar-ture from sampling approaches in traditionalbenthic studies to assess pollution effects (Reshand McElravy 1993).
The question of replication has been hotly de-bated since the earliest day of benthic macroin-vertebrate studies (Needham and Usinger 1956,Chutter and Noble 1966, Resh 1979) and contin-ues to the present (Norris and Georges 1993,Norris et al. 1995, Merritt and Cummins 1996).In the studies reviewed by Resh and McElravy(1993), 3 to 5 replicates typically were taken. Thesurvey of Winterbourn (1985) indicated that n #5 was the most common choice, and that allstudies had at least some replication. Our sur-
vey indicated that if replicates were not collect-ed at all sites, they often were collected at a %of the sites (2.5–55% of sites examined). More-over, 45.7% (21/46) of the programs reportedcollecting replicates at 10% of the sites, as rec-ommended by Plafkin et al. (1989) and Barbouret al. (1999). Although many programs collectedreplicates, they were often only collected forQuality Assurance/Quality Control, and gen-erally were not processed and used in analyses.
Field Processing
Field sorting. Sorting (i.e., removing organ-isms from the sample matrix) was restricted tothe field in 22.9% (19/83) of the programs and,of these, 26.3% (5/19) sorted a fixed number oforganisms. The number of organisms rangedfrom 100 to 300, with a mean of 150. Seventy-five percent (12/16) of the programs that reliedentirely on field sorting selected specimens tomaximize an estimate of faunal richness. Two ofthese programs only sorted Ephemeroptera,Plecoptera, and Trichoptera (EPTs). Three pro-grams with intensive field collections followedby laboratory processing also reported havingreconnaissance programs where macroinverte-brates were only sorted in the field (some ofthese procedures were similar to the RBP-I pro-tocol of Plafkin et al. 1989 or the BioRecon ofBarbour et al. 1999).
Field sorting for assessing richness is highlydependent on an ability to distinguish amongclosely related taxa, and larger and smaller in-dividuals of the same taxon, and is affected byambient environmental factors (e.g., availablelight, weather conditions). Inconsistency amongsorters is likely quite high, and quality controlis also difficult. Clearly, field sorting to maxi-mize faunal diversity is easier done than fieldsorting to produce proportionally representativecounts of specific groups. The bias will be onlarge and/or rapidly moving taxa when sortinglive material.
Preliminary field processing. Of the groupsthat relied on sample processing in the labora-tory, many removed large organic debris andstones (49.2% or 32/65) in the field, and somealso elutriated (separated less dense organic ma-terial from more dense inorganic material) sam-ples (20.0% or 13/65). In contrast, some pro-grams did no field processing (27.7% or 18/65),and took the entire sample back to the labora-
2001] 665BRIDGES
tory. However, in ½ of these cases, artificial sub-strates were used, and the samples probablycontained less extraneous detritus than kick-type samples.
The advantages of doing at least some pro-cessing in the field are to: 1) reduce the amountof material brought back (a particularly impor-tant problem if samples must be carried longdistances); 2) enhance preservation of samples;3) reduce damage to organisms; and 4) lessenlaboratory sorting time. Undoubtedly, speci-mens are lost during field processing and atleast some under-representation results fromspecimens adhering to discarded debris or fromspecimens remaining in the inorganic substratefollowing elutriation (e.g., cased caddisflies andmollusks).
Field sieving. Most (56.7% or 38/67) respon-dents used sieves in the field to process sam-ples. All programs reported using a sieve thatwas less than or equal to the size of the meshused for collecting. Most programs (89.5% or34/38) only used the specimens retained on thesieves in their analyses.
Subsampling in the field. Field subsamplingtypically was not done by most programs. Ofthe 6 programs that subsampled in the field, 1took ¼ of the sample, 2 took random subsam-ples from a gridded tray, and 3 took a certain% of the specimens collected. Given the largearea (x 5 1.7 m2) over which specimens werecollected by many programs, it was surprisingthat more programs did not subsample in thefield.
If intersite comparisons are based on a fixedsample area, comparisons may be compromisedif a program reduces sample volume by a vari-able amount among sites because richness is afunction of area. However, because most pro-grams only identified macroinvertebrates froma very small subsample of the original sample,the loss of some portion of the sample by fieldsubsampling may have little effect.
Preservatives. Most programs (64.1% or 50/78) preserved samples with ethyl alcohol, in aconcentration range of 70 to 100% (x 5 85%).Some programs (17.9% or 14/78) used formalin.The mean concentration of formalin used was10% and ranged from 5 to 30%.
It has long been known that alcohol preser-vatives cause a weight loss in specimens col-lected (e.g., Leonard 1939), but ethyl alcohol hasbenefits that make its use popular: it is relatively
inexpensive, widely available, and less unpleas-ant to use than formalin. It does, however, needto be periodically changed. The weight-loss is-sue is probably of minor importance becausefew programs use standing stock or biomass (orcalculate secondary production estimates) as de-scriptors of macroinvertebrate communities.Conversely, not all organisms are best preservedinitially in ethanol. For example, buffered for-malin is the preferred initial preservative for ol-igochaetes because they tend to degrade if theyare first preserved in alcohol (Klemm 1985).
The safe disposal of preservatives is a concernof industrial hygiene managers. Most of the re-spondents (64.5% or 49/76) disposed of preser-vatives by pouring them down the drain. Thismethod of disposal is possible for some preser-vatives (e.g., ethyl alcohol with sufficient dilu-tion), but not with others (e.g., formalin). Only21.2% (16/76) of the programs used a hazard-ous waste processor to dispose of preservatives.
Laboratory processing
Subsampling. Only 26.3% (19/72) of the re-spondents sorted all the organisms from a sam-ple. Most (73.6% or 53/72) sorted a subsampleof the entire sample. This result differed sub-stantially from an earlier survey by Resh et al.(1985) in which ;½ of the respondents sortedall of the invertebrates from a sample. However,the mean area sampled by respondents in theResh et al. (1985) survey was ;0.1 m2, over anorder of magnitude smaller than the mean areasampled by the respondents to the presentstudy (Fig. 3). Large-volume samples necessitatesubsampling to make sample processing moreeconomical. Little consensus has been reachedon the effects of subsampling and the most ef-fective methods for subsampling (Barbour andGerritsen 1996, Courtemanch 1996, Vinson andHawkins 1996, Growns et al. 1997, Cao et al.1998, Larsen and Herlihy 1998).
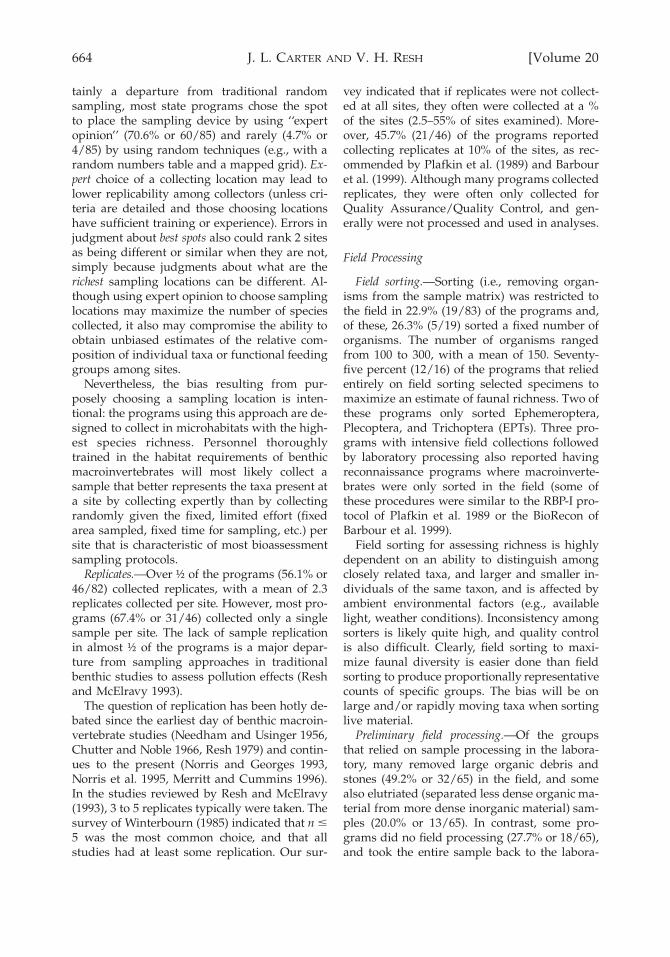
Most programs subsampled by removing afixed number of organisms, usually from 100 to550 organisms (Fig. 4). A 100-organism subsam-ple was the most common number (53.5% or23/43 of the programs). The fixed number fre-quency distribution was somewhat bimodal be-cause 300 organisms were subsampled in 25.6%of the protocols (Fig. 4). Eight programs sub-sampled by sorting a fixed proportion (most of-ten ¼) of the original sample. The device most
666 [Volume 20J. L. CARTER AND V. H. RESH
FIG. 4. Percentage (above each bar) of programs subsampling a fixed number of organisms from a sample(n 5 43).
commonly used for subsampling was a griddedtray or frame (Caton 1991, Moulton et al. 2000).Only 2 programs reported using an Imhoff cone(Wrona et al. 1982) for subsampling. Of the 43programs that reported subsampling by acquir-ing a fixed number of organisms, 95% reportedthat they selected subsamples randomly.
Some programs (35.7% or 25/70) subsampledfurther when extremely abundant taxa werepresent. The taxonomic groups most often cho-sen for this procedure were chironomids and ol-igochaetes, but several respondents stated thatthey further subsampled any taxon that wasabundant enough to limit economical process-ing.
Sorting large/rare organisms. Vinson andHawkins (1996) reported that sorting large/rareorganisms increased estimated richness by;28%. In our study, 53% (26/49) of respondentssorted large/rare organisms (e.g., see tech-niques presented in Vinson and Hawkins 1996,Moulton et al. 2000) from the sample. Of the 26programs that sorted large/rare organisms,35% sorted them before subsampling the origi-nal sample and 65% sorted them from the re-mainder of the sample after the subsample(s)was removed. Twenty-three programs did notsort large/rare organisms from the sample dur-ing any part of the processing. Although sub-
sampling randomly is less biased than sortinglarge/rare organisms, it seems reasonable tosort large/rare organisms in the laboratory, par-ticularly when samples are collected using ‘‘ex-pert opinion’’ to maximize estimated richness.
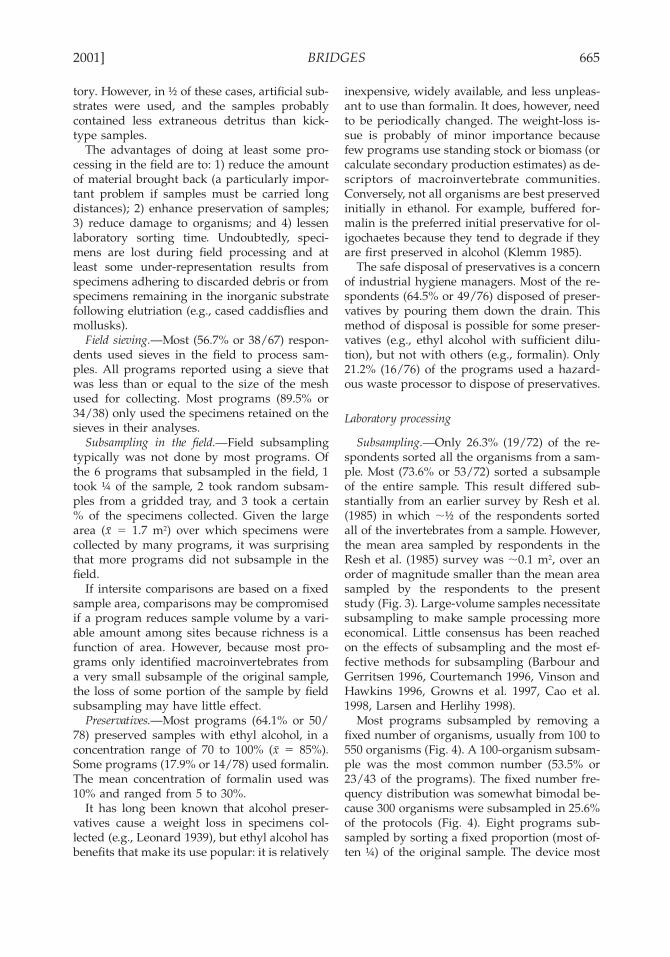
Magnifications used for sorting. The magnifi-cation used for sorting macroinvertebrates inthe laboratory ranged from 1 (sorting by eye) to303 (Fig. 5). Although a modal magnification of103 was used by 32.8% (22/67) of the pro-grams, ;21% only sorted by eye. Furthermore,.50% of the programs used #53 magnification.Two respondents stated that they only sortedorganisms that were greater than a given size(0.5 mm for one program and 1.2 mm for theother). If the objective is to sort all organismscollected, sorting by eye will result in fewer or-ganisms being removed than when sorting un-der higher magnification.
Taxonomic levels generally used in studies. Thelevel of identifications for studies using the ben-thic community as an indicator of impairmentis contentious. One view maintains that the low-est possible levels are necessary (i.e., species orthe lowest possible taxon, usually a combinationof genus and species levels) and the other viewmaintains that higher levels are sufficient (e.g.,family) either because of similar informationcontent at low and high levels or because of cost
2001] 667BRIDGES
FIG. 5. Percentage (above each bar) of magnifications used in the laboratory for sorting macroinvertebrates(n 5 67).
considerations. The answer to this issue de-pends on several factors, some of which are in-trinsic to the study area and objective. For ex-ample, is the taxa richness in an area low (sothat families may only be represented by a sin-gle species) or high (having many confamilialsand congenerics)? What is the geographic extentof the study? Is the level of impairment expect-ed to be large or small?
The type of analysis planned also influencesthis decision. For example, multivariate analysesprobably show similar patterns between speciesand higher taxonomic levels because rare taxaare eliminated from an analysis (Lenat andResh 2001). In reality, the laboratory procedureof counting fixed numbers of organisms (e.g.,100) has the same effect as deliberately remov-ing or reducing rare taxa from an analysis, par-ticularly if large/rare organisms are not sorted.Bailey et al. (2001) and Lenat and Resh (2001)discuss the pros and cons of various taxonomicresolution issues.
Even though there is much discussion on lev-els of identification to be used, it is clear thatmost US benthic macroinvertebrate biomonitor-ing programs use finer rather than coarser res-olution in this regard. Typically, macroinverte-brates are identified to genus (41% or 30/73),genus and species (24.7% or 18/73), or species
(17.8% or 13/73). Only 16.4% (12/73) listedfamily level as typical, and 2 of these describedthis level as appropriate for reconnaissancestudies.
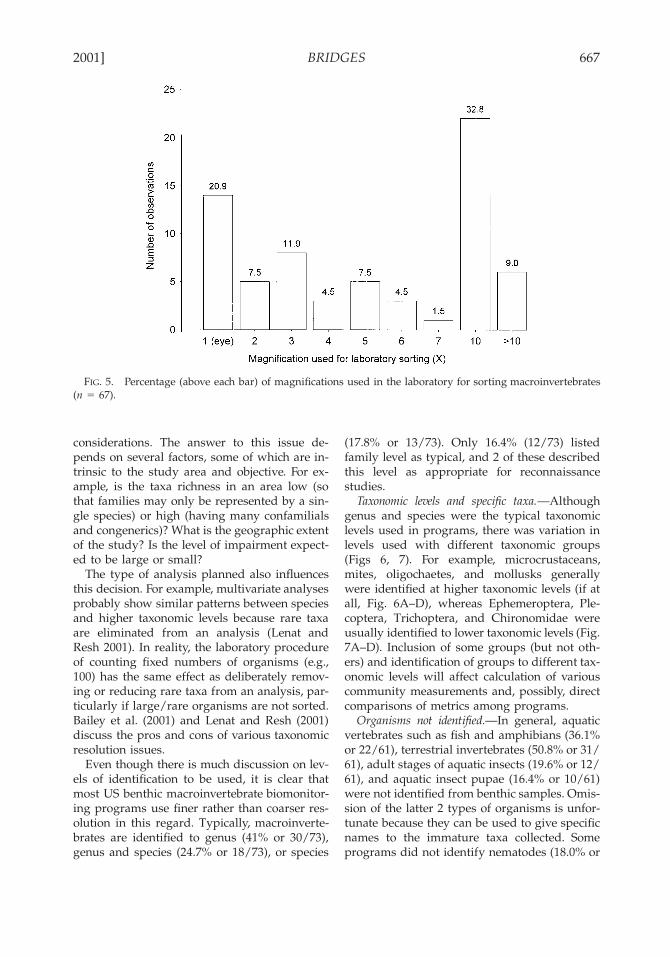
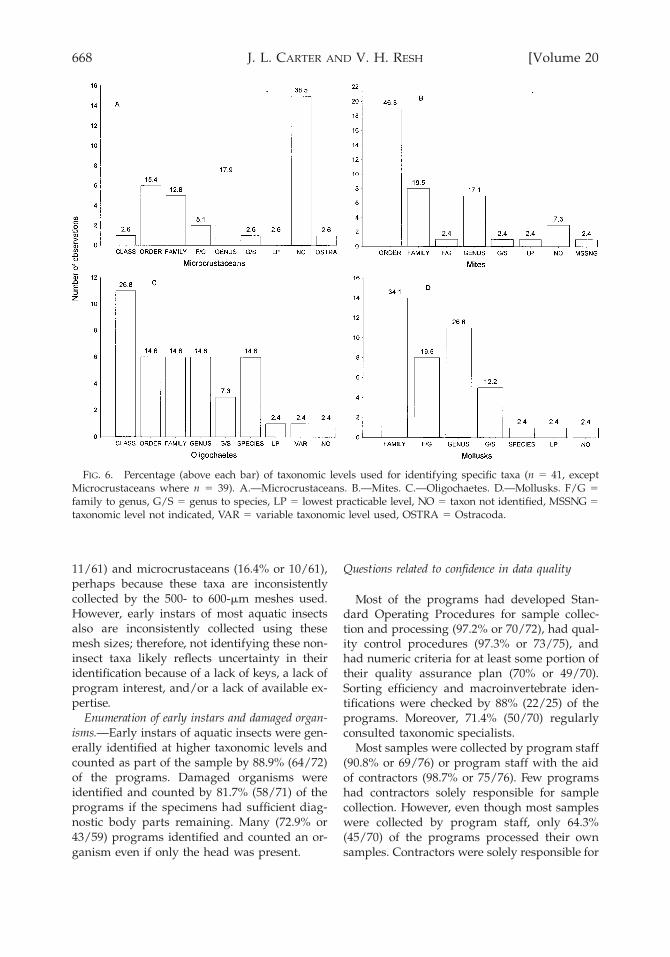
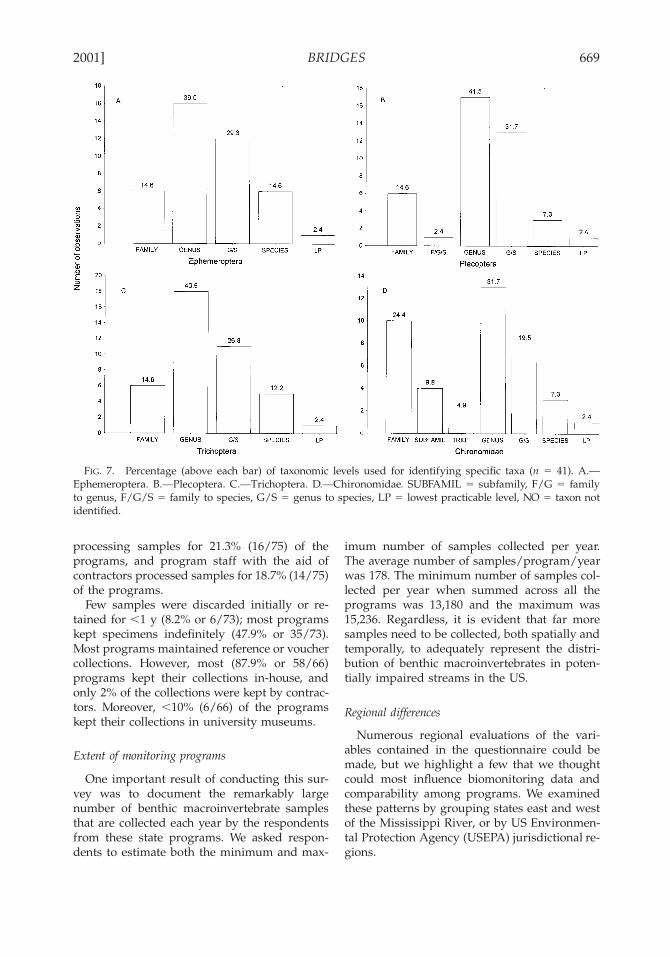
Taxonomic levels and specific taxa. Althoughgenus and species were the typical taxonomiclevels used in programs, there was variation inlevels used with different taxonomic groups(Figs 6, 7). For example, microcrustaceans,mites, oligochaetes, and mollusks generallywere identified at higher taxonomic levels (if atall, Fig. 6A–D), whereas Ephemeroptera, Ple-coptera, Trichoptera, and Chironomidae wereusually identified to lower taxonomic levels (Fig.7A–D). Inclusion of some groups (but not oth-ers) and identification of groups to different tax-onomic levels will affect calculation of variouscommunity measurements and, possibly, directcomparisons of metrics among programs.
Organisms not identified. In general, aquaticvertebrates such as fish and amphibians (36.1%or 22/61), terrestrial invertebrates (50.8% or 31/61), adult stages of aquatic insects (19.6% or 12/61), and aquatic insect pupae (16.4% or 10/61)were not identified from benthic samples. Omis-sion of the latter 2 types of organisms is unfor-tunate because they can be used to give specificnames to the immature taxa collected. Someprograms did not identify nematodes (18.0% or
668 [Volume 20J. L. CARTER AND V. H. RESH
FIG. 6. Percentage (above each bar) of taxonomic levels used for identifying specific taxa (n 5 41, exceptMicrocrustaceans where n 5 39). A.—Microcrustaceans. B.—Mites. C.—Oligochaetes. D.—Mollusks. F/G 5family to genus, G/S 5 genus to species, LP 5 lowest practicable level, NO 5 taxon not identified, MSSNG 5taxonomic level not indicated, VAR 5 variable taxonomic level used, OSTRA 5 Ostracoda.
11/61) and microcrustaceans (16.4% or 10/61),perhaps because these taxa are inconsistentlycollected by the 500- to 600-mm meshes used.However, early instars of most aquatic insectsalso are inconsistently collected using thesemesh sizes; therefore, not identifying these non-insect taxa likely reflects uncertainty in theiridentification because of a lack of keys, a lack ofprogram interest, and/or a lack of available ex-pertise.
Enumeration of early instars and damaged organ-isms. Early instars of aquatic insects were gen-erally identified at higher taxonomic levels andcounted as part of the sample by 88.9% (64/72)of the programs. Damaged organisms wereidentified and counted by 81.7% (58/71) of theprograms if the specimens had sufficient diag-nostic body parts remaining. Many (72.9% or43/59) programs identified and counted an or-ganism even if only the head was present.
Questions related to confidence in data quality
Most of the programs had developed Stan-dard Operating Procedures for sample collec-tion and processing (97.2% or 70/72), had qual-ity control procedures (97.3% or 73/75), andhad numeric criteria for at least some portion oftheir quality assurance plan (70% or 49/70).Sorting efficiency and macroinvertebrate iden-tifications were checked by 88% (22/25) of theprograms. Moreover, 71.4% (50/70) regularlyconsulted taxonomic specialists.
Most samples were collected by program staff(90.8% or 69/76) or program staff with the aidof contractors (98.7% or 75/76). Few programshad contractors solely responsible for samplecollection. However, even though most sampleswere collected by program staff, only 64.3%(45/70) of the programs processed their ownsamples. Contractors were solely responsible for
2001] 669BRIDGES
FIG. 7. Percentage (above each bar) of taxonomic levels used for identifying specific taxa (n 5 41). A.—Ephemeroptera. B.—Plecoptera. C.—Trichoptera. D.—Chironomidae. SUBFAMIL 5 subfamily, F/G 5 familyto genus, F/G/S 5 family to species, G/S 5 genus to species, LP 5 lowest practicable level, NO 5 taxon notidentified.
processing samples for 21.3% (16/75) of theprograms, and program staff with the aid ofcontractors processed samples for 18.7% (14/75)of the programs.
Few samples were discarded initially or re-tained for ,1 y (8.2% or 6/73); most programskept specimens indefinitely (47.9% or 35/73).Most programs maintained reference or vouchercollections. However, most (87.9% or 58/66)programs kept their collections in-house, andonly 2% of the collections were kept by contrac-tors. Moreover, ,10% (6/66) of the programskept their collections in university museums.
Extent of monitoring programs
One important result of conducting this sur-vey was to document the remarkably largenumber of benthic macroinvertebrate samplesthat are collected each year by the respondentsfrom these state programs. We asked respon-dents to estimate both the minimum and max-
imum number of samples collected per year.The average number of samples/program/yearwas 178. The minimum number of samples col-lected per year when summed across all theprograms was 13,180 and the maximum was15,236. Regardless, it is evident that far moresamples need to be collected, both spatially andtemporally, to adequately represent the distri-bution of benthic macroinvertebrates in poten-tially impaired streams in the US.
Regional differences
Numerous regional evaluations of the vari-ables contained in the questionnaire could bemade, but we highlight a few that we thoughtcould most influence biomonitoring data andcomparability among programs. We examinedthese patterns by grouping states east and westof the Mississippi River, or by US Environmen-tal Protection Agency (USEPA) jurisdictional re-gions.

670 [Volume 20J. L. CARTER AND V. H. RESH
FIG. 8. Range of mesh sizes (mm) used by $1 methods for collecting benthic macroinvertebrates withineach US Environmental Protection Agency region.
Mesh size differences, even within a region,varied greatly (Fig. 8). From an east–west per-spective, mesh sizes used for collecting weresignificantly larger in the east (x 5 628 6 143.3SD, n 5 49) than in the west (x 5 548 6 118.5SD, n 5 32).
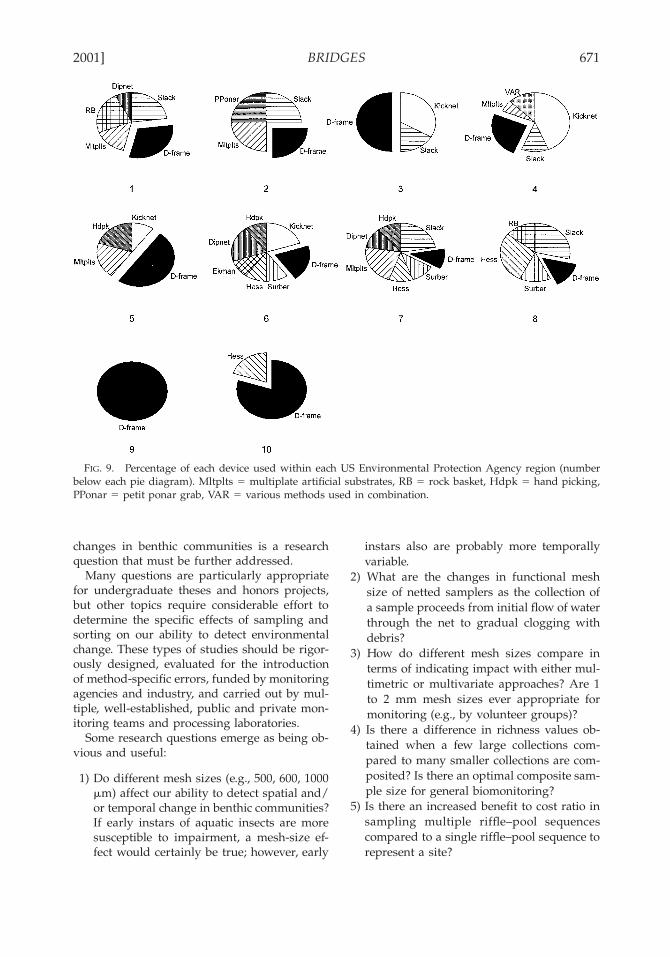
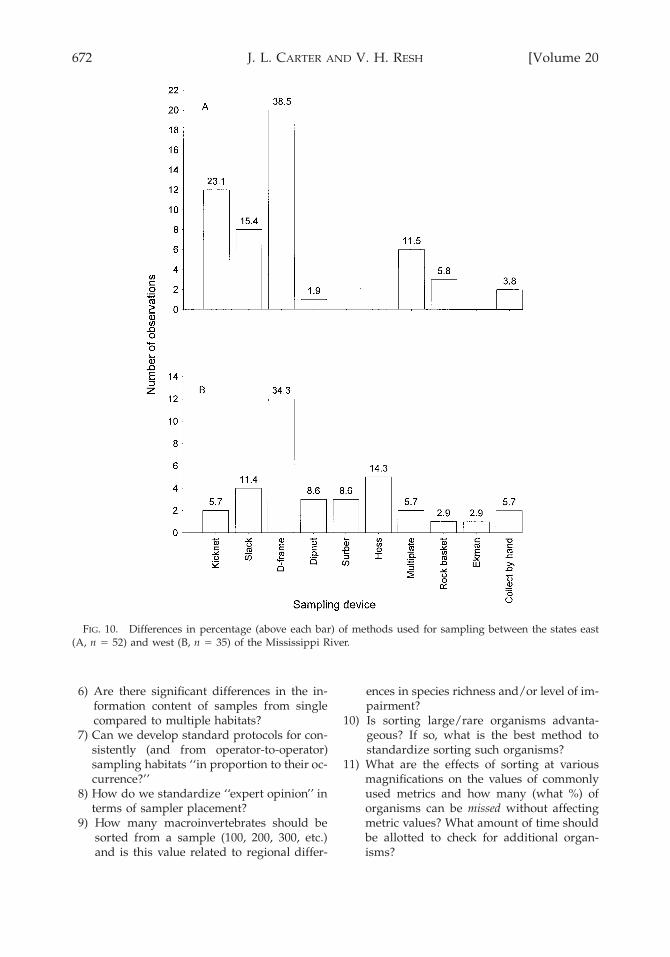
Sampling devices varied greatly from regionto region (Fig. 9); the D-frame net was the onlydevice used within all 10 USEPA regions. The 1m kicknet was used far more often by programsin the east than in the west, and fixed-quadratsamplers were used in the west but not in theeast (Fig. 10).
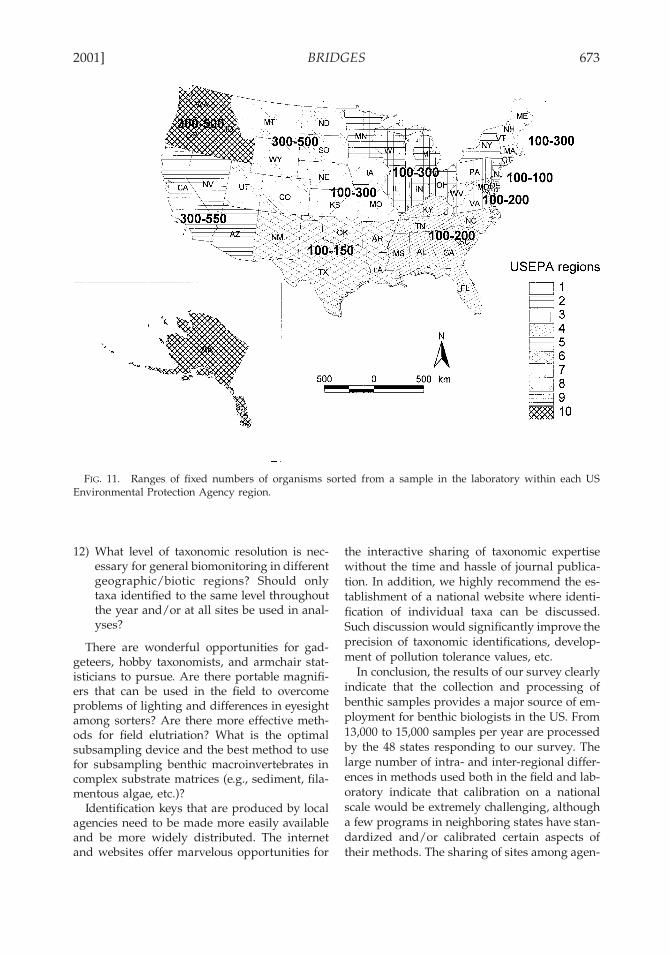
Differences in the number of organisms sort-ed per sample ranged from 0 (all programswithin a region sorted the same number of or-ganisms) to 250 (Fig. 11). In general, most(72.7% or 16/22) programs in the east sorted100 organisms, whereas in the west most (62%or 9/21) programs sorted $300 organisms (Fig.12).
Differences in methods between the easternand western states probably resulted because
bioassessment protocols were established earlierin the east than in the west, and some westernstates developed protocols independently ofeastern programs.
Conclusion
Although methodological research in fresh-water benthic science is not often a popular re-search topic, the need for rigorous, well-de-signed additional studies of sampling and sort-ing procedures is evident from the results ofthis survey. A few recent studies have ad-dressed some of these topics: subsampling (Bar-bour and Gerritsen 1996, Courtemanch 1996,Vinson and Hawkins 1996); field sampling andsubsampling (Growns et al. 1997, Larsen andHerlihy 1998, Rabeni et al. 1999); and taxonomicresolution (Hewlett 2000, Bailey et al. 2001, Len-at and Resh 2001). However, specific compari-sons of currently used techniques to determinewhether and/or how differences in methods af-fect our ability to detect spatial and temporal
2001] 671BRIDGES
FIG. 9. Percentage of each device used within each US Environmental Protection Agency region (numberbelow each pie diagram). Mltplts 5 multiplate artificial substrates, RB 5 rock basket, Hdpk 5 hand picking,PPonar 5 petit ponar grab, VAR 5 various methods used in combination.
changes in benthic communities is a researchquestion that must be further addressed.
Many questions are particularly appropriatefor undergraduate theses and honors projects,but other topics require considerable effort todetermine the specific effects of sampling andsorting on our ability to detect environmentalchange. These types of studies should be rigor-ously designed, evaluated for the introductionof method-specific errors, funded by monitoringagencies and industry, and carried out by mul-tiple, well-established, public and private mon-itoring teams and processing laboratories.
Some research questions emerge as being ob-vious and useful:
1) Do different mesh sizes (e.g., 500, 600, 1000mm) affect our ability to detect spatial and/or temporal change in benthic communities?If early instars of aquatic insects are moresusceptible to impairment, a mesh-size ef-fect would certainly be true; however, early
instars also are probably more temporallyvariable.
2) What are the changes in functional meshsize of netted samplers as the collection ofa sample proceeds from initial flow of waterthrough the net to gradual clogging withdebris?
3) How do different mesh sizes compare interms of indicating impact with either mul-timetric or multivariate approaches? Are 1to 2 mm mesh sizes ever appropriate formonitoring (e.g., by volunteer groups)?
4) Is there a difference in richness values ob-tained when a few large collections com-pared to many smaller collections are com-posited? Is there an optimal composite sam-ple size for general biomonitoring?
5) Is there an increased benefit to cost ratio insampling multiple riffle–pool sequencescompared to a single riffle–pool sequence torepresent a site?
672 [Volume 20J. L. CARTER AND V. H. RESH
FIG. 10. Differences in percentage (above each bar) of methods used for sampling between the states east(A, n 5 52) and west (B, n 5 35) of the Mississippi River.
6) Are there significant differences in the in-formation content of samples from singlecompared to multiple habitats?
7) Can we develop standard protocols for con-sistently (and from operator-to-operator)sampling habitats ‘‘in proportion to their oc-currence?’’
8) How do we standardize ‘‘expert opinion’’ interms of sampler placement?
9) How many macroinvertebrates should besorted from a sample (100, 200, 300, etc.)and is this value related to regional differ-
ences in species richness and/or level of im-pairment?
10) Is sorting large/rare organisms advanta-geous? If so, what is the best method tostandardize sorting such organisms?
11) What are the effects of sorting at variousmagnifications on the values of commonlyused metrics and how many (what %) oforganisms can be missed without affectingmetric values? What amount of time shouldbe allotted to check for additional organ-isms?
2001] 673BRIDGES
FIG. 11. Ranges of fixed numbers of organisms sorted from a sample in the laboratory within each USEnvironmental Protection Agency region.
12) What level of taxonomic resolution is nec-essary for general biomonitoring in differentgeographic/biotic regions? Should onlytaxa identified to the same level throughoutthe year and/or at all sites be used in anal-yses?
There are wonderful opportunities for gad-geteers, hobby taxonomists, and armchair stat-isticians to pursue. Are there portable magnifi-ers that can be used in the field to overcomeproblems of lighting and differences in eyesightamong sorters? Are there more effective meth-ods for field elutriation? What is the optimalsubsampling device and the best method to usefor subsampling benthic macroinvertebrates incomplex substrate matrices (e.g., sediment, fila-mentous algae, etc.)?
Identification keys that are produced by localagencies need to be made more easily availableand be more widely distributed. The internetand websites offer marvelous opportunities for
the interactive sharing of taxonomic expertisewithout the time and hassle of journal publica-tion. In addition, we highly recommend the es-tablishment of a national website where identi-fication of individual taxa can be discussed.Such discussion would significantly improve theprecision of taxonomic identifications, develop-ment of pollution tolerance values, etc.
In conclusion, the results of our survey clearlyindicate that the collection and processing ofbenthic samples provides a major source of em-ployment for benthic biologists in the US. From13,000 to 15,000 samples per year are processedby the 48 states responding to our survey. Thelarge number of intra- and inter-regional differ-ences in methods used both in the field and lab-oratory indicate that calibration on a nationalscale would be extremely challenging, althougha few programs in neighboring states have stan-dardized and/or calibrated certain aspects oftheir methods. The sharing of sites among agen-

674 [Volume 20J. L. CARTER AND V. H. RESH
FIG. 12. Differences in percentage (above each bar) of fixed numbers of organisms removed during samplesorting in the laboratory between the states east (A, n 5 22) and west (B, n 5 21) of the Mississippi River.
cies, and maintaining regional/national vouchercollections and identification keys can makebioassessments more accurate and more effi-cient.
Well-designed tests of the most commonlyused sampling and processing methods to de-termine whether the effects introduced by dif-ferences in methods significantly influence theinterpretation of benthic macroinvertebrate dataare needed. As a starting point, answers to the12 questions listed above would allow more in-
formed decisions to be made by biomonitoringresearchers on the most appropriate method touse for monitoring using macroinvertebrates,and increase national comparability among pro-grams.
Acknowledgements
We thank all the state biologists and manag-ers for the time and effort they put into com-pleting our questionnaire. We also thank Mi-

2001] 675BRIDGES
chael Barbour, Steve Fend, Mike Miller, SteveMoulton, Terry Short, and James Stribling fortheir helpful comments and suggestions on anearlier version of this manuscript.
Literature Cited
BAILEY, R. C., R. H. NORRIS, AND T. B. REYNOLDSON.2001. Taxonomic resolution of benthic macroin-vertebrate communities in bioassessments. Jour-nal of the North American Benthological Society20:280–286.
BARBOUR, M. T., AND J. GERRITSEN. 1996. Subsamplingof benthic samples: a defense of the fixed-countmethod. Journal of the North American Benthol-ogical Society 15:386–391.
BARBOUR, M. T., J. GERRITSEN, B. D. SNYDER, AND J. B.STRIBLING. 1999. Rapid bioassessment protocolsfor use in streams and wadeable rivers: periphy-ton, benthic macroinvertebrates and fish, 2nd edi-tion. EPA 841-B-99-002. Office of Water, US En-vironmental Protection Agency, Washington, DC.
CAO, Y., D. D. WILLIAMS, AND N. E. WILLIAMS. 1998.How important are rare species in aquatic com-munity ecology and bioassessment? Limnologyand Oceanography 47:1403–1409.
CATON, L. W. 1991. Improving subsampling methodsfor the EPA ‘‘Rapid Bioassessment’’ benthic pro-tocols. Bulletin of the North American Benthol-ogical Society 8:317–319.
CHUTTER, F. M., AND R. G. NOBLE. 1966. The reliabilityof a method of sampling stream invertebrates. Ar-chiv fur Hydrobiologie 62:95–103.
COURTEMANCH, D. L. 1996. Commentary on the sub-sampling procedures used for rapid bioassess-ments. Journal of the North American Benthol-ogical Society 15:381–385.
CUMMINS, K. W. 1962. An evaluation of some tech-niques for the collection and analysis of benthicsamples with special emphasis on lotic waters.American Midland Naturalist 67:477–504.
DAVIS, W. S., B. D. SNYDER, J. B. STRIBLING, AND C.STOUGHTON. 1996. Summary of state biologicalassessment programs for streams and wadeablerivers. EPA 230-R-96-007. Office of Policy, Plan-ning, and Evaluation, US Environmental Protec-tion Agency, Washington, DC.
DOWNING, J. A. 1984. Sampling the benthos of stand-ing waters. Pages 87–130 in J. A. Downing and F.H. Rigler (editors). A manual on methods for theassessment of secondary productivity in freshwaters. 2nd edition. IBP Handbook 17. BlackwellScientific Publications, Oxford, UK.
FRISSELL, C. A., W. J. LISS, C. E. WARREN, AND M. D.HURLEY. 1986. A hierarchical framework forstream habitat classification: viewing streams in
a watershed context. Environmental Management10:199–414.
GROWNS, J. E., B. C. CHESSMAN, J. E. JACKSON, AND D.G. ROSS. 1997. Rapid assessment of Australianrivers using macroinvertebrates: cost and efficien-cy of 6 methods of sample processing. Journal ofthe North American Benthological Society 16:682–693.
HEWLETT, R. 2000. Implications of taxonomic resolu-tion and sample habitat for stream classificationat a broad geographic scale. Journal of the NorthAmerican Benthological Society 19:352–361.
HORNIG, C. E., AND J. E. POLLARD. 1978. Macroinver-tebrate sampling techniques for streams in semi-arid regions. EPA-600/4-78-040. Office of Re-search and Development, Environmental Moni-toring and Support Laboratory, US Environmen-tal Protection Agency, Las Vegas, Nevada.
HURLBERT, S. H. 1984. Pseudoreplication and the de-sign of ecological field experiments. EcologicalMonographs 54:187–211.
HURYN, A. D., AND J. B. WALLACE. 2000. Life historyand production of stream insects. Annual Reviewof Entomology 45:83–110.
KLEMM, D. J. (EDITOR). 1985. A guide to the freshwaterAnnelida (Polychaeta, naidid and tubificid Oli-gochaeta, and Hirudinea) of North America. Ken-dall/Hunt Publishing Company, Dubuque, Iowa.
LARSEN, D. P., AND A. T. HERLIHY. 1998. The dilemmaof sampling streams for macroinvertebrate rich-ness. Journal of the North American Benthologi-cal Society 17:359–366.
LENAT, D. R., AND V. H. RESH. 2001. Taxonomy andstream ecology—The benefits of genus- and spe-cies-level identifications. Journal of the NorthAmerican Benthological Society 20:287–298.
LEONARD, J. W. 1939. Comments on the adequacy ofaccepted stream bottom sampling techniques.Transactions of the North American Wildlife andNatural Resources Conference 4:288–295.
MERRITT, R. W., AND K. W. CUMMINS (EDITORS). 1996.An introduction to the aquatic insects of NorthAmerica. Kendall/Hunt Publishing Company,Dubuque, Iowa.
MOULTON, S. R., J. L. CARTER, S. A. GROTHEER, T. F.CUFFNEY, AND T. M. SHORT. 2000. Methods ofanalysis by the US Geological Survey NationalWater Quality Laboratory—processing, taxono-my, and quality control of benthic macroinverte-brate samples. US Geological Survey Open-FileReport 00-212. US Geological Survey, Denver,Colorado.
NEEDHAM, P. R., AND R. L. USINGER. 1956. Variabilityin the macrofauna of a single riffle in ProsserCreek, California, as indicated by the Surber sam-pler. Hilgardia 24:383–409.
NORRIS, R. H., AND A. GEORGES. 1993. Analysis andinterpretation of benthic macroinvertebrate sur-
676 [Volume 20J. L. CARTER AND V. H. RESH
veys. Pages 234–286 in D. M. Rosenberg and V.H. Resh (editors). Freshwater biomonitoring andbenthic macroinvertebrates. Chapman and Hall,New York.
NORRIS, R. H., E. P. MCELRAVY, AND V. H. RESH. 1995.The sampling problem. Pages 282–306 in P. Calowand G. E. Petts (editors). The rivers handbook.Blackwell Scientific Publications, Oxford, UK.
PLAFKIN, J. L., M. T. BARBOUR, K. D. PORTER, S. K.GROSS, AND R. M. HUGHES. 1989. Rapid bioas-sessment protocols for use in streams and rivers:benthic macroinvertebrates and fish. EPA/444/4-89/001. Office of Water, US Environmental Pro-tection Agency, Washington, DC.
RABENI, C. F., N. WANG, AND R. J. SARVER. 1999. Eval-uating adequacy of the representative streamreach used in invertebrate monitoring programs.Journal of the North American Benthological So-ciety 18:284–291.
RESH, V. H. 1979. Sampling variability and life historyfeatures: basic considerations in the design ofaquatic insect studies. Journal of the Fisheries Re-search Board of Canada 36:290–311.
RESH, V. H., AND J. K. JACKSON. 1993. Rapid assess-ment approaches to biomonitoring using benthicmacroinvertebrates. Pages 195–233 in D. M. Ro-senberg and V. H. Resh (editors). Freshwater bio-monitoring and benthic macroinvertebrates.Chapman and Hall, New York.
RESH, V. H., AND E. P. MCELRAVY. 1993. Contemporaryquantitative approaches to biomonitoring usingbenthic macroinvertebrates. Pages 159–194 in D.M. Rosenberg and V. H. Resh (editors). Fresh-water biomonitoring and benthic macroinverte-brates. Chapman and Hall, New York.
RESH, V. H., D. M. ROSENBERG, AND J. W. FEMINELLA.1985. The processing of benthic samples: respons-es to the 1983 NABS questionnaire. Bulletin of theNorth American Benthological Society 2:5–11.
SLACK, K. V., L. J. TILLEY, AND S. S. KENNELLY. 1991.Mesh-size effects on drift sample composition as
determined with a triple net sampler. Hydrobiol-ogia 209:215–226.
VINSON, M. R., AND C. P. HAWKINS. 1996. Effects ofsampling area and subsampling procedure oncomparisons of taxa richness among streams.Journal of the North American Benthological So-ciety 15:392–399.
VOSHELL, J. R., R. J. LAYTON, AND S. W. HINER. 1989.Field techniques for determining the effects oftoxic substances on benthic macroinvertebrates inrocky-bottom streams. Pages 134–155 in U. M.Cowgill and L. R. Williams (editors). Aquatic tox-icology and hazard assessment. Volume 12.ASTM Special Technical Publication 1027. Amer-ican Society for Testing and Materials, Philadel-phia, Pennsylvania.
WINTERBOURN, M. J. 1985. Sampling stream inverte-brates. Pages 241–258 in R. D. Pridmore and A.B. Cooper (editors). Biological monitoring infreshwaters: proceedings of a seminar, Hamilton,November 21–23, 1984, Part 2. Water and SoilMiscellaneous Publication No. 83. National Waterand Soil Conservation Authority, Wellington, NewZealand.
WRONA, F. J., J. M. CULP, AND R. W. DAVIES. 1982.Macroinvertebrate subsampling: a simplified ap-paratus and approach. Canadian Journal of Fish-eries and Aquatic Sciences 39:1051–1054.
ABOUT THE AUTHORS
Jim Carter is an aquatic ecologist with the Nation-al Research Program, Water Resources Division ofthe US Geological Survey. He studies the influenceof physical and chemical factors on community struc-ture of benthic invertebrates in streams. Vince Reshis a Professor of Entomology at the University of Cal-ifornia, Berkeley, and has taught there for 25 y. Hehas done extensive research on stream and riverbioassessment using macroinvertebrates.
Appendix. Questionnaire used for obtaining data on methods used by state agencies for collecting andprocessing benthic macroinvertebrate samples from streams.
INTRODUCTION
We are interested in determining the current methods used to collect and process benthic invertebratesamples for bioassessments and other lotic studies. To acquire these data we are polling researchers activelyinvolved in bioassessments and/or the development of bioassessment techniques. Because we are contactinga limited number of researchers for this survey, we greatly appreciate you taking the time to fill out thisquestionnaire.
Benthic sample collecting and processing varies greatly among programs and researchers; therefore, some
2001] 677BRIDGES
questions may not exactly represent your methods. However, please respond as best you can to as manyquestions as possible.
Thank you,
Jim Carter and Vince Resh
Jim CarterU.S. Geological Survey345 Middlefield Rd. MS 465Menlo Park, CA 94025USA
Vince ReshUC BerkeleyESPM/IB201 Wellman HallBerkeley, CA 94720USA
Tel: [email protected]
Tel: [email protected]
Please fill out the following information.
Name:
Organization:
Email:
Tele:
General comments about your program:
Please fill out one questionnaire for each sampling/processing protocol used by your program. A protocol forour purposes is defined as a unique combination of samplers, mesh size, habitats sampled, and field/laboratoryprocessing that are consistently applied for collecting and processing samples within a study.
SECTION A: SAMPLE COLLECTION
* * * * * * * * * * * * * * * * * * * * * * * * * * * * * * * * * * * * * * * * * * * * * * * * * *This section is designed to collect data on field sampling. We make a distinction between two commonly usedapproaches for collecting a benthic sample. We distinguish between a discrete sample and a composite sample. Adiscrete sample is defined as a sample collected from a contiguous area (e.g., a single Surber sample or a singlekick net sample). A composite sample is defined as a sample collected from a non-contiguous area (e.g., collectingseveral Surber samples (5units) within a riffle or reach and combining all of them in the field).
* * * * * * * * * * * * * * * * * * * * * * * * * * * * * * * * * * * * * * * * * * * * * * * * * *
A-I. What type of sampling device is used (e.g., Kicknet (net between 2 poles), D-frame, Surber, Box, Hess,Grabs (Ekman, Peterson, Ponar, other), Artificial Substrates (Multiplates, Rock-filled basket, other), Corer, etc.)?Please describe.
A-II. What mesh size is used during sample collection or, for artificial substrates, sampler retrieval?
(Please provide units)
678 [Volume 20J. L. CARTER AND V. H. RESH
A-III. Is the sample a composite sample as defined above? Yes NoIf yes,
A. How many ‘‘units’’ are collected per composite sample?B. What is the total area of the composite sample?
(Please provide units)
A-IV. What is the area of a single unit of the composite or single discrete sample if the sample is not acomposite? If the sample is limited by time instead of area (e.g., 3 minutes), please describe in ‘‘Other’’. (Pleasecircle only one)
A. dipnet (no area)B. ,0.09-m2 (1-ft2)C. ;0.1-m2
D. ;0.18-m2 (2-ft2)E. ;0.25-m2
F. ;0.5-m2
G. ;1.0-m2
H. .1.0-m2
I. Other (Please provide units)
A-V. Is the sample collected from a single habitat-type (e.g., riffle, pool, run, etc.)? Yes No
* * * * * * * * * * * * * * * * * * * * * * * * * * * * * * * * * * * * * * * * * * * * * * * * * *The next question addresses the length of stream over which only a composite sample is collected. If yoursample is not a composite, please go to question A-VII.* * * * * * * * * * * * * * * * * * * * * * * * * * * * * * * * * * * * * * * * * * * * * * * * * *A-VI. Please indicate which of the following lengths of stream best describe the length over which the compositeis collected. Indicate all that apply to the collection of the composite.
A. Is the composite collected within a single riffle-pool sequence? Yes NoB. Is the composite collected over a fixed number of riffle-pool sequences? Yes NoIf yes,
1. How many?C. Is the composite collected over stream lengths of multiple channel widths (e.g., 203 the channel
width)? Yes NoIf yes,
1. How many channel widths?D. Is the composite collected over a fixed length of stream? Yes NoIf yes,
1. What is the length? (Please provide units)E. Other,
* * * * * * * * * * * * * * * * * * * * * * * * * * * * * * * * * * * * * * * * * * * * * * * * * *Please answer the following three questions (A-VII through A-IX) regardless of the type of sample collected.
* * * * * * * * * * * * * * * * * * * * * * * * * * * * * * * * * * * * * * * * * * * * * * * * * *
A-VII. Please circle the method that best describes the placement of the sampling device in the habitat or areaof stream sampled.
A. Using random numbersB. Systematically (e.g., along the thalweg; at 1/3 intervals across the stream; etc.)C. Expert opinion (e.g., the area of a riffle that appears most complex and may yield the greatest number
of taxa)D. Haphazardly (i.e., no system—not even random)E. OtherPlease describe:
A-VIII. What habitat(s) are sampled? (Please circle only one)A. Riffle(s) onlyB. Pool(s) onlyC. Run/glide(s) only
2001] 679BRIDGES
D. Fast water habitats (i.e., riffles and runs)E. A composite of fast and slow water habitatsF. A composite of all habitats present in proportion to their occurrenceG. A composite of all habitats present with the same effort (equal time, equal number of sweeps, etc.) per
habitatH. Other
A-IX. Are replicates collected (replicates are defined as additional discrete samples or additional compositesamples collected at a ‘‘site’’ and processed separately—a replicate is not defined as one part of a compositesample)? Yes NoIf yes,
A. How many replicates are collected per site?B. What is the percentage of sites from which replicates are collected? %
SECTION B: FIELD PROCESSING
* * * * * * * * * * * * * * * * * * * * * * * * * * * * * * * * * * * * * * * * * * * * * * * * * *Please answer all relevant questions regardless of the type of sample collected.
* * * * * * * * * * * * * * * * * * * * * * * * * * * * * * * * * * * * * * * * * * * * * * * * * *
B-I. Is the sample only sorted by eye in the field (i.e., without magnification)? Yes NoIf yes,
A. Are a fixed count of organisms chosen? Yes NoIf yes,
1. How many?B. Are only certain taxa chosen (e.g., EPT)? Yes NoIf yes,
1. Which taxa are chosen?
C. Are organisms chosen to maximize the number of different taxa collected? Yes NoD. Are actual counts made of the number of individuals per taxon? Yes NoE. Are ordinal values assigned to the taxa sorted in the field (e.g., rare, common, abundant)? Yes No
* * * * * * * * * * * * * * * * * * * * * * * * * * * * * * * * * * * * * * * * * * * * * * * * * *If you answered Yes to B-I, please go to question B-V.
* * * * * * * * * * * * * * * * * * * * * * * * * * * * * * * * * * * * * * * * * * * * * * * * * *B-II. Please circle all of the statements that best fit your field procedure.
A. Absolutely no field processing is done—the entire sample is taken to the laboratory.B. The sample is elutriated in the field.C. Large organic debris and large stones are removed and discarded in the field.D. Other
B-III. Even though the sample was most likely collected with a net, is the sample further sieved in thefield? Yes NoIf yes,
A. What mesh size of sieve is used? (Please provide units)B. Are only individuals retained on the sieve used for analyses? Yes No
B-IV. Are samples subsampled in the field? Yes NoIf yes, which of the following methods is used to subsample in the field?
A. The subsample is a percentage of the total sample (e.g., 50%, 25%, etc.). Yes NoIf yes,1. Do you record the percentage taken from each sample? Yes No
If yes,a. Is the same percentage taken from each sample? Yes No
If yes,1. What percentage is taken? %

680 [Volume 20J. L. CARTER AND V. H. RESH
2. How is the percentage taken?
B. The subsample is a fixed count of organisms. Yes NoIf yes,1. Are fixed counts of organisms randomly acquired? Yes No2. How many individuals are collected?
C. Other, please describe:
* * * * * * * * * * * * * * * * * * * * * * * * * * * * * * * * * * * * * * * * * * * * * * * * * *B-V. What preservative is used in the field (concentration)?
A. No preservative usedB. Formalin ( %)C. Ethyl Alcohol ( %)D. Isopropyl Alcohol ( %)E. Kahle’sF. Other ( %)
B-VI. How do you dispose of the preservative used in the field when you are processing the samples in thelaboratory?
SECTION C: LABORATORY PROCESSING
C-I. Are all organisms sorted from the sample? Yes NoIf yes, please go to question C-VI.If no, continue . . .* * * * * * * * * * * * * * * * * * * * * * * * * * * * * * * * * * * * * * * * * * * * * * * * * *Please answer questions C-II through C-V, if any portion of the sample is subsampled.* * * * * * * * * * * * * * * * * * * * * * * * * * * * * * * * * * * * * * * * * * * * * * * * * *C-II. Do you size fractionate your sample with sieves before sorting (or subsampling)? Yes NoIf yes,
A. What mesh size(s) is used? mmB. Are analyses performed on only those organisms retained on the sieve? Yes No
If no,1. Are the organisms that pass the sieve further subsampled? Yes No
If yes,a. What device (method) is used?
b. How many organisms are typically identified from this portion of the subsample?c. Are the organisms that passed the sieve used in analysis? Yes No
C-III. Do you subsample the sample, regardless of whether or not it is size fractionated? Yes NoIf yes, please circle and fill out A, B, or C.
A. The subsample is acquired by sorting a fixed count of organisms.1. Are subsamples randomly chosen? Yes No2. What is your target number of organisms (e.g., 50, 100, 300, etc.)?
B. The subsample is a percentage of the sample, regardless of the number of organisms the percentagecontains.1. Is the same percentage of the sample always sorted (e.g., 50%, 25%, etc.)? Yes No
If yes,a. What percentage is sorted? %

2001] 681BRIDGES
C. Other
C-IV. What device(s) or method(s) is used for subsampling the sample in the laboratory (e.g., gridded tray,Folsom plankton splitter, Imhoff cone, etc.)?
C-V. In addition to acquiring organisms for your analyses by subsampling, do you also sort out large-rareorganisms from your sample? Yes NoIf yes,
A. Do you sort out large-rare organisms from your sample before or after subsampling? Please circleone . . . Before After
B. Describe the method(s) used for acquiring these invertebrates from the sample.
* * * * * * * * * * * * * * * * * * * * * * * * * * * * * * * * * * * * * * * * * * * * * * * * * *End of subsampling section.* * * * * * * * * * * * * * * * * * * * * * * * * * * * * * * * * * * * * * * * * * * * * * * * * *C-VI. Do you have an established maximum time limit for sorting a sample? Yes NoIf yes,
A. What is your time limit?C-VII. What magnification is used when sorting a sample or subsample? (Please circle only one)
A. None (sort by eye)B. ;23C. ;33D. ;43E. ;53F. ;63G. ;73H. ;83I. ;103J. .103 Please indicate:
C-VIII. Do you subsample (or further subsample) certain extremely abundant taxa (e.g., Chironomidae) priorto identifying them to lower taxonomic levels? Yes No
If yes,A. List the taxa that are identified using the above process.
B. Describe the method used for subsampling these taxa.
C-IX. If you were asked to what taxonomic level you typically identified invertebrates—what would you respond(e.g., Order, Family, Genus, Species, etc.)?
C-X. Are certain commonly collected organisms not identified (i.e., not even recorded on the data sheet [e.g.,fish, terrestrials, adult aquatics, pupae, mites, worms, Nematoda, etc.])? Yes NoIf yes,
A. Please indicate which taxa and/or life-stages.
C-XI. To what level are the following taxa typically identified (please indicate which taxa are normally slidemounted for identification)?
A. OligochaetaB. MicrocrustaceaC. Ephemeroptera
682 [Volume 20J. L. CARTER AND V. H. RESH
D. OdonataE. PlecopteraF. HemipteraG. TrichopteraH. ColeopteraI. TipulidaeJ. SimuliidaeK. ChironomidaeL. Higher DipteraM. MitesN. MolluscaO. Other
C-XII. Additional questions regarding enumeration.A. In general, are early instars and immatures categorized at higher taxonomic levels and counted?
Yes NoB. If a fragment of an organism can be identified—is it counted? Yes No
If yes,1. Are only heads counted? Yes No
SECTION D: GENERAL QUESTIONS
D-I. Do you use specific procedures for maintaining confidence in your data quality? Yes NoIf yes,
A. Do you have a documented Standard Operating Procedure for sample collection and processing rep-resented by this questionnaire? Yes No
B. Is the laboratory processing subjected to Quality Control procedures and numeric criteria that aredocumented in a Quality Assurance plan? Yes No
C. If you answered yes to D-I., but you answered No to D-I.A. and D-I.B., do you regularly check thequality of sample sorting and invertebrate identification? Yes No
If yes, briefly describe your method:
D-II. Are taxonomic specialists regularly consulted? Yes No
D-III. Are samples collected by you and your staff or by contractors? Me Contractors
D-IV. Are samples processed by you and your staff or by contractors? Me Contractors
D-V. Sample retention and curation.A. How long are samples retained?B. Is a reference/voucher collection maintained? Yes No
If yes,1. Where is the above maintained?
2. How long is the above maintained?D-VI. Number of samples.
A. On average, how many samples do you (or your program) process per year using the protocol thisquestionnaire represents?
B. How many years have you (or your program) been processing this many samples?C. How many more years do you (or your program) expect to process this number of samples?
CONCLUSION
Thank you very much for filling out our questionnaire. The data derived from this survey will allow all of usto better define, classify, and understand current sampling and processing techniques used in bioassessmentsand other lotic studies.