breeding of sweetpotato (ipomoea batatas (l.) lam.) for
TRANSCRIPT
Breeding of sweetpotato ( Ipomoea batatas (L.) Lam.) for drought tolerance and high dry matter content in Rwanda
By
Placide Rukundo
MSc. Molecular Biology (Katholieke Universiteit Leuven, Belgium)
BSc. Biotechnology (National University of Rwanda, Rwanda)
A thesis submitted in partial fulfillment of the requirements for the degree of Doctor of Philosophy (PhD) in Plant Breeding
African Centre of Crop Improvement (ACCI)
College of Agriculture, Engineering and Science
School of Agricultural, Earth and Environmental Sciences (SAEES)
University of KwaZulu-Natal
Pietermaritzburg
Republic of South Africa
October 2015
i
Thesis abstract
Sweetpotato is the third most important root crop next to cassava and potato in Rwanda.
Drought stress remains the leading abiotic constraint to sweetpotato production in the
Southern and Eastern Provinces of the country. Therefore, development and release of
improved sweetpotato varieties incorporating end users’ preferences such as high storage
root yields and dry matter content under limited water conditions remains important for
sustainable production. The specific objectives of this research were: (i) to assess farmers’
perception, production constraints, preferences, and breeding priorities of sweetpotato in
selected agro-ecologies of Rwanda, (ii) to characterise and identify breeding parents among
54 sweetpotato genotypes grown in Rwanda, East and Central Africa, (iii) to select drought
tolerant sweetpotato genotypes under managed drought conditions using greenhouse and
in-vitro screening techniques with early and late developmental traits, (iv) to determine
general combining ability (GCA), specific combining ability (SCA) and maternal effects and
heritability of drought tolerance and yield components of among newly developed
sweetpotato clones and (v) to determine genotype x environment interaction and yield
stability of sweetpotato breeding clones recently bred in Rwanda and to identify promising
genotypes.
A participatory rural appraisal (PRA) study was carried out involving 495 farmers in eight
representative districts to identify farmers’ perception, production constraints, preferences,
and breeding priorities of sweetpotato in the Eastern, Southern and Northern Provinces of
Rwanda. Sweetpotato ranked among the five important food crops for food security and
income generation. Drought stress, unavailability of improved cultivars and planting material,
and pest and disease damage were perceived to be the five main constraints limiting
sweetpotato production. The most important sweetpotato cultivar traits were high yield, early
maturity, drought tolerance, disease and pest resistance, and good culinary taste. The
characteristics of good storage roots identified by farmers included, high dry matter content,
good culinary taste, good shape, root size, and sweetness. Each agro-ecological zone has
its own specific sweetpotato production constraints and farmers’ preferences, necessitating
targeted breeding of different sweetpotato cultivars for each agro-ecological zone for
enhanced productivity and successful adoption of cultivars.
Fifty four sweetpotato genotypes grown in Rwanda, East and Central Africa were field
evaluated to identify breeding parents. Genotypes K513261, Kwezikumwe, 8-1038 and
2005-110 had the highest flowering rate of 44.97, 20.63, 19.05, and 14.82%, respectively.
Suitable genotypes such as K513261, Purple 297, Kwezikumwe and New Kawogo were
ii
identified with high storage root yields at 31.9, 28.6, 28.2 and 27.1 t ha-1, respectively.
Genotypes Ukerewe, 2005-103, Meresiyana and Mvugamo showed the highest mean dry
matter content at 36.5, 35.5, 35.3 and 34.0%, respectively.
Greenhouse and in-vitro screening methods were compared for effective selection of
drought tolerance using 54 diverse sweetpotato genotypes. Positive correlations were
observed between vine yield and fresh weight gain; and between total biomass and fresh
weight gain, during greenhouse and in-vitro studies, respectively. The genotypes 2005-146,
4-160, 8-1038, Karibunduki, Kwezikumwe, Purple 4419, NASPOT 9 O, Nsasagatebo,
Karebe, IMBY 3102, Mwanakumi, 97-062 and Matembere were selected with comparatively
high drought tolerance using the two screening procedures. The genotypes 2005-020,
K513261, Kwezikumwe and Otada 24 were selected for high yield of storage roots, while
2005-034, 2005-110, SPK004 and Ukerewe were selected for high dry matter content, and
4-160, 8-1038, Nsasagatebo and Purple 4419 selected for high drought tolerance. The
selected genotypes have a high flowering rate and are potential parents to breed for high
yield and dry matter content of storage roots and drought tolerance.
Twelve genotypes selected for their high yield, dry matter content or drought tolerance were
crossed using a full diallel mating design. Families were field evaluated at Masoro, Karama
and Rubona Research Stations of Rwanda Agriculture Board to determine general
combining ability (GCA), specific combining ability (SCA), maternal effects and heritability of
drought tolerance, yield and yield components. The GCA effects of parents and SCA effects
of crosses were significant (P<0.01) for canopy temperature (CT), canopy wilting (CW),
storage root, vine and biomass yields, and dry matter content of storage roots. The best
general combiners for drought tolerance were the parents 8-1038, Otada 24 and 4-160 with
the lowest CT and CW and relatively high yields. Best combiners for high storage roots yield
were the parents Nsasagatebo, K513261 and Ukerewe, while Nsasagatebo, 2005-034 and
Ukerewe were the best combiners for high dry matter content. Maternal effects were
significant (P<0.05) among families for CT, CW, flesh color and dry matter content, vine yield
and total biomass. Based on reduced CT and CW, the best families with significant SCA
effects were 4-160 x Nsasagatebo, 4-160 x Ukerewe, Otada 24 x 4-160, Nsasagatebo x
2005-020, Otada 24 x Nsasagatebo, 4-160 x K513261 , 513261 x 4-160, 8-1038 x 4-160, 4-
160 x 8-1038, 8-1038 x 2005-020 and Nsasagatebo x Ukerewe, which were selected for
breeding for drought tolerance. Across sites, the best five selected families with significant
SCA effects for storage root yields were Nsasagatebo x Otada 24, Otada 24 x Ukerewe, 4-
160 x Nsasagatebo, K513261 x 2005-034 and Ukerewe x K513261 with 11.0, 9.7, 9.3, 9.2,
8.6 t/ha, respectively. The best families with high dry matter content of 36.1, 35.1, 34.3,
iii
34.0, and 33.9% were Ukerewe x 2005-034, 4-160 x Nsasagatebo, 2005-034 x Ukerewe,
2005-034 x K513261, 2005-020 x Ukerewe, in that order. The selected families are valuable
genetic resources for sweetpotato breeding for drought tolerance, yield and yield
components.
Genotype by environment interaction and yield stability of 45 selected sweetpotato breeding
clones were evaluated across six environments in Rwanda. Candidate clones designated as
clone 21 (4-160 x 2005-020), 137 (K513261 x 2005-034) and 22 (4-160 x 2005-020) had the
highest storage root yields of 38.2, 23.4 and 20.8 t ha-1, respectively. The highest dry matter
content of storage roots of 40.6, 35.9 and 32.9% were recorded in clones 21, 137 and 259
(2005-034 x 8-1038), respectively. AMMI stability values (ASV) revealed the following most
stable genotypes: Nsansagatebo, 210 (8-1038 x 4-160), 2005-110 and 456 (SPK004 x
K513261), for storage root yields and clones 46 (Kwezikumwe x 2005-020), 509 (Ukerewe x
Kwezikumwe), and 358 (Ukerewe x 8-1038) for dry matter content of storage roots. The
study identified high yielding and stable candidate sweetpotato clones such as 21, 137 and
22 (4-160 x 2005-020) for their high yields and dry matter content of storage roots. These
clones are recommended for direct production or sweetpotato breeding programmes in
Rwanda and similar environments.
In general, the study generated valuable sweetpotato families with high combining ability for
high drought tolerance, yields and dry matter content. The selected candidate sweetpotato
clones are novel genetic resources that could be released as new cultivars after stability
tests in Rwanda or similar environments.

iv
Declaration
I, Placide Rukundo , declare that:
1. The research reported in this thesis, except where otherwise indicated, is my original research.
2. The thesis has not been submitted for any degree or examination at any other university.
3. This thesis does not contain other persons’ data, pictures, graphs or other information, unless specifically acknowledged as being sourced from other persons.
4. This thesis does not contain other persons’ writing, unless specifically acknowledged as being sourced from other researchers. Where other written sources have been quoted, then:
a) Their words have been re-written but the general information attributed to them has been referenced.
b) Where their exact words have been used, their writing has been placed in italics and inside quotation marks and referenced.
5. This thesis does not contain text, graphics or tables copied and pasted from the internet, unless specifically acknowledged, and the source being detailed in the thesis and in the reference sections.
Signed:
As the candidate’s supervisors we agree to the submission of this thesis
.......................................................................................................................................
Prof. H Shimelis (Supervisor)
.......................................................................................................................................
Prof. MD Laing (Co-Supervisor)
v
Acknowledgements
The success of this study was due to the direct or indirect contributions of various people
and institutions through God willing. I wish to extend sincere acknowledgements to all as
follows:
First of all, I thank God for incredible actions for me and standing by my side all the way up
to now. It is too many to recount.
I would like to thank the Alliance for a Green Revolution in Africa (AGRA) for funding my
studies, the African Center for Crop Improvement (ACCI) for coordinating our PhD
programme and the then Institut des Sciences Agronomiques du Rwanda (ISAR) currently
the Rwanda Board of Agriculture (RAB) for providing me the study leave and facilities to
carry out field and laboratory research work.
I express my deep recognition to my late parents, François Hakizinfura and Pascasie
Mukandoli for their fundamental education and inestimable support to shape who I am today.
I recognize your value in my present achievement.
It is a pleasure to express my special appreciation to my major supervisor, Prof. Hussein
Shimelis, for his supervision and constructive guidance during my research period and thesis
write up. I recognize the contribution of my co-supervisor, Prof. Mark Laing, for support and
valuable comments. I also express my sincere thanks to my in country supervisor, Dr.
Daphrose Gahakwa for her contribution in making my study successful through moral,
technical and administrative support.
I am thankful to my lovely wife, Agrippine Musetsamfura, for her strength and
encouragement during my studies and her inestimable work of caring our darling sons,
Bruno Abayo Rukundo and Armand Bishimo Mugiha.
I can’t forget the contribution of field and laboratory technicians of the RAB sweetpotato
research programme; Ms. Aloysia Musabyima and Mr. Leonidas Nzalamba for their technical
support during data collection and field work.
I extend my sincere appreciation to other people and institutions whose names are not listed
here for their assistance in one way or another to complete successfully this hard work.
May Almighty God bless you all.
vi
Dedication
To the Almighty God,
To my wife (Agrippine) and children (Bruno and Armand),
To my late parents (François and Pascasie),
To my brothers and sisters,
To my uncle (Félicien) and to my aunt (Modeste), and
To my beloved and closest friends,
I dedicate this thesis.
vii
Table of contents
Thesis abstract....................................................................................................................... i
Declaration ............................................................................................................................iv
Acknowledgements ............................................................................................................... v
Dedication .............................................................................................................................vi
Table of contents ................................................................................................................. vii
List of figures ...................................................................................................................... xiii
List of tables ........................................................................................................................ xiv
Publications from this thesis ............................................................................................... xvii
Thesis introduction ................................................................................................................ 1
Background ................................................................................................................... 1
Constraints to sweetpotato production ........................................................................... 2
Problem statement ......................................................................................................... 3
Objectives ...................................................................................................................... 4
Thesis outline ................................................................................................................ 5
References .................................................................................................................... 5
1. Chapter One: A review of the literature ........................................................................ 8
Abstract................................................................................................................................. 8
1.1 Introduction ............................................................................................................. 8
1.2 Physiological mechanisms and conventional breeding of sweetpotato for drought-tolerance ...................................................................................................................... 11
1.2.1 Effects of drought stress .............................................................................. 11
1.2.2 Mechanisms of adaptation to drought stress in plant species ....................... 13
1.2.3 Consequences of adaptation mechanisms to drought stress ....................... 15
1.2.4 Drought stress on sweetpotato .................................................................... 15
1.3 Storage root formation, dry matter synthesis, accumulation and genetics in sweetpotato ................................................................................................................. 17
1.4 Breeding of sweetpotato ....................................................................................... 19
1.4.1 Breeding of sweetpotato for drought tolerance ............................................. 20
viii
1.4.2 Breeding of sweetpotato for high dry matter content .................................... 24
1.5 Gene action and correlation between traits ........................................................... 25
1.6 Genotype by environment (G×E) interaction and yield stability ............................. 27
1.6.1 Approaches to evaluate G×E interaction and yield stability .......................... 27
1.6.2 G×E interaction and yield stability of sweetpotato ........................................ 28
1.7 Conclusions .......................................................................................................... 29
1.8 References ........................................................................................................... 30
2. Chapter Two: Farmers’ perceptions, production and productivity constraints, preferences and breeding priorities of sweetpotato in Rwanda ........................................... 42
Abstract............................................................................................................................... 42
2.1 Introduction ........................................................................................................... 42
2.2 Materials and methods .......................................................................................... 45
2.2.1 Description of the study areas ...................................................................... 45
2.2.2 Sampling method ......................................................................................... 46
2.2.3 Data collection ............................................................................................. 46
2.2.4 Data analysis ............................................................................................... 47
2.3 Results .................................................................................................................. 47
2.3.1 Demographic description of the study areas ................................................ 47
2.3.2 Farmers’ perception and sweetpotato production ......................................... 50
2.3.3 Constraints of sweetpotato production ......................................................... 52
2.3.4 Farmers’ preferences for sweetpotato cultivars and storage root traits ........ 53
2.3.5 Sweetpotato farming practices ..................................................................... 54
2.3.6 Seasonal calendar of sweetpotato production and market ........................... 55
2.3.7 Gender and sweetpotato production ............................................................ 56
2.4 Discussion ............................................................................................................ 57
2.4.1 Use of sweetpotato for food security and income generation ....................... 57
2.4.2 Constraints to sweetpotato production ......................................................... 57
2.4.3 Attributes of good sweetpotato cultivars and storage roots .......................... 58
2.4.4 Agronomic management of sweetpotato ...................................................... 59
2.4.5 Seasonal calendar of sweetpotato production .............................................. 60
ix
2.4.6 Gender and sweetpotato production ............................................................ 61
2.5 Conclusions .......................................................................................................... 61
2.6 References ........................................................................................................... 62
3. Chapter Three: Phenotypic characterization of sweetpotato genotypes grown in Rwanda, East and Central Africa ........................................................................................ 66
Abstract............................................................................................................................... 66
3.1 Introduction ........................................................................................................... 67
3.2 Materials and Methods .......................................................................................... 68
3.2.1 Plant materials ............................................................................................. 68
3.2.2 Study sites ................................................................................................... 70
3.2.3 Experimental design and trial establishment ................................................ 70
3.2.4 Data collection ............................................................................................. 71
3.2.5 Data analysis ............................................................................................... 71
3.3 Results .................................................................................................................. 72
3.3.1 Flowering ability ........................................................................................... 72
3.3.2 Yield, yield components and dry matter content ........................................... 74
3.3.3 Genotypic relationship ................................................................................. 75
3.3.4 Principal component analysis ....................................................................... 77
3.4 Discussion ............................................................................................................ 79
3.4.1 Phenotypic traits .......................................................................................... 79
3.4.2 Genetic relationships among sweetpotato genotypes .................................. 81
3.4.3 Principal component analysis ....................................................................... 81
3.5 Conclusions .......................................................................................................... 83
3.6 References ........................................................................................................... 83
4. Chapter Four: Comparison of greenhouse and in-vitro screening of sweetpotato genotypes for drought tolerance .......................................................................................... 88
Abstract............................................................................................................................... 88
4.1 Introduction ........................................................................................................... 89
4.2 Materials and methods .......................................................................................... 91
4.2.1 Plant materials ............................................................................................. 91
4.2.2 Greenhouse experiment .............................................................................. 93
x
4.2.3 In-vitro experiment ....................................................................................... 93
4.2.4 Data collection ............................................................................................. 94
4.2.5 Data analysis ............................................................................................... 94
4.3 Results .................................................................................................................. 94
4.3.1 Greenhouse experiment .............................................................................. 94
4.3.2 In-vitro experiment ....................................................................................... 99
4.3.3 Relationship between drought tolerance parameters of greenhouse and in-vitro experiments................................................................................................. 102
4.4 Discussion .......................................................................................................... 102
4.4.1 Intensity of drought stress under greenhouse and in-vitro experiments ...... 102
4.4.2 Effects of drought stress ............................................................................ 103
4.4.3 Correlation between drought tolerance parameters during greenhouse and in-vitro experiments................................................................................................. 105
4.5 Conclusions ........................................................................................................ 105
4.6 References ......................................................................................................... 105
5. Chapter Five: Combining ability, maternal effects and heritability of drought tolerance, yield and yield components among newly developed sweetpotato clones ......................... 109
Abstract............................................................................................................................. 109
5.1 Introduction ......................................................................................................... 110
5.2 Material and methods ......................................................................................... 112
5.2.1 Plant materials ........................................................................................... 112
5.2.2 Crosses and mating design........................................................................ 113
5.2.3 Field establishment for evaluation of clonal families ................................... 114
5.2.4 Data collection ........................................................................................... 115
5.2.5 Data analysis ............................................................................................. 116
5.3 Results ................................................................................................................ 117
5.3.1 Compatibility among twelve selected sweetpotato genotypes .................... 117
5.3.2 Analysis of variance ................................................................................... 119
5.3.3 Field performance of families and parents ................................................. 120
5.4 Discussion .......................................................................................................... 128
5.4.1 Success rate of crosses, seed set and germination ................................... 128
xi
5.4.2 Performance of newly developed families and parents .............................. 128
5.4.3 Drought tolerance ...................................................................................... 129
5.4.4 Yield of storage roots ................................................................................. 130
5.4.5 Dry matter content of storage roots ............................................................ 131
5.4.6 Heritability .................................................................................................. 131
5.4.7 General and specific combining ability effects ............................................ 132
5.4.8 Maternal effect ........................................................................................... 133
5.5 Conclusions ........................................................................................................ 134
5.6 References ......................................................................................................... 134
6. Chapter Six: Genotype by environment interaction and yield stability of sweetpotato clones in Rwanda .............................................................................................................. 139
Abstract............................................................................................................................. 139
6.1 Introduction ......................................................................................................... 140
6.2 Materials and Methods ........................................................................................ 142
6.2.1 Plant materials ........................................................................................... 142
6.2.2 Description of the study sites ..................................................................... 144
6.2.3 Experimental design and field establishment ............................................. 145
6.2.4 Data collection ........................................................................................... 145
6.2.5 Data analysis ............................................................................................. 145
6.3 Results ................................................................................................................ 147
6.3.1 Analysis of variance and performance of genotypes .................................. 147
6.3.2 AMMI analysis ........................................................................................... 154
6.3.3 GGE biplot analysis ................................................................................... 158
6.4 Discussion .......................................................................................................... 160
6.4.1 Analysis of variance response of sweetpoato genotypes ........................... 160
6.4.2 AMMI analysis ........................................................................................... 162
6.4.3 GGE biplot analysis ................................................................................... 164
6.5 Conclusions ........................................................................................................ 165
6.6 References ......................................................................................................... 166
7. Chapter Seven: Overview of the study ..................................................................... 169
xii
7.1 Introduction ......................................................................................................... 169
7.2 Summary of major findings ................................................................................. 170
7.3 Implications of the research findings ................................................................... 173
xiii
List of figures
Figure 2.1: A map of Rwanda showing the districts where the survey was conducted. ........ 46
Figure 3.1: Dendrogram showing principal genetic clusters of 54 sweetpotato genotypes evaluated at Rubona and Karama in Rwanda using 26 phenotypic traits. ........................... 75
Figure 3.2: GGE biplot based on storage root yield (A), dry matter content (B), vine yield (C) and total biomass (D) of 54 sweetpotato genotypes tested at Karama and Rubona in Rwanda............................................................................................................................... 76
Figure 4.1: Comparison of growth of sweetpotato plants of genotype Mvugamo under continuous irrigation (left) and drought stress of three months (right) under greenhouse conditions. ........................................................................................................................... 95
Figure 5.1: Immature capsules (left) and mature capsules (right) of sweetpotato resulted from hand crosses. ........................................................................................................... 114
Figure 5.2: Germination of sweetpotato seeds after scarification (left) and seedling plants (right). ............................................................................................................................... 114
Figure 6.1: Which-won-where polygon view of GGE biplot and mega environments for storage root yield (a) and dry matter content of storage root (b) of sweetpotato. Numbers are genotypes, E1 to E6: environments, P1 to P8: Parents. .................................................... 159
Figure 6.2: Discriminating power and representativeness of the test environments for root yield (a), dry matter content of storage root (b) of sweetpotato. Numbers are genotypes, E1 to E6: environments, P1 to P8: Parents............................................................................. 160
xiv
List of tables
Table 0.1: Structure of the thesis .......................................................................................... 5
Table 2.1: Description of sampled farmers from three provinces and seven districts of Rwanda in 2013 .................................................................................................................. 49
Table 2.2: Score (%) of main food crops for food security following a pairwise comparison of farmers (N=327) of three provinces and seven districts of Rwanda ..................................... 51
Table 2.3: Score (%) of main food crops for income generation after a pairwise comparison of farmers (N=327) of three provinces and seven districts of Rwanda ................................. 52
2.4: Constraints of sweetpotato production and their relative importance (%) of three provinces and seven districts of Rwanda ............................................................................ 53
Table 2.5: Preferred characteristics of a good cultivar and storage root of sweetpotato and their relative score (%) by growers in Bugesera, Kayonza Gakenke, Rulindo Gisagara, Huye and Muhanga Districts of Rwanda....................................................................................... 54
Table 2.6: Market price variation of sweetpotato (Rwf/kg) in Bugesera, Kayonza Gakenke, Rulindo Gisagara, Huye and Muhanga Districts of Rwanda in 2013 .................................... 55
Table 2.7: Availability and seasonal calendar of sweetpotato production in Rwanda ........... 56
Table 2.8: Sweetpotato production activities and role of gender of three provinces and seven districts of Rwanda .............................................................................................................. 56
Table 3.1: Descriptions of 54 sweetpotato genotypes used in the study .............................. 69
Table 3.2: Geographic location and soil characteristics of the study sites ........................... 70
Table 3.3: Analysis of variance of flowering rate among 54 sweetpotato genotypes evaluated at Rubona and Karama in Rwanda ..................................................................................... 72
Table 3.4: Means of yield, yield components and dry matter content of 54 sweetpotato genotypes evaluated at Rubona and Karama in Rwanda .................................................... 73
Table 3.5: Analysis of variance of yield and yield components among 54 sweetpotato genotypes evaluated at Rubona and Karama in Rwanda .................................................... 74
Table 3.6: Grand mean and standard deviation of yield and yield components of 54 sweetpotato genotypes when evaluated at Rubona and Karama in Rwanda ...................... 75
Table 3.7: Correlations between phenotypic traits of sweetpotato and main principal components generated using 26 traits and the rotation method of Varimax with Kaiser Normalization ...................................................................................................................... 78
Table 4.1: Descriptions of sweetpotato genotypes used in the study ................................... 92
Table 4.2: Water potential readings (MPa) during the experiment ....................................... 95
Table 4.3: Effects of four water stress levels on yield, yield components and vine water content of sweetpotato under greenhouse condition ........................................................... 96
xv
Table 4.4: Analysis of variance on yield and yield components of 54 sweetpotato genotypes evaluated under four water regimes in greenhouse ............................................................. 96
Table 4.5: Mean storage root yield and dry matter content, vined yield, and total biomass production of 54 sweetpotato genotypes under continuous irrigation (T1) and drought stress condition of three months (T4) ............................................................................................. 98
Table 4.6: Mean fresh weigh gain, dry matter content, and water content of 54 sweetpotato genotypes during in-vitro experiment using four sorbitol treatments .................................... 99
Table 4.7: Analysis of variance on fresh weigh gain, dry matter content, and water content of 54 sweetpotato genotypes during in-vitro experiment using four sorbitol treatments ........... 99
Table 4.8: Mean fresh weigh gain, dry matter content and water content, of 54 sweetpotato genotypes grown in-vitro for four weeks in a basic culture medium (control: T1) and under supplementation of 0.6 M sorbitol (T4). ............................................................................. 101
Table 4.9: Correlation coefficients showing pair-wise association of drought tolerance parameters of greenhouse and in-vitro experiments involving 54 sweetpotato genotypes. 102
Table 5.1: Description of sweetpotato parents used in crossing in the study ..................... 113
Table 5.2: Geographic location, soil characteristics and rainfall of the Karama, Masoro and Rubona Research Stations sites in Rwanda. .................................................................... 115
Table 5.3: Compatibility and success rate of crosses with corresponding number of seeds per capsule, and germination rate of scarified seeds eight sweetpotato genotypes ........... 118
Table 5.4: Mean squares and significant tests summarized from a combined analysis of variance of canopy temperature, canopy wilting, yield of storage roots, skin and flesh color, yield of vines, total biomass and dry matter content of storage roots of 64 sweetpotato clones evaluated at three sites in Rwanda ........................................................................ 119
Table 5.5: Mean canopy temperature (CT), canopy wilting (CW), yields of storage roots and vines, total biomass and dry matter content of storage roots of families and parents of sweetpotato clones evaluated across three sites in Rwanda ............................................. 122
Table 5.6: Summary mean squares and significant tests of combining abilities and maternal effects for canopy temperature, canopy wilting, yield of storage root, skin color, flesh color, vine yield, total biomass and dry matter content of storage roots of sweetpotato clones evaluated across three sites in Rwanda ............................................................................ 124
Table 5.7: Estimates of GCA effects for canopy temperature, canopy wilting, yield of storage roots, skin color, flesh color, vine yield, total biomass and dry matter content of eight sweetpotato parents .......................................................................................................... 125
Table 5.8: Estimates of SCA and maternal effects for canopy temperature, canopy wilting, yield of storage roots, skin color, flesh color, vine yield, total biomass and dry matter content of sweetpotato genotypes derived from direct and reciprocal crosses of eight parents...... 127
Table 6.1: Description of sweetpotato clones and varieties used in this study based on previous study ................................................................................................................... 143
Table 6.2: Description of Karama, Masoro and Rubona research sites of the Rwanda Agriculture Board where the present study was conducted ............................................... 144
xvi
Table 6.3: Combined ANOVA for yield and dry matter content of storage root, vine and total biomass of sweetpotato clones evaluated at three sites and two growing seasons in Rwanda ......................................................................................................................................... 147
Table 6.4: Mean storage root weight, vine weight, total biomass and dry matter content of 45 sweetpotato genotypes evaluated across three sites and two growing seasons in Rwandaa
......................................................................................................................................... 148
6.5: Mean yields and dry matter content of storage root of 45 sweetpotato genotypes evaluated at three sites and two growing seasons in Rwanda ........................................... 151
Table 6.6: AMMI analysis of variance for fresh root yield and root dry matter content of 45 sweetpoato clones tested across six environments in Rwanda ......................................... 154
Table 6.7: The best four clones of AMMI selections per environment based on fresh root yield and root dry matter content ....................................................................................... 155
Table 6.8: Mean yield and dry matter content of storage root, IPCA 1, IPCA 2 and AMMI stability values (ASV) of 45 sweetpotato clones evaluated in six environments in Rwanda 157
xvii
Publications from this thesis
Chapter one
Rukundo Placide , Hussein Shimelis, Mark Laing, Daphrose Gahakwa (2013). Storage root
formation, dry matter synthesis, accumulation and genetics in sweetpotato. Australian
Journal of Crop Science 7(13):2054-206.
Rukundo Placide, Hussein Shimelis, Mark Laing and Daphrose Gahakwa (2013).
Physiological mechanisms and conventional breeding of sweetpotato (Ipomoea batatas (L.)
Lam.) to drought-tolerance. African Journal of Agricultural Research 8(18): 1837-1846.
Chapter two
Rukundo Placide , Hussein Shimelis, and Mark Laing and Daphrose Gahakwa (2015).
Farmers’ perceptions, production and productivity constraints, preferences, and breeding
priorities of sweetpotato in Rwanda. HortScience 50(1):36–43. 2015.
Chapter three
Rukundo Placide , Hussein Shimelis, Mark Laing and Daphrose Gahakwa (2015).
Application of principal component analysis to yield and yield related traits to identify
sweetpotato breeding parents. Tropical Agriculture (Trinidad) 92 (1): 1-15.
Rukundo Placide , Hussein Shimelis, Mark Laing and Daphrose Gahakwa (2015).
Phenotypic characterisation of sweetpotato genotypes grown in East and Central Africa.
South African Journal of Plant and Soil 2015: 1–10.
http://dx.doi.org/10.1080/02571862.2014.994141
Rukundo Placide , Hussein Shimelis and Mark Laing (2015). Greenhouse and in-vitro
screening of sweetpotato genotypes for drought tolerance. In press, the journal of Research
on Crops.
1
Thesis introduction
Background
Sweetpotato (Ipomoea batatas [L.] Lam.) is an important crop grown in more than 119
countries on an estimated area of 8.3 million ha for food, feed and industrial raw material
(Scott and Ewell 1993; FAOSTAT 2013). The annual global production of sweetpotato is
estimated at 110.7 million tons of which 15% is from East and Central Africa (FAOSTAT
2013). In Rwanda, sweetpotato is the third most important root crop next to cassava and
potato (FAOSTAT 2013). According to Ndirigwe (2006); Njeru et al. (2008) and NISR (2015),
98% of subsistence farmers in all Rwandan agro-ecological zones grow sweetpotato. This
crop covers about 5.2% of the cultivated land and grown during both the main and off
seasons. In Rwanda an area of 112436 ha was planted with sweetpotato with annual
production of 1081224 tons (FAOSTA 2013). Sweetpotato productivity is very low in the
country (9.62 tons ha-1) than potentially achievable. Fresh root yields of 20 tons ha-1 are
reported in China (Low et al. 2009).
Sweetpotato is an inexpensive source of β-carotene, anthocyanin, carbohydrate, vitamins
and minerals. The orange-fleshed sweetpotato varieties are important sources of β-carotene
which is the major precursor of vitamin A (Chassy et al. 2008), while the purple fleshed
sweetpotato varieties are rich in anthocyanins and other polyphenolic components (Teow et
al. 2007; Steed and Truong 2008). The level of β-carotene and anthocyanin in sweetpotato
is as high as in carrot, pumpkin, Vaccinium species such as blueberry, cranberry, bilberry or
red cabbage (Woolfe 1992; Steed and Truong 2008). The storage roots of sweetpotato are a
major source of energy due to its high carbohydrate content which ranges between 80 to
90% of the dry weight. The carbohydrates consist mainly of starch, sugars and low quantity
of pectin, hemicelluloses, and cellulose (Lebot 2009). Furthermore, sweetpotato is a source
of vitamins C and B6, mineral salts and fibers (Woolfe 1992; Chassy et al. 2008).
Sweetpotato is grown mainly for food (Scott and Ewell 1993). Its consumption per capita per
year is above 80 kg in Rwanda, Burundi and Uganda (FAOSTAT 2013). It is consumed in
different forms varying within a country by regions and incomes of the population group.
Storage roots, young leaves and tips of stems of sweetpotato serve for food. In rural areas
sweetpotato storage roots are consumed boiled or baked, while people with more economic
means tend to use it as fried chips or a snack (Woolfe 1992).
2
The storage roots, by-products of roots and vines of sweetpotato are commonly used as
feed for cattle, pigs and other livestock (Woolfe 1992). In 2007, about half of all sweetpotato
production in the world was used for animal feed (Lebot 2009). The crop is used as an
important ingredient in the feed processing industries (Gupta et al. 2009). Studies have
shown that sweetpotato could form a valuable component of forage crops. It contains
nutrients that can support acceptable growth of livestock (Kariuki et al. 1998; Aregheore
2004; Gupta et al. 2009). Therefore, a mixture of sweetpotato forage with poor quality fodder
sources can sustain the growth of livestock which may consequently increase availability of
animal products for humans (Aregheore 2004). Despite the multiple uses of sweetpotato, its
production and productivity are limited by various factors such as biotic, abiotic and socio-
economic constraints.
Constraints to sweetpotato production
Drought is the leading abiotic stress limiting crop production globally. Recurrent drought is
associated with global climate change (Blum 2002). Drought stress is especially important in
countries practicing rain-fed agriculture such as in Rwanda. Limited water availability affects
negatively crop yields through reduced vegetative growth, premature senescence of leaves,
damages of plant tissues, poor flowering or sterility. These will severely reduce
photosynthesis and crop yields (Taiz and Zeiger 2006; Blum 2011). In sweetpotato, water
deficit causes a reduction of the development of vines limiting storage root formation and
reduced root dry matter content (Woolfe 1992). Severe drought stress may lead to a
complete crop loss. Under drought stress, the severity of biotic stresses such viral infection
and pest attacks increase. Viral diseases are the most important biotic constraints to
sweetpotato production (Fuglie 2007). According to Low et al. (2009), more than 20 different
virus species are reported affecting sweetpotato production globally. The sweetpotato viral
diseases (SPVD) are the result of co-infections amongst different viruses (Karyeija et al.
2000; Aritua et al. 2007). The SPVD can cause yield losses reaching up to 80% on
susceptible varieties (Wambugu 2003). A number of fungal and bacterial diseases of
sweetpotato have been reported leading to low yields in various regions (Low et al. 2009).
Sweetpotato diseases affect stems, leaves and roots in various forms (Low et al. 2009).
Fungal and bacterial pathogens cause low yield losses compared to viral diseases.
Moreover, their distribution depends on environmental factors (Lebot 2009).

3
Key pests in sweetpotato include: wireworm, white grubs, the sweetpotato weevil, the
sweetpotato flea beetle, the cucumber beetle, the white fringed beetle, the armyworm
complex and the sugarcane beetle (Woolfe 1992;). Insect pests are often responsible for
high yield losses and low quality of storage roots of sweetpotato. The magnitudes of pest
infestation differ between regions within a country. However, the sweetpotato weevils are the
most prevalent pests in East and Central Africa (Muyinza et al. 2007). Insect pests can
cause yield losses of 60 to 97% associated with altered and poor quality of roots (Low et al.
2009). Two nematode species: the root knot nematode (Meloidogyne spp.) and reniform
nematode (Rotylenchulus reniformis), have been reported to cause serious yield losses of
sweetpotato in some areas (Muyinza et al. 2007; Lebot 2009). In the past years various
researches have been conducted and successes are reported in controlling sweetpotato
diseases and pests using various approaches (Wambugu 2003; Gibson et al. 2004; Aritua et
al. 2007; Njeru et al. 2008; Alam et al. 2010). However, in Rwanda there are limited studies
available on abiotic stress management such as breeding for drought tolerance.
Problem statement
Considerable proportions of rural communities in Rwanda have experienced periodic hunger
during October to January every year, mainly due to severe drought stress and crop failures.
In the country, there is a lack of drought tolerant varieties of major food crops including
sweetpotato. According to MINIRENA (2014), rainfall in Rwanda has erratic distribution
throughout the main cropping season. Thus, there is severe drought stress between June
and September in the Southern and Eastern Provinces, which are the main sweetpotato
production areas of the country. Consequently, development of drought tolerant sweetpotato
varieties is essential for sustainable production and to ensure food security in Rwanda. This
could be achieved through well-designed crosses and continuous selection of promising and
complementary clones with drought tolerance.
The value of a new sweetpotato variety depends on whether it meets farmers’ and end
users’ preferences and demands. Storage roots with high starch and low hexoses contents
are attractive characteristics for processing purposes (Slafer and Savin 1994). A high starch
and low reduced sugar content of sweetpotato storage roots reduce the cost of processing
because of limited oxidation reactions (McKibbin et al. 2006). High dry matter content is the
main preferred characteristic of sweetpotato for consumers and processing industries.
Recent research initiatives are underway to promote new sweetpotato varieties in sub-
Sahara Africa to tackle hunger and shortage of vitamin A through releasing orange-fleshed
4
sweetpotato varieties. However, these varieties are reportedly low in dry matter content
compared to farmers’ varieties (Cervantes-Flores et al. 2011; Mwanga et al. 2010).
Therefore, breeding for drought tolerance and high dry matter content is important for
sustainable sweetpotato production in Rwanda.
Objectives
The overall goal of this study was to contribute to improvement of food security in Rwanda
through breeding of sweetpotato for drought tolerance and high dry matter content. To
achieve this goal, the following studies were carried out encompassing five objectives.
The specific objectives of the study were:
1. To assess farmers’ perception, production constraints, preferences, and breeding
priorities of sweetpotato in selected agro-ecologies of Rwanda.
2. To characterise and identify breeding parents among 54 sweetpotato genotypes
grown in Rwanda, East and Central Africa.
3. To select drought tolerant sweetpotato genotypes under managed drought conditions
using greenhouse and in-vitro screening techniques with early and late
developmental traits.
4. To determine general combining ability (GCA), specific combining ability (SCA),
maternal effects and heritability of drought tolerance, yield and yield components of
among newly developed sweetpotato clones.
5. To determine genotype x environment interaction and yield stability of sweetpotato
breeding clones recently bred in Rwanda and to identify promising genotypes
This study tested the following hypotheses:
1. Farmers’ have different perceptions, production constraints and preferences of
sweetpotato varieties in Rwanda.
2. There are variation in genetics, drought tolerance and dry matter content in Rwandan
sweetpotato germplasm.
3. There are not maternal effects and specific combining ability on the inheritance of
drought tolerance and dry matter content of sweetpotato.
4. Drought tolerance and dry matter content of sweetpotato are affected by additive
gene action.
5
5. There is G x E interactions for dry matter content and drought tolerance of
sweetpotato.
Thesis outline
This thesis consists of seven different chapters (Table 0.1) associated with activities of the
above-mentioned objectives. Chapter 1 is a literature review, while Chapters 2 to 6 are
distinct research chapters. Consequently, there is some inevitable repetition of references
and introductory information between chapters. The format of references used in the
chapters of this thesis is based on the Journal of Crop Science system which is the most
recommended thesis format adopted by the University of KwaZulu-Natal. Each of these
chapters follows the format of a publishable paper. The contents of Chapter 1 have been
published in the Australian Journal of Crop Science and African Journal of Agriculture
Research. Chapter 2 has been published in the journal of HortScience. Results of Chapter 3
have been published in the South African Journal of Plant and Soil and in the Journal of
Tropical Agriculture (Trinidad). Chapter 4 is in press in the Journal of Research on Crops.
Table 0.1: Structure of the thesis
Chapter Title - Thesis introduction 1 A review of the literature 2 Farmers’ perceptions, production and productivity constraints, preferences, and
breeding priorities of sweetpotato in Rwanda 3 Phenotypic characterisation of sweetpotato genotypes grown in Rwanda, East
and Central Africa 4 Greenhouse and in-vitro screening of sweetpotato genotypes for drought
tolerance 5 Combining ability, maternal effects and heritability of drought tolerance, yield
and yield components among newly developed sweetpotato clones 6 Genotype by environment interaction and yield stability of sweetpotato clones in
Rwanda 7 Overview of the study
References
Alam, I., S.A. Sharmin, K. Naher, J. Alam, M. Anisuzzaman and M.F. Alam. 2010. Effect of growth regulators on meristem culture and plantlet establishment in sweetpotato (Ipomoea batatas (L.) Lam.). Plant Omics 3: 35-39.

6
Aregheore, E. 2004. Nutritive value of sweetpotato (Ipomea batatas (L) Lam) forage as goat feed: Voluntary intake, growth and digestibility of mixed rations of sweetpotato and batiki grass (Ischaemum aristatum var. indicum). Small Ruminant Research 51: 235-241.
Aritua, V., B. Bua, E. Barg, H. Vetten, E. Adipala and R. Gibson. 2007. Incidence of five viruses infecting sweetpotatoes in Uganda: The first evidence of sweetpotato caulimo-like virus in Africa. Plant Pathology 56: 324-331.
Blum, A. 2002. Drought tolerance: Is it a complex trait? In: Saxena, N.P. and J.C. O’Toole, editors, Proceedings of an international workshop on field screening for drought tolerance in rice. Rockefeller Foundation, New York. p. 24-59.
Blum, A. 2011. Plant breeding for water-limited environments. Springer, London.
Cervantes-Flores J.C., B. Sosinski, K.V. Pecota, R.O.M. Mwanga, G.L. Catignani, V.D. Truong, R.H. Watkins, M.R. Ulmer and G.C. Yencho. 2011. Identification of quantitative trait loci for dry-matter, starch, and beta-carotene content in sweetpotato. Molecular Breeding 28: 201-216.
Chassy, B., M. Egnin, Y. Gao, G. Kleter, P. Nestel, M. Newell-McGloughlin, R. Phipps and R. Shillito. 2008. Nutritional and safety assessments of foods and feeds nutritionally improved through biotechnology. Comprehensive Reviews in Food Science and Food Safety 7: 50-113.
FAOSTAT. 2013. Statistics division. FAO. http://faostat.fao.org/site/612/default.aspx#ancor (accessed Accessed 7 July 2015).
Fuglie, K.O. 2007. Priorities for sweetpotato research in developing countries: Results of a survey. Horticulture Science 42: 1200-1206.
Gibson, R.W., V. Aritua, E. Byamukama, I. Mpembe and J. Kayongo. 2004. Control strategies for sweetpotato virus disease in Africa. Virus Research 100: 115-122.
Gupta, J., R. Bardoloi, P. Reddy and A. Das. 2009. Performance of crossbred pigs fed on raw and boiled sweetpotato tuber at various levels at different stages of growth. Indian Journal of Animal Sciences 79: 696-699.
Kariuki, J., C. Gachuiri, G. Gitau, S. Tamminga, J. Van Bruchem, J. Muia and K. Irungu. 1998. Effect of feeding napier grass, lucerne and sweetpotato vines as sole diets to dairy heifers on nutrient intake, weight gain and rumen degradation. Livestock Production Science 55: 13-20.
Karyeija, R., J. Kreuze, R. Gibson and J. Valkonen. 2000. Synergistic interactions of a potyvirus and a phloem-limited crinivirus in sweetpotato plants. Virology 269: 26-36.
Lebot, V. 2009. Sweetpotato. In: Bradshaw, J.E., editor, Root and tuber crops: Handbook of plant breeding. Springer Sciences and Business Media, New York, NY 10013, USA. p. 97-125.
Low, J., J. Lynam, B. Lemaga, C. Crissman, I. Barker, G. Thiele, S. Namanda, C. Wheatley and M. Andrade. 2009. Sweetpotato in Sub-Saharan Africa. In: Loebenstein, G. and G. Thottappilly, editors, The sweetpotato. Springer Verlag, Dordrecht, the Netherlands, p.34-69.
7
McKibbin, R.S., N. Muttucumaru, M.J. Paul, S.J. Powers, M.M. Burrell, S. Coates, P.C. Purcell, A. Tiessen, P. Geigenberger and N.G. Halford. 2006. Production of high starch, low glucose potatoes through over expression of the metabolic regulator SnRK1. Plant Biotechnology Journal 4: 409-418.
MINIRENA. 2014. Rwanda Meteorology Agency. http://www.meteorwanda.gov.rw. ttp://www.meteorwanda.gov.rw. (accessed 30th July 2015).
Muyinza, H., P. Stevenson, R. Mwanga, H. Talwana, J. Murumu and B. Odongo. 2007. The relationship between stem base and root damage by Cylas spp. on sweetpotato. African Crop Science Society 8: 955-957.
Mwanga, R., B. Odongo, C. Niringiye, R. Kapinga, S. Tumwegamire, P. Abidin, E. Carey, B. Lemaga, J. Nsumba and D. Zhang. 2010. Sweetpotato selection releases: Lessons learnt from Uganda. African Crop Science Journal 15: 11-23.
Ndirigwe, J. 2006. Adaptability and acceptability of orange and yellow-fleshed sweetpotato genotypes in Rwanda. MSc Dissertation. Makerere University, Kampala, Uganda.
NISR. 2015. Seasonal Agricultural Survey 2014. The National Institute of Statistics of Rwanda, Kigali, Rwanda. Website: www.statistics.gov.rw.
Njeru, R., M. Bagabe, D. Nkezabahizi, D. Kayiranga, J. Kajuga, L. Butare and J. Ndirigue. 2008. Viruses infecting sweetpotato in Rwanda: Occurrence and distribution. Annals of applied biology 153: 215-221.
Scott, G.J. and P. Ewell. 1993. Sweetpotato in African food systems. In: Scott, G.J., P.I. Ferguson and J.E. Herrera, editors, Product development for root and tuber crops: Africa. International Potato Center, Ibadan. p. 91-104.
Slafer, G.A. and R. Savin. 1994. Source sink relationships and grain mass at different positions within the spike in wheat. Field Crops Research 37: 39-49.
Steed, L. and V.D. Truong. 2008. Anthocyanin content, antioxidant activity, and selected physical properties of flowable purple fleshed sweetpotato purees. Journal of Food Science 73: 215-221.
Taiz, L. and E. Zeiger. 2006. Stress physiology. In: Taiz, L. and E. Zeiger, editors, Plant physiology. Sinauer Associates, Inc., Sunderland, MA. p. 671-681.
Teow, C.C., V.D. Truong, R.F. McFeeters, R.L. Thompson, K.V. Pecota and G.C. Yencho. 2007. Antioxidant activities, phenolic and beta-carotene contents of sweetpotato genotypes with varying flesh colours. Food Chemistry 103: 829-838.
Wambugu, F.M. 2003. Development and transfer of genetically modified virus resistant sweetpotato for subsistence farmers in Kenya. ProQuest Agriculture Journal 61: 110-113.
Woolfe, J.A. 1992. Sweetpotato: An untapped food resource. Cambridge University Press, New York.
8
1. Chapter One: A review of the literature
Abstract
Sweetpotato is an important crop grown for food, feed and industrial raw material. In spite of
the critical value of sweetpotato, its adoption and production in many tropical regions are
limited by low dry matter content of storage root and drought stress, respectively. The
sustainability of sweetpotato production will require the development and release of new
sweetpotato varieties with high dry mater content of storage roots and drought tolerance.
This review describes the aspects associated with development of sweetpotato cultivars with
high dry matter storage root and drought tolerance. It highlights the effects of drought stress,
mechanisms of adaptation of crops to drought stress, drought stress on sweetpotato,
different mechanisms of development and synthesis of dry matter of sweetpotato storage
root, methods to screen sweetpotato clones with drought tolerance and high dry matter
content. Furthermore, the review summarizes breeding approaches, genotype x environment
interaction and yield stability in sweetpotato. Information presented in this review may serve
as important guideline in sweetpotato breeding towards high dry matter content of storage
root and drought-tolerance.
Keywords: Breeding, genetics, drought tolerance, dry matter content, storage root,
sweetpotato
1.1 Introduction
Sweetpotato (Ipomoea batatas [L.] Lam.) is an important crop worldwide grown in more than
119 countries on an estimated area of 8.3 million ha for food, feed and industrial raw
materials (Scott and Ewell 1993; FAOSTAT 2013). The annual global production of
sweetpotato is estimated at 106.5 million metric tons of which 15% is from East and Central
Africa (FAOSTAT 2013). The sweetpotato storage roots are a major source of energy due to
their high carbohydrate content which ranges between 80 to 90% of their dry weight. These
carbohydrates consist mainly of starch, sugars and a low quantity of pectin, hemicelluloses,
and cellulose (Lebot 2009). The orange-fleshed sweetpotato varieties are an important
source of β-carotene which is the major provitamin A carotenoid (Chassy et al. 2008) while
the purple-fleshed sweetpotato varieties are rich in anthocyanins and other polyphenolic
components (Teow et al. 2007; Steed and Truong 2008). Sweetpotato is also a source of
9
vitamins C and B6, mineral salts and fibres (Woolfe 1992; Chassy et al. 2008). Due to its
high nutritional value, sweetpotato has multiple uses.
The consumption of sweetpotato per capita per year was estimated to be 112 kg in Africa,
16 kg in Asia, 18 kg in Oceania, 2 kg in America, < 0.5 kg in Europe, 147 kg in Rwanda, 120
kg in Burundi and 88 kg in Uganda (Chassy et al. 2008). It is consumed in different forms.
Consumption pattern varies within countries by regions and by income of the population
group. Humans can consume sweetpotato roots, young leaves and the tips of stems as
vegetables. Most rural poor consume boiled or baked sweetpotato roots, while people with
more economic means tend to eat sweetpotato roots as fried chips or as a snack food
(Woolfe 1992). In many rural areas, sweetpotato is mostly used as food and feed by small-
scale farmers. The roots, by-product of roots and vines of sweetpotato are commonly used
as feed for cattle, pigs, goat, sheep and rabbit (Woolfe 1992). In 2007, about half of all
sweetpotato production in the world was used for animal feed (Lebot 2009). For this
purpose, it is used as a raw material or ingredient in the feed processing industries (Gupta et
al. 2009). Studies have shown that sweetpotato is a valuable forage containing nutrients that
can support acceptable growth of livestock (Kariuki et al. 1998; Aregheore 2004; Gupta et al.
2009). Therefore, the mixture of sweetpotato forage with poor quality fodder has been
suggested to sustain the growth of livestock and to increase the availability of animal
products for human consumption (Aregheore 2004). Sweetpotato is an important source of
raw material used to make different products such as soluble and refined starch and alcohol
drinks (Woolfe 1992; Low et al. 2009). It is currently a target source of biofuel because of its
ability to produce a high amount of starch biomass which can be fermented and converted
into ethanol (Cervantes-Flores et al. 2011). However, the use of sweetpotato as a raw
material for the biofuel and processing industries requires varieties with dry matter content
that is above 35% of fresh weight (Gruneberg et al. 2009).
In spite of the critical value of sweetpotato, its adaption and production in many tropical
regions are limited by storage root quality and drought stress, respectively (Lebot 2009).
High dry matter content of storage roots is the main preference characteristic of sweetpotato
consumers. In sub-Sahara Africa, farmers prefer sweetpotato varieties that have a high dry
matter content (Mwanga et al. 2007; Cervantes-Flores et al. 2011). High dry matter content,
low fibre, and good taste are the women farmers’ preferred traits for an ideal sweetpotato
variety (Gruneberg et al. 2009; Mwanga et al. 2010). Dry matter content that is above 25% is
an important element for acceptability of a new sweetpotato variety by farmers (Shumbusha
et al. 2010). Low dry matter content was a challenge towards promoting nutritionally
10
enriched orange-fleshed sweetpotato varieties developed to tackle blindness due to
shortage of vitamin A in sub-Sahara Africa. Therefore, the increase of both β-carotene and
dry matter is necessary to promote new orange-fleshed sweetpotato varieties (Cervantes-
Flores et al. 2011; Mwanga et al. 2010). Storage roots with high starch and low hexos
content are attractive characteristics for processing industries of sweetpotato (Slafer and
Savin 1994). High starch and low soluble sugar content of sweetpotato root decrease the
cost of processing because of the absence of oxidation reactions (McKibbin et al. 2006).
These oxidation reactions are mainly favoured by high content of hexoses such as glucose
and fructose and they are responsible for brown and dark colours and bitter taste of dried
and fried food products from storage roots. This change of colour is a result of Maillard
reaction (Dale and Bradshaw 2003). Li (2008) observed that the high dry matter content of
the root significantly reduces the processing cost because of the low absorption of oil.
Because the sustainability of sweetpotato production will depend on the consideration of end
users’ preferences, any breeding programme of the crop needs to incorporate valuable traits
including high dry matter content before the release of elite clones.
The yield reduction due to drought stress was estimated at 60% (Van Heerden and Laurie
2008). In a field experiment, it was observed that drought stress for 20 days during the
critical growing stage decreased yield by 15 to 39% of sweetpotato (Gong and Wang 1990).
Moreover, insect pests and viral diseases were reported to be very severe in drought
conditions (Fuglie 2007). Irrigation agriculture is an ideal and practical solution to overcome
drought effect in crop production. However, farmers do not have access to irrigation water
and infrastructures. Moreover, allocation of clean water for irrigation is a big challenge
because of exponential increase of population and the current global climate change.
Therefore, the sustainable solution to improve sweetpotato production is to develop and
deploy drought tolerant varieties.
Breeding for drought tolerance requires knowledge on the physiological mechanisms
involved in drought tolerance and the genetic control of yield and its components (Subbarao
et al. 2005). Molecular breeding techniques may improve the response of selection to
drought tolerance. However, their efficiency greatly depends on the availability of linked
physiological and morphological traits (Subbarao et al. 2005). Further, it has been observed
that the degree of expression of physiological and phenotypic traits varies depending on
severity of drought stress and genotypes (Yang et al. 1991). The development of a new
variety of sweetpotato with good quality such as high dry matter content and drought
tolerance requires efficient methods of crossing, selection of potential clones and evaluation
of the effects of genotype by environment interactions and yield stability. This permits the
11
release of end-users preferred varieties at the target production environment. Therefore, the
following sections presented the physiological mechanisms of drought tolerance, root
formation and dry matter synthesis and methods to screening for drought tolerance and high
dry matter content in the sweetpotato.
1.2 Physiological mechanisms and conventional breeding of
sweetpotato for drought-tolerance
1.2.1 Effects of drought stress
Drought is an extended period of dry weather characterized by a shortage of water supply to
plants (Acquaah 2007). In drought conditions, water potential (Ψw) of soil becomes negative
because of a concentration increase of soil solutes. The movement of cell water is
determined by the water potential gradient (∆Ψw) that acts as a driving force for transport
through a permeable cell membrane (Taiz and Zeiger 2006). A plant can continue to absorb
water only if its Ψw is lower than of the soil. Drought stress requires changes in plant cells
and tissues to adapt to drought stress conditions and continue to acquire the little available
water of soil (Bartels and Sunkar 2005). Symptoms of drought stress start when a crop has
used between 50 and 80% of extractable soil moisture (Acquaah 2007) and the failure of the
plant to absorb the remaining soil water has severe consequence.
Water plays a crucial role in the life of the plant and its availability is a main factor that
determines the plant population in the environment (Coley et al. 2009). Water is the main
constituent of plant tissues but its quantity varies within plant tissues and plant species. The
water content was estimated at 80 to 95% in masses of growing tissues, 85 to 95% in
vegetative tissues, 35 to 75% in wood with dead cells, and at 5 to 15% in dried seeds (Taiz
and Zeiger 2006). The distribution of plant species in the environment is associated with
their tolerance to environmental stresses (Brenes et al. 2009). It was observed that the most
widespread plant species are drought tolerant (Baltzer et al. 2008; Brenes et al. 2009). A low
temperature was suspected to be the main limiting factor of life in the Antarctic environment.
However, it was found that the water deficit is the major life threatening cause with a positive
correlation observed between the soil moisture and the abundance of organisms in this
environment (Kennedy 1993).
Drought is the primary abiotic stress that affects crop production and food availability
globally. In many developing countries, agriculture depends on rainfall which in many cases
12
does not meet the crop need (Ober 2008). The limited occurrence, amount, and uneven
distribution of rain affect growth and productivity of crops. Eventually this causes famines in
many semi-arid countries (Acquaah 2007). Drought can cause the biggest loss in crop
production compared to other isolated biotic or abiotic stress factors (Boyer 1982; Ober
2008). It affects crop production by reducing the genetic potential of a plant (Mitra 2001).
Consequently, it is responsible of the difference between the mean yield and the yield
potential of a crop and the cause of the yield instability in time (Sorrells et al. 2000).
Drought induces physiological, biochemical and molecular changes that have consequences
on crop growth and productivity (Reddy et al. 2004). Drought induced osmotic stress causes
the removal of water from the cytoplasm to the extracellular space and cell dehydration
(Bartels and Sunkar 2005). Water deficit affects the photosynthesis ability of plants by
changing the content and components of chlorophyll, reducing the net CO2 uptake by leaves
and by decreasing activities of enzymes in the Calvin cycle (Becana et al. 1998; Cornic
2000; Gong et al. 2005; Lawlor and Tezara 2009). The osmotic stress of water deficit inhibits
strongly the growth of leaves and stems of plants. This has negative effects on the yield
potential of the crop (Westgate and Boyer 1985). However, the degree of growth inhibition
and yield reduction depends on the duration and intensity of drought stress and the
genotypes of crop species (Monakhova and Chernyad'ev 2002; Bartels and Sunkar 2005).
The major cause of reduction in photosynthesis ability and growth under drought stress is
the disequilibrium between the production of reactive oxygen species (ROS) and their
scavenging systems (Becana et al. 1998; Noctor et al. 2014). Plants under abiotic stress
generate ROS that cause oxidative reactions (Lin et al. 2006a). The main ROS are hydrogen
peroxide (H2O2) and superoxide (O2.–). These ROS are routinely produced in different
cellular reactions catalysed by various enzymes such as lipoxygenase, peroxidase, NADPH
oxidase and xanthine oxidase, but the main source of these molecules is the Fenton and
Haber-Weiss reactions (Blokhina et al. 2003; Debarry et al. 2005; Lin et al. 2006b). The ROS
damage lipids, carbohydrates and proteins of cell membrane and cell nucleic acids (Zhang
and Kirkham 1996; Sairam et al. 1997; Fu and Huang 2001; Blokhina et al. 2003). When a
plant is under a serious stress condition; there is an accumulation of ROS because
scavenging and repairing mechanisms of ROS damages are surpassed (Lin et al. 2006b).
Therefore, a crop genotype must have efficient mechanisms of defence against ROS to
survive a severe drought osmotic stress and adapt to drought conditions.
13
1.2.2 Mechanisms of adaptation to drought stress in plant species
Crop genotypes can withhold the drought stress by dehydration tolerance, dehydration
avoidance or drought escape (Ludlow 1989; Yue et al. 2006). It was observed that a
genotype can use all or two of these strategies. However, a molecular study with 245 SSR
markers has revealed that dehydration tolerance and dehydration avoidance have distinct
genetic bases (Yue et al. 2006). Mechanisms involved in drought stress adaptation are
outlined beliow:
1.2.2.1 Dehydration tolerance
Dehydration tolerance involves the desiccation tolerance, osmotic adjustment and
antioxidant capacity. This strategy involves the resurrection and survival of genotypes after
extended and extreme internal water deficit. These genotypes can be still alive when there is
95% of leaf water loss (Scott et al. 2000). Dehydration tolerance enables the plants to
survive long and strong periods of water deficit and regrow when rain falls. It allows also
plants to maintain metabolic activities for longer and to translocate more stored assimilates
to the storage tissues (Fukai and Cooper 1995). Accumulation of compatible solutes is one
of biochemical processes that results in the dehydration tolerance (McCue and Hanson
1990). It was reported that compatible solutes play an adaptive role by osmotic adjustment
and protection of cellular compounds (Hare et al. 1998; Ain-Lhout et al. 2001). The
compatible solutes are mainly nitrogen containing molecules such as amino acids and
polyamines, and hydroxyl compounds. Types of these compatible solutes and levels of their
accumulation vary with plant species (McCue and Hanson 1990). The compatible solutes
work together with antioxidants which intervene to eliminate ROS and to repair damages of
ROS.
Crop plants produce different antioxidants that have abilities to scavenge ROS. Antioxidants
have small molecular mass such as ascorbic acid, glutathione, tocopherols, phenolic
compounds, ROS‐interacting enzymes such as superoxide dismutase (SOD), ascorbate
peroxidase (APX) and catalase (CAT) (Blokhina et al. 2003; Brosché et al. 2010). These
molecules play an important role to control the equilibrium between the production and the
elimination of free radicals. Moreover, they work in cohesive network reactions and use
mainly redox reactions (Lin et al. 2006b). Crop varieties that are drought resistant or tolerant
express high quantities of antioxidants than sensitive varieties (Herbinger et al. 2002; Lin et
al. 2006b). Indeed, the quality and the quantity of these molecules are crop species
dependent and their expression is affected by environmental conditions (Herbinger et al.
14
2002; Blokhina et al. 2003; Lin et al. 2006b). Therefore, understanding the expression and
mechanisms of these molecules and their functional models can assist to identify and
develop drought tolerant crop varieties.
1.2.2.2 Dehydration avoidance
Dehydration avoidance consists of minimizing the water loss and maximizing the water
absorption under water deficit conditions. This model is mainly observed on succulent and
C3 crop species (Yue et al. 2006). Water loss can be minimized by reducing the light
absorbance through leaf rolling, stomata closing, dense trichome layer that increases the
reflectance, steep leaf angles, decrease of leaf area and canopy through reduced growth or
shedding of leaves (Ehleringer and Cooper 1992; Larcher 2000; Chaves et al. 2003). It was
observed that perennial and deciduous crop plants reduce their foliage in drought seasons.
Plants that are always green present sometimes thick leaves with solid cuticle, highly
sclerophyllous and reduced size leaves (Lebreton et al. 1995; Sanguineti et al. 1999;
Sorrells et al. 2000; Ain-Lhout et al. 2001; Taiz and Zeiger 2006). The water uptake is
maximised by the increase of the capacity of the root system (Jackson et al. 2000). Root
characteristics such as thickness, depth, length and density have been associated with
drought avoidance in rice (Ekanayake et al. 1985). All these characteristics of roots and
leaves observed in the strategy of dehydration avoidance have effects on the effective water
use and control of evapotranspiration.
1.2.2.3 Drought escape
The strategy of drought escape is based on a short life cycle and developmental plasticity
(Yue et al. 2006). Genotypes grow and reproduce before an appearance of a drought
season (Passioura 1996; Richards 1996; Mitra 2001; Mckay et al. 2003). In the drought
escape, it was suggested that a genotype must have a high metabolic activity and rapid
growth to support the plant to complete its life cycle before the most intense period of
drought. However, the selection based on phenology has revealed that the selection of both
high photosynthetic activities and rapid growth can only be achieved under a well-watered
environment (Sherrard and Maherali 2006). Therefore, the strong correlation of development
duration and metabolic activities to promote the drought escape is not necessary under
drought conditions.
15
1.2.3 Consequences of adaptation mechanisms to drought stress
Adaptation mechanisms to drought stress may incriminate crop growth and productivity
(Larcher 2000). For instance, crop varieties of short life cycle can escape a drought period
but they produce low yield (Acquaah 2007). Mechanisms of dehydration avoidance such as
a stomatal closure and decrease of leaf area reduce assimilation of light and CO2 necessary
for photosynthesis and consequently lower biomass production (Cornic 2000; Larcher 2000;
Lawlor and Tezara 2009). Dehydration tolerance with the accumulation of compatible
solutes, the synthesis of antioxidants and the process of ROS scavenging depletes
assimilates and energy. Consequently, these mechanisms reduce the ability of crop
genotypes to synthesize organic end-products (Mitra 2001). Thus, the development of a
drought tolerant sweetpotato variety needs to balance all drought tolerance mechanisms
without sacrificing crop productivity (Passioura 1996; Richards 1996; Mitra 2001; Mckay et
al. 2003).
1.2.4 Drought stress on sweetpotato
Sweetpotato has unique characteristics of drought tolerance compared to the widely grown
crop species. The root system of sweetpotato has a big surface area that allows easy
access to available soil water (Low et al. 2009). It is very rich in antioxidants such as vitamin
C, carotenoids and polyphenolic substances (Blokhina et al. 2003; Lin et al. 2006b), which
are powerful and scavenge hydroxyl and peroxyl radicals and to control oxidation of lipid and
protein of cell membranes. These are also chelators of metals and inhibitors of Fenton and
Haber-Weiss reactions, which are the principal sources of free radicals (Debarry et al. 2005).
However, sweetpotato is negatively affected by drought stress.
In sweetpotato, it was observed that the water deficit reduces the number of leaves and
tubers, size and composition of roots and vines, and gain of dry weight of shoot and roots
(Bourke 1989; Pardales et al. 2000). In the greenhouse trial, sweetpotato genotypes
revealed differences in vine length and diameter, leaf width and number of nodes per vine
(Ricardo 2011). Drought stress reduced the yield of storage roots, total biomass, marketable
fresh storage root and number of storage roots. However, it was observed that drought
stress increased the dry matter content of storage root (Kivuva 2013). In a pot experiment to
screen 15 sweetpotato varieties for drought tolerance, Sarawasti et al. (2004) observed that
biomass and morphological traits such as main stem length, internode diameter and length,
leaf area and number decreased in response to drought stress. Zhang el al. (2004) observed
that soluble sugar and total amino acid increased as the loss of leaf water increased; but the

16
potassium content decreased significantly. Sweetpotato cells grown under an induced
drought osmotic stress condition had reduced growth, an induction of plasmolysis, an
increase of amino acid pool and sucrose and starch accumulation (Wang et al. 1999). It was
suggested that the accumulation of starch and the plasmolysis process decrease
significantly the cell cytoplasm. Consequently, a small quantity of compatible solutes is
enough to adjust an osmotic pressure induced by a water deficit (Wang et al. 1999). The
drought condition was found to reduce the ability of sweetpotato to eliminate ROS and this
reduction varies from one variety to another (Herbinger et al. 2002; Blokhina et al. 2003; Lin
et al. 2006b).
Germplasm collections from water limited regions showed distinctive leaf morphology
compared to collections from environments with high rainfall. Moreover, the local landraces
were found to be more drought tolerant than introduced varieties under limited water tropical
regions (Carey et al. 1997). Indira and Kabeerathumma, (1988) observed that sweetpotato is
sensitive to water shortage especially during establishment, vine development and storage
root initiation. It was revealed that the shortage of water during critical periods of growth
causes irreversible consequences on yield (Lin et al. 2006a). Anselmo et al., (1998) reported
that drought is the main production constraint of sweetpotato in the region where agriculture
is rainfall dependent. According to Ekanayake, (1990) a variety is drought tolerant when it
produces an economic crop yield under limited water availability. Drought tolerance was
associated with vine availability for planting after prolonged dry season (Gruneberg et al.
2009).
Drought stress causes physiological changes in sweetpotato. van Heerden and Laurie,
(2008) reported that drought caused stomatal closure which reduces CO2 uptake,
photosynthesis and plant growth and yield. It was suggested that drought stress affect the
metabolism of carbon and nitrogen (Haimeirong and Kubota 2003). The effects of osmotic
stress induced by polyethylene glycol on sweetpotato seedlings were investigated by
measuring changes in relative water content, malondialdehyde and proline contents and
superoxide dismutase activity. A highly positive correlation between relative water content
and drought resistance (r = 0. 783), a highly negative correlation between malondialdehyde
contents and drought resistance (r= 0. 848), a highly positive correlation between superoxide
dismutase activity and drought resistance (r = 0. 777) were observed. However, the proline
contents in leaves did not reveal any relation with sweetpotato drought tolerance (Zhang et
al. 2001). Under field trial, Niu et al. (1996) observed that leaf relative water content and
catalase activity are best indicators of drought tolerance. Chowdhhury and Naskar (1993)
17
found the positive correlation between relative water content of leaves and yield of
sweetpotato under water stress condition.
Soil water content is the main factor that determines the formation and growth of storage
roots of sweetpotato (Bourke 1989). In field trials, it was observed that drought stress for 20
days in part of the growing period decreased storage root yields by 15 to 39% (Gong and
Wang 1990). The constant soil humidity was proved to reduce adventitious roots (Pardales
et al. 2000). In water logging conditions, plants do not develop effective roots because
underground parts of plants do not have enough oxygen to carry out metabolic reactions.
Consequently, storage roots rot. Inversely, prolonged drought conditions reduce the
formation and growth of roots and dry matter accumulation (Bourke 1989; Pardales et al.
2000). Therefore, a balanced level of water availability is necessary for good production of
sweetpotato.
1.3 Storage root formation, dry matter synthesis, accumulation
and genetics in sweetpotato
The formation of sweetpotato storage roots is a complex process involving various
phenomena such as stopping of root elongation, initiation of first and second vascular
cambia, development of anomalous and interstitial cambia, increasing of radial growth, cell
proliferation and expansion, and massive accumulation of starch and proteins (Desai 2008;
Ravi et al. 2009). Typically, a storage root has to stop elongation growth but continues radial
growth (Desai 2008). The initiation of storage root starts with the thickening of stellar
structure of adventitious roots, followed by a formation of a circular primary vascular
cambium and other several cambia in sub-apical regions of the thickening root (Ravi and
Indira 1999). These cambia are meristematic tissues which undergo many mitotic cell
divisions resulting into the formation of starch storing tissues, growth of storage root and
suppression of stele lignification. All these processes are controlled by endogenous
phytohormones which are expressed by different genes (Ravi et al. 2009).
Cytokinins are the main phytohormones involved in root formation. Zeatin riboside, trans-
zeatin riboside and 9-glycosyl-N-62-isopentenyl adenosine were identified to be responsible
for the initiation of cambia tissues (Tanaka et al. 2005; Wang et al. 2005). These cytokinins
and others such as isopentenyladenine and dihydrozeatin riboside were proven to play a
pivotal role in the initiation and proliferation of cambia tissues of storage root (Desai 2008).
18
Ku et al. (2008) observed that abscisic acid stimulates cell division of cambial meristematic
tissues by interacting with other cytokinins and results in the growth of storage roots.
Storage root growth takes place at cellular level and involves the expansion in size by
increasing the cell number, size and weight by accumulation of photosynthesis products
(Desai 2008; Ravi et al. 2009). The accumulation of dry matter is associated with the ability
of the root to attract photo-assimilated products from the leaves. The photosynthesized
sucrose is moved from leaves through the stem, towards underground parts including
storage roots (Li 2008). Sucrose is split into hexoses which are transformed to glucose-1
phosphate, which is then used to synthesise starch in the amyloplasts. Reactions of starch
synthesis are mainly catalysed by ADP-glucose pyrophosphorylase and starch synthase
(Nakatani and Komeichi 1992; Li 2008).
Studies of molecular mechanisms of synthesis and accumulation of dry matter revealed that
products expressed by knotted-like homeobox (KNOXI), MADS-box and polyamine genes
play an important role in the formation of sweetpotato storage roots (Chen et al. 2003; Ku et
al. 2008; Tanaka et al. 2008). Products expressed by KNOXI genes were identified in initial
and growing sweetpotato storage roots (Tanaka et al. 2008). It was observed that an up
regulated of KNOXI genes expression is associated with the reduction of lateral root
development (Scanlon et al. 2002) whereas the down regulation of these genes is linked to
an increase of the number of lateral roots. Products of KNOXI genes were identified to
regulate the cytokinin level in the storage roots of sweetpotato and a high expression of
KNOXI genes was associated with a high synthesis of cytokinins (Chen et al. 2003; Tanaka
et al. 2008). The concentration of trans-zeatin riboside content in the growing sweetpotato
storage roots was identified to be correlated with the level of expression of KNOXI genes.
This observation suggested an active involvement of products of KNOXI genes in the
formation of storage roots of sweetpotato (Tanaka et al. 2008). Products of MADS-box
genes were identified to stimulate the production of phytohormones such as jasmonic acid
and cytokinins which participate in the initiation and development of sweetpotato storage
roots (Ku et al. 2008). Spermidine and other products coded by polyamine genes were
identified to play an important role of pathway signal transduction, protein kinase activation
and transcription factors that increase genes expression during storage root formation and
growth (Kasukabe et al. 2006). Indeed, many gene products were identified to be involved in
dry matter synthesis. The expression of genes coding for these products was identified to be
extremely highly influenced by genetic effects and not by factors such as water deficit (Ravi
and Indira 1999; Ravi et al. 2009), soil and air temperature (Li 2008) and physiology and age
19
of seedling (Caldiz et al. 1996). However, there are many other aspects of storage root and
dry matter synthesis that need to be further investigated and understood.
1.4 Breeding of sweetpotato
Sweetpotato breeding has been slower than that of several other staple crops because of
the inherent nature of the crop including polyploidy, poor flowering and seed set, self- and
cross-incompatibility, heterozygosity and large chromosome number. In other cases,
flowering periods are different between sweetpotato genotypes and these periods are
affected by environmental conditions (Jones et al. 1986). The hexaploidy status (Jones and
Deonier 1965; Vimala and Hariprakash 2011) and the irregular meiotic division of
sweetpotato (Ting and Kehr 1953; Jones and Deonier 1965; Maluf et al. 1983) have
negatively affected the progress of breeding programmes. In addition, the pollen and
fertilization incompatibility are a big challenge to sweetpotato breeders (Martin 1965). Thus,
a successful breeding program has to overcome these challenges to achieve greater
selection efficiency.
Application of induction techniques and control of environmental conditions have improved
the flowering and seed production of sweetpotato (Jones, 1986). It was observed that the
induction of physiological shocks, grafting, girdling and chemical treatment can improve the
flowering of sweetpotato (Jones et al. 1986). Miller (1939) revealed that the fertilization of the
ovule, and seed production are temperature, humidity and light dependent. When the
temperature is very low, the fertilisation is poor because of inefficient germination of pollen
and growth of pollen tube. Moreover, the tropical climate favours flowering and seed
production than the temperate conditions. Jones et al. (1986) observed that seed production
is reduced when sweetpotato vines present a high vegetative growth. The authors also
pointed out that the circulation of air through the plant canopy improves the seed set of
sweetpotato. All these findings have an important implication on sweetpotato breeding.
Sweetpotato breeding programmes often have a common overall objective but differ in
specific objectives. The overall objective of sweetpotato breeding programme is usually to
improve the quality and quantity of sweetpotato production though the selection and
development of new varieties (Jones et al. 1986; Kapinga and Carey 2003). Specific
objectives vary depending on needs. Many breeding programmes of sweetpotato focus on
the development of new varieties with high nutrient content such as β-carotene, anthocyanin
and iron, and high yield, dry matter and biomass production (Jones et al. 1986; Fuglie 2007;
20
Gruneberg et al. 2009; Mwanga et al. 2010). All breeding programmes usually lead to the
development of cultivars with high yield, resistance to abiotic and biotic stresses, and other
different characteristics that enhance acceptability by end users (Kapinga and Carey 2003)
Therefore, it is necessary to define the objectives of a breeding programme because this
guides the choice of potential parents and ensuing breeding method.
Each breeding programme requires a source of valuable genes. Therefore, characterisation
of available germplasm and identification of potential parents is a starting point of breeding
programmes (Mitra 2001; Shumbusha et al. 2010). There are recognized institutions such as
Vegetable Breeding Laboratory of Charleston and Louisiana sweetpotato research center in
USA, Asian Vegetable Research and Development Center (AVRDC) in Taiwan, Genetic
Resources Unit of the International Institute for Tropical Agriculture (IITA) at Ibadan/Nigeria
and the International Potato Centre (CIP) in Peru that keep genetic collections of
sweetpotato (Villareal and Lo 1983; Iwanaga 1988; Tjintokohadi and Mok 2001). These
institutions can provide potential parents for a sweetpotato breeding programme if local
landraces do not have good sources of genes for characteristics of interest.
1.4.1 Breeding of sweetpotato for drought tolerance
Breeding of sweetpotato is carried out through random polycross and hand pollination
(Gruneberg et al. 2009). In the polycross method, crossing blocks are installed and allowed
to be naturally open pollinated by insects (Nyquist and Santini 2007). This method is very
useful to generate a genetic diversity in a sweetpotato population but it is not efficient in
genetic studies because of the source of pollen is unknown. Therefore, the hand pollination
method was proposed to overcome this problem (Acquaah 2007). The hand pollination is
carried out in four main steps of preventing insect pollination before doing hand pollination,
hand pollination, preventing insect pollination after hand pollination and labelling (Jones and
Deonier 1965; Jones et al. 1986). This method is commonly applied to ensure cross
combinations of different characteristics in the hybrid seeds through a highly demanding
practice (Jones et al. 1986; Wilson et al. 1989; Gruneberg et al. 2009). When using hand
pollination the commonly used matting designs in the sweetpotato breeding are diallel and
North Carolina (Mihovilovich et al. 2000; Mwanga et al. 2002; Chiona 2009; Gasura et al.
2010).
Breeding for drought tolerance is complicated because of a negative correlation between
some stress adaptive traits and crop yield (Chapin et al. 1993). Zehui (1996) observed that
the use of yield components as the unique indicators for drought tolerance is not sufficient.

21
Physiological, morphological and biochemical characters that may show the drought
tolerance were proposed through greenhouse and laboratory studies (Blum 2002). However,
some varieties selected under greenhouse and laboratory conditions did not show the
drought tolerance under field conditions (Sorrells et al. 2000). This indicates that the
expression of genes for drought tolerance is strongly affected by environmental conditions
(Cheema and Sadaqat 2004).
Knowledge of environmental effects on the expression of genes leads to breeders to adopt
new methods to develop drought tolerant varieties. Efforts of breeders are oriented on the
development of varieties that can produce in an environment where the rainfall is irregular in
the distribution and quantity. This is because crops must have a minimum level of water to
sustain growth (Acquaah 2007). Zehui (1996) suggested that it is necessary to explore all
morphological, biochemical and physiological characters associated with drought tolerance
during the screening process. Also it was suggested that selection should be carried out in
environments in which a new crop variety will be released and grown (Cheema and Sadaqat
2004; Abidin et al. 2005; Mwanga et al. 2007).
Sexual reproduction of sweetpotato generates genetic variability in which valuable clones
are selected further. The mass selection method was first suggested because most
important traits of sweetpotato are quantitative. Also the population improvement through
recurrent selection method was adopted (Carey et al. 1992). Ekanayake, (1990) proposed
two stages in the approach to screen sweetpotato for drought tolerance. Firstly, genotypes
have to be evaluated in a screening nursery using yield and pulling resistance as selection
criteria. Secondly, selected genotypes have to be evaluated under drought conditions in a
field for physiological traits, water use efficiency and yield. Genotypes identified as drought
tolerant could be used as progenitors for combining with other favourable traits.
Selection and breeding for varieties that perform very well under drought conditions is a key
factor to improve the production of sweetpotato. Studying sweetpotato varieties for 70 days
under drought conditions, Hou et al., (1999) observed a significant difference in a survival
rate which was associated with drought tolerance. However, the authors did not find a
correlation between drought tolerance and above ground growth. The evaluation of drought
tolerance of 50 genotypes revealed a yield range from 0.76 to 73.85 g per plant and 17
genotypes were identified to be drought tolerant (Ding et al. 1997). Anselmo et al. (1998)
investigated the drought tolerance of clones of high yielding cultivars and their progenies
from open pollination in the Philippines for two years in the dry season. Based on yield, the
authors found that some clones and open pollinated progenies were drought tolerant.
22
Identification and characterisation of genes have a positive effect on the genetic engineering
for tolerance to drought stress (Acquaah 2007). Genetic engineers have tried to develop
transgenic plants resistant to drought by using isolated genes. Genes coding for sperimidine
synthase were used to improve environmental stress of sweetpotato. These transgenic
plants have revealed tolerance to drought, salt, chilling and heat stresses (Kasukabe et al.
2006). Transgenic plants of sweetpotato containing the gene from Spinacia oleracea
encoding the betaine aldehyde dehydrogenase revealed increased glycine betaine
accumulation and betaine aldehyde dehydrogenase activity. These plants have shown
tolerance to multiple environmental stresses with high ability of protection against cell
damage, strong photosynthetic activity, reduced production of ROS and increased activity of
free radical scavenging enzymes (Fan et al. 2012). Transgenic potato plants with the genes
of Cu / Zn superoxide dismutase and ascorbate peroxidase were developed. These plants
showed enhanced tolerance to multiple environmental stresses including high temperature
compared to non-transgenic plants (Tang et al. 2006). Even though genetic engineering
revealed promising results, its progress is limited by a shortage of successful screening
methods and multidisciplinary approach and genotype by environment interactions (Mitra
2001).
1.4.1.1 Methods of screening for drought
Drought-tolerance studies can be carried out under field or controlled environmental
conditions (Acquaah 2007). Field trials are carried out under natural conditions which are
real environment of a plant but this environment presents some limitations of fluctuation of
water availability caused by unpredictable rainfall. Moreover, environmental factors such as
temperature, air humidity and light are variable. Therefore, field screening for drought
tolerance is complicated by unpredictable environmental conditions (Lafitte et al. 2004). The
rainout shelter and in vitro techniques were proposed to overcome the limitations of selection
for drought tolerance under field conditions (Acquaah 2007). The rainout shelter is a mobile
infrastructure that protects genotypes under experiment from rain. This method permits to
control the uniformity of water supply to plants (Blum 2002). The in vitro approach consists
on growing cells or tissues of plant or plantlets on a defined drought stressing culture media
under an aseptic and controlled environment (Wang et al. 1999; Ahloowalia et al. 2004). The
in vitro technique provides precise results but the working environment differs from the
natural environment of crops. Therefore, the combination of in vitro screening with selection
under the natural condition or under the rainout shelter could improve the quality of results.
23
Drought tolerance can be identified by quantifying phenological, morphological, physiological
and biochemical characteristics and using molecular tools (Blum 2002). Phenological and
morphological characteristics are the most used in breeding for drought tolerance. In these
approaches data collection consists of measurement of plant growth (size of roots, stem and
leaf area, accumulation of fresh and dry biomasses), growth stage (days to flowering and
maturity), senescence, leaf rolling and yield loss (Spitters and Schaapendonk 1990; Cheema
and Sadaqat 2004). The water content and water potential of the crops are indicators of
drought tolerant varieties. A variety that maintains its internal water status under drought
stress is considered drought tolerant (Acquaah 2007). Drought tolerance is also determined
by quantifying plant biochemical products such as compatible solutes, chlorophyll,
antioxidants and other proteins produced by plants as responses to drought stress (Wang et
al. 1999; Reddy et al. 2004; Kasukabe et al. 2006). Diffusion porometry for leaf water
conductance, root penetration, distribution and density in the field and infrared aerial
photography for dehydration are used commonly in studies for drought tolerance (Mitra
2001).
Molecular tools to select for drought tolerance have been developed (Srisuwan et al. 2006;
Acquaah 2007). The basis of this molecular approach is due to the progress of genomics,
transcriptomics, metabolomics and proteomics. Among these tools, DNA molecular markers
based on the hybridization, polymerase chain reaction and DNA sequence are the most
commonly used (Tuberosa and Salvi 2006; Michael et al. 2008). Simple sequence repeats
(SSRs) or microsatellites genetic markers are commonly used in sweetpotato studies. They
have been used in genetic characterization of sweetpotato germplasm (Buteler et al. 1999;
Veasey et al. 2008; Karuri et al. 2010) and analysis of paternity in polyploidy sweetpotato
(Buteler et al. 2002). Other molecular markers such as Restriction Fragment Length
Polymorphisms (RFLPs), Random Amplified Polymorphic DNAs (RAPDs), Sequence
Tagged Sites (STS), Amplified Fragment Length Polymorphisms (AFLPs), Single Nucleotide
Polymorphisms (SNPs) were also proposed in genetic and breeding studies (Acquaah
2007). However, the utilisation of molecular approach in a plant breeding requires a well-
equipped laboratory and trained personnel (Srisuwan et al. 2006).
1.4.1.2 Inheritance of drought tolerance
Drought tolerance is reportedly a complex trait because of the heterogeneity of drought
stress in time and space, and unpredictable characteristics of drought stress (Sorrells et al.
2000). Drought tolerance involves actions and interactions of various biochemical,
morphological and physiological mechanisms that are controlled by products expressed by
24
different genes (Mitra 2001; Acquaah 2007). Moreover, it is difficult to study isolated single
gene and to understand its role of drought tolerance in crop plants (Mitra 2001).
Both qualitative and quantitative inheritances were found in traits associated with drought
tolerance. Ekanayake et al. (1985) observed that root characteristics are controlled by a
qualitative inheritance under drought condition. Leaf rolling, osmotic adjustment and number
of roots were identified to be qualitative traits (Mitra 2001). Study of water deficit mediator
genes indicated that crop species vary in symptoms and reactions to water deficit (Sorrells et
al. 2000). The genes responsible for earliness of stem reserves, leaf persistence and
dwarfing were identified to be associated with drought tolerance (Foulkes et al. 2007). In rice
and cowpea a drought resistance gene linked with genes for plant height and pigmentation
was reportedly pleiotropic on a root system (Morgan 1995; Mitra 2001; Agbicodo et al.
2009). Other proposed candidate genes that are involved in drought tolerance are genes
coding for dehidrin proteins that protect cellular components under dehydration conditions
(Shinozaki and Yamaguchi-Shinozaki 2007), proteins controlling the equilibrium and
damages of ROS (Foyer and Noctor 2005), proteins involving in the osmotic adjustment and
plant morphology (Moinuddin et al. 2005; Ober 2008) and enzymes involved in the
accumulation of compatible solutes (Mitra 2001). Indeed, drought tolerance involves many
genes which code for products working in a highly coordinated network.
1.4.2 Breeding of sweetpotato for high dry matter content
High dry matter content is one of the main specific objectives of many sweetpotato breeding
programmes. It was found that the dry matter content of sweetpotato varies depending on
variety, location, climate, incidence of pests and diseases, cultural practices or soil types
(Jones et al. 1986; Manrique and Hermann 2000; Shumbusha et al. 2010; Vimala and
Hariprakash 2011). Narrow sense heritability ranging between 0.65 and 0.92 was identified
for dry matter content. In addition, transgressive segregation for dry matter content has been
observed in sweetpotato progenies (Cervantes-Flores et al. 2008). These findings and the
existence of several enzymes involved in starch biosynthesis indicate that the dry matter
content is a quantitative trait (Cervantes-Flores et al. 2008). Jones, (1986) reported that the
value of a new sweetpotato variety depends on the combination of the desirable trait with
other characteristics. Therefore, characteristics that meet farmers’, consumers’ and market
preferences have to be considered in the selection process of new cultivars.
25
1.4.2.1 Approaches to screening for high dry matter content
1.4.2.1.1 Morphological markers
Screening for high dry matter content can be direct or indirect depending on the correlation
between dry matter content and other traits (Acquaah 2007). In the direct approach the
screening is mainly based on the weight of dry root mass (Ma et al. 2009; Vimala and
Hariprakash 2011). To determine dry matter content, a precise quantity of fresh weight of
root is excised and dried to constant weight. Then, the dry matter content is determined as a
ratio of dry weight and initial fresh weight (Shumbusha et al. 2010). In the indirect approach,
clones with a high dry matter can be selected by quantifying the starch continent of the root.
This method is based on a high positive correlation between dry matter and starch content
(Ma et al. 2009; Cervantes-Flores et al. 2011). Because of genotypic variance and genotype
by environment interactions, it was suggested that dry matter and starch content may be
improved with a high selection efficiency in the earlier stages (Grunerberg et al. 2005).
1.4.2.1.2 Molecular markers
Molecular markers are alternative tools that can be used in the screening for high dry matter
content (Cervantes-Flores et al. 2011). These molecular markers have showed important
potential to improve the efficiency and precision of conventional breeding techniques
(Acquaah 2007). The large number of quantitative trait loci (QTLs) mapping studies for
diverse crops species have provided an abundance of DNA marker-trait associations. The
principle of molecular marker development consists of population development, QTL
mapping, QTL validation, marker validation and marker-assisted selection (Collard and
Mackill 2008). These molecular markers are useful for selection of traits with low heritability
(Gupta et al. 1999; Collard and Mackill 2008).
1.5 Gene action and correlation between traits
Important traits in crops are controlled by quantitative genes which have different gene
action (Mitra 2001). Gene effects are simply described by gene action which can be additive,
dominant or epistatic (Acquaah 2007). The expression of a trait is dependent on genotype,
environment and genotype by environment (G×E) interactions (Cheema and Sadaqat 2004).
Therefore, the gene action needs a particular analysis in each case study involving various
genotypes and environments through appropriate genetic designs (Acquaah 2007).
26
Various gene actions have been identified and described in different studies on sweetpotato.
Miller, (1939) found that white skin, green stem and white flesh are dominant over red skin,
red stem and yellow flesh of sweetpotato. Ma (2009) observed that the inheritance of β-
carotene is controlled by additive gene effects. The additive gene effects were identified in
the inheritance of dry matter and β-carotene content (Chiona 2009). Vimala and Hariprakash
(2011) found the continuous and overlapping characters of vine, storage root, dry matter and
cooking qualities of sweetpotato. More than five genes were suggested to be involved in the
β-carotene synthesis and in combination with other genes to determine the flesh colour of
storage roots of sweetpotato. Heterosis was observed for the size and number of roots per
plant, indicating dominance gene action or intra-allelic interaction between alleles of the
same gene (Gasura et al. 2010). These findings emphasise the quantitative nature of many
sweetpotato traits and indicate that several plant characteristics associated with yield are
controlled by more than two genes acting and interacting in a complex model. Therefore, the
combination of two or more than two quantitative traits in one cultivar requires knowledge of
the gene action and correlation between these traits to improve the selection response.
Traits can be positively or negatively correlated or not correlated (Acquaah 2007). The
existence of positive correlation between traits implies that improvement of one trait results
in the improvement of the other trait requiring simultaneous selection. While negative
correlation between traits means that the improvement of one trait causes an obligatory
decrease of the other trait. The absence of correlation indicates that each trait can be
improved independently without affecting another (Acquaah 2007). However, the complete
absence of correlation between one trait and others is a rare case in plant breeding. For
example, the breeding for orange-flesh sweetpotato with a high β-carotene, iron and zinc
contents is challenged by a strong negative genetic correlation with dry matter content
(Gruneberg et al. 2009; Ma et al. 2009; Vimala and Hariprakash 2011). This negative
association of dry matter and β-carotene content was attributed to a competition between
starch and β-carotene because both are synthesised in plastids (Cervantes-Flores et al.
2008). Ma-Teresa et al. (1994) observed a negative correlation between root dry matter
content and root yield. A negative correlation was also noted between dry matter and soluble
sugar content of sweetpotato (Gruneberg et al. 2009). However, the correlation between dry
matter and drought tolerance in sweetpotato is poorly documented.
27
1.6 Genotype by environment (G×E) interaction and yield stability
Plant growth and production are a result of interactions of its genetic potential and
environment. Plants perform well in environments in which they are adapted (Acquaah
2007). The performance of genotypes is quantified in terms of wide and specific adaptability
and yield stability (Abidin et al. 2005). Wide adaptability is generally attributed to genotypes
performing well over large areas and presenting high mean yields across different
environments. A variety has a specific adaptability when it ranks among the highest yielding
genotypes at only some locations. The stability which can be static or dynamic is the ability
of a genotype to perform consistently across a wide range of environments (Acquaah 2007).
Knowledge of types of genotype by environment (G×E) interactions is very important before
release to decide if a new variety has wide or specific adaptation (Manrique and Hermann
2000; Grunerberg et al. 2005).
G×E interactions are differential genotypic expressions across multiple environments
(Acquaah 2007). They complicates the comparison of the performance of genotypes across
environments when a high number of genotypes and locations are involved and quite often
delay the selection process of a breeding programme (Caliskan et al. 2007). Prior to release
of a new variety, genotypes of high yield potential are evaluated at different locations for
several years to identify their G×E interactions and yield stability (Acquaah 2007). Therefore,
breeders need robust biometrical methods to estimate phenotypic stability and to analyse
G×E interactions (Bacusmo et al. 1988; Becker and Leon 1988).
1.6.1 Approaches to evaluate G×E interaction and yield stability
There are various methods to estimate the phenotypic stability and to analyse the G×E
interactions (Bacusmo et al. 1988; Caliskan et al. 2007). These methods are classified into
two main groups of univariate stability statistics and multivariate methods (Becker and Leon
1988). The univariate stability statistics can be parametric by using variance of a genotype
across environments (Shukla 1972), ecovalence, regression coefficient (Finlay and
Wilkinson 1963; Russell and Eberhart 1966; Shukla 1972), deviation mean squares, or
coefficient of determination to identify the stability of genotypes (Becker and Leon 1988). It
can also be nonparametric when it is based on rank orders of genotypes using mean or
variance ranks (Becker and Leon 1988). Multivariate methods of analysis of G×E
interactions consist of a wide range of methods including multivariate analysis of variance
(MANOVA), cluster analysis, principal component analysis, additive main effects and
28
multiplicative interactions (AMMI), GGE-bioplot, geometrical methods and stochastic
dominance (Becker and Leon 1988; Gauch and Zobel 1996; Purchase 1997; Yan 2001).
Both univariate stability statistics and multivariate methods are based mainly on the analysis
of variance, regression methods, or principal component analysis.
1.6.2 G×E interaction and yield stability of sweetpotato
Sweetpotato is very sensitive to environmental changes (Carpena et al. 1980; Bacusmo et
al. 1988). Grunerberd et al. (2005) observed variations in the yield and stability in the multi-
environmental trials of different genotypes of sweetpotato. A significant G×E interaction was
found for the mean storage root weight and storage root yield. However, the contribution of
genotype main effects to the total variability was bigger than the environment and G×E
interaction effects (Caliskan et al. 2007). The analysis of combined and AMMI analysis of
total storage root yield of sweetpotato genotypes revealed high significant effects of
genotype, environment and G×E interactions. The genotype mean effects explained 67.9%
of the total variation whereas environment and G×E interactions explained 21.0% and 10.4%
respectively of total variation (Caliskan et al. 2007). Genotype, environment and G×E
interaction effects for average storage roots were significant in combined and AMMI
analysis. The genotype mean effects explained 49.5% of the total variation and G×E
interactions explained 23.5% (Caliskan et al. 2007). Manrique and Hermann (2000) found
that β-carotene content in roots increases with altitude. However, they did not find a high
yielding variety with sufficient stability for total root yield. The G×E analysis with regression,
AMMI and cluster analysis methods revealed that the G×E interactions for yield traits were
larger than genetic variation. However, the G×E interactions for nutritional traits of
sweetpotato were small (Grunerberg et al. 2005). Although the presence of significant G×E
interactions for wide and specific yield stability and quality of sweetpotato has been reported
(Ngeve 1993; Manrique and Hermann 2000; Caliskan et al. 2007), it has been observed that
it is difficult to get a variety with wide stability together with high yield and good performance
(Affleck et al. 2008).
Breeders and agronomists have to carry out multi-environmental trials to identify the stability
and G×E interactions of a new cultivar before its release (Grunerberg et al. 2005). However,
multienvironmental trials are very difficult to conduct because of cost of labor and lack of
seed or planting materials. Vermeer (1990) and Affleck et al. (2008) suggested that
identification of low number of best environments that have ability for differentiating
genotypes can reduce the cost of the breeding programme. In this regard, the use of at least
one favourable and one unfavourable environment in the early stage of selection of
29
sweetpotato was proposed to increase beneficial alleles in the breeding materials
(Grunerberg et al. 2005). This also requires an appropriate method to quantify the stability
across a range of environments.
The comparison of Russell's and Eberhart (1966), Tai's (1971) and biplot approaches in
studies of G×E interactions and yield stability of root crops concluded that the biplot analysis
presents advantages compared to other methods (Affleck et al. 2008). Caliskan et al., (2007)
and Hermann (2005) suggested that the additive main effects and multiplicative interaction
(AMMI) approach is the best to evaluate the G×E interactions and stability of sweetpotato
genotypes in multilocational trials. In the investigation of G×E interactions and stability
analysis of sweetpotato geneotypes, Caliskan et al. (2007) observed a significant correlation
between at least one parameter of Russell's and Eberhart, Tai's, and Shukla's methods. The
Russell's and Eberhart (1966) and Tai (1971) stability parameters gave similar ranking
patterns of genotypes. However, these genotypes were not stable for total storage root yield.
It was also found that ranking correlation based on the AMMI stability value (ASV) and
coefficient of variation (CV) was similar for average storage root weight and total storage
root (Caliskan et al. 2007). This indicates that the AMMI model provides similar information
of genotype stability as Russell's and Eberhart, Tai's, and Shukla's methods. Highly
significant ranking correlations were found among the deviations from regression, ASV, CV
and stability variances (Adugna and Labuschagne 2002). This revealed a close similarity
and effectiveness between univariate and multivariate methods to determine genotype
stability and G×E interactions. Studies to determine the stability of sweetpotato genotypes in
the multilocational trials have revealed that Russell’s and Eberhart (1966), Tai (1971),
Shukla (1972) methods give the same results (Bacusmo et al. 1988). Ngeve (1993) using
the regression method with Russell’s and Eberhart (1966) and Shukla (1972) approaches to
analyse G×E interactions in sweetpotato found irregularity in identifying stable genotypes.
Causes of this irregularity were attributed to the use of various regression parameters which
interpret stability in different ways. Because of various methods to estimate the G×E
interactions and yield stability, most breeders use more than one method to get accurate
results (Bacusmo et al. 1988; Caliskan et al. 2007). However, the choice of a suitable
method depends on the intended purpose and required outcome.
1.7 Conclusions
Drought stress is one of the yield limiting factors in sweetpotato production causing an
annual yield loss estimated at 25%. It is associated with adverse changes at morphological,
30
physiological, biochemical and moleculear levels among genotypes. These changes are
useful indicators in the selection and breeding of drought-tolerant genotypes in sweetpotato.
The adoption of new varieties depends on the consideration of end-user’s preferences
during its development. High dry matter of storage root of sweetpotato is an important
characteristic for consumers and processors. Dry matter content above 25% is an important
factor for farmers to adopt a new variety of sweetpotato. For industrial use of sweetpotato
varieties with a dry matter content that is above 30% of fresh root weight is required. These
standards necessitate serious consideration of dry matter content in any breeding
programme aiming to develop a new variety of sweetpotato. Further, breeding of
sweetpotato for a specific trait requires understanding its genetic mechanism, presence of
genetic diversity, efficient crossing and selection methods that lead to identification and
development of potential clonal cultivars.
1.8 References
Abidin, P., F. Eeuwijk, P. Stam, P. Struik, M. Malosetti, R.O.M. Mwanga, B. Odongo, M. Hermann and E. Carey. 2005. Adaptation and stability analysis of sweetpotato varieties for low input systems in Uganda. Plant Breeding 124: 491-497.
Acquaah, G. 2007. Principles of plant genetics and breeding. Wiley-Blackwell, Oxford.
Adugna, W. and M. Labuschagne. 2002. Genotype‐environment interactions and phenotypic stability analyses of linseed in Ethiopia. Plant Breeding 121: 66-71.
Affleck, I., J.A. Sullivan, R. Tarn and D. Falk. 2008. Genotype by environment interaction effect on yield and quality of potatoes. Canadian Journal of Plant Science 88: 1099-1107.
Agbicodo, E., C. Fatokun, S. Muranaka, R.G.F. Visser and C. Linden van der. 2009. Breeding drought tolerant cowpea: Constraints, accomplishments and future prospects. Euphytica 167: 353-370.
Ahloowalia, B.S., J. Prakash, V.A.C. Savangikar and C. Savangikar. 2004. Plant tissue culture. In: IAEA, editor, Low cost options for tissue culture technology in developing countries. International Atomic Energy Agency, Vienna. p. 3-11.
Ain-Lhout, F., M. Zunzunegui, M. Diaz Barradas, R. Tirado, A. Clavijo and F. Garcia Novo. 2001. Comparison of proline accumulation in two Mediterranean shrubs subjected to natural and experimental water deficit. Plant and Soil 230: 175-183.
Anselmo, B.A., Z.N. Ganga, E.O. Badol, Y.M. Heimer and A. Nejidat. 1998. Screening sweetpotato for drought tolerance in the Philippine highlands and genetic diversity among selected genotypes. Tropical Agriculture 75: 189-196.
Aregheore, E. 2004. Nutritive value of sweetpotato (Ipomea batatas (L) Lam) forage as goat feed: Voluntary intake, growth and digestibility of mixed rations of sweetpotato and

31
batiki grass (Ischaemum aristatum var. indicum). Small Ruminant Research 51: 235-241.
Bacusmo, J., W. Collins and A. Jones. 1988. Comparison of methods of determining stability and adaptation of sweetpotato. Theoretical and Applied Genetics 75: 492-497.
Baltzer, J.L., S.J. Davies, S. Bunyavejchewin and N. Noor. 2008. The role of desiccation tolerance in determining tree species distributions along the Malay-Thai Peninsula. Functional Ecology 22: 221-231.
Bartels, D. and R. Sunkar. 2005. Drought and salt tolerance in plants. Critical Reviews in Plant Sciences 24: 23-58.
Becana, M., J. Moran and I. Iturbe-Ormaetxe. 1998. Iron-dependent oxygen free radical generation in plants subjected to environmental stress: Toxicity and antioxidant protection. Plant and Soil 201: 137-147.
Becker, H. and J. Leon. 1988. Stability analysis in plant breeding. Plant Breeding 101: 1-23.
Blokhina, O., E. Virolainen and K.V. Fagerstedt. 2003. Antioxidants, oxidative damage and oxygen deprivation stress. Annals of Botany 91: 179-194.
Blum, A. 2002. Drought tolerance is it a complex trait? In: Saxena, N.P. and J.C. O’Toole, editors, Proceedings of an international workshop on field screening for drought tolerance in rice. Rockefeller Foundation, New York. p. 24-59.
Bourke, R.M. 1989. Influence of soil moisture extremes on sweetpotato yield in the Papua New Guinea highlands. Mountain Research and Development 9: 322-328.
Boyer, J.S. 1982. Plant productivity and environment. Science 218: 443-448.
Brenes, A.T., P.D. Coley and T.A. Kursar. 2009. Pests vs. drought as determinants of plant distribution along a tropical rainfall gradient. Ecology 90: 1751-1761.
Brosché, M., K. Overmyer, M. Wrzaczek and Kangasjarvi. 2010. Stress signaling III: Reactive oxigen species (ROS). In: Pareek, A., s.k. Sopory, J.H. Bohnert and Govindjee, editors, Abiotic stress adaptation in plant. Springer, Dordrecht. p. 91-102.
Buteler, M., R. Jarret and D. Labonte. 1999. Sequence characterization of microsatellites in diploid and polyploid Ipomoea. Theoretical and Applied Genetics 99: 123-132.
Buteler, M., D. Labonte, R. Jarret and R. Macchiavelli. 2002. Microsatellite-based paternity analysis in polyploid sweetpotato. Journal of the American Society for Horticultural Science 127: 392-396.
Caldiz, D.O., G. Brocchi, J. Alaniz and C. Marchan. 1996. Effects of the physiological age of seed potatoes on tuber initiation and starch and dry matter accumulation. Pesquisa Agropecuária Brasileira 31: 853-858.
Caliskan, M.E., E. Erturk, T. Sogut, E. Boydak and H. Arioglu. 2007. Genotype x environment interaction and stability analysis of sweetpotato (Ipomoea batatas) genotypes. New Zealand Journal of Crop and Horticultural Science 35: 87-99.
32
Carey, E., S. Gichuki, P. Ndolo, G. Turyamureeba, R. Kapinga, N. Lutaladio and J. Teri. 1997. Collaborative sweetpotato breeding in Eastern, Central, and Southern Africa. http://agris.fao.org/agris-search/search.do?recordID=QP1998000023.
Carey, E.E., E. Chujoy, T.R. Dayal, H.M. Kidane-Mariam, H.A. Mendoza and I.G. Mok. 1992. Combating food shortages and poverty: Sweetpotato breeding for CIP’s client countries. CIP circular 19: 1-6.
Carpena, A., E. Rebancos Jr, P. Manguiat, M. Zalameda, G. Sajise Jr and J. Pedro. 1980. Stability of yield performance of some sweetpotato culttvars. Philippine Journal of Crop Science 5: 30-33.
Cervantes-Flores, J.C., B. Sosinski, K.V. Pecota, R.O.M. Mwanga, G.L. Catignani, V.D. Truong, R.H. Watkins, M.R. Ulmer and G.C. Yencho. 2011. Identification of quantitative trait loci for dry-matter, starch, and beta-carotene content in sweetpotato. Molecular Breeding 28: 201-216.
Cervantes-Flores, J.C., G.C. Yencho, A. Kriegner, K.V. Pecota, M.A. Faulk, R.O.M. Mwanga and B.R. Sosinski. 2008. Development of a genetic linkage map and identification of homologous linkage groups in sweetpotato using multiple dose AFLP markers. Molecular Breeding 21: 511-532.
Chapin, F.S., K. Autumn and F. Pugnaire. 1993. Evolution of suites of traits in response to environmental stress. American Naturalist 142: 78-92.
Chassy, B., M. Egnin, Y. Gao, G. Kleter, P. Nestel, M. Newell-McGloughlin, R. Phipps and R. Shillito. 2008. Nutritional and safety assessments of foods and feeds nutritionally improved through biotechnology. Comprehensive Reviews in Food Science and Food Safety 7: 50-113.
Chaves, M.M., J.P. Maroco and J.S. Pereira. 2003. Understanding plant responses to drought from genes to the whole plant. Functional Plant Biology 30: 239-264.
Cheema, K.L. and H.A. Sadaqat. 2004. Potential and genetic basis of drought tolerance in canola (Brassica napus): Generation mean analysis for some phenological and yield components. International Journal of Agriculture and Biology 6: 74-81.
Chen, H., F.M. Rosin, S. Prat and D.J. Hannapel. 2003. Interacting transcription factors from the three amino acid loop extension superclass regulate tuber formation. Plant physiology 132: 1391-1404.
Chiona, M. 2009. Towards enhancement of β-carotene content of high dry mass sweetpotato genotypes in Zambia. PhD. Thesis. University of KwaZulu-Natal, Pietermaritzburg.
Chowdhhury, S. and S. Naskar. 1993. Screening of drought tolerant trait in sweetpotato: Role of relative water content. Orissa Journal of Horticulture 21: 1-4.
Coley, P.D., T.A. Kursar and T. Brenes-Arguedas. 2009. Pests vs. drought as determinants of plant distribution along a tropical rainfall gradient. Ecology 90: 1751-1761.
Collard, B.C.Y. and D.J. Mackill. 2008. Marker-assisted selection: An approach for precision plant breeding in the twenty-first century. Biological Sciences 363: 557-572.
33
Connolly, A., I. Godwin, M. Cooper and I. DeLacy. 1994. Interpretation of randomly amplified polymorphic DNA marker data for fingerprinting sweetpotato (Ipomoea batatas L.) genotypes. Theoretical and Applied Genetics 88: 332-336.
Cornic, G. 2000. Drought stress inhibits photosynthesis by decreasing stomatal aperture not by affecting ATP synthesis. Trends in Plant Science 5: 187-188.
Dale, M.F.B. and J.E. Bradshaw. 2003. Progress in improving processing attributes in potato. Trends in Plant Science 8: 310-312.
Debarry, M., I. Marten, A. Ngezahayo and H.A. Kolb. 2005. Differential defense responses in sweetpotato suspension culture. Plant Science 168: 1171-1179.
Desai, D.P. 2008. Understanding the genetic basis of storage root formation along with starch and betacarotene biosynthesis and their inter-relation in sweetpotato (Ipomoea batatas Lam.). PhD. Thesis. Institut für Angewandte Genetik und Zellbiologie, Seibersdorf.
Ding, C.W., F.X. Niu, X.D. Guo and H. X.X. 1997. Identification on the drought resistance in sweetpotato genetic resource. Journal of Henan Agricultural Sciences 10: 3-5.
Eathington, S.R.C., T.M. Edwards, M.D. Reiter, R.S. Bull and K. Jason. 2007. Molecular markers in a commercial breeding program. Crop science 47: 154-163.
Ehleringer, J. and T. Cooper. 1992. On the role of orientation in reducing photoinhibitory damage in photosynthetic-twig desert shrubs. Plant, Cell and Environment 15: 301-306.
Ekanayake, I., J. Garrity and D. Masajo. 1985. Inheritance of root characters and their relations to drought resistance in rice. Crop science 25: 927-933.
Ekanayake, I.J. 1990. Evaluation of potato and sweetpotato genotypes for drought resistance. CIP, Lima.
Fan, W., M. Zhang, H. Zhang and P. Zhang. 2012. Improved tolerance to various abiotic stresses in transgenic sweetpotato (Ipomoea batatas) expressing spinach betaine aldehyde dehydrogenase. PloS one 7: 37344-37358.
FAOSTAT. 2013. Statistics division. FAO. http://faostat.fao.org/site/612/default.aspx#ancor (accessed Accessed 7 July 2015).
Finlay, K. and G. Wilkinson. 1963. The analysis of adaptation in a plant breeding programme. Australian Journal of Agriculture Sciences 14: 742-754.
Foulkes, M., R. Sylvester-Bradley, R. Weightman and J. Snape. 2007. Identifying physiological traits associated with improved drought resistance in winter wheat. Field Crops Research 103: 11-24.
Foyer, C.H. and G. Noctor. 2005. Redox homeostasis and antioxidant signaling: A metabolic interface between stress perception and physiological responses. The Plant Cell Online 17: 1866-1875.

34
Fu, J. and B. Huang. 2001. Involvement of antioxidants and lipid peroxidation in the adaptation of two cool season grasses to localized drought stress. Environmental and Experimental Botany 45: 105-114.
Fuglie, K.O. 2007. Priorities for sweetpotato research in developing countries: Results of a survey. Horticulture Science 42: 1200-1206.
Fukai, S. and M. Cooper. 1995. Development of drought-resistant cultivars using physiomorphological traits in rice. Field Crops Research 40: 67-86.
Gasura, E., A. Mashingaidze and S. Mukasa. 2010. Genetic variability for tuber yield, quality, and virus disease complex traits in Uganda sweetpotato germplasm. African Crop Science Journal 16: 147-160.
Gauch, H. and R. Zobel. 1996. AMMI analysis of yield trials. In: Kang, M.S. and H.G. Gauch, editors, Genotype by environment interaction. CRC Press, Boca Raton, FL. p. 1-40.
Gong, H., X. Zhu, K. Chen, S. Wang and C. Zhang. 2005. Silicon alleviates oxidative damage of wheat plants in pots under drought. Plant Science 169: 313-321.
Gong, Y. and G. Wang. 1990. An investigation on the effect of drought stress on growth of sweetpotato and measures to improve drought resistance and stabilize yields. Zhejiang Agricultural Sciences 3: 26-29.
Gruneberg, W., R. Mwanga, M. Andrade and J. Espinoza. 2009. Breeding clonally propagated crops In: Ceccarelli, S., E.P. Guimarães and E. Weltzien, editors, Plant breeding and farmer participation. Food and Agriculture Oganization of the United Nations, Rome. p. 275-323.
Grunerberg, W.J., D. Zhang, K. Manrique and M. Hermann. 2005. Genotype x environment interaction for a diverse set of sweetpotato clones evaluated across varying ecogeographic conditions in Peru. Crop science 45: 2160-2171.
Gupta, J., R. Bardoloi, P. Reddy and A. Das. 2009. Performance of crossbred pigs fed on raw and boiled sweetpotato tuber at various levels at different stages of growth. Indian Journal of Animal Sciences 79: 696-699.
Gupta, P., R.K. Varshney, P. Sharma and B. Ramesh. 1999. Molecular markers and their applications in wheat breeding. Plant Breeding 118: 369-390.
Haimeirong and F. Kubota. 2003. The effects of drought stress and leaf ageing on leaf photosynthesis and electron transport in photosystem 2 in sweetpotato (Ipomoea batatas Lam.) cultivars. Photosynthetica 41: 253-258.
Hare, P., W. Cress and J. Van Staden. 1998. Dissecting the roles of osmolyte accumulation during stress. Plant, Cell and Environment 21: 535-553.
Herbinger, K., M. Tausz, A. Wonisch, G. Soja, A. Sorger and D. Grill. 2002. Complex interactive effects of drought and ozone stress on the antioxidant defence systems of two wheat cultivars. Plant Physiology and Biochemistry 40: 691-696.
Hou, L.X., L.Z. Xiao, Z.H. Kang, X.P. Yang, J.H. Gu, B.J. Tang and J.B. Liu. 1999. Identification on drought tolerance resistance of sweetpotato varieties. Journal of Henan Agricultural Sciences 2: 5-6.
35
Indira, P. and S. Kabeerathumma. 1988. Physiological response of sweetpotato under water stress: Effect of water stress during the different phase of tuberization. Journal of Root Crops 14: 37-40.
Iwanaga, M. 1988. Use of wild germplasm for sweetpotato breeding. CIP, Lima.
Jackson, R.B., J.S. Sperry and T.E. Dawson. 2000. Root water uptake and transport: Using physiological processes in global predictions. Trends in Plant Science 5: 482-488.
Jones, A. and M. Deonier. 1965. Interspecific crosses among Ipomoea lacunosa, I. ramoni, I. trichocarpa, and I. triloba. Botanical Gazette 126: 226-232.
Jones, A., P. Dukes and J. Schalk. 1986. Sweetpotato breeding. In: Basset, M.J., editor, Breeding Vegetable Crops. IVA, Eastport. p. 1-35.
Kapinga, R. and E.E. Carey. 2003. Present status of sweetpotato breeding for Eastern and Southern Africa. In: Ree, D., Q.E.A. Van Oirschot and R.E. Kapinga, editors, Sweetpotato post harvest assessment: Experiences from East Africa. NRI ,CPHP, DFID, CIP and Ministry of Agriculture Tanzania, Chatman, UK. p. 3-8
Kariuki, J., C. Gachuiri, G. Gitau, S. Tamminga, J. Van Bruchem, J. Muia and K. Irungu. 1998. Effect of feeding napier grass, lucerne and sweetpotato vines as sole diets to dairy heifers on nutrient intake, weight gain and rumen degradation. Livestock Production Science 55: 13-20.
Karuri, H., E. Ateka, R. Amata, A. Nyende, A. Muigai, E. Mwasame and S. Gichuki. 2010. Evaluating diversity among Kenyan sweetpotato genotypes using morphological and SSR markers. International Journal of Agriculture and Biology 12: 33-38.
Kasukabe, Y., L. He, Y. Watakabe, M. Otani, T. Shimada and S. Tachibana. 2006. Improvement of environmental stress tolerance of sweetpotato by introduction of genes for spermidine synthase. Plant Biotechnology 23: 75-83.
Kennedy, A.D. 1993. Water as a limiting factor in the Antarctic terrestrial environment: A biogeographical synthesis. Arctic and Alpine Research 25: 308-315.
Kivuva, B.M. 2013. Breeding sweetpotato (Ipomoea batatas [L.] Lam.) for drought tolerance in Kenya. PhD thesis, University of KwaZulu-Natal, Pietermaritzburg, South Africa.
Ku, A.T., Y.S. Huang, Y.S. Wang, D. Ma and K.W. Yeh. 2008. IbMADS1 (Ipomoea batatas MADS-box 1 gene) is involved in tuberous root initiation in sweetpotato (Ipomoea batatas). Annals of Botany 102: 57-67.
Lafitte, H.R., A.H. Price and B. Courtois. 2004. Yield response to water deficit in an upland rice mapping population: Associations among traits and genetic markers. Theoretical and Applied Genetics 109: 1237-1246.
Larcher, W. 2000. Temperature stress and survival ability of Mediterranean sclerophyllous plants. Plant Biosystems 134: 279-295.
Lawlor, D.W. and W. Tezara. 2009. Causes of decreased photosynthetic rate and metabolic capacity in water deficient leaf cells: A critical evaluation of mechanisms and integration of processes. Annals of Botany 103: 561–579.
36
Lebot, V. 2009. Sweetpotato. In: Bradshaw, J.E., editor, Root and tuber crops: Handbook of plant breeding. Springer Sciences and Business Media, New York, NY 10013, USA. p. 97-125.
Lebreton, C., V. Lazi-Jani , A. Steed, S. Peki and S. Quarrie. 1995. Identification of QTL for drought responses in maize and their use in testing causal relationships between traits. Journal of Experimental Botany 46: 853-865.
Li, X.Q. 2008. Molecular characterization and biotechnological improvement of the processing quality of potatoes. Canadian Journal of Plant Science 88: 639-648.
Lin, K.H., P.Y. Chao, C.M. Yang, W.C. Cheng, H.F. Lo and T.R. Chang. 2006a. The effects of flooding and drought stresses on the antioxidant constituents in sweetpotato leaves. Botanical Studies 47: 417-426.
Lin, K.H., C.C. Tsou, S.Y. Hwang, L.F.O. Chen and H.F. Lo. 2006b. Paclobutrazol pre-treatment enhanced flooding tolerance of sweetpotato. Journal of Plant Physiology 163: 750-760.
Low, J., J. Lynam, B. Lemaga, C. Crissman, I. Barker, G. Thiele, S. Namanda, C. Wheatley and M. Andrade. 2009. Sweetpotato in Sub-Saharan Africa. In: Loebenstein, G. and G. Thottappilly, editors, The sweetpotato. Springer Verlag, Dordrecht, the Netherlands, p.34-69.
Ludlow, M.M. 1989. Strategies of response to water stress. In: Kreeb, K.H., H. Richter and T.M. Hinckley, editors, Structural and functional responses to environmental stresses. SPB Academic, The Hague. p. 269-281.
Ma-Teresa, L., C. Gerpcio-Sta Sta and C. Enrique. 1994. Heritability estimates of some root characters in sweetpotato. Philippines Jounal of Crop Sciences 19: 27-32.
Ma, D.-f., Q. Li, X.-y. Li, H.-m. Li, Z.-h. Tang, L. Hu, Q.-h. Cao, Y.-p. Xie and X. Wang. 2009. Selection of parents for breeding edible varieties of sweetpotato with high carotene content. Agricultural Sciences in China 8: 1166-1173.
Maluf, W., J. Miranda and P. Ferreira. 1983. Broad sense heritabilities of root and vine traits in sweetpotatoes (Ipomoea batatas [L.] Lam.). Revista Brasileira de Genética, Ribeirão Preto 6: 443-451.
Manrique, K. and M. Hermann. 2000. Effect of G x E interaction on root yield and beta carotene content of selected sweetpotato (Ipomoea batatas [L] Lam.) varieties and breeding clones. CIP, Lima.
Martin, F.W. 1965. Incompatibility in the sweetpotato. Economics and Botany 19: 406-415.
McCue, K.F. and A.D. Hanson. 1990. Drought and salt tolerance: Towards understanding and application. Trends in Biotechnology 8: 358-362.
Mcharo, M. and D.R. Labonte. 2010. Multivariate selection of AFLP markers associated with β-carotene in sweetpotatoes. Euphytica 175: 123-132.
Mckay, J.K., J. Richards and T. Mitchell-Olds. 2003. Genetics of drought adaptation in Arabidopsis thaliana: Pleiotropy contributes to genetic correlations among ecological traits. Molecular Ecology 12: 1137-1151.
37
McKibbin, R.S., N. Muttucumaru, M.J. Paul, S.J. Powers, M.M. Burrell, S. Coates, P.C. Purcell, A. Tiessen, P. Geigenberger and N.G. Halford. 2006. Production of high starch, low glucose potatoes through over expression of the metabolic regulator SnRK1. Plant Biotechnology Journal 4: 409-418.
Michael, J., M.I. Abdelbagi, R.M. Susan and J.M. David. 2008. Marker assisted breeding. In: Ashwani, P., K.S. Sudhir, J.B. Hans and Govindjee, editors, Abiotic stress adaptation in plants. Springer, Dordrecht, The Netherlands. p. 452-470.
Mihovilovich, E., H.A. Mendoza and L.F. Salazar. 2000. Combining ability for resistance to sweetpotato feathery mottle virus. Hortscience 35: 1319-1320.
Miller, J.c. 1939. Further studies and techniques used in sweetpotato breeding in Louisiana. The Journal of Heredity 30: 485-492.
Mitra, J. 2001. Genetics and genetic improvement of drought resistance in crop plants. Current Science 80: 758-763.
Moinuddin, F., R. Sayre and K. Reynolds. 2005. Osmotic adjustment in wheat in relation to grain yield under water deficit environments. Agronomy Journal 97: 1062-1071.
Monakhova, O. and I. Chernyad'ev. 2002. Protective role of kartolin-4 in wheat plants exposed to soil draught. Applied Biochemistry and Microbiology 38: 373-380.
Morgan, J. 1995. Growth and yield of wheat lines with differing osmoregulative capacity at high soil water deficit in seasons of varying evaporative demand. Field Crops Research 40: 143-152.
Mwanga, R., B. Odongo, C. Niringiye, R. Kapinga, S. Tumwegamire, P. Abidin, E. Carey, B. Lemaga, J. Nsumba and D. Zhang. 2010. Sweetpotato selection releases: Lessons learnt from Uganda. African Crop Science Journal 15: 11-23.
Mwanga, R.O.M., G.C. Yencho and J.W. Moyer. 2002. Diallel analysis of sweetpotatoes for resistance to sweetpotato virus disease. Euphytica 128: 237-248.
Mwanga, Z., M. Mataa and M. Msabaha. 2007. Quality and yield stability of orange fleshed sweetpotato (Ipomoea batatas) varieties grown in different agro-ecologies. African Crop Science 8: 339-345.
Nakatani, M. and M. Komeichi. 1992. Relationship between starch content and activity of starch synthase and ADP-glucose pyrophosphorylase in tuberous root of sweetpotato. Japan Journal of Crop Science 61: 463-468.
Noctor, G., A. Mhamdi and C.H. Foyer. 2014. The roles of reactive oxygen metabolism in drought: not so cut and dried. Plant physiology 164: 1636-1648.
Ngeve, J. 1993. Regression analysis of genotype x environment interaction in sweetpotato. Euphytica 71: 231-238.
Niu, F.X., Hua, X.X., Guo, X.D., Wu, J.Y., Li, H.M. and Ding, C.W. 1996. Studies on several physiological indexes of the drought resistance of sweetpotatoes and its comprehensive evaluation. Acta Agronomica Sinica 22: 392-398.
38
Nyquist, W. and J. Santini. 2007. Pollen dispersion within a population, nonrandom mating theory, and number of replications in polycross nurseries. Crop Science 47: 547-560.
Ober, E.S. 2008. Breeding for improved drought tolerance and water use efficiency. In: HGCA, editor, Arable cropping in a changing climate, Higham. 23-24 January 2008. HGCA. p.28-37.
Pardales, J., D.M. Bañoc, A. Yamauchi, M. Iijima and C. Esquibel. 2000. The effect of fluctuations of soil moisture on root development during the establishment phase of sweetpotato. Plant Production Science-Tokyo 3: 134-139.
Passioura, J.B. 1996. Drought and drought tolerance. Plant Growth Regulation 20: 79-83.
Purchase, J.L. 1997. Parametric analysis to describe genotype x environment interaction and yield stability in winter wheat. PhD. Thesis. University of the Orange Free State.
Ravi, V. and P. Indira. 1999. Crop physiology of sweetpotato. Horticultural Reviews 23: 277-338.
Ravi, V., S. Naskar, T. Makeshkumar, B. Babu and B.S.P. Krishnan. 2009. Molecular physiology of storage root formation and development in sweetpotato (Ipomoea batatas [L.]) Lam.). Journal of Root Crops 35: 1-27.
Reddy, A.R., K.V. Chaitanya and M. Vivekanandan. 2004. Drought induced responses of photosynthesis and antioxidant metabolism in higher plants. Journal of Plant Physiology 161: 1189-1202.
Ricardo, J. 2011. Screening sweetpotato (Ipomoea Batatas L.) for drought tolerance and high beta-carotene content in Mozambique. MSc. Dissertaion, University of KwaZulu-Natal, Pietermaritzburg, South Africa.
Richards, R. 1996. Defining selection criteria to improve yield under drought. Plant growth regulation 20: 157-166.
Russell, W. and S. Eberhart. 1966. Stability parameters for comparing varieties. Crop Science 6: 36-40.
Sairam, R., D. Shukla and D. Saxena. 1997. Stress induced injury and antioxidant enzymes in relation to drought tolerance in wheat genotypes. Biologia Plantarum 40: 357-364.
Sanguineti, M., R. Tuberosa, P. Landi, S. Salvi, M. Maccaferri, E. Casarini and S. Conti. 1999. QTL analysis of drought-related traits and grain yield in relation to genetic variation for leaf abscisic acid concentration in field grown maize. Journal of Experimental Botany 50: 1289-1297.
Saraswati, P., M. Johnston, R. Coventry and J. Holtum. 2004. Identification of drought tolerant sweetpotato (Ipomoea batatas [L.] Lam) cultivars. Australian Agronomy.
Scanlon, M.J., D.C. Henderson and B. Bernstein. 2002. SEMAPHORE1 functions during the regulation of ancestrally duplicated knox genes and polar auxin transport in maize. Development 129: 2663-2673.
Scott, G.J., R. Best, M. Rosegrant and M. Bokanga. 2000. Roots and tubers in the global food system: A vision statement to the year 2020. CIP, Lima.
39
Scott, G.J. and P. Ewell. 1993. Sweetpotato in African food systems. In: Scott, G.J., P.I. Ferguson and J.E. Herrera, editors, Product development for root and tuber crops: Africa. International Potato Center, Ibadan. p. 91-104.
Sherrard, M.E. and H. Maherali. 2006. The adaptive significance of drought escape in Avena barbata, an annual grass. Evolution 60: 2478-2489.
Shinozaki, K. and K. Yamaguchi-Shinozaki. 2007. Gene networks involved in drought stress response and tolerance. Journal of Experimental Botany 58: 221-227.
Shukla, G.K. 1972. Some statistical aspects of partitioning genotype-environmental components of variability. Heredity 29: 237-245.
Shumbusha, D., G. Tusiime, R. Edema, P. Gibson and R.O.M. Mwanga. 2010. Diallel analysis of root dry matter content in sweetpotato. Second Ruforum Biannual Meeting 1013-1017.
Slafer, G.A. and R. Savin. 1994. Source sink relationships and grain mass at different positions within the spike in wheat. Field Crops Research 37: 39-49.
Sorrells, M., A. Diab and M. Nachit. 2000. Comparative genetics of drought tolerance. Options Méditerranéennes 40: 191-201.
Spitters, C.J.T. and A.H.C.M. Schaapendonk. 1990. Evaluation of breeding strategies for drought tolerance in potato by means of crop growth asimulation. Plant and Soil 123: 193-203.
Srisuwan, S., D. Sihachakr and S. Siljak-Yakovlev. 2006. The origin and evolution of sweetpotato (Ipomoea batatas Lam.) and its wild relatives through the cytogenetic approaches. Plant Science 171: 424-433.
Steed, L. and V.D. Truong. 2008. Anthocyanin content, antioxidant activity, and selected physical properties of flowable purple fleshed sweetpotato purees. Journal of Food Science 73: 215-221.
Subbarao, G., O. Ito, R. Serraj, J. Crouch, S. Tobita, K. Okada, C. Hash, R. Ortiz and W. Berry. 2005. Physiological perspectives on improving crop adaptation to drought-justification for systemic component-based approach. In: Pessarakli, M., editor, Handbook of Photosynthesis. Marcel and Dekker, New York. p. 577-594.
Tai, G.C.C. 1971. Genotypic stability analysis and its application to potato regional trials. Crop Science 11: 184-190.
Taiz, L. and E. Zeiger. 2006. Stress physiology. In: Taiz, L. and E. Zeiger, editors, Plant physiology. Sinauer Associates, Inc., Sunderland, MA. p. 671-681.
Tanaka, M., N. Kato, H. Nakayama, M. Nakatani and Y. Takahata. 2008. Expression of class I knotted1-like homeobox genes in the storage roots of sweetpotato (Ipomoea batatas). Journal of Plant Physiology 165: 1726-1735.
Tanaka, M., Y. Takahata and M. Nakatani. 2005. Analysis of genes developmentally regulated during storage root formation of sweetpotato. Journal of Plant Physiology 162: 91-102.
40
Tang, L., S.Y. Kwon, S.H. Kim, J.S. Kim, J.S. Choi, K.Y. Cho, C.K. Sung, S.S. Kwak and H.S. Lee. 2006. Enhanced tolerance of transgenic potato plants expressing both superoxide dismutase and ascorbate peroxidase in chloroplasts against oxidative stress and high temperature. Plant Cell Reports 25: 1380-1386.
Teow, C.C., V.D. Truong, R.F. McFeeters, R.L. Thompson, K.V. Pecota and G.C. Yencho. 2007. Antioxidant activities, phenolic and beta-carotene contents of sweetpotato genotypes with varying flesh colours. Food Chemistry 103: 829-838.
Ting, Y.U.C. and A.E. Kehr. 1953. Meiotic studies in the sweetpotato. Journal of Heredity 44: 207-211.
Tjintokohadi, N.L.N. and I.G. Mok. 2001. Sweetpotato germplasm conservation and breeding in CIP-ESEAP. International Plant Genetic Resources Institute (IPGRI), Rome. p. 39-46.
Tuberosa, R. and S. Salvi. 2006. Genomics based approaches to improve drought tolerance of crops. Trends in Plant Science 11: 406-412.
Van Heerden, P.D.R. and R. Laurie. 2008. Effects of prolonged restriction in water supply on photosynthesis, shoot development and storage root yield in sweetpotato. Physiologia Plantarum 134: 99-109.
Veasey, E.A., A. Borges, M.S. Rosa, J.R. Queiroz-Silva, E.A. Bressan and N. Peroni. 2008. Genetic diversity in Brazilian sweetpotato (Ipomoea batatas [L.] Lam., solanales, Convolvulaceae) landraces assessed with microsatellite markers. Genetics and Molecular Biology 31: 725-733.
Vermeer, H. 1990. Optimising potato breeding: The genotypic, environmental and genotype-environment coefficients of variation for tuber yield and other traits in potato (Solanum tuberosum L.) under different experimental conditions. Euphytica 49: 229-236.
Villareal, R.L. and H.F. Lo. 1983. Utilisation of sweetpotato germplasm by plant breeder. Pilippine Journal of Crop Science 8: 113-118.
Vimala, B. and B. Hariprakash. 2011. Variability of morphological characters and dry matter content in the hybrid progenies of sweetpotato (Ipomoea batatas [L] Lam). Geneconserve 10: 65-86.
Wang, H.L., P.D. Lee, L.F. Liu and J.C. Su. 1999. Effect of sorbitol induced osmotic stress on the changes of carbohydrate and free amino acid pools in sweetpotato cell suspension cultures. Botanical Bulletin of Academia Sinica 40: 219-225.
Wang, Q., L. Zhang and Z. Wang. 2005. Formation and thickening of tuberous roots in relation to the endogenous hormone concentrations in sweetpotato. Scientia Agricultura Sinica 38: 2414-2420.
Westgate, M. and J. Boyer. 1985. Osmotic adjustment and the inhibition of leaf, root, stem and silk growth at low water potentials in maize. Planta 164: 540-549.
Wilson, J.E., F.S. Pole, E.J.M. Smit-Nicole and P. Taufatofua. 1989. Sweetpotato (Ipomoea batatas) breeding. Institute for research, extension and training in agriculture, Western Samoa.
41
Woolfe, J.A. 1992. Sweetpotato: An untapped food resource. Cambridge University Press, New York.
Yan, W. 2001. GGEbiplot: A windows application for graphical analysis of multienvironment trial data and other types of two-way data. Agronomy Journal 93: 1111-1118.
Yang, R.C., S. Jana and J. Clarke. 1991. Phenotypic diversity and associations of some potentially drought-responsive characters in durum wheat. Crop science 31: 1484-1491.
Yue, B., W. Xue, L. Xiong, X. Yu, L. Luo, K. Cui, D. Jin, Y. Xing and Q. Zhang. 2006. Genetic basis of drought resistance at reproductive stage in rice: Separation of drought tolerance from drought avoidance. Genetics 172: 1213-1228.
Zehui, C. 1996. Genetics of Characters Associated with Drought Resistance in Maize (Zea mays L.). PhD. Thesis. Philippines University, Laguna.
Zhang, J. and M. Kirkham. 1996. Antioxidant responses to drought in sunflower and sorghum seedlings. New Phytologist 132: 361-373.
Zhang, M., F. Tan and Q. Zhang. 2001. Physiological indices for rapid identification of sweetpotato drought resistance and selection of methods. Scientia Agricultura Sinica 34: 260-265.
Zhang, M.S., Z.H. Peng, Xie.B., F. Tan, Q.T. Zhang, Y.F. Fu, C.X. Yang and Y.H. Yang. 2004. Relationship between water loss rate of cut leaves and osmotic regulators under water stress and drought resistance in sweetpotato. Scientia Agricultura Sinica 37: 152-156.
42
2. Chapter Two: Farmers’ perceptions, production and
productivity constraints, preferences and breeding
priorities of sweetpotato in Rwanda
Abstract
The role of farmers and their production constraints and preferences are important for
sweetpotato breeding and adoption of cultivars and agronomic production packages. The
objective of this study was to assess farmers’ perception, production constraints,
preferences and breeding priorities of sweetpotato in selected agro-ecologies of Rwanda. A
total of 495 farmers were surveyed in 2013 in seven representative districts: Bugesera and
Kayonza in the Eastern Province, Gakenke and Rulindo in the Northern Province, and
Gisagara, Huye and Muhanga in the Southern Province. Data were collected through a
participatory rural appraisal (PRA) methodology using a semi-structured questionnaire and
focus group discussions. Pairwise comparison of 16 food crops allocated sweetpotato as
one of the five important food crops for food security and income generation. Drought stress,
unavailability of improved cultivars and planting material, pest and disease damage were
perceived to be the five main constraints limiting sweetpotato production, contributing to
17.3, 15.0, 12.9, 11.7 and 11.5%, respectively. The most important sweetpotato cultivar
traits were high yield, early maturity, drought tolerance, disease and pest tolerance and good
culinary taste at 22.5, 18.5, 15.4, 12.7 and 10.1%, respectively. The characteristics of good
storage roots identified by farmers included high dry matter content, good culinary taste,
good shape, root size and sweetness representing 27.4, 18.8, 16.1, 11.6 and 9.4%,
respectively. Each agro-ecological zone has its own specific sweetpotato production
constraints and farmers’ preferences, necessitating targeted breeding of different
sweetpotato cultivars for each agro-ecological zone, for enhanced productivity and
successful adoption of cultivars.
Keywords: Breeding priorities, farmers’ preferences, production constraints, sweetpotato
2.1 Introduction
Globally the demand for quantity and quality food is fast increasing due to population growth,
limited water and land and overexploitation of available resources (Tilman et al. 2001;
43
Godfray et al. 2010). Moreover, global climate change aggravates the biotic and abiotic
stresses on food crops (Tester and Langridge 2010). These environmental changes will
negatively affect crop production and food security. Therefore, novel mitigation strategies are
required to boost crop productivity and ensure food security. Improved and resilient crop
cultivars and their production technologies are among these strategies (Brown and Funk
2008).
Participatory plant breeding is usually conducted to ensure adoption of newly developed
crop cultivars and their production packages by smallholder farmers of marginal agro-
ecological and socio-economic groups (Ceccarelli et al. 2007). In the past, plant breeding
focused on developing high yielding and improved crop cultivars in favourable environments
and under controlled experimental situations (Bänziger and Cooper 2001). As such,
conventional plant breeding did not consider farmers' preferences and attributes, locally
available germplasm, and the real conditions of small-scale farmers, in pursuit of developing
crop cultivars for broad adaptation (Witcombe et al. 1996; Ceccarelli et al. 2000). These
failures to engage with the realities faced by local farmers have been identified as the
primary causes for the consistently low adoption of newly developed “improved” crop
cultivars and their production packages released by government and NGO scientists
(Adesina and Baidu-Forson 1995).
There are varied preferences and needs by end users for crop cultivars. For instance, for
industrial starch production, sweetpotato cultivars are required to have high dry matter
content, while cultivars for human consumption should have other traits such as attractive
skin and flesh colour, good cooking quality, and high β-carotene. Sweetpotato cultivars
intended for animal feed should have high-protein content (Lebot 2009). Therefore,
sweetpotato breeding should involve the needs of stakeholders in developing of new
cultivars and new agricultural technologies to meet their diverse requirements (Atlin et al.
2001; Rees et al. 2003).
Agricultural technologies developed through participatory research have a greater chance of
adoption and diffusion by farmers because they are developed in response to local
constraints, and meet end users needs and preferences (Ashby and Lilja 2004). Various
research approaches have been reported in participatory breeding of new crop cultivars,
including, consultative approaches, collaborative approaches, collegial approaches and
farmer experimentation (Ashby and Lilja 2004). Advantages of farmer participatory research
include: 1) co-definition of breeding objectives, 2) participatory evaluation of germplasm, 3)
identification of breeding priorities and 4) participatory selection of promising progenies
44
(Ceccarelli and Grando 2009). In one case, the incorporation of participatory approaches
into conventional breeding programmes reduced the time taken for cultivar development
from nine to six years (Lilja and Aw-Hasaan 2003).
In sweetpotato breeding, farmers’ knowledge and experience during preliminary on-farm and
on-station evaluations may enable quick identification of promising genotypes (Abidin et al.
2005). Song (1998) reported that the end-users participation in the improvement of seed
systems led to the efficient utilisation of national genetic resources and promoted their
production. In selection of high yielding genotypes, Ceccarelli et al. (2009) observed that
farmers have the same selection ability as breeders. Therefore, close collaboration between
farmers and breeders is necessary to speed up the breeding process and to respond to
appropriate needs of stakeholders.
Application of participatory research requires integrated skills (Ceccarelli et al. 2009). A
careful choice of research goals, target environments and selection of partners are critical
steps of participatory research. It also demands a systematic understanding of different
types of participatory research approaches to select the most appropriate tools (Ashby and
Lilja 2004) such as participatory rural appraisal, focus group discussions, participatory
selection in segregating populations and participatory cultivar testing and selection (Sperling
2001).
Sweetpotato is an important food and feed crop in sub-Sahara Africa and ranks fourth after
maize, bananas and cassava (FAOSTAT 2013). It yields considerably well in poor soils and
tolerates extreme weather conditions unsuitable for other food crops such as maize and
banana (Woolfe 1992). Therefore, it has an important role in food security in many rural
families of drought affected environments (Bashaasha et al. 1995). Rwanda is the third in
sweetpotato production in East Africa and the first in per capita consumption of sweetpotato
in Africa (Chassy et al. 2008). More than 95% of Rwandan farmers grow sweetpotato for
household food security (Njeru et al. 2008). During the farming seasons many rural families
rely on sweetpotato because of a shortage of other food security crops such as cassava,
potato, banana and maize (Gibson et al. 2004; Njeru et al. 2008). Due to its high productivity
per unit area and continuous availability, sweetpotato is an ideal food crop for Rwanda, the
most densely populated (416 persons/km2) country in Africa, with limited agricultural land
(NISR 2012). The crop requires less production inputs such as fertilizers and pesticides than
other major crops (Woolfe 1992). However, the average sweetpotato yield in Rwanda is low,
5.9 t.ha-1 wet weight compared to yields of 22.8 and 21.7 5.9 t.ha-1 reported in the USA and
Japan, respectively (FAOSTAT 2013). This requires targeted participatory sweetpotato
45
breeding to develop improved and high yielding cultivars, and their production packages,
according to the needs of the growers in the country. Therefore, the objective of this study
was to assess farmers’ perception, production and productivity constraints, preferences and
breeding priorities of sweetpotato in selected agro-ecologies of Rwanda. Results of the study
may assist in the breeding and sustainable production of sweetpotato in Rwanda and
countries with similar agro-ecologies.
2.2 Materials and methods
2.2.1 Description of the study areas
The study was carried out in 2013 in Bugesera and Kayonza districts of Eastern Province,
Gakenke and Rulindo districts of Northern Province, and Gisagara, Huye, and Muhanga
districts of Southern Province of Rwanda (Figure 2.1). These districts were selected because
of the importance of sweetpotato production in their food production (Ndamage et al. 1992).
Agriculture is the main economic activity of the selected districts, employing more than 90%
of the population. In these districts farmers grow many food crops including beans, sorghum,
sweetpotato, bananas and maize (NISR 2010). The Rwanda Agricultural Board (RAB) has
promoted cultivation of sweetpotato in these areas to produce raw materials for the
Urwibutso Enterprise, which was established for the industrial production of sweetpotato
biscuits, cakes, bread and juice (Rwakabuba 2012). In Gisagara, Huye, and Muhanga
districts, a range food crops are grown, including sweetpotato which is the main food crop
supplied to provincial cities (Kayitare 2006).
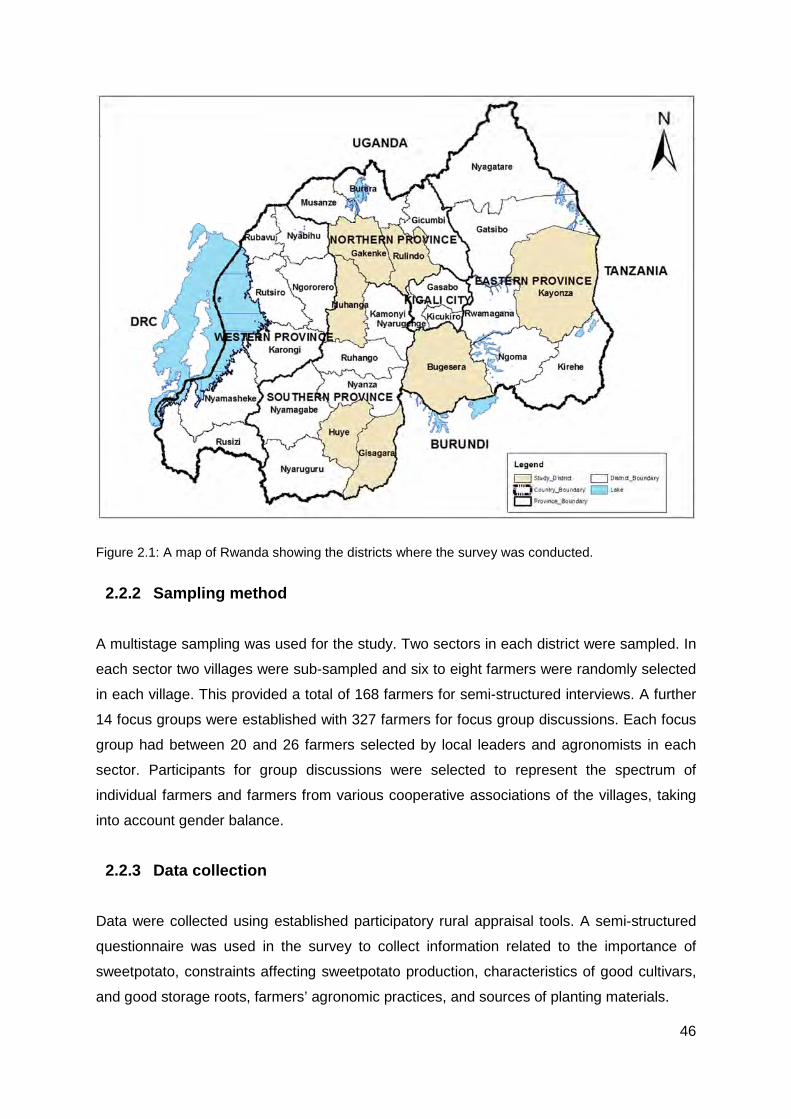
46
Figure 2.1: A map of Rwanda showing the districts where the survey was conducted.
2.2.2 Sampling method
A multistage sampling was used for the study. Two sectors in each district were sampled. In
each sector two villages were sub-sampled and six to eight farmers were randomly selected
in each village. This provided a total of 168 farmers for semi-structured interviews. A further
14 focus groups were established with 327 farmers for focus group discussions. Each focus
group had between 20 and 26 farmers selected by local leaders and agronomists in each
sector. Participants for group discussions were selected to represent the spectrum of
individual farmers and farmers from various cooperative associations of the villages, taking
into account gender balance.
2.2.3 Data collection
Data were collected using established participatory rural appraisal tools. A semi-structured
questionnaire was used in the survey to collect information related to the importance of
sweetpotato, constraints affecting sweetpotato production, characteristics of good cultivars,
and good storage roots, farmers’ agronomic practices, and sources of planting materials.
47
Different participatory rural appraisal (PRA) approaches were applied to identify periods of
sweetpotato production, food availability across the year, the importance of sweetpotato in
food security and income generation, farmer’s preferences, the most serious constraints
affecting sweetpotato and the role of gender in sweetpotato production. Seasonal calendar
analyses were used to identify planting and harvesting periods of sweetpotato, the periods of
limited availability and overproduction, and the fluctuation of sweetpotato prices on market.
Pair-wise and ranking matrices were used to identify the importance of sweetpotato as a
food security crop, and as an income generation crop. A matrix scoring method was used
following Ceccarelli’s (2012) to rank farmers’ and consumers’ preferences, constraints of
sweetpotato production, characteristics of good storage roots and cultivars of sweetpotato,
and the role of gender in sweetpotato production in Rwanda. Participants listed the best
criteria and data were organised on flipcharts followed by ranking using a fixed number of
votes. After votes were given by participants, percentage values of each parameter were
calculated.
2.2.4 Data analysis
Data collected were analysed using SPSS (PASW statistics 18.0) computer package (SPSS
2006), Genstat 15th edition (Payne et al. 2011) and Microsoft Excel (Windows Office 2012).
Variables were subjected to descriptive statistics, one-sample t-test and cross tabulation and
chi-square analyses.
2.3 Results
2.3.1 Demographic description of the study areas
The most important variables and descriptions of farmers chosen for the study are presented
in Table 2.1. The number of female respondents was higher than males. Females
represented 58.4% while males were at 41.6%. The total number of interviewed farmers
during the survey was 168 while 327 farmers were available for group discussions.
In this survey, 67.3% of the farmers had finished primary school, 4.2% had completed post-
primary school, 1.4% had attended secondary school and 26.9% were illiterate (Table 2.1).
Training in agricultural practices were limited, with only 28.5% of the interviewed farmers
having been trained in some agricultural practices by various organizations such as World
48
Vision and Catholic Relief Services, the Food Agricultural Organisation of the United
Nations, and national public agricultural institutions such as the Institut des Siences
Agronomique du Rwanda (ISAR), the Rwanda Agricultural Development Authority (RADA)
and the Rwanda Agricultural Board (RAB). Most farmers’ training had focused on use of
agricultural inputs, soil conservation and agronomic crop management.
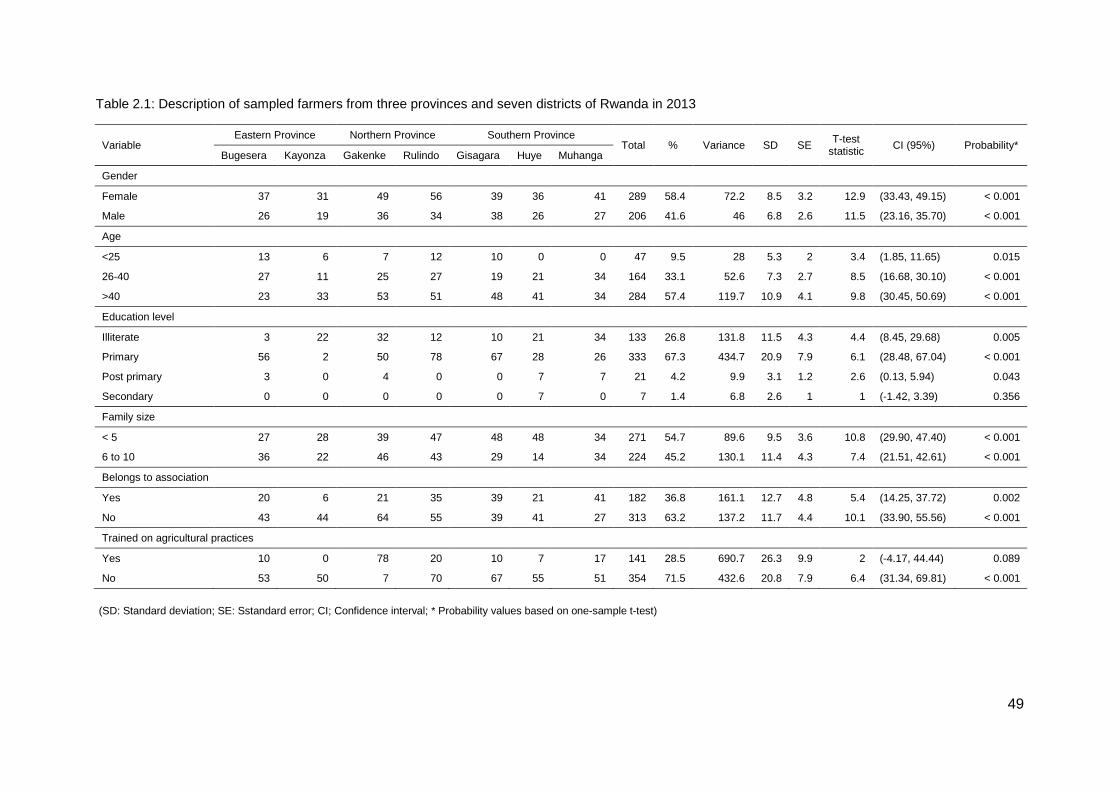
49
Table 2.1: Description of sampled farmers from three provinces and seven districts of Rwanda in 2013
Variable Eastern Province Northern Province Southern Province
Total % Variance SD SE T-test
statistic CI (95%) Probability* Bugesera Kayonza Gakenke Rulindo Gisagara Huye Muhanga
Gender
Female 37 31 49 56 39 36 41 289 58.4 72.2 8.5 3.2 12.9 (33.43, 49.15) < 0.001
Male 26 19 36 34 38 26 27 206 41.6 46 6.8 2.6 11.5 (23.16, 35.70) < 0.001
Age
<25 13 6 7 12 10 0 0 47 9.5 28 5.3 2 3.4 (1.85, 11.65) 0.015
26-40 27 11 25 27 19 21 34 164 33.1 52.6 7.3 2.7 8.5 (16.68, 30.10) < 0.001
>40 23 33 53 51 48 41 34 284 57.4 119.7 10.9 4.1 9.8 (30.45, 50.69) < 0.001
Education level
Illiterate 3 22 32 12 10 21 34 133 26.8 131.8 11.5 4.3 4.4 (8.45, 29.68) 0.005
Primary 56 2 50 78 67 28 26 333 67.3 434.7 20.9 7.9 6.1 (28.48, 67.04) < 0.001
Post primary 3 0 4 0 0 7 7 21 4.2 9.9 3.1 1.2 2.6 (0.13, 5.94) 0.043
Secondary 0 0 0 0 0 7 0 7 1.4 6.8 2.6 1 1 (-1.42, 3.39) 0.356
Family size
< 5 27 28 39 47 48 48 34 271 54.7 89.6 9.5 3.6 10.8 (29.90, 47.40) < 0.001
6 to 10 36 22 46 43 29 14 34 224 45.2 130.1 11.4 4.3 7.4 (21.51, 42.61) < 0.001
Belongs to association
Yes 20 6 21 35 39 21 41 182 36.8 161.1 12.7 4.8 5.4 (14.25, 37.72) 0.002
No 43 44 64 55 39 41 27 313 63.2 137.2 11.7 4.4 10.1 (33.90, 55.56) < 0.001
Trained on agricultural practices
Yes 10 0 78 20 10 7 17 141 28.5 690.7 26.3 9.9 2 (-4.17, 44.44) 0.089
No 53 50 7 70 67 55 51 354 71.5 432.6 20.8 7.9 6.4 (31.34, 69.81) < 0.001
(SD: Standard deviation; SE: Sstandard error; CI; Confidence interval; * Probability values based on one-sample t-test)
50
2.3.2 Farmers’ perception and sweetpotato production
Importance of sweetpotato
The results from a pairwise comparison of the 16 food crops grown by farmers (banana,
bean, cassava, cocoyam, fruit, Irish potato, maize, groundnut, dry peas, rice, sorghum,
soybean, sunflower, sweetpotato, vegetables and yam), revealed that the positions of
sweetpotato in terms of food security and income generation varied from one district to
another (Tables 2.2 and 2.3). In Bugesera District, sweetpotato ranked fourth as a food
security crop after banana, bean and cassava and ranked fifth in income generation. In
Kayonza District, sweetpotato ranked fifth after bean, cassava, banana and rice for food
security and ranked thirteenth in income generation. In Gakenke District, sweetpotato ranked
fourth as a food security crop after banana, bean and cassava and third in income
generation. In Rulindo District, it was the fourth food security crop and the fifth in income
generation. In Gisagara District, sweetpotato was the third food security crop after banana
and cassava and the fifth in income generation. In Huye District, it ranked third for food
security after cassava and bean and the sixth in income generation. In Muhanga District,
sweetpotato was the fourth after bean, cassava and banana as a food security crop and the
sixth in income generation. In all districts of the study, cassava, banana and sweetpotato
were among the first five food crops while banana was the only crop ranked among the first
five crops in income generation.
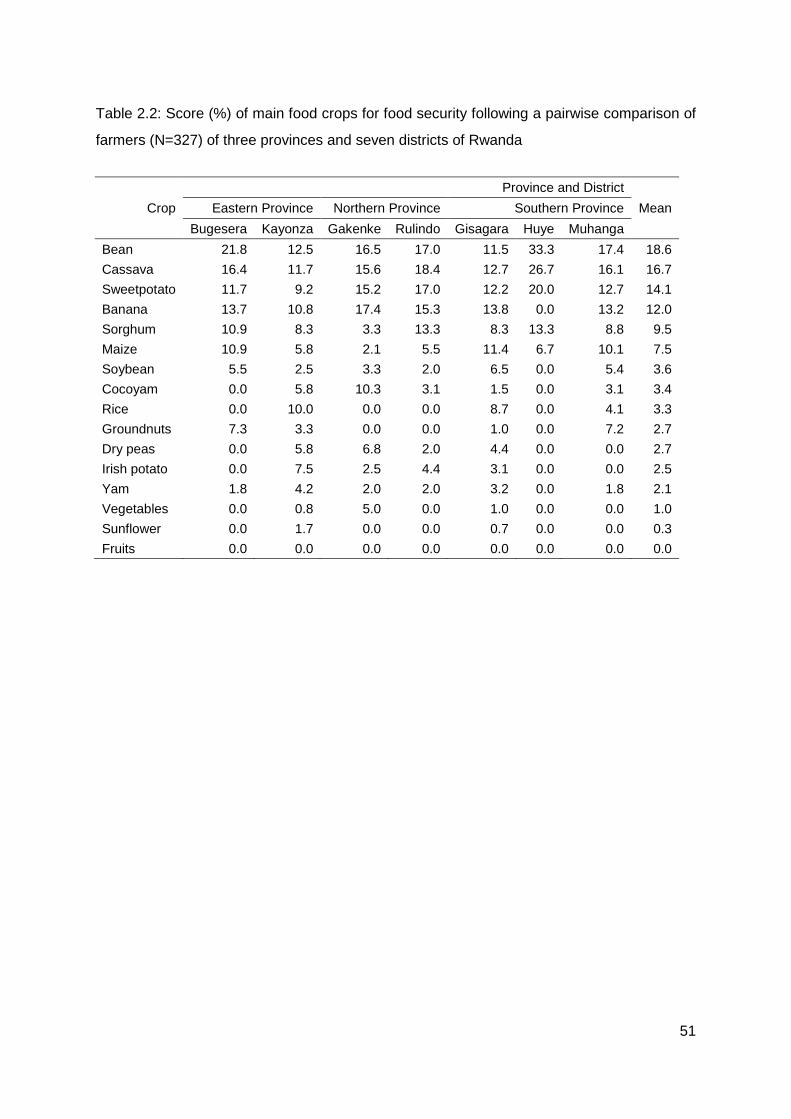
51
Table 2.2: Score (%) of main food crops for food security following a pairwise comparison of
farmers (N=327) of three provinces and seven districts of Rwanda
Crop
Province and District
Mean Eastern Province Northern Province Southern Province
Bugesera Kayonza Gakenke Rulindo Gisagara Huye Muhanga
Bean 21.8 12.5 16.5 17.0 11.5 33.3 17.4 18.6
Cassava 16.4 11.7 15.6 18.4 12.7 26.7 16.1 16.7
Sweetpotato 11.7 9.2 15.2 17.0 12.2 20.0 12.7 14.1
Banana 13.7 10.8 17.4 15.3 13.8 0.0 13.2 12.0
Sorghum 10.9 8.3 3.3 13.3 8.3 13.3 8.8 9.5
Maize 10.9 5.8 2.1 5.5 11.4 6.7 10.1 7.5
Soybean 5.5 2.5 3.3 2.0 6.5 0.0 5.4 3.6
Cocoyam 0.0 5.8 10.3 3.1 1.5 0.0 3.1 3.4
Rice 0.0 10.0 0.0 0.0 8.7 0.0 4.1 3.3
Groundnuts 7.3 3.3 0.0 0.0 1.0 0.0 7.2 2.7
Dry peas 0.0 5.8 6.8 2.0 4.4 0.0 0.0 2.7
Irish potato 0.0 7.5 2.5 4.4 3.1 0.0 0.0 2.5
Yam 1.8 4.2 2.0 2.0 3.2 0.0 1.8 2.1
Vegetables 0.0 0.8 5.0 0.0 1.0 0.0 0.0 1.0
Sunflower 0.0 1.7 0.0 0.0 0.7 0.0 0.0 0.3
Fruits 0.0 0.0 0.0 0.0 0.0 0.0 0.0 0.0

52
Table 2.3: Score (%) of main food crops for income generation after a pairwise comparison
of farmers (N=327) of three provinces and seven districts of Rwanda
Crop
Province and District
Mean Eastern Province Northern Province Southern Province
Bugesera Kayonza Gakenke Rulindo Gisagara Huye Muhanga
Banana 11.4 9.3 30.3 24.3 18.3 33.3 17.4 20.6
Cassava 22.7 7.6 27.7 12.6 16.6 20.7 16.0 17.7
Bean 29.6 12.7 2.0 13.7 10.7 0.0 15.7 12.1
Sorghum 18.2 6.8 2.0 3.3 4.8 20.0 15.1 10.0
Sweetpotato 6.8 2.5 15.7 10.2 6.5 6.7 9.8 8.3
Maize 2.3 4.2 6.1 10.3 13.2 6.7 5.3 6.9
Rice 0.0 11.9 0.0 0.0 14.7 6.0 6.5 5.6
Fruits 0.0 10.2 7.3 3.2 2.2 0.0 0.0 3.3
Groundnuts 4.6 11.0 0.0 1.5 1.5 0.0 4.5 3.3
Vegetables 0.0 5.9 4.0 5.9 3.0 0.0 3.2 3.2
Dry peas 0.0 5.9 5.0 8.9 1.2 0.0 0.0 3.0
Irish potato 0.0 5.9 0.0 0.0 3.5 6.7 0.0 2.3
Soybean 2.3 3.4 0.0 4.1 2.0 0.0 1.1 1.8
Cocoyam 0.0 1.7 0.0 1.7 1.7 0.0 5.4 1.5
Yam 2.3 0.9 0.0 0.2 0.0 0.0 0.0 0.5
Sunflower 0.0 0.0 0.0 0.0 0.0 0.0 0.0 0.0
2.3.3 Constraints of sweetpotato production
The main constraints of sweetpotato production and their relative importance as reported by
farmers during group discussions are presented in Table 2.4. In Bugesera District, drought,
shortage of planting materials (vines) and diseases were the three top constraints reported
by farmers. Shortage of improved cultivars, drought and pests were the leading constraints
of sweetpotato production in Kayonza District. In Gakenke District, drought, diseases and
pests were considered the main three sweetpotato production constraints. In Rulindo
District, drought, diseases and shortage of vines were regarded as the most important
constraints of sweetpotato production. In Gisagara District, farmers reported that drought,
pests and shortage of improved cultivars were the main production constraints. In Huye
District, pests, drought, and shortage of vines were identified as the most important
constraints of sweetpotato production. In Muhanga District, farmers prioritized drought, pest
and shortage of vines as the three main constraints of sweetpotato production. Overall, in
the surveyed districts, drought stress, shortage of improved cultivars and planting material,
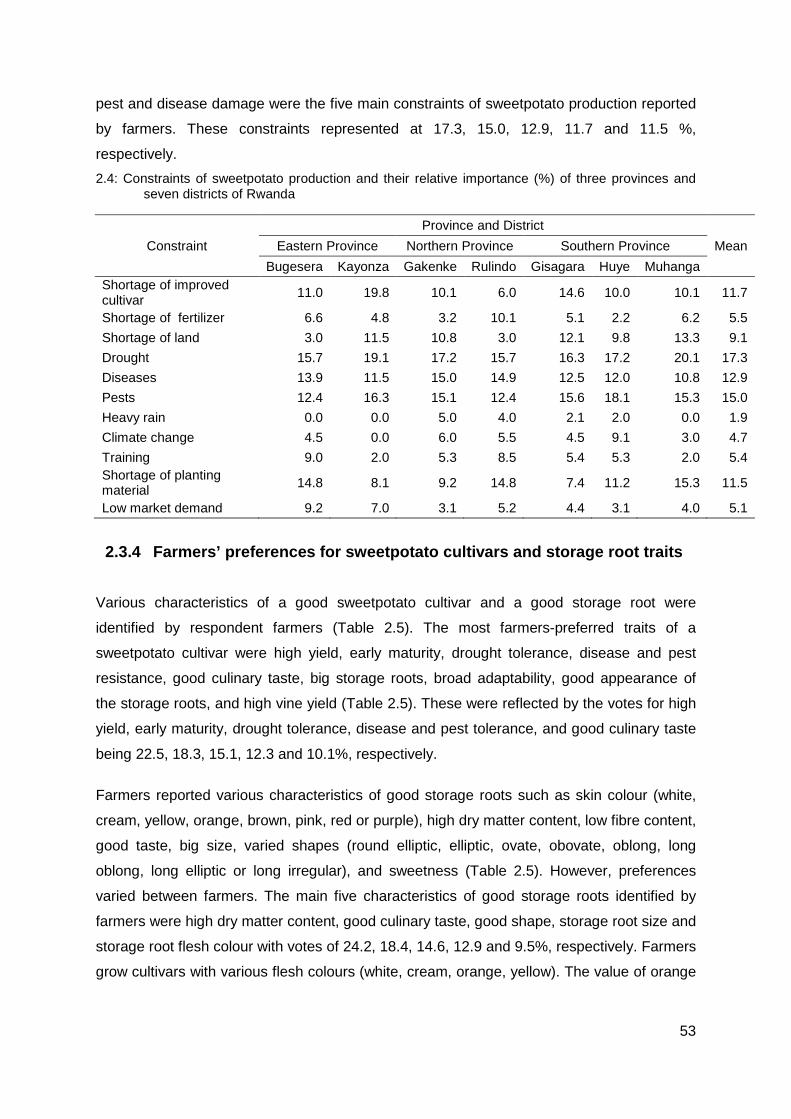
53
pest and disease damage were the five main constraints of sweetpotato production reported
by farmers. These constraints represented at 17.3, 15.0, 12.9, 11.7 and 11.5 %,
respectively.
2.4: Constraints of sweetpotato production and their relative importance (%) of three provinces and seven districts of Rwanda
Constraint
Province and District
Mean Eastern Province Northern Province Southern Province
Bugesera Kayonza Gakenke Rulindo Gisagara Huye Muhanga Shortage of improved cultivar
11.0 19.8 10.1 6.0 14.6 10.0 10.1 11.7
Shortage of fertilizer 6.6 4.8 3.2 10.1 5.1 2.2 6.2 5.5
Shortage of land 3.0 11.5 10.8 3.0 12.1 9.8 13.3 9.1
Drought 15.7 19.1 17.2 15.7 16.3 17.2 20.1 17.3
Diseases 13.9 11.5 15.0 14.9 12.5 12.0 10.8 12.9
Pests 12.4 16.3 15.1 12.4 15.6 18.1 15.3 15.0
Heavy rain 0.0 0.0 5.0 4.0 2.1 2.0 0.0 1.9
Climate change 4.5 0.0 6.0 5.5 4.5 9.1 3.0 4.7
Training 9.0 2.0 5.3 8.5 5.4 5.3 2.0 5.4 Shortage of planting material 14.8 8.1 9.2 14.8 7.4 11.2 15.3 11.5
Low market demand 9.2 7.0 3.1 5.2 4.4 3.1 4.0 5.1
2.3.4 Farmers’ preferences for sweetpotato cultivars and storage root traits
Various characteristics of a good sweetpotato cultivar and a good storage root were
identified by respondent farmers (Table 2.5). The most farmers-preferred traits of a
sweetpotato cultivar were high yield, early maturity, drought tolerance, disease and pest
resistance, good culinary taste, big storage roots, broad adaptability, good appearance of
the storage roots, and high vine yield (Table 2.5). These were reflected by the votes for high
yield, early maturity, drought tolerance, disease and pest tolerance, and good culinary taste
being 22.5, 18.3, 15.1, 12.3 and 10.1%, respectively.
Farmers reported various characteristics of good storage roots such as skin colour (white,
cream, yellow, orange, brown, pink, red or purple), high dry matter content, low fibre content,
good taste, big size, varied shapes (round elliptic, elliptic, ovate, obovate, oblong, long
oblong, long elliptic or long irregular), and sweetness (Table 2.5). However, preferences
varied between farmers. The main five characteristics of good storage roots identified by
farmers were high dry matter content, good culinary taste, good shape, storage root size and
storage root flesh colour with votes of 24.2, 18.4, 14.6, 12.9 and 9.5%, respectively. Farmers
grow cultivars with various flesh colours (white, cream, orange, yellow). The value of orange
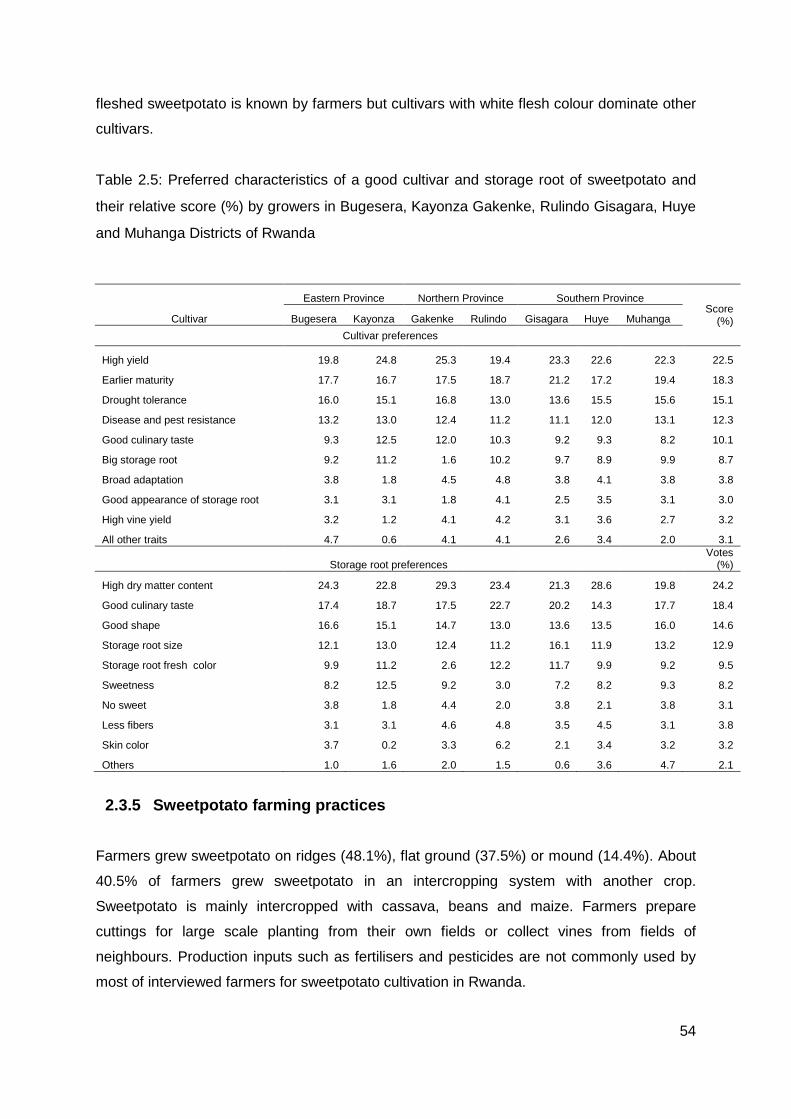
54
fleshed sweetpotato is known by farmers but cultivars with white flesh colour dominate other
cultivars.
Table 2.5: Preferred characteristics of a good cultivar and storage root of sweetpotato and
their relative score (%) by growers in Bugesera, Kayonza Gakenke, Rulindo Gisagara, Huye
and Muhanga Districts of Rwanda
Cultivar
Eastern Province Northern Province Southern Province Score
(%) Bugesera Kayonza Gakenke Rulindo Gisagara Huye Muhanga
Cultivar preferences
High yield 19.8 24.8 25.3 19.4 23.3 22.6 22.3 22.5
Earlier maturity 17.7 16.7 17.5 18.7 21.2 17.2 19.4 18.3
Drought tolerance 16.0 15.1 16.8 13.0 13.6 15.5 15.6 15.1
Disease and pest resistance 13.2 13.0 12.4 11.2 11.1 12.0 13.1 12.3
Good culinary taste 9.3 12.5 12.0 10.3 9.2 9.3 8.2 10.1
Big storage root 9.2 11.2 1.6 10.2 9.7 8.9 9.9 8.7
Broad adaptation 3.8 1.8 4.5 4.8 3.8 4.1 3.8 3.8
Good appearance of storage root 3.1 3.1 1.8 4.1 2.5 3.5 3.1 3.0
High vine yield 3.2 1.2 4.1 4.2 3.1 3.6 2.7 3.2
All other traits 4.7 0.6 4.1 4.1 2.6 3.4 2.0 3.1
Storage root preferences Votes
(%)
High dry matter content 24.3 22.8 29.3 23.4 21.3 28.6 19.8 24.2
Good culinary taste 17.4 18.7 17.5 22.7 20.2 14.3 17.7 18.4
Good shape 16.6 15.1 14.7 13.0 13.6 13.5 16.0 14.6
Storage root size 12.1 13.0 12.4 11.2 16.1 11.9 13.2 12.9
Storage root fresh color 9.9 11.2 2.6 12.2 11.7 9.9 9.2 9.5
Sweetness 8.2 12.5 9.2 3.0 7.2 8.2 9.3 8.2
No sweet 3.8 1.8 4.4 2.0 3.8 2.1 3.8 3.1
Less fibers 3.1 3.1 4.6 4.8 3.5 4.5 3.1 3.8
Skin color 3.7 0.2 3.3 6.2 2.1 3.4 3.2 3.2
Others 1.0 1.6 2.0 1.5 0.6 3.6 4.7 2.1
2.3.5 Sweetpotato farming practices
Farmers grew sweetpotato on ridges (48.1%), flat ground (37.5%) or mound (14.4%). About
40.5% of farmers grew sweetpotato in an intercropping system with another crop.
Sweetpotato is mainly intercropped with cassava, beans and maize. Farmers prepare
cuttings for large scale planting from their own fields or collect vines from fields of
neighbours. Production inputs such as fertilisers and pesticides are not commonly used by
most of interviewed farmers for sweetpotato cultivation in Rwanda.
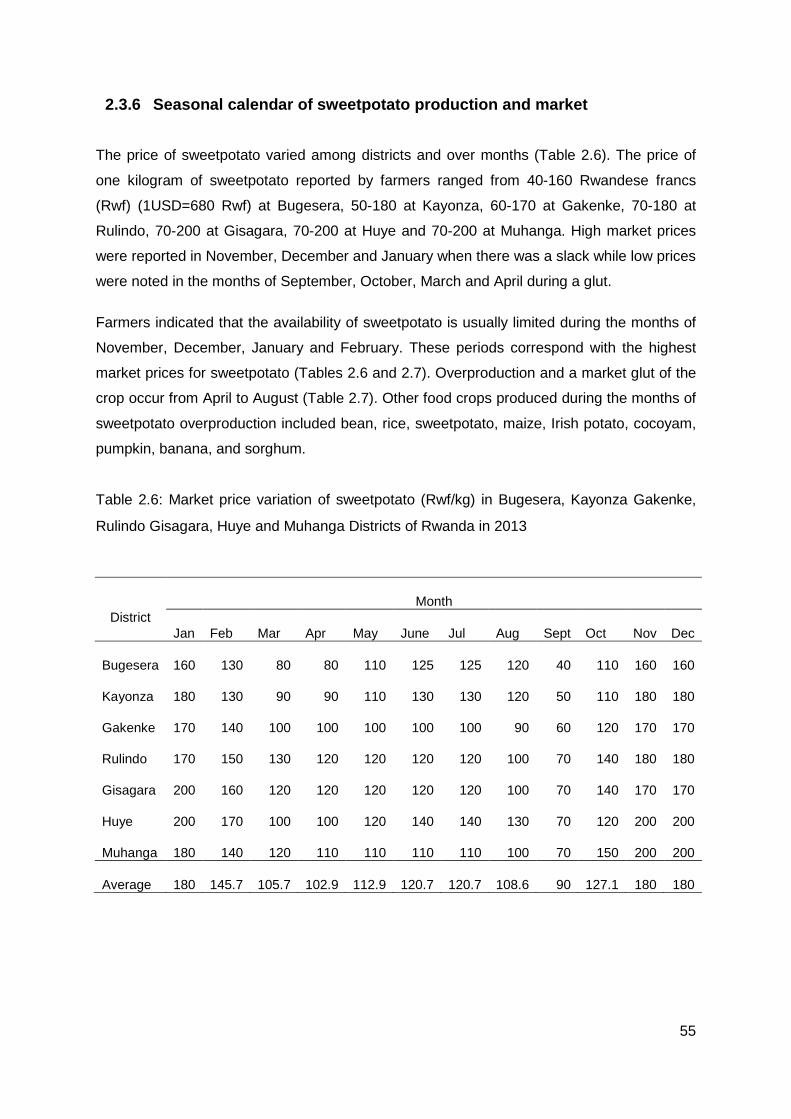
55
2.3.6 Seasonal calendar of sweetpotato production and market
The price of sweetpotato varied among districts and over months (Table 2.6). The price of
one kilogram of sweetpotato reported by farmers ranged from 40-160 Rwandese francs
(Rwf) (1USD=680 Rwf) at Bugesera, 50-180 at Kayonza, 60-170 at Gakenke, 70-180 at
Rulindo, 70-200 at Gisagara, 70-200 at Huye and 70-200 at Muhanga. High market prices
were reported in November, December and January when there was a slack while low prices
were noted in the months of September, October, March and April during a glut.
Farmers indicated that the availability of sweetpotato is usually limited during the months of
November, December, January and February. These periods correspond with the highest
market prices for sweetpotato (Tables 2.6 and 2.7). Overproduction and a market glut of the
crop occur from April to August (Table 2.7). Other food crops produced during the months of
sweetpotato overproduction included bean, rice, sweetpotato, maize, Irish potato, cocoyam,
pumpkin, banana, and sorghum.
Table 2.6: Market price variation of sweetpotato (Rwf/kg) in Bugesera, Kayonza Gakenke,
Rulindo Gisagara, Huye and Muhanga Districts of Rwanda in 2013
District Month
Jan Feb Mar Apr May June Jul Aug Sept Oct Nov Dec
Bugesera 160 130 80 80 110 125 125 120 40 110 160 160
Kayonza 180 130 90 90 110 130 130 120 50 110 180 180
Gakenke 170 140 100 100 100 100 100 90 60 120 170 170
Rulindo 170 150 130 120 120 120 120 100 70 140 180 180
Gisagara 200 160 120 120 120 120 120 100 70 140 170 170
Huye 200 170 100 100 120 140 140 130 70 120 200 200
Muhanga 180 140 120 110 110 110 110 100 70 150 200 200
Average 180 145.7 105.7 102.9 112.9 120.7 120.7 108.6 90 127.1 180 180
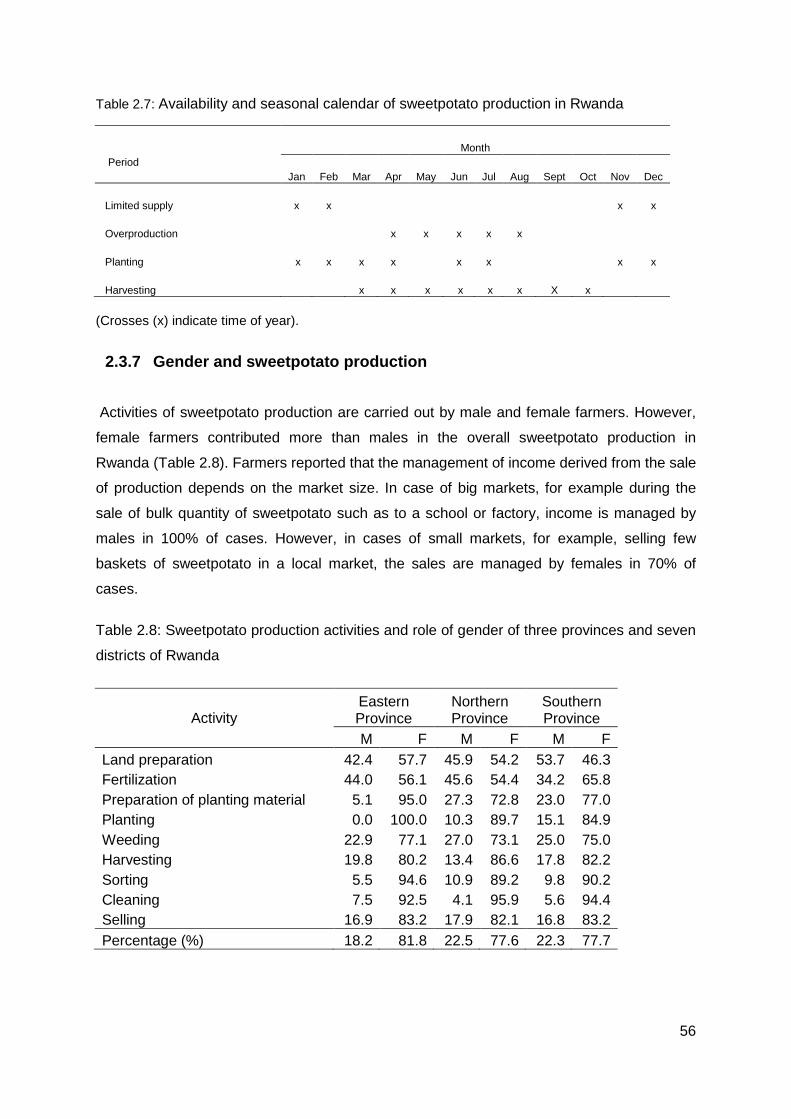
56
Table 2.7: Availability and seasonal calendar of sweetpotato production in Rwanda
Period Month
Jan Feb Mar Apr May Jun Jul Aug Sept Oct Nov Dec
Limited supply x x x x
Overproduction x x x x x
Planting x x x x x x x x
Harvesting x x x x x x X x
(Crosses (x) indicate time of year).
2.3.7 Gender and sweetpotato production
Activities of sweetpotato production are carried out by male and female farmers. However,
female farmers contributed more than males in the overall sweetpotato production in
Rwanda (Table 2.8). Farmers reported that the management of income derived from the sale
of production depends on the market size. In case of big markets, for example during the
sale of bulk quantity of sweetpotato such as to a school or factory, income is managed by
males in 100% of cases. However, in cases of small markets, for example, selling few
baskets of sweetpotato in a local market, the sales are managed by females in 70% of
cases.
Table 2.8: Sweetpotato production activities and role of gender of three provinces and seven
districts of Rwanda
Activity Eastern Province
Northern Province
Southern Province
M F M F M F Land preparation 42.4 57.7 45.9 54.2 53.7 46.3 Fertilization 44.0 56.1 45.6 54.4 34.2 65.8 Preparation of planting material 5.1 95.0 27.3 72.8 23.0 77.0 Planting 0.0 100.0 10.3 89.7 15.1 84.9 Weeding 22.9 77.1 27.0 73.1 25.0 75.0 Harvesting 19.8 80.2 13.4 86.6 17.8 82.2 Sorting 5.5 94.6 10.9 89.2 9.8 90.2 Cleaning 7.5 92.5 4.1 95.9 5.6 94.4 Selling 16.9 83.2 17.9 82.1 16.8 83.2 Percentage (%) 18.2 81.8 22.5 77.6 22.3 77.7
57
2.4 Discussion
2.4.1 Use of sweetpotato for food security and income generation
Food insecurity is a major problem in many nations due to biotic and abiotic constraints.
According to Tshuma (2012), food security is achieved at various levels such as individual,
family, national, regional and global level. Food security encompasses physical and
economic access to sufficient quality and quantity food for an active and healthy life.
Sweetpotato has been reported to be an important crop in the food security and economy of
poor households in the marginal agro-ecological zones (Bashaasha et al. 1995; Githunguri
et al. 2006). Bashaasha et al. (1995) observed that farmers’ sweetpotato plots contain many
cultivars which have various attributes such as maturity periods. Variation in maturity periods
contributes to the continuous supply of food over the year. In Rwanda, the contribution of
sweetpotato to family food security and income generation varied from one district to another
(Tables 2.2 and 2.3). However, in all the study areas sweetpotato was ranked among the top
five major food crops.
2.4.2 Constraints to sweetpotato production
In the assessment of priorities for sweetpotato research in developing countries, Fuglie
(2007) found common production constraints in almost all the major sweetpotato producing
areas. Some constraints were specific to certain regions. Viral diseases, shortage of post-
harvest processing technologies, lack of clean planting materials and improved cultivars with
high and stable yield potential were the main constraints of sweetpotato production in almost
the major sweetpotato producing regions. Sweetpotato weevils and butterflies were the main
pests of sweetpotato while drought stress was the most important abiotic stress in Uganda
(Bashaasha et al. 1995; Muyinza et al. 2007). Sseruwa (2012) observed that Kabare and
Luwero districts of Uganda had similar production constraints. Production constraints of
sweetpotato in three regions of Kenya were similar and farmers identified weevils as the
major pest, while sweetpotato virus disease (SPVD) as the major disease. Drought was the
third among major production constraints reported by farmers (Kivuva 2013). Kapinga and
Carey (2003) reported that viral and Alternaria diseases, drought, shortage of planting
materials and low soil fertility were the main production constraints of sweetpotato in
Rwanda. Unlike previous finings the present study found types and intensity of sweetpotato
production constraints differed across districts (Table 2.4). Drought stress, shortage of
58
improved cultivars and planting material, pest and disease damage were the five main
constraints of sweetpotato production reported by farmers in Rwanda.
2.4.3 Attributes of good sweetpotato cultivars and storage roots
The selection of cultivars to be grown by farmers is tightly linked to farmers’ preferences and
cultivar characteristics. Different storage root characteristics such as storage root formation,
root shape, surface defects, latex production, skin and fresh colour, dry matter content,
sugar content and culinary taste are positive attributes for farmers’ choices of cultivars in
Uganda (Gibson et al. 2008). High dry matter content, good shape and culinary taste were
the main characteristics of good storage roots in the present study. It was also observed that
a good cultivar must have high yields, early maturity and drought tolerance (Table 2.5). In
another study, Laurie and Magoro (2008) in South Africa found that the most important traits
used by farmers to select good sweetpotato cultivars were sweet taste, dry texture and good
yield. Desired traits of sweetpotato identified by Ugandan farmers were high yield, early
maturity and high dry matter content of storage root (Sseruwu 2012). Githunguri et al. (2006)
observed that yield is the most important selection criterion of a good cultivar of sweetpotato
in Kenya. Low fiber and high dry matter content, and taste were the main characteristics
influencing the choice of good storage root by Kenyan women farmers (Githunguri et al.
2006). In a participatory cultivar selection, characteristics such as high yield, early maturity
and large storage root were the main attributes of a good cultivar (Gibson et al. 2008). High
dry matter content is the main characteristic for sweetpotato processors and consumers,
while skin colour and root shape are also important traits of preference for sweetpotato
cultivars (Rees et al. 2003). These findings reveal that farmers and end-users preferences
are diverse. Therefore there is a need for clear communication between breeders and
stakeholders for the successful improvement of the crop, with high levels of farmer adoption
of new cultivars.
High level of vitamin A deficiency (VAD) prevails in Rwanda especially among women. In the
country, 7% of mothers showed some form of night blindness during their last pregnancy. A
5% VAD in a population is reported to be severe (Shaikh and Mahy 2003). To tackle VAD,
the Government of Rwanda adopted a scheduled vitamin A supplements in the form of
capsules to all children aged from 6 to 59 months. Also a single dose of vitamin A
supplement is being given to mothers after two months of delivery. However, this practice is
expensive and depends on positive perception by the population towards vitamin A
supplementation. Contrastingly, Van Jaarsveld et al. (2005) found that daily consumption of
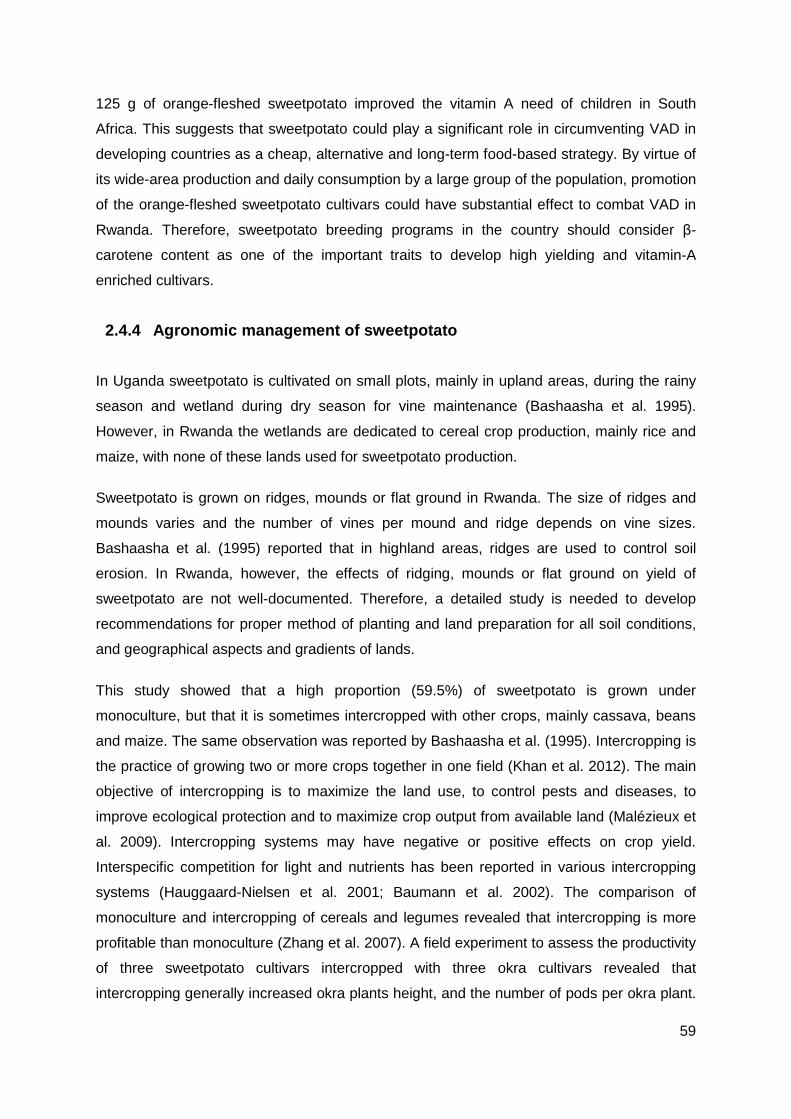
59
125 g of orange-fleshed sweetpotato improved the vitamin A need of children in South
Africa. This suggests that sweetpotato could play a significant role in circumventing VAD in
developing countries as a cheap, alternative and long-term food-based strategy. By virtue of
its wide-area production and daily consumption by a large group of the population, promotion
of the orange-fleshed sweetpotato cultivars could have substantial effect to combat VAD in
Rwanda. Therefore, sweetpotato breeding programs in the country should consider β-
carotene content as one of the important traits to develop high yielding and vitamin-A
enriched cultivars.
2.4.4 Agronomic management of sweetpotato
In Uganda sweetpotato is cultivated on small plots, mainly in upland areas, during the rainy
season and wetland during dry season for vine maintenance (Bashaasha et al. 1995).
However, in Rwanda the wetlands are dedicated to cereal crop production, mainly rice and
maize, with none of these lands used for sweetpotato production.
Sweetpotato is grown on ridges, mounds or flat ground in Rwanda. The size of ridges and
mounds varies and the number of vines per mound and ridge depends on vine sizes.
Bashaasha et al. (1995) reported that in highland areas, ridges are used to control soil
erosion. In Rwanda, however, the effects of ridging, mounds or flat ground on yield of
sweetpotato are not well-documented. Therefore, a detailed study is needed to develop
recommendations for proper method of planting and land preparation for all soil conditions,
and geographical aspects and gradients of lands.
This study showed that a high proportion (59.5%) of sweetpotato is grown under
monoculture, but that it is sometimes intercropped with other crops, mainly cassava, beans
and maize. The same observation was reported by Bashaasha et al. (1995). Intercropping is
the practice of growing two or more crops together in one field (Khan et al. 2012). The main
objective of intercropping is to maximize the land use, to control pests and diseases, to
improve ecological protection and to maximize crop output from available land (Malézieux et
al. 2009). Intercropping systems may have negative or positive effects on crop yield.
Interspecific competition for light and nutrients has been reported in various intercropping
systems (Hauggaard-Nielsen et al. 2001; Baumann et al. 2002). The comparison of
monoculture and intercropping of cereals and legumes revealed that intercropping is more
profitable than monoculture (Zhang et al. 2007). A field experiment to assess the productivity
of three sweetpotato cultivars intercropped with three okra cultivars revealed that
intercropping generally increased okra plants height, and the number of pods per okra plant.
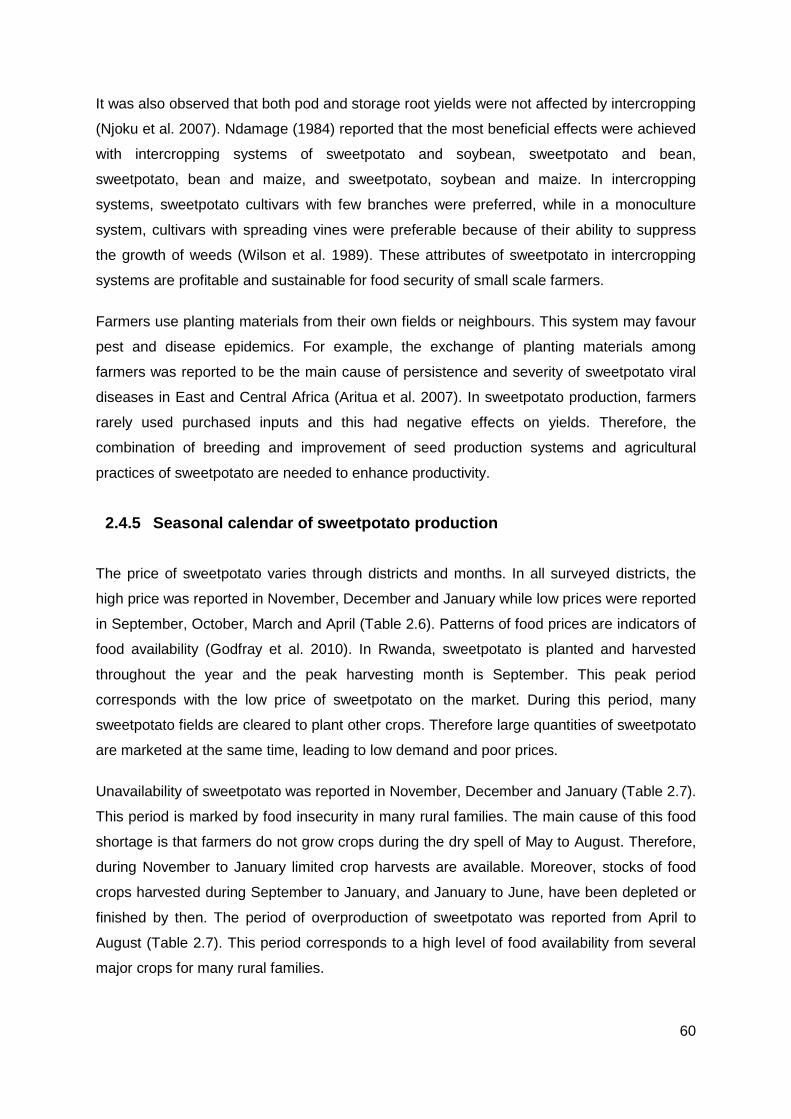
60
It was also observed that both pod and storage root yields were not affected by intercropping
(Njoku et al. 2007). Ndamage (1984) reported that the most beneficial effects were achieved
with intercropping systems of sweetpotato and soybean, sweetpotato and bean,
sweetpotato, bean and maize, and sweetpotato, soybean and maize. In intercropping
systems, sweetpotato cultivars with few branches were preferred, while in a monoculture
system, cultivars with spreading vines were preferable because of their ability to suppress
the growth of weeds (Wilson et al. 1989). These attributes of sweetpotato in intercropping
systems are profitable and sustainable for food security of small scale farmers.
Farmers use planting materials from their own fields or neighbours. This system may favour
pest and disease epidemics. For example, the exchange of planting materials among
farmers was reported to be the main cause of persistence and severity of sweetpotato viral
diseases in East and Central Africa (Aritua et al. 2007). In sweetpotato production, farmers
rarely used purchased inputs and this had negative effects on yields. Therefore, the
combination of breeding and improvement of seed production systems and agricultural
practices of sweetpotato are needed to enhance productivity.
2.4.5 Seasonal calendar of sweetpotato production
The price of sweetpotato varies through districts and months. In all surveyed districts, the
high price was reported in November, December and January while low prices were reported
in September, October, March and April (Table 2.6). Patterns of food prices are indicators of
food availability (Godfray et al. 2010). In Rwanda, sweetpotato is planted and harvested
throughout the year and the peak harvesting month is September. This peak period
corresponds with the low price of sweetpotato on the market. During this period, many
sweetpotato fields are cleared to plant other crops. Therefore large quantities of sweetpotato
are marketed at the same time, leading to low demand and poor prices.
Unavailability of sweetpotato was reported in November, December and January (Table 2.7).
This period is marked by food insecurity in many rural families. The main cause of this food
shortage is that farmers do not grow crops during the dry spell of May to August. Therefore,
during November to January limited crop harvests are available. Moreover, stocks of food
crops harvested during September to January, and January to June, have been depleted or
finished by then. The period of overproduction of sweetpotato was reported from April to
August (Table 2.7). This period corresponds to a high level of food availability from several
major crops for many rural families.
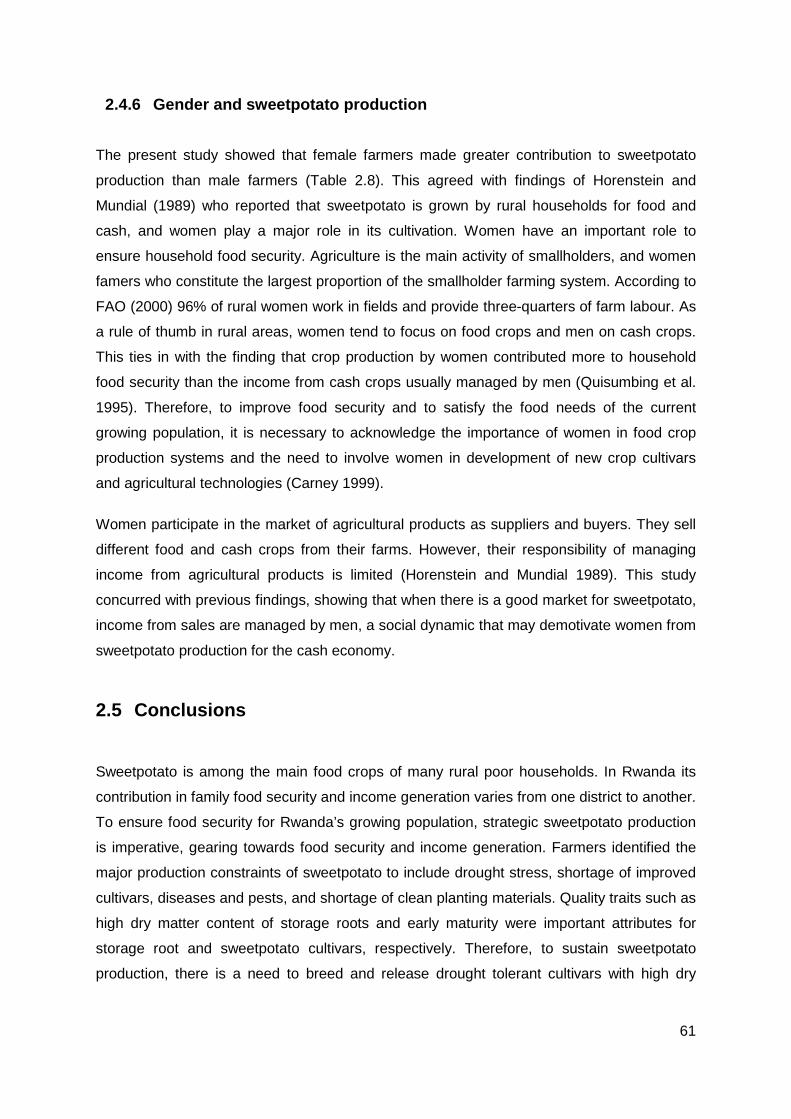
61
2.4.6 Gender and sweetpotato production
The present study showed that female farmers made greater contribution to sweetpotato
production than male farmers (Table 2.8). This agreed with findings of Horenstein and
Mundial (1989) who reported that sweetpotato is grown by rural households for food and
cash, and women play a major role in its cultivation. Women have an important role to
ensure household food security. Agriculture is the main activity of smallholders, and women
famers who constitute the largest proportion of the smallholder farming system. According to
FAO (2000) 96% of rural women work in fields and provide three-quarters of farm labour. As
a rule of thumb in rural areas, women tend to focus on food crops and men on cash crops.
This ties in with the finding that crop production by women contributed more to household
food security than the income from cash crops usually managed by men (Quisumbing et al.
1995). Therefore, to improve food security and to satisfy the food needs of the current
growing population, it is necessary to acknowledge the importance of women in food crop
production systems and the need to involve women in development of new crop cultivars
and agricultural technologies (Carney 1999).
Women participate in the market of agricultural products as suppliers and buyers. They sell
different food and cash crops from their farms. However, their responsibility of managing
income from agricultural products is limited (Horenstein and Mundial 1989). This study
concurred with previous findings, showing that when there is a good market for sweetpotato,
income from sales are managed by men, a social dynamic that may demotivate women from
sweetpotato production for the cash economy.
2.5 Conclusions
Sweetpotato is among the main food crops of many rural poor households. In Rwanda its
contribution in family food security and income generation varies from one district to another.
To ensure food security for Rwanda’s growing population, strategic sweetpotato production
is imperative, gearing towards food security and income generation. Farmers identified the
major production constraints of sweetpotato to include drought stress, shortage of improved
cultivars, diseases and pests, and shortage of clean planting materials. Quality traits such as
high dry matter content of storage roots and early maturity were important attributes for
storage root and sweetpotato cultivars, respectively. Therefore, to sustain sweetpotato
production, there is a need to breed and release drought tolerant cultivars with high dry
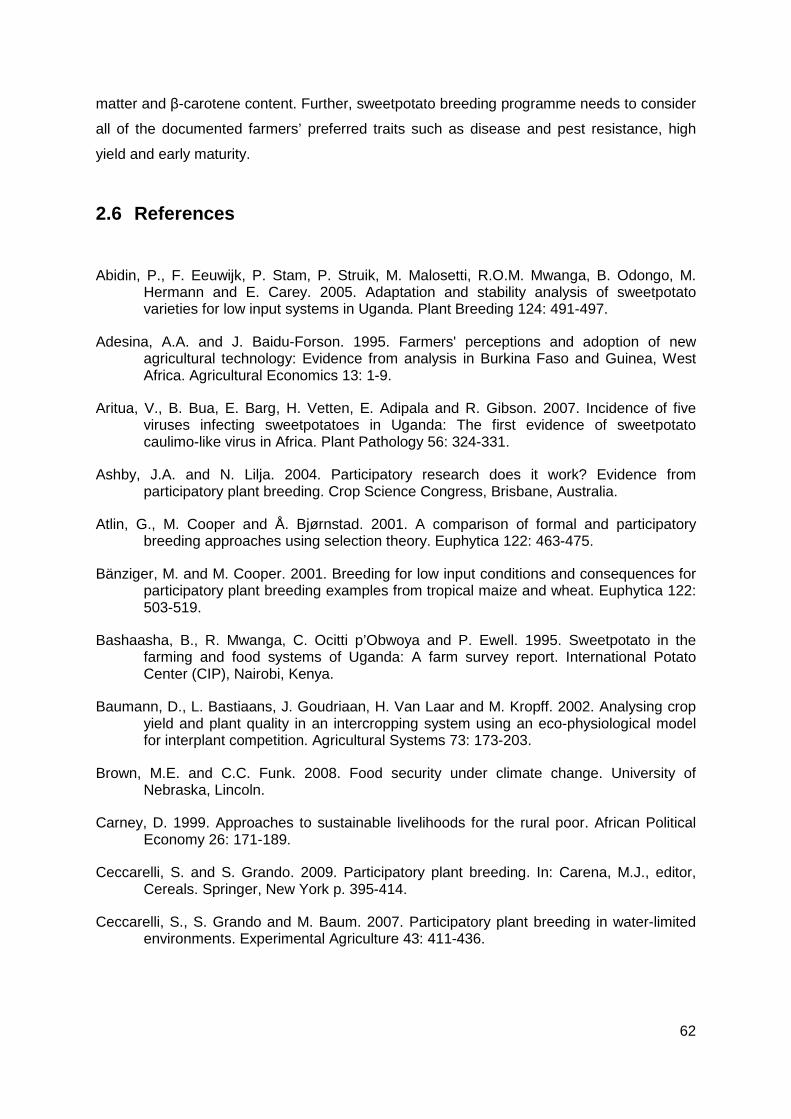
62
matter and β-carotene content. Further, sweetpotato breeding programme needs to consider
all of the documented farmers’ preferred traits such as disease and pest resistance, high
yield and early maturity.
2.6 References
Abidin, P., F. Eeuwijk, P. Stam, P. Struik, M. Malosetti, R.O.M. Mwanga, B. Odongo, M. Hermann and E. Carey. 2005. Adaptation and stability analysis of sweetpotato varieties for low input systems in Uganda. Plant Breeding 124: 491-497.
Adesina, A.A. and J. Baidu-Forson. 1995. Farmers' perceptions and adoption of new agricultural technology: Evidence from analysis in Burkina Faso and Guinea, West Africa. Agricultural Economics 13: 1-9.
Aritua, V., B. Bua, E. Barg, H. Vetten, E. Adipala and R. Gibson. 2007. Incidence of five viruses infecting sweetpotatoes in Uganda: The first evidence of sweetpotato caulimo-like virus in Africa. Plant Pathology 56: 324-331.
Ashby, J.A. and N. Lilja. 2004. Participatory research does it work? Evidence from participatory plant breeding. Crop Science Congress, Brisbane, Australia.
Atlin, G., M. Cooper and Å. Bjørnstad. 2001. A comparison of formal and participatory breeding approaches using selection theory. Euphytica 122: 463-475.
Bänziger, M. and M. Cooper. 2001. Breeding for low input conditions and consequences for participatory plant breeding examples from tropical maize and wheat. Euphytica 122: 503-519.
Bashaasha, B., R. Mwanga, C. Ocitti p’Obwoya and P. Ewell. 1995. Sweetpotato in the farming and food systems of Uganda: A farm survey report. International Potato Center (CIP), Nairobi, Kenya.
Baumann, D., L. Bastiaans, J. Goudriaan, H. Van Laar and M. Kropff. 2002. Analysing crop yield and plant quality in an intercropping system using an eco-physiological model for interplant competition. Agricultural Systems 73: 173-203.
Brown, M.E. and C.C. Funk. 2008. Food security under climate change. University of Nebraska, Lincoln.
Carney, D. 1999. Approaches to sustainable livelihoods for the rural poor. African Political Economy 26: 171-189.
Ceccarelli, S. and S. Grando. 2009. Participatory plant breeding. In: Carena, M.J., editor, Cereals. Springer, New York p. 395-414.
Ceccarelli, S., S. Grando and M. Baum. 2007. Participatory plant breeding in water-limited environments. Experimental Agriculture 43: 411-436.
63
Ceccarelli, S., S. Grando, R. Tutwiler, J. Baha, A. Martini, H. Salahieh, A. Goodchild and M. Michael. 2000. A methodological study on participatory barley breeding: Selection phase. Euphytica 111: 91-104.
Ceccarelli, S., E.P. Guimarães and E. Weltzien, editor(s), 2009. Plant breeding and farmer participation. FAO, Rome.
Chassy, B., M. Egnin, Y. Gao, G. Kleter, P. Nestel, M. Newell-McGloughlin, R. Phipps and R. Shillito. 2008. Nutritional and safety assessments of foods and feeds nutritionally improved through biotechnology. Comprehensive Reviews in Food Science and Food Safety 7: 50-113.
FAO. 2000. Women and developing agriculture. Food Agriculture Organisation, Rome.
FAOSTAT. 2013. Statistics division. FAO. http://faostat.fao.org/site/612/default.aspx#ancor (accessed Accessed 7 July 2015).
Fuglie, K.O. 2007. Priorities for sweetpotato research in developing countries: Results of a survey. Horticulture Science 42: 1200-1206.
Gibson, R.W., V. Aritua, E. Byamukama, I. Mpembe and J. Kayongo. 2004. Control strategies for sweetpotato virus disease in Africa. Virus Research 100: 115-122.
Gibson, R.W., E. Byamukama, I. Mpembe, K. James and R.O.M. Mwanga. 2008. Working with farmer groups in Uganda to develop new sweetpotato cultivars: Decentralisation and building on traditional approaches. Euphytica 159: 159:217-228.
Githunguri, C.M., C.C.K. Ariithi, R. Kapinga, S. Agili, Y.N. Migwa, J.K. Ng’ang’a and L. Mutuku. 2006. Farmers' perceptions of plant growth and organoleptic characteristics on elite sweetpotato clones in Machakoc and semi-arid Eastern Kenya. Ruforum 2: 12-19.
Godfray, H.C.J., J.R. Beddington, I.R. Crute, L. Haddad, D. Lawrence, J.F. Muir, J. Pretty, S. Robinson, S.M. Thomas and C. Toulmin. 2010. Food security: The challenge of feeding 9 billion people. Science 327: 812-818.
Hauggaard-Nielsen, H., P. Ambus and E.S. Jensen. 2001. Interspecific competition, N use and interference with weeds in pea-barley intercropping. Field Crops Research 70: 101-109.
Horenstein, N.R. and B. Mundial. 1989. Women and food security in Kenya. Population and Human Resources Department, World Bank.
Kapinga, R. and E.E. Carey. 2003. Present status of sweetpotato breeding for Eastern and Southern Africa. In: Ree, D., Q.E.A. Van Oirschot and R.E. Kapinga, editors, Sweetpotato post harvest assessment: Experiences from East Africa. NRI ,CPHP, DFID, CIP and Ministry of Agriculture Tanzania, Chatman, UK. p. 3-8
Kayitare, L. 2006. Rwanda food security update. News Net of World Food Programme.Kigali-Rwanda. p. 1-6.
Khan, M.A., K. Naveed, B.A. Kawsar Ali and S. Jan. 2012. Impact of mungbean-maize intercropping on growth and yield of mungbean. Pakistan Journal of Weed Science Research 18: 191-200.
64
Kivuva, B.M. 2013. Breeding sweetpotato (Ipomoea batatas [L.] Lam.) for drought tolerance in Kenya. PhD. Thesis, University of KwaZulu-Natal, Pietermaritzburg, South Africa.
Laurie, S. and M. Magoro. 2008. Evaluation and release of new sweetpotato varieties through farmer participatory selection. African Journal of Agricultural Research 3: 672-676.
Lebot, V. 2009. Sweetpotato. In: Bradshaw, J.E., editor, Root and tuber crops: Handbook of plant breeding. Springer Sciences and Business Media, New York, NY 10013, USA. p. 97-125.
Lilja, N. and A. Aw-Hasaan. 2003. Benefits and costs of participatory barley breeding in Syria. The 25th international conference of IAAE, Durban, South Africa. 16–22 August. CIMMYT.
Malézieux, E., Y. Crozat, C. Dupraz, M. Laurans, D. Makowski, H. Ozier-Lafontaine, B. Rapidel, S. De Tourdonnet and M. Valantin-Morison. 2009. Mixing plant species in cropping systems: Concepts, tools and models. Agronomy for Sustainable Development 29: 329-353.
Muyinza, H., P. Stevenson, R. Mwanga, H. Talwana, J. Murumu and B. Odongo. 2007. The relationship between stem base and root damage by Cylas spp. on sweetpotato. African Crop Science Society 8: 955-957.
Ndamage, G. 1984. Sweetpotato production potential in Rwanda. Triennial Root Crops Symposium of the International Society for Tropical Root Crops, Douala. 14-19 Aug 1983. IDRC.
Ndamage, G., P. Ntawuruhunga and J. Mulindangabo. 1992. Progrès de la recherche sur les plantes à racines et tubercules au Rwanda, 1984-1991. Institut des Sciences Agronomiques du Rwanda et Centre de Recherches pour le Developpement International, Butare.
NISR. 2010. Integrated household living conditions survey. DFID, Kigali.
NISR. 2012. The provisional results of the 4th population and housing census of Rwanda. National Institute of Statistics of Rwanda, Kigali-Rwanda.
Njeru, R., M. Bagabe, D. Nkezabahizi, D. Kayiranga, J. Kajuga, L. Butare and J. Ndirigue. 2008. Viruses infecting sweetpotato in Rwanda: Occurrence and distribution. Annals of Applied Biology 153: 215-221.
Njoku, S., C. Muoneke, D. Okpara and F. Agbo. 2007. Effect of intercropping varieties of sweetpotato and okra in an ultisol of southeastern Nigeria. African Journal of Biotechnology 6: 1650-1654.
Payne, R.W., D.A. Murray, S.A. Harding, D.B. Baird and D.M. Soutar. 2011. An introduction to GenStat for windows (14th Edition). Hemel Hempstead, UK.
Quisumbing, A.R., L.R. Brown, H.S. Feldstein, L. Haddad and C. Peña. 1995. Women: The key to food security. Washington, D.C.
65
Rees, D., Q.E.A. van Oirschot, R. Amour, E. Rwiza, R. Kapinga and T. Carey. 2003. Cultivar variation in keeping quality of sweetpotatoes. Postharvest Biology and Technology 28: 313-325.
Rwakabuba, N. 2012. Orange fleshed sweetpotato biscuit at Urwibutso entreprise. RAB, Center for Agricultural Information and Communication (CICA), Kigali.
Shaikh, J. and L. Mahy. 2003. Assessment of the vitamin A situation in Rwanda. USAID, Kigali, Rwanda.
Song, Y. 1998. New seed in old China: Impact of CIMMYT collaborative programme on maize breeding in south-western China. Universiteit Wageningen, Landbouw.
Sperling, L., Ashby, J.A., Smith, M.E., Weltzien, E., Guire, S. Mc. 2001. A framework for analyzing participatory plant breeding approaches and results. Euphytica 122: 106-119.
SPSS. 2006. PASW Statistics for Windows SPSS Inc. City, country
Sseruwu, G. 2012. Breeding of Sweetpotato (Ipomoea batatas (L.) Lam.) for storage root yield and resistance to Alternaria leaf petiole and stem blight (Alternaria spp.) in Uganda. PhD. Thesis, University of KwaZulu-Natal, Pietermaritzburg, South Africa.
Tester, M. and P. Langridge. 2010. Breeding technologies to increase crop production in a changing world. Science 327: 818-822.
Tilman, D., J. Fargione, B. Wolff, C. D'Antonio, A. Dobson, R. Howarth, D. Schindler, W.H. Schlesinger, D. Simberloff and D. Swackhamer. 2001. Forecasting agriculturally driven global environmental change. Science 292: 281-284.
Tshuma, M.C. 2012. A review of the poverty and food security issues in South Africa: Is agriculture the solution? African Journal of Agricultural Research 7: 4010-4020.
Van Jaarsveld, P.J., M. Faber, S.A. Tanumihardjo, P. Nestel, C.J. Lombard and A.J. Spinnler Benad´e. 2005. β-carotene-rich orange fleshed sweetpotato improves the vitamin A status of primary school children assessed with the modified relative dose response test. American Journal of Clinical Nutrition 81: 1080-1087.
Wilson, J.E., F.S. Pole, N.E.J. Smit and P. Taufatofua. 1989. Sweetpotato breeding. IRETA publications, Apia, Western Samoa.
Witcombe, J., A. Joshi, K. Joshi and B. Sthapit. 1996. Farmer participatory crop improvement: Varietal selection and breeding methods and their impact on biodiversity. Experimental Agriculture 32: 445-460.
Woolfe, J.A. 1992. Sweetpotato: An untapped food resource. Cambridge University Press, New York.
Zhang, L.-z., W. Van der Werf, S.-p. Zhang, B. Li and J. Spiertz. 2007. Growth, yield and quality of wheat and cotton in relay strip intercropping systems. Field Crops Research 103: 178-188.
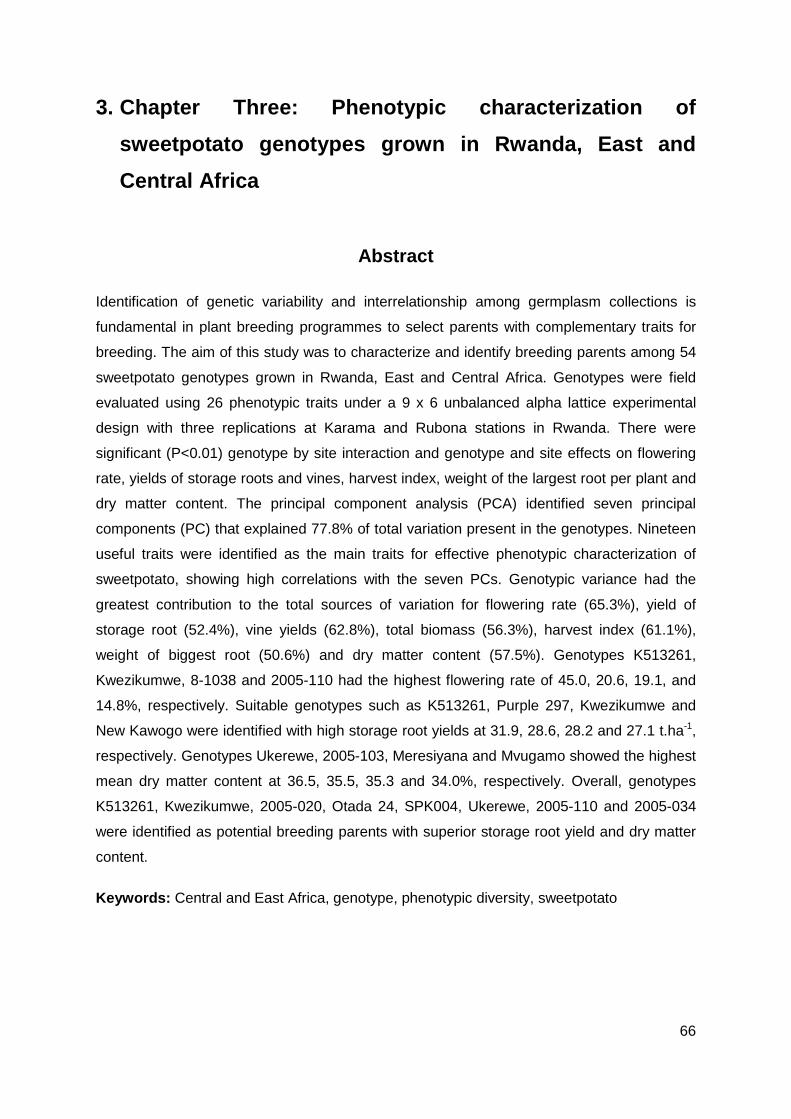
66
3. Chapter Three: Phenotypic characterization of
sweetpotato genotypes grown in Rwanda, East and
Central Africa
Abstract
Identification of genetic variability and interrelationship among germplasm collections is
fundamental in plant breeding programmes to select parents with complementary traits for
breeding. The aim of this study was to characterize and identify breeding parents among 54
sweetpotato genotypes grown in Rwanda, East and Central Africa. Genotypes were field
evaluated using 26 phenotypic traits under a 9 x 6 unbalanced alpha lattice experimental
design with three replications at Karama and Rubona stations in Rwanda. There were
significant (P<0.01) genotype by site interaction and genotype and site effects on flowering
rate, yields of storage roots and vines, harvest index, weight of the largest root per plant and
dry matter content. The principal component analysis (PCA) identified seven principal
components (PC) that explained 77.8% of total variation present in the genotypes. Nineteen
useful traits were identified as the main traits for effective phenotypic characterization of
sweetpotato, showing high correlations with the seven PCs. Genotypic variance had the
greatest contribution to the total sources of variation for flowering rate (65.3%), yield of
storage root (52.4%), vine yields (62.8%), total biomass (56.3%), harvest index (61.1%),
weight of biggest root (50.6%) and dry matter content (57.5%). Genotypes K513261,
Kwezikumwe, 8-1038 and 2005-110 had the highest flowering rate of 45.0, 20.6, 19.1, and
14.8%, respectively. Suitable genotypes such as K513261, Purple 297, Kwezikumwe and
New Kawogo were identified with high storage root yields at 31.9, 28.6, 28.2 and 27.1 t.ha-1,
respectively. Genotypes Ukerewe, 2005-103, Meresiyana and Mvugamo showed the highest
mean dry matter content at 36.5, 35.5, 35.3 and 34.0%, respectively. Overall, genotypes
K513261, Kwezikumwe, 2005-020, Otada 24, SPK004, Ukerewe, 2005-110 and 2005-034
were identified as potential breeding parents with superior storage root yield and dry matter
content.
Keywords: Central and East Africa, genotype, phenotypic diversity, sweetpotato
67
3.1 Introduction
Sweetpotato (Ipomoea babatas [L.] Lam) is an important food security crop widely grown in
the tropics (Woolfe 1992). In sub-Sahara Africa it remains the fourth important crop after
cassava, banana and maize (FAOSTAT 2013). Sweetpotato adapts to many agro-ecological
zones, with a growing period varying from three to five months, depending on genotype and
environment (Afuape et al. 2011). This crop can grow in poor soils with relatively low levels
of nutrients when compared to other root crops (Woolfe 1992).
Sweetpotato serves as human food, animal feed, industrial raw material and for biofuel
production (Aregheore 2004; Low et al. 2009). In sub-Saharan Africa leaves of sweetpotato
are also consumed as a vegetable which is rich in vitamins and minerals (Low et al. 2007;
Ma et al. 2009). Sweetpotato has considerable potential to reduce malnutrition and improve
food security in many developing countries owing to its comparatively high biomass
production and adaptation to harsh growing environments (Hsiao-Feng et al. 2007; Courtney
et al. 2008). Further, the crop may serve as a valuable source of income for small-scale
farmers.
Identification of suitable genotypes with complementary economic traits is an important step
for crop improvement and sustainable crop production (Tseng et al. 2002; Elameen et al.
2011). Understanding the genetic variability and genetic interrelationship present among
germplasm collections is valuable to avoid redundancy, and allows plant breeders to select
potential parents with desirable traits for cultivar development (Chaudhary and Singh 1982;
Yoshida 2004). Afuape et al. (2011) reported that proper management and effective
utilization of plant genetic resources depend on detailed understanding of their genetic
variability. The failure to identify suitable and potential parents affects the outcome of the
breeding programme, which is dependent on the degree of genetic variability present in the
source population (Tseng et al. 2002).
Various methods are available to measure the genetic variation among crop genetic
resources. These methods rely on the availability of data based on pedigree, plant
morphology, agronomic performance, and biochemical and molecular analyses (Mohammadi
and Prasanna 2003). Field phenotyping is a common method to determine genetic variation
between and within genotypes (Yoshida 2004). Standardized phenotypic descriptors of
sweetpotato have been developed (Huamán 1999) and widely used in various genetic
studies of sweetpotato (Ngeve 1993; Tseng et al. 2002; Tairo et al. 2008; Elameen et al.
68
2011). These studies reported the presence of high level of genetic variation for tolerance to
biotic and abiotic stresses, and agronomic traits such as foliage development, storage root
yields, and dry matter and nutrient content.
Sweetpotato and beans (Phaseolus vulgalis L.) are the main staple food crops grown in
Rwanda (Ndamage et al. 1992). Sweetpotato is grown by over 98% of the Rwandan farmers
across all agro-ecological zones of the country (Ndirigwe 2006; Njeru et al. 2008). It
occupies an estimated area of 10% of all the cultivated land in Rwanda grown in both the
main and off-seasons (ISAR 2007). In terms of total production, sweetpotato is the third root
crop after cassava and potato (FAOSTAT 2013).
Phenotypic markers reflect crop ideotypes, which are relatively cheap and easy to use,
depending on prior knowledge of such traits and their expression (Elameen et al. 2011).
However, phenotypic traits are highly affected by environmental factors (Elameen et al.
2011). When using phenotypic traits to characterize germplasm, it was recommended to test
a set of genotypes across seasons and locations with sufficient replications for a meaningful
comparison and selection (Jacoby et al. 2003). A combined use of morphological,
biochemical and molecular (DNA) markers has been proposed for genetic diversity studies
(Elameen et al. 2011).
Diverse genotypes of sweetpotatoes are being grown in Rwanda. One hundred and thirteen
genotypes have been collected and maintained by the National Sweetpotato Research
Programme of the Rwanda Agricultural Board (RAB). These collections include landraces,
locally bred clones and introductions. However, this germplasm is not well characterized and
the genetic diversity present in the collections is not known, which impacts breeding and
strategic conservation of the crop. Therefore, the objectives of this study were to determine
the phenotypic diversity among Rwandan grown sweetpotato germplasm and to identify
superior parents for breeding purposes.
3.2 Materials and Methods
3.2.1 Plant materials
In this study 54 sweetpotato genotypes which are commonly grown in Rwanda were used.
The details of the genotypes are presented in Table 3.1. These genotypes were selected
from 113 genotypes maintained by the National Sweetpotato Research Programme of
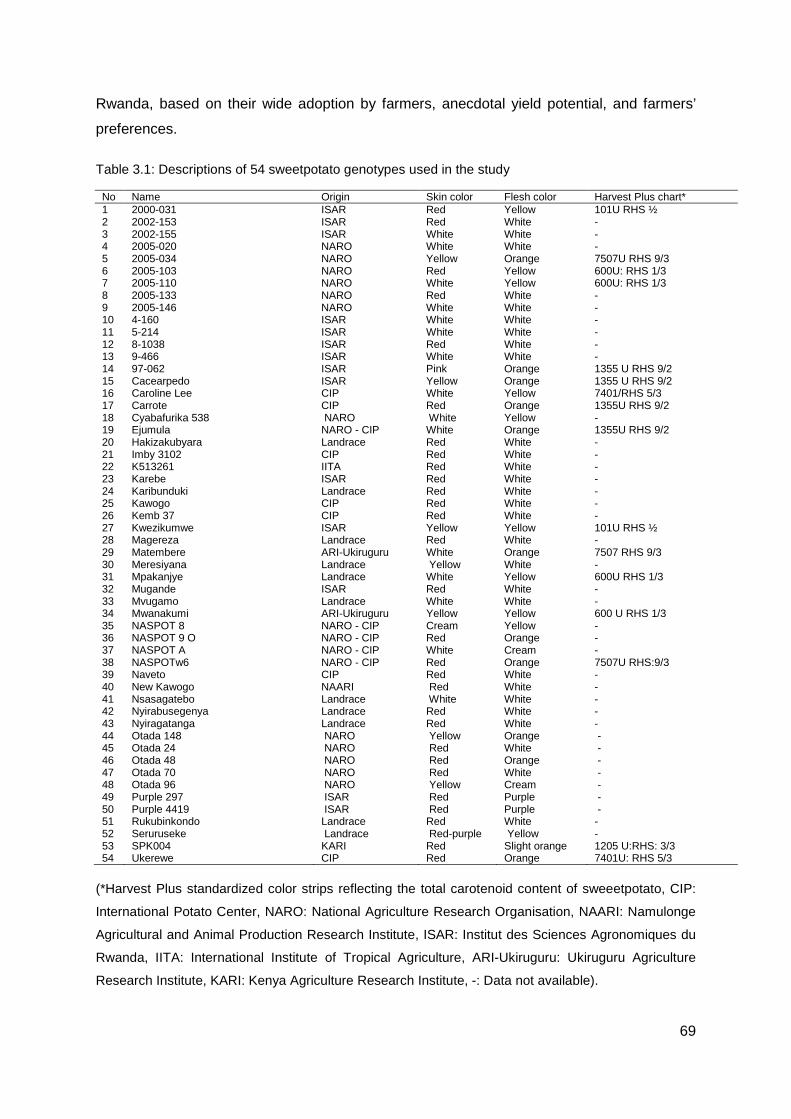
69
Rwanda, based on their wide adoption by farmers, anecdotal yield potential, and farmers’
preferences.
Table 3.1: Descriptions of 54 sweetpotato genotypes used in the study
No Name Origin Skin color Flesh color Harvest Plus chart* 1 2000-031 ISAR Red Yellow 101U RHS ½ 2 2002-153 ISAR Red White - 3 2002-155 ISAR White White - 4 2005-020 NARO White White - 5 2005-034 NARO Yellow Orange 7507U RHS 9/3 6 2005-103 NARO Red Yellow 600U: RHS 1/3 7 2005-110 NARO White Yellow 600U: RHS 1/3 8 2005-133 NARO Red White - 9 2005-146 NARO White White - 10 4-160 ISAR White White - 11 5-214 ISAR White White - 12 8-1038 ISAR Red White - 13 9-466 ISAR White White - 14 97-062 ISAR Pink Orange 1355 U RHS 9/2 15 Cacearpedo ISAR Yellow Orange 1355 U RHS 9/2 16 Caroline Lee CIP White Yellow 7401/RHS 5/3 17 Carrote CIP Red Orange 1355U RHS 9/2 18 Cyabafurika 538 NARO White Yellow - 19 Ejumula NARO - CIP White Orange 1355U RHS 9/2 20 Hakizakubyara Landrace Red White - 21 Imby 3102 CIP Red White - 22 K513261 IITA Red White - 23 Karebe ISAR Red White - 24 Karibunduki Landrace Red White - 25 Kawogo CIP Red White - 26 Kemb 37 CIP Red White - 27 Kwezikumwe ISAR Yellow Yellow 101U RHS ½ 28 Magereza Landrace Red White - 29 Matembere ARI-Ukiruguru White Orange 7507 RHS 9/3 30 Meresiyana Landrace Yellow White - 31 Mpakanjye Landrace White Yellow 600U RHS 1/3 32 Mugande ISAR Red White - 33 Mvugamo Landrace White White - 34 Mwanakumi ARI-Ukiruguru Yellow Yellow 600 U RHS 1/3 35 NASPOT 8 NARO - CIP Cream Yellow - 36 NASPOT 9 O NARO - CIP Red Orange - 37 NASPOT A NARO - CIP White Cream - 38 NASPOTw6 NARO - CIP Red Orange 7507U RHS:9/3 39 Naveto CIP Red White - 40 New Kawogo NAARI Red White - 41 Nsasagatebo Landrace White White - 42 Nyirabusegenya Landrace Red White - 43 Nyiragatanga Landrace Red White - 44 Otada 148 NARO Yellow Orange - 45 Otada 24 NARO Red White - 46 Otada 48 NARO Red Orange - 47 Otada 70 NARO Red White - 48 Otada 96 NARO Yellow Cream - 49 Purple 297 ISAR Red Purple - 50 Purple 4419 ISAR Red Purple - 51 Rukubinkondo Landrace Red White - 52 Seruruseke Landrace Red-purple Yellow - 53 SPK004 KARI Red Slight orange 1205 U:RHS: 3/3 54 Ukerewe CIP Red Orange 7401U: RHS 5/3
(*Harvest Plus standardized color strips reflecting the total carotenoid content of sweeetpotato, CIP:
International Potato Center, NARO: National Agriculture Research Organisation, NAARI: Namulonge
Agricultural and Animal Production Research Institute, ISAR: Institut des Sciences Agronomiques du
Rwanda, IITA: International Institute of Tropical Agriculture, ARI-Ukiruguru: Ukiruguru Agriculture
Research Institute, KARI: Kenya Agriculture Research Institute, -: Data not available).
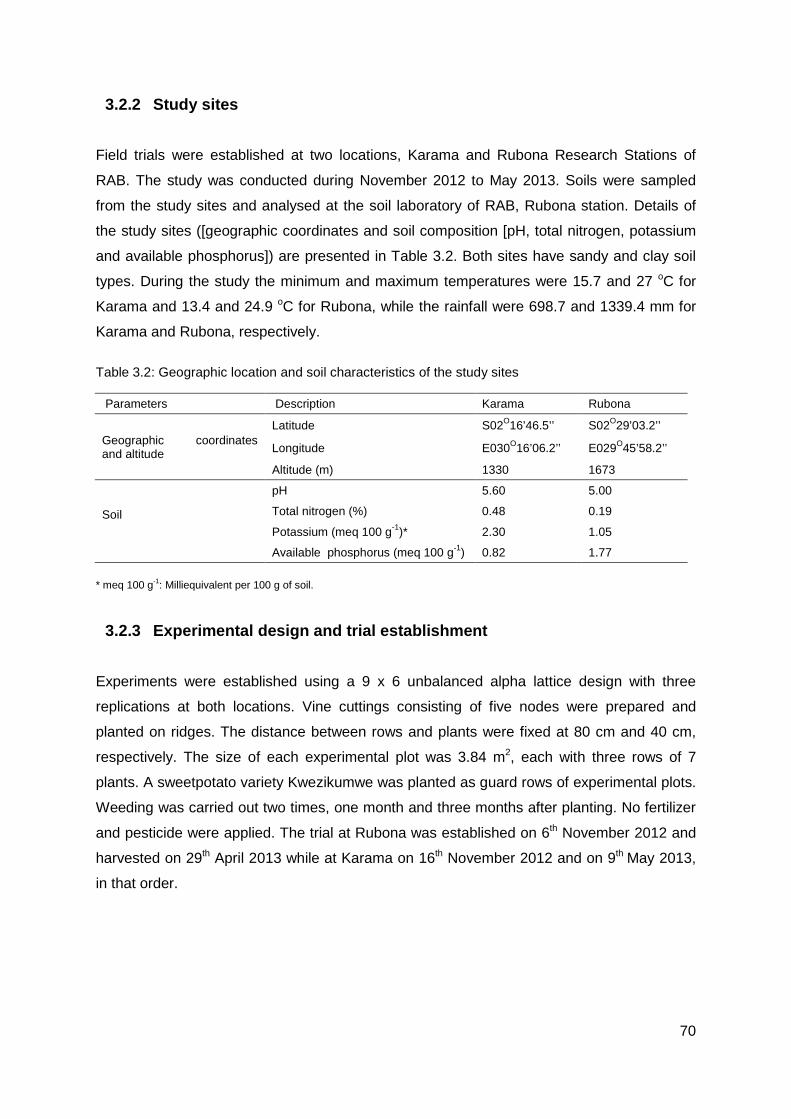
70
3.2.2 Study sites
Field trials were established at two locations, Karama and Rubona Research Stations of
RAB. The study was conducted during November 2012 to May 2013. Soils were sampled
from the study sites and analysed at the soil laboratory of RAB, Rubona station. Details of
the study sites ([geographic coordinates and soil composition [pH, total nitrogen, potassium
and available phosphorus]) are presented in Table 3.2. Both sites have sandy and clay soil
types. During the study the minimum and maximum temperatures were 15.7 and 27 oC for
Karama and 13.4 and 24.9 oC for Rubona, while the rainfall were 698.7 and 1339.4 mm for
Karama and Rubona, respectively.
Table 3.2: Geographic location and soil characteristics of the study sites
Parameters Description Karama Rubona
Geographic coordinates and altitude
Latitude S02O16’46.5’’ S02O29’03.2’’
Longitude E030O16’06.2’’ E029O45’58.2’’
Altitude (m) 1330 1673
Soil
pH 5.60 5.00
Total nitrogen (%) 0.48 0.19
Potassium (meq 100 g-1)* 2.30 1.05
Available phosphorus (meq 100 g-1) 0.82 1.77
* meq 100 g-1: Milliequivalent per 100 g of soil.
3.2.3 Experimental design and trial establishment
Experiments were established using a 9 x 6 unbalanced alpha lattice design with three
replications at both locations. Vine cuttings consisting of five nodes were prepared and
planted on ridges. The distance between rows and plants were fixed at 80 cm and 40 cm,
respectively. The size of each experimental plot was 3.84 m2, each with three rows of 7
plants. A sweetpotato variety Kwezikumwe was planted as guard rows of experimental plots.
Weeding was carried out two times, one month and three months after planting. No fertilizer
and pesticide were applied. The trial at Rubona was established on 6th November 2012 and
harvested on 29th April 2013 while at Karama on 16th November 2012 and on 9th May 2013,
in that order.
71
3.2.4 Data collection
Data on flowering ability (flowering rate) were recorded at 30, 60, 90 and 120 days after
planting as the percentage of plants which flowered in an experimental plot. Data on yield
and yield components were recorded on seven sampled and tagged plants per experimental
plot. These data included weight of storage roots, weight of vines, weight of the largest root,
total biomass and harvest index, internode length, vine diameter, vine length and vine
number. Qualitative data such as storage root formation, storage root shape, skin color of
storage root, storage root surface defects, storage root flesh colour, latex production in
storage roots and oxidation in storage roots, were recorded during harvest following the
method developed by the International Potato Center (CIP) (Huamán 1999). General leaf
shape, type of leaf lobes, shape of central lobe and number of lobes were also recorded
using the CIP method (Huamán 1999). Dry matter content was determined after modifying
the methods described by Carey and Reynoso (1996) and Tairo et al. (2008). Briefly, fresh
root samples were collected from three healthy big roots per genotype. Approximately 50 to
55 g of the fresh weight were excised and kept in a paper bag prior to drying. Samples were
dried in an oven at 70 oC for 72 hours. Dried samples were weighed with a sensitive balance
and dry matter content determined using the formula: Dry matter content (DM) % = [(Dry
weight/Fresh weight) x 100].
3.2.5 Data analysis
All collected quantitative data were subjected to the standard analysis of variance using the
GLM procedure of the SAS 9.2 statistical programme (SAS 2004). When significant
differences were detected, means were separated using the LSD test procedure at the 5%
significance level (Cochran and Cox 1992). Qualitative data were analysed with a non-
parametric method of Krusal-Wallis test procedure using SPSS (SPSS 2006). Cluster
analysis of 26 phenotypic traits to determine genetic relationships and to identify unique
genotypes. The phenotypic traits included in this analysis were yield and yield components
(yields of roots and vines, total biomass, harvest index, largest root weight, root number per
plant), storage root quality (skin color, storage root defect, fresh color, latex production and
oxidation of storage root, dry matter content), vine (internode length, vine diameter, vine
length, vine number), leaf (shape of central lobe, leaf general outline, lobe number, leaf lobe
type) and inflorescence (flowering rate after first, second, third and fourth month of plating).
A similarity matrix was determined using Euclidean distance and a dendogram generated
using the nearest neighbor method (Mohammadi and Prasanna 2003). Genotype and
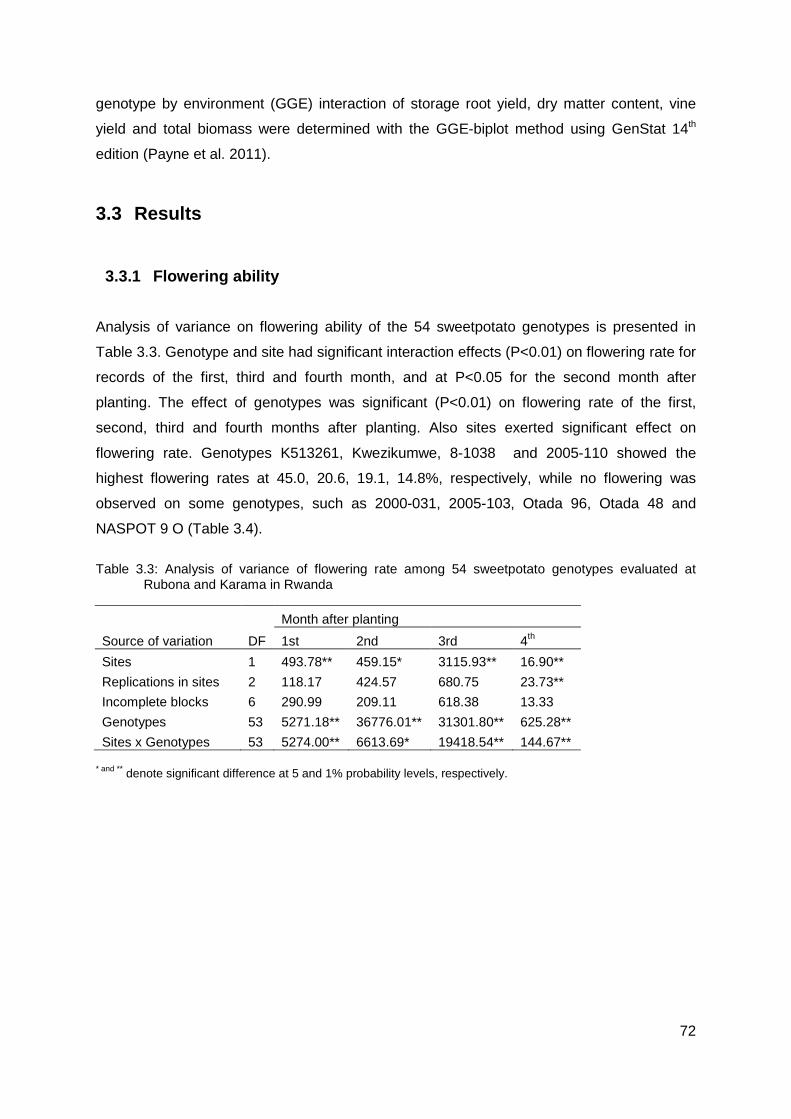
72
genotype by environment (GGE) interaction of storage root yield, dry matter content, vine
yield and total biomass were determined with the GGE-biplot method using GenStat 14th
edition (Payne et al. 2011).
3.3 Results
3.3.1 Flowering ability
Analysis of variance on flowering ability of the 54 sweetpotato genotypes is presented in
Table 3.3. Genotype and site had significant interaction effects (P<0.01) on flowering rate for
records of the first, third and fourth month, and at P<0.05 for the second month after
planting. The effect of genotypes was significant (P<0.01) on flowering rate of the first,
second, third and fourth months after planting. Also sites exerted significant effect on
flowering rate. Genotypes K513261, Kwezikumwe, 8-1038 and 2005-110 showed the
highest flowering rates at 45.0, 20.6, 19.1, 14.8%, respectively, while no flowering was
observed on some genotypes, such as 2000-031, 2005-103, Otada 96, Otada 48 and
NASPOT 9 O (Table 3.4).
Table 3.3: Analysis of variance of flowering rate among 54 sweetpotato genotypes evaluated at Rubona and Karama in Rwanda
Source of variation DF
Month after planting
1st 2nd 3rd 4th
Sites 1 493.78** 459.15* 3115.93** 16.90**
Replications in sites 2 118.17 424.57 680.75 23.73**
Incomplete blocks 6 290.99 209.11 618.38 13.33
Genotypes 53 5271.18** 36776.01** 31301.80** 625.28**
Sites x Genotypes 53 5274.00** 6613.69* 19418.54** 144.67**
* and ** denote significant difference at 5 and 1% probability levels, respectively.
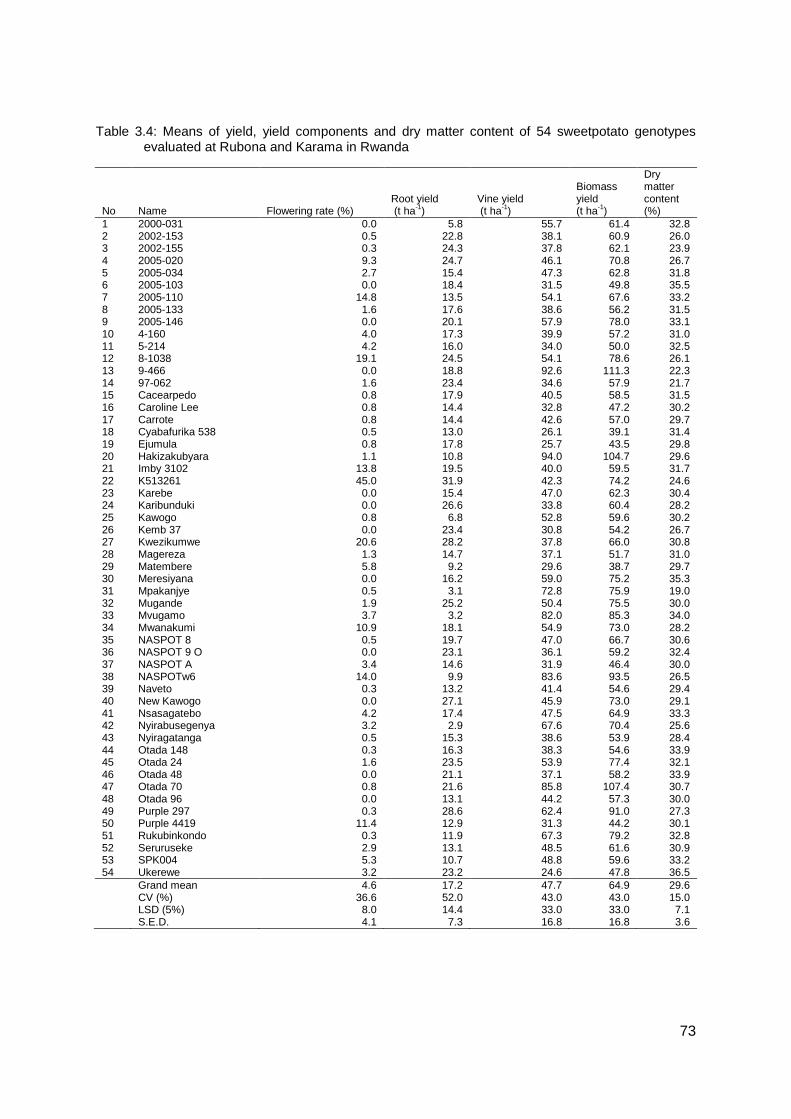
73
Table 3.4: Means of yield, yield components and dry matter content of 54 sweetpotato genotypes evaluated at Rubona and Karama in Rwanda
No Name Flowering rate (%) Root yield (t ha-1)
Vine yield (t ha-1)
Biomass yield (t ha-1)
Dry matter content (%)
1 2000-031 0.0 5.8 55.7 61.4 32.8 2 2002-153 0.5 22.8 38.1 60.9 26.0 3 2002-155 0.3 24.3 37.8 62.1 23.9 4 2005-020 9.3 24.7 46.1 70.8 26.7 5 2005-034 2.7 15.4 47.3 62.8 31.8 6 2005-103 0.0 18.4 31.5 49.8 35.5 7 2005-110 14.8 13.5 54.1 67.6 33.2 8 2005-133 1.6 17.6 38.6 56.2 31.5 9 2005-146 0.0 20.1 57.9 78.0 33.1 10 4-160 4.0 17.3 39.9 57.2 31.0 11 5-214 4.2 16.0 34.0 50.0 32.5 12 8-1038 19.1 24.5 54.1 78.6 26.1 13 9-466 0.0 18.8 92.6 111.3 22.3 14 97-062 1.6 23.4 34.6 57.9 21.7 15 Cacearpedo 0.8 17.9 40.5 58.5 31.5 16 Caroline Lee 0.8 14.4 32.8 47.2 30.2 17 Carrote 0.8 14.4 42.6 57.0 29.7 18 Cyabafurika 538 0.5 13.0 26.1 39.1 31.4 19 Ejumula 0.8 17.8 25.7 43.5 29.8 20 Hakizakubyara 1.1 10.8 94.0 104.7 29.6 21 Imby 3102 13.8 19.5 40.0 59.5 31.7 22 K513261 45.0 31.9 42.3 74.2 24.6 23 Karebe 0.0 15.4 47.0 62.3 30.4 24 Karibunduki 0.0 26.6 33.8 60.4 28.2 25 Kawogo 0.8 6.8 52.8 59.6 30.2 26 Kemb 37 0.0 23.4 30.8 54.2 26.7 27 Kwezikumwe 20.6 28.2 37.8 66.0 30.8 28 Magereza 1.3 14.7 37.1 51.7 31.0 29 Matembere 5.8 9.2 29.6 38.7 29.7 30 Meresiyana 0.0 16.2 59.0 75.2 35.3 31 Mpakanjye 0.5 3.1 72.8 75.9 19.0 32 Mugande 1.9 25.2 50.4 75.5 30.0 33 Mvugamo 3.7 3.2 82.0 85.3 34.0 34 Mwanakumi 10.9 18.1 54.9 73.0 28.2 35 NASPOT 8 0.5 19.7 47.0 66.7 30.6 36 NASPOT 9 O 0.0 23.1 36.1 59.2 32.4 37 NASPOT A 3.4 14.6 31.9 46.4 30.0 38 NASPOTw6 14.0 9.9 83.6 93.5 26.5 39 Naveto 0.3 13.2 41.4 54.6 29.4 40 New Kawogo 0.0 27.1 45.9 73.0 29.1 41 Nsasagatebo 4.2 17.4 47.5 64.9 33.3 42 Nyirabusegenya 3.2 2.9 67.6 70.4 25.6 43 Nyiragatanga 0.5 15.3 38.6 53.9 28.4 44 Otada 148 0.3 16.3 38.3 54.6 33.9 45 Otada 24 1.6 23.5 53.9 77.4 32.1 46 Otada 48 0.0 21.1 37.1 58.2 33.9 47 Otada 70 0.8 21.6 85.8 107.4 30.7 48 Otada 96 0.0 13.1 44.2 57.3 30.0 49 Purple 297 0.3 28.6 62.4 91.0 27.3 50 Purple 4419 11.4 12.9 31.3 44.2 30.1 51 Rukubinkondo 0.3 11.9 67.3 79.2 32.8 52 Seruruseke 2.9 13.1 48.5 61.6 30.9 53 SPK004 5.3 10.7 48.8 59.6 33.2 54 Ukerewe 3.2 23.2 24.6 47.8 36.5 Grand mean 4.6 17.2 47.7 64.9 29.6 CV (%) 36.6 52.0 43.0 43.0 15.0 LSD (5%) 8.0 14.4 33.0 33.0 7.1 S.E.D. 4.1 7.3 16.8 16.8 3.6
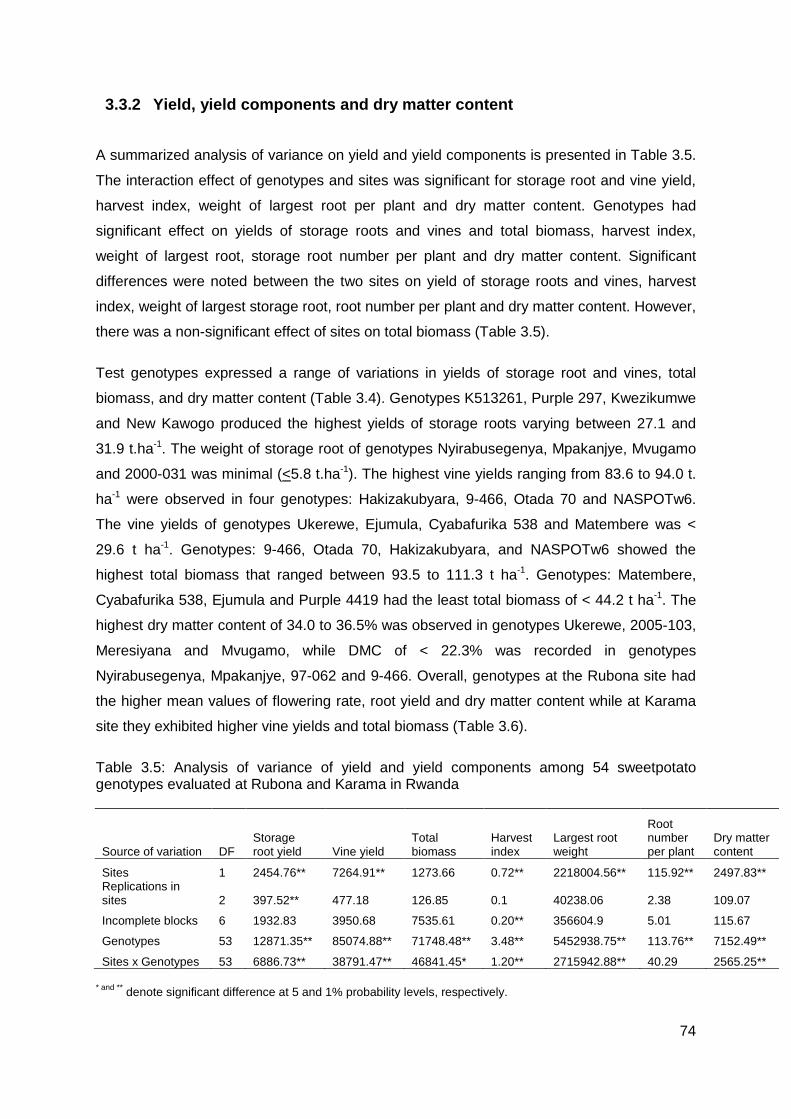
74
3.3.2 Yield, yield components and dry matter content
A summarized analysis of variance on yield and yield components is presented in Table 3.5.
The interaction effect of genotypes and sites was significant for storage root and vine yield,
harvest index, weight of largest root per plant and dry matter content. Genotypes had
significant effect on yields of storage roots and vines and total biomass, harvest index,
weight of largest root, storage root number per plant and dry matter content. Significant
differences were noted between the two sites on yield of storage roots and vines, harvest
index, weight of largest storage root, root number per plant and dry matter content. However,
there was a non-significant effect of sites on total biomass (Table 3.5).
Test genotypes expressed a range of variations in yields of storage root and vines, total
biomass, and dry matter content (Table 3.4). Genotypes K513261, Purple 297, Kwezikumwe
and New Kawogo produced the highest yields of storage roots varying between 27.1 and
31.9 t.ha-1. The weight of storage root of genotypes Nyirabusegenya, Mpakanjye, Mvugamo
and 2000-031 was minimal (<5.8 t.ha-1). The highest vine yields ranging from 83.6 to 94.0 t.
ha-1 were observed in four genotypes: Hakizakubyara, 9-466, Otada 70 and NASPOTw6.
The vine yields of genotypes Ukerewe, Ejumula, Cyabafurika 538 and Matembere was <
29.6 t ha-1. Genotypes: 9-466, Otada 70, Hakizakubyara, and NASPOTw6 showed the
highest total biomass that ranged between 93.5 to 111.3 t ha-1. Genotypes: Matembere,
Cyabafurika 538, Ejumula and Purple 4419 had the least total biomass of < 44.2 t ha-1. The
highest dry matter content of 34.0 to 36.5% was observed in genotypes Ukerewe, 2005-103,
Meresiyana and Mvugamo, while DMC of < 22.3% was recorded in genotypes
Nyirabusegenya, Mpakanjye, 97-062 and 9-466. Overall, genotypes at the Rubona site had
the higher mean values of flowering rate, root yield and dry matter content while at Karama
site they exhibited higher vine yields and total biomass (Table 3.6).
Table 3.5: Analysis of variance of yield and yield components among 54 sweetpotato genotypes evaluated at Rubona and Karama in Rwanda
Source of variation DF Storage root yield Vine yield
Total biomass
Harvest index
Largest root weight
Root number per plant
Dry matter content
Sites 1 2454.76** 7264.91** 1273.66 0.72** 2218004.56** 115.92** 2497.83** Replications in sites 2 397.52** 477.18 126.85 0.1 40238.06 2.38 109.07
Incomplete blocks 6 1932.83 3950.68 7535.61 0.20** 356604.9 5.01 115.67
Genotypes 53 12871.35** 85074.88** 71748.48** 3.48** 5452938.75** 113.76** 7152.49**
Sites x Genotypes 53 6886.73** 38791.47** 46841.45* 1.20** 2715942.88** 40.29 2565.25**
* and ** denote significant difference at 5 and 1% probability levels, respectively.
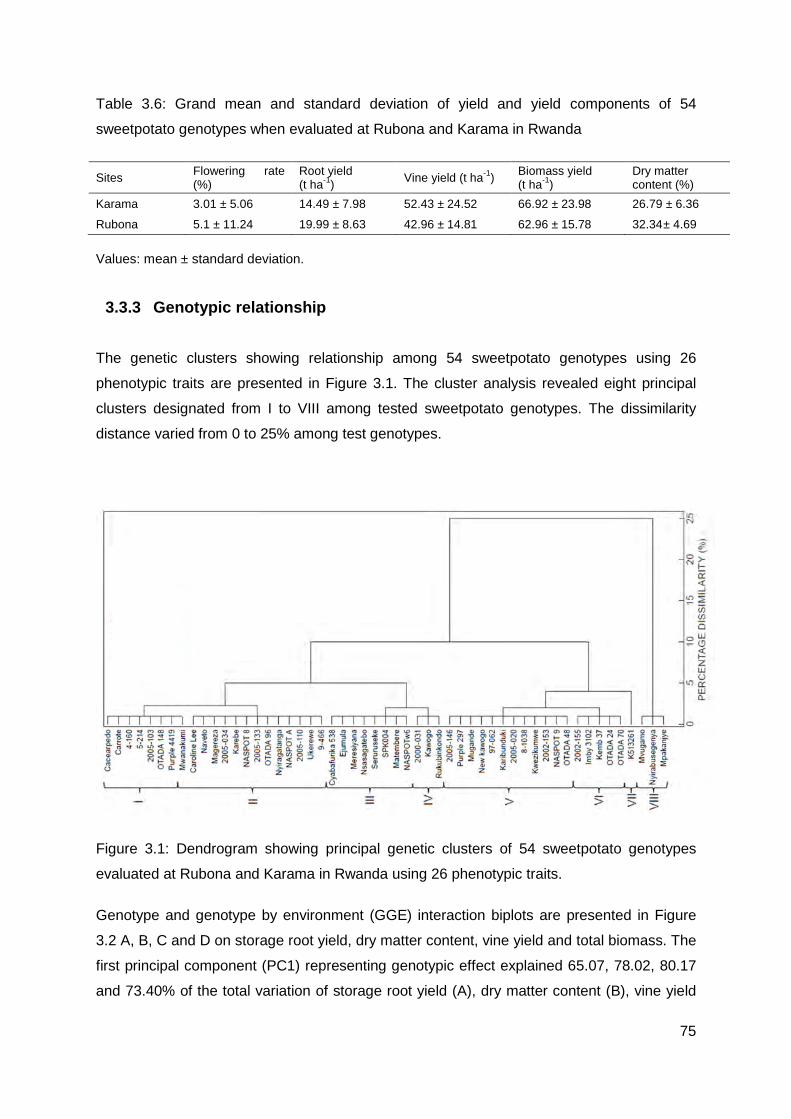
75
Table 3.6: Grand mean and standard deviation of yield and yield components of 54
sweetpotato genotypes when evaluated at Rubona and Karama in Rwanda
Sites Flowering rate (%)
Root yield (t ha-1) Vine yield (t ha-1) Biomass yield
(t ha-1) Dry matter content (%)
Karama 3.01 ± 5.06 14.49 ± 7.98 52.43 ± 24.52 66.92 ± 23.98 26.79 ± 6.36
Rubona 5.1 ± 11.24 19.99 ± 8.63 42.96 ± 14.81 62.96 ± 15.78 32.34 ± 4.69
Values: mean ± standard deviation.
3.3.3 Genotypic relationship
The genetic clusters showing relationship among 54 sweetpotato genotypes using 26
phenotypic traits are presented in Figure 3.1. The cluster analysis revealed eight principal
clusters designated from I to VIII among tested sweetpotato genotypes. The dissimilarity
distance varied from 0 to 25% among test genotypes.
Figure 3.1: Dendrogram showing principal genetic clusters of 54 sweetpotato genotypes
evaluated at Rubona and Karama in Rwanda using 26 phenotypic traits.
Genotype and genotype by environment (GGE) interaction biplots are presented in Figure
3.2 A, B, C and D on storage root yield, dry matter content, vine yield and total biomass. The
first principal component (PC1) representing genotypic effect explained 65.07, 78.02, 80.17
and 73.40% of the total variation of storage root yield (A), dry matter content (B), vine yield
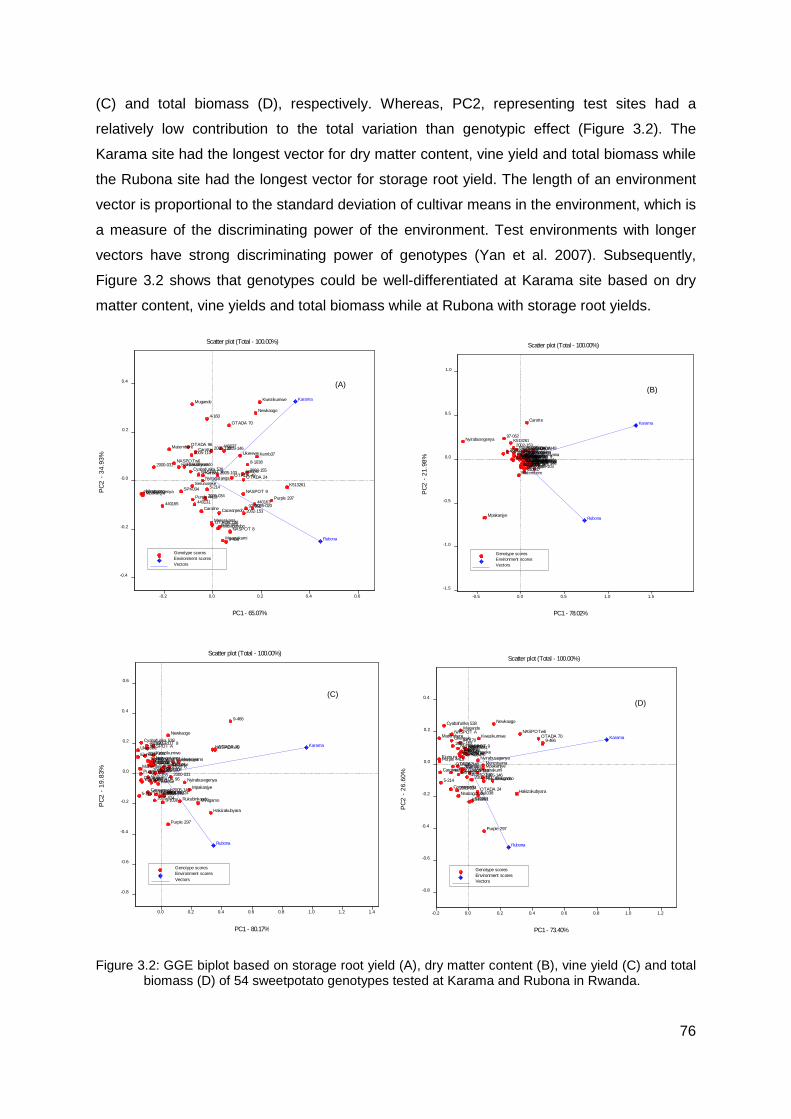
76
(C) and total biomass (D), respectively. Whereas, PC2, representing test sites had a
relatively low contribution to the total variation than genotypic effect (Figure 3.2). The
Karama site had the longest vector for dry matter content, vine yield and total biomass while
the Rubona site had the longest vector for storage root yield. The length of an environment
vector is proportional to the standard deviation of cultivar means in the environment, which is
a measure of the discriminating power of the environment. Test environments with longer
vectors have strong discriminating power of genotypes (Yan et al. 2007). Subsequently,
Figure 3.2 shows that genotypes could be well-differentiated at Karama site based on dry
matter content, vine yields and total biomass while at Rubona with storage root yields.
Figure 3.2: GGE biplot based on storage root yield (A), dry matter content (B), vine yield (C) and total biomass (D) of 54 sweetpotato genotypes tested at Karama and Rubona in Rwanda.
2000-031
2002-153
2002-155
2005-020
2005-034
2005-103
2005-1102005-1332005-146
4-160
440037
440131 440163440165
440170
5-214
8-1038
9-466
97-062CacearpedoCaroline
Carotte
Cyabafurika 538
Ejumura
Hakizakubyara
K513261
Karebe
Kemb37
Kwezikumwe
Matembere
Meresiyana
Mpakanjye
Mugande
Mvugamo
Mwanakumi
NASPOT 8
NASPOT 9
NASPOT A
NASPOTw6
Newkaogo
Nsasagatebo
Nyirabusegenya
Nyiragatanga
OTADA 148
OTADA 24
Scatter plot (Total - 100.00%)
OTADA 48
OTADA 70
OTADA 96
Purple 297Purple 4419
Rukubinkondo
SerurusekeSPK004
Ukerewe
Karama
Rubona
-0.2
-0.4
0.2
-0.2
0.6
-0.0
0.2
0.4
0.4 0.0
PC
2 -
34.
93%
PC1 - 65.07%
VectorsEnvironment scoresGenotype scores
2000-031
2002-1532002-155
2005-0202005-034
2005-1032005-1102005-1332005-146
4-160440037
440131440163
440165
440170
5-214
8-10389-466
97-062
CacearpedoCaroline
Carotte
Cyabafurika 538EjumuraHakizakubyara
K513261
KarebeKemb37
Kwezikumwe
Matembere
Meresiyana
Mpakanjye
Mugande
MvugamoMwanakumi
NASPOT 8NASPOT 9
NASPOT A
NASPOTw6
NewkaogoNsasagatebo
Nyirabusegenya
Nyiragatanga
Scatter plot (Total - 100.00%)
OTADA 148
OTADA 24OTADA 48
OTADA 70OTADA 96
Purple 297Purple 4419
RukubinkondoSeruruseke
SPK004Ukerewe
Karama
Rubona
-1.5
-0.5
-1.0
0.5
-0.5
1.5
0.0
0.5
1.0
0.0 1.0
PC
2 -
21.9
8%
PC1 - 78.02%
VectorsEnvironment scoresGenotype scores
2000-031
2002-153
2002-1552005-020
2005-034
2005-103
2005-110
2005-133
2005-146
4-160
440037
440131
440163
440165
440170
5-2148-1038
9-466
97-062
Cacearpedo
Caroline
Carotte
Cyabafurika 538
Ejumura
Hakizakubyara
K513261
KarebeKemb37
Kwezikumwe
Matembere
Meresiyana
Mpakanjye
Mugande
Scatter plot (Total - 100.00%)
Mvugamo
Mwanakumi
NASPOT 8
NASPOT 9NASPOT A NASPOTw6
Newkaogo
Nsasagatebo
Nyirabusegenya
NyiragatangaOTADA 148
OTADA 24
OTADA 48
OTADA 70
OTADA 96
Purple 297
Purple 4419
Rukubinkondo
SerurusekeSPK004
Ukerewe Karama
Rubona
0.0
-0.8
0.4
-0.6
0.8
-0.4
1.2
-0.2
0.0
0.2
0.4
0.6
0.6 1.4 0.2 1.0
PC
2 -
19.
83%
PC1 - 80.17%
VectorsEnvironment scoresGenotype scores
2000-031
2002-1532002-155
2005-020
2005-034
2005-103
2005-110
2005-133
2005-146
4-160440037
440131
440163
440165
440170
5-214
8-1038
9-466
97-062
Cacearpedo
Caroline
Carotte
Cyabafurika 538
Ejumura
Hakizakubyara
K513261
KarebeKemb37
KwezikumweMatembere
MeresiyanaMpakanjye
Mugande
Mvugamo
Mwanakumi
Scatter plot (Total - 100.00%)
NASPOT 8
NASPOT 9
NASPOT A NASPOTw6
Newkaogo
Nsasagatebo
Nyirabusegenya
Nyiragatanga
OTADA 148
OTADA 24
OTADA 48
OTADA 70
OTADA 96
Purple 297
Purple 4419
Rukubinkondo
SerurusekeSPK004
Ukerewe Karama
Rubona
-0.2 0.2
-0.8
0.6
-0.6
1.0
-0.4
-0.2
0.0
0.2
0.0
0.4
0.8 1.2 0.4
PC
2 -
26.
60%
PC1 - 73.40%
VectorsEnvironment scoresGenotype scores
(A) (B)
(C) (D)
(A) (B)
(C)
77
3.3.4 Principal component analysis
The PCA revealed seven main principal components representing 77.83 % of total variance
among the 54 genotypes of sweetpotato (Table 3.7). The first four principal components
explained 17.51, 15.92, 13.95, and 10.00 % of the total variance, respectively. These
components represented 57.38 % of the total variance components (Table 3.7). Strong
correlations were observed between PCs and phenotypic traits (Table 3.7). PC1 correlated
better with leaf characteristics such as leaf general outline, leaf lobe type, lobe number and
shape of central lobe while PC2 was well-correlated with flowering rate. PC3 has a strong
relationship with storage root yield, weight of the biggest storage root and harvest index.
PC4 correlated mainly with latex production and oxidation of storage root. Vine yield and
total biomass had a stronger association with PC5. PC6 showed negative associations with
vine and internode length. Finally PC7 showed positive correlations with skin color and
storage root formation. Among the 26 phenotypic traits used in the current genetic diversity
study, the PCA identified only 19 phenotypic traits with strong correlations with the seven
principle components.
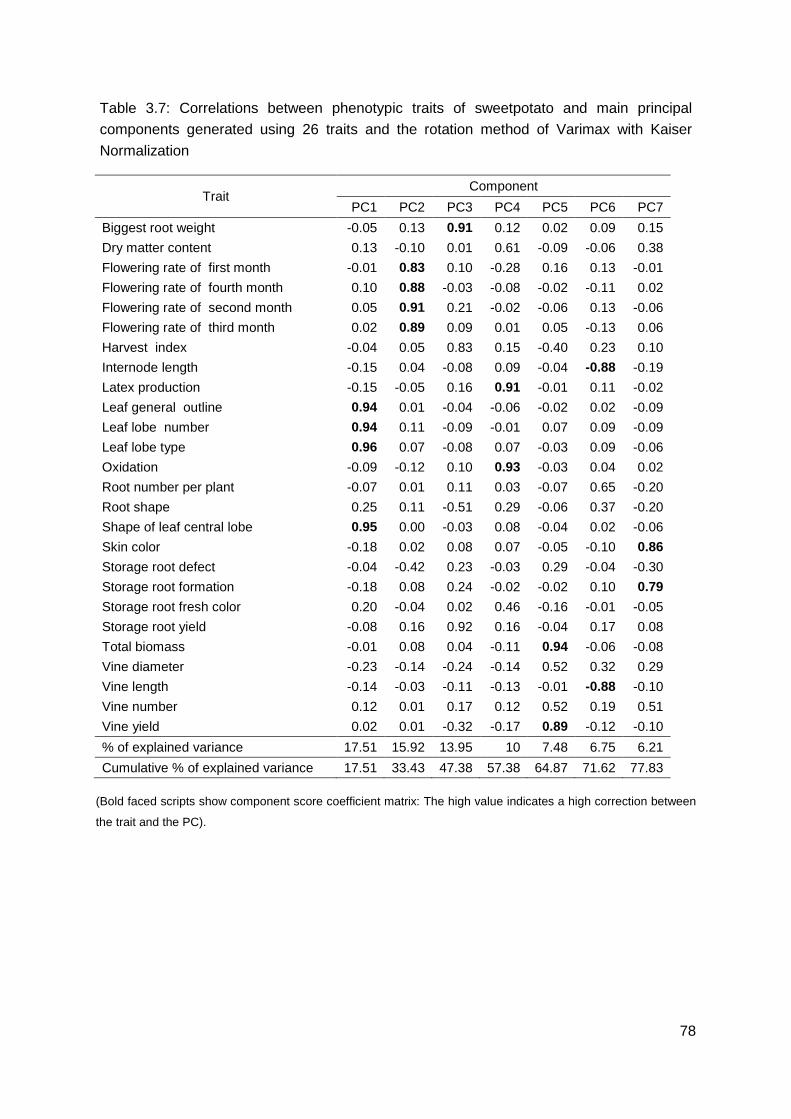
78
Table 3.7: Correlations between phenotypic traits of sweetpotato and main principal
components generated using 26 traits and the rotation method of Varimax with Kaiser
Normalization
Trait Component
PC1 PC2 PC3 PC4 PC5 PC6 PC7
Biggest root weight -0.05 0.13 0.91 0.12 0.02 0.09 0.15
Dry matter content 0.13 -0.10 0.01 0.61 -0.09 -0.06 0.38
Flowering rate of first month -0.01 0.83 0.10 -0.28 0.16 0.13 -0.01
Flowering rate of fourth month 0.10 0.88 -0.03 -0.08 -0.02 -0.11 0.02
Flowering rate of second month 0.05 0.91 0.21 -0.02 -0.06 0.13 -0.06
Flowering rate of third month 0.02 0.89 0.09 0.01 0.05 -0.13 0.06
Harvest index -0.04 0.05 0.83 0.15 -0.40 0.23 0.10
Internode length -0.15 0.04 -0.08 0.09 -0.04 -0.88 -0.19
Latex production -0.15 -0.05 0.16 0.91 -0.01 0.11 -0.02
Leaf general outline 0.94 0.01 -0.04 -0.06 -0.02 0.02 -0.09
Leaf lobe number 0.94 0.11 -0.09 -0.01 0.07 0.09 -0.09
Leaf lobe type 0.96 0.07 -0.08 0.07 -0.03 0.09 -0.06
Oxidation -0.09 -0.12 0.10 0.93 -0.03 0.04 0.02
Root number per plant -0.07 0.01 0.11 0.03 -0.07 0.65 -0.20
Root shape 0.25 0.11 -0.51 0.29 -0.06 0.37 -0.20
Shape of leaf central lobe 0.95 0.00 -0.03 0.08 -0.04 0.02 -0.06
Skin color -0.18 0.02 0.08 0.07 -0.05 -0.10 0.86
Storage root defect -0.04 -0.42 0.23 -0.03 0.29 -0.04 -0.30
Storage root formation -0.18 0.08 0.24 -0.02 -0.02 0.10 0.79
Storage root fresh color 0.20 -0.04 0.02 0.46 -0.16 -0.01 -0.05
Storage root yield -0.08 0.16 0.92 0.16 -0.04 0.17 0.08
Total biomass -0.01 0.08 0.04 -0.11 0.94 -0.06 -0.08
Vine diameter -0.23 -0.14 -0.24 -0.14 0.52 0.32 0.29
Vine length -0.14 -0.03 -0.11 -0.13 -0.01 -0.88 -0.10
Vine number 0.12 0.01 0.17 0.12 0.52 0.19 0.51
Vine yield 0.02 0.01 -0.32 -0.17 0.89 -0.12 -0.10
% of explained variance 17.51 15.92 13.95 10 7.48 6.75 6.21
Cumulative % of explained variance 17.51 33.43 47.38 57.38 64.87 71.62 77.83
(Bold faced scripts show component score coefficient matrix: The high value indicates a high correction between
the trait and the PC).

79
3.4 Discussion
3.4.1 Phenotypic traits
In this study, the interaction effect of genotypes and sites were significant for flowering
ability, yield of storage roots and vines, harvest index, weight of largest storage root, and dry
matter content (Tables 3.3 and 3.5). Hafekamp (1988) reported that rainfall, temperature,
light and soil nutrients are the main factors affecting plant growth and productivity.
Environmental differences between Karama and Rubona (Table 3.2) and the inherent
genetic variation present among test genotypes are principal causes of variability in yield
responses. Crop genotypes have varied conversion efficiency given similar environmental
resources (George et al. 2002). The variation in genetic constitution of crop genotypes
influences the expression and level of heritable traits between and within environment
(Acquaah 2007).
In the current study, sites had significant effects on yield and yield components. Tairo et al.
(2008) observed that number of roots, weight of roots, fresh weight per plant and dry matter
content of sweetpotatoes differed significantly among and within agro-ecological zones. This
was also confirmed in the present study where sites differed significantly in affecting
flowering rate, yields of storage roots and vines, harvest index, largest root weight, root
number per plant and dry matter content (Tables 3.3 and 3.4). The significant differences of
sites may be attributed to soil heterogeneity and environmental conditions (Table 3.2). A
slight difference in soil nutrients was observed between Karama and Rubona sites (Table
3.2). Karama site was rich in total nitrogen and potassium. High soil fertility is reported to
favour vegetative growth while decreasing formation of storage roots (Okpara et al. 2009).
The high vine yields and total biomass recorded at the Karama site (Table 3.6) could be
attributed to better soil fertility than the Rubona site.
Dry matter content of sweetpotato may increase with application of potassium fertilizer
(George et al. 2002). This observation is different from the results of this study. The soil at
Karama site contained a high potassium level (Table 3.2). However, in the present study the
mean dry matter content of sweetpotato storage roots was low (26.8%) compared to the
Rubona site (32.3%) (Table 3.6). Hartemink et al. (2000) contended that as rainfall increased
the storage root yield of sweetpotato decreased. This observation is contrary to the result of
this study. The rainfall of the Karama site during the experiment was 698.7 mm which was
significantly less than the Rubona site (1339.4 mm). However, genotypes at the Rubona site
80
had remarkably high yields of storage roots (Table 3.6). Thus, it is important not to rule out
the influence of multiple factors which may impact crop yields when tests are carried out
under different environmental conditions.
Test genotypes showed broad variation in yields of storage root and vine, total biomass, dry
matter content and flowering rate (Table 3.4). Genetic diversity analysis of sweetpotato using
morphological and molecular markers revealed that all the characters evaluated were
significantly different between genotypes (Karuri et al. 2010). Fongod et al. (2012) observed
significant differences among sweetpotato accessions in agronomic and morphological
characters. Using molecular, morphological and agronomic characterization methods,
Maquia et al. (2013) observed a high level of genetic diversity in Mozambican sweetpotato
germplasm. Gasura et al. (2010) observed that some of their test sweetpotato genotypes
had strong or weak flowering ability while others failed to flower. Extreme phenotypic
variations observed in his study confirm the presence of considerable genetic variations
among sweetpotato genotypes in Rwanda. Sweetpotato shows broad phenotypic and
genotypic diversity because of its inherent cross pollination owing to self- or cross-
incompatibility, polyploidy and heterozygosity (Jones et al. 1986; Yoshida 2004). Lebot
(2009) argued that the yield of sweetpotatoes could be determined by the length of the
growing period. Across the present study sites growing periods were almost similar for all
genotypes. Therefore, the broad variations observed among genotypes could be attributed
to differences in genetic constitution.
The current study revealed that the effect of genotype and site were significantly different for
flowering rate (Table 3.3). The within-plot variation for flowering rate indicates a high level of
genetic variability among the test populations. Most sweetpotato genotypes flower naturally
within the short day length of the tropics (Miller 1937; Jones et al. 1986). Sweetpotato
flowers best during the cool season in tropical countries. The average daily temperature that
favors seed set is between 20 and 25◦C while maximum seed set occurred when the mean
daily temperature was about 23.9◦C (Lebot 2009). Several techniques such as physiological
shocks, grafting, girdling, chemical treatment and use of controlled environmental conditions
help improve flowering in sweetpotatoes. Flower and seed production is enhanced under
tropical than temperate climates (Jones et al. 1976). In general, flowering ability and seed
set have important implications on sweetpotato breeding.
81
3.4.2 Genetic relationships among sweetpotato genotypes
Knowledge on genetic distance between potential parents is important for breeding
(Acquaah 2007). Plant breeding programs require sufficient genetic diversity for designed
crosses and creating new genetic recombinants. This enables selection of segeregants with
better quantitative or qualitative responses such as yield or resistance to abiotic and biotic
stresses (Korzun 2003).
Fongod et al. (2012) showed that cluster analysis of 19 sweetpotato genotypes using 26
characters revealed the existence of three major groups with a similarity index ranging from
0.42 to 1.00 before maturity and 0.34 to 1.00 at maturity based on the Euclidean distance. In
cluster analysis of Tanzanian elite sweetpotato genotypes for resistance to sweetpotato virus
disease and high dry matter content, Tairo et al. (2008) found two major groups with a low
genetic similarity of 0.52. Also, significant differences between genotypes and genetic
distance ranging from 0.26 to 0.80 were reported during morphological characterization of
eight genotypes of Solanum retroflexum (Jacoby et al. 2003). A cluster analysis using
morphological and SSR Markers separated some Kenyan sweetpotato genotypes into two
major groups (Karuri et al. 2010). In this study, genotypes were assorted into eight main
clusters (Figure 3.1) and a dissimilarity distance ranging from 0 to 0.25.
Preliminary evaluation of sweetpotato based on horticultural traits may assist in identification
of unrelated parents for specific breeding programmes. These unrelated genotypes may
contribute distinctive alleles from different loci (Dhillon and Isiki 1999). Based on high yields,
dry matter content and flowering rate, the current study identified genotypes such as
Ukerewe and 2005-034 (cluster II), SPK004 and 2005-110 (cluster III), Otada 24 (cluster IV),
Kwezikumwe and 2005-020 (cluster V) and K513261(cluster VII) as potential parents for
sweetpoato breeding towards high yield and dry matter content.
3.4.3 Principal component analysis
Principal component analysis (PCA) was applied as a statistical approach to identify the
major variance components, their contributions and correlated traits (Heberger et al. 2003).
This method assists in reducing the number of variables in the data collection in a breeding
and selection process. Consequently, it saves time and resources and improves the
selection responses in crop improvement programs (Johnson and Wichern 2007). Through
this method, few variables explaining variations among individuals are identified among
82
various characters (Shimelis et al. 2013). Therefore, the PCA provides valuable information
when there are several correlated traits, by reducing the costs of screening.
Principal component analysis assists in determining the relationships between traits, and the
independent principal components that are effective on plant traits (Beheshtizadeh et al.
2013). In the evaluation of diversity among potato cultivars using agro-morphological and
yield components, Ahmadizadeh and Felenji (2011), observed that three components
explained 80.1% of the total variation among traits. The authors reported that the first PC
was highly correlated with yield, tuber weight, dry matter content and harvest index. This PC
was very important to select high yielding clones and parents for breeding programs. In the
principal component analysis of 21 sweetpotato genotypes using 17 traits, Afuape et al.
(2011) found three PCs explaining 76% of total variance. They also observed that the
number of marketable and unmarketable roots, total number of roots, weight of marketable
and unmarketable roots, total root weight, incidence and severity of root Cylas spp, length of
biggest, medium and smallest marketable roots and number of branches are traits that are
important to differentiate sweetpotato genotypes (Afuape et al. 2011).
In an agro-morphological characterization of different accessions of sweetpotato, Fongod et
al. (2012) identified four main components before maturity and five main components at
maturity, explaining 78.2 and 76.4%, respectively, of the total genetic variability. The PCA
revealed seven main principal components representing 77.83 % of total variance among
the 54 genotypes of sweetpotato (Table 3.7). The first four principal components explained
17.51, 15.92, 13.95, and 10.00% of the total variance, respectively. These components
represented 57.38 % of the total variance components (Table 3.7). Strong correlations were
observed between PCs and phenotypic traits (Table 3.7). PC1 is well-correlated with leaf
characteristics, such as leaf general outline, leaf lobe type, lobe number and shape of
central lobe while PC2 correlated with flowering rate. PC3 has a strong relationship with
storage root yields, weight of the biggest storage root and harvest index. PC4 correlated
fairly well mainly with latex production and oxidation of storage root. Vine yield and total
biomass had a stronger association with PC5. PC6 showed negative associations with vine
and internode length. Finally PC7 showed positive correlations with skin color and storage
root formation. Among the 26 phenotypic traits used in the current study, the PCA identified
only 19 phenotypic traits with strong correlations with the seven principle components.
83
3.5 Conclusions
The present study provided a preliminary analysis of the genetic diversity among 54
sweetpotato genotypes widely grown in the different agro-ecological zones of Rwanda using
agro-morphological traits. Results showed a broad range of variation in root yield, weight of
the largest root, number of roots per plant, dry matter content, vine yield and flowering rate
among genotypes. Therefore, the studied genotypes represent a rich diversity that can serve
as a basis for genetic improvement. Findings of this study need to be complemented through
molecular characterization. Considering traits such as high yield, high dry matter content and
flowering rate, this study identified sweetpotato genotypes K513261, Kwezikumwe, 2005-
020, Otada 24, SPK004, Ukerewe, 2005-110 and 2005-034 as potential parents for genetic
enhancement and breeding towards high yield and dry matter content.
3.6 References
Acquaah, G. 2007. Principles of plant genetics and breeding. Wiley-Blackwell, Oxford.
Afuape, S.O., P.I. Okocha and D. Njoku. 2011. Multivariate assessment of the
agromorphological variability and yield components among sweetpotato (Ipomoea
batatas [L.] Lam) landraces. African Journal of Plant Science 5: 123-132.
Ahmadizadeh, M. and H. Felenji. 2011. Evaluating diversity among potato cultivars using
agro-morphological and yield components in fall cultivation of Jiroft area. American
Eurasian Journal of Agricultural and Environmental Sciences 11: 655-662.
Aregheore, E. 2004. Nutritive value of sweetpotato (Ipomea batatas [L.] Lam) forage as goat
feed: Voluntary intake, growth and digestibility of mixed rations of sweetpotato and
batiki grass (Ischaemum aristatum var. indicum). Small Ruminant Research 51: 235-
241.
Beheshtizadeh, H., A. Rezaie, A. Rezaie and A. Ghandi. 2013. Principal component analysis
and determination of the selection criteria in bread wheat (Triticum aestivum L.)
genotypes. International Journal of Agriculture and Crop Sciences 5: 2024-2027.
84
Carey, E.E. and D. Reynoso. 1996. Procedures for the evaluation of pathogen tested
sweetpotato clones: Sweetpotato germplasm management training manual. CIP,
Lima, Peru.
Chaudhary, V.S. and B.B. Singh. 1982. Heterosis and genetic variability in relation to genetic
diversity in soybean. Indian Jounal of Genetics 42: 324-328.
Cochran, W.G. and G.M. Cox. 1992. Expermental designs. Wiley Classics Library,
Lexington, KY, USA.
Courtney, M., M. McHaro, D. La Bonte and W. Gruneberg. 2008. Heritability estimates for
micronutrient composition of sweetpotato storage roots. Hortscience 43: 1382-1384.
Dhillon, N.P.S. and K. Isiki. 1999. Genomic variation and genetic relationships in Ipomoea
spp. Plant Breeding 118: 161-165.
Elameen, A., A. Larsen, S.S. Klemsdal, S. Fjellheim, L. Sundheim, S. Msolla, E. Masumba
and O.A. Rognli. 2011. Phenotypic diversity of plant morphological and root
descriptor traits within a sweetpotato, Ipomoea batatas (L.) Lam., germplasm
collection from Tanzania. Genetic Resources and Crop Evolution 58: 397-407.
FAOSTAT. 2013. Statistics division. FAO. http://faostat.fao.org/site/612/default.aspx#ancor
(accessed Accessed 7 July 2015).
Fongod, A.G.N., A.M. Mih and T.N. Nkwatoh. 2012. Morphological and agronomical
characterization of different accessions of sweetpotatoe (Ipomoea batatas) in
Cameroon. International Research Journal of Agricultural Science and Soil Science
2: 234-245.
Gasura, E., A. Mashingaidze and S. Mukasa. 2010. Genetic variability for tuber yield, quality,
and virus disease complex traits in Uganda sweetpotato germplasm. African Crop
Science Journal 16: 147-160.
George, M.S., G. Lu and W. Zhou. 2002. Genotypic variation for potassium uptake and
utilization efficiency in sweetpotato (Ipomoea batatas L.). Field Crops Research 77: 7-15.
Hafekamp, M.R. 1988. Environmental factors affecting plant productivity: Achieving efficient
use of rangeland resources. Fort Keogh Livestock and Range Research Laboratory,
USDA-ARS, Montana State University.
85
Hartemink, A.E., S. Poloma, M. Maino, K. Powell, J. Egenae and J. O’Sullivan. 2000. Yield
decline of sweetpotato in the humid lowlands of Papua New Guinea. Agriculture,
Ecosystems and Environment 79: 259-269.
Heberger, K., E. Csomós and L. Simon-Sarkadi. 2003. Principal component and linear
discriminant analysis of free amino acids and biogenic amines in Hungarian wines.
Journal of Agricultural and Food Chemistry 51: 8055-8060.
Hsiao-Feng, L., L. Kuan-Hung, L. Yung-Chung, C. Kuan-Yee, C. Yen-Fu and H. Shih-Ying.
2007. Improving breeding efficiency for quality and yield of sweetpotato. Botanical
Studies 48: 283-292.
Huamán, Z. 1999. Botany, origin, evolution and biodiversity of the sweetpotato: Sweetpotato
germplasm management training manual. CIP, Lima, Peru.
ISAR. 2007. Annual report. Institut des Sciences Agronomiques du Rwanda, Kigali.
Jacoby, A., M.T. Labuschagne and C.D. Viljoen. 2003. Genetic relationships between
Southern African Solanum retroflexum Dun, and other related spicies measured by
morphological and DNA markers. Euphytica 132: 109-113.
Johnson, R.A. and W.D. Wichern. 2007. Applied multivariate statistical analysis. Prentice-
Hall, Upper Saddle River.
Jones, A., P. Dukes and F. Cuthbert. 1976. Mass selection in sweetpotato: Breeding for
resistance to insects and diseases and for horticultural characteristics. Journal of the
American Society for Horticulture 101: 701-704.
Jones, A., P. Dukes and J. Schalk. 1986. Sweetpotato breeding. In: Basset, M.J., editor,
Breeding Vegetable Crops. IVA, Eastport. p. 1-35.
Karuri, H., E. Ateka, R. Amata, A. Nyende, A. Muigai, E. Mwasame and S. Gichuki. 2010.
Evaluating diversity among Kenyan sweetpotato genotypes using morphological and
SSR markers. International Journal of Agriculture and Biology 12: 33-38.
Korzun, V. 2003. Molecular markers and their application in cereals breeding. Cell and
Molecular Biology Letter 7: 811-820.
86
Lebot, V. 2009. Sweetpotato. In: Bradshaw, J.E., editor, Root and tuber crops: Handbook of
plant breeding. Springer Sciences and Business Media, New York, NY 10013, USA.
p. 97-125.
Low, J., J. Lynam, B. Lemaga, C. Crissman, I. Barker, G. Thiele, S. Namanda, C. Wheatley
and M. Andrade. 2009. Sweetpotato in Sub-Saharan Africa. In: Loebenstein, G. and
G. Thottappilly, editors, The sweetpotato. Springer Verlag, Dordrecht, the
Netherlands, p.34-69.
Low, J.W., M. Arimond, N. Osman, B. Cunguara, F. Zano and D. Tschirley. 2007. A food-
based approach introducing orange-fleshed sweetpotatoes increased vitamin A
intake and serum retinol concentrations in young children in rural Mozambique. The
Journal of nutrition 137: 1320-1332.
Ma, D.-f., Q. Li, X.-y. Li, H.-m. Li, Z.-h. Tang, L. Hu, Q.-h. Cao, Y.-p. Xie and X. Wang. 2009.
Selection of parents for breeding edible varieties of sweetpotato with high carotene
content. Agricultural Sciences in China 8: 1166-1173.
Maquia, I., I. Muocha, A. Naico, N. Martins, M. Gouveia, I. Andrade, L.F. Goulao and A.I.
Ribeiro. 2013. Molecular, morphological and agronomic characterization of the
sweetpotato (Ipomoea batatas L.) germplasm collection from Mozambique: Genotype
selection for drought prone regions. South African Journal of Botany 88 142–151.
Miller, J.C. 1937. Inducing the sweetpotato to bloom and set seed. Journal of Heredity 28:
347-349.
Mohammadi, S. and B. Prasanna. 2003. Analysis of genetic diversity in crop plants salient
statistical tools and considerations. Crop Science 43: 1235-1248.
Ndamage, G., P. Ntawuruhunga and J. Mulindangabo. 1992. Progrès de la recherche sur les
plantes à racines et tubercules au Rwanda, 1984-1991. Institut des Sciences
Agronomiques du Rwanda et Centre de Recherches pour le Developpement
International, Butare.
Ndirigwe, J. 2006. Adaptability and acceptability of orange and yellow-fleshed sweetpotato
genotypes in Rwanda. MSc. Dissertation. Makerere University, Uganda, Kampala.
Ngeve, J. 1993. Regression analysis of genotype x environment interaction in sweetpotato.
Euphytica 71: 231-238.
87
Njeru, R., M. Bagabe, D. Nkezabahizi, D. Kayiranga, J. Kajuga, L. Butare and J. Ndirigue.
2008. Viruses infecting sweetpotato in Rwanda: Occurrence and distribution. Annals
of applied biology 153: 215-221.
Okpara, D., O. Okon and F. Ekeleme. 2009. Optimizing nitrogen fertilization for production of
white and orange-fleshed sweetpotato in Southeast Nigeria. Journal of Plant Nutrition
32: 878-891.
Payne, R.W., D.A. Murray, S.A. Harding, D.B. Baird and D.M. Soutar. 2011. An introduction
to GenStat for windows (14th Edition). Hemel Hempstead, UK.
SAS. 2004. SAS software. SAS Institute Inc., Cary, NC, USA.
Shimelis, H., P. Mashela and A. Hugo. 2013. Principal agronomic and seed oil traits in the
industrial oil crop vernonia (Centrapalus pauciflorus var. ethiopica). South African
Journal of Plant and Soil 30: 131-137.
SPSS. 2006. PASW Statistics for Windows SPSS Inc., Chicago IL USA.
Tairo, F., E. Mneney and A. Kullaya. 2008. Morphological and agronomical characterization
of sweetpotato (Ipomoea batatas [L.] Lam.) germplasm collection from Tanzania.
African Journal of Plant Science 2: 077-085.
Tseng, Y.T., H.F. Lo and S.Y. Hwang. 2002. Genotyping and assessment of genetic
relationships in elite polycross breeding cultivars of sweetpotato in Taiwan based on
SAMPL polymorphisms. Botanical Bulletin of Academia Sinica 43: 99-105.
Woolfe, J.A. 1992. Sweetpotato: An untapped food resource. Cambridge University Press,
New York.
Yan, W., M.S. Kang, B. Ma, S. Woods and P.L. Cornelius. 2007. Biplot vs. AMMI analysis of
genotype-by-environment data. Crop Science 47: 643-655.
Yoshida, T. 2004. Sorghum diversity evaluated by simple sequence repeat (SSR) markers
and phenotypic performance. Plant Production Science 7: 301-308.
88
4. Chapter Four: Comparison of greenhouse and in-vitro
screening of sweetpotato genotypes for drought
tolerance
Abstract
Breeding sweetpotato (Ipomoea babatas [L.] Lam) for drought tolerance is hindered by
unavailability of less expensive, reproducible and high throughput screening systems and
the inherent quantitative inheritance of drought tolerance. Various methods are applied to
screen for drought tolerance such as field, greenhouse or in-vitro techniques. The objective
of this study was to compare greenhouse and in-vitro techniques for effective selection of
drought tolerance in sweetpotatoes. Greenhouse and in-vitro experiments were established
at Rubona research station of the Rwandan Agricultural Board using 54 sweetpotato
genotypes. Genotypes were evaluated in the greenhouse using four levels of water regime
[control, drought stress imposed by withholding water for one, two or three month(s)] while
in-vitro tests were carried out using four treatment solutions [control or basic culture medium
(0 M), control supplemented with 0.2, 0.4, or 0.6 M sorbitol]. In the greenhouse study, data
collected included: soil water potential (Ψw), weights of storage root, biggest storage root
and vines, dry matter content (DMC) of storage root and vine, and water content (WC) of
vines. Whereas Ψw of culture media, fresh weight gain (FWG), DMC and WC were recorded
during the in-vitro experiment. In the greenhouse test, Ψw of drought stressed treatments
varied from -1.94 to -0.05 MPa and showed an increased trend with prolonged drought
stress. The control treatment showed Ψw ranging between -0.02 to 0 MPa. During the in-vitro
experiment, the mean Ψw values were - 0.07, - 0.81, -1.35 and -1.73 MPa for control, 0.2,
0.4, and 0.6 M sorbitol treatments, respectively. Under greenhouse conditions, genotypes by
water regimes, genotype and water regime had significant effects (P ≤ 0.01) on yield and
yield related traits. Genotypes showed significant differences between the control and
drought stress imposed for one month. Under in-vitro test, the control and 0.2 M sorbitol
treatments were not significantly different in the FWG. However, the control treatment was
significantly different from 0.4, and 0.6 M sorbitol concentrations. Positive correlations were
observed between vine yield and FWG; and between total biomass and FWG, during
greenhouse and in-vitro studies, respectively. Overall, genotypes 2005-146, 4-160, 8-1038,
Karibunduki, Kwezikumwe, Purple 4419, NASPOT 9 O, Nsasagatebo, Karebe, IMBY 3102,
Mwanakumi, 97-062 and Matembere were selected with comparatively high drought
89
tolerance using the two screening procedures. The selected genotypes are useful genetic
resources to breed sweetpotatoes for drought tolerance.
Key words: Drought tolerance, greenhouse, in-vitro, sorbitol, sweetpotato
4.1 Introduction
Sweetpotato (Ipomoea babatas [L.] Lam) is an important crop widely grown in tropical and
subtropical regions of the world (Woolfe 1992). It is estimated to be cultivated on an area of
2.1 million hectares with annual global production of 9.9 million tons (FAOSTAT 2013).
Sweetpotato is grown for human food, animal feed and raw material for industries. In many
tropical countries, sweetpotato is the second important root crop after cassava (FAOSTAT
2013). It is a highly productive crop per unit area and grows under variable climatic
conditions making it an ideal crop in harsh environments (Haimeirong and Kubota 2003).
Sweetpotato has a very important role to alleviate malnutrition and poverty (Woolfe 1992;
Gasura et al. 2010). The aboveground part and by products of processed sweetpotato are
commonly used as animal feed (Woolfe 1992). With the on-going initiative of biofuel
production, sweetpotato is an alternative crop because of its high starch production per unit
area (Lebot 2009).
Sweetpotato has a short growing period varying from 3 to 5 months depending on variety
and location (Woolfe 1992). During this growth period, the crop faces water stress due to
fluctuations of soil water content. For instance, in Rwanda, there is high yield loss of
sweetpotato during the off season (April/May to September/October) production owing to
severe drought occurrences during June to September. Yield loss and subsequent food
insecurity in the major sweetpotatoes growing areas are primarily attributed to inadequate
soil moisture and limited water availability (Sherrard and Maherali 2006). Low soil moisture
content during the critical growth stages such as crop establishment and root initiation is
responsible for poor crop growth and productivity (Pantuwan et al. 2002). The annual and
global yield loss due to drought stress was estimated at 25% (Woolfe 1992). Under field
experiment, Gong and Wang (1990) observed that drought stress for 20 days during root
formation of sweetpotato caused yield reductions ranging from 15 to 39%.
The use of irrigation water is an alternative approach to manage drought stress under rain-
fed crop production systems such as in Rwanda. This approach seems to be expensive,
unsustainable and unaffordable by smallholder farmers. Moreover, the availability of clean
90
water for irrigation is critical because of exponential global population growth and climate
change (Acquaah 2007). Other cultural practices such as mulching, fallowing and use of
ground cover are commonly applied to preserve soil moisture (Acquaah 2007). Various
international and national policies were adopted to counterattack the threat of drought stress
such as promoting standard approaches to assess impact of drought stress, implementing
effective systems of drought monitoring, early warning systems and emergency response
and recovery (Gommes et al. 2010). Breeding for drought tolerance remains the most
sustainable, feasible and economic approach to drought management. Therefore, to support
the alternative management approaches, it is needed to develop and deploy new varieties
with drought tolerance and high water use efficiency (Ober 2008).
Breeding for drought tolerance requires identification of suitable genetic resources, a
controlled stress screening environment and high throughput selection methods to maximize
selection gains (Subbarao et al. 2005). Owens (2001) reported that crop productivity has to
increase by 60 and 20% in the developing and developed countries, respectively, to ensure
food demand. The use of improved crop varieties with drought tolerance, and suitable
agricultural practices are considered as appropriate approaches to crop production in arid
and semi-arid areas (Ashraf and Harris 2005). Hence, breeding for drought tolerance is one
of main objectives of plant breeding programs to improve food security.
Breeding of sweetpotato for drought tolerance is challenged by unavailability of inexpensive,
reproducible and high throughput screening systems and the inherent quantitative
inheritance of drought tolerance. Consequently, limited progress has been made in
identifying genetic determinants of drought tolerance in sweetpotato. Drought tolerance has
complex physio-biochemical processes at cellular level and its expression varies across
different stages of plant development (Ekanayake and Wanda 2004; Andrade et al. 2009;
Lebot 2009). Different screening approaches are suggested for drought tolerance such as
field trials aiming at agronomic traits and laboratory experiments involving early traits for
selection (Acquaah 2007; Gopal and Iwama 2007; He et al. 2009). Pot experiments to
screen for drought tolerance in sweetpotato revealed that plant biomass, main stem length,
internode diameter, internode length, leaf number and area, and root weight decreased in
response to severe water stress (Saraswati et al. 2004). Greenhouse drought stress for 5
and 10 days after transplantation reduced the number of storage roots by 42% and 66%,
respectively, compared with the control. Drought condition in the field resulted in a 49%
reduction in storage root yield compared to irrigated conditions (Solis et al. 2014). Wang et
al. (1999) found that the accumulation of amino acid levels such as alanine, glutamic acid
and its derivatives, and starch were high in stressed cell compared to normal cells in
91
suspension cultures. In-vitro selection for identification of the salt tolerance of 276
sweetpotato clones, revealed 18 clones showing significantly higher in-vitro salt tolerance
than control plants. When these salt tolerant clones were further tested under greenhouse
conditions using solutions containing different concentrations of NaCl, only 3 clones showed
salt tolerance with better growth and rooting ability than other clones and control plants (He
et al. 2009). Therefore, combined use of different screening approaches targeting early and
later growth stages of sweetpotato may assist in the selection of drought tolerant clones for
breeding. Field selection for drought tolerance is often problematic because the balance of
soil humidity is variable from season to season and year to year even at the same site.
Selection under managed environments such as greenhouse and in-vitro are alternative
approaches to improve selection gains. Therefore, the objective of this study was to
compare greenhouse and in-vitro techniques for effective selection of drought tolerance in
sweetpotatoes under managed condition and using early and late traits.
4.2 Materials and methods
4.2.1 Plant materials
The study used 54 sweetpotato genotypes described in Table 4.1. These genotypes were
collected from the National Sweetpotato Research Program of the Rwandan Agricultural
Board (RAB). A drought tolerant sweetpotato clone, Mugande, selected by the International
Potato Center (CIP) based in Nairobi (Kenya) served as a control (Table 4.1, entry 32).
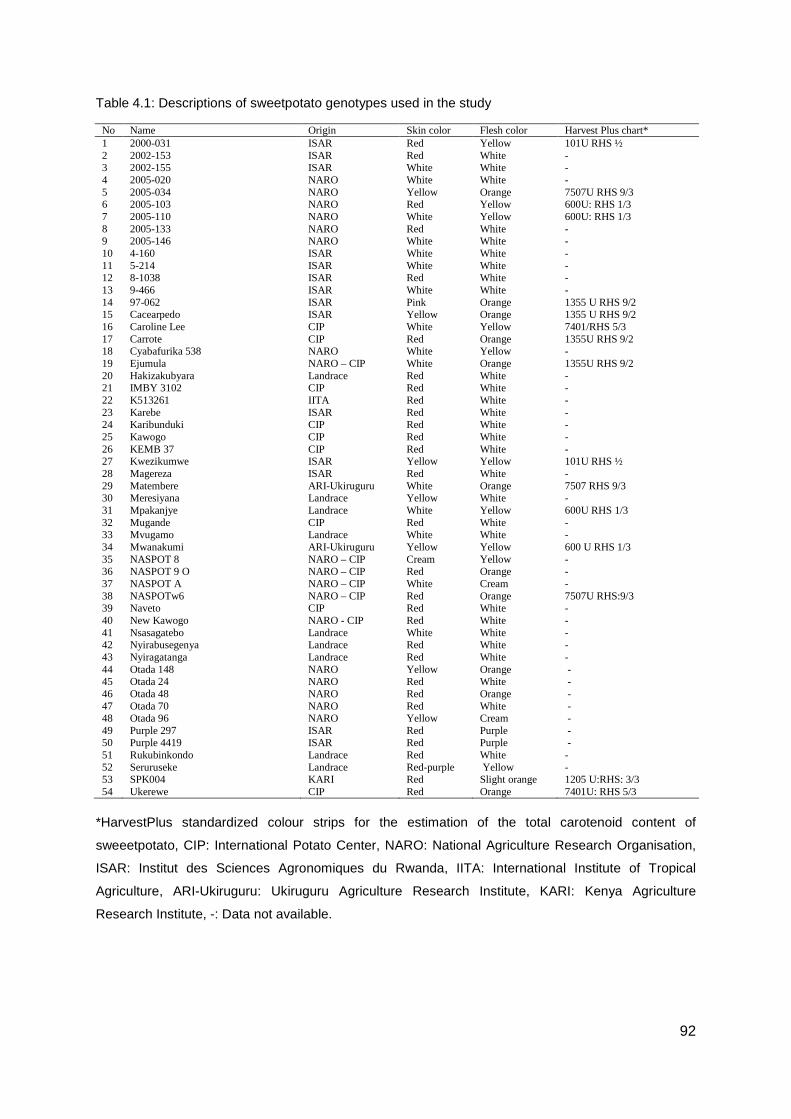
92
Table 4.1: Descriptions of sweetpotato genotypes used in the study
No Name Origin Skin color Flesh color Harvest Plus chart* 1 2000-031 ISAR Red Yellow 101U RHS ½ 2 2002-153 ISAR Red White - 3 2002-155 ISAR White White - 4 2005-020 NARO White White - 5 2005-034 NARO Yellow Orange 7507U RHS 9/3 6 2005-103 NARO Red Yellow 600U: RHS 1/3 7 2005-110 NARO White Yellow 600U: RHS 1/3 8 2005-133 NARO Red White - 9 2005-146 NARO White White - 10 4-160 ISAR White White - 11 5-214 ISAR White White - 12 8-1038 ISAR Red White - 13 9-466 ISAR White White - 14 97-062 ISAR Pink Orange 1355 U RHS 9/2 15 Cacearpedo ISAR Yellow Orange 1355 U RHS 9/2 16 Caroline Lee CIP White Yellow 7401/RHS 5/3 17 Carrote CIP Red Orange 1355U RHS 9/2 18 Cyabafurika 538 NARO White Yellow - 19 Ejumula NARO – CIP White Orange 1355U RHS 9/2 20 Hakizakubyara Landrace Red White - 21 IMBY 3102 CIP Red White - 22 K513261 IITA Red White - 23 Karebe ISAR Red White - 24 Karibunduki CIP Red White - 25 Kawogo CIP Red White - 26 KEMB 37 CIP Red White - 27 Kwezikumwe ISAR Yellow Yellow 101U RHS ½ 28 Magereza ISAR Red White - 29 Matembere ARI-Ukiruguru White Orange 7507 RHS 9/3 30 Meresiyana Landrace Yellow White - 31 Mpakanjye Landrace White Yellow 600U RHS 1/3 32 Mugande CIP Red White - 33 Mvugamo Landrace White White - 34 Mwanakumi ARI-Ukiruguru Yellow Yellow 600 U RHS 1/3 35 NASPOT 8 NARO – CIP Cream Yellow - 36 NASPOT 9 O NARO – CIP Red Orange - 37 NASPOT A NARO – CIP White Cream - 38 NASPOTw6 NARO – CIP Red Orange 7507U RHS:9/3 39 Naveto CIP Red White - 40 New Kawogo NARO - CIP Red White - 41 Nsasagatebo Landrace White White - 42 Nyirabusegenya Landrace Red White - 43 Nyiragatanga Landrace Red White - 44 Otada 148 NARO Yellow Orange - 45 Otada 24 NARO Red White - 46 Otada 48 NARO Red Orange - 47 Otada 70 NARO Red White - 48 Otada 96 NARO Yellow Cream - 49 Purple 297 ISAR Red Purple - 50 Purple 4419 ISAR Red Purple - 51 Rukubinkondo Landrace Red White - 52 Seruruseke Landrace Red-purple Yellow - 53 SPK004 KARI Red Slight orange 1205 U:RHS: 3/3 54 Ukerewe CIP Red Orange 7401U: RHS 5/3
*HarvestPlus standardized colour strips for the estimation of the total carotenoid content of
sweeetpotato, CIP: International Potato Center, NARO: National Agriculture Research Organisation,
ISAR: Institut des Sciences Agronomiques du Rwanda, IITA: International Institute of Tropical
Agriculture, ARI-Ukiruguru: Ukiruguru Agriculture Research Institute, KARI: Kenya Agriculture
Research Institute, -: Data not available.
93
4.2.2 Greenhouse experiment
A greenhouse experiment was established at Rubona research station of RAB. The 54
genotypes were tested at four water regimes: control (T1, continually watered till maturity),
drought stress imposed by withholding water for one (T2), two (T3) or three month(s) (T4).
The various stress levels were meant to target vegetative growth, storage root initiation and
storage root development for selection. Soil moisture was monitored using soil moisture
sensor (Watermark meter, Irrometer, Riverside, CA 92516, Litho USA) to apply irrigation to
the control treatment. The 54 genotypes x four water regimes yielded 216 treatment
combinations and evaluated in a completely randomized design using three replications.
Vine cuttings with three nodes and one leaf were raised in plastic trays under optimal humid
conditions for two weeks to develop roots. The rooted vines were transplanted in
polyethylene plastic pots filled with 15 kg of pot mix soil (100 kg sand, 100 kg manure). Prior
to planting, each pot was watered to saturation level. All plants were grown for one month
under irrigation for establishment. Then, the trial was conducted using the four water
regimes described above.
4.2.3 In-vitro experiment
Drought tolerance of sweetpotato genotypes was investigated under in-vitro conditions
following a modified method of Guo et al. (1999), Biswas et al. (2002) and He et al., (2009).
Vine cuttings of three nodes were planted in a greenhouse for two weeks to develop roots.
The rooted vine cuttings were washed with tap water to remove the soil, wiped with tissue
paper, prior to determining their initial fresh weight using analytical balance, and planted in
plastic trays containing oven sterilised sand. Ten plants of the same genotype were grown
for each treatment. The planted trays were kept in a growth room (at 26 °C, photoperiod of
16 h light and 8 h darkness) for four weeks.
Four solutions were applied as a source of water and nutrients. The control solution (T1) was
prepared with 4.4 g/l Murashige and Skoog (MS) salts (Murashige and Skoog 1962) with
vitamins, supplemented with 20 mg/l putrescine-HCl, 10 mg/l gibberillic acid, 0.2 g/l ascorbic
acid, 0.1 g/l calcium nitrate, 2 mg/l calcium penthotenate and 0.1 g/l L-arginine. The drought
stress conditions were mimicked by supplementing 0.2, 0.4, or 0.6 M sorbitol to the control
solution and represented T2, T3, and T4, respectively as applied by Rukundo el al (2012).
Twenty ml of each solution was applied to each plant every week for three weeks.

94
4.2.4 Data collection
4.2.4.1 Greenhouse experiment
The soil water potential (Ψw) of each treatment was recorded weekly with a hand held soil
moisture sensor. Weight of storage root, biggest storage root and vines of each plant were
determined using analytical balance at harvest (120 days after planting). The dry matter
content (DMC) of storage root and vine, and water content (WC) of vines were determined
using a modified method described by Rodriguez (1999). Approximately 50 to 100 g of fresh
weight were sampled from healthy and biggest root and vines of each plant and kept in a
paper bag prior to drying. These samples were dried at 70OC to a constant weight. The
weight of dried samples was determined and the DMC was determined using the following
formula: DM% = (dry weight/fresh weight) x100.
4.2.4.2 In-vitro experiment
The Ψw of each treatment was recorded with a water potential meter. Fresh weight gain
(FWG), DMC and WC were determined as described above. The FWG was determined as
the difference of final and initial fresh weights.
4.2.5 Data analysis
Data was analysed using the REML procedure (Cochran and Cox 1992) to calculate ANOVA
and mean comparisons using GeneStat 14th edition (Payne et al. 2011). The correlation
between traits for greenhouse and in-vitro experiments was determined with 2-tailed test
using SPSS (PASW Statistics 18.0) computer package (SPSS 2006).
4.3 Results
4.3.1 Greenhouse experiment
In a greenhouse trial, the Ψw of drought stress treatments decreased as the duration of
drought stress increased. The mean Ψw varied from -0.66 to 0.0, -1.75 to 0.0 and -1.95 to -
0.03 Mpa for T2, T3 and T4, respectively (Table 4.2). In the control treatment, the mean Ψw
ranged between -0.02 to 0.0 MPa (Table 4.2).
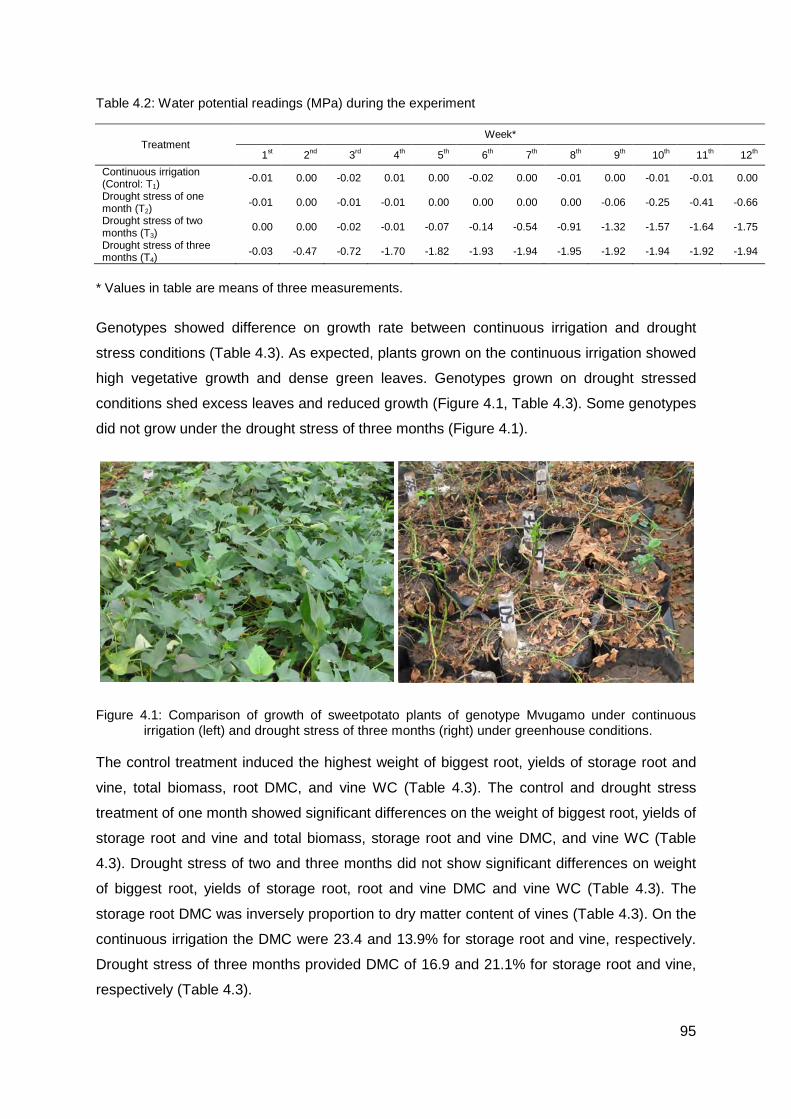
95
Table 4.2: Water potential readings (MPa) during the experiment
Treatment Week*
1st 2nd 3rd 4th 5th 6th 7th 8th 9th 10th 11th 12th
Continuous irrigation (Control: T1)
-0.01 0.00 -0.02 0.01 0.00 -0.02 0.00 -0.01 0.00 -0.01 -0.01 0.00
Drought stress of one month (T2)
-0.01 0.00 -0.01 -0.01 0.00 0.00 0.00 0.00 -0.06 -0.25 -0.41 -0.66
Drought stress of two months (T3)
0.00 0.00 -0.02 -0.01 -0.07 -0.14 -0.54 -0.91 -1.32 -1.57 -1.64 -1.75
Drought stress of three months (T4)
-0.03 -0.47 -0.72 -1.70 -1.82 -1.93 -1.94 -1.95 -1.92 -1.94 -1.92 -1.94
* Values in table are means of three measurements.
Genotypes showed difference on growth rate between continuous irrigation and drought
stress conditions (Table 4.3). As expected, plants grown on the continuous irrigation showed
high vegetative growth and dense green leaves. Genotypes grown on drought stressed
conditions shed excess leaves and reduced growth (Figure 4.1, Table 4.3). Some genotypes
did not grow under the drought stress of three months (Figure 4.1).
Figure 4.1: Comparison of growth of sweetpotato plants of genotype Mvugamo under continuous irrigation (left) and drought stress of three months (right) under greenhouse conditions.
The control treatment induced the highest weight of biggest root, yields of storage root and
vine, total biomass, root DMC, and vine WC (Table 4.3). The control and drought stress
treatment of one month showed significant differences on the weight of biggest root, yields of
storage root and vine and total biomass, storage root and vine DMC, and vine WC (Table
4.3). Drought stress of two and three months did not show significant differences on weight
of biggest root, yields of storage root, root and vine DMC and vine WC (Table 4.3). The
storage root DMC was inversely proportion to dry matter content of vines (Table 4.3). On the
continuous irrigation the DMC were 23.4 and 13.9% for storage root and vine, respectively.
Drought stress of three months provided DMC of 16.9 and 21.1% for storage root and vine,
respectively (Table 4.3).
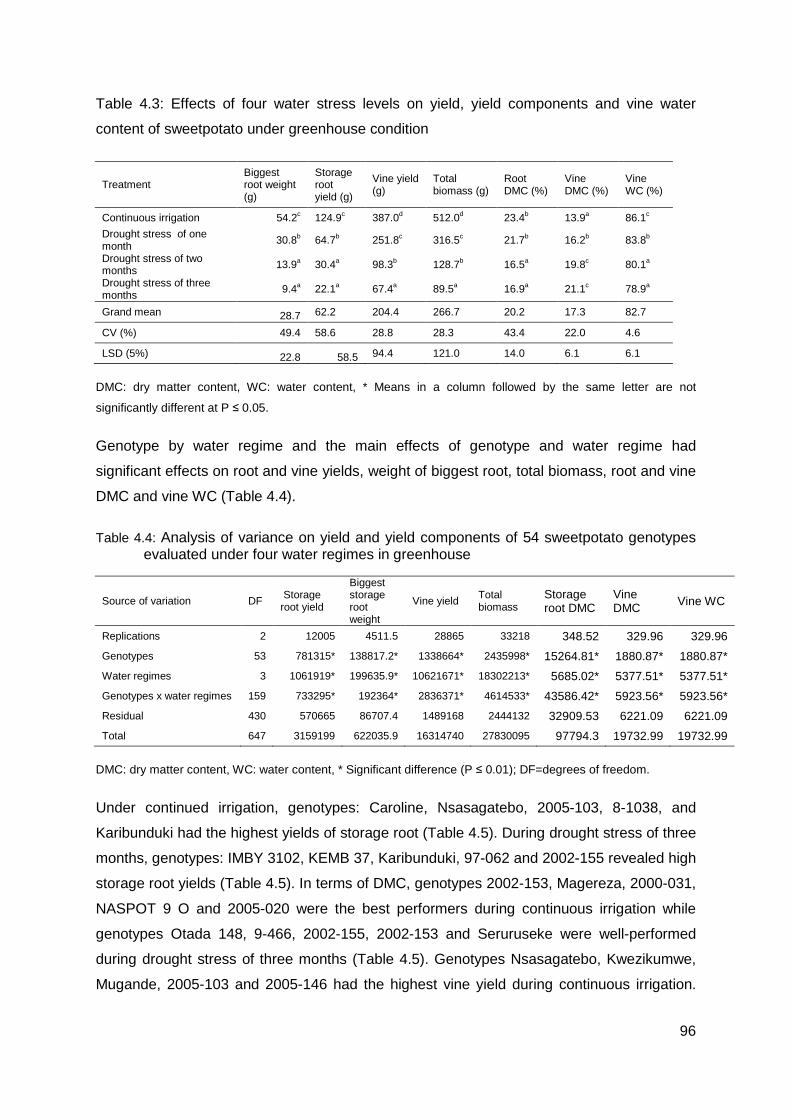
96
Table 4.3: Effects of four water stress levels on yield, yield components and vine water
content of sweetpotato under greenhouse condition
Treatment Biggest root weight (g)
Storage root yield (g)
Vine yield (g)
Total biomass (g)
Root DMC (%)
Vine DMC (%)
Vine WC (%)
Continuous irrigation 54.2c 124.9c 387.0d 512.0d 23.4b 13.9a 86.1c
Drought stress of one month 30.8b 64.7b 251.8c 316.5c 21.7b 16.2b 83.8b
Drought stress of two months 13.9a 30.4a 98.3b 128.7b 16.5a 19.8c 80.1a
Drought stress of three months
9.4a 22.1a 67.4a 89.5a 16.9a 21.1c 78.9a
Grand mean 28.7 62.2 204.4 266.7 20.2 17.3 82.7
CV (%) 49.4 58.6 28.8 28.3 43.4 22.0 4.6
LSD (5%) 22.8 58.5 94.4 121.0 14.0 6.1 6.1
DMC: dry matter content, WC: water content, * Means in a column followed by the same letter are not
significantly different at P ≤ 0.05.
Genotype by water regime and the main effects of genotype and water regime had
significant effects on root and vine yields, weight of biggest root, total biomass, root and vine
DMC and vine WC (Table 4.4).
Table 4.4: Analysis of variance on yield and yield components of 54 sweetpotato genotypes evaluated under four water regimes in greenhouse
Source of variation DF Storage root yield
Biggest storage root weight
Vine yield Total biomass
Storage root DMC
Vine DMC Vine WC
Replications 2 12005 4511.5 28865 33218 348.52 329.96 329.96
Genotypes 53 781315* 138817.2* 1338664* 2435998* 15264.81* 1880.87* 1880.87*
Water regimes 3 1061919* 199635.9* 10621671* 18302213* 5685.02* 5377.51* 5377.51*
Genotypes x water regimes 159 733295* 192364* 2836371* 4614533* 43586.42* 5923.56* 5923.56*
Residual 430 570665 86707.4 1489168 2444132 32909.53 6221.09 6221.09
Total 647 3159199 622035.9 16314740 27830095 97794.3 19732.99 19732.99
DMC: dry matter content, WC: water content, * Significant difference (P ≤ 0.01); DF=degrees of freedom.
Under continued irrigation, genotypes: Caroline, Nsasagatebo, 2005-103, 8-1038, and
Karibunduki had the highest yields of storage root (Table 4.5). During drought stress of three
months, genotypes: IMBY 3102, KEMB 37, Karibunduki, 97-062 and 2002-155 revealed high
storage root yields (Table 4.5). In terms of DMC, genotypes 2002-153, Magereza, 2000-031,
NASPOT 9 O and 2005-020 were the best performers during continuous irrigation while
genotypes Otada 148, 9-466, 2002-155, 2002-153 and Seruruseke were well-performed
during drought stress of three months (Table 4.5). Genotypes Nsasagatebo, Kwezikumwe,
Mugande, 2005-103 and 2005-146 had the highest vine yield during continuous irrigation.
97
Under drought stress of three months the best vine yields were observed in genotypes IMBY
3102, Mwanakumi, NASPOT 9 O, 2000-031 and Kawogo. The highest total biomass
production were observed in genotypes Nsasagatebo, 2005-103, Mugande, Caroline and
Kwezikumwe during continuous irrigation or genotypes IMBY 3102, 97-062, NASPOT 9 O,
2005-146 and 4-160 during drought stress condition of three months (Table 4.5).
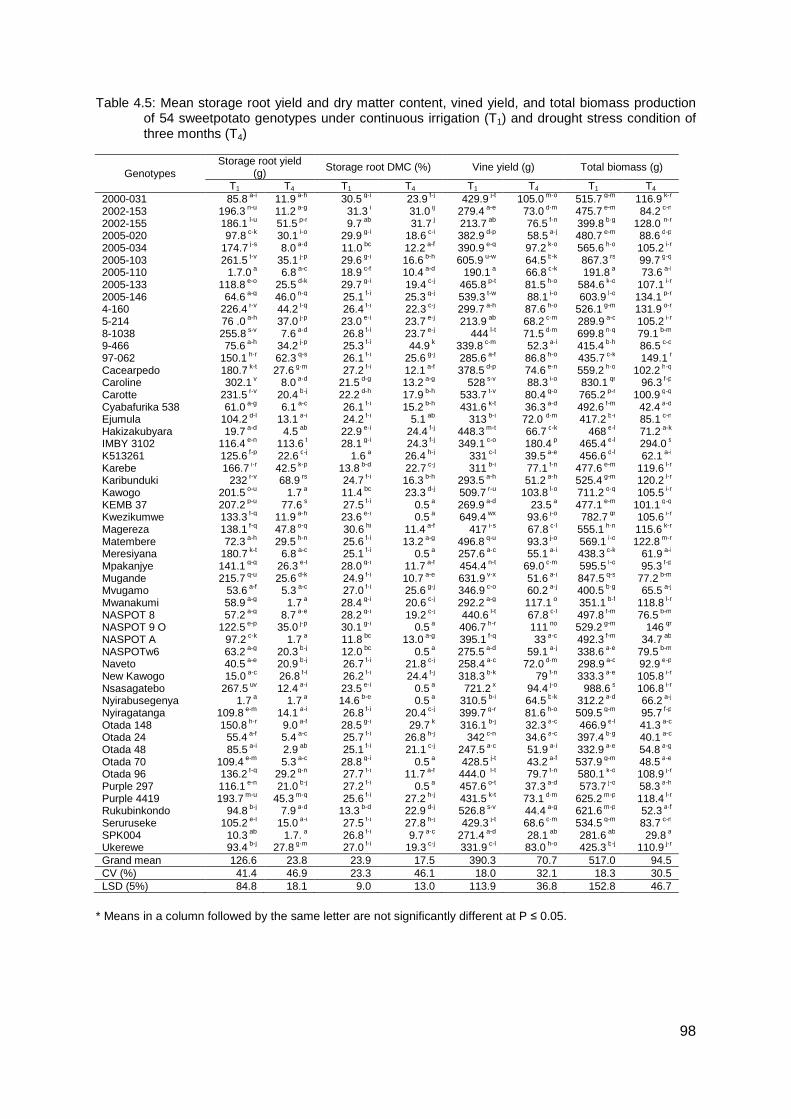
98
Table 4.5: Mean storage root yield and dry matter content, vined yield, and total biomass production of 54 sweetpotato genotypes under continuous irrigation (T1) and drought stress condition of three months (T4)
Genotypes Storage root yield
(g) Storage root DMC (%) Vine yield (g) Total biomass (g)
T1 T4 T1 T4 T1 T4 T1 T4 2000-031 85.8 a-i 11.9 a-h 30.5 g-i 23.9 f-j 429.9 j-t 105.0 m-o 515.7 g-m 116.9 k-r 2002-153 196.3 n-u 11.2 a-g 31.3 i 31.0 ij 279.4 a-e 73.0 d-m 475.7 e-m 84.2 c-n 2002-155 186.1 l-u 51.5 p-r 9.7 ab 31.7 j 213.7 ab 76.5 f-n 399.8 b-g 128.0 n-r 2005-020 97.8 c-k 30.1 i-o 29.9 g-i 18.6 c-i 382.9 d-p 58.5 a-j 480.7 e-m 88.6 d-p 2005-034 174.7 j-s 8.0 a-d 11.0 bc 12.2 a-f 390.9 e-q 97.2 k-o 565.6 h-o 105.2 i-r 2005-103 261.5 t-v 35.1 j-p 29.6 g-i 16.6 b-h 605.9 u-w 64.5 b-k 867.3 rs 99.7 g-q 2005-110 1.7.0 a 6.8 a-c 18.9 c-f 10.4 a-d 190.1 a 66.8 c-k 191.8 a 73.6 a-l 2005-133 118.8 e-o 25.5 d-k 29.7 g-i 19.4 c-j 465.8 p-t 81.5 h-o 584.6 k-o 107.1 i-r 2005-146 64.6 a-g 46.0 n-q 25.1 f-i 25.3 g-j 539.3 t-w 88.1 i-o 603.9 l-o 134.1 p-r 4-160 226.4 r-v 44.2 l-q 26.4 f-i 22.3 c-j 299.7 a-h 87.6 h-o 526.1 g-m 131.9 o-r 5-214 76 .0 a-h 37.0 j-p 23.0 e-i 23.7 e-j 213.9 ab 68.2 c-m 289.9 a-c 105.2 i-r 8-1038 255.8 s-v 7.6 a-d 26.8 f-i 23.7 e-j 444 l-t 71.5 d-m 699.8 n-q 79.1 b-m 9-466 75.6 a-h 34.2 j-p 25.3 f-i 44.9 k 339.8 c-m 52.3 a-i 415.4 b-h 86.5 c-o 97-062 150.1 h-r 62.3 q-s 26.1 f-i 25.6 g-j 285.6 a-f 86.8 h-o 435.7 c-k 149.1 r Cacearpedo 180.7 k-t 27.6 g-m 27.2 f-i 12.1 a-f 378.5 d-p 74.6 e-n 559.2 h-o 102.2 h-q Caroline 302.1 v 8.0 a-d 21.5 d-g 13.2 a-g 528 s-v 88.3 i-o 830.1 qr 96.3 f-p Carotte 231.5 r-v 20.4 b-j 22.2 d-h 17.9 b-h 533.7 t-v 80.4 g-o 765.2 p-r 100.9 g-q Cyabafurika 538 61.0 a-g 6.1 a-c 26.1 f-i 15.2 b-h 431.6 k-t 36.3 a-d 492.6 f-m 42.4 a-d Ejumula 104.2 d-l 13.1 a-i 24.2 f-i 5.1 ab 313 b-i 72.0 d-m 417.2 b-i 85.1 c-n Hakizakubyara 19.7 a-d 4.5 ab 22.9 e-i 24.4 f-j 448.3 m-t 66.7 c-k 468 e-l 71.2 a-k IMBY 3102 116.4 e-n 113.6 t 28.1 g-i 24.3 f-j 349.1 c-o 180.4 p 465.4 e-l 294.0 s K513261 125.6 f-p 22.6 c-j 1.6 a 26.4 h-j 331 c-l 39.5 a-e 456.6 d-l 62.1 a-i Karebe 166.7 i-r 42.5 k-p 13.8 b-d 22.7 c-j 311 b-i 77.1 f-n 477.6 e-m 119.6 l-r Karibunduki 232 r-v 68.9 rs 24.7 f-i 16.3 b-h 293.5 a-h 51.2 a-h 525.4 g-m 120.2 l-r Kawogo 201.5 o-u 1.7 a 11.4 bc 23.3 d-j 509.7 r-u 103.8 l-o 711.2 o-q 105.5 i-r KEMB 37 207.2 p-u 77.6 s 27.5 f-i 0.5 a 269.9 a-d 23.5 a 477.1 e-m 101.1 g-q Kwezikumwe 133.3 f-q 11.9 a-h 23.6 e-i 0.5 a 649.4 wx 93.6 j-o 782.7 qr 105.6 i-r Magereza 138.1 f-q 47.8 o-q 30.6 hi 11.4 a-f 417 i-s 67.8 c-l 555.1 h-n 115.6 k-r Matembere 72.3 a-h 29.5 h-n 25.6 f-i 13.2 a-g 496.8 q-u 93.3 j-o 569.1 i-o 122.8 m-r Meresiyana 180.7 k-t 6.8 a-c 25.1 f-i 0.5 a 257.6 a-c 55.1 a-i 438.3 c-k 61.9 a-i Mpakanjye 141.1 g-q 26.3 e-l 28.0 g-i 11.7 a-f 454.4 n-t 69.0 c-m 595.5 l-o 95.3 f-p Mugande 215.7 q-u 25.6 d-k 24.9 f-i 10.7 a-e 631.9 v-x 51.6 a-i 847.5 q-s 77.2 b-m Mvugamo 53.6 a-f 5.3 a-c 27.0 f-i 25.6 g-j 346.9 c-o 60.2 a-j 400.5 b-g 65.5 a-j Mwanakumi 58.9 a-g 1.7 a 28.4 g-i 20.6 c-j 292.2 a-g 117.1 o 351.1 b-f 118.8 l-r NASPOT 8 57.2 a-g 8.7 a-e 28.2 g-i 19.2 c-j 440.6 l-t 67.8 c-l 497.8 f-m 76.5 b-m NASPOT 9 O 122.5 e-p 35.0 j-p 30.1 g-i 0.5 a 406.7 h-r 111 no 529.2 g-m 146 qr NASPOT A 97.2 c-k 1.7 a 11.8 bc 13.0 a-g 395.1 f-q 33 a-c 492.3 f-m 34.7 ab NASPOTw6 63.2 a-g 20.3 b-j 12.0 bc 0.5 a 275.5 a-d 59.1 a-j 338.6 a-e 79.5 b-m Naveto 40.5 a-e 20.9 b-j 26.7 f-i 21.8 c-j 258.4 a-c 72.0 d-m 298.9 a-c 92.9 e-p New Kawogo 15.0 a-c 26.8 f-l 26.2 f-i 24.4 f-j 318.3 b-k 79 f-n 333.3 a-e 105.8 i-r Nsasagatebo 267.5 uv 12.4 a-i 23.5 e-i 0.5 a 721.2 x 94.4 j-o 988.6 s 106.8 i-r Nyirabusegenya 1.7 a 1.7 a 14.6 b-e 0.5 a 310.5 b-i 64.5 b-k 312.2 a-d 66.2 a-j Nyiragatanga 109.8 e-m 14.1 a-i 26.8 f-i 20.4 c-j 399.7 g-r 81.6 h-o 509.5 g-m 95.7 f-p Otada 148 150.8 h-r 9.0 a-f 28.5 g-i 29.7 k 316.1 b-j 32.3 a-c 466.9 e-l 41.3 a-c Otada 24 55.4 a-f 5.4 a-c 25.7 f-i 26.8 h-j 342 c-n 34.6 a-c 397.4 b-g 40.1 a-c Otada 48 85.5 a-i 2.9 ab 25.1 f-i 21.1 c-j 247.5 a-c 51.9 a-i 332.9 a-e 54.8 a-g Otada 70 109.4 e-m 5.3 a-c 28.8 g-i 0.5 a 428.5 j-t 43.2 a-f 537.9 g-m 48.5 a-e Otada 96 136.2 f-q 29.2 g-n 27.7 f-i 11.7 a-f 444.0 l-t 79.7 f-n 580.1 k-o 108.9 j-r Purple 297 116.1 e-n 21.0 b-j 27.2 f-i 0.5 a 457.6 o-t 37.3 a-d 573.7 j-o 58.3 a-h Purple 4419 193.7 m-u 45.3 m-q 25.6 f-i 27.2 h-j 431.5 k-t 73.1 d-m 625.2 m-p 118.4 l-r Rukubinkondo 94.8 b-j 7.9 a-d 13.3 b-d 22.9 d-j 526.8 s-v 44.4 a-g 621.6 m-p 52.3 a-f Seruruseke 105.2 e-l 15.0 a-i 27.5 f-i 27.8 h-j 429.3 j-t 68.6 c-m 534.5 g-m 83.7 c-n SPK004 10.3 ab 1.7. a 26.8 f-i 9.7 a-c 271.4 a-d 28.1 ab 281.6 ab 29.8 a Ukerewe 93.4 b-j 27.8 g-m 27.0 f-i 19.3 c-j 331.9 c-l 83.0 h-o 425.3 b-j 110.9 j-r Grand mean 126.6 23.8 23.9 17.5 390.3 70.7 517.0 94.5 CV (%) 41.4 46.9 23.3 46.1 18.0 32.1 18.3 30.5 LSD (5%) 84.8 18.1 9.0 13.0 113.9 36.8 152.8 46.7
* Means in a column followed by the same letter are not significantly different at P ≤ 0.05.
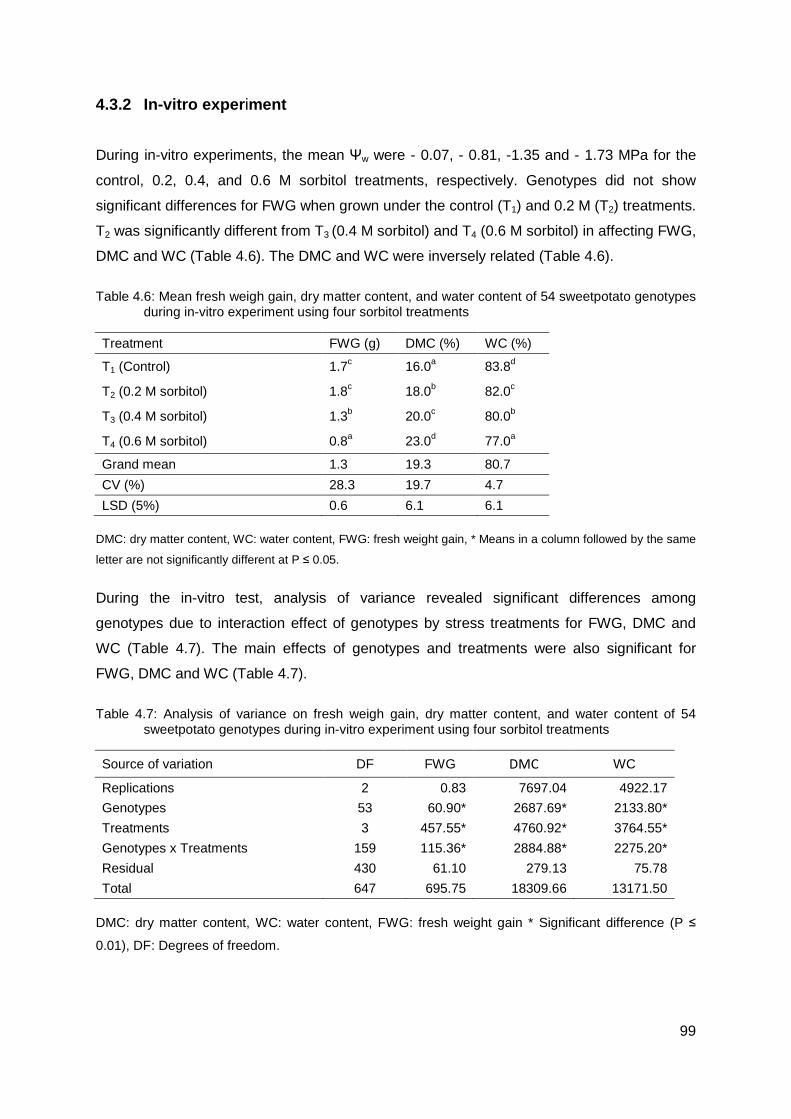
99
4.3.2 In-vitro exper iment
During in-vitro experiments, the mean Ψw were - 0.07, - 0.81, -1.35 and - 1.73 MPa for the
control, 0.2, 0.4, and 0.6 M sorbitol treatments, respectively. Genotypes did not show
significant differences for FWG when grown under the control (T1) and 0.2 M (T2) treatments.
T2 was significantly different from T3 (0.4 M sorbitol) and T4 (0.6 M sorbitol) in affecting FWG,
DMC and WC (Table 4.6). The DMC and WC were inversely related (Table 4.6).
Table 4.6: Mean fresh weigh gain, dry matter content, and water content of 54 sweetpotato genotypes during in-vitro experiment using four sorbitol treatments
Treatment FWG (g) DMC (%) WC (%)
T1 (Control) 1.7c 16.0a 83.8d
T2 (0.2 M sorbitol) 1.8c 18.0b 82.0c
T3 (0.4 M sorbitol) 1.3b 20.0c 80.0b
T4 (0.6 M sorbitol) 0.8a 23.0d 77.0a
Grand mean 1.3 19.3 80.7
CV (%) 28.3 19.7 4.7
LSD (5%) 0.6 6.1 6.1
DMC: dry matter content, WC: water content, FWG: fresh weight gain, * Means in a column followed by the same
letter are not significantly different at P ≤ 0.05.
During the in-vitro test, analysis of variance revealed significant differences among
genotypes due to interaction effect of genotypes by stress treatments for FWG, DMC and
WC (Table 4.7). The main effects of genotypes and treatments were also significant for
FWG, DMC and WC (Table 4.7).
Table 4.7: Analysis of variance on fresh weigh gain, dry matter content, and water content of 54 sweetpotato genotypes during in-vitro experiment using four sorbitol treatments
Source of variation DF FWG DMC WC
Replications 2 0.83 7697.04 4922.17
Genotypes 53 60.90* 2687.69* 2133.80*
Treatments 3 457.55* 4760.92* 3764.55*
Genotypes x Treatments 159 115.36* 2884.88* 2275.20*
Residual 430 61.10 279.13 75.78
Total 647 695.75 18309.66 13171.50
DMC: dry matter content, WC: water content, FWG: fresh weight gain * Significant difference (P ≤
0.01), DF: Degrees of freedom.
100
The control treatment had the highest FWG at 4.9, 4.34, 4.2, 4.2 and 3.9 g displayed by
genotypes Nsasagatebo, 2005-103, Mugande, Caroline and Kwezikumwe, respectively. At
the 0.6 M sorbitol treatment, genotypes IMBY 3102, 97-062, NASPOT 9 O, 2005-146, 4-160
and 2002-155 revealed the highest FWG of 1.5, 0.8, 0.7, 0.7 and 0.7 g, respectively (Table
4.8). A high DMC of 21.2, 20.2, 18.4, 18.2 and 17.9% was observed in genotypes Naveto,
K513261, Meresiyana, Otada 148 and Kwezikumwe, respectively. Under drought stress, the
genotypes 2005-103, 9-466, Otada 70, New Kawogo and Kwezikumwe revealed the highest
DMC of 39.4, 36.9, 32.3, 30.3 and 28.4 % (Table 4.8). The best genotypes that showed
relatively high WC compared to the control were Caroline, 2005-110, Mvugamo, NASPOT A
and 97-062 at 88.5, 87.7, 87.7, 87.6 and 87.4 %. Under 0.6 M sorbitol treatment, genotypes
8-1038, Nyiragatanga, IMBY 3102, SPK004 and Mvugamo expressed WC of 88.8, 83.5,
82.7, 81.9 and 81.9 % (Table 4.8).
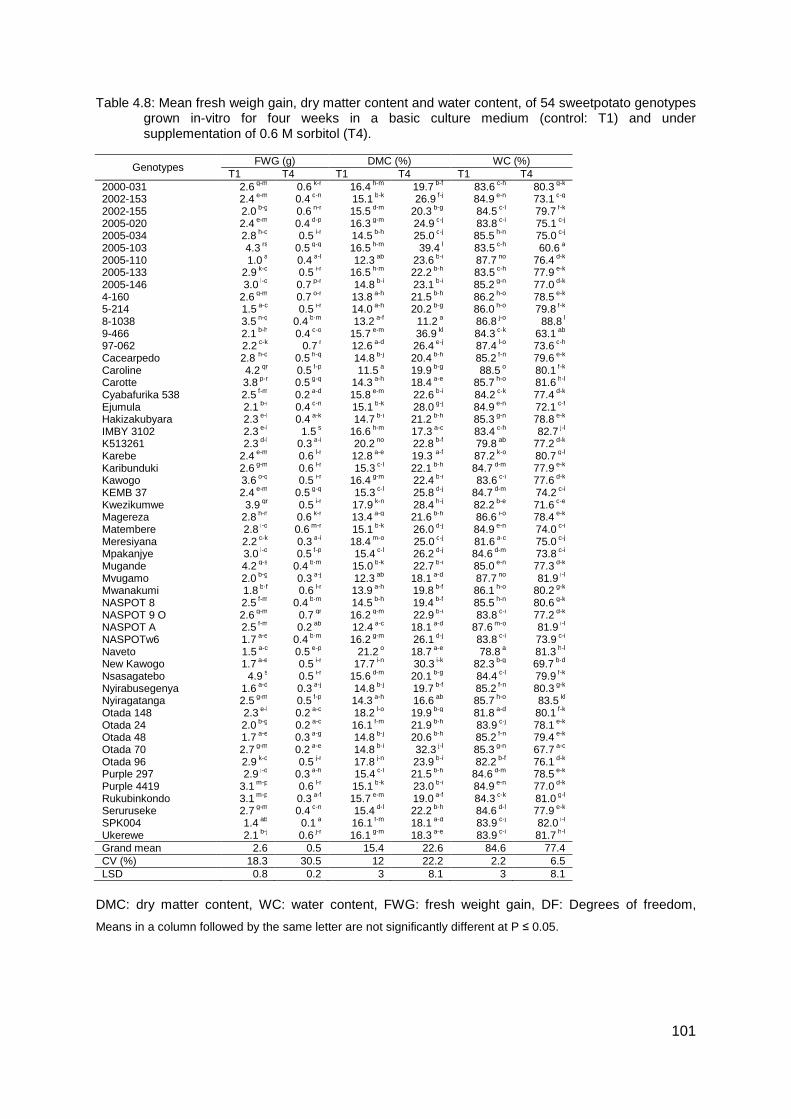
101
Table 4.8: Mean fresh weigh gain, dry matter content and water content, of 54 sweetpotato genotypes grown in-vitro for four weeks in a basic culture medium (control: T1) and under supplementation of 0.6 M sorbitol (T4).
Genotypes FWG (g) DMC (%) WC (%)
T1 T4 T1 T4 T1 T4 2000-031 2.6 g-m 0.6 k-r 16.4 h-m 19.7 b-f 83.6 c-h 80.3 g-k 2002-153 2.4 e-m 0.4 c-n 15.1 b-k 26.9 f-j 84.9 e-n 73.1 c-g 2002-155 2.0 b-g 0.6 n-r 15.5 d-m 20.3 b-g 84.5 c-l 79.7 f-k 2005-020 2.4 e-m 0.4 d-p 16.3 g-m 24.9 c-j 83.8 c-i 75.1 c-j 2005-034 2.8 h-o 0.5 i-r 14.5 b-h 25.0 c-j 85.5 h-n 75.0 c-j 2005-103 4.3 rs 0.5 g-q 16.5 h-m 39.4 l 83.5 c-h 60.6 a 2005-110 1.0 a 0.4 a-l 12.3 ab 23.6 b-i 87.7 no 76.4 d-k 2005-133 2.9 k-o 0.5 i-r 16.5 h-m 22.2 b-h 83.5 c-h 77.9 e-k 2005-146 3.0 l-o 0.7 p-r 14.8 b-i 23.1 b-i 85.2 g-n 77.0 d-k 4-160 2.6 g-m 0.7 o-r 13.8 a-h 21.5 b-h 86.2 h-o 78.5 e-k 5-214 1.5 a-c 0.5 i-r 14.0 a-h 20.2 b-g 86.0 h-o 79.8 f-k 8-1038 3.5 n-q 0.4 b-m 13.2 a-f 11.2 a 86.8 j-o 88.8 l 9-466 2.1 b-h 0.4 c-o 15.7 e-m 36.9 kl 84.3 c-k 63.1 ab 97-062 2.2 c-k 0.7 r 12.6 a-d 26.4 e-j 87.4 l-o 73.6 c-h Cacearpedo 2.8 h-o 0.5 h-q 14.8 b-j 20.4 b-h 85.2 f-n 79.6 e-k Caroline 4.2 qr 0.5 f-p 11.5 a 19.9 b-g 88.5 o 80.1 f-k Carotte 3.8 p-r 0.5 g-q 14.3 a-h 18.4 a-e 85.7 h-o 81.6 h-l Cyabafurika 538 2.5 f-m 0.2 a-d 15.8 e-m 22.6 b-i 84.2 c-k 77.4 d-k Ejumula 2.1 b-i 0.4 c-n 15.1 b-k 28.0 g-j 84.9 e-n 72.1 c-f Hakizakubyara 2.3 e-l 0.4 a-k 14.7 b-i 21.2 b-h 85.3 g-n 78.8 e-k IMBY 3102 2.3 e-l 1.5 s 16.6 h-m 17.3 a-c 83.4 c-h 82.7 j-l K513261 2.3 d-l 0.3 a-i 20.2 no 22.8 b-f 79.8 ab 77.2 d-k Karebe 2.4 e-m 0.6 l-r 12.8 a-e 19.3 a-f 87.2 k-o 80.7 g-l Karibunduki 2.6 g-m 0.6 l-r 15.3 c-l 22.1 b-h 84.7 d-m 77.9 e-k Kawogo 3.6 o-q 0.5 i-r 16.4 g-m 22.4 b-i 83.6 c-i 77.6 d-k KEMB 37 2.4 e-m 0.5 g-q 15.3 c-l 25.8 d-j 84.7 d-m 74.2 c-i Kwezikumwe 3.9 qr 0.5 i-r 17.9 k-n 28.4 h-j 82.2 b-e 71.6 c-e Magereza 2.8 h-n 0.6 k-r 13.4 a-g 21.6 b-h 86.6 i-o 78.4 e-k Matembere 2.8 i-o 0.6 m-r 15.1 b-k 26.0 d-j 84.9 e-n 74.0 c-i Meresiyana 2.2 c-k 0.3 a-i 18.4 m-o 25.0 c-j 81.6 a-c 75.0 c-j Mpakanjye 3.0 l-o 0.5 f-p 15.4 c-l 26.2 d-j 84.6 d-m 73.8 c-i Mugande 4.2 q-s 0.4 b-m 15.0 b-k 22.7 b-i 85.0 e-n 77.3 d-k Mvugamo 2.0 b-g 0.3 a-j 12.3 ab 18.1 a-d 87.7 no 81.9 i-l Mwanakumi 1.8 b-f 0.6 l-r 13.9 a-h 19.8 b-f 86.1 h-o 80.2 g-k NASPOT 8 2.5 f-m 0.4 b-m 14.5 b-h 19.4 b-f 85.5 h-n 80.6 g-k NASPOT 9 O 2.6 g-m 0.7 qr 16.2 g-m 22.9 b-i 83.8 c-i 77.2 d-k NASPOT A 2.5 f-m 0.2 ab 12.4 a-c 18.1 a-d 87.6 m-o 81.9 i-l NASPOTw6 1.7 a-e 0.4 b-m 16.2 g-m 26.1 d-j 83.8 c-i 73.9 c-i Naveto 1.5 a-c 0.5 e-p 21.2 o 18.7 a-e 78.8 a 81.3 h-l New Kawogo 1.7 a-e 0.5 i-r 17.7 i-n 30.3 i-k 82.3 b-g 69.7 b-d Nsasagatebo 4.9 s 0.5 i-r 15.6 d-m 20.1 b-g 84.4 c-l 79.9 f-k Nyirabusegenya 1.6 a-d 0.3 a-j 14.8 b-j 19.7 b-f 85.2 f-n 80.3 g-k Nyiragatanga 2.5 g-m 0.5 f-p 14.3 a-h 16.6 ab 85.7 h-o 83.5 kl Otada 148 2.3 e-l 0.2 a-c 18.2 l-o 19.9 b-g 81.8 a-d 80.1 f-k Otada 24 2.0 b-g 0.2 a-c 16.1 f-m 21.9 b-h 83.9 c-j 78.1 e-k Otada 48 1.7 a-e 0.3 a-g 14.8 b-j 20.6 b-h 85.2 f-n 79.4 e-k Otada 70 2.7 g-m 0.2 a-e 14.8 b-i 32.3 j-l 85.3 g-n 67.7 a-c Otada 96 2.9 k-o 0.5 j-r 17.8 j-n 23.9 b-i 82.2 b-f 76.1 d-k Purple 297 2.9 j-o 0.3 a-h 15.4 c-l 21.5 b-h 84.6 d-m 78.5 e-k Purple 4419 3.1 m-p 0.6 l-r 15.1 b-k 23.0 b-i 84.9 e-n 77.0 d-k Rukubinkondo 3.1 m-p 0.3 a-f 15.7 e-m 19.0 a-f 84.3 c-k 81.0 g-l Seruruseke 2.7 g-m 0.4 c-n 15.4 d-l 22.2 b-h 84.6 d-l 77.9 e-k SPK004 1.4 ab 0.1 a 16.1 f-m 18.1 a-d 83.9 c-j 82.0 i-l Ukerewe 2.1 b-j 0.6 j-r 16.1 g-m 18.3 a-e 83.9 c-i 81.7 h-l Grand mean 2.6 0.5 15.4 22.6 84.6 77.4 CV (%) 18.3 30.5 12 22.2 2.2 6.5 LSD 0.8 0.2 3 8.1 3 8.1
DMC: dry matter content, WC: water content, FWG: fresh weight gain, DF: Degrees of freedom,
Means in a column followed by the same letter are not significantly different at P ≤ 0.05.
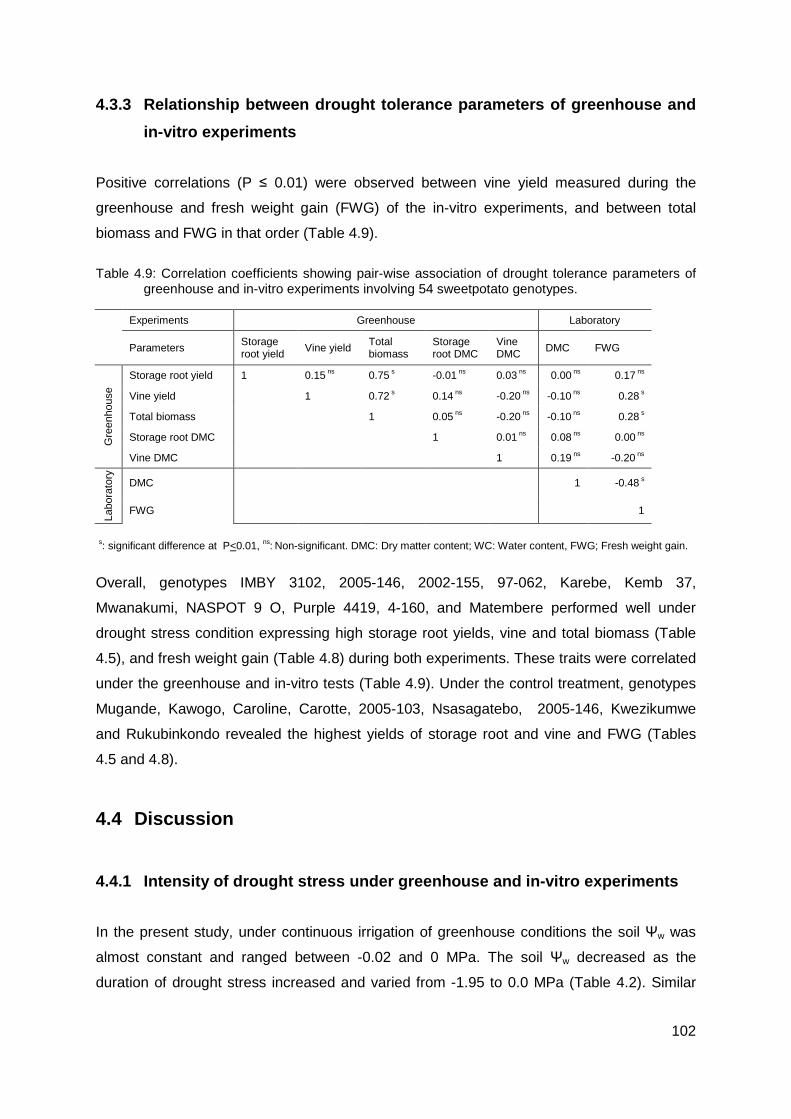
102
4.3.3 Relationship between drought tolerance parameters of greenhouse and
in-vitro experiments
Positive correlations (P ≤ 0.01) were observed between vine yield measured during the
greenhouse and fresh weight gain (FWG) of the in-vitro experiments, and between total
biomass and FWG in that order (Table 4.9).
Table 4.9: Correlation coefficients showing pair-wise association of drought tolerance parameters of greenhouse and in-vitro experiments involving 54 sweetpotato genotypes.
Experiments Greenhouse Laboratory
Parameters Storage root yield Vine yield
Total biomass
Storage root DMC
Vine DMC DMC FWG
Gre
enho
use
Storage root yield 1 0.15 ns 0.75 s -0.01 ns 0.03 ns 0.00 ns 0.17 ns
Vine yield 1 0.72 s 0.14 ns -0.20 ns -0.10 ns 0.28 s
Total biomass 1 0.05 ns -0.20 ns -0.10 ns 0.28 s
Storage root DMC 1 0.01 ns 0.08 ns 0.00 ns
Vine DMC 1 0.19 ns -0.20 ns
Labo
rato
ry
DMC
1 -0.48 s
FWG
1
s: significant difference at P<0.01, ns: Non-significant. DMC: Dry matter content; WC: Water content, FWG; Fresh weight gain.
Overall, genotypes IMBY 3102, 2005-146, 2002-155, 97-062, Karebe, Kemb 37,
Mwanakumi, NASPOT 9 O, Purple 4419, 4-160, and Matembere performed well under
drought stress condition expressing high storage root yields, vine and total biomass (Table
4.5), and fresh weight gain (Table 4.8) during both experiments. These traits were correlated
under the greenhouse and in-vitro tests (Table 4.9). Under the control treatment, genotypes
Mugande, Kawogo, Caroline, Carotte, 2005-103, Nsasagatebo, 2005-146, Kwezikumwe
and Rukubinkondo revealed the highest yields of storage root and vine and FWG (Tables
4.5 and 4.8).
4.4 Discussion
4.4.1 Intensity of drought stress under greenhouse and in-vitro experiments
In the present study, under continuous irrigation of greenhouse conditions the soil Ψw was
almost constant and ranged between -0.02 and 0 MPa. The soil Ψw decreased as the
duration of drought stress increased and varied from -1.95 to 0.0 MPa (Table 4.2). Similar
103
observations were reported by Rahimi et al. (2010) in their study of f leaf Ψw and relative WC
under gradual drought stress in Plantago ovata and P. psyllium. Within five days after
irrigation, the leaf Ψw was almost constant and varied between -0.7 and -1.0 MPa. However,
there was a Ψw decline of -1.6 and -2.0 MPa after 8 days of irrigation and of -2.3 and -2.8
MPa after 10 days of irrigation for P. psyllium and P. ovata, respectively. The change of this
Ψw was associated with the increase of solute concentration in the soil and resulted negative
osmotic potential (Taiz and Zeiger 2006).
The control semi-solid MS medium with 30 g l−1 sucrose had a Ψw of -0.80 MPa. When this
culture medium was supplemented with 0.4 M sorbitol and 0.012 M polyethylene glycol
(PEG), the Ψw were -2.05 MPa and -1.30 MPa, respectively (Gopal and Iwama 2007). The
dissolution of sugar in a solution of culture medium caused a Ψw decrease of the culture
medium. In bananas, a culture medium supplemented with 0.09 M sucrose had a Ψw of -
0.37 MPa. When this culture medium was supplemented with 0.1 M and 0.5 M sorbitol, the
Ψw shifted to -0.63 Mpa and -1.72 Mpa, respectively (Rukundo et al. 2012). These findings
agree with the observation of this study in which under the in-vitro condition, the Ψw
decreased as the concentration of sorbitol increased at -0.07, -0.81, -1.35 and - 1.73 MPa
for control (0.0 M), 0.2, 0.4, and 0.6 M sorbitol treatments, respectively. Both the greenhouse
and in-vitro approaches showed the same trend; as the drought stress conditions increased,
the Ψw decreased.
4.4.2 Effects of drought stress
4.4.2.1 Greenhouse experiments
Limited water availability at any crop growth stage causes unfavourable effects on growth.
These effects vary depending on the intensity of stress and the crop growth stage (Deblonde
and Ledent 2001; Farooq et al. 2012). The results from this study corroborate with the above
observations. There was a significant difference between plants grown on continuous
irrigation and drought stress conditions (Figure 4.3). Plants grown under continuous irrigation
showed high vegetative growth and dense green leaves.
In sweetpotato production a yield loss of more 60%, due to drought stress was recorded in
South Africa (van Heerden and Laurie 2008). This loss was associated with a decreased of
the aboveground biomass accumulation. Therefore, it was suggested that the genetic
improvement for drought tolerance of sweetpotato has to consider these characteristics
which include well-developed aboveground plant parts or vines (van Heerden and Laurie
104
2008). Saraswati et al. (2004) reported that plant biomass, main stem length, internode
diameter, internode length, leaf number and area, and root weight decreased in response to
water stress. Previous findings agreed with the results of this study. Plants grown on drought
stress conditions revealed a loss of leaves and reduced growth. Continued irrigation showed
the highest yield of storage root, vine and total biomass, weight of biggest root, root DMC
and vine WC (Table 4.3). The effects of continuous irrigation were significantly different from
other treatments (Table 4.3).
Previous studies showed that water regimes of 100, 80, 60, 40 and 30% of field capacity had
significant effect on shoot growth and weight. The strongest effects were observed in plants
grown on the 30% treatment where shoot fresh weight, shoot dry weight, and shoot length
was reduced by 79, 7 and 76.0%, respectively, at the time of harvest (Van Heerden and
Laurie 2008). In this study, highest reduction of growth and yield was observed on drought
stress of three months. However, the effects of drought stress of three months were not
significantly different from drought stress of two months (Table 4.3). This indicates that
drought tolerance in sweetpotato genotypes could be investigated by applying one month of
continuous irrigation for establishment followed by two months of drought stress under
greenhouse conditions.
4.4.2.2 In-vitro tests
Effects of drought stress induced by 0, 15 and 25 % PEG in laboratory experiments caused
a reduction of shoot, root biomass and plant height (Bayoumi et al. 2010). The increase of
osmotic inducer in basal culture medium caused a decrease of callus induction and plantlet
growth (Biswas et al. 2002). These findings agreed with results of the present study. T2
(control supplemented with 0.2 M sorbitol) were significantly different from T3 (control
supplemented with 0.4 M sorbitol) and T4 (control supplemented with 0.6 M sorbitol) on
FWG, DMC and WC (Table 4.6). The application of the same concentration of sorbitol (0.2
M) as an osmotic inducer on different varieties of banana plantlets showed that all varieties
were negatively affected, but the degree of sensitivity varied significantly (Rukundo et al.
2012). The same observation was found in this study; the interaction between genotypes
and treatment were significant for FWG, DMC and WC (Table 4.7). The control (T1) and
control complemented with 0.2 M sorbitol (T2) did not show significant differences in fresh
weight gain (Table 4.7). This indicates that the control supplemented with 0.4 M sorbitol
could be the lowest concentration to be applied in screening for drought tolerance in
sweetpotatoes under in-vitro condition suggesting more sorbitol concentrations in future
studies.
105
4.4.3 Correlation between drought tolerance parameters during greenhouse
and in-vitro experiments
Selection for drought tolerance is complicated by the lack of fast and reproducible screening
approaches, and constant water stress conditions to efficiently evaluate a large number of
genotypes (Ramirez-Vallejo and Kelly 1998; Talebi et al. 2009). Thus, drought indices which
provide a measure of drought based on yield and yield related traits under drought
conditions in comparison to the control have been used for screening drought-tolerant
genotypes (Mitra 2001). These indices are either based on drought resistance or
susceptibility of genotypes (Talebi et al. 2009). Selection of different genotypes under stress
conditions is one of the main tasks of plant breeders to develop stress-tolerant cultivars
(Clarke et al. 1984). This study revealed that in all evaluated parameters under greenhouse
and in vitro experiments (Table 4.9); only three parameters with positive correlations (vine
weight and fresh weight gain, and total biomass) could be considered as major selection
criteria to identify drought tolerant sweetpotato genotypes under greenhouse and in-vitro
tests.
4.5 Conclusions
This study indicates that the basal culture medium of sweetpotato supplemented with 0.4 M
sorbitol could be the lowest concentration to be applied in screening for drought tolerance
under in-vitro condition. In greenhouse trial, two months was enough to screen for drought
tolerance in sweetpotatoes. Vine yields, total biomass and fresh weight gain are three
important selection parameters to identify drought tolerant sweetpotato genotypes under
greenhouse and in-vitro tests. In the absence of drought stress ideal genotypes are
Mugande, Kawogo, Caroline, Carotte, 2005-103, Nsasagatebo, 2005-146, Kwezikumwe and
Rukubinkondo for high storage root yields. Under drought stress conditions the best
genotypes identified with the highest storage yields were IMBY 3102, 2005-146, 2002-155,
97-062, Karebe, Kemb 37, Mwanakumi, NASPOT 9 O, Purple 4419, 4-160, and Matembere.
4.6 References
Acquaah, G. 2007. Principles of plant genetics and breeding. Wiley-Blackwell, Oxford.
106
Andrade, M., J. Ricardo and W. Grunerberg. 2009. Need of breeding orange fleshed sweetpotato for drought prone regions using Mozambique as drought prone test environments. CIP, Lima, Peru.
Ashraf, M. and P.J. Harris. 2005. Abiotic stresses: Plant resistance through breeding and molecular approaches. Food Products Press, New York, USA.
Bayoumi, T., M.H. Eid and E. Metwali. 2010. Application of physiological and biochemical indices as a screening technique for drought tolerance in wheat genotypes. African Journal of Biotechnology 7: 2341-2352.
Biswas, J., B. Chowdhury, A. Bhattacharya and A. Mandal. 2002. In vitro screening for increased drought tolerance in rice. In Vitro Cellular and Developmental Biology Plant 38: 525-530.
Clarke, J.M., F. Townley-Smith, T.N. McCaig and D.G. Green. 1984. Growth analysis of spring wheat cultivars of varying drought resistance. Crop Science 24: 537-541.
Cochran, W.G. and G.M. Cox. 1992. Expermental designs. Wiley Classics Library, Lexington, KY, USA.
Deblonde, P. and J. Ledent. 2001. Effects of moderate drought conditions on green leaf number, stem height, leaf length and tuber yield of potato cultivars. European Journal of Agronomy 14: 31-41.
Ekanayake, I.J. and C. Wanda. 2004. Effect of irrigation on sweetpotato root carbohydrates and nitrogenous compounds. Food, Agriculture and Environment 2: 243-248.
FAOSTAT. 2013. Statistics division. FAO. http://faostat.fao.org/site/612/default.aspx#ancor (accessed Accessed 7 July 2015).
Farooq, M., M. Hussain, A. Wahid and K. Siddique. 2012. Drought stress in plants: An Overview. in, Plant Responses to Drought Stress. Springer. p. 1-33.
Gasura, E., A. Mashingaidze and S. Mukasa. 2010. Genetic variability for tuber yield, quality, and virus disease complex traits in Uganda sweetpotato germplasm. African Crop Science Journal 16: 147-160.
Gommes, R., A. Challinor, H. Das, M.A. Dawod, L. Mariani, B. Tychon, R. Krüger, U. Otte, R.E.R. Vega and W. Trampf. 2010. Guide to Agricultural Meteorological Practices. WMO, Geneva, Switzerland.
Gong, Y. and G. Wang. 1990. An investigation on the effect of drought stress on growth of sweetpotato and measures to improve drought resistance and stabilize yields. Zhejiang Agricultural Sciences 3: 26-29.
Gopal, J. and K. Iwama. 2007. In vitro screening of potato against water-stress mediated through sorbitol and polyethylene glycol. Plant Cell Reports 26: 693-700.
Guo, X., J. Tang, Y. Zhang, H. Zhang, X. Shi, Y. Liu, D. Zhao, M.D. Zhou and Y. Wang. 1999. In vitro maintenance of sweetpotato genetic resources. Plant Genetic Resources Conservation and Use in China 9: 75-79.
107
Haimeirong and F. Kubota. 2003. The effects of drought stress and leaf ageing on leaf photosynthesis and electron transport in photosystem 2 in sweetpotato (Ipomoea batatas Lam.) cultivars. Photosynthetica 41: 253-258.
He, S., Y. Han, Y. Wang, H. Zhai and Q. Liu. 2009. In vitro selection and identification of sweetpotato (Ipomoea batatas [L.] Lam.) plants tolerant to NaCl. Plant Cell, Tissue and Organ Culture 96: 69-74.
van Heerden, P.D.R.v. and R. Laurie. 2008. Effects of prolonged restriction in water supply on photosynthesis, shoot development and storage root yield in sweetpotato. Physiologia Plantarum 134: 99-109.
Lebot, V. 2009. Sweetpotato. In: Bradshaw, J.E., editor, Root and tuber crops: Handbook of plant breeding. Springer Sciences and Business Media, New York, NY 10013, USA. p. 97-125.
Mitra, J. 2001. Genetics and genetic improvement of drought resistance in crop plants. Current Science 80: 758-763.
Murashige, T. and F. Skoog. 1962. A revised medium for growth and bioassays with tobacco tissue cultures. Bologia Plantarum 15: 473-497.
Ober, E.S. 2008. Breeding for improved drought tolerance and water use efficiency. In: HGCA, editor, Arable cropping in a changing climate, Higham. 23-24 January 2008. HGCA. p.28-37.
Owens, S. 2001. Salt of the Earth: Genetic engineering may help to reclaim agricultural land lost due to salinisation. EMBO reports 2: 877-879.
Pantuwan, G., S. Fukai, M. Cooper, S. Rajatasereekul and J. O’Toole. 2002. Yield response of rice (Oryza sativa L.) genotypes to drought under rainfed lowland: Plant factors contributing to drought resistance. Field Crops Research 73: 181-200.
Payne, R.W., D.A. Murray, S.A. Harding, D.B. Baird and D.M. Soutar. 2011. An introduction to GenStat for windows (14th Edition). Hemel Hempstead, UK.
Rahimi, A., S. Madah Hosseini, M. Pooryoosef and I. Fateh. 2010. Variation of leaf water potential, relative water content and SPAD under gradual drought stress and stress recovery in two medicinal species of Plantago ovata and P. psyllium. Plant Ecophysiology 2: 53-60.
Ramirez-Vallejo, P. and J.D. Kelly. 1998. Traits related to drought resistance in common bean. Euphytica 99: 127-136.
Rodríguez, F. 1999. Methods to evaluate culinary quality and other attributes for processing sweetpotato storage roots. In: Huaman, Z., editor, Sweetpotato germplasm management (Ipomoea batatas): Training manual. International Potato Center (CIP), Lima, Peru. p. 190-218.
Rukundo, P., S.C. Carpentier and R. Swennen. 2012. Development of in vitro technique to screen for drought tolerant banana varieties by sorbitol induced osmotic stress. African Journal of Plant Science 6: 416-425.
108
Saraswati, P., M. Johnston, R. Coventry and J. Holtum. 2004. Identification of drought tolerant sweetpotato (Ipomoea batatas [L.] Lam) cultivars. Australian Agronomy. http://www.cropscience.org.au/icsc2004/poster/1/1/1400_saraswatip.htm.
Sherrard, M.E. and H. Maherali. 2006. The adaptive significance of drought escape in Avena barbata, an annual grass. Evolution 60: 2478-2489.
Solis, J., A. Villordon, N. Baisakh, D. Labonte and N. Firon. 2014. Effect of drought on storage root development and gene expression profile of sweetpotato under greenhouse and field conditions. Journal of the American Society for Horticultural Science 139: 317-324.
SPSS. 2006. PASW Statistics for Windows SPSS Inc. Chicago IL, USA.
Subbarao, G., O. Ito, R. Serraj, J. Crouch, S. Tobita, K. Okada, C. Hash, R. Ortiz and W. Berry. 2005. Physiological perspectives on improving crop adaptation to drought-justification for systemic component-based approach. In: Pessarakli, M., editor, Handbook of Photosynthesis. Marcel and Dekker, New York. p. 577-594.
Taiz, L. and E. Zeiger. 2006. Stress physiology. In: Taiz, L. and E. Zeiger, editors, Plant physiology. Sinauer Associates, Inc., Sunderland, MA. p. 671-681.
Talebi, R., F. Fayaz and A. Naji. 2009. Effective selection criteria for assessing drought stress tolerance in durum wheat (Triticum durum Desf.). General and Applied Plant Physiology 35: 64-74.
Wang, H.L., P.D. Lee, L.F. Liu and J.C. Su. 1999. Effect of sorbitol induced osmotic stress on the changes of carbohydrate and free amino acid pools in sweetpotato cell suspension cultures. Botanical Bulletin of Academia Sinica 40: 219-225.
Woolfe, J.A. 1992. Sweetpotato: An untapped food resource. Cambridge University Press, New York.
109
5. Chapter Five: Combining ability, maternal effects and
heritability of drought tolerance, yield and yield
components among newly developed sweetpotato
clones
Abstract
Knowledge on gene action and traits expression are important for effective breeding. The
objective of this study was to determine the general combining ability (GCA), specific
combining ability (SCA), maternal effects and heritability of drought tolerance, yield and yield
components of candidate sweetpotato clones. Twelve genotypes selected for their high
yield, dry matter content or drought tolerance were crossed using a full diallel mating design.
Families were field evaluated at Masoro, Karama and Rubona Research Stations of Rwanda
Agriculture Board. Success rate of crosses varied from 1.8 to 62.5% with a mean of 18.8%.
Family by site interaction had significant effect (P<0.01) on storage root and vine yields, total
biomass and dry matter content of storage root. The family effects were significant (P< 0.01)
for all parameters measured. Broad sense heritability estimates were 0.95, 0.84, 0.68, 0.47,
0.74, 0.75, 0.50 and 0.58 for canopy temperature (CT), canopy wilting (CW), root yield, skin
colour, flesh colour, dry matter content, vine yield and total biomass, respectively. The GCA
effects of parents and SCA effects of crosses were significant (P<0.01) for CT, CW, storage
root, vine and biomass yields, and dry matter content of storage root. The ratio of GCA/SCA
effects for CT, CW, yield of storage roots and dry matter content of storage roots were
higher than 50% suggesting the preponderance of additive over non-additive gene actions in
the expression of these traits. The best general combiners for drought tolerance were the
parents, 8-1038, Otada 24 and 4-160 with the lowest CT and CW and relatively high yields.
Best combiners for high storage root yield were the parents, Nsasagatebo, K513261 and
Ukerewe, while Nsasagatebo, 2005-034 and Ukerewe were the best combiners for high dry
matter content. Maternal effects were significant (P<0.05) among families for CT, CW, flesh
color and dry matter content, vine yield and total biomass. Based on reduced CT and CW,
the best families with significant SCA effects were, 4-160 x Nsasagatebo, 4-160 x Ukerewe,
Otada 24 x 4-160, Nsasagatebo x 2005-020, Otada 24 x Nsasagatebo, 4-160 x K513261 ,
513261 x 4-160, 8-1038 x 4-160, 4-160 x 8-1038, 8-1038 x 2005-020 and Nsasagatebo x
Ukerewe, which were selected for breeding for drought tolerance. Across sites, the best five
selected families with significant SCA effects for storage root yield were, Nsasagatebo x
110
Otada 24, Otada 24 x Ukerewe, 4-160 x Nsasagatebo, K513261 x 2005-034 and Ukerewe x
K513261 with 11.0, 9.7, 9.3, 9.2, 8.6 t/ha, respectively. The best families with high dry
matter content of 36.1, 35.1, 34.3, 34.0, and 33.9 % were Ukerewe x 2005-034, 4-160 x
Nsasagatebo, 2005-034 x Ukerewe, 2005-034 x K513261, 2005-020 x Ukerewe, in that
order. The selected families are valuable genetic resources for sweetpotato breeding for
drought tolerance, yield and yield components in Rwanda or similar environments.
Key words: Canopy temperature, canopy wilting, drought tolerance, gene action, heritability,
general combining ability, specific combining ability, storage root, sweetpotato.
5.1 Introduction
Sweetpotato (Ipomoea batatas [L.] Lam; 2n=6x=90) is an important root crop grown in more
than 110 countries on an estimated area of 110x106 ha with an annual production of 9 million
tons (FAOSTAT 2013). In most sub-Saharan Africa countries, it is widely grown in
smallholders farmesrs systems across various agro-ecological zones, with excellent
tolerance to various abiotic and biotic stresses. Sweetpotato has become the main staple
food for many families in Uganda, Rwanda, and Burundi in Eastern Africa, where annual per
capita consumption fresh roots is above 80 kg (FAOSTAT 2013). The storage roots of
sweetpotato are rich in carbohydrates and its leaves are rich in proteins. Orange fleshed
sweetpotato varieties are rich in β-carotene, a precursor of vitamin A, while purple fleshed
sweetpotato varieties contain anthocyanin, which is a powerful anti-antioxidant (Lebot 2009).
Sweetpotato flour can be used as a partial substitute of wheat flour in bakeries and pasta
products, allowing for import substitute for wheat flour (Tan et al. 2007). However, yield and
yield components, and quality traits of sweetpotato genotypes vary due to differences in
genetic constitution, the environment and genotype-by-environment interactions.
Quantitative characters including drought tolerance are influenced by genetic and non-
genetic factors. The genetic components of quantitative traits are often controlled by many
sets of genes with various gene action (Acquaah 2007). An ideotype is determined by
genetic components explained by gene action such as additive, dominance, epistatic or
overdominance effects, and the environment in which it is grown (Fasoula and Fasoula
2003). The magnitude and direction of genetic components are estimated through various
parameters including combining ability, heritability and heterosis analyses. Knowledge of
gene action and associated trait expression is important for effective breeding and selection
(Grami et al. 1977; Ma-Teresa et al. 1994).
111
Combining ability analysis helps to identify superior parents to be used in breeding programs
or to identify promising cross combinations for cultivar development (Acquaah 2007).
General combining ability (GCA) is directly related to the breeding value of a parent and is
associated with additive genetic effects, while specific combining ability (SCA) is the relative
performance of a cross that is associated with non-additive gene action, predominantly
contributed by dominance, epistasis, or genotype x environment interaction effects (Rojas
and Sprague 1952; Falconer and Mackay 1996). Therefore, both GCA and SCA effects are
important in the selection or development of breeding populations (Viana and Matta 2003).
Trait expression is influenced by both nuclear and cytoplasmic genes (Acquaah 2007). The
cytoplasmic genes are known to have maternal inheritance, which is often determined
through reciprocal crosses. The distribution of cytoplasmic genetic materials into gametes is
unequal and unpredictable (Roach and Wulff 1987; Acquaah 2007). Grami and Stefansson
(1977) reported that the maternal effects on protein and oil content in summer rape seed
crop observed during the F1 generation change in the F2. This change was attributed to
inadequate distribution of cytoplasmic components during gamete formation of female
plants. Hence, it is difficult to maintain the maternal effects in sexually reproducing crops.
Maternal genetic effects can be maintained in vegetatively propagated crops such as
sweetpotato, owing to the inherently identical reproduction. Therefore, investigation and
identification of maternal effects for desirable traits can be beneficial in breeding of
sweetpotato, which may enhance responses to selection (Falconer and Mackay 1996).
Heritability is categorized into broad sense heritability (H2) and narrow sense heritability (h2)
and is a measure of the proportion of the genetic variance out of the total phenotypic
variance present in a population. It shows the degree to which offspring can be expected to
resemble their parents for a specific trait (Ma-Teresa et al. 1994; Sleper and Poehlman
2006). When breeding clonally propagated species such as sweetpotato in which both
additive and non-additive gene actions are fixed and transferred from parent to offspring,
broad sense heritability is useful. However, in half sib families of sexually propagated crops,
heritability in the narrow sense is important because alleles responsible for non-additive
genetic variations are not fully recovered due to reshuffling of genes (Sleper and Poehlman
2006). Selection of traits with low heritability could be enhanced through the use of
controlled screening methods or controlled environments, molecular markers or selection
based on breeding values (Gasura et al. 2010). Ma-Teresa et al. (1994) reported that the
heritability of dry matter content in sweetpotato was 75 -88% while Jones el al. (1986) and
Lebot (2009) reported heritability levels for weight of storage roots of 61% for families and
59% for parentals (Jones et al. 1986; Lebot 2009).
112
Genetic studies in sweetpotato are limited due to self- and cross-incompatibility, high level of
polyploidy and limited flowering ability and seed setting (Lin et al. 2007). Knowledge of the
genetics of sweetpotato traits is helpful for efficient selection and breeding. Development of
sweetpotato varieties with complementary traits to satisfy the food demand and changing
end-users’ preferences is dependent up on information on the genetic attributes of parents
and progenies. This, in turn, depends on the magnitude and direction of genetic effects on
traits of economic interest. Therefore, the objective of this study was to determine general
combining ability (GCA), specific combining ability (SCA), maternal effects and heritability of
drought tolerance, yield and yield components of newly developed sweetpotato clones.
5.2 Material and methods
5.2.1 Plant materials
Twelve selected sweetpotato genotypes described in Table 5.1 were included in the study to
generate new genetic combinations. The parents were selected based on field, in-vitro and
greenhouse evaluations aiming at flowering ability, yield potential, dry matter content of
storage root or drought tolerance (Rukundo et al. 2015).
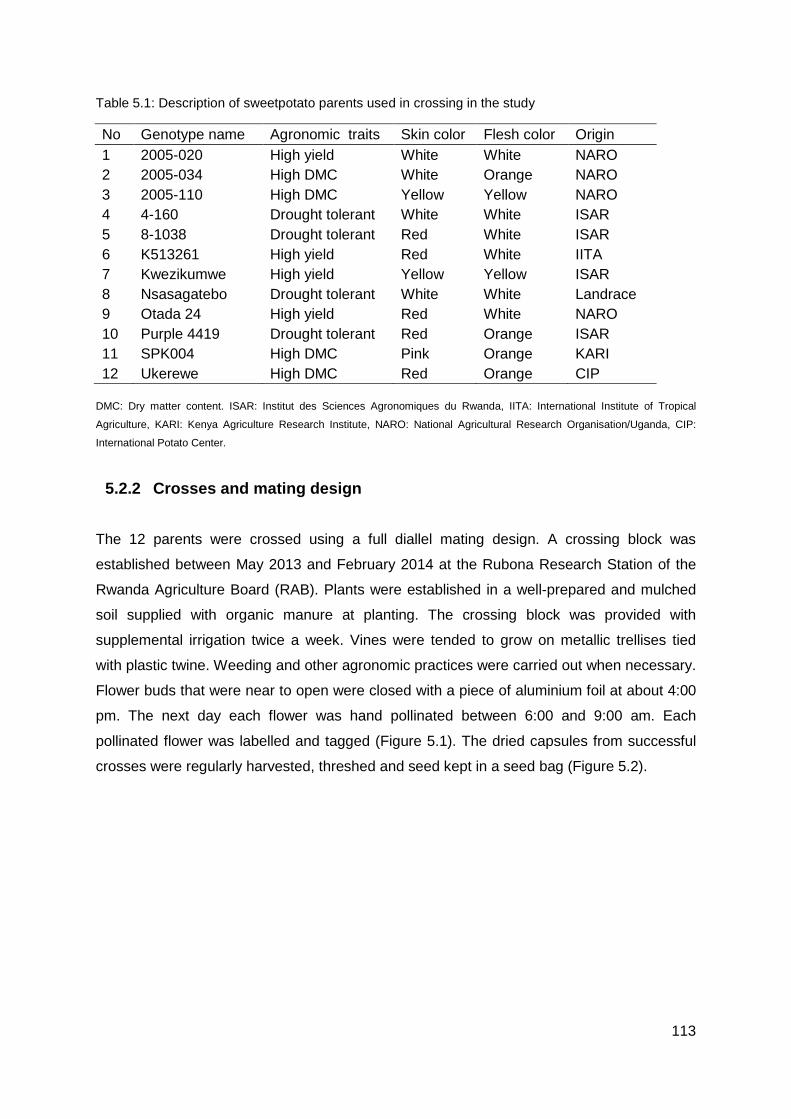
113
Table 5.1: Description of sweetpotato parents used in crossing in the study
No Genotype name Agronomic traits Skin color Flesh color Origin 1 2005-020 High yield White White NARO
2 2005-034 High DMC White Orange NARO
3 2005-110 High DMC Yellow Yellow NARO
4 4-160 Drought tolerant White White ISAR
5 8-1038 Drought tolerant Red White ISAR
6 K513261 High yield Red White IITA
7 Kwezikumwe High yield Yellow Yellow ISAR
8 Nsasagatebo Drought tolerant White White Landrace
9 Otada 24 High yield Red White NARO
10 Purple 4419 Drought tolerant Red Orange ISAR
11 SPK004 High DMC Pink Orange KARI 12 Ukerewe High DMC Red Orange CIP
DMC: Dry matter content. ISAR: Institut des Sciences Agronomiques du Rwanda, IITA: International Institute of Tropical
Agriculture, KARI: Kenya Agriculture Research Institute, NARO: National Agricultural Research Organisation/Uganda, CIP:
International Potato Center.
5.2.2 Crosses and mating design
The 12 parents were crossed using a full diallel mating design. A crossing block was
established between May 2013 and February 2014 at the Rubona Research Station of the
Rwanda Agriculture Board (RAB). Plants were established in a well-prepared and mulched
soil supplied with organic manure at planting. The crossing block was provided with
supplemental irrigation twice a week. Vines were tended to grow on metallic trellises tied
with plastic twine. Weeding and other agronomic practices were carried out when necessary.
Flower buds that were near to open were closed with a piece of aluminium foil at about 4:00
pm. The next day each flower was hand pollinated between 6:00 and 9:00 am. Each
pollinated flower was labelled and tagged (Figure 5.1). The dried capsules from successful
crosses were regularly harvested, threshed and seed kept in a seed bag (Figure 5.2).
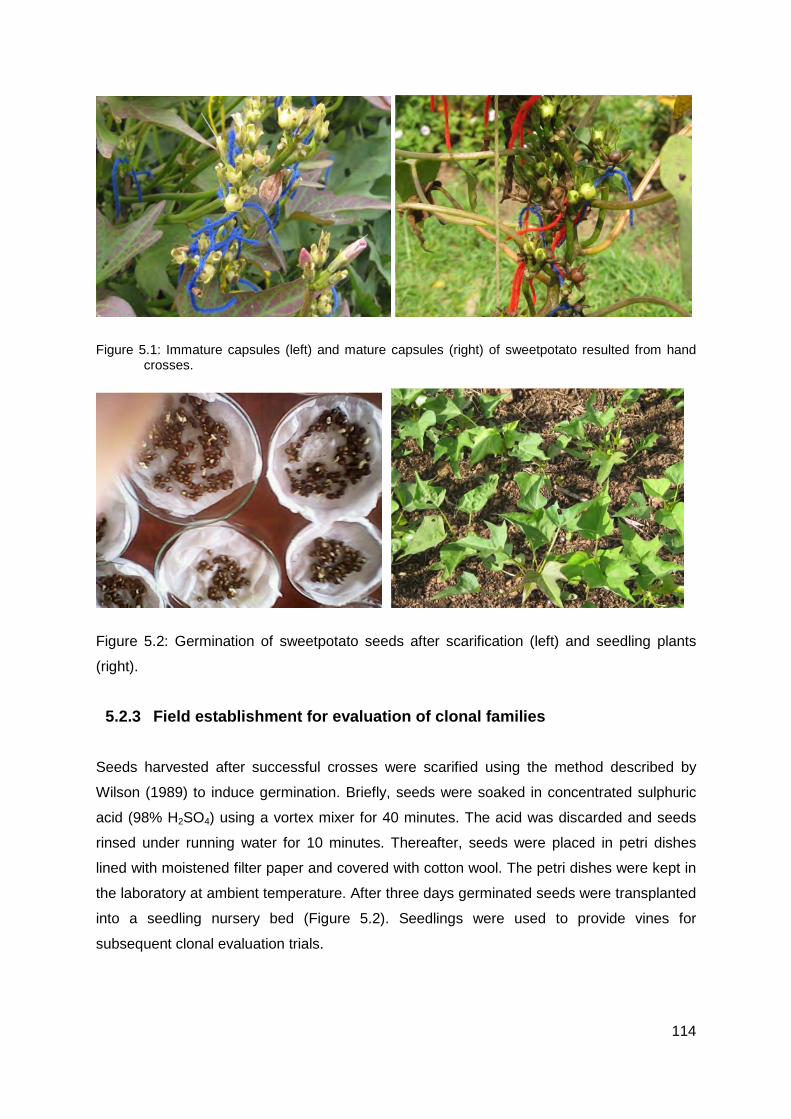
114
Figure 5.1: Immature capsules (left) and mature capsules (right) of sweetpotato resulted from hand crosses.
Figure 5.2: Germination of sweetpotato seeds after scarification (left) and seedling plants
(right).
5.2.3 Field establishment for evaluation of clonal families
Seeds harvested after successful crosses were scarified using the method described by
Wilson (1989) to induce germination. Briefly, seeds were soaked in concentrated sulphuric
acid (98% H2SO4) using a vortex mixer for 40 minutes. The acid was discarded and seeds
rinsed under running water for 10 minutes. Thereafter, seeds were placed in petri dishes
lined with moistened filter paper and covered with cotton wool. The petri dishes were kept in
the laboratory at ambient temperature. After three days germinated seeds were transplanted
into a seedling nursery bed (Figure 5.2). Seedlings were used to provide vines for
subsequent clonal evaluation trials.
115
Field trials were established in September 2014 at the Karama, Masoro and Rubona
Research Stations of RAB. The climate and soil description of the sites are summarised in
Table 5.2. Vine cuttings from 64 families (56 successful crosses and 8 parents) were planted
in the field using an alpha lattice design with three replications. Cuttings with 4 to 5 nodes
were planted with inter-row spacing of 80 cm and intra-row spacing of 50 cm. Experimental
plots were bordered by growing two rows of a sweetpotato variety NASPOT 9 O. Weeding
was carried out as required and no fertiliser and pesticide were applied. Harvesting was
carried out 135 days after planting.
Table 5.2: Geographic location, soil characteristics and rainfall of the Karama, Masoro and
Rubona Research Stations sites in Rwanda.
Parameters Description Karama Masoro Rubona
Geographic coordinates
Latitude S02o16’46.5’’ S01o55’40.0” S02o29’03.2’’
Longitude E030o16’06.2’’ E030o10’04.0” E029o45’58.2’’
Altitude (m) 1330 1482 1673
Soil Types Sandy and clay
soils Clay and kaolin
soils Clay and kaolin
soils
Temperature (oC) Minimum 17.2 15.7 13.4
Maximum 28.4 27.1 26.9
Rain fall (mm) Sept 2014- Feb 2015 567.9 722.4 804.3
5.2.4 Data collection
5.2.4.1 Success rate of crosses
The number of successful crosses carried out was recorded periodically and during
harvesting. These data were used to determine success rate of crosses and compatibility
between the selected parents. The mean number of viable seeds per capsule was recorded.
The percentage of seed germination was determined after seed scarification.
5.2.4.2 Agronomic data
Drought tolerance among clonal families and parents were assessed using canopy
temperature (CT) measured with an infrared thermometer (Major Tech, MT694) and canopy
wilting (CW) data collected at the Karama site. CT and WT were recorded during sunny days
between 12h00 and 15h00. CT was rated using a 1 to 5 scale where, score 1: no wilting, 2:
few top leaves showed wilting, 3: half of the leaves showed wilting, 4: severe wilting, about
75 % of the leaves showed wilting and 5: severely wilted and plant death (Blum 2002). Fresh
weight of storage root and vine yields, skin and flesh characteristics of storage root were
116
recorded using the standard descriptors developed by CIP (Huamán 1999). Furthermore, the
dry matter content (DMC) was determined following the methods described by Carey and
Reynoso (1996) and Tairo et al. (2008) with minor modifications. Briefly, two samples of 50
to 60 g were collected from the biggest, healthy storage roots of each clone and kept in a
paper bag. These samples were dried in an oven at 70oC for 72 hours. Dried samples were
weighed with an analytical balance and the dry matter content was determined using the
formula: Dry matter content (DM) % = [(Dry weight/Fresh weight) x 100].
5.2.5 Data analysis
5.2.5.1 Success rate of crosses, number of seeds per capsule and germination
The success rate (%) of crosses was determined as a ratio of number of harvested seed
capsules per total number of crosses carried out. The number of seeds per capsule was
determined and averaged for each family. The germination rate was determined as the ratio
of germinated seed to total number of seed scarified and planted for each family.
5.2.5.2 Analysis of variance
Plot yield data of storage root, vine and total biomass were converted to t ha-1. Data on yield,
dry matter content of storage root and leaf temperatures were subjected to analysis of
variance using the GLM procedure of the SAS 9.2 statistical program (SAS Institute, 2004).
When significant differences were detected, means were separated using the LSD test
procedure at the 5% significance level (Cochran and Cox 1992). The qualitative data of leaf
wilting, skin colour and fresh colour were analysed using the non-parametric Krusal-Wallis
test procedure of the SPSS computer package (PASW statistics 18.0) (SPSS 2006).
5.2.5.3 Estimation of general and specific combining ability effects and heritability
Analysis of variance was performed using the DIALLEL-SAS05 program (Zhang et al. 2005)
to identify the significant level of general combining ability (GCA) of parents and specific
combining ability (SCA) of crosses. The diallel analysis was performed using Griffing’s
(1956) Method 1 Model 2, with the genetic statistical model of:
Yij= µ+ gi +gj + sij + rij + bk +eijkl
Where: Yij = observed value of the cross between parent i and j; µ = overall mean; gi = GCA
effect of parent i; gj = GCA effect of parent j; sij = SCA of the cross between parents i and j;
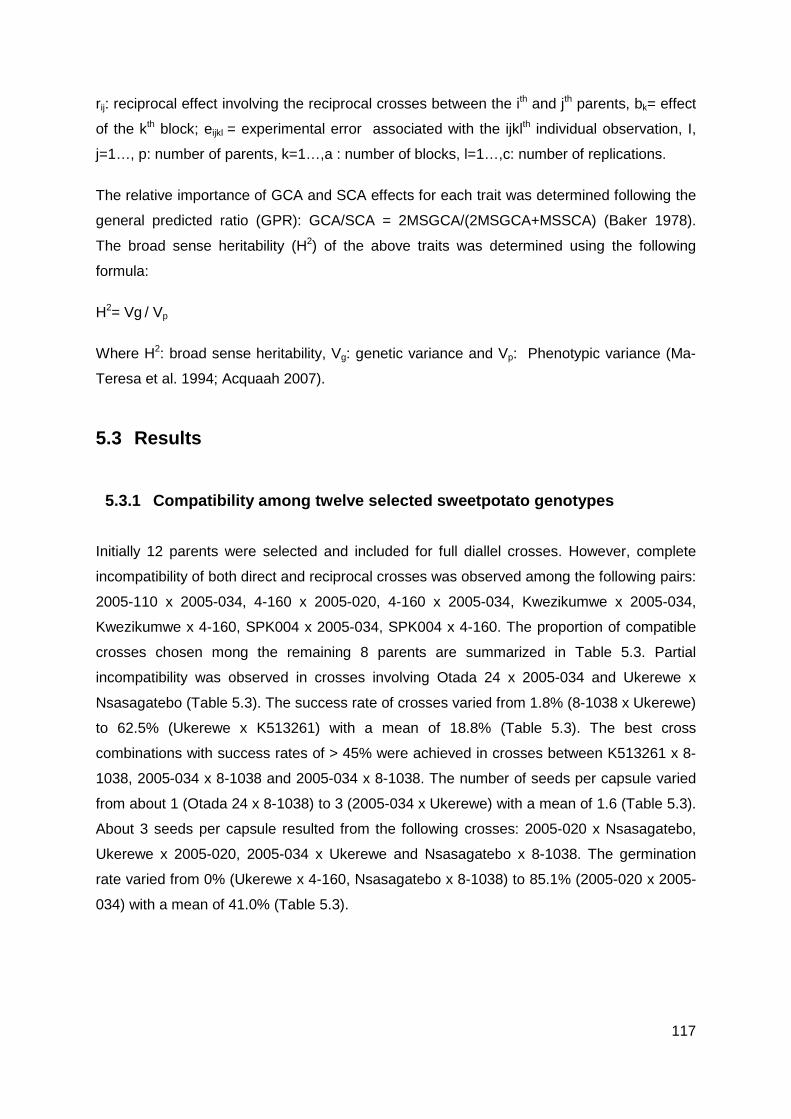
117
rij: reciprocal effect involving the reciprocal crosses between the ith and jth parents, bk= effect
of the kth block; eijkl = experimental error associated with the ijklth individual observation, I,
j=1…, p: number of parents, k=1…,a : number of blocks, l=1…,c: number of replications.
The relative importance of GCA and SCA effects for each trait was determined following the
general predicted ratio (GPR): GCA/SCA = 2MSGCA/(2MSGCA+MSSCA) (Baker 1978).
The broad sense heritability (H2) of the above traits was determined using the following
formula:
H2= Vg / Vp
Where H2: broad sense heritability, Vg: genetic variance and Vp: Phenotypic variance (Ma-
Teresa et al. 1994; Acquaah 2007).
5.3 Results
5.3.1 Compatibility among twelve selected sweetpotato genotypes
Initially 12 parents were selected and included for full diallel crosses. However, complete
incompatibility of both direct and reciprocal crosses was observed among the following pairs:
2005-110 x 2005-034, 4-160 x 2005-020, 4-160 x 2005-034, Kwezikumwe x 2005-034,
Kwezikumwe x 4-160, SPK004 x 2005-034, SPK004 x 4-160. The proportion of compatible
crosses chosen mong the remaining 8 parents are summarized in Table 5.3. Partial
incompatibility was observed in crosses involving Otada 24 x 2005-034 and Ukerewe x
Nsasagatebo (Table 5.3). The success rate of crosses varied from 1.8% (8-1038 x Ukerewe)
to 62.5% (Ukerewe x K513261) with a mean of 18.8% (Table 5.3). The best cross
combinations with success rates of > 45% were achieved in crosses between K513261 x 8-
1038, 2005-034 x 8-1038 and 2005-034 x 8-1038. The number of seeds per capsule varied
from about 1 (Otada 24 x 8-1038) to 3 (2005-034 x Ukerewe) with a mean of 1.6 (Table 5.3).
About 3 seeds per capsule resulted from the following crosses: 2005-020 x Nsasagatebo,
Ukerewe x 2005-020, 2005-034 x Ukerewe and Nsasagatebo x 8-1038. The germination
rate varied from 0% (Ukerewe x 4-160, Nsasagatebo x 8-1038) to 85.1% (2005-020 x 2005-
034) with a mean of 41.0% (Table 5.3).
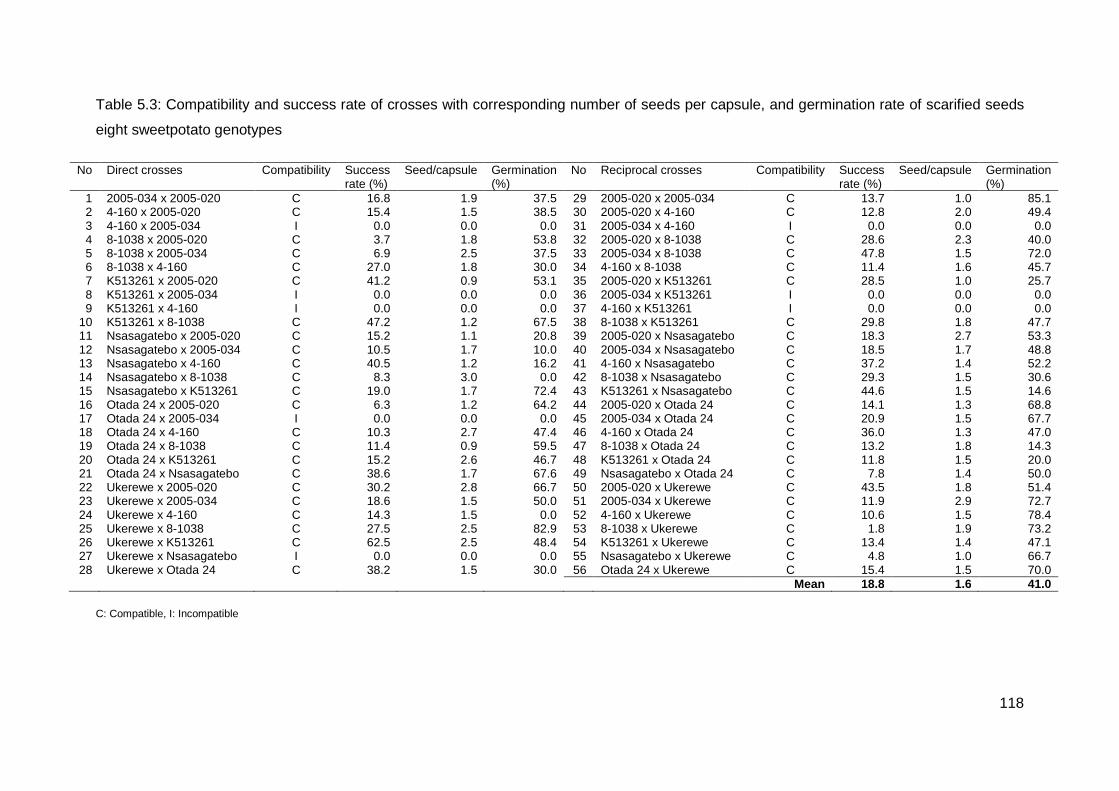
118
Table 5.3: Compatibility and success rate of crosses with corresponding number of seeds per capsule, and germination rate of scarified seeds
eight sweetpotato genotypes
No Direct crosses Compatibility Success rate (%)
Seed/capsule Germination (%)
No Reciprocal crosses Compatibility Success rate (%)
Seed/capsule Germination (%)
1 2005-034 x 2005-020 C 16.8 1.9 37.5 29 2005-020 x 2005-034 C 13.7 1.0 85.1 2 4-160 x 2005-020 C 15.4 1.5 38.5 30 2005-020 x 4-160 C 12.8 2.0 49.4 3 4-160 x 2005-034 I 0.0 0.0 0.0 31 2005-034 x 4-160 I 0.0 0.0 0.0 4 8-1038 x 2005-020 C 3.7 1.8 53.8 32 2005-020 x 8-1038 C 28.6 2.3 40.0 5 8-1038 x 2005-034 C 6.9 2.5 37.5 33 2005-034 x 8-1038 C 47.8 1.5 72.0 6 8-1038 x 4-160 C 27.0 1.8 30.0 34 4-160 x 8-1038 C 11.4 1.6 45.7 7 K513261 x 2005-020 C 41.2 0.9 53.1 35 2005-020 x K513261 C 28.5 1.0 25.7 8 K513261 x 2005-034 I 0.0 0.0 0.0 36 2005-034 x K513261 I 0.0 0.0 0.0 9 K513261 x 4-160 I 0.0 0.0 0.0 37 4-160 x K513261 I 0.0 0.0 0.0
10 K513261 x 8-1038 C 47.2 1.2 67.5 38 8-1038 x K513261 C 29.8 1.8 47.7 11 Nsasagatebo x 2005-020 C 15.2 1.1 20.8 39 2005-020 x Nsasagatebo C 18.3 2.7 53.3 12 Nsasagatebo x 2005-034 C 10.5 1.7 10.0 40 2005-034 x Nsasagatebo C 18.5 1.7 48.8 13 Nsasagatebo x 4-160 C 40.5 1.2 16.2 41 4-160 x Nsasagatebo C 37.2 1.4 52.2 14 Nsasagatebo x 8-1038 C 8.3 3.0 0.0 42 8-1038 x Nsasagatebo C 29.3 1.5 30.6 15 Nsasagatebo x K513261 C 19.0 1.7 72.4 43 K513261 x Nsasagatebo C 44.6 1.5 14.6 16 Otada 24 x 2005-020 C 6.3 1.2 64.2 44 2005-020 x Otada 24 C 14.1 1.3 68.8 17 Otada 24 x 2005-034 I 0.0 0.0 0.0 45 2005-034 x Otada 24 C 20.9 1.5 67.7 18 Otada 24 x 4-160 C 10.3 2.7 47.4 46 4-160 x Otada 24 C 36.0 1.3 47.0 19 Otada 24 x 8-1038 C 11.4 0.9 59.5 47 8-1038 x Otada 24 C 13.2 1.8 14.3 20 Otada 24 x K513261 C 15.2 2.6 46.7 48 K513261 x Otada 24 C 11.8 1.5 20.0 21 Otada 24 x Nsasagatebo C 38.6 1.7 67.6 49 Nsasagatebo x Otada 24 C 7.8 1.4 50.0 22 Ukerewe x 2005-020 C 30.2 2.8 66.7 50 2005-020 x Ukerewe C 43.5 1.8 51.4 23 Ukerewe x 2005-034 C 18.6 1.5 50.0 51 2005-034 x Ukerewe C 11.9 2.9 72.7 24 Ukerewe x 4-160 C 14.3 1.5 0.0 52 4-160 x Ukerewe C 10.6 1.5 78.4 25 Ukerewe x 8-1038 C 27.5 2.5 82.9 53 8-1038 x Ukerewe C 1.8 1.9 73.2 26 Ukerewe x K513261 C 62.5 2.5 48.4 54 K513261 x Ukerewe C 13.4 1.4 47.1 27 Ukerewe x Nsasagatebo I 0.0 0.0 0.0 55 Nsasagatebo x Ukerewe C 4.8 1.0 66.7 28 Ukerewe x Otada 24 C 38.2 1.5 30.0 56 Otada 24 x Ukerewe C 15.4 1.5 70.0 Mean 18.8 1.6 41.0
C: Compatible, I: Incompatible
119
5.3.2 Analysis of variance
A separate analysis of variance of each site showed significant differences among tested
families for all parameters measured (data not presented). The combined analysis of
variance revealed significant interactions (P≤0.01) of family by site effects for storage root
and vine yields, total biomass, and dry matter content of storage roots. A non-significant
family by site interaction effect was detected for skin and flesh color of storage roots (Table
5.4). The family effects were significant (P≤ 0.01) for all parameters evaluated (Table 5.4).
The effects of sites were significantly different at P≤0.05 for storage root and vine yields,
total biomass, and dry matter content (Table 5.4). Overall, the family effects made a more
significant contribution to the total variability than sites, and family by sites effects as shown
by its having the highest sum of squares for all evaluated traits (Table 5.4). Broad sense
heritability (H2) values of 0.95, 0.84 0.68, 0.47, 0.74, 0.50, 0.58 and 0.75 were estimated for
canopy temperature, canopy wilting, storage root yield, skin colour, flesh colour, yield of
vine, total biomass and dry matter content, respectively (Table 5.4).
Table 5.4: Mean squares and significant tests summarized from a combined analysis of variance of canopy temperature, canopy wilting, yield of storage roots, skin and flesh color, yield of vines, total biomass and dry matter content of storage roots of 64 sweetpotato clones evaluated at three sites in Rwanda
Source of
variation DF
Traits and mean squares
CT CW
Storage
root Skin color
Flesh
color Vine yield Biomass DMC
Site 2 64.68** 51.82** 606.98* 186.1 ns 2.08 ns 59597.94** 65617.55** 3214.97**
Rep (Site) 6 62.28ns 4.47 ns 577.78 ns 83.57 ns 1.01 ns 3160.25 ns 5428.14 545.08**
Family 63 31658.56** 982.45** 20534.25** 1456.59** 231.31** 174857.82** 286096.53** 76232.05**
Site x Family 126 1428.54 ns 129.61 ns 8274.97** 1267.96
ns 21.98 ns 114054.01** 134981.53** 22069.69**
H2 0.95 0.84 0.68 0.47 0.74 0.50 0.58 0.75
DF: degree of freedom, CT: canopy temperature, CW: canopy wilting, H2: broad sense heritability, DMC: Dry
matter content, **: Significant at p<0.01, *: Significant at p<0.05, ns: not significant).
120
5.3.3 Field performance of families and parents
5.3.3.1 Canopy temperature and wilting
Experimental clones that showed the lowest CT (< 20oC) were 4-160 x Ukerewe, 4-160 x
Nsasagatebo, 8-1038 x 4-160, 4-160 x 8-1038, 8-1038 x 2005-020 and Nsasagatebo x
Ukerewe. These clones had CT values of 18.9, 19.2, 19.3, 19.4, 19.7 and 19.8 oC,
respectively (Table 5.5). The parental genotypes Nsasagatebo, 4-160 and 8-1038 selected
for their known drought tolerance, ranked among the best ten with the lowest CT values
measured at 17.8, 18.2 and 18.4 oC, in that order (Table 5.5). The lowest CW values of 0.9,
1.1, 1.2, 1.3, 1.4, and 1.50 were observed in the following crosses: 4-160 x Nsasagatebo, 4-
160 x Ukerewe, Nsasagatebo x 2005-020, Otada 24 x Nsasagatebo, 4-160 x K513261 and
K513261 x 4-160, respectively (Table 5). Among the parents, Nsasagatebo showed the
lowest CW (1.1), followed by 4-160 (1.5) and 8-1038 (1.6). High levels of CW of 4.0 to 4.3
were found in the families Otada 24 x 2005-020, 2005-034 x Nsasagatebo, Nsasagatebo x
2005-034 and 2005-020 x K513261 (Table 5.5).
5.3.3.2 Storage root yields
The highest overall mean storage root yield of 6.9 t ha-1 was observed at Rubona site
followed by the Karama and Masoro sites with 6.5 and 4.5 t ha-1, respectively (Table 5.5). At
the Karama site, the five families showing the highest yields of storage roots were
Nsasagatebo x Otada 24 (18.9 t ha-1), K513261 x Nsasagatebo (16.8 t ha-1), K513261 x
2005-034 (11.9 t ha-1), Otada 24 x 4-160 (10.4 t ha-1) and Ukerewe x 8-1038 (9.9 t ha-1). The
best yielding families at Masoro were 8-1038 x K513261 (13.3 t ha-1), Ukerewe x K513261
(10.4 t ha-1), Nsasagatebo x Otada 24 (9.8 t ha-1), K513261 x Otada 24 (8.4 t ha-1), and
Ukerewe x Otada 24 (7.9 t ha-1) (Table 5.5). At the Rubona site, the best five families for
storage root yield were Otada 24 x Ukerewe (17.6 t ha-1), 4-160 x Nsasagatebo (17.3 t ha-1),
Nsasagatebo x 8-1038 (16.8 t ha-1), K513261 x 2005-034 (13.6 t ha-1) and 2005-020 x
Ukerewe (13.5 t ha-1) (Table 5.5). Across the three sites, the best five families for storage
root yield were Nsasagatebo x Otada 24, Otada 24 x Ukerewe, 4-160 x Nsasagatebo,
K513261 x 2005-034 and Ukerewe x K513261 with yield of 11.0, 9.7, 9.3, 9.2 and 8.6 t ha-1,
respectively (Table 5.5). The parental genotypes used in these crosses exhibited mean
storage root yields of 7.7 to 23.3 t ha-1. The parents, 8-1038 and Ukerewe were the best
yielders producing 23.3 and 21.5 t ha-1, respectively (Table 5.5).
121
5.3.3.3 Dry matter content of storage root
Comparatively, the highest mean dry matter content of storage root (28.1%) was recorded at
the Rubona site. At Masoro, the mean DMC was 26.0% while Karama had 22.4% (Table
5.5). At the Karama site, families such as Ukerewe x 2005-034, 4-160 x Nsasagatebo, Otada
24 x 4-160, K513261 x 2005-034, 8-1038 x 4-160 generated the highest DMC values of
35.8, 34.5, 34.4, 33.8 and 32.9 %, respectively (Table 5.5). The best DMC of 40.6, 39.8,
38.9, 38.4, 37.8 % were observed at the Masoro site in the families of 8-1038 x K513261,
2005-034 x Otada 24, Ukerewe x 2005-034, Ukerewe x Otada 24 and 4-160 x Nsasagatebo,
respectively (Table 5.5). At Rubona site, the best five families were K513261 x Nsasagatebo
(37.4%), Nsasagatebo x 8-1038 (37.2%), 8-1038 x K513261 (36.7%), Nsasagatebo x 2005-
034 (35.5%) and Nsasagatebo x Ukerewe (35.3%) (Table 5.5). Across all the study sites, the
five best performing families were 8-1038 x K513261, Nsasagatebo x 8-1038, Otada 24 x 4-
160, Nsasagatebo x Ukerewe and 4-160 x Nsasagatebo with DMC values of 37.5, 37.2,
35.7, 35.3 and 35.1%, respectively (Table 5). Overall, the parental clones Ukerewe, 2005-
034, Nsasagatebo, Otada 24, 4-160, K513261, 2005-020 and 8-1038 displayed high DMC
values of 37.3, 35.8, 35.8, 35.1, 34.4, 34.0, 31.9 and 30.2%, respectively (Table 5.5).
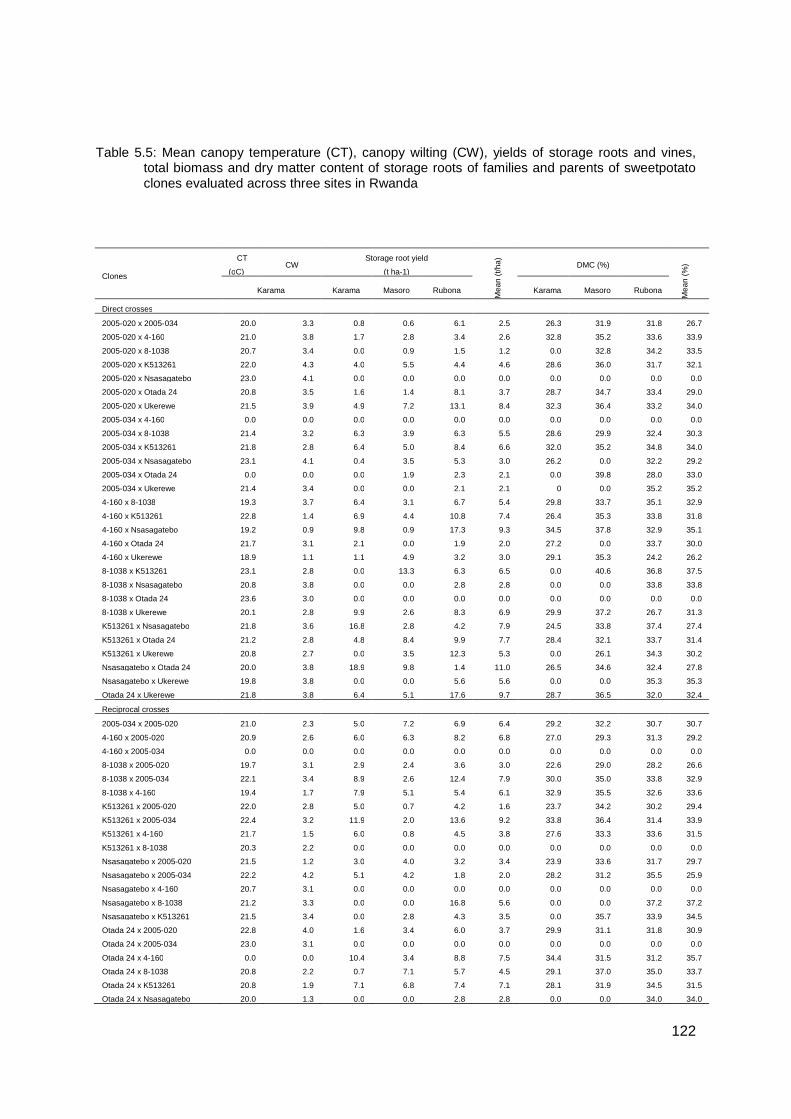
122
Table 5.5: Mean canopy temperature (CT), canopy wilting (CW), yields of storage roots and vines, total biomass and dry matter content of storage roots of families and parents of sweetpotato clones evaluated across three sites in Rwanda
Clones
CT
(oC) CW
Storage root yield
(t ha-1)
Mea
n (t
/ha)
DMC (%)
Mea
n (%
)
Karama Karama Masoro Rubona Karama Masoro Rubona
Direct crosses
2005-020 x 2005-034 20.0 3.3 0.8 0.6 6.1 2.5 26.3 31.9 31.8 26.7
2005-020 x 4-160 21.0 3.8 1.7 2.8 3.4 2.6 32.8 35.2 33.6 33.9
2005-020 x 8-1038 20.7 3.4 0.0 0.9 1.5 1.2 0.0 32.8 34.2 33.5
2005-020 x K513261 22.0 4.3 4.0 5.5 4.4 4.6 28.6 36.0 31.7 32.1
2005-020 x Nsasagatebo 23.0 4.1 0.0 0.0 0.0 0.0 0.0 0.0 0.0 0.0
2005-020 x Otada 24 20.8 3.5 1.6 1.4 8.1 3.7 28.7 34.7 33.4 29.0
2005-020 x Ukerewe 21.5 3.9 4.9 7.2 13.1 8.4 32.3 36.4 33.2 34.0
2005-034 x 4-160 0.0 0.0 0.0 0.0 0.0 0.0 0.0 0.0 0.0 0.0
2005-034 x 8-1038 21.4 3.2 6.3 3.9 6.3 5.5 28.6 29.9 32.4 30.3
2005-034 x K513261 21.8 2.8 6.4 5.0 8.4 6.6 32.0 35.2 34.8 34.0
2005-034 x Nsasagatebo 23.1 4.1 0.4 3.5 5.3 3.0 26.2 0.0 32.2 29.2
2005-034 x Otada 24 0.0 0.0 0.0 1.9 2.3 2.1 0.0 39.8 28.0 33.0
2005-034 x Ukerewe 21.4 3.4 0.0 0.0 2.1 2.1 0 0.0 35.2 35.2
4-160 x 8-1038 19.3 3.7 6.4 3.1 6.7 5.4 29.8 33.7 35.1 32.9
4-160 x K513261 22.8 1.4 6.9 4.4 10.8 7.4 26.4 35.3 33.8 31.8
4-160 x Nsasagatebo 19.2 0.9 9.8 0.9 17.3 9.3 34.5 37.8 32.9 35.1
4-160 x Otada 24 21.7 3.1 2.1 0.0 1.9 2.0 27.2 0.0 33.7 30.0
4-160 x Ukerewe 18.9 1.1 1.1 4.9 3.2 3.0 29.1 35.3 24.2 26.2
8-1038 x K513261 23.1 2.8 0.0 13.3 6.3 6.5 0.0 40.6 36.8 37.5
8-1038 x Nsasagatebo 20.8 3.8 0.0 0.0 2.8 2.8 0.0 0.0 33.8 33.8
8-1038 x Otada 24 23.6 3.0 0.0 0.0 0.0 0.0 0.0 0.0 0.0 0.0
8-1038 x Ukerewe 20.1 2.8 9.9 2.6 8.3 6.9 29.9 37.2 26.7 31.3
K513261 x Nsasagatebo 21.8 3.6 16.8 2.8 4.2 7.9 24.5 33.8 37.4 27.4
K513261 x Otada 24 21.2 2.8 4.8 8.4 9.9 7.7 28.4 32.1 33.7 31.4
K513261 x Ukerewe 20.8 2.7 0.0 3.5 12.3 5.3 0.0 26.1 34.3 30.2
Nsasagatebo x Otada 24 20.0 3.8 18.9 9.8 1.4 11.0 26.5 34.6 32.4 27.8
Nsasagatebo x Ukerewe 19.8 3.8 0.0 0.0 5.6 5.6 0.0 0.0 35.3 35.3
Otada 24 x Ukerewe 21.8 3.8 6.4 5.1 17.6 9.7 28.7 36.5 32.0 32.4
Reciprocal crosses
2005-034 x 2005-020 21.0 2.3 5.0 7.2 6.9 6.4 29.2 32.2 30.7 30.7
4-160 x 2005-020 20.9 2.6 6.0 6.3 8.2 6.8 27.0 29.3 31.3 29.2
4-160 x 2005-034 0.0 0.0 0.0 0.0 0.0 0.0 0.0 0.0 0.0 0.0
8-1038 x 2005-020 19.7 3.1 2.9 2.4 3.6 3.0 22.6 29.0 28.2 26.6
8-1038 x 2005-034 22.1 3.4 8.9 2.6 12.4 7.9 30.0 35.0 33.8 32.9
8-1038 x 4-160 19.4 1.7 7.9 5.1 5.4 6.1 32.9 35.5 32.6 33.6
K513261 x 2005-020 22.0 2.8 5.0 0.7 4.2 1.6 23.7 34.2 30.2 29.4
K513261 x 2005-034 22.4 3.2 11.9 2.0 13.6 9.2 33.8 36.4 31.4 33.9
K513261 x 4-160 21.7 1.5 6.0 0.8 4.5 3.8 27.6 33.3 33.6 31.5
K513261 x 8-1038 20.3 2.2 0.0 0.0 0.0 0.0 0.0 0.0 0.0 0.0
Nsasagatebo x 2005-020 21.5 1.2 3.0 4.0 3.2 3.4 23.9 33.6 31.7 29.7
Nsasagatebo x 2005-034 22.2 4.2 5.1 4.2 1.8 2.0 28.2 31.2 35.5 25.9
Nsasagatebo x 4-160 20.7 3.1 0.0 0.0 0.0 0.0 0.0 0.0 0.0 0.0
Nsasagatebo x 8-1038 21.2 3.3 0.0 0.0 16.8 5.6 0.0 0.0 37.2 37.2
Nsasagatebo x K513261 21.5 3.4 0.0 2.8 4.3 3.5 0.0 35.7 33.9 34.5
Otada 24 x 2005-020 22.8 4.0 1.6 3.4 6.0 3.7 29.9 31.1 31.8 30.9
Otada 24 x 2005-034 23.0 3.1 0.0 0.0 0.0 0.0 0.0 0.0 0.0 0.0
Otada 24 x 4-160 0.0 0.0 10.4 3.4 8.8 7.5 34.4 31.5 31.2 35.7
Otada 24 x 8-1038 20.8 2.2 0.7 7.1 5.7 4.5 29.1 37.0 35.0 33.7
Otada 24 x K513261 20.8 1.9 7.1 6.8 7.4 7.1 28.1 31.9 34.5 31.5
Otada 24 x Nsasagatebo 20.0 1.3 0.0 0.0 2.8 2.8 0.0 0.0 34.0 34.0
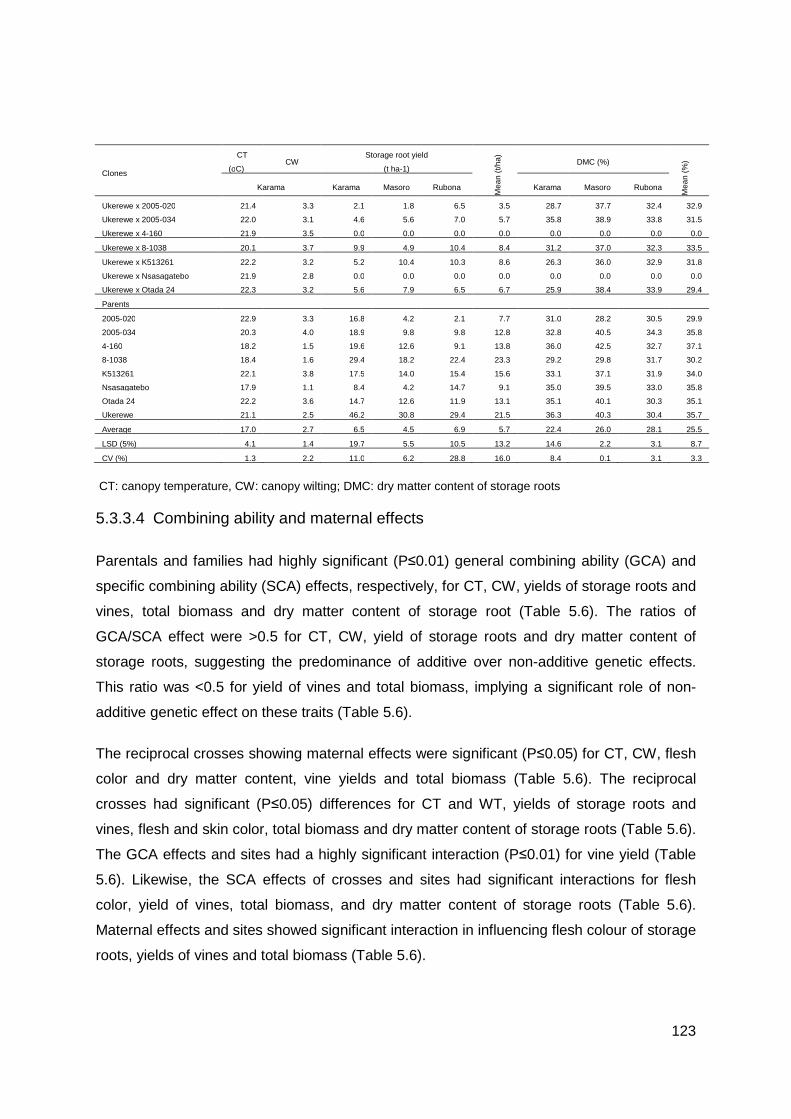
123
Clones
CT
(oC) CW
Storage root yield
(t ha-1)
Mea
n (t
/ha)
DMC (%)
Mea
n (%
)
Karama Karama Masoro Rubona Karama Masoro Rubona
Ukerewe x 2005-020 21.4 3.3 2.1 1.8 6.5 3.5 28.7 37.7 32.4 32.9
Ukerewe x 2005-034 22.0 3.1 4.6 5.6 7.0 5.7 35.8 38.9 33.8 31.5
Ukerewe x 4-160 21.9 3.5 0.0 0.0 0.0 0.0 0.0 0.0 0.0 0.0
Ukerewe x 8-1038 20.1 3.7 9.9 4.9 10.4 8.4 31.2 37.0 32.3 33.5
Ukerewe x K513261 22.2 3.2 5.2 10.4 10.3 8.6 26.3 36.0 32.9 31.8
Ukerewe x Nsasagatebo 21.9 2.8 0.0 0.0 0.0 0.0 0.0 0.0 0.0 0.0
Ukerewe x Otada 24 22.3 3.2 5.6 7.9 6.5 6.7 25.9 38.4 33.9 29.4
Parents
2005-020 22.9 3.3 16.8 4.2 2.1 7.7 31.0 28.2 30.5 29.9
2005-034 20.3 4.0 18.9 9.8 9.8 12.8 32.8 40.5 34.3 35.8
4-160 18.2 1.5 19.6 12.6 9.1 13.8 36.0 42.5 32.7 37.1
8-1038 18.4 1.6 29.4 18.2 22.4 23.3 29.2 29.8 31.7 30.2
K513261 22.1 3.8 17.5 14.0 15.4 15.6 33.1 37.1 31.9 34.0
Nsasagatebo 17.9 1.1 8.4 4.2 14.7 9.1 35.0 39.5 33.0 35.8
Otada 24 22.2 3.6 14.7 12.6 11.9 13.1 35.1 40.1 30.3 35.1
Ukerewe 21.1 2.5 46.2 30.8 29.4 21.5 36.3 40.3 30.4 35.7
Average 17.0 2.7 6.5 4.5 6.9 5.7 22.4 26.0 28.1 25.5
LSD (5%) 4.1 1.4 19.7 5.5 10.5 13.2 14.6 2.2 3.1 8.7
CV (%) 1.3 2.2 11.0 6.2 28.8 16.0 8.4 0.1 3.1 3.3
CT: canopy temperature, CW: canopy wilting; DMC: dry matter content of storage roots
5.3.3.4 Combining ability and maternal effects
Parentals and families had highly significant (P≤0.01) general combining ability (GCA) and
specific combining ability (SCA) effects, respectively, for CT, CW, yields of storage roots and
vines, total biomass and dry matter content of storage root (Table 5.6). The ratios of
GCA/SCA effect were >0.5 for CT, CW, yield of storage roots and dry matter content of
storage roots, suggesting the predominance of additive over non-additive genetic effects.
This ratio was <0.5 for yield of vines and total biomass, implying a significant role of non-
additive genetic effect on these traits (Table 5.6).
The reciprocal crosses showing maternal effects were significant (P≤0.05) for CT, CW, flesh
color and dry matter content, vine yields and total biomass (Table 5.6). The reciprocal
crosses had significant (P≤0.05) differences for CT and WT, yields of storage roots and
vines, flesh and skin color, total biomass and dry matter content of storage roots (Table 5.6).
The GCA effects and sites had a highly significant interaction (P≤0.01) for vine yield (Table
5.6). Likewise, the SCA effects of crosses and sites had significant interactions for flesh
color, yield of vines, total biomass, and dry matter content of storage roots (Table 5.6).
Maternal effects and sites showed significant interaction in influencing flesh colour of storage
roots, yields of vines and total biomass (Table 5.6).
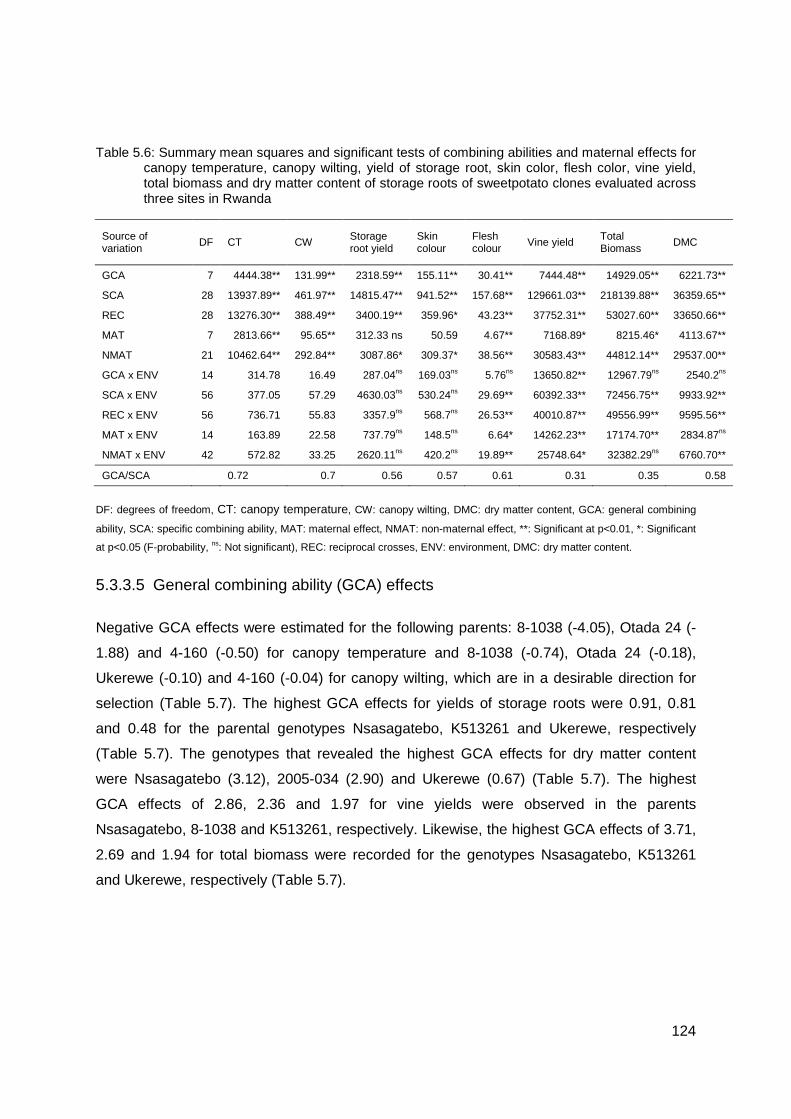
124
Table 5.6: Summary mean squares and significant tests of combining abilities and maternal effects for canopy temperature, canopy wilting, yield of storage root, skin color, flesh color, vine yield, total biomass and dry matter content of storage roots of sweetpotato clones evaluated across three sites in Rwanda
Source of variation
DF CT CW Storage root yield
Skin colour
Flesh colour
Vine yield Total Biomass
DMC
GCA 7 4444.38** 131.99** 2318.59** 155.11** 30.41** 7444.48** 14929.05** 6221.73**
SCA 28 13937.89** 461.97** 14815.47** 941.52** 157.68** 129661.03** 218139.88** 36359.65**
REC 28 13276.30** 388.49** 3400.19** 359.96* 43.23** 37752.31** 53027.60** 33650.66**
MAT 7 2813.66** 95.65** 312.33 ns 50.59 4.67** 7168.89* 8215.46* 4113.67**
NMAT 21 10462.64** 292.84** 3087.86* 309.37* 38.56** 30583.43** 44812.14** 29537.00**
GCA x ENV 14 314.78 16.49 287.04ns 169.03ns 5.76ns 13650.82** 12967.79ns 2540.2ns
SCA x ENV 56 377.05 57.29 4630.03ns 530.24ns 29.69** 60392.33** 72456.75** 9933.92**
REC x ENV 56 736.71 55.83 3357.9ns 568.7ns 26.53** 40010.87** 49556.99** 9595.56**
MAT x ENV 14 163.89 22.58 737.79ns 148.5ns 6.64* 14262.23** 17174.70** 2834.87ns
NMAT x ENV 42 572.82 33.25 2620.11ns 420.2ns 19.89** 25748.64* 32382.29ns 6760.70**
GCA/SCA 0.72 0.7 0.56 0.57 0.61 0.31 0.35 0.58
DF: degrees of freedom, CT: canopy temperature, CW: canopy wilting, DMC: dry matter content, GCA: general combining
ability, SCA: specific combining ability, MAT: maternal effect, NMAT: non-maternal effect, **: Significant at p<0.01, *: Significant
at p<0.05 (F-probability, ns: Not significant), REC: reciprocal crosses, ENV: environment, DMC: dry matter content.
5.3.3.5 General combining ability (GCA) effects
Negative GCA effects were estimated for the following parents: 8-1038 (-4.05), Otada 24 (-
1.88) and 4-160 (-0.50) for canopy temperature and 8-1038 (-0.74), Otada 24 (-0.18),
Ukerewe (-0.10) and 4-160 (-0.04) for canopy wilting, which are in a desirable direction for
selection (Table 5.7). The highest GCA effects for yields of storage roots were 0.91, 0.81
and 0.48 for the parental genotypes Nsasagatebo, K513261 and Ukerewe, respectively
(Table 5.7). The genotypes that revealed the highest GCA effects for dry matter content
were Nsasagatebo (3.12), 2005-034 (2.90) and Ukerewe (0.67) (Table 5.7). The highest
GCA effects of 2.86, 2.36 and 1.97 for vine yields were observed in the parents
Nsasagatebo, 8-1038 and K513261, respectively. Likewise, the highest GCA effects of 3.71,
2.69 and 1.94 for total biomass were recorded for the genotypes Nsasagatebo, K513261
and Ukerewe, respectively (Table 5.7).
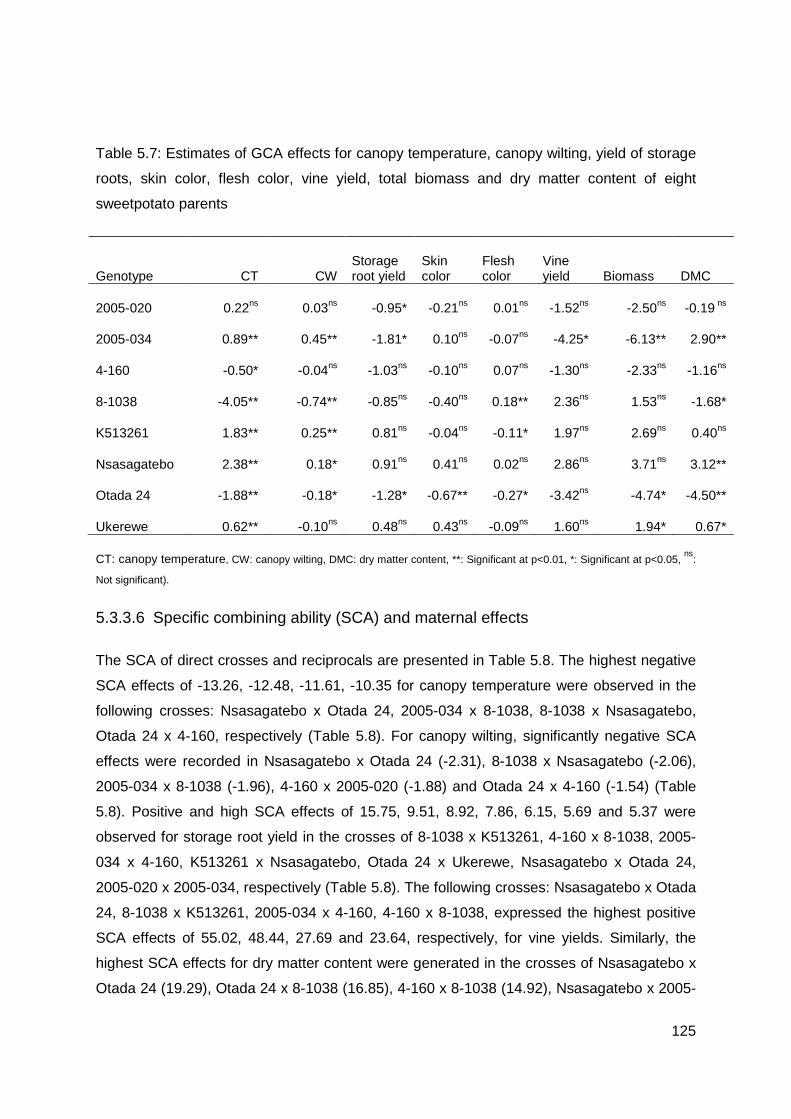
125
Table 5.7: Estimates of GCA effects for canopy temperature, canopy wilting, yield of storage
roots, skin color, flesh color, vine yield, total biomass and dry matter content of eight
sweetpotato parents
Genotype CT CW Storage root yield
Skin color
Flesh color
Vine yield Biomass DMC
2005-020 0.22ns 0.03ns -0.95* -0.21ns 0.01ns -1.52ns -2.50ns -0.19 ns
2005-034 0.89** 0.45** -1.81* 0.10ns -0.07ns -4.25* -6.13** 2.90**
4-160 -0.50* -0.04ns -1.03ns -0.10ns 0.07ns -1.30ns -2.33ns -1.16ns
8-1038 -4.05** -0.74** -0.85ns -0.40ns 0.18** 2.36ns 1.53ns -1.68*
K513261 1.83** 0.25** 0.81ns -0.04ns -0.11* 1.97ns 2.69ns 0.40ns
Nsasagatebo 2.38** 0.18* 0.91ns 0.41ns 0.02ns 2.86ns 3.71ns 3.12**
Otada 24 -1.88** -0.18* -1.28* -0.67** -0.27* -3.42ns -4.74* -4.50**
Ukerewe 0.62** -0.10ns 0.48ns 0.43ns -0.09ns 1.60ns 1.94* 0.67*
CT: canopy temperature, CW: canopy wilting, DMC: dry matter content, **: Significant at p<0.01, *: Significant at p<0.05, ns
:
Not significant).
5.3.3.6 Specific combining ability (SCA) and maternal effects
The SCA of direct crosses and reciprocals are presented in Table 5.8. The highest negative
SCA effects of -13.26, -12.48, -11.61, -10.35 for canopy temperature were observed in the
following crosses: Nsasagatebo x Otada 24, 2005-034 x 8-1038, 8-1038 x Nsasagatebo,
Otada 24 x 4-160, respectively (Table 5.8). For canopy wilting, significantly negative SCA
effects were recorded in Nsasagatebo x Otada 24 (-2.31), 8-1038 x Nsasagatebo (-2.06),
2005-034 x 8-1038 (-1.96), 4-160 x 2005-020 (-1.88) and Otada 24 x 4-160 (-1.54) (Table
5.8). Positive and high SCA effects of 15.75, 9.51, 8.92, 7.86, 6.15, 5.69 and 5.37 were
observed for storage root yield in the crosses of 8-1038 x K513261, 4-160 x 8-1038, 2005-
034 x 4-160, K513261 x Nsasagatebo, Otada 24 x Ukerewe, Nsasagatebo x Otada 24,
2005-020 x 2005-034, respectively (Table 5.8). The following crosses: Nsasagatebo x Otada
24, 8-1038 x K513261, 2005-034 x 4-160, 4-160 x 8-1038, expressed the highest positive
SCA effects of 55.02, 48.44, 27.69 and 23.64, respectively, for vine yields. Similarly, the
highest SCA effects for dry matter content were generated in the crosses of Nsasagatebo x
Otada 24 (19.29), Otada 24 x 8-1038 (16.85), 4-160 x 8-1038 (14.92), Nsasagatebo x 2005-
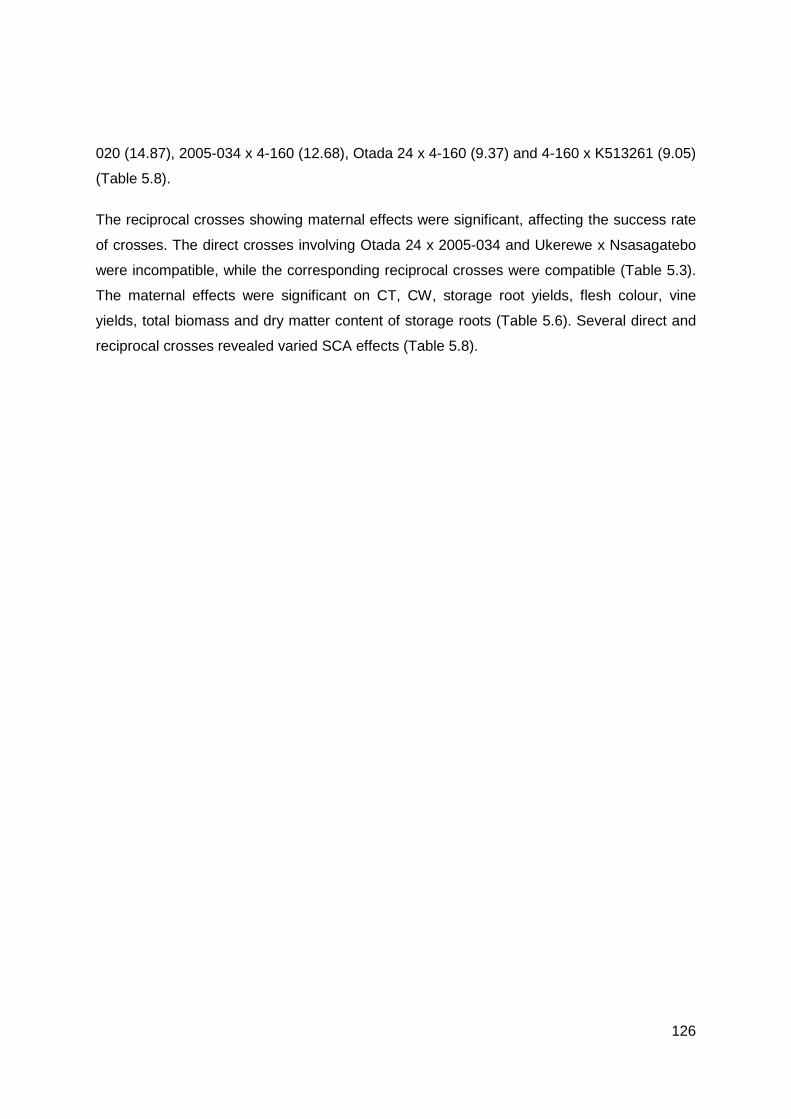
126
020 (14.87), 2005-034 x 4-160 (12.68), Otada 24 x 4-160 (9.37) and 4-160 x K513261 (9.05)
(Table 5.8).
The reciprocal crosses showing maternal effects were significant, affecting the success rate
of crosses. The direct crosses involving Otada 24 x 2005-034 and Ukerewe x Nsasagatebo
were incompatible, while the corresponding reciprocal crosses were compatible (Table 5.3).
The maternal effects were significant on CT, CW, storage root yields, flesh colour, vine
yields, total biomass and dry matter content of storage roots (Table 5.6). Several direct and
reciprocal crosses revealed varied SCA effects (Table 5.8).
127
Table 5.8: Estimates of SCA and maternal effects for canopy temperature, canopy wilting, yield of storage roots, skin color, flesh color, vine yield, total biomass and dry matter content of sweetpotato genotypes derived from direct and reciprocal crosses of eight parents
Crosses
Traits
CT CW Storage root yield Vine yield DMC
Direct Reciprocal Direct Reciprocal Direct Reciprocal Direct Reciprocal Direct Reciprocal
2005-020 x 2005-034 -1.93* 0.28 ns -0.69* -0.49* 5.37* 1.94 ns 7.46ns 8.33 ns -1.36 ns 1.99 ns
2005-020 x 4-160 2.32** -9.48** -0.38
ns -1.88** 1.30 ns 2.09 ns 1.57 ns -5.84 ns 1.45 ns -2.34 ns
2005-020 x 8-1038 -4.39** -1.06 ns -
0.57** -0.13 ns 1.44 ns 1.08 ns 11.51* 5.16 ns 4.83** -1.36 ns
2005-020 x K513261 -1.14 ns 0.52 ns -0.20
ns -0.75** -3.07 ns -1.48 ns -11.29* -8.37 ns -0.82 ns -1.38 ns
2005-020 x Nsasagatebo 0.18 ns -1.19 ns 0.21 ns -0.36 ns -1.94 ns 1.69 ns -9.95 ns 7.64 ns -0.78 ns 14.87**
2005-020 x Otada 24 3.71** -0.81 ns 0.69** 0.25 ns -1.18 ns -0.02 ns -6.27 ns -3.83 ns -9.02** 0.98 ns
2005-020 x Ukerewe -0.56 ns -0.08 ns 0.70** -0.27 ns -0.95 ns -2.47 ns 9.05 ns 0.81 ns 0.89 ns -0.51 ns
2005-034 x 4-160 3.32** 0.00 0.94** 0.00 8.92** 0.00 27.69** 0.00 12.68** 0.00
2005-034 x 8-1038 -2.48** 0.35 ns -1.96**
0.08 ns -4.08* 1.21 ns -22.64**
2.11 ns -22.65**
1.30 ns
2005-034 x K513261 2.35** 0.31 ns 0.32 ns 0.23 ns 0.98 ns 1.28 ns 8.39 ns 14.63* 6.87** -0.07 ns
2005-034 x Nsasagatebo 2.21** -0.23 ns 0.13 ns 0.03 ns 2.03 ns -0.53 ns 17.91** -2.04 ns 6.49** 4.91*
2005-034 x Otada 24 6.32** 10.99** 1.62** 1.56** -1.15 ns -1.91 ns -11.55* -10.08 ns 1.21 ns -16.49**
2005-034 x Ukerewe -6.16** -1.00 ns -1.04**
-0.15ns -3.50* 2.51 ns -11.81* 4.84 ns -8.5** 4.45*
4-160 x 8-1038 12.29** -1.37** 1.85** -1.04** 9.51** 0.38 ns 23.64** 5.66 ns 14.92** 0.38 ns
4-160 x K513261 5.44** 0.47 ns 0.45* 0.02ns -0.15 ns -1.79 ns -5.60 ns -4.71 ns 9.05** -0.17 ns
4-160 x Nsasagatebo 6.87** 9.86** 1.30** 1.53** -0.45 ns -4.67* -2.42 ns -18.08** 4.73** -17.54**
4-160 x Otada 24 -1.24* -10.35** -0.29
ns -1.54** 0.84 ns 2.67 ns -2.44 ns -5.07 ns -1.78 ns 9.37**
4-160 x Ukerewe -3.26** 10.46** -0.36
ns 1.77** -0.74 ns -1.52 ns 3.38 ns -18.68** 1.85 ns -13.10**
8-1038 x K513261 0.70 ns 9.63** 0.95** 1.11** 15.75** -3.27 ns 48.44** -10.38 ns 3.94 ns -15.99**
8-1038 x Nsasagatebo -
11.61** 0.18 ns -
2.06** -0.26 ns -4.41** 2.33 ns -
16.03** -5.25 ns -
13.02** 1.48 ns
8-1038 x Otada 24 3.04** -1.92** 0.78** -0.44 ns -2.23 ns 2.26 ns -10.69* 11.20 ns -2.58 ns 16.85**
8-1038 x Ukerewe 1.21* 0.01 ns -0.30
ns 0.43 ns -4.99** 0.74 ns
-13.96**
1.00 ns -9.70** 1.11 ns
K513261 x Nsasagatebo -0.64 ns -0.11 ns 0.25 ns -0.07 ns 7.86** -2.78 ns 2.10 ns -17.45** 2.30 ns 0.34 ns
K513261 x Otada 24 3.13** -0.69 ns 0.78** -0.48* -0.44 ns -0.30 ns 2.36 ns -10.21 ns 3.64** 0.03 ns
K513261 x Ukerewe -0.54 ns 0.69 ns -0.46* 0.28 ns 0.05 ns 1.69 ns 10.08 ns 5.99 ns 2.19 ns 8.44**
Nsasagatebo x Otada 24 -13.26**
-0.03 ns -2.31**
-1.22** 5.69* -9.22** 55.02** -2.92 ns 19.29** -5.70**
Nsasagatebo x Ukerewe 3.73** 10.43** 0.09 ns 1.38** 4.99** -0.93 ns -9.38 ns -1.28 ns 0.46 ns -10.02**
Otada 24 x Ukerewe 2.91* 0.23 ns 0.66* -0.29 ns 6.15** -1.50 ns 15.11* 1.90 ns 8.31** -1.51 ns
CT: canopy temperature, CW: canopy wilting, DMC: dry matter content, **: Significant at p<0.01, *: Significant at p<0.05, ns: Not significant.
128
5.4 Discussion
5.4.1 Success rate of crosses, seed set and germination
The self- and cross-incompatibility of sweetpotato remains a major impediment for
sweetpotato breeding (Martin 1965; 1970; Kobayashi et al. 1993). Gasura et al. (2010)
observed that some sweetpotato clones can be crossed easily. However, some female
parents are difficult to cross with specific male parents. The same results were observed in
this study. Complete incompatibility of both direct and reciprocal crosses was observed in
seven pairs while eleven crosses showed partial incompatibility (Table 5.3). This result
suggests that the success of genetic improvement of sweetpotato depends on an efficient
selection of compatible parents.
The success rate of crosses varied from 3.7 to 66.7 % with a mean of 19.3% (Table 5.3).
According to Lebot (2009) the success rates of crosses depend on various factors such as
compatibility, vigour of parents and weather conditions. According to Jones and Deonier
(1965) and Jones et al. (1986) each capsule of sweetpotato has a maximum of 4 seeds,
often with 1 to 2 seeds. Reportedly hand pollinated flowers produced up to 2 and rarely 3
seeds per capsule while insect pollinated flowers produced 3 to 4 seeds per capsule
(Gasura et al. 2010). Lebot (2009) reported that about 50% of hand pollinated flowers
produce two seeds. Similar results were observed in this study in which the number of seeds
per capsule varied from 1 to 3 with a mean of 2 (Table 5.3).
Sweetpotato seed germination is irregular because of the hard seed coat (Miller 1937).
Chemical and mechanical scarification has been recommended to overcome this challenge
(Wilson et al. 1989). In this study, variable seed germination was observed after scarification
ranging from 10 and 85.1% with a mean of 43.8% (Table 5.3). Preliminary tests have shown
that seeds that float in water germinate poorly. Most of the seed that sank was reportedly
viable (Martin 1946).
5.4.2 Performance of newly developed families and parents
Previous reports pointed out highly significant (P < 0.001) effects of environment, genotype
and genotype by environmental interactions on qualitative and quantitative traits of
129
sweetpotatoes (Mwololo et al. 2009; Adebola et al. 2013; Kathabwalika et al. 2013). In the
present study significant interactions between family and site were observed affecting yields
of storage roots and vines, total biomass and dry matter content of storage roots of
sweetpotato. The family effects were significant for all parameters evaluated, while site
effects were significant for yields of storage roots and vines, total biomass and dry matter
content of storage roots (Table 5.4). Kathabwalika et al. (2013) reported that the effects of
genotypes, environments and their interactions contributed to 43.4%, 34.8%, and 21.8%, of
the variation in storage root yields, respectively. Likewise, the strong contribution of
genotype has been observed in the performance of sweetpotato genotypes
(Nedunchezhiyan et al. 2007; Chataika et al. 2010). The highest proportion of the sum of
squares of families for all evaluated traits indicated the existence of considerable genetic
variation among the newly developed clones (Table 5.4).
5.4.3 Drought tolerance
A positive and significant correlation between yield and canopy temperatures were observed
under drought stress conditions (Royo et al. 2002; Guendouz et al. 2012). This suggested
that canopy temperature can be regarded as a valuable parameter to identify drought
tolerance of crop genotypes. The canopy temperatures of wheat genotypes grown under
well-watered conditions and drought stressed conditions was significantly different
(Guendouz et al. 2012). In this study, families showed variation in canopy temperatures
ranging from 16.9 to 22.7 oC. These canopy temperatures found in this study were lower
than the report of Guendouz et al. (2012) under irrigated conditions (23.8 to 28.0°C) and
under water stressed conditions (27.0 to 30.7°C). Canavar (2013) reported that canopy
temperature is lower and dependent on the ambient temperatures of the environment.
Therefore, ambient temperatures of experimental sites are different and can provide variable
canopy temperatures.
Genotypes with water stress tolerance express low canopy temperatures under water
stressed conditions (Blum 2011; Pathan et al. 2014). This was also found in the present
study in which some of the selected genotypes for drought tolerance (Nsasagatebo, 4-160
and 8-1038) had the lowest canopy temperatures (Table 5.5). The families that showed the
lowest canopy temperature (< 20oC) were, 4-160 x Ukerewe, 4-160 x Nsasagatebo, 8-1038
x 4-160, 4-160 x 8-1038, 8-1038 x 2005-020, Nsasagatebo x Ukerewe, with canopy
130
temperatures of 18.9, 19.2, 19.3, 19.4, 19.7, 19.8oC, respectively (Table 5.5). Canopy
temperatures measured using infrared thermometer provided useful data in determining
drought tolerance of sweetpotato clones under water limited conditions. Therefore, this
parameter can be considered as a rapid approach to assess drought tolerance in crop
plants. However, other complementary techniques and parameters such as leaf water
potential, canopy wilting, stomatal conductance, canopy senescence which are not plant
destructive approaches and yield potential should be measured for efficient screening of
crop genotypes for drought tolerance (Canavar 2013).
Canopy wilting is the first visible symptom of water stress (Carter et al. 2006; Pathan et al.
2014). A slow canopy wilting and minimal yield reduction under drought stress are important
traits that should be evaluated to determine drought tolerance in crop genotypes (Pathan et
al. 2014). For example, in soybean, slow canopy wilting and sustained nitrogen fixation
under drought stress have resulted in yield increases in water-limited environments (Sinclair
et al. 2007). In this study, the lowest mean canopy wilting scores of 0.86, 1.09, 1.19, 1.33,
1.33, 1.47, 1.50 were observed among the crosses of 4-160 x Nsasagatebo, 4-160 x
Ukerewe, Otada 24 x 4-160, Nsasagatebo x 2005-020, Otada 24 x Nsasagatebo, 4-160 x
K513261 and K513261 x 4-160, respectively (Table 5.5). Among parents, Nsasagatebo
developed the lowest level of canopy wilting (1.1), followed by 4-160 (1.5) and 8-1038 (1.6).
Based on low canopy temperature and canopy wilting, the following families were ranked
and selected: 4-160 x Nsasagatebo, 4-160 x Ukerewe, Otada 24 x 4-160, Nsasagatebo x
2005-020, Otada 24 x Nsasagatebo, 4-160 x K513261 , 513261 x 4-160, 8-1038 x 4-160, 4-
160 x 8-1038, 8-1038 x 2005-020 and Nsasagatebo x Ukerewe.
5.4.4 Yield of storage roots
Sites had significant effects on the yield of storage roots of sweetpotato clones. Previous
reports showed that the average storage root yield was higher in the Nairobi region (16.8 t
ha-1) than in Western Kenya (15.2 t ha-1) (Mwamburi and Ndolo 2013). Traits associated with
storage root yields such as size of storage roots and number of storage roots per plant have
been reported to be strongly affected by changes in environmental conditions
(Nedunchezhiyan et al. 2007). In this study, sites caused variation in the storage root yields.
The highest mean storage root yield of 6.9 t ha-1 was observed at Rubona, followed by
Karama with 5.5 t ha-1 and Masoro with 4.5 t ha-1 (Table 5.5). In Uganda Gasura et al.
131
(2010) reported three classes; high yielding (18-30 t ha-1), moderately yielding (11-17 t ha-1)
and low yielding (<11 t ha-1) sweetpotato genotypes. Storage root yields ranging between
63.3 and 22.1 t ha-1 have been reported in South Africa (Adebola et al. 2013). The storage
root yields found in this study were much lower than in these reports. The tested clones are
in the early selection phase and their yield response could be affected by their genetic
constitution and the environment. This requires continuous selection of genetically fixed,
stable and high yielding clones across representative sites in Rwanda. Moreover, fertilizers,
pesticides and irrigation were not applied in this study, whereas they were in the other trials
such as reported by Adebola et al. (2013).
5.4.5 Dry matter content of storage roots
Dry matter content of sweetpotato storage roots is influenced by site and genotype effects
(Shumbusha et al. 2010). Variable dry matter content has been reported in Kenya to range
from 29.6 to 26.6%. Significant effects of site and genotype on dry matter content were
observed in the present study. The highest dry matter content (28.3%) was observed at
Rubona followed by Masoro (26.3 %) and Karama (22.6%) (Table 5.5).
In another study, dry matter contents of sweetpotato storage roots varied from 25.6 to 33.3
% among families, while these values were 25.3 to 45.4 % for individual clones (Courtney et
al. 2008). In the present study, dry matter content among families varied from 25.9 to 37.5 %
(Table 5.5). The best families in dry matter content across site were, 8-1038 x K513261,
Nsasagatebo x 8-1038, Otada 24 x 4-160, Nsasagatebo x Ukerewe and 4-160 x
Nsasagatebo. These families had dry matter content of 37.5, 37.2, 35.7, 35.3 and 35.1% in
the storage roots, respectively (Table 5.5). These families are promising for future release,
by showing DMC of >25%, an important attribute for farmer’s adoption of new sweetpotato
varieties in Rwanda. Therefore, further evaluations across representative growing
environments are needed to identify their adaptability and stability.
5.4.6 Heritability
Genetic improvement of crop plants depends on the magnitude of heritability of economic
traits (Maluf et al. 1983; Ma-Teresa et al. 1994). Previous results recorded heritability of 0.93
for dry matter content of sweetpotato storage roots among full-sibling families (Courtney et
132
al. 2008). Heritability of 0.11 to 0.75 was reported for root yield, 0.07 to 0.75 for root size,
and 0.26 to 0.50 for dry matter (Ma-Teresa et al. 1994). Heritability of non-marketable roots
was 0.6 (Maluf et al. 1983). The present study found heritability of 0.95, 0.84, 0.68, 0.47,
0.74 and 0.75, 0.50 and 0.58 for canopy temperature, canopy wilting, storage root yield, skin
colour, flesh colour, dry matter content, yield of vines and total biomass, respectively (Table
5.4). Some of these estimates agree with previous findings. According to Courtney et al.
(2008), heritability differs from one population to another, and with the test environment.
Heritability for nutrient composition may vary due to soil nutrients such as the macro- and
micro-elements. High heritability estimates indicate a higher frequency of genes controlling
the traits (Ma-Teresa et al. 1994) and the potential to improve these traits with traditional
breeding strategies (Courtney et al. 2008; Mwije et al. 2014). Accordingly, heritability
observed for canopy temperature, canopy wilting, yield of storage roots and dry matter
content of storage roots indicated that the genetic improvement of these traits can be
achieved through conventional breeding.
5.4.7 General and specific combining ability effects
The GCA and SCA analysis revealed significant differences (P<0.01) among genotypes for
canopy temperature, canopy wilting, yield of storage roots and vines, total biomass and dry
matter content of storage roots (Table 5.6). Saad (1993) reported that effects of GCA and
SCA were significant for yield, storage root number and mean root weight. GCA and SCA
mean squares for flesh yield and root dry matter content were highly significant (Chiona
2009). Previous diallel analysis revealed significant GCA and SCA effects in the study of
heritability of putative drought adaptation traits in sweetpotato (Mwije et al. 2014).
The GCA/SCA ratio was > 50% for canopy temperature, canopy wilting, storage root yields,
skin colour, flesh colour and dry matter content of storage roots but nit for vines yield and
total biomass (Table 5.6). These results agree with the findings of Chiona (2009) who
reported that the ratio of GCA/SCA for storage root yield was 0.68. Baker (1978) indicated
that high ratios of GCA/SCA mean that the additive gene action makes a stronger
contribution to the expression of specific traits than non-additive gene action. This study
revealed that the additive gene action had important effects in expression of canopy
temperature, canopy wilting, storage root yield, skin colour, flesh colour and dry matter

133
content of storage roots, while the non-additive gene action had significant effects in the
expression of vine yields and total biomass.
In the drought tolerance studies, genotypes that presented the highest negative general
combining abilities for canopy temperature and canopy wilting were the most desirable.
These genotypes were 8-1038 (-4.05), Otada 24 (-1.88) and 4-160 (-0.50) for canopy
temperature and 8-1038 (-0.74), Otada 24 (-0.18), Ukerewe (-0.10) and 4-160 (-0.04) for
canopy wilting (Table 5.7). The selection of parents based on their combining ability, and
understanding the genetic control of key traits ensure the efficiency of a breeding
programme (Nadarajan and Gunasekaran 2005; Sleper and Poehlman 2006). In the current
study, good general combiners for drought tolerance were the parents, 8-1038, Otada 24
and 4-160. These genotypes revealed the lowest canopy temperature and wilting. Good
combiners for high storage root yields were Nsasagatebo, K513261 and Ukerewe, while
good combiners for high dry matter content were, Nsasagatebo, 2005-034 and Ukerewe
(Table 5.7).
Specific combining ability effects are useful to identify specific crosses with desirable traits
(Acquaah 2007). In this study, the best specific crosses for drought tolerance were
Nsasagatebo x Otada 24, 2005-034 x 8-1038, 8-1038 x Nsasagatebo and Otada 24 x 4-160.
These had the lowest canopy temperature and wilting level (Table 5.8). The crosses of 8-
1038 x K513261, 4-160 x 8-1038, 2005-034 x 4-160, K513261 x Nsasagatebo, Otada 24 x
Ukerewe, Nsasagatebo x Otada 24 and 2005-020 x 2005-034 were selected for their high
storage root yields. The best crosses for high dry matter content were Nsasagatebo x Otada
24, Otada 24 x 8-1038, 4-160 x 8-1038, Nsasagatebo x 2005-020, 2005-034 x 4-160, Otada
24 x 4-160 and 4-160 x K51326 (Table 5.8).
5.4.8 Maternal effect
Maternal effects are common in sexually reproducing crops, and these can be detected by
measuring the genetic differences of individuals arising from direct and reciprocal crosses
(Grami and Stefansson 1977). A trait is controlled by nuclear genes when the direction of
cross did not affect its quantity and quality of expression (Gedye 2005). Lin et al. (2007)
reported maternal effects on yields of storage roots and vines in Clone I selections of
sweetpotato. In the current study the maternal effects affected the compatibility between
genotypes where partial compatibility was observed in the crosses of Otada 24 x 2005-034
134
and Ukerewe x Nsasagatebo (Table 5.3). The maternal effects were significant among
families for canopy temperature, canopy wilting, flesh color, dry matter content, yield of vines
and total biomass. This was confirmed by the significant effects of reciprocal crosses and
their varied SCA effects (Table 5.6 and 5.8). The existence of maternal effects is important
for sweetpotato breeders in considering the direction of crosses to be performed to improve
a particular trait.
5.5 Conclusions
The present study examined combining abilities, maternal effects and heritability of drought
tolerance, yield and yield components in newly developed sweetpotato clones. High levels of
broad sense heritability (> 0.50) and significant GCA and SCA effects were detected for
canopy temperature, canopy wilting, storage root yields and dry matter content of storage
roots, indicating that these traits can be improved through conventional breeding. Both
additive and non-additive gene actions were important in the expression of drought
tolerance, storage root yields and storage root dry matter content of the tested sweetpotato
crosses. The ratio of GCA/SCA >50% on canopy temperature, canopy wilting, yield of
storage roots and dry matter content of storage roots revealed the predominance of additive
gene action. The best general combiners were parents 8-1038, Otada 24 and 4-160 for
drought tolerance; Nsasagatebo, K513261 and Ukerewe for high storage root yield; and
Nsasagatebo, 2005-034 and Ukerewe for high dry matter content. Based on low canopy
temperatures, low levels of canopy wilting and high storage root yields and dry matter
content, the families selected for breeding or direct production were 2005-020 x 4-160, 2005-
034 x 2005-020, 8-1038 x 4-160, 8-1038 x Ukerewe, Nsasagatebo x Otada 24, Otada 24 x
8-1038, Otada 24 x K513261, Ukerewe x 2005-034, and Ukerewe x 8-1038. The selected
families are recommended for further evaluation to determine their yield potential and
stability for release in Rwanda or similar environments.
5.6 References
Acquaah, G. 2007. Principles of plant genetics and breeding. Wiley-Blackwell, Oxford.

135
Adebola, P.O., A. Shegro, S.M. Laurie, L.N. Zulu and M. Pillay. 2013. Genotype x environment interaction and yield stability estimate of some sweetpotato (Ipomoea batatas [L.] Lam] breeding lines in South Africa. Journal of Plant Breeding and Crop Science 5: 182-186.
Baker, R. 1978. Issues in diallel analysis. Crop Science 18: 533-536.
Blum, A. 2002. Drought tolerance: is it a complex trait? In: Saxena, N.P. and J.C. O’Toole, editors, Proceedings of an international workshop on field screening for drought tolerance in rice. Rockefeller Foundation, New York. p. 24-59.
Blum, A. 2011. Plant breeding for water-limited environments. Springer, London.
Canavar, Ö. 2013. Comparison and determination of leaf temperature of sunflower and safflower under drought stress. Helia 36: 47-58.
Carey E, R.D. 1996. Procedures for the evaluation of pathogen tested sweetpotato clones: Sweetpotato germplasm management training manual. CIP, Lima, Peru.
Carter, T.E.J., J. Orf, L.C. Purcell, J. Specht, H.R. Boerma, P. Chen, T. Sinclair and T. Rufty. 2006. Tough times, tough plants - new soybean genes defend against drought and other stresses. Proceedings of the 33rd Soybean Seed Research Conference, Chicago, IL, 5-8 December 2006.
Chataika, B., J. Bokosi, M. Kwapata, R. Chirwa, V. Mwale, P. Mnyenyembe and J. Myers. 2010. Performance of parental genotypes and inheritance of angular leaf spot (Phaeosariopsis griseola) resistance in the common bean (Phaseolus vulgaris). African Journal of Biology 9: 4398-4406.
Chiona, M. 2009. Towards enhancement of β-carotene content of high dry mass sweetpotato genotypes in Zambia. PhD. Thesis. University of KwaZulu-Natal, Pietermaritzburg.
Cochran, W.G. and G.M. Cox. 1992. Experimental designs. Wiley Classics Library, Lexington, KY, USA.
Courtney, M., M. McHaro, D. La Bonte and W. Gruneberg. 2008. Heritability estimates for micronutrient composition of sweetpotato storage roots. Hortscience 43: 1382-1384.
Falconer, D.S. and T.F.C. Mackay. 1996. Introduction to quantitative genetics. 4th ed. Pearson Prentice Hall, Harlow.
FAOSTAT. 2013. Statistics division. FAO. http://faostat.fao.org/site/612/default.aspx#ancor (accessed Accessed 7 July 2015).
Fasoula, V.A. and D.A. Fasoula. 2003. Partitioning crop yield into genetic components. In: Kang, M.S., editor, Handbook of formulas and software for plant geneticists and breeders. Food Products Press and The Haworth Reference Press, Binghamton, NY 13904-1580.
136
Gasura, E., A. Mashingaidze and S. Mukasa. 2010. Genetic variability for tuber yield, quality, and virus disease complex traits in Uganda sweetpotato germplasm. African Crop Science Journal 16: 147-160.
Gedye, K.R., A.D. Bettge, G.E. King, and C.F. Morris. 2005. Evaluation of maternal parent and peroindoline allele on kernel texture in a reciprocal cross between two hard spring wheat cultivars. Euphytica 141: 121-127.
Grami, B. and B. Stefansson. 1977. Paternal and maternal effects on protein and oil content in summer rape. Canadian Journal of Plant Science 57: 945-949.
Grami, B., B. Stefansson and R. Baker. 1977. Genetics of protein and oil content in summer rape: heritability, number of effective factors, and correlations. Canadian Journal of Plant Science 57: 937-943.
Griffing, B. 1956. Concept of general and specific combining ability in relation to diallel crossing systems. Australian Journal of Biological Sciences 9: 463-493.
Guendouz, A., S. Guessoumm, K. Maamri, M. Benidir and M. Hafsi. 2012. Canopy temperature efficiency as indicators for drought tolerance in Durum Wheat (Triticum Durum Desf.) in Semi Arid. Journal of Agriculture and Sustainability 1: 23-38.
Huamán, Z. 1999. Botany, origin, evolution and biodiversity of the sweetpotato: Sweetpotato germplasm management training manual. CIP, Lima, Peru.
Jones, A. and M. Deonier. 1965. Interspecific crosses among Ipomoea lacunosa, I. ramoni, I. trichocarpa, and I. triloba. Botanical Gazette 126: 226-232.
Jones, A., P. Dukes and J. Schalk. 1986. Sweetpotato breeding. In: Basset, M.J., editor, Breeding Vegetable Crops. IVA, Eastport. p. 1-35.
Kathabwalika, D.M., E.H.C. Chilembwe, V.M. Mwale, D. Kambewa and J.P. Njoloma. 2013. Plant growth and yield stability of orange fleshed sweetpotato (Ipomoea batatas) genotypes in three agro-ecological zones of Malawi. International Research Journal of Agricultural Science and Soil Science 3: 383-392.
Kobayashi, R.S., S.L. Sinden and J.C. Bouwkamp. 1993. Ovule culture of sweetpotato (Ipomoea batatas) and closely related species. Plant Cell, Tissue and Organ Culture 32: 77-82.
Lebot, V. 2009. Sweetpotato. In: Bradshaw, J.E., editor, Root and tuber crops: Handbook of plant breeding. Springer Sciences and Business Media, New York, NY 10013, USA. p. 97-125.
Lin, K.-H., Y.-C. Lai, K.-Y. Chang, Y.-F. Chen, S.-Y. Hwang and H.-F. Lo. 2007. Improving breeding efficiency for quality and yield of sweetpotato. Botanical Studies 48: 283-292.
Ma-Teresa, L., C. Gerpcio-Sta Sta and C. Enrique. 1994. Heritability estimates of some root characters in sweetpotato. Philippines Jounal of Crop Sciences 19: 27-32.
137
Maluf, W., J. Miranda and P. Ferreira. 1983. Broad sense heritabilities of root and vine traits in sweetpotatoes (Ipomoea batatas [L.] Lam.). Revista Brasileira de Genética, Ribeirão Preto 6: 443-451.
Martin, F.W. 1965. Incompatibility in the sweetpotato. Economics and Botany 19: 406-415.
Martin, F.W. 1970. Self-and interspecific incompatibility in the Convolvulaceae. Botanical Gazette: 139-144.
Martin, J.A.J. 1946. Germination of sweetpotato as affected by different methods of scarification. American Society of HortScience 47: 387-390.
Miller, J.C. 1937. Inducing the sweetpotato to bloom and set seed. Journal of Heredity 28: 347-349.
Mwamburi, M. and P. Ndolo. 2013. Root-yield performance of pre-release sweetpotato genotypes in Kenya. Journal of Applied Biosciences 65: 4914-4921.
Mwije, A., S.B. Mukasa, P. Gibson and S. Kyamanywa. 2014. Heritability analysis of putative drought adaptation traits in sweetpotato. African Crop Science Journal 22: 79 - 87.
Mwololo, J.K., P.W. Muturi, M.W.K. Mburu, R.W. Njeru, N. Kiarie, J.K. Munyua, E.M. Ateka, R.W. Muinga, R.E. Kapinga and B. Lemaga. 2009. Additive main effects and multiplicative interaction analysis of genotype x environmental interaction among sweetpotato genotypes. Journal of Animal and Plant Sciences 2: 148-155.
Nadarajan, N. and M. Gunasekaran. 2005. Quantitative genetics and biometrical techniques in plant breeding. Kalyani Publishers, New Delhi, India.
Nedunchezhiyan, M., G. Byju and S. Naskar. 2007. Sweetpotato (Ipomoea batatas L.) as an intercrop in a coconut plantation: Growth, yield and quality. Journal of Root Crops 33: 26-29.
Pathan, S.M., J.-D. Lee, D.A. Sleper, F.B. Fritschi, R.E. Sharp, T.E.J. Carter, R.L. Nelson, C.A. King, W.T. Schapaugh, M.R. Ellersieck, H.T. Nguyen and J.G. Shannon. 2014. Two soybean plant introductions display slow leaf wilting and reduced yield loss under drought. Journal of Agronomy and Crop Science 200: 231-236.
Roach, D.A. and R.D. Wulff. 1987. Maternal effects in plants. Annual Review of Ecology and Systematics 18: 209-235.
Rojas, B.A. and G.F. Sprague. 1952. A comparison of variance components in corn yield trials: III. General and specific combining ability and their interaction with locations and years. Agronomy Journal 44: 462-466.
Royo, C., D. Villegas, L.F. Garcia Del Moral, S. Elhani, N. Aparicio, Y. Rharrabti and J.L. Araus. 2002. Comparative performance of carbon isotope discrimination and canopy temperature depression as predictors of genotypes differences in durum wheat yield in Spain. Australian Journal Agriculture Research 53: 561-569.
138
Rukundo, P., H. Shimelis, M. Laing and D. Gahakwa. 2015. Phenotypic characterisation of sweetpotato genotypes grown in East and Central Africa. South African Journal of Plant and Soil: http://dx.doi.org/10.1080/02571862.2014.994141.
Saad, M.S.B. 1993. Variability, divergence, heteosis, combining ability and yield component study in sweeetpotatoes (Ipomoea batatas [L] Lam.) from Sabah and Sarawak, Malaysia. PhD thesis. University of Pertanian Malaysia, Malaysia.
Shumbusha, D., G. Tusiime, R. Edema, P. Gibson and R.O.M. Mwanga. 2010. Diallel analysis of root dry matter content in sweetpotato. Second Ruforum Biannual Meeting 1013-1017.
Sinclair, T.R., L.C. Purcell, C.A. King, C.H. Sneller, P. Chen and V. Vadez. 2007. Drought tolerance and yield increase of soybean resulting from improved symbiotic N2 fixation. Field Crops Research 101: 68-71.
Sleper, D.A. and J.M. Poehlman. 2006. Breeding field crops. Blackwell Publishing, Iowa, USA.
SPSS. 2006. PASW Statistics for Windows SPSS Inc. Chicago IL, USA.
Tairo, F., E. Mneney and A. Kullaya. 2008. Morphological and agronomical characterization of sweetpotato (Ipomoea batatas [L.] Lam.) germplasm collection from Tanzania. African Journal of Plant Science 2: 077-085.
Tan, S.L., A.M. Abdul Aziz and M.A. Zaharah. 2007. Selection of sweetpotato clones for flour production. Journal of Tropical Agriculture and Food Science 35: 205-212.
Viana, J.M.S. and F.d.P. Matta. 2003. Analysis of general and specific combining abilities of popcorn populations, including selfed parents. Genetics and Molecular Biology 26: 465-471.
Wilson, J.E., F.S. Pole, N.E.J. Smit and P. Taufatofua. 1989. Sweetpotato breeding. IRETA publications, Apia, Western Samoa.
Zhang, Y., M.S. Kang and K.R. Lamkey. 2005. DIALL-SAS05: A comprehensive program for Griffing's and Gardner-Eberhart analyses. Agronomy Journal 97: 1097-1106.
139
6. Chapter Six: Genotype by environment interaction and
yield stability of sweetpotato clones in Rwanda
Abstract
Assessment of adaptability and yield stability of candidate genotypes is an important step in
cultivar selection and recommendation for sustainable sweetpotato production. The objective
of this study was to determine genotype by environment interaction and yield stability of 45
selected sweetpotao breeding clones. Field trials were conducted using an alpha lattice
design with three replications across six environments in Rwanda. Data on fresh root yield
and dry matter content were collected and subjected to the additive main effect and
multiplicative interaction (AMMI) and genotype and genotype-environment (GGE) bi-plot
analyses. Results showed significant interaction effects (p=0.001) of clone x site x season,
clone x site and clone x season on yield and dry matter content of storage roots. Site x
season interaction had significant effects on dry matter content of storage roots only.
Candidate clones designated as clone 21 (4-160 x 2005-020), 137 (K513261 x 2005-034)
and 22 (4-160 x 2005-020) had the highest storage root yield of 38.2, 23.4 and 20.8 t ha-1,
respectively. The highest dry matter content of storage roots of 40.6, 35.9 and 32.9% were
recorded in clones 21, 137 and 259 (2005-034 x 8-1038), respectively. AMMI analysis
showed that genotypes (G), environments (E) and G x E interaction effects contributed to
20.7%, 17.6% and 61.7% of the total variation of clones for fresh root yields, respectively.
The contributions of G, E, and G x E effects, respectively, were 19.5%, 11.8% and 68.7% to
the total variation in root dry matter content. AMMI stability values (ASV) revealed the
following most stable genotypes: Nsansagatebo, 210 (8-1038 x 4-160), 2005-110 and 456
(SPK004 x K513261), for storage root yield and clones 46 (Kwezikumwe x 2005-020), 509
(Ukerewe x Kwezikumwe), Mugande, and 358 (Ukerewe x 8-1038) for dry matter content of
storage roots. Overall, the present study identified high yielding and stable candidate
sweetpotato clones such as 21, 137 and 22 (4-160 x 2005-020) for their high yields and dry
matter content of storage roots. These clones are recommended for direct production or
sweetpotato breeding programmes in Rwanda and similar environments.
Key words: AMMI, breeding clone, GGE-biplot, Rwanda, stability, sweetpotato.
140
6.1 Introduction
Sweetpotato (Ipomoea batatus L.) is an important food, feed and cash crop in many tropical
and sub-tropical regions of the world (FAOSTAT 2013; Laurie and Magoro 2008). In sub-
Sahara Africa, sweetpotato is grown across and estimated area of 2.1 million hectares, with
an annual production of about 9.9 million tons (FAOSTAT 2013). In Rwanda, sweetpotato is
an important component of the farming system. During the main crop growing season of
Rwanda (season A) in 2015, sweetpotato occupied 5.2% of the total cultivated land
accounting for 14.3% of the total crop production (NISR 2015). The use of sweetpotato as a
food security crop and source of pro-Vitamin A for vulnerable people such as malnourished
children, HIV patients and pregnant women has boosted its production in many areas of
East Africa (Osiru et al. 2009).
Development of high and stable yielding and climate smart crop varieties such as
sweetpotato is crucial for sustainable crop production and food security for the growing
population of sub-Saharan Africa in the face of global climate change and varied preferences
of end-users (Cochard et al. 2008). Assessment of adaptability and yield stability of
candidate genotypes is an important step in cultivar selection and recommendation for
sustainable sweetpotato production. Crop varieties perform well in environments in which
they are adapted (Acquaah 2007). The performance of a genotype is the product of its
genetic constitution, the environment and genotype by environment interaction (GxE) (Yan et
al. 2001). The performance of a crop variety is quantified in terms of its wide or specific
adaptability and yield stability (Abidin et al. 2005). A variety that performs well over large
growing areas presenting a high mean yield has a wide adaptability (Acquaah 2007;
Mwanga et al. 2007). A variety has a specific adaptability when it ranks among the highest
yielder only at some locations (Acquaah 2007). Differential response of a genotype across a
given set of environments is the results of GxE interactions (Nasayao and Saldaga 1988;
Osiru et al. 2009; Russell and Eberhart 1966). Statistically, GxE interactions occur if the
difference in performance between any two genotypes is inconsistent over the test
environments (Acquaah 2007).
Genotype by environment interaction has direct relevance during cultivar selection and
recommendation to growers (Caliskan et al. 2007; Nasayao and Saldaga 1988).
Environmental effects often mask the genetic component which is the cause of poor genetic
141
gain during selection of quantitative traits such as yields and yield components (Fasoula and
Fasoula 2003). This requires identification of promising genotypes adapted to the target
growing areas after multi-environment trials involving target locations and growing
seasons/years. This will aid to measure adaptability and yield stability of candidate varieties.
Various statistical methods and parameters are available to measure GxE interaction and
yield stability of genotypes (Bacusmo et al. 1988; Collins et al. 1987; Jones et al. 1986). The
additive main effects and multiplicative interaction (AMMI) (Zobel et al. 1988) and genotype
and genotype by environment (GGE) (Gabriel 1971) methods are the most widely used
multivariate approaches to analyse data collected from multi-environment trials. The AMMI
model combines analysis of variance for the genotype and environment main effects with
principal component analysis of the G x E interactions (Gauch and Zobel 1996). The GGE
integrates the genotypic main effect with the G x E interaction effect (Yan et al. 2000).
The storage root yield of sweetpotato is highly sensitive to environmental changes. Mwanga
et al. (2007) reported that the GxE interactions have a great influence on the performance of
sweetpotato. Gruneberg et al. (2005) reported that the G×E interaction component were
larger than, or nearly equal to, the genetic variation of sweetpotato yields (Grunerberg et al.
2005). Manrique and Hermann (2000) and Tekalign (2007) observed lack of association
between high yield and stable performance attributed to G×E interactions. GxE interaction
was significant for yield and quality of sweetpotato storage root (Caliskan et al. 2007;
Carpena et al. 1980; Manrique and Hermann 2000; Ngeve 1993). Grunerberg et al., (2005)
observed a small GxE interaction for nutritional traits of sweetpotato in multi-environmental
trials. This indicates that selection for high nutritional value could be conducted relatively in a
few selected environments without compromising the efficiency of selection.
In an attempt to develop improved sweetpotato cultivars, candidate clones were crossed and
suitable recombinants were selected under Rwandan conditions. Best performing and stable
clones should be ranked and selected across representative test environments for direct
production or for sweetpotato breeding programs. Therefore, the objectives of this study
were to determine G x E interaction and yield stability of sweetpotato breeding clones
recently bred in Rwanda and to identify promising genotypes.
142
6.2 Materials and Methods
6.2.1 Plant materials
A total of 45 clones were included in the present study. Thirty two were newly bred and
candidate clones (Table 6.1). The candidate clones were selected based on their relatively
high storage root yields and dry matter content of storage roots and drought tolerance.
Twelve parental clones used in developing the new clones and a control variety ‘Mugange’
were included in the study. The description of the plant materials is given in Table 6.1.
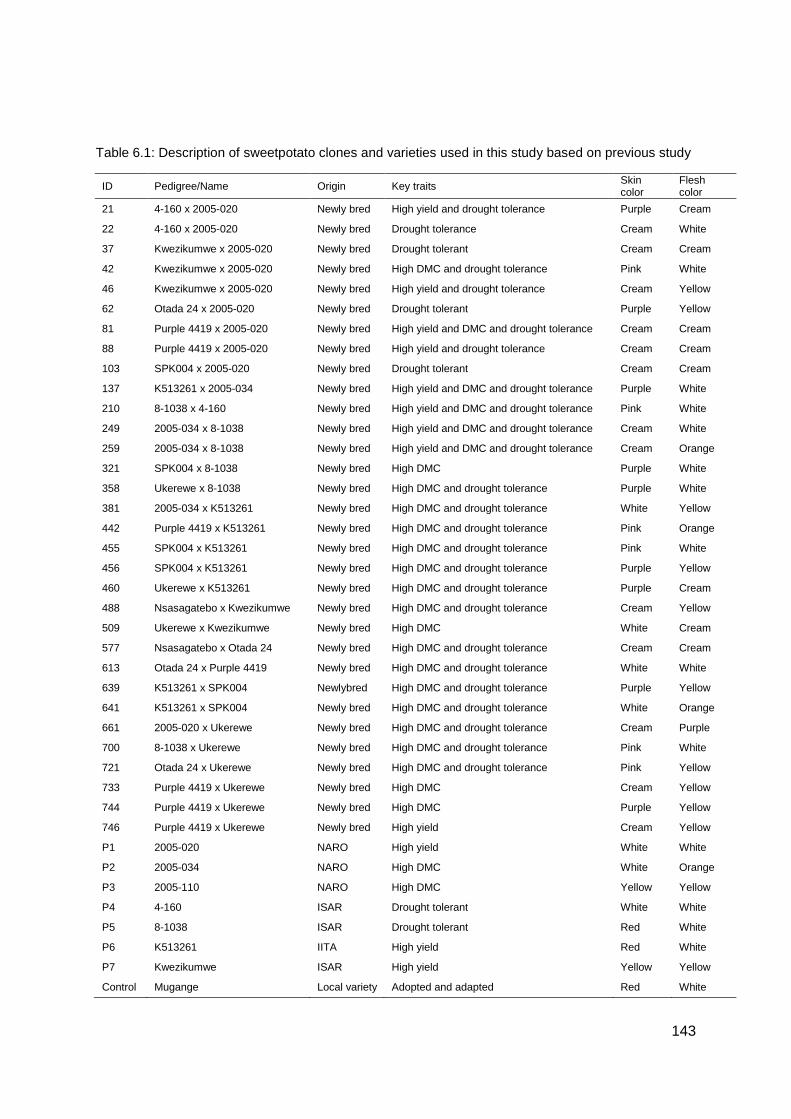
143
Table 6.1: Description of sweetpotato clones and varieties used in this study based on previous study
ID Pedigree/Name Origin Key traits Skin color
Flesh color
21 4-160 x 2005-020 Newly bred High yield and drought tolerance Purple Cream
22 4-160 x 2005-020 Newly bred Drought tolerance Cream White
37 Kwezikumwe x 2005-020 Newly bred Drought tolerant Cream Cream
42 Kwezikumwe x 2005-020 Newly bred High DMC and drought tolerance Pink White
46 Kwezikumwe x 2005-020 Newly bred High yield and drought tolerance Cream Yellow
62 Otada 24 x 2005-020 Newly bred Drought tolerant Purple Yellow
81 Purple 4419 x 2005-020 Newly bred High yield and DMC and drought tolerance Cream Cream
88 Purple 4419 x 2005-020 Newly bred High yield and drought tolerance Cream Cream
103 SPK004 x 2005-020 Newly bred Drought tolerant Cream Cream
137 K513261 x 2005-034 Newly bred High yield and DMC and drought tolerance Purple White
210 8-1038 x 4-160 Newly bred High yield and DMC and drought tolerance Pink White
249 2005-034 x 8-1038 Newly bred High yield and DMC and drought tolerance Cream White
259 2005-034 x 8-1038 Newly bred High yield and DMC and drought tolerance Cream Orange
321 SPK004 x 8-1038 Newly bred High DMC Purple White
358 Ukerewe x 8-1038 Newly bred High DMC and drought tolerance Purple White
381 2005-034 x K513261 Newly bred High DMC and drought tolerance White Yellow
442 Purple 4419 x K513261 Newly bred High DMC and drought tolerance Pink Orange
455 SPK004 x K513261 Newly bred High DMC and drought tolerance Pink White
456 SPK004 x K513261 Newly bred High DMC and drought tolerance Purple Yellow
460 Ukerewe x K513261 Newly bred High DMC and drought tolerance Purple Cream
488 Nsasagatebo x Kwezikumwe Newly bred High DMC and drought tolerance Cream Yellow
509 Ukerewe x Kwezikumwe Newly bred High DMC White Cream
577 Nsasagatebo x Otada 24 Newly bred High DMC and drought tolerance Cream Cream
613 Otada 24 x Purple 4419 Newly bred High DMC and drought tolerance White White
639 K513261 x SPK004 Newlybred High DMC and drought tolerance Purple Yellow
641 K513261 x SPK004 Newly bred High DMC and drought tolerance White Orange
661 2005-020 x Ukerewe Newly bred High DMC and drought tolerance Cream Purple
700 8-1038 x Ukerewe Newly bred High DMC and drought tolerance Pink White
721 Otada 24 x Ukerewe Newly bred High DMC and drought tolerance Pink Yellow
733 Purple 4419 x Ukerewe Newly bred High DMC Cream Yellow
744 Purple 4419 x Ukerewe Newly bred High DMC Purple Yellow
746 Purple 4419 x Ukerewe Newly bred High yield Cream Yellow
P1 2005-020 NARO High yield White White
P2 2005-034 NARO High DMC White Orange
P3 2005-110 NARO High DMC Yellow Yellow
P4 4-160 ISAR Drought tolerant White White
P5 8-1038 ISAR Drought tolerant Red White
P6 K513261 IITA High yield Red White
P7 Kwezikumwe ISAR High yield Yellow Yellow
Control Mugange Local variety Adopted and adapted Red White
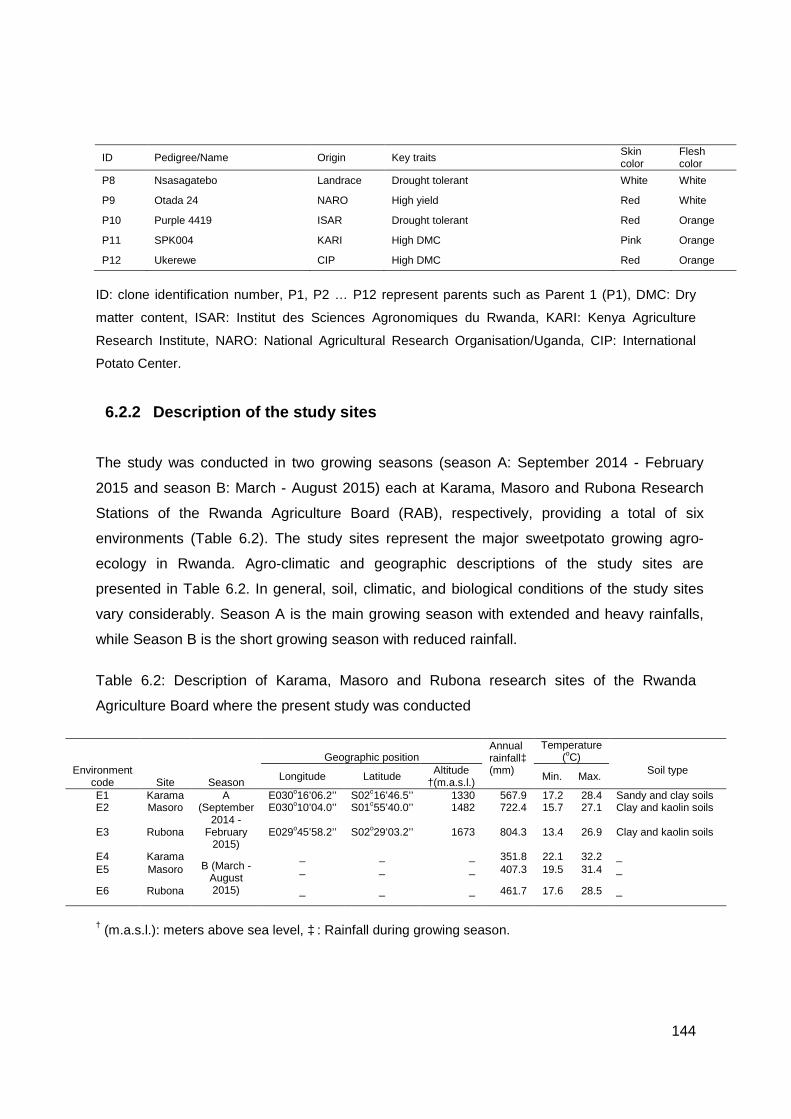
144
ID Pedigree/Name Origin Key traits Skin color
Flesh color
P8 Nsasagatebo Landrace Drought tolerant White White
P9 Otada 24 NARO High yield Red White
P10 Purple 4419 ISAR Drought tolerant Red Orange
P11 SPK004 KARI High DMC Pink Orange
P12 Ukerewe CIP High DMC Red Orange
ID: clone identification number, P1, P2 … P12 represent parents such as Parent 1 (P1), DMC: Dry
matter content, ISAR: Institut des Sciences Agronomiques du Rwanda, KARI: Kenya Agriculture
Research Institute, NARO: National Agricultural Research Organisation/Uganda, CIP: International
Potato Center.
6.2.2 Description of the study sites
The study was conducted in two growing seasons (season A: September 2014 - February
2015 and season B: March - August 2015) each at Karama, Masoro and Rubona Research
Stations of the Rwanda Agriculture Board (RAB), respectively, providing a total of six
environments (Table 6.2). The study sites represent the major sweetpotato growing agro-
ecology in Rwanda. Agro-climatic and geographic descriptions of the study sites are
presented in Table 6.2. In general, soil, climatic, and biological conditions of the study sites
vary considerably. Season A is the main growing season with extended and heavy rainfalls,
while Season B is the short growing season with reduced rainfall.
Table 6.2: Description of Karama, Masoro and Rubona research sites of the Rwanda
Agriculture Board where the present study was conducted
Environment code Site Season
Geographic position Annual rainfall‡ (mm)
Temperature (oC)
Soil type Longitude Latitude
Altitude †(m.a.s.l.) Min. Max.
E1 Karama A (September
2014 - February
2015)
E030o16’06.2’’ S02o16’46.5’’ 1330 567.9 17.2 28.4 Sandy and clay soils E2 Masoro E030o10’04.0’’ S01o55’40.0’’ 1482 722.4 15.7 27.1 Clay and kaolin soils
E3 Rubona E029o45’58.2’’ S02o29’03.2’’ 1673 804.3 13.4 26.9 Clay and kaolin soils
E4 Karama B (March -
August 2015)
_ _ _ 351.8 22.1 32.2 _ E5 Masoro _ _ _ 407.3 19.5 31.4 _
E6 Rubona _ _ _ 461.7 17.6 28.5 _
† (m.a.s.l.): meters above sea level, ‡ : Rainfall during growing season.
145
6.2.3 Experimental design and field establishment
Clones were established using a 5×9 alpha-lattice experimental design with three
replications at each location. Vine cuttings of five nodes were prepared for field planting.
Cuttings were planted on ridges with inter-row spacing of 80 cm and intra-row spacing of 50
cm. The experimental plot consists of three rows consisting of 30 plants. Experimental plots
were bordered by growing two rows of a sweetpotato variety Ukerewe. Weeding was carried
out as required and no fertilisers and pesticides were applied. Harvesting was carried out
135 days after planting.
6.2.4 Data collection
The following data were collected: weight of storage root, weight of vine and dry matter
content of storage root. Data on yield and yield components were recorded on the inner row
of experimental plots. Six plants were harvested and the weight of storage roots and vines
were determined using a field balance. The recorded yields were converted to t ha-1. The dry
matter content was determined after modifying the methods described by Carey and
Reynoso (1996). Fresh root samples were collected from five healthy, big roots from each
plant within the harvested plot. About 100 g of fresh weight were excised on each root and a
composite of 500 g were prepared in which 100g were sampled and kept in a paper bag
prior to drying. Samples were dried in an oven at 70oC for 72 hours. Dried samples were
weighed with a sensitive balance and the dry matter content was determined using the
formula: Dry matter content (DM) expressed in % = ((Dry weight/Fresh weight) x 100).
6.2.5 Data analysis
6.2.5.1 Analysis of variance
A combined analysis of variance across seasons and sites was carried out to identify the
effects of genotypes, sites, seasons and their interactions on yield of storage root and vines,
total biomass and dry matter content of storage root using GenStat 14th edition (Payne et al.
2011). The clones were treated as fixed factor, while environments (both spatial and
temporal), replications within environments and blocks within replications were random
factors. The additive main effects and multiplicative interaction (AMMI) and genotype and
146
genotype x environment (GGE) biplot models were computed sequentially to analyze G x E
interaction and yield stability of genotypes. The AMMI model as formulated by Gauch and
Zobel (1996) is:
���=�+��+��+�����+ ��+���,
Where ���: the observed mean yield of genotype i in environment j, �: the grand mean, ��: the
genotype main effect, ��: the environment main effect, : the eigenvalues of the interaction
principal component analysis (IPCA), �� and ��: the genotype and environment scores for
the IPCA axis, ��: the interaction residual, N: the number of IPCA retained in the model and
���: the random error term. The ANOVA and ranking of best performing sweetpotato clones in
each environment were performed with AMMI. Further, AMMI’s stability value (ASV) was
determined to rank tested sweetpotato clones based on their stability using the formulae of
Purchase (1997):
ASV=
Where, SS: sum of squares; IPCA1: interaction principal component analysis axis 1, IPCA2:
interaction principal component analysis axis 2.
6.2.5.2 GGE biplot
The GGE biplot analysis allows to identify the relationship among sweetpotato clones and
the environments. The variations caused by genotype and genotype x environment
interactions were explored using GGE biplot based on the principal component analysis
(PCA) of environment-centred data (Yan et al. 2000; Yan and Kang 2002). The GGE biplot
was analysed using Genstat 14th edition (Payne et al. 2011). The basic model for a GGE
biplot as described by Yan et al. (2001) is:
Yij= bj + bjαi +λlζilηjl+Ɛij,
Where Yij: Average yield of i genotype in the environment j, bj: the average yield of all
genotypes in environment j, αi: the main effect of genotype i, λn: the singular value for
principal component PCn, ζil and ηjl: scores for genotype i and environment j on PCn,
respectively, and Ɛij: the residual associated with i genotype and j environment. The which-
won-where polygon view pattern of GGE biplot was used to identify high yielding clones in a
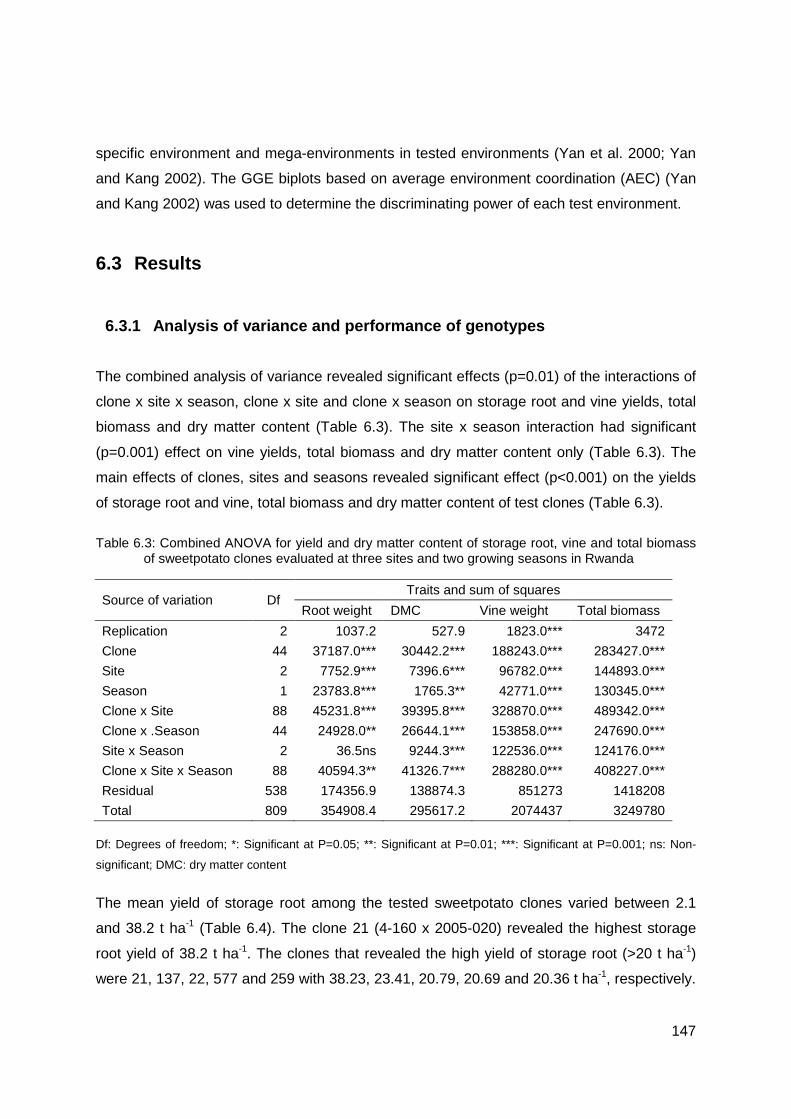
147
specific environment and mega-environments in tested environments (Yan et al. 2000; Yan
and Kang 2002). The GGE biplots based on average environment coordination (AEC) (Yan
and Kang 2002) was used to determine the discriminating power of each test environment.
6.3 Results
6.3.1 Analysis of variance and performance of genotypes
The combined analysis of variance revealed significant effects (p=0.01) of the interactions of
clone x site x season, clone x site and clone x season on storage root and vine yields, total
biomass and dry matter content (Table 6.3). The site x season interaction had significant
(p=0.001) effect on vine yields, total biomass and dry matter content only (Table 6.3). The
main effects of clones, sites and seasons revealed significant effect (p<0.001) on the yields
of storage root and vine, total biomass and dry matter content of test clones (Table 6.3).
Table 6.3: Combined ANOVA for yield and dry matter content of storage root, vine and total biomass of sweetpotato clones evaluated at three sites and two growing seasons in Rwanda
Source of variation Df Traits and sum of squares
Root weight DMC Vine weight Total biomass
Replication 2 1037.2 527.9 1823.0*** 3472
Clone 44 37187.0*** 30442.2*** 188243.0*** 283427.0***
Site 2 7752.9*** 7396.6*** 96782.0*** 144893.0***
Season 1 23783.8*** 1765.3** 42771.0*** 130345.0***
Clone x Site 88 45231.8*** 39395.8*** 328870.0*** 489342.0***
Clone x .Season 44 24928.0** 26644.1*** 153858.0*** 247690.0***
Site x Season 2 36.5ns 9244.3*** 122536.0*** 124176.0***
Clone x Site x Season 88 40594.3** 41326.7*** 288280.0*** 408227.0***
Residual 538 174356.9 138874.3 851273 1418208
Total 809 354908.4 295617.2 2074437 3249780
Df: Degrees of freedom; *: Significant at P=0.05; **: Significant at P=0.01; ***: Significant at P=0.001; ns: Non-
significant; DMC: dry matter content
The mean yield of storage root among the tested sweetpotato clones varied between 2.1
and 38.2 t ha-1 (Table 6.4). The clone 21 (4-160 x 2005-020) revealed the highest storage
root yield of 38.2 t ha-1. The clones that revealed the high yield of storage root (>20 t ha-1)
were 21, 137, 22, 577 and 259 with 38.23, 23.41, 20.79, 20.69 and 20.36 t ha-1, respectively.
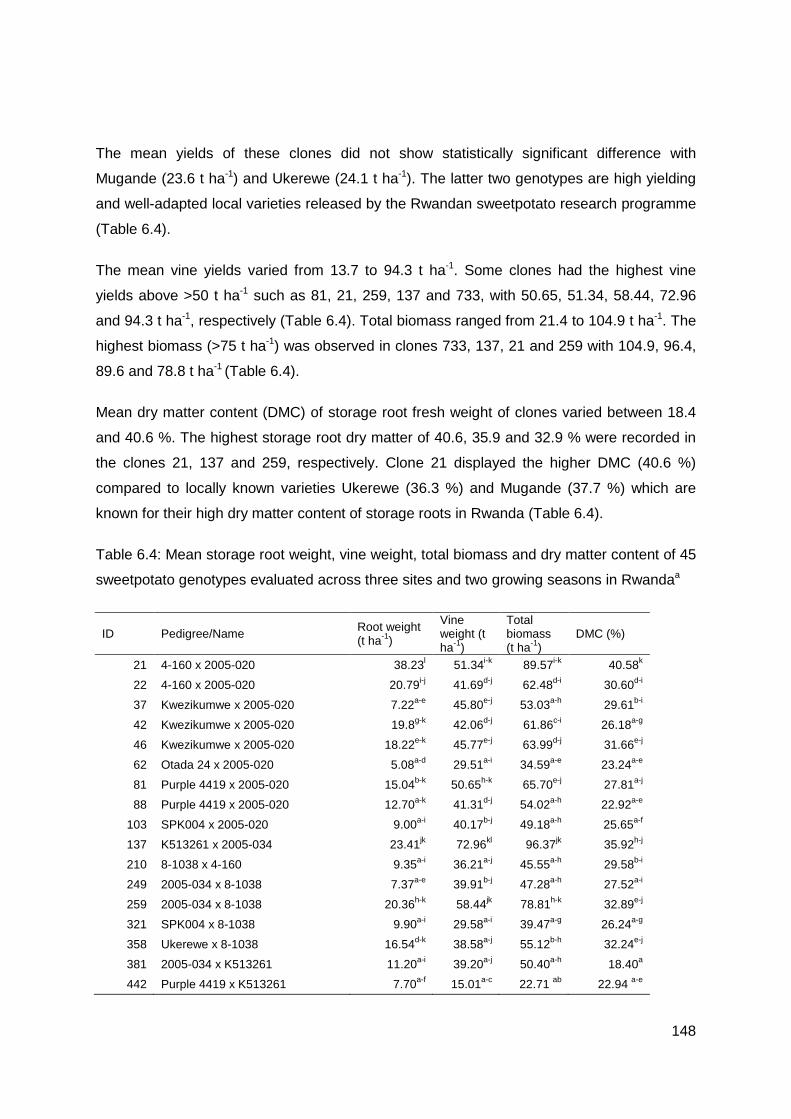
148
The mean yields of these clones did not show statistically significant difference with
Mugande (23.6 t ha-1) and Ukerewe (24.1 t ha-1). The latter two genotypes are high yielding
and well-adapted local varieties released by the Rwandan sweetpotato research programme
(Table 6.4).
The mean vine yields varied from 13.7 to 94.3 t ha-1. Some clones had the highest vine
yields above >50 t ha-1 such as 81, 21, 259, 137 and 733, with 50.65, 51.34, 58.44, 72.96
and 94.3 t ha-1, respectively (Table 6.4). Total biomass ranged from 21.4 to 104.9 t ha-1. The
highest biomass (>75 t ha-1) was observed in clones 733, 137, 21 and 259 with 104.9, 96.4,
89.6 and 78.8 t ha-1 (Table 6.4).
Mean dry matter content (DMC) of storage root fresh weight of clones varied between 18.4
and 40.6 %. The highest storage root dry matter of 40.6, 35.9 and 32.9 % were recorded in
the clones 21, 137 and 259, respectively. Clone 21 displayed the higher DMC (40.6 %)
compared to locally known varieties Ukerewe (36.3 %) and Mugande (37.7 %) which are
known for their high dry matter content of storage roots in Rwanda (Table 6.4).
Table 6.4: Mean storage root weight, vine weight, total biomass and dry matter content of 45
sweetpotato genotypes evaluated across three sites and two growing seasons in Rwandaa
ID Pedigree/Name Root weight (t ha-1)
Vine weight (t ha-1)
Total biomass (t ha-1)
DMC (%)
21 4-160 x 2005-020 38.23l 51.34i-k 89.57i-k 40.58k
22 4-160 x 2005-020 20.79i-j 41.69d-j 62.48d-i 30.60d-i
37 Kwezikumwe x 2005-020 7.22a-e 45.80e-j 53.03a-h 29.61b-i
42 Kwezikumwe x 2005-020 19.8g-k 42.06d-j 61.86c-i 26.18a-g
46 Kwezikumwe x 2005-020 18.22e-k 45.77e-j 63.99d-j 31.66e-j
62 Otada 24 x 2005-020 5.08a-d 29.51a-i 34.59a-e 23.24a-e
81 Purple 4419 x 2005-020 15.04b-k 50.65h-k 65.70e-j 27.81a-j
88 Purple 4419 x 2005-020 12.70a-k 41.31d-j 54.02a-h 22.92a-e
103 SPK004 x 2005-020 9.00a-i 40.17b-j 49.18a-h 25.65a-f
137 K513261 x 2005-034 23.41jk 72.96kl 96.37jk 35.92h-j
210 8-1038 x 4-160 9.35a-i 36.21a-j 45.55a-h 29.58b-i
249 2005-034 x 8-1038 7.37a-e 39.91b-j 47.28a-h 27.52a-i
259 2005-034 x 8-1038 20.36h-k 58.44jk 78.81h-k 32.89e-j
321 SPK004 x 8-1038 9.90a-i 29.58a-i 39.47a-g 26.24a-g
358 Ukerewe x 8-1038 16.54d-k 38.58a-j 55.12b-h 32.24e-j
381 2005-034 x K513261 11.20a-i 39.20a-j 50.40a-h 18.40a
442 Purple 4419 x K513261 7.70a-f 15.01a-c 22.71 ab 22.94 a-e
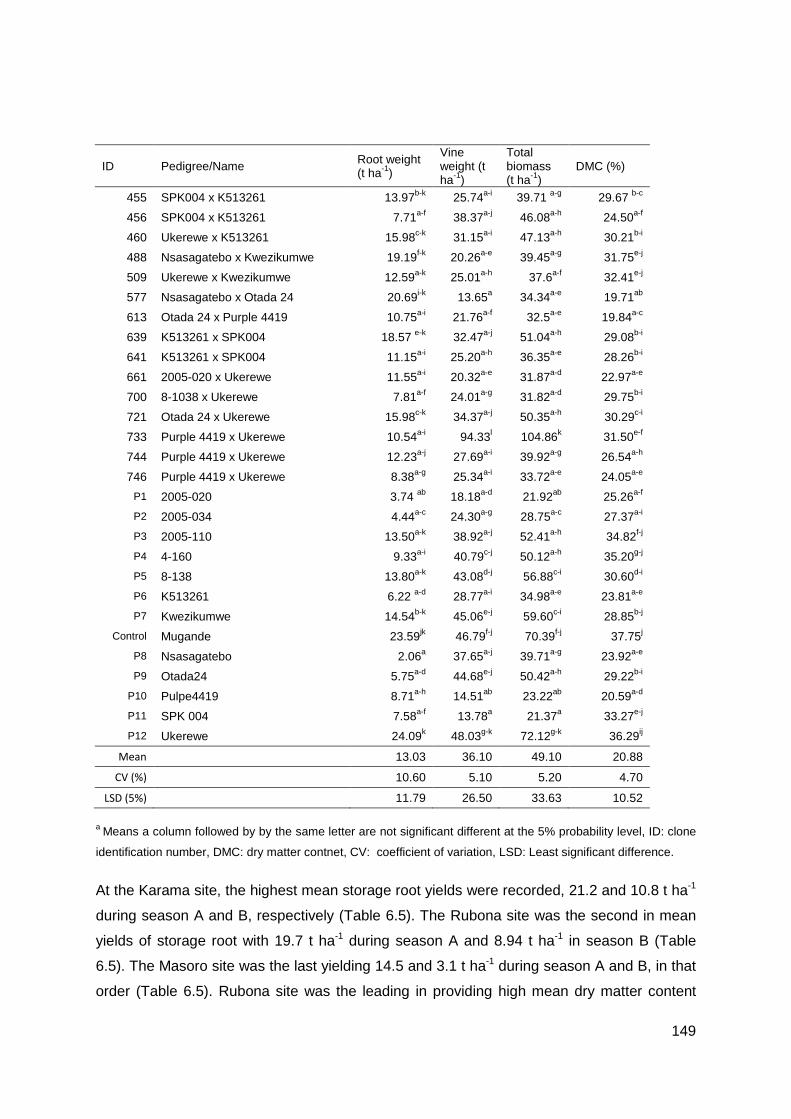
149
ID Pedigree/Name Root weight (t ha-1)
Vine weight (t ha-1)
Total biomass (t ha-1)
DMC (%)
455 SPK004 x K513261 13.97b-k 25.74a-i 39.71 a-g 29.67 b-c
456 SPK004 x K513261 7.71a-f 38.37a-j 46.08a-h 24.50a-f
460 Ukerewe x K513261 15.98c-k 31.15a-i 47.13a-h 30.21b-i
488 Nsasagatebo x Kwezikumwe 19.19f-k 20.26a-e 39.45a-g 31.75e-j
509 Ukerewe x Kwezikumwe 12.59a-k 25.01a-h 37.6a-f 32.41e-j
577 Nsasagatebo x Otada 24 20.69i-k 13.65a 34.34a-e 19.71ab
613 Otada 24 x Purple 4419 10.75a-i 21.76a-f 32.5a-e 19.84a-c
639 K513261 x SPK004 18.57 e-k 32.47a-j 51.04a-h 29.08b-i
641 K513261 x SPK004 11.15a-i 25.20a-h 36.35a-e 28.26b-i
661 2005-020 x Ukerewe 11.55a-i 20.32a-e 31.87a-d 22.97a-e
700 8-1038 x Ukerewe 7.81a-f 24.01a-g 31.82a-d 29.75b-i
721 Otada 24 x Ukerewe 15.98c-k 34.37a-j 50.35a-h 30.29c-i
733 Purple 4419 x Ukerewe 10.54a-i 94.33l 104.86k 31.50e-f
744 Purple 4419 x Ukerewe 12.23a-j 27.69a-i 39.92a-g 26.54a-h
746 Purple 4419 x Ukerewe 8.38a-g 25.34a-i 33.72a-e 24.05a-e
P1 2005-020 3.74 ab 18.18a-d 21.92ab 25.26a-f
P2 2005-034 4.44a-c 24.30a-g 28.75a-c 27.37a-i
P3 2005-110 13.50a-k 38.92a-j 52.41a-h 34.82f-j
P4 4-160 9.33a-i 40.79c-j 50.12a-h 35.20g-j
P5 8-138 13.80a-k 43.08d-j 56.88c-i 30.60d-i
P6 K513261 6.22 a-d 28.77a-i 34.98a-e 23.81a-e
P7 Kwezikumwe 14.54b-k 45.06e-j 59.60c-i 28.85b-j
Control Mugande 23.59jk 46.79f-j 70.39f-j 37.75j
P8 Nsasagatebo 2.06a 37.65a-j 39.71a-g 23.92a-e
P9 Otada24 5.75a-d 44.68e-j 50.42a-h 29.22b-i
P10 Pulpe4419 8.71a-h 14.51ab 23.22ab 20.59a-d
P11 SPK 004 7.58a-f 13.78a 21.37a 33.27e-j
P12 Ukerewe 24.09k 48.03g-k 72.12g-k 36.29ij
Mean 13.03 36.10 49.10 20.88
CV (%) 10.60 5.10 5.20 4.70
LSD (5%) 11.79 26.50 33.63 10.52
a Means a column followed by by the same letter are not significant different at the 5% probability level, ID: clone
identification number, DMC: dry matter contnet, CV: coefficient of variation, LSD: Least significant difference.
At the Karama site, the highest mean storage root yields were recorded, 21.2 and 10.8 t ha-1
during season A and B, respectively (Table 6.5). The Rubona site was the second in mean
yields of storage root with 19.7 t ha-1 during season A and 8.94 t ha-1 in season B (Table
6.5). The Masoro site was the last yielding 14.5 and 3.1 t ha-1 during season A and B, in that
order (Table 6.5). Rubona site was the leading in providing high mean dry matter content

150
(29.9 and 26.4 %) followed by the Masoro and Karama sites. Their dry matter contents were
28.6 and 25.1 and 23.6 and 21.7 % for Seasons A and B, respectively (Table 6.5). During
Season A, vine yields of 71.4, 30.5 and 28.1 t ha-1 were recorded at the Rubona, Masoro
and Karamam sites, respectively (Table 6.5). Karama site was the first in vine yields in
Season B. Rubona site was the second and Masoro site was the last. The yields of the three
sites were 44.3, 27.7 and 14.8 t ha-1, in that order (Table 6.5).

151
6.5: Mean yields and dry matter content of storage root of 45 sweetpotato genotypes evaluated at three sites and two growing seasons in
Rwanda
ID
Yield of storage roots (t ha-1) Yield of vines (t ha-1) Dry matter content of storage root (%)
Season A Season B Season A Season B Season A Season B
Karama Masoro Rubona Karama Masoro Rubona Karama Masoro Rubona Karama Masoro Rubona Karama Masoro Rubona Karama Masoro Rubona
21 30.10 57.40 56.70 27.38 14.08 43.71 32.20 95.20 52.50 30.72 48.61 48.81 45.30 29.30 22.72 33.77 31.23 33.16
22 46.20 0.00 0.00 40.83 14.86 22.84 30.80 2.80 44.10 75.76 43.87 52.80 0.00 10.08 27.73 34.44 30.71 32.66
37 8.40 14.00 15.40 3.11 0.58 1.83 37.80 28.00 143.50 28.62 18.78 18.12 33.86 20.01 19.50 0.00 21.04 35.22
42 41.30 0.00 8.40 31.38 5.13 32.61 53.20 1.40 33.60 88.67 13.07 62.42 10.88 0.00 17.53 19.45 28.29 32.96
46 14.00 12.60 42.00 17.97 10.81 11.95 12.60 22.40 112.00 60.32 29.17 38.13 9.67 11.19 28.33 36.16 21.39 35.23
62 1.40 22.40 2.10 3.11 0.00 1.48 16.10 60.20 2.80 49.78 15.67 32.51 11.52 30.70 8.25 0.00 19.86 21.09
81 42.70 8.40 30.80 0.00 5.91 2.45 60.20 37.80 141.40 0.00 58.10 6.42 33.44 10.53 34.38 21.32 19.21 0.00
88 2.10 8.40 60.90 3.72 0.00 1.10 7.70 29.40 136.50 54.20 0.70 19.38 21.46 9.53 23.48 0.00 9.94 25.11
103 33.60 14.00 0.00 4.78 0.00 1.63 46.20 25.20 112.00 43.17 0.00 14.47 0.00 31.57 33.79 0.00 8.93 31.61
137 42.00 9.80 45.50 23.33 0.00 19.83 31.50 19.60 198.10 113.87 0.00 74.67 35.43 36.55 34.47 0.00 30.96 36.13
210 16.10 15.40 18.90 4.12 0.00 1.56 37.80 28.00 73.50 54.13 8.17 15.63 20.47 35.12 32.99 0.00 9.50 31.43
249 5.60 5.60 20.30 9.33 0.00 3.38 40.60 16.80 121.80 38.89 1.63 19.76 31.15 22.80 22.59 0.00 19.46 21.09
259 23.80 18.20 62.30 6.83 0.00 11.06 24.50 11.20 231.70 40.60 7.00 35.66 30.59 30.83 22.08 0.00 31.29 34.56
321 28.00 15.40 10.50 4.39 0.00 1.10 30.80 33.60 24.85 63.00 0.00 25.20 11.20 34.27 34.64 0.00 8.85 20.49
358 19.60 18.20 1.40 30.33 2.80 26.90 18.20 16.80 65.10 77.00 5.37 49.00 9.67 38.88 36.00 0.00 28.91 31.96
381 21.00 0.00 42.00 0.00 0.00 4.20 44.80 5.60 168.00 0.00 0.00 16.80 11.10 0.00 36.24 0.00 9.09 0.00
442 23.10 18.20 0.00 0.00 3.50 1.40 25.90 25.20 0.00 18.67 9.33 10.97 0.00 34.43 27.34 17.38 10.47 0.00
455 29.40 1.40 43.40 3.73 0.78 5.13 15.40 2.80 104.30 14.00 8.56 9.38 32.05 10.02 36.62 0.00 29.73 21.59
456 12.60 5.60 20.30 5.54 0.00 2.22 10.50 22.40 121.80 58.51 0.00 17.03 32.26 9.69 23.46 0.00 9.71 23.89
460 21.70 43.40 2.10 17.50 0.00 11.20 15.40 21.00 72.80 56.00 0.00 21.70 20.69 37.01 34.28 0.00 19.89 21.38
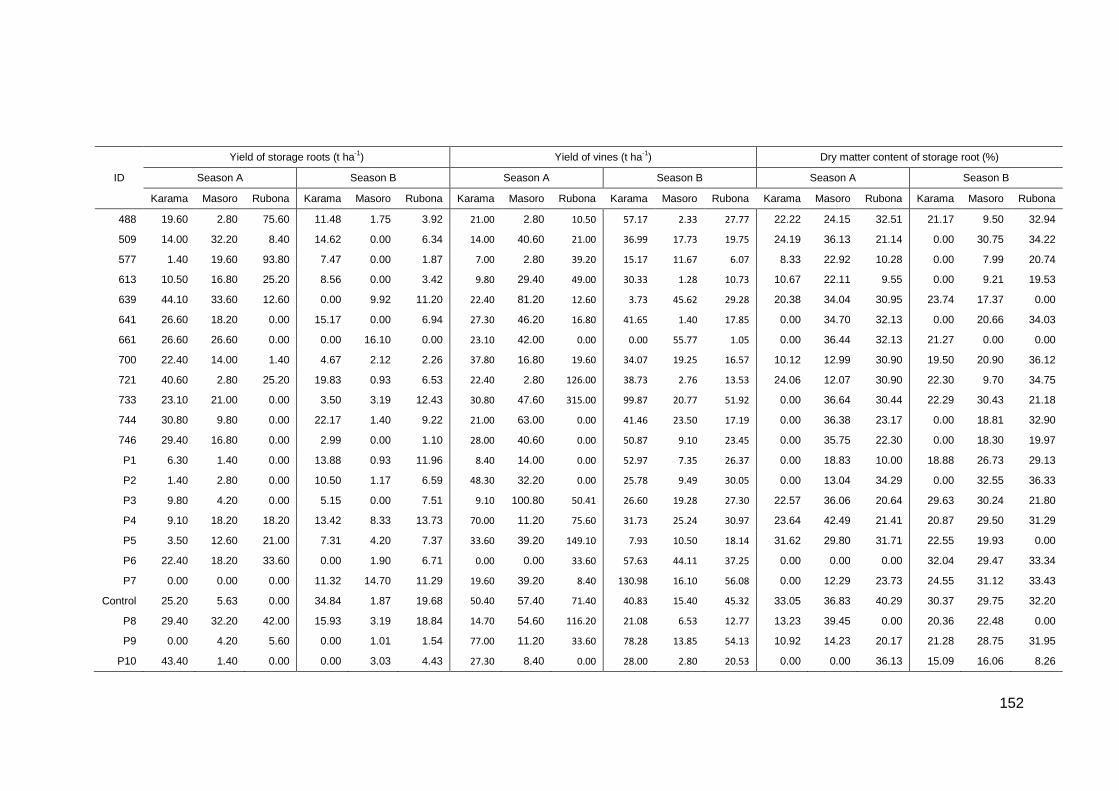
152
ID
Yield of storage roots (t ha-1) Yield of vines (t ha-1) Dry matter content of storage root (%)
Season A Season B Season A Season B Season A Season B
Karama Masoro Rubona Karama Masoro Rubona Karama Masoro Rubona Karama Masoro Rubona Karama Masoro Rubona Karama Masoro Rubona
488 19.60 2.80 75.60 11.48 1.75 3.92 21.00 2.80 10.50 57.17 2.33 27.77 22.22 24.15 32.51 21.17 9.50 32.94
509 14.00 32.20 8.40 14.62 0.00 6.34 14.00 40.60 21.00 36.99 17.73 19.75 24.19 36.13 21.14 0.00 30.75 34.22
577 1.40 19.60 93.80 7.47 0.00 1.87 7.00 2.80 39.20 15.17 11.67 6.07 8.33 22.92 10.28 0.00 7.99 20.74
613 10.50 16.80 25.20 8.56 0.00 3.42 9.80 29.40 49.00 30.33 1.28 10.73 10.67 22.11 9.55 0.00 9.21 19.53
639 44.10 33.60 12.60 0.00 9.92 11.20 22.40 81.20 12.60 3.73 45.62 29.28 20.38 34.04 30.95 23.74 17.37 0.00
641 26.60 18.20 0.00 15.17 0.00 6.94 27.30 46.20 16.80 41.65 1.40 17.85 0.00 34.70 32.13 0.00 20.66 34.03
661 26.60 26.60 0.00 0.00 16.10 0.00 23.10 42.00 0.00 0.00 55.77 1.05 0.00 36.44 32.13 21.27 0.00 0.00
700 22.40 14.00 1.40 4.67 2.12 2.26 37.80 16.80 19.60 34.07 19.25 16.57 10.12 12.99 30.90 19.50 20.90 36.12
721 40.60 2.80 25.20 19.83 0.93 6.53 22.40 2.80 126.00 38.73 2.76 13.53 24.06 12.07 30.90 22.30 9.70 34.75
733 23.10 21.00 0.00 3.50 3.19 12.43 30.80 47.60 315.00 99.87 20.77 51.92 0.00 36.64 30.44 22.29 30.43 21.18
744 30.80 9.80 0.00 22.17 1.40 9.22 21.00 63.00 0.00 41.46 23.50 17.19 0.00 36.38 23.17 0.00 18.81 32.90
746 29.40 16.80 0.00 2.99 0.00 1.10 28.00 40.60 0.00 50.87 9.10 23.45 0.00 35.75 22.30 0.00 18.30 19.97
P1 6.30 1.40 0.00 13.88 0.93 11.96 8.40 14.00 0.00 52.97 7.35 26.37 0.00 18.83 10.00 18.88 26.73 29.13
P2 1.40 2.80 0.00 10.50 1.17 6.59 48.30 32.20 0.00 25.78 9.49 30.05 0.00 13.04 34.29 0.00 32.55 36.33
P3 9.80 4.20 0.00 5.15 0.00 7.51 9.10 100.80 50.41 26.60 19.28 27.30 22.57 36.06 20.64 29.63 30.24 21.80
P4 9.10 18.20 18.20 13.42 8.33 13.73 70.00 11.20 75.60 31.73 25.24 30.97 23.64 42.49 21.41 20.87 29.50 31.29
P5 3.50 12.60 21.00 7.31 4.20 7.37 33.60 39.20 149.10 7.93 10.50 18.14 31.62 29.80 31.71 22.55 19.93 0.00
P6 22.40 18.20 33.60 0.00 1.90 6.71 0.00 0.00 33.60 57.63 44.11 37.25 0.00 0.00 0.00 32.04 29.47 33.34
P7 0.00 0.00 0.00 11.32 14.70 11.29 19.60 39.20 8.40 130.98 16.10 56.08 0.00 12.29 23.73 24.55 31.12 33.43
Control 25.20 5.63 0.00 34.84 1.87 19.68 50.40 57.40 71.40 40.83 15.40 45.32 33.05 36.83 40.29 30.37 29.75 32.20
P8 29.40 32.20 42.00 15.93 3.19 18.84 14.70 54.60 116.20 21.08 6.53 12.77 13.23 39.45 0.00 20.36 22.48 0.00
P9 0.00 4.20 5.60 0.00 1.01 1.54 77.00 11.20 33.60 78.28 13.85 54.13 10.92 14.23 20.17 21.28 28.75 31.95
P10 43.40 1.40 0.00 0.00 3.03 4.43 27.30 8.40 0.00 28.00 2.80 20.53 0.00 0.00 36.13 15.09 16.06 8.26

153
ID
Yield of storage roots (t ha-1) Yield of vines (t ha-1) Dry matter content of storage root (%)
Season A Season B Season A Season B Season A Season B
Karama Masoro Rubona Karama Masoro Rubona Karama Masoro Rubona Karama Masoro Rubona Karama Masoro Rubona Karama Masoro Rubona
P11 22.40 4.20 0.00 11.43 0.93 6.53 25.90 12.60 0.00 20.77 5.13 18.29 0.00 35.63 32.91 21.83 29.77 31.47
P12 29.40 43.40 39.90 15.59 2.92 13.33 23.10 68.60 105.00 53.04 8.87 29.55 19.72 40.29 30.44 21.24 30.29 33.78
Mean 21.20 14.47 19.68 10.83 3.07 8.94 28.10 30.50 71.40 44.30 14.75 27.70 23.61 28.57 29.88 21.70 25.08 26.42
CV (%) 32.20 8.40 32.80 0.40 3.90 31.20 22.20 19.30 18.00 9.10 8.60 58.60 10.40 6.50 16.60 8.60 21.90 12.00
LSD
(5%) 28.56 18.66 59.65 5.66 6.55 10.90 34.32 38.18 136.00 41.19 17.31 31.75 19.08 19.76 47.88 15.93 18.94 20.37
ID: clone identification number, Season A: September 2014-February 2015, Season B: March-August 2015.
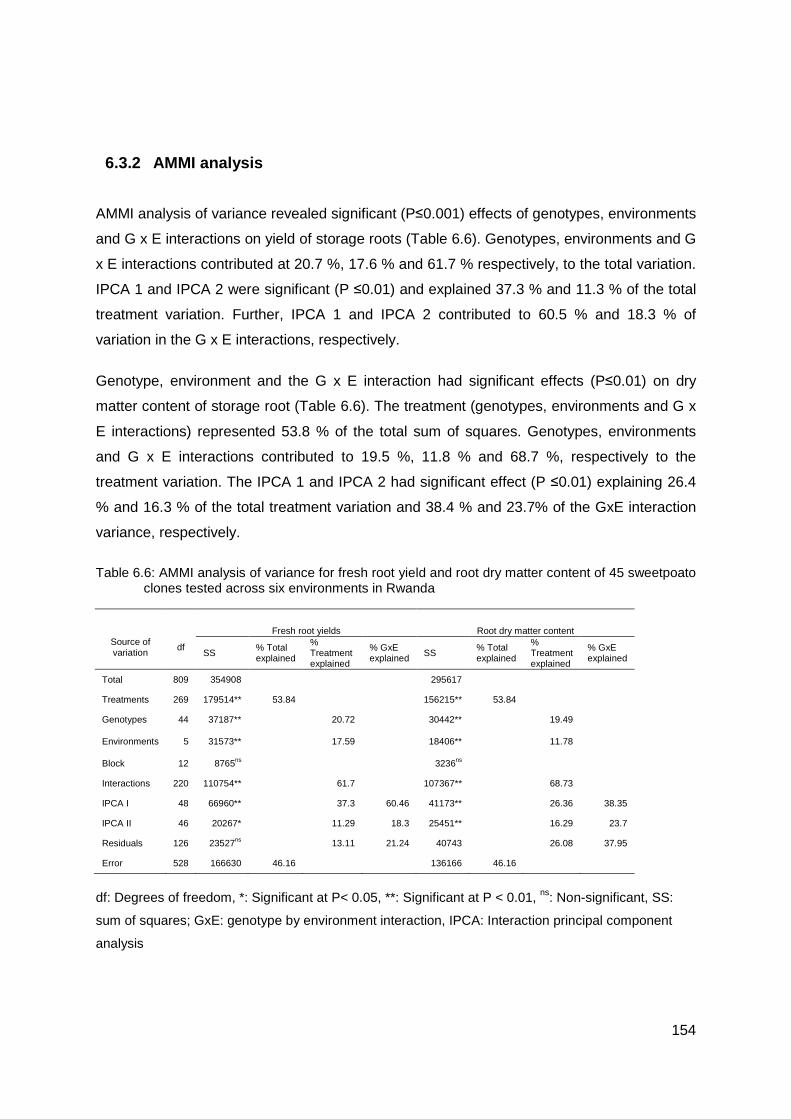
154
6.3.2 AMMI analysis
AMMI analysis of variance revealed significant (P≤0.001) effects of genotypes, environments
and G x E interactions on yield of storage roots (Table 6.6). Genotypes, environments and G
x E interactions contributed at 20.7 %, 17.6 % and 61.7 % respectively, to the total variation.
IPCA 1 and IPCA 2 were significant (P ≤0.01) and explained 37.3 % and 11.3 % of the total
treatment variation. Further, IPCA 1 and IPCA 2 contributed to 60.5 % and 18.3 % of
variation in the G x E interactions, respectively.
Genotype, environment and the G x E interaction had significant effects (P≤0.01) on dry
matter content of storage root (Table 6.6). The treatment (genotypes, environments and G x
E interactions) represented 53.8 % of the total sum of squares. Genotypes, environments
and G x E interactions contributed to 19.5 %, 11.8 % and 68.7 %, respectively to the
treatment variation. The IPCA 1 and IPCA 2 had significant effect (P ≤0.01) explaining 26.4
% and 16.3 % of the total treatment variation and 38.4 % and 23.7% of the GxE interaction
variance, respectively.
Table 6.6: AMMI analysis of variance for fresh root yield and root dry matter content of 45 sweetpoato clones tested across six environments in Rwanda
Source of variation
df
Fresh root yields Root dry matter content
SS % Total explained
% Treatment explained
% GxE explained SS
% Total explained
% Treatment explained
% GxE explained
Total 809 354908
295617
Treatments 269 179514** 53.84
156215** 53.84
Genotypes 44 37187**
20.72
30442**
19.49
Environments 5 31573**
17.59
18406**
11.78
Block 12 8765ns
3236ns
Interactions 220 110754**
61.7
107367**
68.73
IPCA I 48 66960**
37.3 60.46 41173**
26.36 38.35
IPCA II 46 20267*
11.29 18.3 25451**
16.29 23.7
Residuals 126 23527ns
13.11 21.24 40743
26.08 37.95
Error 528 166630 46.16 136166 46.16
df: Degrees of freedom, *: Significant at P< 0.05, **: Significant at P < 0.01, ns: Non-significant, SS:
sum of squares; GxE: genotype by environment interaction, IPCA: Interaction principal component
analysis

155
The four best sweetpotato clones selected through AMMI for storage root yield across six
environments is presented in Table 6.7. The clone 21 (4-160 x 2005-020) was selected as
the first in three environments (E2, E5, E6), whilst clone 22 (4-160 x 2005-020) was selected
across two environments (E1, E4) and clone 577 (Nsasagatebo x Otada 24) only in one
environment (E3). Across all environments, the clones that appeared the best with high
storage root yields were clone 21, 22 and 42 (selected 4 times), 137 (3 times), ukerewe (2
times) and clone 88, 259, 460, 488, 509, 577 and Kwezikumwe (once) (Table 6.7).
For dry matter content, the genotype Mugande (Control) was the first in three environments
(E1, E4, E6) followed by the clones 21, 22 and 358 selected in E3, E5 and E2, respectively.
The clones that were selected among the best four with high dry matter content across all
environments were 100 with 4 times, clones 21, 22, 46 and 137 (three times), clone 358 (two
times) and clones 81, 460, 641, P6 (K513261), P11 (SPK004) and P12 (Ukerewe) (Table
6.7).
Table 6.7: The best four clones of AMMI selections per environment based on fresh root
yield and root dry matter content
Fresh root yield (t ha-1) Environment Mean PCA Scores 1 2 3 4
E1 21.2 3.464 22 42 137 P7
E2 14.47 0.919 21 460 P12 509
E3 19.68 -11.019 577 488 259 88
E4 10.83 2.715 22 42 21 137
E5 3.07 1.78 21 22 P12 42
E6 8.94 2.14 21 22 42 137
Storage root dry matter content (%) Environment Mean PCA Score 1 2 3 4
E1 25.88 1.878 Control P12 137 358
E2 24.57 2.065 358 137 460 641
E3 16.61 -9.862 21 137 81 Control
E4 24.42 2.5 Control 22 P11 46
E5 12.7 1.634 22 46 P6 21
E6 21.08 1.784 Control 21 22 46
E1: Karama season A 2015, E2: Masoro season A 2015, E3: Rubona season A 2015, E4: Karama
season B 2015, E5: Masoro season B 2015, E6: Rubona season B 2015, PCA: principal component
analysis, P1...P12: parents used in crossing. See Tables 1 and 2, for codes of environments (E1-E6)
and genotypes, respectively.
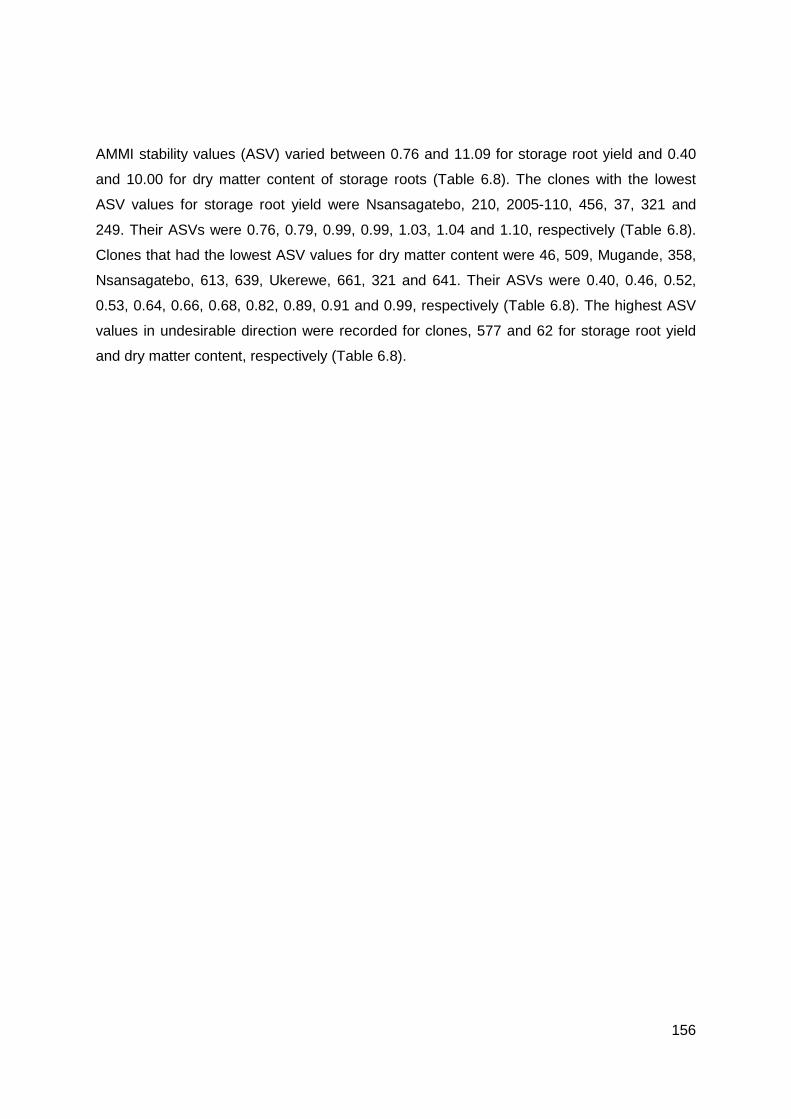
156
AMMI stability values (ASV) varied between 0.76 and 11.09 for storage root yield and 0.40
and 10.00 for dry matter content of storage roots (Table 6.8). The clones with the lowest
ASV values for storage root yield were Nsansagatebo, 210, 2005-110, 456, 37, 321 and
249. Their ASVs were 0.76, 0.79, 0.99, 0.99, 1.03, 1.04 and 1.10, respectively (Table 6.8).
Clones that had the lowest ASV values for dry matter content were 46, 509, Mugande, 358,
Nsansagatebo, 613, 639, Ukerewe, 661, 321 and 641. Their ASVs were 0.40, 0.46, 0.52,
0.53, 0.64, 0.66, 0.68, 0.82, 0.89, 0.91 and 0.99, respectively (Table 6.8). The highest ASV
values in undesirable direction were recorded for clones, 577 and 62 for storage root yield
and dry matter content, respectively (Table 6.8).
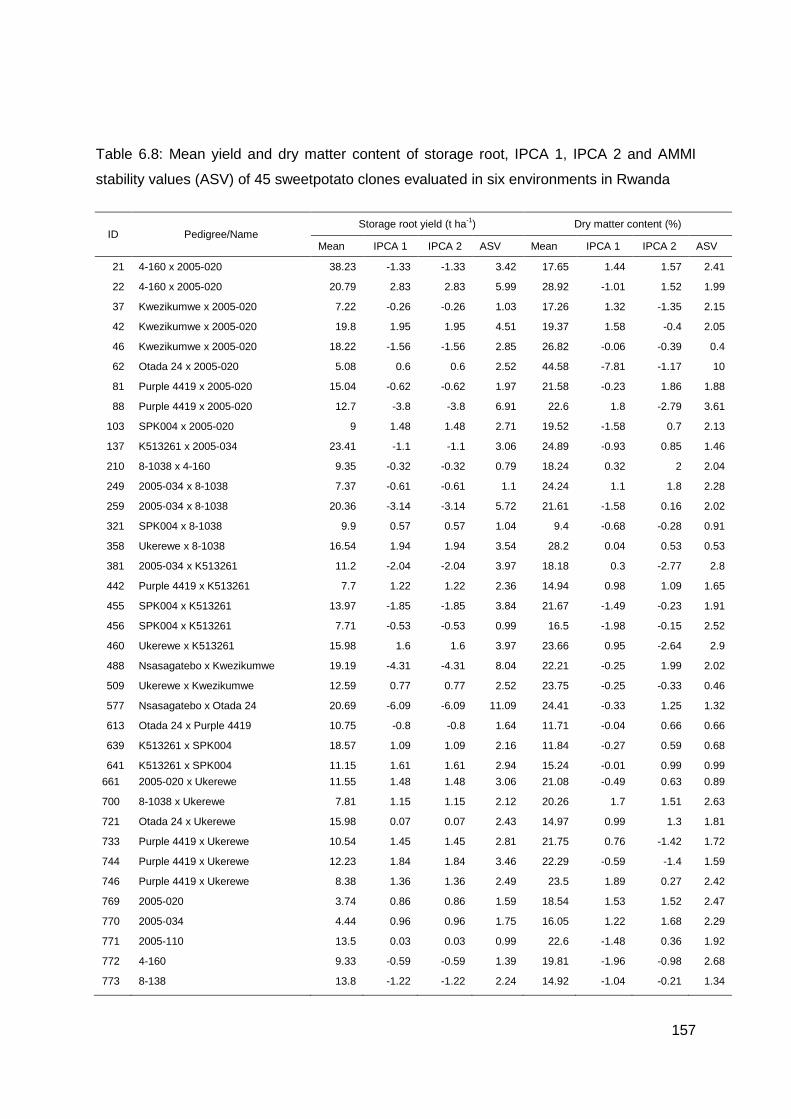
157
Table 6.8: Mean yield and dry matter content of storage root, IPCA 1, IPCA 2 and AMMI
stability values (ASV) of 45 sweetpotato clones evaluated in six environments in Rwanda
ID Pedigree/Name Storage root yield (t ha-1) Dry matter content (%)
Mean IPCA 1 IPCA 2 ASV Mean IPCA 1 IPCA 2 ASV
21 4-160 x 2005-020 38.23 -1.33 -1.33 3.42 17.65 1.44 1.57 2.41
22 4-160 x 2005-020 20.79 2.83 2.83 5.99 28.92 -1.01 1.52 1.99
37 Kwezikumwe x 2005-020 7.22 -0.26 -0.26 1.03 17.26 1.32 -1.35 2.15
42 Kwezikumwe x 2005-020 19.8 1.95 1.95 4.51 19.37 1.58 -0.4 2.05
46 Kwezikumwe x 2005-020 18.22 -1.56 -1.56 2.85 26.82 -0.06 -0.39 0.4
62 Otada 24 x 2005-020 5.08 0.6 0.6 2.52 44.58 -7.81 -1.17 10
81 Purple 4419 x 2005-020 15.04 -0.62 -0.62 1.97 21.58 -0.23 1.86 1.88
88 Purple 4419 x 2005-020 12.7 -3.8 -3.8 6.91 22.6 1.8 -2.79 3.61
103 SPK004 x 2005-020 9 1.48 1.48 2.71 19.52 -1.58 0.7 2.13
137 K513261 x 2005-034 23.41 -1.1 -1.1 3.06 24.89 -0.93 0.85 1.46
210 8-1038 x 4-160 9.35 -0.32 -0.32 0.79 18.24 0.32 2 2.04
249 2005-034 x 8-1038 7.37 -0.61 -0.61 1.1 24.24 1.1 1.8 2.28
259 2005-034 x 8-1038 20.36 -3.14 -3.14 5.72 21.61 -1.58 0.16 2.02
321 SPK004 x 8-1038 9.9 0.57 0.57 1.04 9.4 -0.68 -0.28 0.91
358 Ukerewe x 8-1038 16.54 1.94 1.94 3.54 28.2 0.04 0.53 0.53
381 2005-034 x K513261 11.2 -2.04 -2.04 3.97 18.18 0.3 -2.77 2.8
442 Purple 4419 x K513261 7.7 1.22 1.22 2.36 14.94 0.98 1.09 1.65
455 SPK004 x K513261 13.97 -1.85 -1.85 3.84 21.67 -1.49 -0.23 1.91
456 SPK004 x K513261 7.71 -0.53 -0.53 0.99 16.5 -1.98 -0.15 2.52
460 Ukerewe x K513261 15.98 1.6 1.6 3.97 23.66 0.95 -2.64 2.9
488 Nsasagatebo x Kwezikumwe 19.19 -4.31 -4.31 8.04 22.21 -0.25 1.99 2.02
509 Ukerewe x Kwezikumwe 12.59 0.77 0.77 2.52 23.75 -0.25 -0.33 0.46
577 Nsasagatebo x Otada 24 20.69 -6.09 -6.09 11.09 24.41 -0.33 1.25 1.32
613 Otada 24 x Purple 4419 10.75 -0.8 -0.8 1.64 11.71 -0.04 0.66 0.66
639 K513261 x SPK004 18.57 1.09 1.09 2.16 11.84 -0.27 0.59 0.68
641 K513261 x SPK004 11.15 1.61 1.61 2.94 15.24 -0.01 0.99 0.99
661 2005-020 x Ukerewe 11.55 1.48 1.48 3.06 21.08 -0.49 0.63 0.89
700 8-1038 x Ukerewe 7.81 1.15 1.15 2.12 20.26 1.7 1.51 2.63
721 Otada 24 x Ukerewe 15.98 0.07 0.07 2.43 14.97 0.99 1.3 1.81
733 Purple 4419 x Ukerewe 10.54 1.45 1.45 2.81 21.75 0.76 -1.42 1.72
744 Purple 4419 x Ukerewe 12.23 1.84 1.84 3.46 22.29 -0.59 -1.4 1.59
746 Purple 4419 x Ukerewe 8.38 1.36 1.36 2.49 23.5 1.89 0.27 2.42
769 2005-020 3.74 0.86 0.86 1.59 18.54 1.53 1.52 2.47
770 2005-034 4.44 0.96 0.96 1.75 16.05 1.22 1.68 2.29
771 2005-110 13.5 0.03 0.03 0.99 22.6 -1.48 0.36 1.92
772 4-160 9.33 -0.59 -0.59 1.39 19.81 -1.96 -0.98 2.68
773 8-138 13.8 -1.22 -1.22 2.24 14.92 -1.04 -0.21 1.34
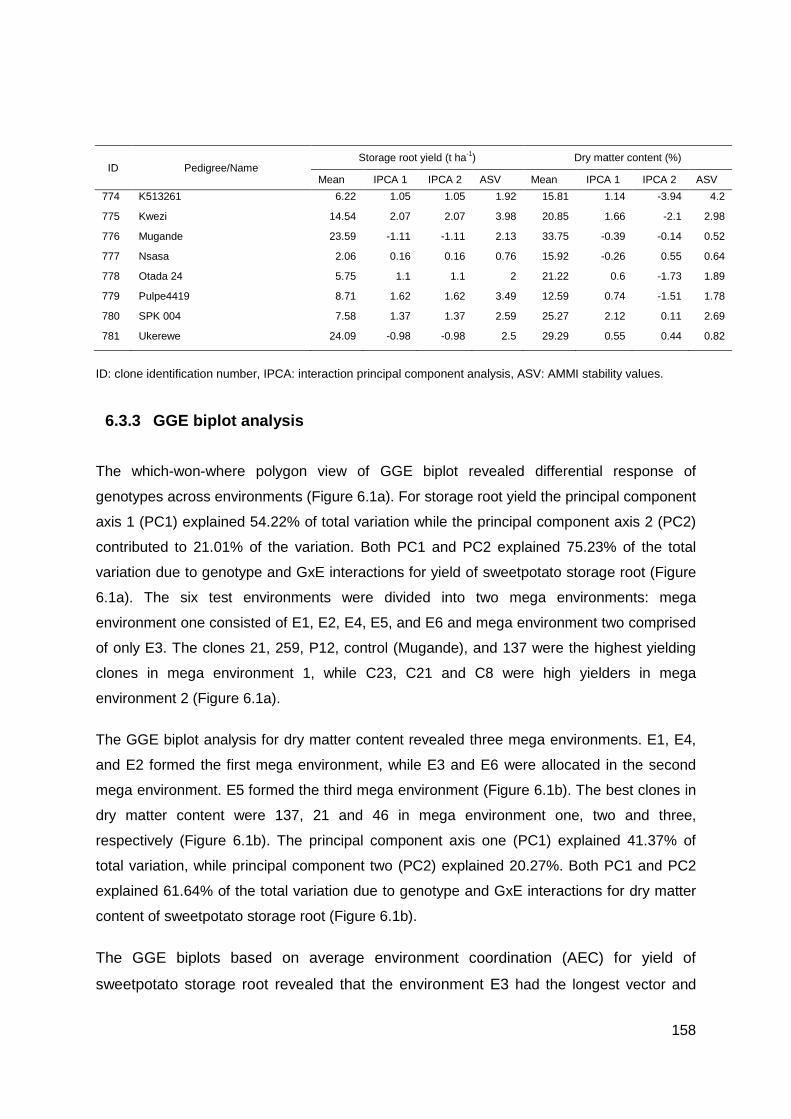
158
ID Pedigree/Name Storage root yield (t ha-1) Dry matter content (%)
Mean IPCA 1 IPCA 2 ASV Mean IPCA 1 IPCA 2 ASV
774 K513261 6.22 1.05 1.05 1.92 15.81 1.14 -3.94 4.2
775 Kwezi 14.54 2.07 2.07 3.98 20.85 1.66 -2.1 2.98
776 Mugande 23.59 -1.11 -1.11 2.13 33.75 -0.39 -0.14 0.52
777 Nsasa 2.06 0.16 0.16 0.76 15.92 -0.26 0.55 0.64
778 Otada 24 5.75 1.1 1.1 2 21.22 0.6 -1.73 1.89
779 Pulpe4419 8.71 1.62 1.62 3.49 12.59 0.74 -1.51 1.78
780 SPK 004 7.58 1.37 1.37 2.59 25.27 2.12 0.11 2.69
781 Ukerewe 24.09 -0.98 -0.98 2.5 29.29 0.55 0.44 0.82
ID: clone identification number, IPCA: interaction principal component analysis, ASV: AMMI stability values.
6.3.3 GGE biplot analysis
The which-won-where polygon view of GGE biplot revealed differential response of
genotypes across environments (Figure 6.1a). For storage root yield the principal component
axis 1 (PC1) explained 54.22% of total variation while the principal component axis 2 (PC2)
contributed to 21.01% of the variation. Both PC1 and PC2 explained 75.23% of the total
variation due to genotype and GxE interactions for yield of sweetpotato storage root (Figure
6.1a). The six test environments were divided into two mega environments: mega
environment one consisted of E1, E2, E4, E5, and E6 and mega environment two comprised
of only E3. The clones 21, 259, P12, control (Mugande), and 137 were the highest yielding
clones in mega environment 1, while C23, C21 and C8 were high yielders in mega
environment 2 (Figure 6.1a).
The GGE biplot analysis for dry matter content revealed three mega environments. E1, E4,
and E2 formed the first mega environment, while E3 and E6 were allocated in the second
mega environment. E5 formed the third mega environment (Figure 6.1b). The best clones in
dry matter content were 137, 21 and 46 in mega environment one, two and three,
respectively (Figure 6.1b). The principal component axis one (PC1) explained 41.37% of
total variation, while principal component two (PC2) explained 20.27%. Both PC1 and PC2
explained 61.64% of the total variation due to genotype and GxE interactions for dry matter
content of sweetpotato storage root (Figure 6.1b).
The GGE biplots based on average environment coordination (AEC) for yield of
sweetpotato storage root revealed that the environment E3 had the longest vector and
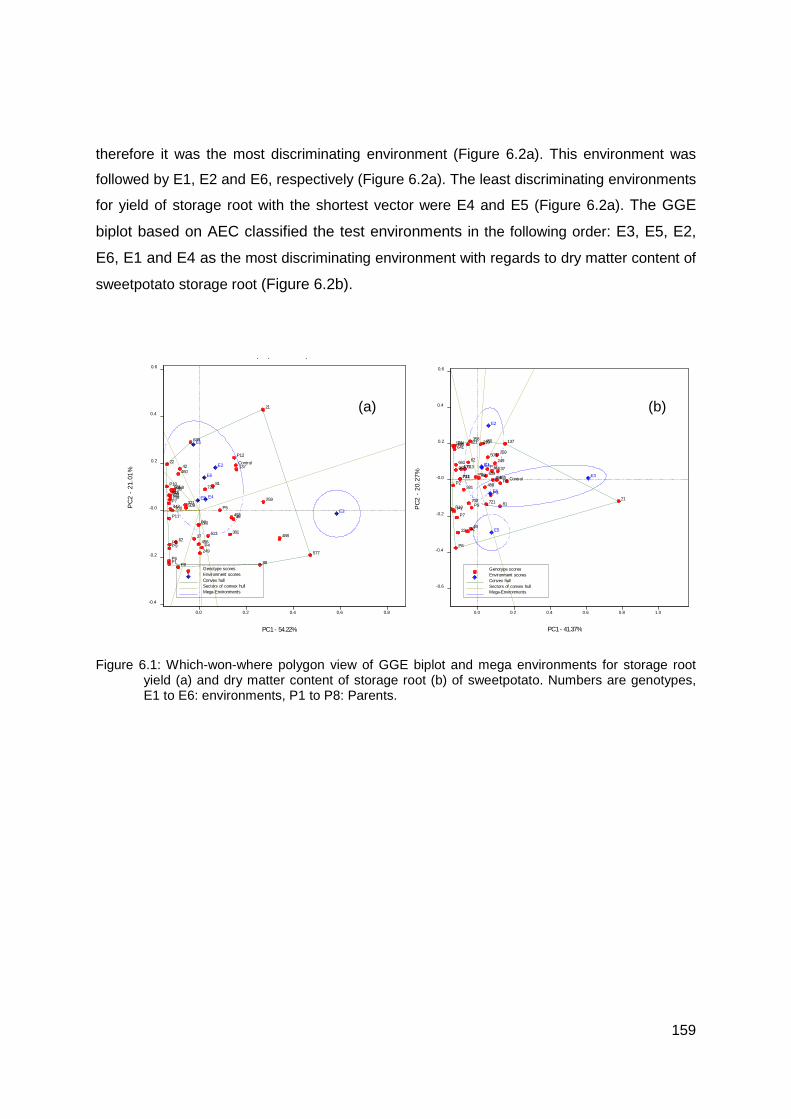
159
therefore it was the most discriminating environment (Figure 6.2a). This environment was
followed by E1, E2 and E6, respectively (Figure 6.2a). The least discriminating environments
for yield of storage root with the shortest vector were E4 and E5 (Figure 6.2a). The GGE
biplot based on AEC classified the test environments in the following order: E3, E5, E2,
E6, E1 and E4 as the most discriminating environment with regards to dry matter content of
sweetpotato storage root (Figure 6.2b).
Figure 6.1: Which-won-where polygon view of GGE biplot and mega environments for storage root yield (a) and dry matter content of storage root (b) of sweetpotato. Numbers are genotypes, E1 to E6: environments, P1 to P8: Parents.
456
46
460
488
103
137
509
Scatter plot (Total - 75.23%)
21
210
22
249 577
613
259321
358
3762
639
381
42
442
455
P9
P8
P7
P6
P5
P4
P3
P2
P12
P11
P10
P1
Control
88
81
746744
733 721
700
661
641
E1
E2
E3
E4E5
E6
-0.4
-0.2
-0.0
0.0
0.2
0.4
0.4
0.8
0.6
0.2 0.6
PC1 - 54.22%
PC
2 -
21.0
1%
Mega-Environments
Environment scoresConvex hullSectors of convex hull
Genotype scores
358
37
381
42
442
103 137
21
210
22
249
259
321
P9
P8
P7
P6
P5
P4
P3
P2
P12
P11
P10P1
Control88
81
746744
733
721700
661
641
639
62
613577
509
488
460
46
456455
E1
E2
E3
E4
E5
E6
-0.6
-0.4
-0.2
0.0
-0.0
0.4
0.2
0.8
0.4
0.6
0.2 1.0 0.6
PC
2 -
20.2
7%
PC1 - 41.37%
Mega-Environments
Environment scoresConvex hullSectors of convex hull
Genotype scores
(a) (b)
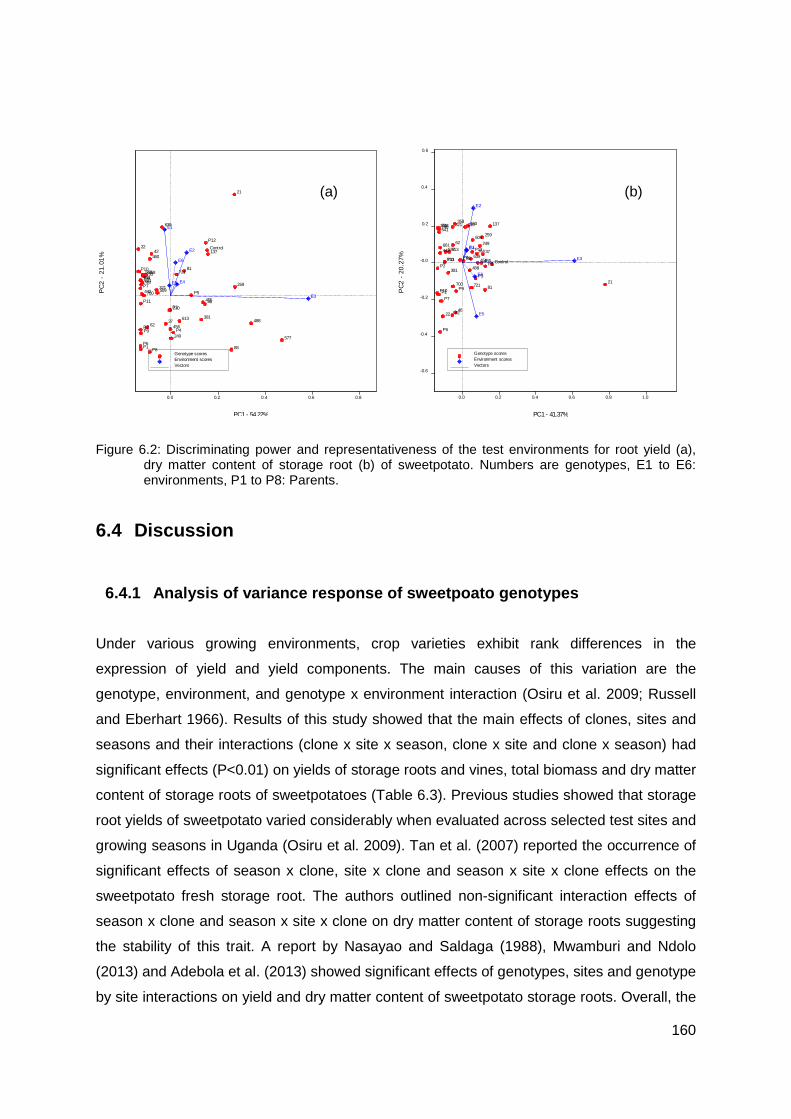
160
Figure 6.2: Discriminating power and representativeness of the test environments for root yield (a), dry matter content of storage root (b) of sweetpotato. Numbers are genotypes, E1 to E6: environments, P1 to P8: Parents.
6.4 Discussion
6.4.1 Analysis of variance response of sweetpoato genotypes
Under various growing environments, crop varieties exhibit rank differences in the
expression of yield and yield components. The main causes of this variation are the
genotype, environment, and genotype x environment interaction (Osiru et al. 2009; Russell
and Eberhart 1966). Results of this study showed that the main effects of clones, sites and
seasons and their interactions (clone x site x season, clone x site and clone x season) had
significant effects (P<0.01) on yields of storage roots and vines, total biomass and dry matter
content of storage roots of sweetpotatoes (Table 6.3). Previous studies showed that storage
root yields of sweetpotato varied considerably when evaluated across selected test sites and
growing seasons in Uganda (Osiru et al. 2009). Tan et al. (2007) reported the occurrence of
significant effects of season x clone, site x clone and season x site x clone effects on the
sweetpotato fresh storage root. The authors outlined non-significant interaction effects of
season x clone and season x site x clone on dry matter content of storage roots suggesting
the stability of this trait. A report by Nasayao and Saldaga (1988), Mwamburi and Ndolo
(2013) and Adebola et al. (2013) showed significant effects of genotypes, sites and genotype
by site interactions on yield and dry matter content of sweetpotato storage roots. Overall, the
103
137
21
210
22
249
259321
358
37381
42
442
455
456
46
460
488
509
577
61362
639
641
661
700
721733744746
81
88
Control
P1
P10
P11
P12
P2
P3
P4
P5
P6
P7
P8
P9
E3
E6
E1
E5
E2
E4
0.6 0.8 0.0 0.4 0.2
PC1 - 54.22%
PC
2 -
21.0
1%
VectorsEnvironment scoresGenotype scores
103 137
21
210
22
249
259
321358
37
381
42
442
455456
46
460
488
509
577613
62
639
641
661
700 721
733
744746
81
88Control
P1P10
P11
P12
P2
P3
P4
P5
P6
P7
P8
P9
E4E1
E3
E5
E2
E6
-0.6
0.0
-0.4
0.4
-0.2
0.8
-0.0
0.2
0.4
0.6
0.2 1.0 0.6 P
C2
- 20
.27%
PC1 - 41.37%
VectorsEnvironment scoresGenotype scores
(b) (a)
161
above studies demonstrated the importance of multi-environmental trials (METS) of pre-
released genotypes to identify promising clones and appropriate growing environments to
enhance productivity.
During the present study the yield of storage root varied between 2.1 and 38.2 t ha-1 where
the best clone (clone 21) yielded at 38.2 t ha-1 (Table 6.4). Mbwaga et al. (2007) observed a
significant yield variation among sweetpotato genotypes producing between 23.0 and 26.0 t
ha-1 of storage roots. A high yielding genotype with a yield potential of 20.7 t ha-1 across
three different agro-ecological zones was reported elsewhere (Kathabwalika et al. 2013).
Mean yields of 16.8 and 15.2 t ha-1 were reported in Nairobi and Western Kenya,
respectively (Mwamburi and Ndolo 2013). The present study identified other promising
clones such as 137, 22, 577 and 259 with mean storage yields of 23.4, 20.8, 20.7 and 20.4 t
ha-1, respectively (Table 6.4). These yield levels are comparable to previous findings.
Interestingly, the mean yields of the presently selected and high yielding clones had not
shown statistical significance difference to that of the locally popular varieties such as
Mugande (23.6 t ha-1) and Ukerewe (24.1 t ha-1) (Table 6.4). Overall, clones 21, 137, 22, 577
and 259) are recommended as candidate varieties because of their high yield potential and
genetic stability when compared to the control varieties widely grown in Rwanda.
In Rwanda high, vine yields of 83.6 to 93.9 t ha-1 and total biomass of 93.5 to 111.3 t ha−1
were reported (Rukundo et al. 2015) . In the current study, the highest vine yields and total
biomass among sweetpotato clones were 94.3 t ha-1 and 104.9 t ha-1, respectively across
three sites and two growing seasons (Table 6.4). The study sites and growing seasons had
marked differences in vine yields and total biomass (Table 6.5). These variations are due to
genotype by environment interactions.
In the current study, dry matter content of storage roots varied from 18.4 and 40.9 %. Earlier
studies reported a broad variation among genotypes in dry matter content of storage roots
(Courtney et al. 2008). Cervantes-Flores et al. (2011) reported that dry matter content of
storage roots showed a normal distribution with values of 15 to 35 % and a mean of 25 %
when evaluating a mapping population. The current study recorded the highest dry matter
content of storage roots of 40.6, 35.9, and 32.9 in the clones 21, 137, and 259, respectively.
Clone 21 had a dry matter content of 40.6 % above Ukerewe (36.3 %) and Mugande (37.7
%) which are popular varieties in Rwanda for their high dry matter content (Table 6.4). In
Rwanda, Shumbusha et al. (2010) indicated that high storage root dry matter content is an
162
important attribute for high adoption of sweetpotato varieties. In the country growers and end
users prefer sweetpotato genotypes with dry matter content above 25 %. Therefore, the
selected clones (21, 137 and 259) are ideal possessing high yielding potential and increased
dry matter content for wide-area recommendation to farmers and end-users in the country.
Storage root yields of sweetpotato genotypes are reported to be variably expressed across
test sites and growing seasons affecting cultivar ranks (Osiru et al. 2009). At the Karama site
the highest mean yields were achieved at 21.2 and 10.8 t ha-1 during season A and B,
respectively (Table 6.5). The yield levels were comparatively higher than the Rubona and
Masoro sites across seasons. Conversely, the tested clones had the highest dry mater
content at the Rubona site during both seasons (29.9 and 25.1 %) than the Masoro (28.6
and 25.1 %) and Karama (23.6 and 21.7 %) sites (Table 6.5). Variation in micro- and macro-
climatic conditions and soil characteristics were reportedly the major factors causing
differences in yields of sweetpotato across environments (Carey et al. 1997; Osiru et al.
2009).
6.4.2 AMMI analysis
Similar to the present study, AMMI analysis of variance for storage yields of sweetpotato
was reported to show significant effects (p=0.01) of genotypes x locations, genotypes x
seasons and locations x seasons interactions (Osiru et al. 2009). In a study conducted using
AMMI analysis involving 28 sweetpotato breeding clones evaluated over two years and two
locations, Adebola et al. (2013) found significant effects (P < 0.01) of environments,
genotype and G x E interactions for yield of storage roots.
In the present study, environments and G x E interaction accounted for 53.8 % of the total
sum of squares. The contribution of genotypes, environments and G x E interaction to the
total variation, were 20.7 %, 17.6 % and 61.7% respectively (Table 6.6). In previous studies
it was reported that environmental effects contributed significantly to the total variation
(Bacusmo et al. 1988; Ngeve 1993), whereas other researchers reported genotypic main
effects to be main contributors (Abidin et al. 2005; Caliskan et al. 2007; Grunerberg et al.
2005; Manrique and Hermann 2000). Gauch and Zobel (1996) pointed out that in multi-
locational trials, the main effect of environments represented up to 80 % of the total
variation, whereas genotype and GxE interactions each represented 10 %. Abidin et al.
(2005) reported that the genotypic main effect was larger than the interaction effects, while
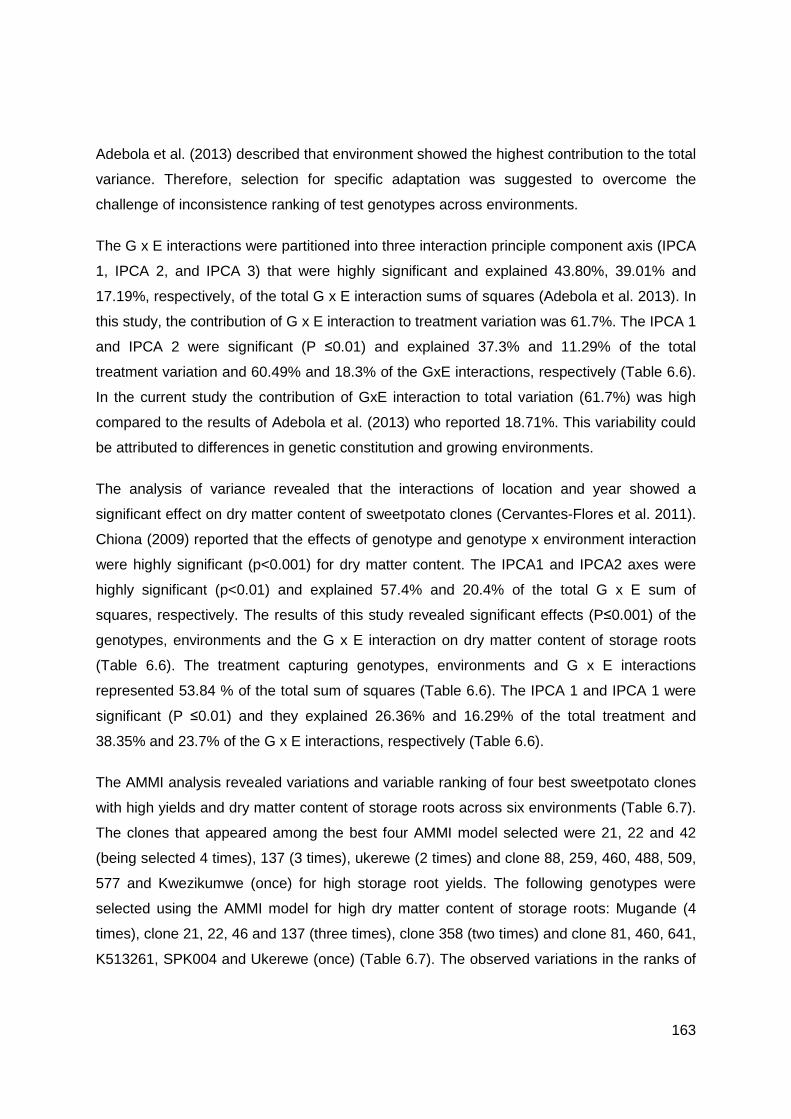
163
Adebola et al. (2013) described that environment showed the highest contribution to the total
variance. Therefore, selection for specific adaptation was suggested to overcome the
challenge of inconsistence ranking of test genotypes across environments.
The G x E interactions were partitioned into three interaction principle component axis (IPCA
1, IPCA 2, and IPCA 3) that were highly significant and explained 43.80%, 39.01% and
17.19%, respectively, of the total G x E interaction sums of squares (Adebola et al. 2013). In
this study, the contribution of G x E interaction to treatment variation was 61.7%. The IPCA 1
and IPCA 2 were significant (P ≤0.01) and explained 37.3% and 11.29% of the total
treatment variation and 60.49% and 18.3% of the GxE interactions, respectively (Table 6.6).
In the current study the contribution of GxE interaction to total variation (61.7%) was high
compared to the results of Adebola et al. (2013) who reported 18.71%. This variability could
be attributed to differences in genetic constitution and growing environments.
The analysis of variance revealed that the interactions of location and year showed a
significant effect on dry matter content of sweetpotato clones (Cervantes-Flores et al. 2011).
Chiona (2009) reported that the effects of genotype and genotype x environment interaction
were highly significant (p<0.001) for dry matter content. The IPCA1 and IPCA2 axes were
highly significant (p<0.01) and explained 57.4% and 20.4% of the total G x E sum of
squares, respectively. The results of this study revealed significant effects (P≤0.001) of the
genotypes, environments and the G x E interaction on dry matter content of storage roots
(Table 6.6). The treatment capturing genotypes, environments and G x E interactions
represented 53.84 % of the total sum of squares (Table 6.6). The IPCA 1 and IPCA 1 were
significant (P ≤0.01) and they explained 26.36% and 16.29% of the total treatment and
38.35% and 23.7% of the G x E interactions, respectively (Table 6.6).
The AMMI analysis revealed variations and variable ranking of four best sweetpotato clones
with high yields and dry matter content of storage roots across six environments (Table 6.7).
The clones that appeared among the best four AMMI model selected were 21, 22 and 42
(being selected 4 times), 137 (3 times), ukerewe (2 times) and clone 88, 259, 460, 488, 509,
577 and Kwezikumwe (once) for high storage root yields. The following genotypes were
selected using the AMMI model for high dry matter content of storage roots: Mugande (4
times), clone 21, 22, 46 and 137 (three times), clone 358 (two times) and clone 81, 460, 641,
K513261, SPK004 and Ukerewe (once) (Table 6.7). The observed variations in the ranks of
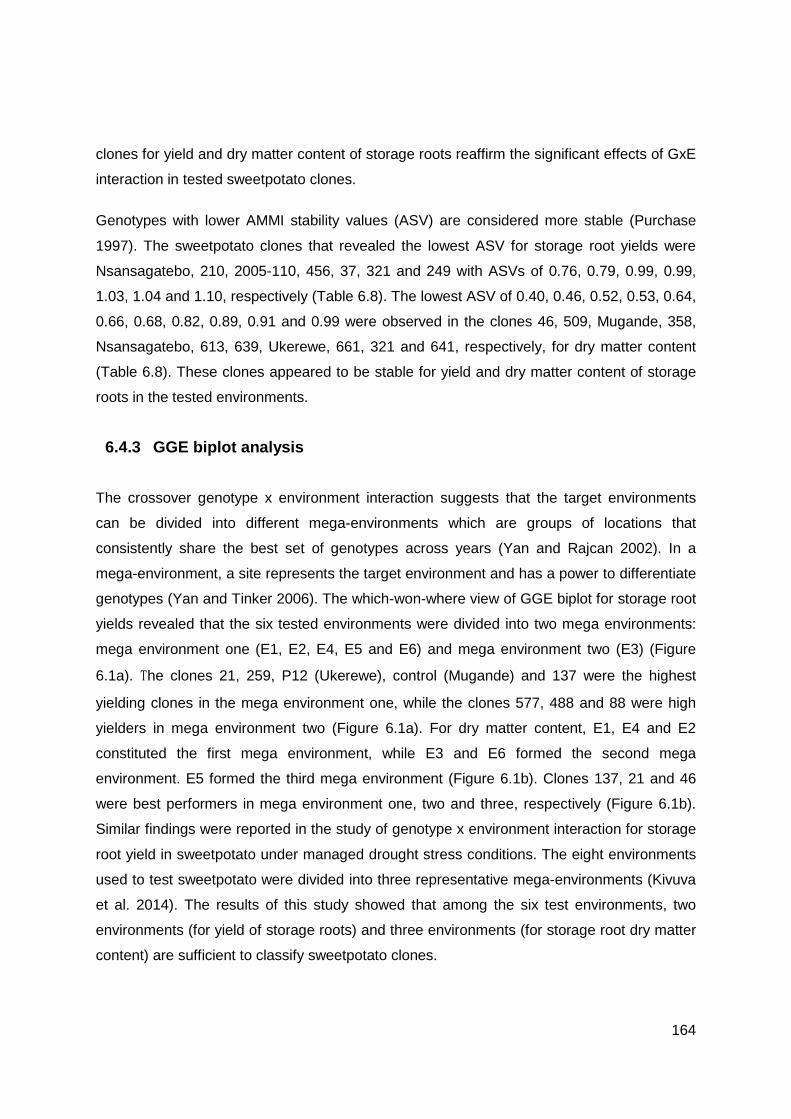
164
clones for yield and dry matter content of storage roots reaffirm the significant effects of GxE
interaction in tested sweetpotato clones.
Genotypes with lower AMMI stability values (ASV) are considered more stable (Purchase
1997). The sweetpotato clones that revealed the lowest ASV for storage root yields were
Nsansagatebo, 210, 2005-110, 456, 37, 321 and 249 with ASVs of 0.76, 0.79, 0.99, 0.99,
1.03, 1.04 and 1.10, respectively (Table 6.8). The lowest ASV of 0.40, 0.46, 0.52, 0.53, 0.64,
0.66, 0.68, 0.82, 0.89, 0.91 and 0.99 were observed in the clones 46, 509, Mugande, 358,
Nsansagatebo, 613, 639, Ukerewe, 661, 321 and 641, respectively, for dry matter content
(Table 6.8). These clones appeared to be stable for yield and dry matter content of storage
roots in the tested environments.
6.4.3 GGE biplot analysis
The crossover genotype x environment interaction suggests that the target environments
can be divided into different mega-environments which are groups of locations that
consistently share the best set of genotypes across years (Yan and Rajcan 2002). In a
mega-environment, a site represents the target environment and has a power to differentiate
genotypes (Yan and Tinker 2006). The which-won-where view of GGE biplot for storage root
yields revealed that the six tested environments were divided into two mega environments:
mega environment one (E1, E2, E4, E5 and E6) and mega environment two (E3) (Figure
6.1a). The clones 21, 259, P12 (Ukerewe), control (Mugande) and 137 were the highest
yielding clones in the mega environment one, while the clones 577, 488 and 88 were high
yielders in mega environment two (Figure 6.1a). For dry matter content, E1, E4 and E2
constituted the first mega environment, while E3 and E6 formed the second mega
environment. E5 formed the third mega environment (Figure 6.1b). Clones 137, 21 and 46
were best performers in mega environment one, two and three, respectively (Figure 6.1b).
Similar findings were reported in the study of genotype x environment interaction for storage
root yield in sweetpotato under managed drought stress conditions. The eight environments
used to test sweetpotato were divided into three representative mega-environments (Kivuva
et al. 2014). The results of this study showed that among the six test environments, two
environments (for yield of storage roots) and three environments (for storage root dry matter
content) are sufficient to classify sweetpotato clones.
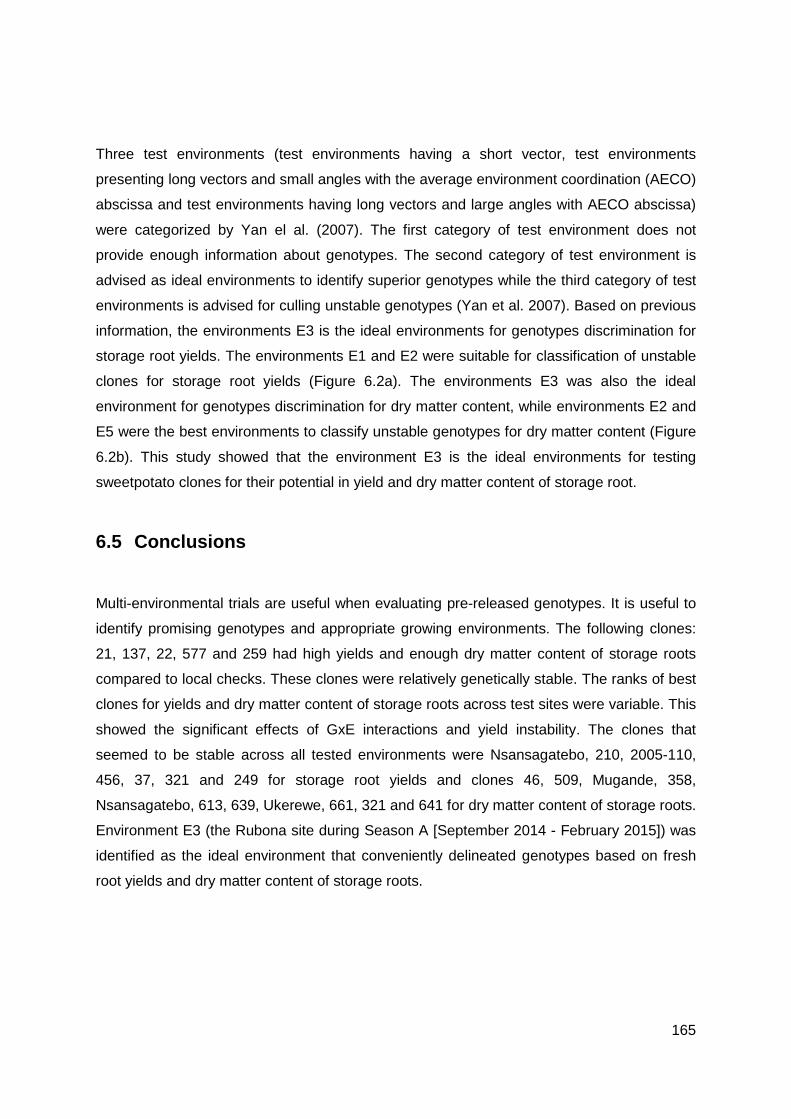
165
Three test environments (test environments having a short vector, test environments
presenting long vectors and small angles with the average environment coordination (AECO)
abscissa and test environments having long vectors and large angles with AECO abscissa)
were categorized by Yan el al. (2007). The first category of test environment does not
provide enough information about genotypes. The second category of test environment is
advised as ideal environments to identify superior genotypes while the third category of test
environments is advised for culling unstable genotypes (Yan et al. 2007). Based on previous
information, the environments E3 is the ideal environments for genotypes discrimination for
storage root yields. The environments E1 and E2 were suitable for classification of unstable
clones for storage root yields (Figure 6.2a). The environments E3 was also the ideal
environment for genotypes discrimination for dry matter content, while environments E2 and
E5 were the best environments to classify unstable genotypes for dry matter content (Figure
6.2b). This study showed that the environment E3 is the ideal environments for testing
sweetpotato clones for their potential in yield and dry matter content of storage root.
6.5 Conclusions
Multi-environmental trials are useful when evaluating pre-released genotypes. It is useful to
identify promising genotypes and appropriate growing environments. The following clones:
21, 137, 22, 577 and 259 had high yields and enough dry matter content of storage roots
compared to local checks. These clones were relatively genetically stable. The ranks of best
clones for yields and dry matter content of storage roots across test sites were variable. This
showed the significant effects of GxE interactions and yield instability. The clones that
seemed to be stable across all tested environments were Nsansagatebo, 210, 2005-110,
456, 37, 321 and 249 for storage root yields and clones 46, 509, Mugande, 358,
Nsansagatebo, 613, 639, Ukerewe, 661, 321 and 641 for dry matter content of storage roots.
Environment E3 (the Rubona site during Season A [September 2014 - February 2015]) was
identified as the ideal environment that conveniently delineated genotypes based on fresh
root yields and dry matter content of storage roots.
166
6.6 References
Abidin P., F. Eeuwijk, P. Stam, P. Struik, M. Malosetti, R.O.M. Mwanga, B. Odongo, M. Hermann and E. Carey. 2005. Adaptation and stability analysis of sweetpotato varieties for low input systems in Uganda. Plant Breeding 124: 491-497.
Acquaah G. 2007. Principles of plant genetics and breeding. Wiley-Blackwell, Oxford.
Adebola P.O., A. Shegro, S.M. Laurie, L.N. Zulu and M. Pillay. 2013. Genotype x environment interaction and yield stability estimate of some sweetpotato (Ipomoea batatas [L.] Lam) breeding lines in South Africa. Journal of Plant Breeding and Crop Science 5: 182-186.
Bacusmo J., W. Collins and A. Jones. 1988. Comparison of methods of determining stability and adaptation of sweetpotato. Theoretical and Applied Genetics 75: 492-497.
Caliskan M.E., E. Erturk, T. Sogut, E. Boydak and H. Arioglu. 2007. Genotype x environment interaction and stability analysis of sweetpotato (Ipomoea batatas) genotypes. New Zealand Journal of Crop and Horticultural Science 35: 87-99.
Carey, E.E. and D. Reynoso. 1996. Procedures for the evaluation of pathogen tested
sweetpotato clones: Sweetpotato germplasm management training manual. CIP,
Lima, Peru.
Carey E., S. Gichuki, P. Ndolo, G. Turyamureeba, R. Kapinga, N. Lutaladio and J. Teri. 1997. Collaborative sweetpotato breeding in Eastern, Central, and Southern Africa. CIP, Lima, Peru.
Carey E R.D. 1996. Procedures for the evaluation of pathogen tested sweetpotato clones: Sweetpotato germplasm management training manual. CIP, Lima, Peru.
Carpena A., E. Rebancos Jr, P. Manguiat, M. Zalameda, G. Sajise Jr and J. Pedro. 1980. Stability of yield performance of some sweetpotato culttvars. Philippine Journal of Crop Science 5: 30-33.
Cervantes-Flores J.C., B. Sosinski, K.V. Pecota, R.O.M. Mwanga, G.L. Catignani, V.D. Truong, R.H. Watkins, M.R. Ulmer and G.C. Yencho. 2011. Identification of quantitative trait loci for dry-matter, starch, and beta-carotene content in sweetpotato. Molecular Breeding 28: 201-216.
Chiona M. 2009. Towards enhancement of β-carotene content of high dry mass sweetpotato genotypes in Zambia. PhD Thesis, University of KwaZulu-Natal.
Cochard H., S.T. Barigah, M. Kleinhentz and A. Eshel. 2008. Is xylem cavitation resistance a relevant criterion for screening drought resistance among Prunus species? Journal of Plant Physiology 165: 976- 982.
Collins W.W., L.G. Wilson, S. Arrendell and L.F. Dickey. 1987. Genotype x environment interactions in sweetpotato yield and quality factors. Journal of American Society of Horticulture Science 112: 579-583.
167
Courtney M., M. McHaro, D. La Bonte and W. Gruneberg. 2008. Heritability estimates for micronutrient composition of sweetpotato storage roots. Hortscience 43: 1382-1384.
FAOSTAT. 2013. Statistics division, FAO, Rome.
Fasoula V.A. and D.A. Fasoula. 2003. Partitioning crop yield into genetic components, in: Kang M S (ed), Handbook of formulas and software for plant geneticists and breeders, Food Products Press and The Haworth Reference Press, Binghamton, NY 13904-1580.
Gabriel K.R. 1971. The biplot graphic display of matrices with application to principal component analysis. Biometrika 58: 453-467.
Gauch H. and R. Zobel. 1996. AMMI analysis of yield trials, in: Kang M S and Gauch H G (eds), Genotype by environment interaction, CRC Press, Boca Raton, FL. pp. 1-40.
Grunerberg W.J., D. Zhang, K. Manrique and M. Hermann. 2005. Genotype x environment interactions for a diverse set of sweetpotato clones evaluated across varying ecogeographic conditions in Peru. Crop science 45: 2160-2171.
Jones A., P. Dukes and J. Schalk. 1986. Sweetpotato breeding, in: Basset M J (ed), Breeding Vegetable Crops, IVA, Eastport. pp. 1-35.
Kathabwalika D.M., E.H.C. Chilembwe, V.M. Mwale, D. Kambewa and J.P. Njoloma. 2013. Plant growth and yield stability of orange fleshed sweetpotato (Ipomoea batatas) genotypes in three agro-ecological zones of Malawi. International Research Journal of Agricultural Science and Soil Science 3: 383-392.
Kivuva B.M., S.M. Githiri, G.C. Yencho and J. Sibiya. 2014. Sweetpotato under managed drought stress conditions. Journal of Agricultural Science 6: 41-56.
Laurie S. and M. Magoro. 2008. Evaluation and release of new sweetpotato varieties through farmer participatory selection. African Journal of Agricultural Research 3: 672-676.
Manrique K. and M. Hermann. 2000. Effect of G x E interaction on root yield and beta carotene content of selected sweetpotato (Ipomoea batatas [L] Lam.) varieties and breeding clones. CIP, Lima.
Mwamburi M. and P. Ndolo. 2013. Root-yield performance of pre-release sweetpotato genotypes in Kenya. Journal of Applied Biosciences 65: 4914-4921.
Mwanga Z., M. Mataa and M. Msabaha. 2007. Quality and yield stability of orange fleshed sweetpotato (Ipomoea batatas) varieties grown in different agro-ecologies. African Crop Science 8: 339-345.
Nasayao L.Z. and F.A. Saldaga. 1988. Genotype by environement interaction for yield in sweetpotato (Ipomoea Batatas L.). Philippine Journal of Crop Science 13: 99-104.
Ngeve J. 1993. Regression analysis of genotype x environment interaction in sweetpotato. Euphytica 71: 231-238.
NISR. 2015. Seasonal Agricultural Survey 2014. The National Institute of Statistics of Rwanda, Kigali, Rwanda. Website: www.statistics.gov.rw.
168
Osiru M.O., O.M. Olanya, E. Adipala, R. Kapinga and B. Lemaga. 2009. Yield stability analysis of Ipomoea batatus L. cultivars in diverse environments. Australian Journal of Crop Science 3: 213-220.
Payne R.W., D.A. Murray, S.A. Harding, D.B. Baird and D.M. Soutar. 2011. An Introduction to Genstat for Windows (14th Edition). Hemel Hempstead, UK.
Purchase J.L. 1997. Parametric analysis to describe genotype x environment interaction and yield stability in winter wheat. PhD Thesis, University of the Orange Free State.
Rukundo P., H. Shimelis, M. Laing and D. Gahakwa. 2015. Phenotypic characterisation of sweetpotato genotypes grown in East and Central Africa. South African Journal of Plant and Soil: http://dx.doi.org/10.1080/02571862.2014.994141.
Russell W. and S. Eberhart. 1966. Stability parameters for comparing varieties. Crop Science 6: 36-40.
Shumbusha D., G. Tusiime, R. Edema, P. Gibson and R.O.M. Mwanga. 2010. Diallel analysis of root dry matter content in sweetpotato. Second Ruforum Biannual Meeting 1013-1017.
Tan S.L., A.M. Abdul Aziz and M.A. Zaharah. 2007. Selection of sweetpotato clones for flour production. Journal of Tropical Agriculture and Food Science 35: 205-212.
Tekalign T. 2007. Genotype x environment interaction for root yield of elite sweetpotato (Ipomoea batatas [L] lam.) genotypes. South Africa Journal of Plant and Soil 24: 144-146.
Yan W., P.L. Cornelius, J. Crossa and L.A. Hunt. 2001. Two types of GGE-Biplots for analyzing multi-environment trial data. Crop science 41: 656-663.
Yan W., L.A. Hunt, Q. Sheng and Z. Szlavnics. 2000. Cultivar evaluation and mega-environment investigation based on GGE biplot. Crop Science 40: 597-605.
Yan W. and M.S. Kang. 2002. GGE biplot analysis: A graphical tool for breeders, geneticists, and agronomists. CRC Handbooks, Boca Raton, Florida, USA.
Yan W., M.S. Kang, B. Ma, S. Woods and P.L. Cornelius. 2007. Biplot vs. AMMI analysis of genotype-by-environment data. Crop Science 47: 643-655.
Yan W. and I. Rajcan. 2002. Biplot evaluation of test sites and trait relations of soybean in Ontario. Crop Science 42: 11-20.
Yan W. and N.A. Tinker. 2006. Biplot analysis of multi-environment trial data: Principles and applications. Canadian Journal of Plant Science 86: 623-645.
Zobel R.W., M.J. Wright and H.G. Gauch. 1988. Statistical analysis of yield trial. Agronomy Journal 80: 388-393.

169
7. Chapter Seven: Overview of the study
7.1 Introduction
Sweetpotato (Ipomoea batatas [L.] Lam.) is the third important root crop grown by 98% of
subsistence farmers in all agro-ecological zones of Rwanda. Rwanda experiences severe
drought spells during the off season (April/May to September/October) for crop production
owing to the limited rainfall that falls from June to September. Most rural communities face
periodic hunger during October to January every year in the country. The critical problem is
that there is a limited number of drought tolerant varieties of major food crops, including
sweetpotato. Consequently, drought tolerant sweetpotato varieties are required for
sustainable sweetpotato production and to ensure food security in Rwanda. The value of a
new sweetpotato variety depends on farmers’ and end users’ preferences. Sweetpotato
storage roots with high dry matter content might be adopted by farmers and subsequently by
consumers and processors. Therefore, breeding for drought tolerance and high dry matter
content is an overriding consideration for enhancing sweetpotato production in Rwanda.
This section presents the thesis overview and summarizes the research objectives and
keys findings of the study.
The specific objectives of this study were:
1. To assess farmers’ perception, production constraints, preferences, and breeding
priorities of sweetpotato in selected agro-ecologies of Rwanda.
2. To characterise and identify breeding parents among 54 sweetpotato genotypes
grown in Rwanda, East and Central Africa.
3. To select drought tolerant sweetpotato genotypes under managed drought conditions
using greenhouse and in-vitro screening techniques with early and late
developmental traits.
4. To determine general combining ability (GCA), specific combining ability (SCA),
maternal effects and heritability of drought tolerance, yield and yield components of
among newly developed sweetpotato clones.
5. To determine genotype x environment interaction and yield stability of sweetpotato
breeding clones recently bred in Rwanda and to identify promising genotypes.
170
7.2 Summary of major findings
The first study focused on a survey involving 168 farmers and 14 focus group discussions
across eight representative districts. The study identified key production and productivity
constraints, preferences and breeding priorities of sweetpotato farmers in Rwanda. The
specific outcome of this study showed that:
• Drought stress, unavailability of improved cultivars and planting material, and pest
and disease damage are the five main constraints limiting sweetpotato production.
• High yield, early maturity, drought tolerance, disease and pest tolerance, and good
culinary taste are the most important traits of a good sweetpotato cultivar.
• High dry matter content, good culinary taste, good shape, root size, and sweetness
are main characteristics of good storage roots identified by farmers.
• Each agro-ecological zone had its own specific sweetpotato production constraints
and farmers’ preferences.
The second study characterized the phenotypic diversity of 54 sweetpotato genotypes grown
in Rwanda, east and central Africa. Field trials were conducted using a 9 x 6 unbalanced
alpha lattice design with three replications at the Karama and Rubona Research stations of
Rwanda Agriculture Board. The main findings of this study were the following:
• Genotypes K513261, Kwezikumwe, 8-1038 and 2005-110 flowered the most.
• Genotypes K513261, Purple 297, Kwezikumwe and New Kawogo were identified as
producing high storage root yields.
• Genotypes Ukerewe, 2005-103, Meresiyana and Mvugamo showed the highest
mean dry matter content.
• Among 26 phenotypic traits used to characterize sweetpotato genotypes, only 19
traits were identified as the most influential characters for effective genetic diversity
studies of sweetpotato.
• Overall, the following genotypes: K513261, Kwezikumwe, 2005-020, Otada 24,
SPK004, Ukerewe, 2005-110 and 2005-034 were identified as potential breeding
parents of sweetpotato for Rwanda with superior storage root yield and dry matter
content.
171
The third study compared the use of greenhouse and in-vitro screening techniques of
drought tolerance using 54 sweetpotato genotypes at the Rubona Research Station of the
Rwandan Agricultural Board. The main findings of this study included:
• Positive correlations were observed between vine yield and fresh weight gain (FWG)
and between total biomass and FWG, during greenhouse and in-vitro experiments,
respectively.
• Genotypes such as 2005-146, 4-160, 8-1038, Karibunduki, Kwezikumwe, Purple
4419, NASPOT 9 O, Nsasagatebo, Karebe, IMBY 3102, Mwanakumi, 97-062 and
Matembere were selected with comparatively high drought tolerance using two
screening procedures.
The fourth study investigated the genetic basis and heritability of drought tolerance; yield
and yield components. This was carried out using 12 genotypes selected for superior
performance for the traits of storage root yield, dry matter content or drought tolerance. The
clones were crossed using a full diallel mating design. Families were field evaluated at three
sites to determine general combining ability (GCA), specific combining ability (SCA),
maternal effects and heritability of drought tolerance, yield and yield components. The main
outcomes of this study were:
• Broad sense heritability estimates were 0.95, 0.84, 0.68, 0.75, 0.50 and 0.58 for
canopy temperature (CT), canopy wilting (CW), root yield, storage root dry matter
content, vine yield and total biomass, respectively.
• The GCA effects of parents and SCA effects of crosses were significant (P<0.01) for
CT, CW, storage root, vine and biomass yields, and dry matter content of storage
roots.
• The ratio of GCA/SCA effects for CT, CW, yield of storage roots and dry matter
content of storage roots were higher than 50%, suggesting the preponderance of
additive over non-additive gene action in the expression of these traits. This indicates
that the mating design should therefore be to enhance recurrent selection.
• The best general combiners for drought tolerance were the parents 8-1038, Otada 24
and 4-160 with the lowest CT and CW and relatively high yields.
• Best combiners for high storage root yields were the parents, Nsasagatebo, K513261
and Ukerewe, while Nsasagatebo, 2005-034 and Ukerewe were the best combiners
for high dry matter content of storage roots.
172
• Maternal effects were significant (P<0.05) among families for CT, CW, flesh color
and dry matter content, vine yield and total biomass.
• Based on reduced CT and CW, the best families with significant SCA effects were 4-
160 x Nsasagatebo, 4-160 x Ukerewe, Otada 24 x 4-160, Nsasagatebo x 2005-020,
Otada 24 x Nsasagatebo, 4-160 x K513261 , 513261 x 4-160, 8-1038 x 4-160, 4-160
x 8-1038, 8-1038 x 2005-020 and Nsasagatebo x Ukerewe, which were selected for
breeding for drought tolerance.
• Across sites, the best five selected families with significant SCA effects for storage
root yields were Nsasagatebo x Otada 24, Otada 24 x Ukerewe, 4-160 x
Nsasagatebo, K513261 x 2005-034 and Ukerewe x K513261 with 11.0, 9.7, 9.3, 9.2,
8.6 t/ha, respectively.
• The best families with high dry matter content of storage roots were Ukerewe x 2005-
034, 4-160 x Nsasagatebo, 2005-034 x Ukerewe, 2005-034 x K513261 and 2005-
020 x Ukerewe.
The fifth study tested genotype x environment interaction and yield stability of 45 selected
sweetpotato breeding clones using field trials established across six environments in
Rwanda. The study revealed that:
• Interaction effects of clone x site x season, clone x site and clone x season on yields
and dry matter content of storage roots were significant (p=0.001).
• Site x season interaction had significant effects on dry matter content of storage roots
only.
• Candidate clones designated as clone 21 (4-160 x 2005-020), 137 (K513261 x 2005-
034) and 22 (4-160 x 2005-020) had the highest storage root yields of 38.23, 23.41
and 20.79 t ha-1, respectively.
• The highest dry matter content of storage roots of 40.58, 35.92 and 32.89% were
recorded in the following clones: 21, 137 and 259 (2005-034 x 8-1038), respectively.
• AMMI stability values (ASV) revealed that genotypes, Nsansagatebo and clones 210
(8-1038 x 4-160), 2005-110 and 456 (SPK004 x K513261) were the most stable for
storage root yields and Clones 46 (Kwezikumwe x 2005-020), 509 (Ukerewe x
Kwezikumwe), Mugande, and 358 (Ukerewe x 8-1038) were stable for dry matter
content of storage roots.
173
• Candidate sweetpotato clones such as 21, 137 and 22 (4-160 x 2005-020) were
selected for their high yields and dry matter content of storage roots. These clones
are recommended for direct production or sweetpotato breeding programmes in
Rwanda and similar environments.
7.3 Implications of the research findings
• Assessment of farmers’ perceptions, production and productivity constraints,
preferences and breeding priorities is is crucial to the success of any plant breeding
programme, to ensure that any new varieties that are developed genuinely respond
to the needs of end users. The Rwandan sweetpotato germplasm has considerable
genetic variability for yield, yield components and drought tolerance. This variability is
useful for genetic improvement of sweetpotato.
• Greenhouse and/or in-vitro screenings are alternative approachs to screening for
drought tolerance in sweetpotato. High levels of broad sense heritability and
significant effects of both additive and non-additive genetic effects on yield and dry
matter content of storage roots, and drought tolerance suggest that these traits can
be improved through conventional breeding.
• Maternal genetic effects were identified for some traits, highlighting the need for plant
breeders to be cautious in their assignment of sweetpotato genotypes as maternal or
paternal parents. Multi-environmental trials are useful when evaluating pre-released
sweetpotato genotypes. Among the test environments, the environment designated
as E3 (the Rubona Research Station, in Season A) provided the ideal environment
for testing sweetpotato clones for yield and dry matter content of storage roots.
• Valuable sweetpotato families were developed with high combining ability for high
drought tolerance, yield and dry matter content. The candidate sweetpotato clones
could be released as new cultivars after stability testing in target and representative
environments in Rwanda.