breaking the metal ceiling - world...
TRANSCRIPT

Policy Research Working Paper 7503
Breaking the Metal Ceiling
Female Entrepreneurs Who Succeed in Male-Dominated Sectors
Francisco CamposMarkus GoldsteinLaura McGorman
Ana Maria Munoz BoudetObert Pimhidzai
Africa Region—Office of the Chief EconomistGender Cross Cutting Solution AreaPoverty and Equity & Trade and Competitiveness Global Practice Groups December 2015
WPS7503P
ublic
Dis
clos
ure
Aut
horiz
edP
ublic
Dis
clos
ure
Aut
horiz
edP
ublic
Dis
clos
ure
Aut
horiz
edP
ublic
Dis
clos
ure
Aut
horiz
ed

Produced by the Research Support Team
Abstract
The Policy Research Working Paper Series disseminates the findings of work in progress to encourage the exchange of ideas about development issues. An objective of the series is to get the findings out quickly, even if the presentations are less than fully polished. The papers carry the names of the authors and should be cited accordingly. The findings, interpretations, and conclusions expressed in this paper are entirely those of the authors. They do not necessarily represent the views of the International Bank for Reconstruction and Development/World Bank and its affiliated organizations, or those of the Executive Directors of the World Bank or the governments they represent.
Policy Research Working Paper 7503
This paper is a product of the Office of the Chief Economist, Africa Region; the Gender Cross Cutting Solution Area; the Poverty and Equity Global Practice Group; and the Trade and Competitiveness Global Practice Group. It is part of a larger effort by the World Bank to provide open access to its research and make a contribution to development policy discussions around the world. Policy Research Working Papers are also posted on the Web at http://econ.worldbank.org. The authors may be contacted at [email protected].
A range of reasons is cited to explain gender differences in business performance in Africa. Within those, the sector of operations is consistently identified as a major issue. This paper uses a mixed methods approach to assess how women entrepreneurs in Uganda start (and strive) oper-ating firms in male-dominated sectors, and what hinders other women from doing so. The study finds that women who cross over into male-dominated sectors make as much as men, and three times more than women who stay in
female-dominated sectors. The paper examines a set of fac-tors to explain the differences in sector choices, and finds that there is a problem of information about opportunities in male-dominated industries. The analysis also concludes that psychosocial factors, particularly the influence of male role models and exposure to the sector from family and friends, are critical in helping women circumvent or over-come the norms that undergird occupational segregation.

Breaking the Metal Ceiling:
Female Entrepreneurs Who Succeed in Male‐Dominated Sectors1
Francisco Campos
Markus Goldstein
Laura McGorman
Ana Maria Munoz Boudet
Obert Pimhidzai
Keywords: Gender, norms, labor market participation, entrepreneurship, small enterprises.
JEL codes: J16, O17, O12, D22, D24, L25, L26
1 We thank the UN Foundation for financial support for this project. We also thank the World Bank’s Bank‐Netherlands Partnership Program Trust Fund and Belgium Poverty Reduction Program for financial support for the impact evaluation project on which the project draws. We thank Elena Bardasi for her detailed review and resulting discussion and participants in seminars at the World Bank and the UN Foundation for comments. We would also like to thank Victoria Katende of Makerere University for the excellent work in leading the logistics and implementation of the qualitative assessments. We would also like to thank Nelson Matua for his support in supervising face‐to‐face interviews. All views expressed in this paper should be considered those of the authors alone, and do not necessarily represent those of the institutions they represent.

2
Section I: Introduction
Evidence from developed and developing countries indicates that there is significant gender
segregation within the labor market, with women more likely to work in low‐productivity sectors, less
profitable businesses, or be relegated to unpaid family employment or the informal wage sector (World
Bank, 2011; ILO, 2012; Dolado et al; 2003). In entrepreneurship, women‐owned2 businesses typically
underperform men’s (see Klapper and Parker, 2011, for an overview of this literature). While female
participation in entrepreneurial activities varies by region, the gaps in productivity and growth between
male and female‐owned enterprises are stark and remain large even in rich countries (World Bank, 2011;
Klapper and Parker, 2011). Occupational segregation also comes with a growth cost. If we make the not
unreasonable assumption that skills are equally distributed across men and women at start, the growth
of an economy will be reduced by gender segregation of employment as a given sector does not have
access to the full set of skills that exist. Focusing on enterprises in developing countries, Bruhn (2009) finds
that female‐owned firms throughout Latin America tend to be smaller than male‐owned firms in terms of
sales, number of employees and profits. Similarly, Bardasi, Sabarwal, and Terrell (2011) reveal large gaps
in firm size in Europe and Central Asia, Latin America, and Sub‐Saharan Africa. And research in Latin
America and Asia found that only one in ten firms growing to at least 15 employees is women‐owned
(Kantis, Angelelli and Koenig, 2005).
In Africa, female participation in entrepreneurial activities is higher than in any other region, with
women representing half of non‐farm business ownership (Hallward‐Driemeier, 2011). However, these
entrepreneurship opportunities have yet to lead to equal earnings between women and men. A range of
studies show female‐owned firms lagging behind their male counterparts in a number of key measures of
enterprise performance. In terms of revenue, Bardasi, Sabarwal and Terrell (2011) indicate that female‐
owned enterprises in Sub‐Saharan Africa have sales that are 31 percent lower than male‐owned firms. For
productivity, Hallward‐Driemeier (2011) estimates the gender gaps in labor productivity in Africa to be 6
to 8 percent, and Costa and Rijkers (2012) analyze rural non‐farm entrepreneurship and find that male‐
owned firms in Ethiopia are three times more productive than female‐owned ones. Finally, our
examination of summary statistics from the Uganda National Household Survey (2005/2006) indicates
2 See Hallward‐Driemeyer and Aterido (2011) for a discussion on the importance of the definition of female ownership between partial ownership and decision‐making. In the setting of this study 90 percent of the enterprises only have one owner. For those in partnership, female ownership is defined in this study as the main business owner being a woman.

3
that male‐owned businesses in Uganda are 3.1 times larger than female‐owned enterprises and earn 2.5
times as much.
A range of factors have been discussed in the literature to explain these differences (Klapper and
Parker, 2011; World Bank, 2012), including access to finance and time constraints. However, the sector in
which the firm operates is consistently found to be a major determinant of gender‐observed differences
in performance and growth (e.g. Hallward‐Driemeier, 2011; Bardasi, Sabarwal and Terrell, 2011; Costa
and Rijkers, 2012).3 For example, Hundley (2001) estimates that women’s concentration in the personal
services sector explains as much as 14 percent of the gender‐based self‐employment earnings differential.
De Mel, McKenzie and Woodruff (2009) find that female ownership loses statistical significance in
explaining differences in performance once industry choice is controlled for. Results from Guatemala
(Kevane and Wydick, 2001) and India (Kantor, 2005) suggest that constraints to female‐owned firms and
their sector concentration respond to factors such as the marginal value of time for home production, and
constraints on location of business, among others.4
Differences in sectoral choice among men and women are large, with the vast majority of female
entrepreneurs clustering in low value‐added industries. Women entrepreneurs in Africa tend to
concentrate in hotels and restaurants, wholesale and retail trade, garments, textiles and leather goods,
and other services (Bardasi, Sabarwal and Terrell, 2011). African men on the other hand have businesses
distributed across a wider range of sectors, including construction and manufacturing.
Given that existing research has identified industry concentration as important in determining
future profitability and growth, the current debate is centered on whether the women’s decision to enter
these sectors is driven by constraints or preferences (see Bardasi, Sabarwal and Terrell, 2011, for an
overview of this literature). Afzal, Hasan, and Parveen (2011) suggest that there are some behavioral and
perception‐based determinants of lower profitability, namely that female entrepreneurs exhibit a
significant amount of “intrinsic” rather than “extrinsic” motivation, and are often driven more by flexible
work schedules or personal achievement rather than a raw interest in profit or growth, contributing to
preference‐driven hypotheses. Similarly, Minniti (2010), among others, suggests that female
3 A survey of developed country literature on small and medium firms suggests that the limited growth observed among female‐owned firms is due to the over‐representation on women in a subset of sectors (Nichter and Goldmarck, 2009). 4 Kantor (2005) shows that 36 percent of female entrepreneurs operate home‐based firms where clients go to them for purchases, compared to 20 percent of male entrepreneurs. Household firms are smaller, and also less likely to grow (Mead and Liedholm, 1998).

4
entrepreneurs exhibit less confidence in their skill sets and ability to take risks than men. Conversely,
research in Africa (for instance Bardasi and Getahun, 2008) and elsewhere (Brush, 1992) found that
women are often constrained by a range of factors, including limited access to finance and human capital
development opportunities, which points more to a constraint‐driven hypothesis.
In this study, we seek to examine the role of a range of factors that may hinder or help women
entrepreneurs to enter male dominated sectors. We do this in the context of Uganda, which shows the
concentration pattern that the studies above refer to: only 6 percent of women operate in male‐
dominated sectors5 (where over 75 percent of enterprises are male‐owned),6 while 34 percent of men
have businesses in those industries (UBOS, 2006). Specifically, we break the potential factors explaining
the entry into male dominated sectors into three (potentially overlapping) groups.
First, we look at whether the crossover entrepreneurs (women who own businesses in male‐
dominated industries) are above average in their entrepreneurial skill or abilities. Second, we examine the
possibility that their psychosocial development explains their ability to overcome occupational
segregation. Finally, as credit and human capital constraints are often cited as factors that hold back
women’s business no matter which sector they are in, we examine the possibility that the ability to
overcome these constraints might explain their presence in these non‐traditional sectors.
We use a mixed methods approach to examine these potential explanations. To start with, we
find that women who cross over into male‐dominated sectors make as much as men, and more than
women who stay in female‐dominated sectors. But this fact is unknown to a majority of the women who
do not cross over, suggesting information is a key initial hurdle to crossing over. The main factors that
seem to be associated with crossing over are psychosocial ‐‐ particularly the influence of male role models
and exposure to the sector from family and friends. These factors are likely to be critical in helping the
crossover women circumvent or overcome the norms that undergird occupational segregation.
5 While in the literature male‐dominated sectors are often defined as those where more than 50 percent of the firms are male‐owned (over‐representation), in this study we focused on enterprises where male‐domination is over 75 percent, because the over‐representation could just be a reflection of the specific sample, which is often not representative of the population – eg: the WB/IFC Enterprise Surveys are often not representative of the population of firms in the country in the absence of a solid census of firms. While these classifications at the margin could potentially average out in a quantitative analysis, they matter considerably when looking at a qualitative assessment where perceptions may be different than the sample dynamics. 6 Of course, if more women were to operate in those sectors, they would cease to be male‐dominated, but currently, and through time and across countries, the pattern is prevalent, and hence important to analyze.
5
The next section lays out the data we use and the methods by which they were collected. After
exploring the characteristics of female‐owned firms in our study sample, and comparing them with male‐
owned firms in terms of productivity and profits (section three), we move on to examine the relative roles
of the three groups of factors mentioned above in determining which women cross over and which do
not (section four). Once in business, challenges such as access to finance and lack of networks and
sometimes a hostile environment are the most prevalent ones, together with limited technical and
managerial skills – as detailed in section five. Section six draws on the findings to identify some areas for
testing future policy interventions aiming to promote female participation in male‐dominated sectors of
the economy, as well as to support women who wish to cross over.
Section II: Data and methods
This paper draws on baseline data collected in the first semester of 2011 from a sample of
entrepreneurs in urban Uganda from within and just outside Kampala, which are mostly part of the Katwe
Small Scale Industry Association (KASSIDA). The data were collected as part of an evaluation of the impact
of a skills and managerial training program on business performance. The baseline survey included a total
sample of 326 women and 409 men, of which only 30 women (crossovers) owned businesses in male‐
dominated sectors. Table 1 shows the distribution of women and men across different industries and
indicates the gender concentration, with crossover sectors identified in bold.7 We use this data set
(hereafter the KASSIDA data set), which has detailed information on assets, inputs, other costs, sales, and
profits, to compare the performance of crossovers with both other women‐owned businesses in
traditional female sectors and male‐owned businesses in the same sectors.
7 The sample size in table 1 is larger than in the analysis that follows as we do not observe all variables for all firms listed here.

6
Table 1: Number of enterprises per sector in the Kassida data set
Female‐owned Male‐owned Sector Crossovers Non‐crossovers
Barbershop / Hair Salon 0 63 7
Carpentry 4 0 44
Catering 0 107 2
Electricals 1 0 11
Fitting and machinery 0 0 11
Foundry & forgery8 15 0 48
Metal fabrication 7 0 185
Shoe making & repair 3 0 33
Tailoring / knitting 0 126 68
Total 30 296 409
This paper also uses the outcomes of a mixed methods questionnaire collected uniquely for this
paper (hereafter the mixed methods data set). This questionnaire was administered in July/August 2012
to 187 female entrepreneurs – 67 working in male‐dominated sectors such as those identified in Table 1,
and 120 working in traditionally female sectors (catering, hair dressing, and tailoring).
Table 2: Number of enterprises per sector in the mixed methods data set
Female‐owned
Sector Crossovers Non‐crossovers
Carpentry 26 0
Catering 0 41
Clay molding 0 1
Electricals 1 0
Fitting and machinery 7 0
Foundry & forgery 15 0
Hair salon 0 23
Metal fabrication 10 0
Shoe making & repair 8 0
Tailoring / knitting 0 55
Total 67 120
As the study was designed to include both formal and informal businesses, it is not representative
of all enterprises in Kampala.9 Instead, an initial sample of respondents was drawn from the KASSIDA data
8 Forgery could be integrated in metal fabrication under a different definition of sectors. The definition used follows the list of sectors identified by KASSIDA to organize their work. 9 The inclusion of informal businesses results in a lack of an accessible sample frame from which to draw.

7
set (21 of the crossovers in the mixed method data set were from the KASSIDA data set; the additional
crossover participants were identified through respondent‐driven/snowball sampling). For non‐
crossovers, 60 respondents were identified through a random sample of the KASSIDA data set,10 and an
additional 60 were matched to the crossover sample on a small list of pre‐business characteristics.11 Given
the mixed method and not purely quantitative approach, the objective of the matched subset was to
enable a sufficient sample of individuals with characteristics relatively similar to crossovers before the
inception of their business, with the main difference being that they took different paths due to a set of
factors to be explained in the analysis.
We prepared semi‐structured interview instruments to capture a wide range of information about
female entrepreneurs, including their background, family history, education, entrepreneurial
capacity/tendency (risk aversion,12 personality profile, IQ), access to networks, presence of role models,
and a host of other factors. In addition to these quantitative measures, there were open‐ended questions
that allowed participants to supply answers in their own words and elaborate on the path that led them
to be in a specific business sector. The instruments included substantial room for probing by enumerators,
leading to a rich quantitative and qualitative data set.13
To complement information obtained in individual interviews, we conducted 17 focus group
discussions with crossovers, non‐crossovers, clients, suppliers, and (male) employees, with approximately
six members per group. Focus groups of entrepreneurs included cases where only one sector was
represented, as well as others that included a mix of both crossovers and non‐crossovers. Additionally,
we interviewed a set of community leaders and credit providers to gauge the structural constraints facing
both female entrepreneurs in male‐dominated sectors, as well as those in traditional sectors. Including
various partners in the value‐chain allows us to better measure community‐wide perceptions on female
participation in entrepreneurial activities, enabling better understanding of why so few female
entrepreneurs decide to cross over.
10 Respondents from the KASSIDA data set included both members of the treatment and control groups, the former of which had received technical and managerial training, the latter of which had not. 11 These characteristics included nearest neighbor on age, age squared, and completion of primary education. 12 The games on risk aversion were not considered for this analysis because half‐way through implementation, survey audits indicated problems in administering this part of the survey. 13 Interviews were recorded and there was space in the questionnaire for additional writing of questions and answers.
8
Section III: The profitability and productivity of male and female‐owned firms
In this section, we investigate the differences in size and firm‐level performance between firms
owned by women crossovers and non‐crossovers, as well as between crossover firms and those owned
by men operating in the same sectors. We use the KASSIDA data set (discussed above) to document these
differences and examine to what extent the differences are explained by production inputs and the scale
of the operation.
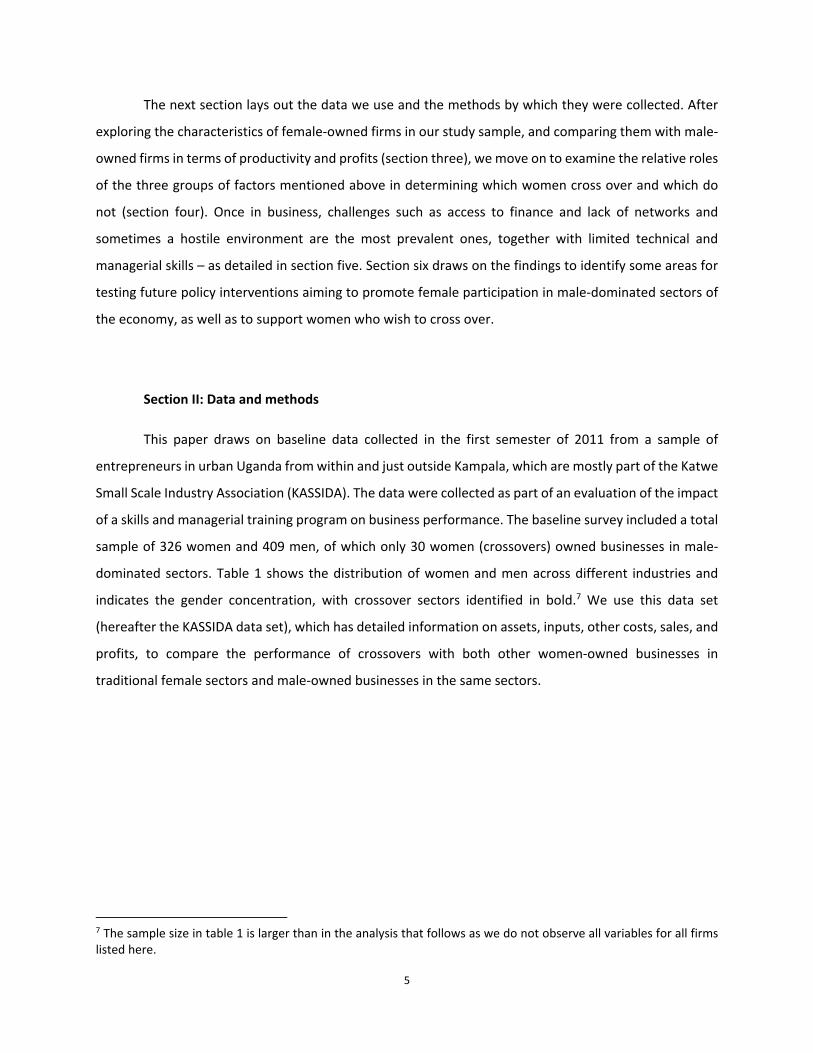
The first place to start with this examination is the profit of different firms. Women will have
incentives in crossing over if it is a profitable endeavor. Looking within female‐owned firms, Figure 1 shows
the distribution of the logarithm of monthly profits for crossovers versus non‐crossovers. As per the
literature on the importance of sectors in explaining gender gaps (Klapper and Parker 2011; Bardasi,
Sabarwal and Terrell 2011), many of the women who cross over make higher profits than women who do
not.
Figure 1: Distribution of (log) monthly profits for women crossovers and non‐crossovers – Kassida data set
In Figure 2, we examine the relative profits of female crossover firms versus male‐owned firms in
the same sectors. This figure shows distributions of profit that are a lot more similar than those in Figure
0
.1
.2
.3
.4
Den
sity
8 10 12 14 16logmthprofit
Crossover(f)
Non-crossover(f)
kernel = epanechnikov, bandwidth = 0.4290
Profit Distribution by Crossover

9
1, indicating that businesses owned by women that cross over to male‐dominated sectors perform
similarly to male‐owned businesses in those sectors.
Figure 2: Distribution of (log) monthly profits for women crossovers and men in same sectors – Kassida data set
In order to examine the differences between women who cross over and those who do not in
more depth, we now turn to a set of basic statistics in Table 3.
0
.1
.2
.3
.4
Den
sity
10 12 14 16logmthprofit
Female crossover
Male
kernel = epanechnikov, bandwidth = 0.4290
Profit Distribution (Crossover Sectors)

10
Table 3: Summary statistics for Female‐owned enterprises ‐ Kassida data set Total StDev Crossover Non‐Crossover Difference
Financials
Revenues past month (UGX '000) 1,058 2,246 2,697 914 1,783***
Profits past month (UGX '000) 229 392 494 205 289***
Investment
Net capital invested (UGX '000) 2,056 5,880 5,312 1,769 3,543***
Number of workers 2.6 2.0 3.9 2.4 1.5***
Inputs consumed past month (UGX '000) 377 783 968 325 643***
Personal characteristics
Age 37 9 42 36 6***
Married 53 50 40 54 ‐14
Widow 13 34 32 11 21***
Less than primary education 12 32 30 10 20***
Primary school is max education 52 50 26 54 ‐28***
Secondary school is max education 24 43 30 24 7
Completed more than secondary 13 33 13 13 0
Previously worker in sector 13 33 12 13 ‐1
Received business or technical training in past 43 50 72 40 32***
Financial literacy index (0‐1) 0.5 0.1 0.5 0.4 0.1***
Technical literacy index (0‐1) 0.4 0.2 0.4 0.4 0.0
Owns more than one business 15 36 24 14 10
Household and business activities simultaneously 30 46 44 29 15
Business characteristics
Business owner started this firm 93 26 84 93 ‐9*
Saw market opportunity when starting business 56 50 48 57 ‐9
Has business partners 3 16 0 3 ‐3
Business is registered 46 50 44 46 ‐2
Age of business 9 7 14 9 5***
Size of business network (log) 3.2 1.1 3.4 3.1 0.2
Access to finance
Has bank account 51 50 60 50 10
Has received business support 14 18 19 13 6*
Belongs to SACCO 18 39 32 17 15*
Has received loan 32 47 44 31 13
Harassment (past 12 months)
Has been sexually harassed 16 37 8 17 ‐9
Other type of harassment+ 42 49 40 42 ‐2
N 309 25 284
note: *** p<0.01, ** p<0.05, * p<0.1. At the time of the survey, 1 US$ = UGX 2,250.
+ other type of harassment includes: threats to shut down business; shouting, scolding, making a nuisance in or near enterprise premises; vandalism of premises or merchandise; confiscation of property or merchandise; pushing or shoving; and beating.
Table 3 shows the vast difference across these two types of female entrepreneurs and their firms.
First of all, we can see that the average revenue of a crossover firm is about three times that of a non‐
crossover firm, and profit is more than double. In addition, as might be expected, the crossover firms
11
operate at a larger scale with significantly higher levels of labor and capital. Crossover firms are also older,
and more likely to have received business support in the form of business or technical training. There also
appear to be some differences in terms of finance – crossovers are more likely to belong to a savings and
credit cooperative (SACCO) and to have received business development services such as assistance on
business planning, developing promotional materials, and expanding market access. In terms of business
practices, crossovers are significantly less likely to be running a business that they themselves started. In
terms of personal characteristics, crossovers show some differences from non‐crossovers: they are older,
have a somewhat different education profile and are more likely to be widowed.
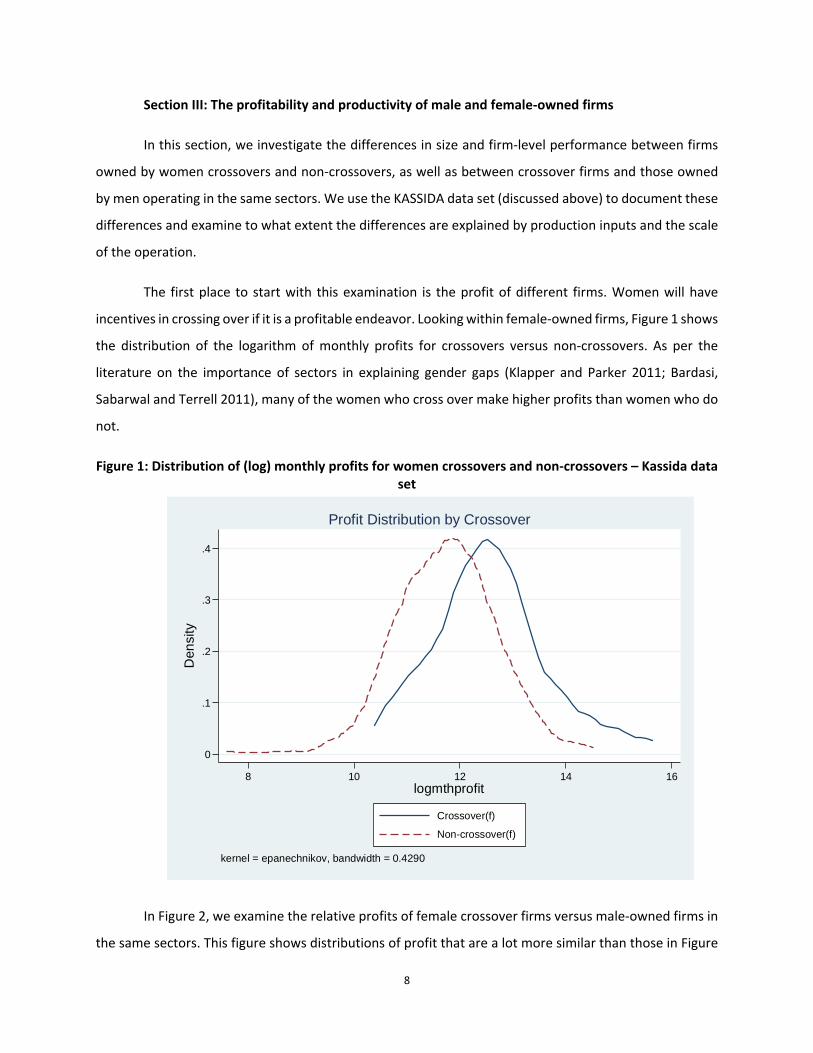
Table 4 provides the same comparison, using the KASSIDA data, for female and male
entrepreneurs within the crossover sectors.
Table 4: Summary statistics, within crossovers' sectors female‐male comparison ‐ Kassida data set Total StDev Crossover Male Difference
Financials
Revenues past month (UGX '000) 3,343 5,543 2,697 3,397 ‐700
Profits past month (UGX '000) 513 676 494 515 ‐21
Investment
Net capital invested (UGX '000) 3,865 7,749 5,312 3,744 1,569
Number of workers 5.5 4.0 3.9 5.6 ‐1.7**
Inputs consumed past month (UGX '000) 1,659 4,169 968 1,717 ‐749
Personal characteristics
Age 39 10 42 39 4*
Married 86 35 40 90 ‐50***
Widow 3 16 32 0 32***
Less than primary education 9 28 30 7 24***
Primary school is max education 45 50 26 47 ‐20*
Secondary school is max education 29 46 30 29 1
Completed more than secondary 17 38 13 17 ‐4
Previously worker in sector 17 37 12 17 ‐5
Received business or technical training in past 67 47 72 66 6
Financial literacy index (0‐1) 0.5 0.1 0.5 0.5 0.0
Technical literacy index (0‐1) 0.5 0.2 0.4 0.5 ‐0.1**
Owns more than one business 24 43 24 24 0
Household and business activities simultaneously 12 33 44 9 35***
Business characteristics
Business owner started this firm 87 34 84 87 ‐3
Saw market opportunity when starting business 65 48 48 66 ‐18*
Has business partners 13 33 0 14 ‐14**
Business is registered 64 48 44 66 ‐22**
Age of business 15 9 14 15 ‐2
Size of business network (log) 4 1 3 4 ‐0.2
Access to finance

12
Has bank account 63 48 60 63 ‐3
Has received business support 18 20 19 17 2
Belongs to SACCO 9 28 32 7 25***
Has received loan 31 46 44 30 14
Harassment (past 12 months)
Has been sexually harassed 7 25 8 7 1
Other type of harassment+ 48 50 40 49 ‐9
N 324 25 299
note: *** p<0.01, ** p<0.05, * p<0.1. At the time of the survey, 1 US$ = UGX 2,250. + other type of harassment includes: threats to shut down business; shouting, scolding, making a nuisance in or near enterprise premises; vandalism of premises or merchandise; confiscation of property or merchandise; pushing or shoving; and beating.
In terms of core business indicators, profit, revenue and capital are not statistically significantly
different across male and female‐owned firms in the crossover sectors. There is a significant difference in
the number of workers, with female‐owned firms averaging 1.7 fewer workers than their male‐owned
counterparts. This could be related to different allocation of capital and labor, but could also just be due
to different sub‐sector composition. When we turn to business practices, however, a number of significant
differences emerge. Women, not surprisingly, are much more likely to mix household and financial
resources than men, but are significantly less likely to have a business partner (indeed none of the
crossovers does) and less likely to be registered. There appears to be some difference in finance ‐‐ female
entrepreneurs in these sectors are more likely to belong to a SACCO. The characteristics of the
entrepreneurs are also different ‐‐ women are older than their male counterparts, have a slightly different
educational profile (although the years of education, not shown here, are not significantly different), are
less likely to be married and more likely to be widows, and score lower on our measure of technical skills.14
The preceding discussion suggests that women crossovers and non‐crossovers operate at
different scales but also have a range of different business practices and personal attributes. In order to
disentangle the relative impact of scale, we turn to production function estimates. We use a Cobb‐Douglas
production function of the form where is output of firm i in sector j and modeled as
a function of capital, , labor, , intermediate material inputs, , and total factor productivity (TFP),
A. This approach investigates if these factors account for the potential gaps in productivity between
14 These are a set of questions designed to carefully measure skills within a given sector (e.g. "how far in inches from the scalp would you apply a chemical relaxer?" for hair salon or “what is the minimum size of wire used for making an industrial welding machine?” for electrical).

13
crossovers and other groups. Moreover, we assess if the observed differences are associated with
suboptimal scale of operations for a specific group.
We acknowledge limitations of this analytical approach, namely the potential problems of
endogeneity, including omitted variable bias, simultaneity and self‐selection issues. Nevertheless, such an
analysis is helpful in identifying the initial factors that might be relevant in explaining the unconditional
differences in performance.
Table 5 shows the estimates of production functions for female‐owned firms, with and without
controls for capital, labor and material inputs.
Table 5: Production Function Estimates for female‐owned enterprises
Dependent Variable: log Sales, restricted sample of women‐only (Kassida data set)
est1 est2
B se B Se
Crossover 1.027*** 0.193 2.817* 1.552
log Capital 0.086** 0.038
log Labor 0.558*** 0.073
Log Material Inputs 0.103*** 0.035
cross*lnK ‐0.121 0.140
cross*lnL 0.481 0.329
cross*lnM ‐0.091 0.159
_cons 13.089*** 0.072 10.388*** 0.559
N 309 309
r2 0.065 0.256
Non‐crossovers CRS (p‐value of F‐test) 0.0014***
Crossovers CRS (p‐value of F‐test) 0.9519
Crossovers RS = Non‐crossovers RS (p‐value of F‐test) 0.3266
note: *** p<0.01, ** p<0.05, * p<0.1. CRS‐ Constant Returns to Scale; RS = Returns to Scale.
The first conclusion that can be drawn from this table is that crossovers have higher sales than
non‐crossovers, even after accounting for the capital, labor and material inputs invested in the business
as the crossover variable remains significant in the second set of estimates. A second conclusion is that
scale does not appear to be driving the enterprise outcome differences (here measured in terms of sales)
between crossover and non‐crossover female entrepreneurs. As the last three rows of the table show,

14
non‐crossover enterprises exhibit decreasing returns to scale and we cannot rule out that the same is true
for crossover enterprises. Thus, differences in economies of scale do not appear to be driving the levels
of sales across these two types of enterprises. Given that economies of scale are not driving the
differences in revenues (and profits) between crossovers and non‐crossovers, in the next section we turn
to a range of other potential factors.
Section IV: Who crosses over?
The women who break into male‐dominated industries are different than women in traditional
sectors, but there is no clear theory to explain why they do what they do. The literature has focused most
on the choice of sector as a driving factor of gender‐correlated profit and productivity differentials, and
on the general constraints to female entrepreneurial activity – regardless of sector. But little to no
attention has been given to the factors associated with women who successfully cross over.15
In order to examine this, in this section we examine three potential sets of explanations as to how
a small sub‐set of women end up with businesses in male dominated industries. First, it could be that the
women who cross over are “superwomen” with superior skills and abilities. That is, they are above
average entrepreneurs, whose inherent intelligence and personality characteristics predispose them to
success and they can thus spot, and capitalize on, the opportunities presented by male dominated sectors.
Second, it could be that these women are entrepreneurs of average ability, but that their psycho‐social
development has helped them to circumvent or overcome the norms that identify certain professions as
“male” professions. Here we will look at a range of psychosocial characteristics including family
background, role models, and an in‐depth of the entrepreneur's own account of how she ended up in her
current profession. By psychosocial characteristics, we mean the interrelation between social and
individual factors expressed in someone's behaviors and mind. Third, it could be that these are the few
women who somehow managed to overcome structural inequalities in education or human capital more
generally, and access to finance, and thus move into these higher return sectors.
15 Among some of the studies that have looked at this issue, Bruni et al (2004) and Anna et al (2000) focus on
women’s choices for traditional female sectors, suggesting that these choices are driven by an assessment of which
industry presents the lowest barriers to entry –from capital to skills, but not on the specific factors that drive women
into non‐traditional sectors.

15
The fact that these explanations are potentially overlapping was clearly evident in the qualitative
work. One non‐crossover woman captured both the role of norms and ability when she said: “Such women
are ‘superwomen’. They have the characteristics of men”. On the other hand, a crossover foundry owner
provides some insight into the importance of information and psychosocial development when she says:
“No, we are not different. It just takes a mindset and the necessary information to do this business.”
For this analysis, we use the mixed methods data set, which has a larger sample of crossovers and
was designed fully for the purpose of this study. Hence, the depth of the information collected is much
more detailed on this topic than the KASSIDA data set, which was meant to achieve other objectives.
Information
Before we take an in‐depth look at the groups of factors, there is one potential market failure that
could explain why some women do not cross over: information.
As shown in figure 1 (above), women who cross over have significantly higher profits than those
who do not. It is possible that women who remain in female‐dominated sectors simply do not know that
they are making less. In our mixed methods interviews, we asked about this.16
A tabulation of the answers shows that most of the women who do not cross over believe that
they make the same or more as those in the crossover sectors.17 As Figure 1 above shows, some of them
are right and some are wrong ‐‐ the distributions of profits across crossover and non‐crossover sectors
overlap. Hence, in order to examine the potential information barrier, we divide the non‐crossovers into
those whose profits are below the mean in the crossover sectors and those whose profits are above the
mean. Figure 3 shows the results.
The difference in size of the bars confirms that the majority of the non‐crossovers have lower
profits than the mean profits for crossovers. Moreover, this figure shows that non‐crossovers are unaware
of the potential profitability of crossing over. Looking at the bar on the left for non‐crossovers with lower
16 The questions used in the survey were the following: “[If crossover] Do you think you are making more, the same, or less money than you would if you were in a sector where women typically operate?” / “[If non‐crossover] Do you think you are making more, the same, or less money than you would if you were in a sector where men typically operate?”. In both cases, the respondent had three options: 1‐ Making more money; 2 – Making the same money; and 3 – Making less money. 17 It is also true that most of the crossovers think that they make more than the non‐crossovers, even those crossovers that make less. However, this is only a major issue for non‐crossovers as they are the ones in general not taking advantage of the opportunities in the male‐dominated sectors.

16
profits than the mean for crossovers, almost 80 percent of non‐crossovers that make less than crossovers
think they make the same or more.
Figure 3: Non‐crossovers beliefs on profitability (%) – Mixed methods data set
Other explaining factors
While information is clearly one barrier to crossing over for some women, we now take a deeper
look at the characteristics of the entrepreneurs themselves for other explanations. In order to examine
these characteristics, we run a series of regressions using the mixed methods data set. The results are in
Table 6. In what follows we discuss two sets of OLS regression results.18 Recall that the mixed methods
data set has two sets of non‐crossover women: those who were matched to the crossovers on a small set
of pre‐business characteristics and a group of randomly selected women. Given these two groups, we
discuss results for both of them combined (columns A‐C) and for the matched sample (columns D‐F).
Summary statistics for the variables used in the regressions can be found in Appendix table 1.
18 We run also probit models, obtaining similar conclusions, although the results in these models are more extreme given the small sample size and the rare outcome.
42
22
12
5
14
5
Non‐crossovers that make less Non‐crossovers that make the same ormore
Believe make more money Believe make same money
Believe make less money

17
Table 6: Correlates of "Being a crossover" OLS COMBINED OLS MATCHED
A B C D E F
1. Personal characteristics
Age ‐0.003 ‐0.001 ‐0.003 ‐0.004 ‐0.001 ‐0.003
Father owned or managed family enterprise ‐0.113 ‐0.093 ‐0.155 ‐0.200* ‐0.206* ‐0.227*
Mother owned or managed family enterprise ‐0.224** ‐0.165** ‐0.190** ‐0.203** ‐0.125 ‐0.178*
Proportion of male siblings 0.030 0.047 0.032 0.097 0.119 0.072
Boy ratio, father owned enterprise interaction ‐0.037 ‐0.038 ‐0.028 ‐0.059 ‐0.087 ‐0.052
Marital status: reference ‐ married / living with a partner
Divorced ‐0.128 ‐0.176* ‐0.086 ‐0.163 ‐0.198* ‐0.117
Widowed ‐0.140 ‐0.138 ‐0.112 ‐0.208* ‐0.215* ‐0.193
Never married 0.253* 0.196 0.291** 0.453** 0.451** 0.382*
Religion: reference ‐ catholic
Protestant ‐0.162 ‐0.188* ‐0.158 ‐0.131 ‐0.221* ‐0.083
Muslim ‐0.088 ‐0.077 ‐0.074 ‐0.078 ‐0.069 ‐0.024
Pentacostal ‐0.060 ‐0.099 ‐0.029 ‐0.014 ‐0.085 0.071
Region of birth: reference ‐ Kampala
Eastern 0.04 0.063 0.068 0.024 0.095 0.061
Central ‐0.004 0.051 ‐0.013 0.011 0.076 0.026
Western 0.009 0.064 0.051 0.062 0.087 0.118
Northern 0.152 0.248 0.302 0.019 0.187 0.180
Foreign country ‐0.092 ‐0.024 ‐0.106
2. Skills and abilities
Raven test score ‐0.034** ‐0.032** ‐0.034** ‐0.035** ‐0.033** ‐0.028*
Digit test score 0.030 0.039 0.052 0.037 0.026 0.046
Locus of control aggregate score 0.009 ‐0.069 ‐0.250 ‐0.130 ‐0.143 ‐0.598
Agreeability score ‐0.129 ‐0.050 ‐0.118 ‐0.274 ‐0.106 ‐0.450
Emotional stability score ‐1.371** ‐0.976** ‐1.384** ‐0.77 ‐0.471 ‐0.797*
Conscientious 0.531 0.268 0.622 0.32 0.555 ‐0.325
Self‐efficacy 0.984* 1.106* 0.898 0.333 0.548 0.533
3. Psychosocial factors
Male role model 0.220** 0.214** 0.188* 0.204* 0.124 0.167
First job was in non‐male dominated sector ‐0.461*** ‐0.434*** ‐0.398*** ‐0.619*** ‐0.644*** ‐0.532***
Exposure origination: Reference ‐ self idea
Someone's suggestion 0.216** 0.232*
Was offered job in sector by family or friend 0.315** 0.21
Observed others in sector 0.149 0.104
Worked for a wage in sector – qualitative recode 0.028 ‐0.025
Exposure enabling factor: Reference ‐ self idea
Suggested to me 0.334* 0.241
Offered job by a family member or friend 0.175 0.158
Observed others 0.104 0.118
Worked for stranger ‐0.158 ‐0.169
Was trained 0.057 0.115
4. Capital
Years of education ‐0.005 0.008 ‐0.008 ‐0.012 0.039 ‐0.022
Years of education squared 0.000 ‐0.001 0.000 0.000 ‐0.004 0.001
Owned an enterprise in another sector 0.151* 0.148* 0.141* 0.193** 0.173* 0.175*

18
Choose sector for low capital requirements 0.050 0.019 0.005 0.118 0.054 0.032
Delayed starting enterprise saving for capital 0.148* 0.123 0.136 0.107 0.142 0.051
Years of experience in previous jobs ‐0.009 ‐0.011 ‐0.009 ‐0.002 0.001 ‐0.002
Previous years of experience squared 0.000 0.000 0.000 0.000 0.000 0.000
Trained while waiting to start business 0.017 0.180
Constant 1.033 0.520 1.004 1.689** 0.660 2.176**
N 133 133 133 91 91 91
Adjusted R‐Squared 0.370 0.407 0.432 0.566 0.588 0.592
* p<0.1, ** p<0.05, *** p<0.001
Skills and abilities
We first analyze how innate skills and abilities are correlated with the decision to cross over to
male dominated sectors.
We used two cognitive tests, a digit‐span recall exercise (measuring working memory) and Raven's
Test (which captures fluid intelligence ‐ the ability to understand complex problems and problem solve ‐
as per Yuan et al., 2006) to determine if innate ability and/or intelligence predict the likelihood of being a
crossover. A digit‐span exercise involves respondents being shown a card with a four‐digit number on it,
with the card then being taken away. Ten seconds later, respondents are asked to repeat the number as
was written on the card. If respondents recall the number correctly, enumerators then show them a five‐
digit number, with the process continuing up to 11 digits. In the Raven progressive non‐verbal reasoning
test, enumerators provide 12 printed pages to each respondent, each of which contain a four by four
pattern with one quadrant missing. Below the pattern are six figures, one of which fits the pattern, with
the patterns becoming progressively more difficult. Respondents were given five minutes to complete as
many of the patterns as possible.
In Table 6, we can see that the digit‐span test is not a significant predictor of crossing over. On
the other hand, the results on the Raven’s Test suggest that women with less fluid intelligence are more
likely to cross over. While statistically significant, these effects are fairly small: getting one more matrix
correct is associated with about a 3 percent decrease in the likelihood of crossing over.
In addition to cognitive measures, the team considered a variety of non‐cognitive tests to gauge
respondents’ levels of innate entrepreneurial spirit (see Rauch and Frese, 2007; and Khwaja and Klinger,
ongoing). This class of measures may be useful in predicting the success of entrepreneurs over time (see
for example, de Mel, et. al. 2010). We asked respondents to rate a level of agreement with questions that

19
evaluated their personal levels of self‐efficacy, locus of control, agreeableness, conscientiousness, and
emotional stability on a scale from strong disagreement to strong agreement. As with the cognitive
measures, the results in Table 6 do not show that the crossovers score unambiguously more
entrepreneurial than non‐crossovers. Three of our measures (locus of control, agreeableness and
conscientiousness) show no correlation with the likelihood of being a crossover. However, women who
score lower on emotional stability (this includes getting irritated more often and stressed about things)
are more likely to be a crossover. On the other hand, women who score higher on self‐efficacy (the ability
to complete tasks and reach goals) are significantly more likely to be a crossover in a sub‐set of these
specifications.
In a meta‐analysis of a wide range of studies on the relationship between personality traits and
business creation and success, Rauch and Frese (2007) find that self‐efficacy is positively correlated with
business success, but not creation. This would suggest that the crossovers have personality traits in
common with successful entrepreneurs. On the other hand, Rauch and Frese also find that locus of control
is significantly related to success, while Zhao and Seibert (2006) find differences between entrepreneurs
and managers on agreeableness. And the lack of a significant difference on these dimensions suggests
that the crossovers are no different in key entrepreneurship traits than the non‐crossovers.
In sum, these results, combined with the cognitive tests, show that while the women who
crossover may be different in some dimensions of personality, they are not more likely to score uniformly
higher in skills that would aid them in becoming successful entrepreneurs.
Psychosocial factors
Individual characteristics interact with one's environment in a range of ways that might impact
the choice to cross over into male‐dominated sectors. In order to make this wide group tractable, we
break this set of factors down into different sub‐groups.
We start with an examination of the family background of these entrepreneurs. As shown in Table
6, women whose mothers are entrepreneurs are less likely to cross over, suggesting a continuation of
professions within the family. Nonetheless, while we might expect the father entrepreneurial background
or the sex composition of one's siblings to matter as an influence in crossing over to male activities, the
results in Table 6 indicate that they do not.

20
As the summary statistics discussed above indicate, women who cross over are less likely to have
started their own business and are more likely to be widowed. This would suggest that a central path to
crossing over is to inherit a business, perhaps from a husband. However, our analysis in Table 6, indicates
that when we control for a range of factors, this does not appear to be a central pathway to becoming a
crossover. Relative to married women, divorced and widowed women are, if anything, less likely to be a
crossover. Women who have never been married or have never lived with someone are significantly more
likely than married women to be a crossover.
A critical path to cross over seems to be having had a male role model in youth. In seeking to
understand the importance of different psychosocial factors, we identify the women's reported role
model in youth. Table 6 shows that women with a male role model are 12‐22 percent more likely to be a
crossover. This provides an indication of how men are involved in the transition of women to higher profit
sectors. We asked the respondents who these role models were, which are presented in Table 7.
Table 7: Identity of role model in youth (%)
Crossover Non‐crossover Difference
Male 32.6 18.1 14.5*
Female 67.4 81.9 ‐14.5*
100 100
Male relative 21.3 14.0 7.3
Female relative 40.4 55.8 ‐15.4*
Non‐related male 10.6 5.8 4.8
Non‐related female 27.7 24.4 3.2
100 100
N 47 86 133 *** p<0.01, ** p<0.05, * p<0.1.
Within the male relative, fathers are more common for crossovers to be their role model relative
to non‐crossover. However, as shown in the results on family background in Table 6, the channels of
influence are not as direct as assuming that crossovers became entrepreneurs in a sector because it was
where their fathers used to work.19 From the qualitative data, it appears that fathers in some cases were
19 “Father owned enterprise” is not positively correlated with being a crossover in Table 6. We tested for collinearity between “Father owned enterprise” and “Male role model”.
21
instrumental in introducing women to a different sector by providing relevant contacts, or by providing
financial support at the moment to start up.
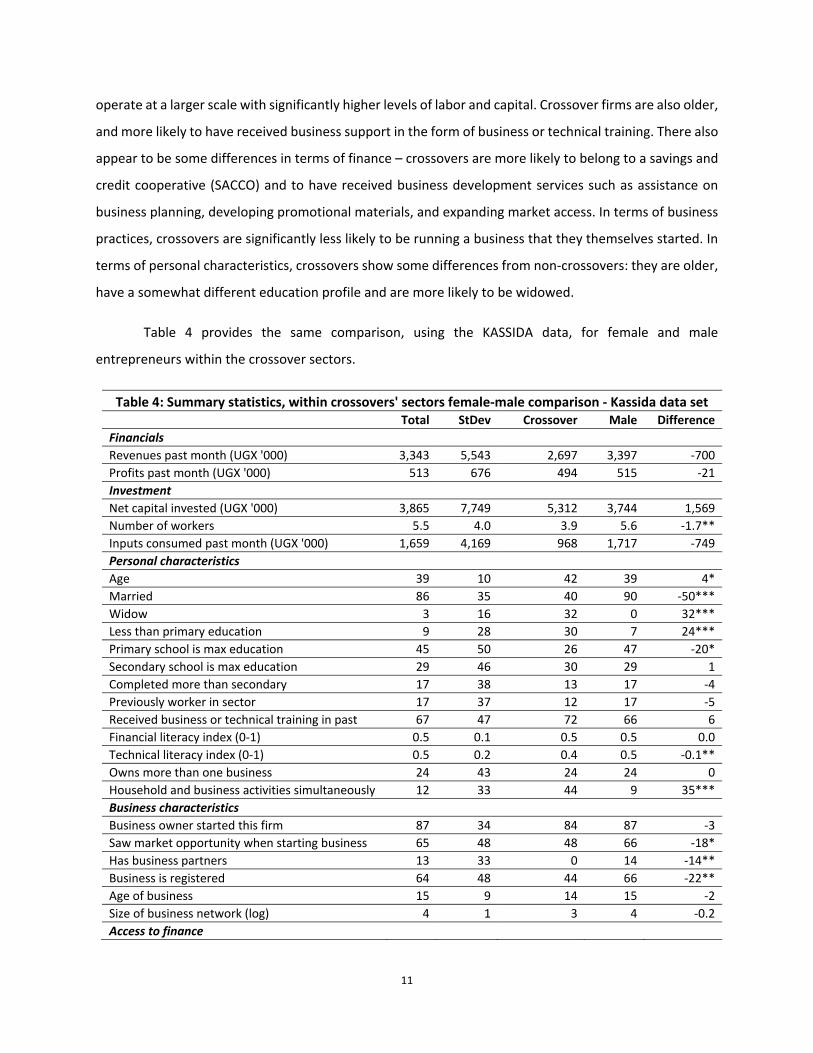
The importance of certain kinds of men is again evident when we ask who first exposed the
entrepreneurs to this sector. Table 8 shows the distribution of the responses of crossovers versus non‐
crossovers.
Table 8: Identity of individuals introducing entrepreneurs to their sectors (%)
Crossover Non‐crossover Difference
Mother 1.8 10.6 ‐8.8**
Father 7.3 1.9 5.4*
Other male family member 20.0 5.8 14.2***
Other female family member 10.9 16.4 ‐5.4
Female friend/community member 29.1 26.0 3.1
Male friend/community member 12.7 3.9 8.9**
Teacher 1.8 26.9 ‐25.1***
Other 16.4 8.7 7.7**
N 55 104 159 *** p<0.01, ** p<0.05, * p<0.1.
Table 8 shows that crossovers are more likely to be introduced to their sector relative to non‐
crossovers by fathers, male friends/community members, and other male family members. Two of our
respondents summarize the role of these male mentors: “Through his encouragements [and] help, I kept
my savings until I got what was enough to start up. He mentored me after I finished my diploma”; “My
spouse was in carpentry when we married. His friend taught me the skill because my spouse wanted me
only to manage and do sales for him”.
On the other hand, non‐crossovers are more likely to be introduced to their sectors by mothers
and teachers. Indeed, teachers are one of the main sources of exposure to the non‐crossover sectors,
particularly for the case of tailors who learn how to sew at school or attend special training provided by
other institutions (church, charities and NGOs). This suggests that the education system, as it now stands,
is one of the reinforcing factors in maintaining the gender segregation of labor.
Returning to Table 6, we also look at variables which may be critical in terms of initial exposure.
Specifically, having a first job in a non‐male dominated sector is negatively associated with being a

22
crossover. This suggests strong path dependence in these women's career ‐‐ with an initial job in a non‐
crossover sector, they are much less likely to switch.20
In an effort to better understand the pathways to becoming a crossover, we also undertook a
coding exercise of women's stories of how they ended up in their current sector of employment drawing
on both quantitative and qualitative data. Two of the authors coded the answers separately and then
compared and reconciled.21 In particular, we coded two separate sets of variables out of these data. The
first is what we label as the exposure origination, which is meant to capture where the original
idea/impetus for choosing this sector came from. As individuals cited many factors in explaining their story
in the decision to start/join a business in a specific industry, we ordered these factors through time. The
first identified factor was coded as the exposure origination and is used under the assumption that what
matters is where the original idea comes from. As per Table 6, the options for coding of the exposure to
sector include self‐idea, someone’s suggestion, offered job in sector by family or friend, observed others,
or worked for a wage in the sector.
Alternatively, we use the last identified factor to define the sector participation enabling factor,
which would imply that the last step is explanatory of the final decision taken. For example, for the case
of one of the crossovers in metal fabrication who described her process of getting into the business as “I
lost my capital in charcoal selling and I was unemployed, then a friend invited me to join a workshop of
metal fabrication where I was taught the skills. She first taught me how to produce, and then I started my
own business”, her origination factor is ‘someone suggested’ while her enabling factor is ‘training’. Both
the sector participation origination and the sector participation enabling factor are included in the analysis
in Table 6. However, since they are obviously overlapping, we run them separately in columns B and C
and E and F.
When we focus on what started the process, we can see that relative to the idea coming from the
entrepreneur herself, the role of others appears to be significantly more important. Someone's suggestion
and being offered a job in the sector by a friend or family member are significant and positive in predicting
the likelihood of crossing over relative to own idea. These results seem to confirm the importance of active
engagement from others in enabling women to move into male‐dominated sectors. Our participation
20 Although the name used is crossover, actually very few women crossover from female dominated sectors to male dominated ones. This is typically their first business activity. 21 Disagreements were few.

23
enabling factors suggest that relative to self‐initiation, "suggested to me" is positively correlated with
being a crossover, but only in the combined sample, and significant only at the 10 percent level.
The qualitative work confirms ‘active exposure’ to the sector as a relevant intermediate step in
the trajectory to become a crossover, either by engaging in actively learning the trade or being taken to
the firm by an active intermediary or enabler – friend, family member ‐ who not only suggests starting in
the trade but also brings the person to either their own business or someone else's.
Capital
We now focus on capital and skills that can be acquired in the market, which are factors typically
associated with gender gaps in entrepreneurship. We start our examination of capital with human capital.
As can be seen in section 4 in Table 6, education, the most common measure of human capital, does not
significantly affect the probability that a woman is a crossover. This also true for years of experience in
the previous job, and age (section 1), which will capture all accumulated experience. One area where
experience might matter is whether the entrepreneur owned an enterprise in another sector. This is
positively correlated with being a crossover (at the 10 percent level). On balance, human capital does not
appear to affect the probability that a woman entered a male‐dominated sector.
Still, the value of education seems to vary by person. The qualitative work indicates that subjective
perceptions of the uses of education even when education levels are similarly low seem to differ from
crossovers to non‐crossovers. For instance, while a crossover‐woman who dropped out of school after
Standard 4 and can read and write in English and Luganda believes her education “has helped a lot because
I can read documents concerning my business. I keep my business records”, a catering entrepreneur with
exactly same education level and of same age feels that her literacy levels are of no use when it comes to
her business.
It is difficult to capture the importance of credit constraints at the time that a woman made a
decision to enter these sectors. In order to get at the influence of financial capital, we asked two
questions: 1) did the woman choose this sector because of the low capital requirements (which is likely
to be negatively related to becoming a crossover given the higher capital intensity of the crossover
sectors) and 2) did the entrepreneur choose to delay setting up her business, and whether this was
because she was saving to accumulate capital. The results indicate that these entrepreneurs do not
choose their sector ‐ crossover and non‐crossover ‐ based on the capital requirements. The one exception
to this is when we use the combined sample and do not control for the pathway to becoming a crossover.

24
In this case, delaying the enterprise start‐up to accumulate capital is positively correlated with being a
crossover, but only at 10 percent. We will discuss (current) sources of credit further in section V.
In sum, and as discussed in this
section, most forms of human and
financial capital do not appear to play a
role in being a crossover. In terms of skills
and abilities, crossover entrepreneurs do
not seem to have more innate
intelligence than non‐crossovers. Their
personalities are somewhat different, but
not in ways that uniformly predict
business success. What seems to be
critically important for the crossover
decision, however, are psychosocial
factors. And key among these is the
importance of male role models and ‘gate
openers’, and the active engagement of
these role models in engaging the female
entrepreneur in the activities of the
crossover sector and in breaking
traditional norms. These factors give us
some insight into how female
entrepreneurs become crossovers and
the combination of them, as it is the case
for Ali Z, one of our respondents in Box 1.
But the challenge is not only to successfully break into a new sector, but stay in the sector. In the
next section, we examine some of the challenges crossovers face in sustaining their businesses.
Box 1: The Story of Ali Z ‐ Exposure to Foundry
Ali is a 29‐year old woman who has run a business in metal
fabrication for ten years. She was born in the Northern
Region of Uganda, and spent most of her childhood with
her uncle until the age of 14, when she moved to live with
her grandmother. Ali is unable to read and write, but had
a role model as a child that was a female business owner
who was wealthy and successful. While a teenager, “An
employee at a foundry near my grannie’s home invited me
to earn a living filing saucepans,” and so Ali became
introduced to the business of foundry.
While an employee, Ali noticed that the industry was
profitable. Over the next few years, while her
grandmother provided her with shelter and food, Ali saved
a bit of money. From her savings, she started her own
enterprise in foundry. She now has four employees (two
men, two women) and on a good day of sales, Ali earns
profits of 150,000 UGsh ($67).
When asked if she would want to expose other women to
this industry, Ali responds with an enthusiastic yes.
Women “need to work and educate their children. Some
women are desperately in need of money and heavily
depending on their husbands/boyfriends,” she says. Ali
has a husband, but feels lucky to be able to support
herself.
25
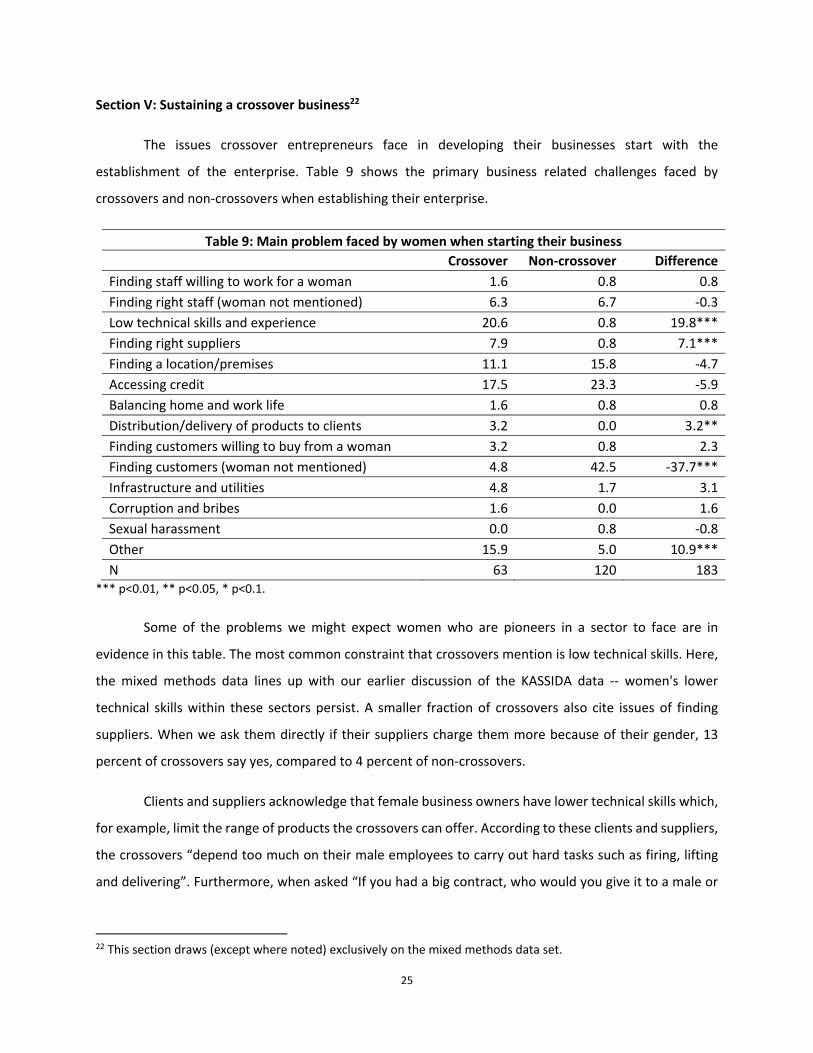
Section V: Sustaining a crossover business22
The issues crossover entrepreneurs face in developing their businesses start with the
establishment of the enterprise. Table 9 shows the primary business related challenges faced by
crossovers and non‐crossovers when establishing their enterprise.
Table 9: Main problem faced by women when starting their business
Crossover Non‐crossover Difference
Finding staff willing to work for a woman 1.6 0.8 0.8
Finding right staff (woman not mentioned) 6.3 6.7 ‐0.3
Low technical skills and experience 20.6 0.8 19.8***
Finding right suppliers 7.9 0.8 7.1***
Finding a location/premises 11.1 15.8 ‐4.7
Accessing credit 17.5 23.3 ‐5.9
Balancing home and work life 1.6 0.8 0.8
Distribution/delivery of products to clients 3.2 0.0 3.2**
Finding customers willing to buy from a woman 3.2 0.8 2.3
Finding customers (woman not mentioned) 4.8 42.5 ‐37.7***
Infrastructure and utilities 4.8 1.7 3.1
Corruption and bribes 1.6 0.0 1.6
Sexual harassment 0.0 0.8 ‐0.8
Other 15.9 5.0 10.9***
N 63 120 183 *** p<0.01, ** p<0.05, * p<0.1.
Some of the problems we might expect women who are pioneers in a sector to face are in
evidence in this table. The most common constraint that crossovers mention is low technical skills. Here,
the mixed methods data lines up with our earlier discussion of the KASSIDA data ‐‐ women's lower
technical skills within these sectors persist. A smaller fraction of crossovers also cite issues of finding
suppliers. When we ask them directly if their suppliers charge them more because of their gender, 13
percent of crossovers say yes, compared to 4 percent of non‐crossovers.
Clients and suppliers acknowledge that female business owners have lower technical skills which,
for example, limit the range of products the crossovers can offer. According to these clients and suppliers,
the crossovers “depend too much on their male employees to carry out hard tasks such as firing, lifting
and delivering”. Furthermore, when asked “If you had a big contract, who would you give it to a male or
22 This section draws (except where noted) exclusively on the mixed methods data set.

26
female business owner?” The qualitative responses pointed to male‐owned firms when it came to metal
fabrication and carpentry because of the skill levels required to deliver on time.23
Finally, a small fraction of crossovers refer to problems with the distribution/delivery of products
to clients, while no non‐crossovers cite these issues – likely due to the nature of their business. But finding
customers in the first place is not a challenge faced by the crossovers while this is far and away the major
problem cited by non‐crossovers (over 44 percent). From the focus group discussions with clients of metal
fabrication and carpentry, it emerges that crossovers are perceived as being better at tracking their orders
and as providers of better customer care than male business owners.
Given crossovers are defying gender norms, we might expect crossover entrepreneurs to be more
isolated. When asked if they have difficulty establishing networks, 40 percent of crossover entrepreneurs
say yes compared to only 14 percent of non‐crossovers. However, in some dimensions, crossovers are
able to overcome networking difficulties. They know roughly the same number of people in their sector
as non‐crossovers do, although less of these people (but not statistically significantly less) are women.
Fifty‐four percent of them interact with other business owners at least once a month to discuss business
issues, while this is true for only 39 percent of non‐crossovers.24 And crossovers are as likely as non‐
crossovers to interact with other women to discuss business issues.
As mentioned in the previous sections, self‐efficacy plays a positive role in entering the sector,
but also in sustaining the business. Seasoned women entrepreneurs see themselves as able to effectively
master all crucial aspects of their trade, no doubt by applying life skills they have developed in their paths
as independent businesswomen and heads of household. This is also reflected in the qualitative work in
the fact that compared with women in traditional sectors, crossovers are less concerned about social
perceptions of their actions and show lower fear of social shame.
Another potential dimension in which issues may arise for crossover entrepreneurs is in the
harassment they receive as they operate their business. Table 10 compares reported sources of
harassment for crossover and non‐crossover female entrepreneurs. The major form of harassment that
both crossovers and non‐crossovers face is a threat to shut down the business (most commonly by the
23 If that is the case, this would suggest crossovers would do a higher number of smaller activities than men. Information on type of products sold suggests this is the case for women doing metal work. One woman noted that her difficulties in finding male employees to help with the physically demanding work had influenced her decision in the type of products she was offering. 24 This difference is significant at 10 percent.

27
police), but this threat is significantly more frequent for crossovers. In addition, crossovers experience
more frequent vandalism of their premises. Both of these could be because crossovers stand out within
their sectors. However, these could also be features of the sectors within which crossovers operate. For
example, compare a metal fabricator and a caterer. A caterer can pack up most of her capital and move
her business quite easily, while a metal fabricator is more likely to have larger machinery that makes her
business less mobile.25
Table 10: Harassment in the past 12 months (%)
Crossover Non‐crossover Difference
Threats to shut down business 33.9 20.0 13.9**
Shouting, scolding, making a nuisance in or near enterprise premises
21.0 15.0 6.0
Vandalism of premises or merchandise 8.1 2.5 5.5*
Confiscation of property or merchandise 8.1 6.7 1.3
Pushing or shoving 14.5 11.8 2.8
Sexual proposals 29.0 16.8 12.2*
Fondling or inappropriate touching 3.2 2.5 0.7
Beating 6.5 2.5 3.9
Arson 3.2 0.8 2.4
Witchcraft 19.4 14.5 4.8
N 62 119 181 *** p<0.01, ** p<0.05, * p<0.1.
The third significant difference in harassment unambiguously indicates the vulnerability of
women who choose to cross over ‐ they are almost twice as likely to experience unwanted sexual
proposals than those who do not cross over26 ‐ although they are equally likely to report sexual
harassment to be among the three most prominent problems faced by business women in Uganda
25 The KASSIDA data set (table 4) provides some support for this fact as there are no significant differences between men and women in the crossover sectors across the forms of harassment. However, this is not a primary focus in the KASSIDA data collection and some numbers appear less reliable (e.g. much lower rates of sexual harassment). 26 These findings on sexual harassment are not confirmed in the KASSIDA data set, where reporting of sexual harassment is lower in general and in particular for crossovers. This is likely partly related to methodological differences (as Ellsberg et al (2001). Ellsberg and Heise (2002) show when comparing differences in reported experiences of violence that these issues are very sensitive to methodological factors such as type and structure of the survey, interview setting and privacy levels, sex of the interviewer, and if the instrument is quantitative or qualitative. The mixed methods survey design and implementation ‐ including a more personal approach to individual’s own experience in the form of a dialogue ‐ was better suited to learn about these issues. UN (2014) and Ellsberg and Heise (2005) also note that underreporting of violent experiences in questions related to violence inserted in surveys about other unrelated issues is of frequent occurrence.

28
interested in entering their sector (23 percent of crossovers and 21 percent of non‐crossovers27).
Harassment also appeared prominently as part of the disadvantages of crossovers as seen by clients and
community leaders.
When we asked entrepreneurs about the issues they currently face in their business, the most
common answer (at around 35 percent) for both crossovers and non‐crossovers was credit. Table 11
shows the sources of credit for these entrepreneurs in the last 12 months.
Table 11: Borrowing sources in the past 12 months
Crossover Non‐crossover Difference
Spouse / partner 9.5 3.3 6.2*
Female family member 9.5 6.7 2.9
Male family member 7.9 5.8 2.1
Female friend / community member 6.3 15.8 ‐9.5*
Male friend / community member 3.2 5.0 ‐1.8
Other business 3.2 0.8 2.3
Microfinance institution 28.6 30.0 ‐1.4*
Bank 17.5 6.7 10.8**
N 63 120 183 *** p<0.01, ** p<0.05, * p<0.1.
Not surprisingly, given the capital intensive nature of their businesses, crossovers get credit from
different sources. The most common source of credit in the last year for crossovers was a microfinance
institution (29 percent), followed by a formal bank ‐‐ 18 percent of crossovers used this source, compared
to only 7 percent of non‐crossovers. Crossovers are less likely than non‐crossovers to have borrowed from
a female friend/community member, perhaps because non‐crossovers can rely on other women who
work in their sectors. On the other hand, 10 percent of crossovers borrowed from their spouse, compared
to only 3 percent of non‐crossovers.
A large majority of entrepreneurs contributes to household expenses. When asked if their spouse
knew about their business, 94 percent of non‐crossovers answered yes, compared to 78 percent of
crossovers. Spousal knowledge of earnings was much lower ‐‐ 34 percent for crossovers and 21 percent
for non‐crossovers (this difference is not statistically significant). Table 12 shows the intended uses for
those that contribute to household expenses.
27 Table 9 only reports on the main problem.

29
Table 12: Contribution of money from business to household expenditure
Crossover Non‐crossover Difference
Regular contribution of money to household 88.7 93.2 ‐4.5
If contributes, on what?
Food for the family 92.7 99.1 ‐6.4
School fees 25.5 11.0 14.4**
Property payments/rent 10.9 7.3 3.6
Family transport costs 23.6 24.8 ‐1.1
Cooking fuel 61.8 76.1 ‐14.3*
Give money to husband 1.8 0.0 1.8
Taking care of parents/elderly 0.0 0.0 0.0
Give money to extended family 1.8 0.0 1.8
Other 3.6 0.0 3.6**
N 62 117 179
*** p<0.01, ** p<0.05, * p<0.1.
In addition to the monetary contributions, it is possible that the household demands on women's
time may constrain women's ability to provide the supervision that larger crossover enterprises require.
However, as the KASSIDA data discussed above indicate, crossover women manage to combine work and
family duties more frequently than their male counterparts with no widespread adverse impacts on
profits. Indeed, when we compare crossover women to non‐crossover women using the mixed methods
data set, we find that crossover women actually spend significantly fewer hours per week (62 hours versus
67) working in the business. And they spend about the same time taking care of children and/or the elderly
(14 hours versus 16 ‐‐ not statistically different).
Section VI: Designing policies to support women who want to cross over
This paper explores an area heretofore unexplored in the literature on enterprises and
occupational segregation. As such, there is not a literature on potential policies for us to draw on. In what
follows, we provide a set of policy recommendations based on what is suggested by the analysis above.
However, given the lack of tested interventions in this area and the limitations of descriptive analysis,

30
experimentation and rigorous impact evaluations28 of these policies ‐ using different combinations of
interventions and in different contexts ‐ are critical.
The first ingredient in a policy to support women who wish to cross over is information. A
significant majority of the women who have not entered male‐dominated sectors think that they make
the same or more as enterprise owners in these sectors when, in fact, they do not. And they recognize
that information is a factor and it needs to come early in life. ‐“No, they are not different [crossovers], any
woman can do that kind of work, provided she is exposed early enough” noticed a hair salon owner. The
provision of information will enable these women, in the first instance, to make better informed choices
about their sector of operation. Findings from a 2011 evaluation of the Kenya national vocational training
program suggest that this approach may be enough to change minds (Hicks et al., 2011). In the Kenya
program, before training enrollment decisions and course selections, some women received information
on the difference between expected earnings for graduates of male‐dominated trades versus female‐
dominated trades, as well as a video presentation about successful Kenyan female car mechanics. Women
who received the intervention were nine percentage points more likely to express preference for a male‐
dominated course, and five percentage points more likely to enroll in one.
However, as our research shows, information alone is not likely to be enough. A second element
of a potential program is to provide supportive engagement with those who can help guide the female
entrepreneurs as they seek to enter and then operate businesses in male‐dominated sectors. Ideally, this
mentor will be drawn from the entrepreneur's existing network of family and friends, but it may work as
well with sympathetic (or empathetic) outsiders. In our qualitative work, both crossovers and non‐
crossovers agreed that they will allow for their daughters to cross over if someone reliable was to
introduce them to the sector.
Third, while we do not find skills to be a binding constraint for women who cross over, our analysis
suggests that it can be important to be exposed to the sector from early‐on and one way is to work / do
apprenticeships, ideally in businesses owned by people within the networks of trust. The qualitative work
makes a distinction between active and passive observation. Passive participation characterizes women
in female dominated sectors. Active participation, which is key for crossovers, consists of being close to
the business, working in a business doing sales or managing the storefront, providing services and inputs
28 Given that these policies will involve directly confronting well‐entrenched norms, it is critical to integrate qualitative work in these rigorous impact evaluations.
31
for crossover business, and/or being invited to learn. Apprenticeships or other experiences working in a
crossover business may be a critical way to not only impart basic skills to potential crossovers but also to
receive this active participation.
In addition to these elements, a number of other considerations may help with the success of this
type of intervention. First, timing of different actions is
important. Crossovers report requiring a longer time to
start their businesses primarily because apprenticeship
and learning the trade takes time. Combined with the
fact that crossovers are much more likely to have their
first job in a crossover sector, our results suggest the
importance of aiming to support women without much
experience working in a traditional female sector. This
would imply targeting younger women who are just
entering the labor market.29
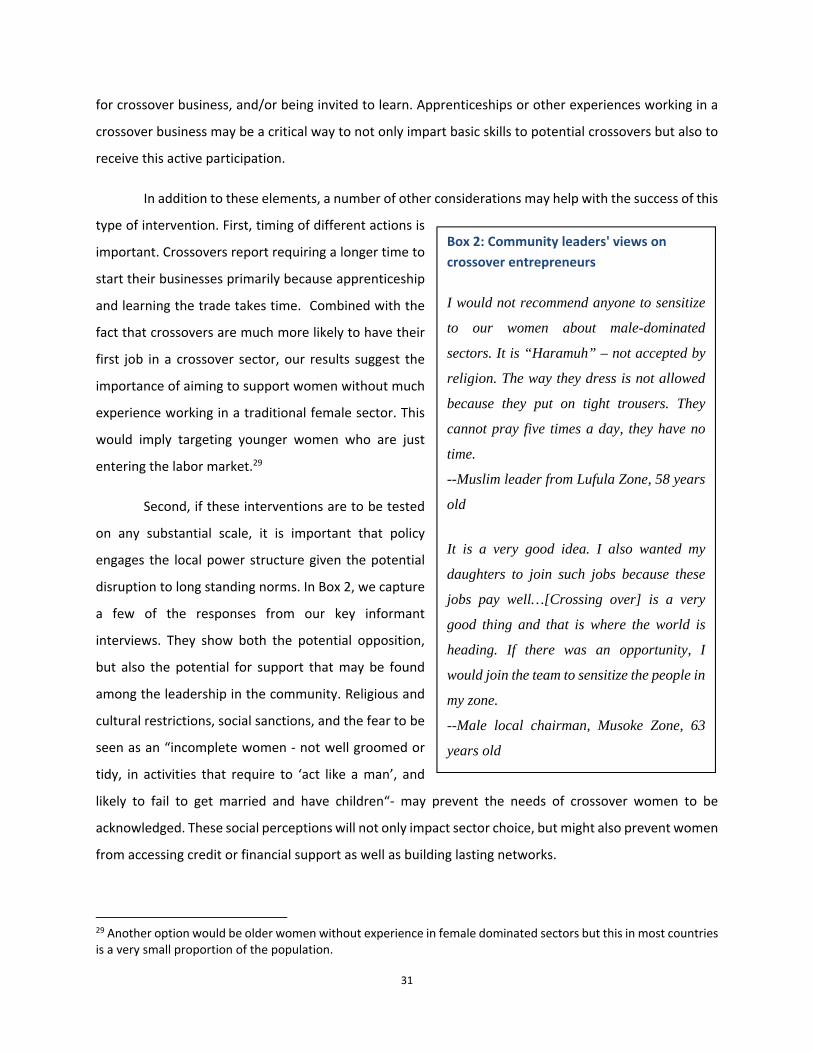
Second, if these interventions are to be tested
on any substantial scale, it is important that policy
engages the local power structure given the potential
disruption to long standing norms. In Box 2, we capture
a few of the responses from our key informant
interviews. They show both the potential opposition,
but also the potential for support that may be found
among the leadership in the community. Religious and
cultural restrictions, social sanctions, and the fear to be
seen as an “incomplete women ‐ not well groomed or
tidy, in activities that require to ‘act like a man’, and
likely to fail to get married and have children“‐ may prevent the needs of crossover women to be
acknowledged. These social perceptions will not only impact sector choice, but might also prevent women
from accessing credit or financial support as well as building lasting networks.
29 Another option would be older women without experience in female dominated sectors but this in most countries is a very small proportion of the population.
Box 2: Community leaders' views on
crossover entrepreneurs
I would not recommend anyone to sensitize
to our women about male-dominated
sectors. It is “Haramuh” – not accepted by
religion. The way they dress is not allowed
because they put on tight trousers. They
cannot pray five times a day, they have no
time.
--Muslim leader from Lufula Zone, 58 years
old
It is a very good idea. I also wanted my
daughters to join such jobs because these
jobs pay well…[Crossing over] is a very
good thing and that is where the world is
heading. If there was an opportunity, I
would join the team to sensitize the people in
my zone.
--Male local chairman, Musoke Zone, 63
years old

32
Finally, once women start to cross over, it is critical to support them ongoing. As the data and
words of our respondents indicate, the process of crossing over is a continuous one (e.g. with support for
networks or crossover specific business organizations), with different issues arising at different stages in
the process.

33
REFERENCES
Anna, A.L., Chandler, G.N., Jansen, E., Mero, N.P. (2000): “Women business owners in traditional and non‐traditional industries”. Journal of Business Venturing, vol. 15, no. 3, pp. 279‐303.
Bardasi, E., Getahun, A. (2008): “Unlocking the Power of Women”. Chapter prepared for the Ethiopia ICA. Toward the Competitive Frontier: Strategies for Improving Ethiopia’s Investment Climate. World Bank, Washington D.C
Bardasi, E., Sabarwal S., Terrell, K. (2011): “How do female entrepreneurs perform? Evidence from three Developing Regions. Small Business Econ 37: 417–441.
Bruni, A., Gherardi, S., Poggio, B. (2004): “Entrepreneur‐mentality, gender and the study of women entrepreneurs”. Journal of Organizational Change Management, vol. 17, no. 3, pp. 256‐268.
Brush, C. G. (1992): “Research on Women Business Owners: Past Trends: A New Perspective and Future Directions”. Entrepreneurship, Theory & Practice Summer, 5‐30.
Costa, R., Rijkers, B. (2012): "Gender and Rural Non‐Farm Entrepreneurship." World Development 40.12.2012.
Creswell, J., Clark, V. (2007): “Designing and Conducting Mixed Methods Research”. Sage Publications.
Davis, P., Babakus, E., Englis, P., Pett, T. (2010): “The Influence of CEO Gender on Market Orientation and Performance in Service Small and Medium‐Sized Service Businesses.” Journal of Small Business Management, Vol. 48 Issue 4, pp. 475‐496.
Dolado, J., Felgueroso, F., Jimeno, J. (2003) : “Discrimination et inégalités / Discrimination and Unequal Outcome. ” Annals of Economics and Statistics / Annales d'Économie et de Statistique , No. 71/72, pp. 293‐315.
Ellsberg, M., Heise, L., Pena, R., Agurto, S., Winkvist, A. (2001): “Researching domestic violence against women: methodological and ethical considerations”. Studies in family planning, 32(1), 1‐16.
Ellsberg, M., Heise, L. (2002): “Bearing witness: ethics in domestic violence research”. The Lancet, 359 (9317), 1599‐1604.
Ellsberg, M., Heise, L. (2005): “Researching violence against women. A practical guide for researchers and activists”. Washington, DC. World Health Organization.
Hallward‐Driemer, M. (2013): “Enterprising Women: Expanding Economic Opportunities in Africa”. Washington, DC: World Bank – AFD.
Hasan, R., Afzal, R., Parveen, S. (2011): “Motivational Orientation and Perceived Social Support among Pakistani Female Entrepreneurs in Attock District”. Journal of Gender and Social Issues, Vol 10
Hicks, J. H., Kremer, M., Mbiti, I., Miguel, E. (2011): “Vocational Education Voucher Delivery and Labor
Market Returns:A Randomized Evaluation Among Kenyan Youth.” Report for Spanish Impact Evaluation Fund, Phase II.
International Labor Organization (ILO) (2012): “Global Employment Trends for Women”. Geneva.

34
Kantis, H., Angelelli, P., Koenig V. P. (2005): “Developing Entrepreneurship: Experience in Latin America and Worldwide”. IADB/Fundes International, Washington, DC.
Kantor, P. (2005). “Determinants of women's microenterprise success in Ahmedabad, India: Empowerment and economics”. Feminist Economics, 11(3), 63–83.
Kevane, M., Wydick, B. (2001): “Microenterprise lending to female entrepreneurs: Sacrificing economic growth for poverty alleviation?”. World Development, 29(7), 1225‐1236.
Khwaja, A., Klinger, B. (ongoing): “Psychometric Analysis of Entrepreneurs”. Entrepreneurial Finance Lab, Harvard University.
Klapper, L., Parker, S. (2011): “Gender and the Business Environment for New Firm Creation.” World Bank Res Obs. 26(2): 237‐257
de Mel, S., McKenzie, D., Woodruff, C. (2010): "Who are the Microenterprise Owners? Evidence from Sri Lanka on Tokman versus De Soto”. International Differences in Entrepreneurship, Lerner and Schoar, eds. University of Chicago Press for the NBER. Pages 63‐87
de Mel Suresh, McKenzie, D., Woodruff, C. (2009): “Are Women More Credit Constrained? Experimental Evidence on Gender and Microenterprise Returns.” American Economic Journal: Applied Economics, Vol. 1, No. 3, pp. 1‐32
Mead, D. C., & Liedholm, C. (1998). “The dynamics of micro and small enterprises in developing countries”. World development, 26(1), 61‐74.
Minniti M. (2010): “Female Entrepreneurship and Economic Activity”. European Journal of Development Research, 22(3): 294‐312.
Minniti, M., Naudé, W.. “Special Section: Female Entrepreneurship across Countries and in Development.” European Journal of Development Research. Guest Editors: International Trade Forum, Case Studies: Business in Action.
Neider, L. (1987): “A Preliminary Investigation of Female Entrepreneurs in Florida.” Journal of Small Business Management, Vol. 25 Issue 3, pp. 22‐29.
Nguyen, T. (2008): “Information, Role Models and Perceived Returns to Education: Experimental Evidence from Madagascar.” Massachusetts Institute of Technology.
Nichter, S., Goldmark, L. (2009): “Small firm growth in developing countries”. World Development, 37(9), 1453‐1464.
Rauch, A., Frese, M. (2007): “Let's put the person back into entrepreneurship research: A meta‐analysis on the relationship between business owners' personality traits, business creation, and success”. European Journal of Work and Organizational Psychology, 16:4, 353‐385
UBOS (2006): “Uganda National Household Survey 2005/06” Uganda Bureau of Statistics, Kampala.
United Nations (2014): “Guidelines for producing statistics on violence against women”. Department of Economic and Social Affairs. Statistics Division.

35
Varvasovsky, Z., Brugha, R. (2000): “How to do (or not to do)…A Stakeholder Analysis,” Health Policy and Planning, Vol 15(3), 338‐345.
Yuan, K., Steedle, J., Shavelson, R., Alonzo, A., Oppezzo, M. (2006): "Working memory, fluid intelligence, and science learning." Educational Research Review 1: 83‐98.
World Bank (2011): “World Development Report 2012: Gender Equality and Development”. Washington, D.C.
World Bank (2013): “Lending Interest Rate (Percent) By Country.” Available at: http://data.worldbank.org/indicator/FR.INR.LEND. Databank.
Zhao, H., Seibert, S. E (2006): “The Big Five personality dimensions and entrepreneurial status: A meta‐analytical review”. Journal of Applied Psychology, 91(2), 259 – 271.

36
Appendix Table 1: Summary statistics for Female‐owned enterprises ‐ Mixed‐methods data set Total StDev Crossover Non‐Crossover Difference
1. Personal Characteristics
Age 39 10 38 40 ‐2
Father employment
Father worked on family farm 11 31 11 10 1
Father owned or managed enterprise 53 50 39 61 ‐22**
Father had pvt wage job 23 42 20 25 ‐4
Father had gvt wage job 9 29 20 3 17***
Father had other occupation 4 19 9 1 8**
Mother employment
Mother was a housewife 26 44 36 21 15*
Mother worked on farm 25 43 30 22 7
Mother owned or managed enterprise 41 49 23 51 ‐28***
Mother had a wage job 8 26 11 6 6
Marital status
Married or cohabiting 52 50 57 49 7
Divorced 22 41 14 26 ‐12
Widowed 18 39 16 19 ‐3
Never married 8 28 14 6 8
Religion
Protestant 24 43 23 25 ‐2
Muslim 33 47 27 36 ‐9
Pentacostal 17 38 20 16 5
Catholic 26 44 30 24 6
Region of birth
Kampala 22 41 18 24 ‐5
Eastern 16 37 23 12 10
Central 37 48 34 38 ‐4
Western 20 40 16 22 ‐7
Northern 4 19 9 1 8**
Foreign country 2 12 0 2 ‐2
Other characteristics
Ratio of male siblings 0.9 0.7 0.8 0.9 ‐0.1
Boy ratio, father owned enterprise interaction 0.4 0.7 0.2 0.5 ‐0.3**
2. Skills and abilities
Raven test score 6.5 3.4 5.5 7.0 ‐1.6***
Digit test score 3.0 1.2 3.1 3.0 0.0
Locus of control aggregate score 0.6 0.1 0.6 0.6 0.0
Agreeability score 0.7 0.1 0.7 0.7 ‐0.0
Emotional stability score 0.7 0.1 0.7 0.7 ‐0.0***
Conscientious 0.8 0.1 0.8 0.8 ‐0.0
Self‐efficacy 0.8 0.1 0.8 0.8 0.0
3. Psychosocial factors
Male role model 19 39 30 13 16**
First job in non‐male sector 78 41 52 91 ‐39***
Exposure origination
Self‐interested 23 42 9 29 ‐20***

37
Suggested to me 23 42 32 18 14*
Employed in sector by relative 21 41 36 13 23***
Observed others 12 33 16 10 6
Worked in sector for a stranger 21 41 7 28 ‐21***
Exposure enabling factor
Self idea 7 25 5 8 ‐3
Someone's suggestion 7 25 11 4 7
Observed others in sector 7 25 9 6 3
Trained 37 48 30 40 ‐11
Employed in sector by relative 20 40 36 12 24***
Worked for a wage in sector 23 42 9 29 ‐20***
4. Capital
Years of education 8.4 3.2 8.4 8.5 ‐0.1
Owned enterprise in other sector 30 46 36 27 9
Chose sector due to low capital 10 30 7 11 ‐4
Delayed start saving for capital 23 42 27 21 6
Years of experience in past jobs 9 10 6 10 ‐3*
Trained before starting business 23 42 16 26 ‐10
N 133 47 86
*** p<0.01, ** p<0.05, * p<0.1.