brand smc 453 - smctradeonline.com€¦ · the project is for a gtg (gas turbine...
TRANSCRIPT

Bra
nd s
mc
453


From The Desk Of Editor
(Saurabh Jain)
SMC Global Securities Ltd. (hereinafter referred to as “SMC”) is a registered Member of National Stock Exchange of India Limited, Bombay Stock Exchange Limited and its associate is member of MCX stock Exchange Limited. It is also registered as a Depository Participant with CDSL and NSDL. Its associates merchant banker and Portfolio Manager are registered with SEBI and NBFC registered with RBI. It also has registration with AMFI as a Mutual Fund Distributor.
SMC is a SEBI registered Research Analyst having registration number INH100001849. SMC or its associates has not been debarred/ suspended by SEBI or any other regulatory authority for accessing /dealing in securities market.
SMC or its associates including its relatives/analyst do not hold any financial interest/beneficial ownership of more than 1% in the company covered by Analyst. SMC or its associates and relatives does not have any material conflict of interest. SMC or its associates/analyst has not received any compensation from the company covered by Analyst during the past twelve months. The subject company has not been a client of SMC during the past twelve months. SMC or its associates has not received any compensation or other benefits from the company covered by analyst or third party in connection with the research report. The Analyst has not served as an officer, director or employee of company covered by Analyst and SMC has not been engaged in market making activity of the company covered by Analyst.
The views expressed are based solely on information available publicly available/internal data/ other reliable sources believed to be true.
SMC does not represent/ provide any warranty express or implied to the accuracy, contents or views expressed herein and investors are advised to independently evaluate the market conditions/risks involved before making any investment decision.
lobal stock markets gained during the week as the earnings season across the
Gglobe came largely better than expectations. U.S. 10 year bond yield surpassing 3
percent remains a concerns as it signals higher interest rates in the world biggest
bond market. European Central Bank (ECB) President Mario Draghi acknowledging about
moderation in the Eurozone recovery kept monetary policy unchanged. ECB said that there
is need for an ample degree of monetary accommodation to secure a sustained return of
inflation rates towards levels that are below, but close to, 2% over the medium term.There
are expectations that ECB will probably wait a bit more before coming out with it guidance
on it plans to phase out the stimulus.Bank of Japan (BoJ)in the monetary policy review
meeting maintaining 2 percent inflation target left its policy unchanged. The Bank said
that it will continue with "Quantitative and Qualitative Monetary Easing (QQE) with Yield
Curve Control," aiming to achieve the price stability target of 2 percent, as long as it is
necessary for maintaining that target in a stable manner.
Back at home, rising bond yields seems to be building in a risk premium for uncertainty in
the wake of rising oil prices which may stoke inflation. Foreign Institutional investors
continue to be on the sell side in the Indian equities and debt market adding to the
weakness in the domestic currency. In the earning season so far there have been more hits
than misses.Going next week, quarterly earnings, macroeconomic data, trend in global
markets, investment by foreign portfolio investors (FPIs) and domestic institutional
investors (DIIs), the movement of rupee against the dollar and crude oil price movement
will dictate trend on the bourses in the near term.
After a massive jump commodities are on the path of correction. Apart from some improved
trade environment, it was magical high in the dollar index which stimulated selling
pressure in commodities. Crude may trade weak on higher dollar index. Crude oil prices can
face resistance near 4650 and has key support near 4380. Base metals counter can witness
further profit booking at higher levels on the back of easing of sanctions on Russia's UC Rusal
and less than expected PMI figures from China. This week is holiday shortened week and
there is loads of economic data’s and events are scheduled, which may result in wild swings
in commodities. Some of them are; Manufacturing PMI of China, CPI of Germany, PCE Core,
ISM Manufacturing, ISM Employment, ISM Non-Manufacturing/Services Composite, Change
in Non-farm Payrolls, Unemployment Rate and FOMC rate decision of US, Unemployment
Rate of Newzeland, GDP of Italy and Euro Zone, GDP of Canada, etc. In the monetary review
policy meeting U.S. Federal Open Market Committee is expected to keep interest rates
unchanged at 1.75% in its meeting on 2nd May.
Contents
Equity 4-7
Derivatives 8-9
Commodity 10-13
Currency 14
IPO 15
FD Monitor 16
Mutual Fund 17-18
SMC GLOBAL SECURITIES LTD.
REGISTERED OFFICES:
11 / 6B, Shanti Chamber, Pusa Road, New Delhi 110005.
Tel: 91-11-30111000, Fax: 91-11-25754365
MUMBAI OFFICE:
Lotus Corporate Park, A Wing 401 / 402 , 4th Floor ,
Graham Firth Steel Compound, Off Western Express Highway,
Jay Coach Signal, Goreagon (East) Mumbai - 400063
Tel: 91-22-67341600, Fax: 91-22-67341697
KOLKATA OFFICE:
18, Rabindra Sarani, Poddar Court, Gate No-4,5th Floor, Kolkata-700001
Tel.: 033 6612 7000/033 4058 7000, Fax: 033 6612 7004/033 4058 7004
AHMEDABAD OFFICE :
10/A, 4th Floor, Kalapurnam Building, Near Municipal Market,
C G Road, Ahmedabad-380009, Gujarat
Tel : 91-79-26424801 - 05, 40049801 - 03
CHENNAI OFFICE:
Salzburg Square, Flat No.1, III rd Floor, Door No.107, Harrington Road,
Chetpet, Chennai - 600031.
Tel: 044-39109100, Fax -044- 39109111
SECUNDERABAD OFFICE:
315, 4th Floor Above CMR Exclusive, BhuvanaTower,
S D Road, Secunderabad, Telangana-500003
Tel : 040-30031007/8/9
DUBAI OFFICE:
2404, 1 Lake Plaza Tower, Cluster T, Jumeriah Lake Towers,
PO Box 117210, Dubai, UAE
Tel: 97145139780 Fax : 97145139781
Email ID : [email protected]
Printed and Published on behalf of
Mr. Saurabh Jain @ Publication Address
11/6B, Shanti Chamber, Pusa Road, New Delhi-110005
Website: www.smcindiaonline.com
Investor Grievance : [email protected]
Printed at: S&S MARKETING
102, Mahavirji Complex LSC-3, Rishabh Vihar, New Delhi - 110092 (India)
Ph.: +91-11- 43035012, 43035014, Email: [email protected]

NEWS
NOTES:1) These levels should not be confused with the daily trend sheet, which is sent every morning by e-mail in the name
of "Morning Mantra ".2) Sometimes you will find the stop loss to be too far but if we change the stop loss once, we will find more strength
coming into the stock. At the moment, the stop loss will be far as we are seeing the graphs on weekly basis and taking a long-term view and not a short-term view.
TREND SHEET
4
Closing as on 27-04-2018
Stocks *Closing Trend Date Rate SUPPORT RESISTANCE Closing
Price Trend Trend S/l
Changed Changed
S&P BSE SENSEX 34970 UP 27.04.18 34970 33700 33050
NIFTY50 10692 UP 27.04.18 10692 10300 10100
NIFTY IT 13795 UP 21.07.17 10712 12300 11800
NIFTY BANK* 25395 DOWN 09.03.18 24296 - 25500
ACC 1560 DOWN 02.02.18 1680 1590 1620
BHARTIAIRTEL 409 DOWN 25.01.18 453 430 440
BPCL 390 DOWN 16.02.18 466 410 425
CIPLA 600 UP 20.04.18 589 565 550
SBIN 243 DOWN 16.02.18 272 265 275
HINDALCO 235 DOWN 27.04.18 235 250 255
ICICI BANK 288 DOWN 01.03.18 305 305 315
INFOSYS 1185 UP 13.04.17 1010 1100 1080
ITC 279 DOWN 09.03.18 259 280 285
L&T 1378 UP 13.01.17 959 1310 1270
MARUTI 8783 UP 06.04.18 9206 8700 8550
NTPC 171 DOWN 02.02.18 165 172 175
ONGC 181 DOWN 09.03.18 180 190 195
RELIANCE 996 UP 23.06.17 718 920 880
TATASTEEL 590 DOWN 09.03.18 607 620 650
FORTHCOMING EVENTS
EQUITY
Ex-Date Company Purpose
2-May-18 Indiabulls Housing Finance Interim Dividend Rs 10/- Per Share
3-May-18 MMTC Bonus 1:2
9-May-18 HCL Technologies Interim Dividend
15-May-18 Godrej Consumer Products Interim Dividend
16-May-18 Nestle India Dividend - Rs 23 Per Share
17-May-18 ACC Dividend Rs 15 Per Share
Meeting Date Company Purpose
30-Apr-18 HDFC Financial Results/Dividend and Fund Raising
30-Apr-18 Hindustan Zinc Financial Results
30-Apr-18 CEAT Financial Results/Dividend/Other business matters
30-Apr-18 Kotak Mahindra Bank Financial Results
1-May-18 Dabur India Financial Results/Dividend
2-May-18 HCL Technologies Financial Results/Dividend
2-May-18 Hero MotoCorp Financial Results/Dividend
2-May-18 Marico Financial Results/Other business matters
2-May-18 Tata Power Company Financial Results/Dividend
3-May-18 HCC Financial Results
3-May-18 MRF Financial Results/Dividend/Fund Raising
3-May-18 Castrol India Financial Results
4-May-18 BSE Financial Results/Dividend
4-May-18 Ambuja Cements Financial Results
7-May-18 Tata Chemicals Financial Results/Dividend
7-May-18 ICICI Bank Dividend
8-May-18 Godrej Consumer Products Financial Results/Dividend
8-May-18 SKF India Financial Results/Dividend/Other business matters
8-May-18 ABB India Financial Results
DOMESTIC NEWSEconomy• Ravi Shankar Prasad, Union Minister, of Electronics and Information
Technology said: Indian mobile manufacturing industry is expected to touch Rs 1,32,000 crore by end of 2018.
Auto Ancillaries• GNA Axles announced that the company will avail a term loan of Rs.
70.00 crore from Bajaj Finance for the purpose of procuring the Machinery for the manufacture of Axles Shafts for LCV's, Small Pick ups and SUV's at its upcoming new unit at Gulabgarh Dist. Kapurthala. The factory building and shed for this Unit has already been erected.
Capital Goods• ABB inaugurated a microgrid solution at its Vadodara facility that will
harness solar power and reduce its carbon footprint. This is the first of its kind to be installed at a manufacturing campus in India.
• The Thermax Group has concluded a repeat order of Rs 279 crore from a leading public sector fertiliser company to set up their captive cogeneration plant at Trombay. The project is for a GTG (Gas Turbine Generator)-cum-HRSG (Heat Recovery Steam Generator) based cogen plant of 50 MW capacity on an EPC basis.
Telecom• Reliance Jio is planning to recruit about 75,000 to 80,000 people during
this financial year. The company was having a partnership with about 6,000 colleges, including technical institutions, across the country.
Information Technology• Cyient Ltd has acquired AnSem N.V., for a consideration of $17 million
through its subsidiary Cyient Europe Ltd. AnSem, a fabless, application-specific integrated circuits (ASICs) design company, serves companies in automotive, medical, industrial, smart home and smart grid sectors. The all-cash deal lets Cyient buy 100 per cent equity in the target firm.
FMCG• ITC has joined hands with NITI Aayog to train 2 lakh farmers to
increase their income and raise productivity of major crops in 25 "aspirational districts" across seven states in the country by 2022.
• Parag Milk Foods has launched Avvatar Advanced Muscle Gainer, a product specially designed to support lean muscle gain with controlled fat levels. The product is available in a rich chocolate flavour with pack sizes of 3.3 lbs, 6 lbs and 10 lbs.
Miscellaneous• VIP Industries will invest around Rs 80 crore in the ongoing financial
year on advertisement and promotions for all its brands. The company plans to spend Rs 30 crore of the planned investment in the first quarter of the financial year 2018-19.
INTERNATIONAL NEWS• US durable goods orders surged up by 2.6 percent in March after spiking
by an upwardly revised 3.5 percent in February. Economists had expected durable goods orders to climb by 1.6 percent compared to the 3.0 percent jump that had been reported for the previous month.
• US jobless claims dropped to 209,000, a decrease of 24,000 from the previous week's revised level of 233,000. Economists had expected jobless claims to edge down to 230,000 from the 232,000 originally reported for the previous week.
• US consumer confidence index rose to 128.7 in April from a revised 127.0 in March. Economists had expected the index to dip to 126.1 from the 127.7 originally reported for the previous month.
• US new home sales soared by 4.0 percent to an annual rate of 694,000 in March after surging up by 3.6 percent to a revised rate of 667,000 in February. Economists had expected new home sales to climb by 1.9 percent.
• US existing home sales climbed by 1.1 percent to an annual rate of 5.60 million in March after surging up by 3.0 percent to a rate of 5.54 million in February. Economists had expected existing home sales to edge up by 0.2 percent.
• The European Central Bank’s Governing Council left interest rates unchanged. The rates on the main refinancing operations and the interest rates on the marginal lending facility and the deposit facility will remain at 0.00%, 0.25% and minus 0.40%, respectively.
• Industrial output in Japan gained 1.2 percent on month in March, the Ministry of Economy, Trade and Industry. That topped forecasts for an increase of 0.5 percent following the 2.0 percent gain in February.
• Retail sales in Japan were down a seasonally adjusted 0.7 percent on month in March, the Ministry of Economy, Trade and Industry said. That was shy of forecasts for a flat reading following the 0.5 percent increase in February.
*BANKNIFTY has breached the resistance of 25200

BSE SENSEX TOP GAINERS & LOSERS (% Change) NSE NIFTY TOP GAINERS & LOSERS (% Change)
SECTORAL INDICES (% Change)
SMC Trend
FMCGHealthcare
Auto BankRealty
Cap GoodsCons Durable
Oil & GasPower
ITMetal
Down SidewaysUp
GLOBAL INDICES (% Change)
INDIAN INDICES (% Change)
SMC Trend
Nifty Sensex BSE Midcap BSE Smallcap Nifty Junior S&P CNX 500
SMC Trend
FTSE 100CAC 40
NasdaqDow jonesS&P 500
NikkeiStrait times
Hang SengShanghai
FII/FPI & DII TRADING ACTIVITY (In Rs. Crores)
5
EQUITY
FII / FPI Activity DII trading activity
14.21
7.34
5.114.18 4.02
-10.72
-5.93 -5.60-4.62 -4.53
-15.00
-10.00
-5.00
0.00
5.00
10.00
15.00
20.00
Yes Bank M & M Reliance Inds. Adani Ports TCS Hindalco Inds. Vedanta Wipro Tata Steel Bharti Infra.
14.14
7.38
5.103.99 3.93
-5.66-4.50
-3.33 -2.91-2.23
-10.00
-5.00
0.00
5.00
10.00
15.00
20.00
Yes Bank M & M Reliance Inds. Adani Ports TCS Wipro Tata Steel St Bk of India Tata Motors-DVR
Axis Bank
0.51
0.87
-0.08 -0.07
0.320.36
-0.20
0.00
0.20
0.40
0.60
0.80
1.00
Nifty Sensex BSE Midcap BSE Smallcap Nifty Next 50 S&P CNX 500
0.93
0.41
-1.04
-0.47
0.54
0.78
1.37
-3.99
0.70
-0.77
1.35
-5.00
-4.00
-3.00
-2.00
-1.00
0.00
1.00
2.00
Auto Index Bankex Cap Goods Index Cons Durable Index
FMCG Index Healthcare Index IT Index Metal Index Oil & Gas Index Power Index Realty Index
-0.38
-0.57
-0.12
0.71
-0.09
-1.35
0.11
0.720.75
-1.50
-1.00
-0.50
0.00
0.50
1.00
Nasdaq Comp. Dow Jones S&P 500 Nikkei Strait Times Hang Seng Shanghai Comp. FTSE 100 CAC 40
-21.02
-259.08
-680.99
-304.79
-1056.34
111.01
387.26
508.55435.98
684.11
-1200.00
-1000.00
-800.00
-600.00
-400.00
-200.00
0.00
200.00
400.00
600.00
800.00
Friday Monday Tuesday Wednesday Thursday

Beat the street - Fundamental Analysis
Source: Company Website Reuters CapitalineAbove calls are recommended with a time horizon of 8 to 10 months.
6
EQUITY
Investment Rationale• Suprajit Engineering Limited is the largest
automotive cable maker with a planned annual cable capacity of 225 million cables. Company’s customer list includes most Indian automotive majors. It also exports too many marquee global customers.
• The company uses its diverse knowledge and experience in manufacturing processes to leverage the best out of all its manufacturing facilities and research centers.
• On the development front, the company has bought technology to start supplying CBS (Combined Braking System) module and is working with various OEMs to get it approved.CBS is mandatory from FY19/20 on all newly launched/ manufactured two-wheelers respectively with engine capacity of <125 cc.
• The company plans to increase its non-automotive cable revenue and the acquisition of “Wescon Controls” is an effort in this direction. The management of the company has implemented new strategy to increase penetration in the US non-automotive segment (agri and construction to begin with). This shall lower the cyclicality of business and improve profitability. It has restated its guidance of 8-10% YoY revenue growth.
• It manufactures cables, which caters mostly to the auto industry, has a production capacity of over 150 million automotive cables a year, and is the largest domestic manufacturer of automotive cables. To reduce its dependency on two-wheelers, the company plans to increase its sales to four-wheelers—currently 33% of its sales mix. More domestic orders (from Maruti) and export orders (from BMW, Audi, Volkswagen, etc.) would help the company boost its sales in the four-wheeler segment. Moreover, Management expects cable to continue to outperform industry. Export revenues to double over next three years
from current levels of Rs 120 crore led by new exports orders from existing customers like VW, Ford, BMW, Renault Nissan.
• Next phase of growth for the company is likely to be driven by gaining share in global auto and non-auto cables; increase in content supplied for CBS/ABS in domestic 2Ws; focus on aftermarket space (both lamps & cables). The company is expanding business in North America.
ValuationThe company is the most preferred manufacturer of cables and meets the demand of virtually every major OEM in the automotive sector. It would more focus on cables in the export market for better positioning. Steady demand from specific OEMs and the shoring up of control-cable growth in the auto and non-auto markets, exports and replacements would guide the further growth to the company. According to the management, its profitability would improve in coming years as its capacity expansion and integration with the acquired companies is almost done. Thus we expect the stock to see a price target of Rs 319 in 8 to 10 month’s time frame on an expected P/E of 28x and FY19 (E) earnings of Rs.11.40.
Investment Rationale• GNFC today is one of the leaders in fertilizer
i ndus t ry. The company i s engaged i n manufacturing and selling fertilizers such as Urea and Ammonium Nitro-phosphate under the brand name of "NARMADA". The company has initiated a unique and first of its kind, socio economic project of collection of neem seeds through the rural poor especially women to supplement their income and encourage them for organic farming.
• On the development front, it has set up core chemical and petrochemical plants such as Methanol, Formic Acid, Nitric Acid, and Acetic; has India’s largest single stream plant of Aniline and the proposed di-calcium phosphate project in joint venture with Belgian company Eco Phos will be operational by 2019. Di-Calcium Phosphate is mainly used as dietary supplement in prepared instant food products including noodles. Moreover, the company is only manufacturer of Toluene Di-Isocyanate (TDI) in South East Asia and Indian Sub Continent. Its chemicals enjoy high brand value in niche market.
• The company is on a high growth trajectory as during the year FY17-18, performance of company is the best ever in its 42 years history, with improved financial performance, long term debt has been fully paid off as of that by making the prepayment of Rs. 534crore. These measures reduced the finance cost of the company by 51% Y-o-Y.
• The growth in revenue and profits are significantly led by non-TDI chemicals, both in terms of revenue and profits. Most of the plants performed well. For TDI the combined capacity utilisation stood at 93% during the year as against 73% last year. Also during the year Aniline, Ethyl
Acetate, Formic Acid and Technical Grade Urea has also recorded highest production. The realization in Acetic Acid, Formic Acid and Ethyl Acetate were the highest in the last 6 years.
• The company is now planning to raise its acetic acid and formic acid production capacity. For the fourth quarter ended March 2018, the company’s net profit increased by 38% to Rs 329 crore as compared to Rs 238 crore in the same quarter of fiscal 2016-17.
Valuation:The management of the company is continuously focusing on increasing its capacity additions in chemical segment as well as to improve capacity utilization of its Dahej Plant and during the year; it has paid all of its long term debt and now planning to reduce its working capital. Moreover, it has developed requisite expertise and confidence with proven project management competencies. Thus, it is expected that the stock will see a price target of Rs.552 in 8 to 10 months time frame on a current P/Ex 8.81 and FY19 (EPS) of Rs.62.69.
Face Value (Rs.) 10.00
52 Week High/Low 548.50/253.60
M.Cap (Rs. in Cr.) 7072.39
EPS (Rs.) 51.15
P/E Ratio (times) 8.90
P/B Ratio (times) 1.57
Dividend Yield (%) 1.65
Stock Exchange BSE
% OF SHARE HOLDING
VALUE PARAMETERS
ACTUAL ESTIMATE
FY Mar-17 FY Mar-18 FY Mar-19
Revenue 4588.80 5837.30 6863.20
Ebitda 652.80 1390.60 1792.00
Ebit 401.40 1120.20 1792.00
Pre-tax Profit 715.10 1161.93 1434.90
Net Income 229.10 794.90 974.30
EPS 15.62 51.15 62.69
BVPS 244.60 286.83 331.13
RoE 7.08 - 18.93
GUJARAT NARMADA VALLEY FERTI & CHEM LTD CMP: 455.05 Upside:21%Target Price:552.00
Face Value (Rs.) 1.00
52 Week High/Low 348.50/224.50
M.Cap (Rs. in Cr.) 3858.38
EPS (Rs.) 9.78
P/E Ratio (times) 28.22
P/B Ratio (times) 6.56
Dividend Yield (%) 0.18
Stock Exchange BSE
% OF SHARE HOLDING
VALUE PARAMETERS
ACTUAL ESTIMATE
FY Mar-17 FY Mar-18 FY Mar-19
Revenue 1208.40 1447.40 1636.40
Ebitda 200.90 233.20 272.00
Ebit 178.90 198.00 237.10
Pre-tax Profit 174.10 187.80 231.80
Net Income 113.00 127.70 159.40
EPS 8.60 9.21 11.40
BVPShare 40.65 45.03 54.32
RoE 22.89 22.46 23.29
P/E Chart
SUPRAJIT ENGINEERING LTD CMP: 275.85 Upside:16%Target Price: 319.00
P/E Chart
` in cr
` in cr
11.16
15.06
4.2241.18
28.38Foreign
Institutions
Non Promoter Corporate Holding
Promoters
Public & Others
Foreign
Institutions
Non Promoter Corporate Holding
Promoters
Public & Others
0.00
200.00
400.00
600.00
800.00
1000.00
1200.00
1400.00
27
-Ap
r-1
6
20
-May
-16
14
-Ju
n-1
6
8-J
ul-
16
2-A
ug
-16
26
-Au
g-1
6
22
-Sep
-16
19
-Oct
-16
11
-No
v-1
6
7-D
ec-1
6
30
-Dec
-16
24
-Jan
-17
17
-Feb
-17
16
-Mar
-17
11
-Ap
r-1
7
8-M
ay-1
7
31
-May
-17
23
-Ju
n-1
7
19
-Ju
l-1
7
11
-Au
g-1
7
7-S
ep-1
7
3-O
ct-1
7
27
-Oct
-17
21
-No
v-1
7
14
-Dec
-17
10
-Jan
-18
5-F
eb-1
8
1-M
ar-1
8
27
-Mar
-18
23
-Ap
r-1
8
6 12 18 24 Close Price
11.54
4.44
0
44.48
39.54
0.00
50.00
100.00
150.00
200.00
250.00
300.00
350.00
400.00
450.00
27
-Ap
r-1
5
2-J
un
-15
7-J
ul-
15
11
-Au
g-1
5
15
-Sep
-15
26
-Oct
-15
2-D
ec-1
5
7-J
an-1
6
12
-Feb
-16
21
-Mar
-16
2-M
ay-1
6
6-J
un
-16
12
-Ju
l-1
6
17
-Au
g-1
6
23
-Sep
-16
1-N
ov-
16
7-D
ec-1
6
11
-Jan
-17
16
-Feb
-17
27
-Mar
-17
4-M
ay-1
7
8-J
un
-17
14
-Ju
l-1
7
21
-Au
g-1
7
26
-Sep
-17
2-N
ov-
17
7-D
ec-1
7
15
-Jan
-18
21
-Feb
-18
2-A
pr-
18
21 28 35 42 Close Price

Charts by Spider Software India Ltd
EQUITY
Above calls are recommended with a time horizon of 1-2 months
Disclaimer : The analyst and its affiliates companies make no representation or warranty in relation to the accuracy, completeness or reliability of the information contained in its research. The analysis contained in the analyst research is based on numerous assumptions. Different assumptions could result in materially different results.The analyst not any of its affiliated companies not any of their, members, directors, employees or agents accepts any liability for any loss or damage arising out of the use of all or any part of the analysis research.
SOURCE: CAPITAL LINE
The stock closed at Rs 279.80 on 27TH April, 2018. It made a 52-week low at Rs
230.55 on 23RD August 2017 and a 52-week high of Rs. 286.30 on 25TH October
2017. The 200 days Exponential Moving Average (EMA) of the stock on the daily
chart is currently at Rs 253.14
Short term, medium term and long term bias is looking positive for the stock. It
was forming an “Ascending Triangle” pattern on weekly charts, which is bullish
in nature. Moreover, it has given the breakout of same and also has managed to
close above the same. There is a significant rise in volume activity on weekly
basis which indicates that buying is more aggressive for the stock. Therefore,
one can buy in the range of 273-276 levels for the upside target of 320-330 levels
with SL below 255.
The stock closed at Rs 122.05 on 27TH April, 2018. It made a 52-week low at Rs
82.10 on 11TH August 2017 and a 52-week high of Rs. 126.40 on 08TH January
2018. The 200 days Exponential Moving Average (EMA) of the stock on the daily
chart is currently at Rs 106.32
As we can see on charts that stock is continuously trading in higher highs and
higher lows, forming “Rising Wedge” pattern on weekly charts which is
considered to be bullish. Apart from this, it is forming an “Inverted Head and
Shoulder” pattern on daily charts, which is also a bullish pattern. On the
technical indicators front, RSI and MACD are also suggesting buying at current
levels. Therefore, one can buy in the range of 119-120 levels for the upside
target of 135-140 levels with SL below 109.
Manappuram Finance Limited (MANAPPURAM)
7
Berger Paints (I) Limited (BERGEPAINT)

DERIVATIVES
CHANGE IN NIFTY OPTION OI (IN QTY)
WEEKLY VIEW OF THE MARKET
NIFTY OPTION OI CONCENTRATION (IN QTY)
CHANGE IN BANKNIFTY OPTION OI (IN QTY) (MONTHLY)BANKNIFTY OPTION OI CONCENTRATION (IN QY) (MONTHLY)
Overall derivative data indicates long rollover and most of the Nifty May futures positions has been rolled in the range of 10550 to 10620. Derivative data
indicates bullish scenario to continue with Nifty having multiple strong supports at 10600 & 10550 spot levels. We may witness short covering on every dip as far
Nifty index is holding above 10500 levels. In the May option contracts series 10500 put strike and 11000 calls strike are witnessing open interest build up which
indicates that the probable range for May expiry could be 10500-11000 with positive bias. From option data, shifting of range towards upper band reflects that
market undertone is likely to remain bullish with support of consistent short covering. The Implied Volatility (IV) of calls was down and closed at 11.15% while
that for put options closed at 11.05%. The Nifty VIX for the week closed at 12.04% and is expected to remain sideways. Overall market’s cost-of-carry is up on the
back of fresh long additions. The PCR OI for the week closed up at 1.15, which indicates OTM put writing. On the technical front 10600-10620 spot levels is strong
support zone and current trend is likely to continue towards 10800-10850 levels.
In lakhs
In 10000 In 10000
HINDZINC (MAY FUTURE)
Buy: Around `330
Target: `337
Stop loss: `326
BPCL
BUY MAY 380. PUT 9.75SELL MAY 370. PUT 6.50
Lot size: 1800BEP: 376.75
Max. Profit: 12150.00 (6.75*1800)
OPTIONSTRATEGY
FUTURE
JINDALSTEL
BUY MAY 260. CALL 9.20SELL MAY 270. CALL 5.80
Lot size: 2250BEP: 263.40
Max. Profit: 14850.00 (6.60*2250)Max. Loss: 7650.00 (3.40*2250)
DERIVATIVE STRATEGIES
AMARAJABAT (MAY FUTURE)
Buy: Above `868
Target: `895
Stop loss: `853
BULLISH STRATEGY BEARISH STRATEGY
APOLLOTYRE
BUY MAY 300. CALL 9.00SELL MAY 310. CALL 5.60
Lot size: 3000BEP: 303.40
Max. Profit: 19800.00 (6.60*3000)Max. Loss: 10200.00 (3.40*3000)
SELL GRANULES (MAY FUTURE)
Sell: Below `106
Target: `101
Stop loss: `109
8
Call Put Call Put
Call Put Call Put
20.16
8.01
7.09
7.93
11.85
19.21
21.31
27.55
19.29
43.83
12.3215.77
24.72
24.22
25.76
30.64
18.09
5.59
6.14
9.88 12.72
15.04
0.00
5.00
10.00
15.00
20.00
25.00
30.00
35.00
40.00
45.00
50.00
9000 10000 10300 10400 10500 10600 10700 10800 10900 11000 12000
15.26
4.36
2.90
2.64 3.78
9.31
14.41
15.89
10.21
27.06
9.59
10.01
7.26
13.68
14.58
20.22
14.64
3.58
1.60
0.72
4.21
11.60
0.00
5.00
10.00
15.00
20.00
25.00
30.00
9000 10000 10300 10400 10500 10600 10700 10800 10900 11000 12000
1.86 6.11
17.82 22.63
24.43
40.91
36.04
12.48
8.65
18.57
16.52
6.08 9.48
21.21
78.51
65.31
31.70
12.12
3.74
2.74
18.53
20.44
0.00
10.00
20.00
30.00
40.00
50.00
60.00
70.00
80.00
90.00
22500 23000 23500 24000 24500 25000 25500 26000 26500 27000 27300
1.86 6.02
17.67 21.49
23.12
35.69
24.85
5.21
3.57
17.28
16.50
3.26 7.42
16.67
62.00
53.62
16.89
8.59
1.88
2.70
18.22
20.42
0.00
10.00
20.00
30.00
40.00
50.00
60.00
70.00
22500 23000 23500 24000 24500 25000 25500 26000 26500 27000 27300
In lakhs

DERIVATIVES
FII’s ACTIVITY IN DERIVATIVE SEGMENT
SENTIMENT INDICATOR (NIFTY)
26-Apr 25-Apr 24-Apr 23-Apr 20-Apr
DISCOUNT/PREMIUM 14.70 21.15 27.80 28.10 49.30
COST OF CARRY% 0.53 0.54 0.55 0.54 0.55
PCR(OI) 1.15 1.29 1.36 1.36 1.49
PCR(VOL) 0.95 1.16 1.32 1.19 1.19
A/D RATIO(NIFTY 50) 1.33 0.42 0.92 1.22 0.46
A/D RATIO(ALL FO STOCK)* 1.18 0.41 0.63 1.11 0.45
IMPLIED VOLATILITY 11.15 11.80 11.28 11.92 11.57
VIX 12.04 12.40 11.90 13.15 13.15
HISTORICAL VOLATILITY 13.05 13.27 13.51 13.86 14.29
*All Future Stock
SENTIMENT INDICATOR (BANKNIFTY)
FII’S ACTIVITY IN NIFTY FUTURE
**The highest call open interest acts as resistance and highest put open interest acts as support.# Price rise with rise in open interest suggests long buildup | Price fall with rise in open interest suggests short buildup # Price fall with fall in open interest suggests long unwinding | Price rise with fall in open interest suggests short covering
#All Future Stock
26-Apr 25-Apr 24-Apr 23-Apr 20-Apr
DISCOUNT/PREMIUM 10.85 17.55 28.50 62.55 113.90
COST OF CARRY% 0.53 0.54 0.55 0.54 0.55
PCR(OI) 1.32 1.59 1.62 2.07 1.91
PCR(VOL) 0.98 1.23 1.13 1.59 1.07
A/D RATIO(BANKNIFTY) 1.75 0.09 0.33 2.00 0.20#A/D RATIO(ALL FO STOCK) 0.91 0.10 0.22 1.44 0.10
IMPLIED VOLATILITY 14.07 15.70 14.19 15.73 15.27
VIX 12.04 12.40 11.90 13.15 13.15
HISTORICAL VOLATILITY 17.47 17.45 17.42 17.92 18.45
9
In Cr. In Cr.
Bottom 10 RolloverTop 10 Rollover
NAME LTP Rollover % Open interest
EQUITAS 151.45 97.1% 19692800
JSWSTEEL 329.2 96.5% 65415000
MCX 768.15 94.5% 3857000
BRITANNIA 5407.65 94.4% 842400
LICHSGFIN 549.1 94.3% 12050500
SUNPHARMA 515.5 94.2% 56732500
GMRINFRA 20.45 94.2% 283725000
IDFC 55.75 94.1% 155113200
CENTURYTEX 1229.5 93.9% 6290900
BHARATFORG 776.05 93.7% 8343600
NAME LTP Rollover % Open interest
ITC 275.15 53.8% 57549600
NIITTECH 1120.45 54.5% 1830000
CUMMINSIND 750.6 55.2% 830400
TCS 3536.25 60.5% 6330250
MINDTREE 1046.8 61.6% 3052800
PIDILITIND 1084.5 65.6% 1195000
OIL 231.6 68.0% 2974125
ENGINERSIN 156.25 70.7% 8680000
BERGEPAINT 271.05 71.1% 1652200
MARICO 321.7 71.5% 6390800
315
-18
237
2320
792
200
177 275
163
762
-500
0
500
1000
1500
2000
2500
13-Apr 16-Apr 17-Apr 18-Apr 19-Apr 20-Apr 23-Apr 24-Apr 25-Apr 26-Apr
716
123
439
1668
1111
91
-37
2629
782
4571
-1000
0
1000
2000
3000
4000
5000
13-Apr 16-Apr 17-Apr 18-Apr 19-Apr 20-Apr 23-Apr 24-Apr 25-Apr 26-Apr

10
SPICES
The correction in soybean futures (May) seems to have been ended and days ahead the levels 3760-3800 on the upside can be seen, taking support near 3600-3550 levels. Ahead of the sowing season, a shortage of soybean seed is being estimated in 2018-19 (Jul-Jun) Kharif season owing to lower crop in key growing states. The preliminary figures show that against the requirement of 290,976 tons soybean seed, the country is likely to have 281,659 tons seeds available this year. To mitigate the smaller seed stocks for the oilseed, the government is recommending farmers to use seeds available with them only after doing seed treatment. Farmers are also being advised to use dibbling method during soybean sowing on raised broad beds. Refined soy oil futures (May) is giving a lower closing since past four consecutive weeks, despite rupee crashing to 14-month low against US dollar. This portrays that the underlying demand for this cooking oil is hand to mouth; also the sellers are not quoting higher rates as the supply side is comfortable. This bearish trend is expected to continue as it can test 755-750 levels. However, there is a contrary situation with CPO futures where an upside momentum is persisting on the back of steady demand due to the ongoing marriage season. The May delivery contract is expected to trade with a positive bias in the range of 640-660 levels. Mustard seed futures (May) is trading near its two months low of 3783 levels & the bearish trend is likely to persist as it can go down further to test 3650 levels. At the spot markets, this oilseed is under pressure of arrivals and also witnessing lower demand from crushers due to lackluster demand in mustard oil and mustard cake.
OIL AND OILSEEDS
OTHER COMMODITIES
The tug-of-war between the heft inventories of pulses and government’s measures to arrest the fall of chana prices is likely to persist, but it seems that the supply side is on the winning side. After getting price recovery shocks from various steps being taken by the government, chana is witnessing selling pressure as market participants are taking opportunity to sell their produce at higher rates. This bearish trend is expected to persist and the current month contract may even break 3500 levels to descend towards 3400 levels. Cotton futures (May) on MCX is likely to trade firm in the range of 20500-21200 levels and take positive cues from the international cotton prices, which is trading near 7-months high. The main fundamental factor that is driving cotton prices higher on ICE (International Cotton Exchange) is the dry weather concerns in Texas, the major cotton producing region in the United States. Back at home, the prospects of exports are higher & rupee inching closer to the yearly low of 66.97 is raising the optimism among the exporters. Last week, guar seed prices made yearly low of 3960, while guar gum is not much far from its yearly low of 8600 levels. The price outlook of these counters is bearish and more downside can be seen on the back of expectation of higher closing stocks of around 1.07 core bags. On the export front, the current pace of guar gum export is not going the make any major difference up to this season-end. Guar seed stocks will deplete at faster pace only in case monthly guar gum export rises to 50,000 metric tons, otherwise there is very less possibility of any major recovery in Guar seed and Guargum prices.
Bullion counter may witness profit booking at higher levels as reduced safe
haven demand and firm greenback continue to weigh on the prices. This week
better nonfarm payroll data is expected which can further keep the prices
under pressure .Moreover fed is expected to keep interest rates unchanged at
1.75% in its meeting on 2nd May. On domestic bourses sharp depreciation in
local currency rupee has capped the downside to larger extent. Gold can face
resistance near 31500 and can slip lower towards 30800 while silver can face
resistance near 40200 and may slip lower towards 38700. This week less than
expected US economic data such as US pending home sales and manufacturing
PMI can cap the downside. Recently tensions in Korean peninsula have also
eased which has reduced safe haven demand of yellow metal. Last week North
Korean leader Kim Jong Un and South Korean President Moon Jae met in the
first summit for the two Koreas in over a decade. ECB Chief Mario Draghi
denied any concerns over softness in the euro zone economy last week as the
ECB sought to bolster expectations for a gradual withdrawal of the ECBs
monetary stimulus. Rising concerns about the U.S bond yields as the 10 year
yield edged above 3% also pressurized the bullions. The jitters grew about
growing federal borrowing spurred more selling in the U.S government bonds,
paving the path for it to visit levels not seen since July 2011. China's gold
appetite remains strong as net gold imports via Hong Kong jumped 78.67
percent in March from the previous month.
BULLIONS
Crude oil prices may witness some volatility at higher levels as on the one side concerns of U.S. decision on Iran nuclear deal and sanctions is assisting the prices on higher side but on the other side rising greenback and increasing US production can lead to profit booking . Crude oil prices can face resistance near 4650 and has key support near 4380. French President Emmanuel Macron’s prediction that U.S. will pull out of Iran nuclear accord stoked concerns about renewal of sanctions that would slash crude exports from OPEC’s third-largest producer. The whole focus for market will be on whether President Trump will decide to re impose sanctions on Iran in coming weeks. If sanctions are levied on Iran, least 250,000 to 350,000 bpd of Iranian crude could be at risk of disruption if sanctions are brought back into place which will push prices upwards as markets have not fully priced in size and magnitude of Iran sanctions. Meanwhile crude inventories rose 2.2 million barrels in the week to April 20, compared with expectations for decrease of 2 million barrels. Natural gas can remain on firm note and continue to move higher towards 198 on colder weather conditions. EIA weekly data noted a bigger than expected decline in gas stocks and the trajectory of working gas in storage is moving lower, at the beginning of the injections season. Colder than normal temperatures is being forecasted to cover most of the US mid-west which can increase heating demand.
ENERGY COMPLEX
Base metals counter can witness further profit booking at higher levels as
easing of sanctions on Russia's UC Rusal and less than expected PMI figures
from China this week can cap the upside. Copper can face resistance near 468
and can slip lower towards 440. Chile's Escondida announced that early
contract talks with its workers' union ended without agreement, setting stage
for legally scheduled negotiations to begin in June. Nickel prices can witness
profit booking towards 920. According to INSG data “Global demand for nickel
is expected to increase to 2.34 million tonnes in 2018 versus 2.19 million in
2017”. Zinc prices may take support near 205 and can face resistance near 215
in MCX. According to ILZSG global demand for zinc is expected to exceed
supply by 263,000 tonnes as world demand for refined zinc is seen rising by 2%
to 13.97 million tonnes in 2018 after remaining stable over past three years.
Lead may trade with mixed bias in range of 151-160. According to ILZSG lead is
likely to be in deficit of 17,000 tonnes this year as demand for refined lead is
expected to grow 2.7% in 2018 to 11.9 million tonnes, mainly as consequence
of increases in usage in China and U.S. Aluminium can take support near 144 in
MCX. Aluminium prices declined sharply following US softening stance on
sanctions has been arrested amid reports that Oleg Deripaska plans to keep
control of United Co. Rusal. US have indicated it may lift the sanctions on
Rusal if its owner Oleg Deripaska, cedes control of the company.
Turmeric futures (May) is expected to take support near 6700 levels & trade
with an upside bias for 7200 levels. The fundamentals are supportive amid
growing demand from both domestic and export fronts. The demand-supply
balance sheet reveals that for this year, the carry-forward stock of turmeric
was around 22 lakh bags, and after adding domestic production, the total
availability of turmeric for the whole year will be around 82 lakh bags. But in
the domestic and export market this year, around 75 lakh bags of turmeric is
expected to be consumed, given that in the year 2019 turmeric carry-forward
stock is expected to be around 7 lakh bags, which can create bullish
environment for the long-term. Jeera futures (May) is likely to witness a
consolidation in the range of 15200-16500 levels. The market participants
would trade cautiously & take cues from the spot markets as the arrivals have
started at major market yards in Rajasthan in full swing. The pace of arrival
may increase in coming days but a shortage of jeera in the world market and
India being the only supplier till the month of June, would keep the prices
firm. Last week, a bearish trend has emerged in coriander futures (May) after
it has broken the major support near 5000 levels amid subdued demand and
good arrivals. During this week, this downtrend will probably get extended
towards 4600-4500 levels. The stockiest are showing less interest as they
already stocked up the spice earlier at low levels and are now unable to stock
up the spice due to full warehouses.
BASE METALS

11
TECHNICAL RECOMMENDATIONS
ALUMINIUM MCX (MAY) contract closed at Rs. 152.45 on 26th Apr’18. The contract made its high of Rs.
178.80 on 19th Apr’18 and a low of Rs. 129.40 on 5th Apr’18. The 18-day Exponential Moving Average of
the commodity is currently at Rs. 150.45.
On the daily chart, the commodity has Relative Strength Index (14-day) value of 50.63. One can buy at
Rs. 147 for a target of Rs. 153 with the stop loss of Rs. 144.75.
LEAD MCX (MAY) contract closed at Rs. 157.20 on 26th Apr’18. The contract made its high of Rs. 162 on
1st Mar’18 and a low of Rs. 150.60 on 13th Apr’18. The 18-day Exponential Moving Average of the
commodity is currently at Rs. 155.70.
On the daily chart, the commodity has Relative Strength Index (14-day) value of 50.81. One can buy at
Rs. 154 for a target of Rs. 158 with the stop loss of Rs. 152.
MENTHA OIL MCX (MAY) contract closed at Rs. 1263.80 on 26th Apr’18. The contract made its high of Rs.
1533.50 on 1st Jan’18 and a low of Rs. 1052.10 on 14th Mar’18. The 18-day Exponential Moving Average
of the commodity is currently at Rs. 1262.
On the daily chart, the commodity has Relative Strength Index (14-day) value of 54.55. One can buy
above Rs. 1282 for a target of Rs. 1346 with the stop loss of Rs. 1250.
ALUMINIUM MCX (MAY)
LEAD MCX (MAY)
MENTHA OIL MCX (MAY)
TREND SHEET
*Closing as on 26.04.18
EXCHANGE COMMODITY CONTRACT CLOSING DATE TREND TREND RATE TREND SUPPORT RESISTANCE CLOSING
PRICE CHANGED CHANGED STOP/LOSS
NCDEX SOYABEAN MAY 3722.00 19.04.18 Sideways - 3640.00 3960.00 -
NCDEX JEERA MAY 15940.00 26.04.18 Sideways - 15550.00 16100.00 -
NCDEX REF.SOY OIL MAY 768.45 12.04.18 Down 774.00 - 778.00 779.00
NCDEX RMSEED MAY 3831.00 22.03.18 Down 4018.00 - 3850.00 3870.00
NCDEX CHANA MAY 3597.00 19.04.18 Sideways - 3600.00 3750.00 -
NCDEX GUARSEED MAY 4125.00 22.03.18 Down 4221.00 - 4090.00 4110.00
NCDEX COCUD MAY 1231.00 28.02.18 Down 1569.00 - 1250.00 1265.00
NMCE PEPPER MINI MAY 37225.00 18.01.18 Down 41715.00 - 38100.00 38500.00
MCX MENTHA OIL MAY 1263.50 26.04.18 UP 1263.50 1236.00 - 1230.00
MCX CARDAMOM JUN 944.10 28.02.18 Down 1090.30 - 970.00 995.00
MCX SILVER JUL 39963.00 26.04.18 Down 39963.00 - 40300.00 40500.00
MCX GOLD JUN 31252.00 28.03.18 Sideways - 30600.00 31650.00 -
MCX COPPER JUN 467.15 17.04.18 UP 447.35 460.00 - 457.00
MCX LEAD MAY 157.20 28.03.18 Sideways - 152.00 159.00 -
MCX ZINC MAY 210.55 12.04.18 Sideways - 205.00 217.00 -
MCX NICKEL MAY 956.80 23.04.18 Down 949.50 - 990.00 995.00
MCX ALUMINIUM MAY 152.45 19.04.18 Sideways - 144.00 160.00 -
MCX CRUDE OIL MAY 4558.00 22.03.18 UP 4201.00 4470.00 - 4450.00
MCX NATURAL GAS MAY 190.50 24.04.18 UP 187.30 185.00 - 184.00

NEWS DIGEST
After a massive jump commodities are on the path f correction and that is for good reason as
some peaceful talk shed the supply disruption fear and made trade environment better. North
Korea statement regarding the End of Nuclear test was one of them. Apart from some improved
trade environment, it was magical high in the dollar index which stimulated selling pressure in
commodities as we know that Dollar index and commodities have negative correlation. Bullion
counter saw massive selling pressure, especially gold on easing concerns over North Korea and
a Sino-U.S. trade war amid upside in dollar index. Gold prices on Thursday stayed close to five-
week lows hit in the previous session, pressured by a stronger dollar, which hovered near more
than three-month highs, and a rise in US Treasury yields. The dollar index, which measures the
greenback against a basket of currencies, was steady at 91.177, its highest since January 12.
The benchmark US Treasury 10-year yield edged above 3 per cent on Wednesday as jitters
about growing federal borrowing spurred more selling in the US government bonds, paving the
path for it to visit the levels not seen since July 2011. Silver also went down in line with gold.
Furthermore, global silver physical demand dropped to its lowest level in five years during
2017, led largely by a steep decline in coin and bar demand, even as industrial demand
increased, according to Thomson Reuters GFMS. World 2017 silver physical demand fell 2.3
percent to 1.02 billion ounces, the lowest amount since 2012. Base metals took correction.
Aluminum prices moved down on softening of the U.S. sanctions on Russian producer United
Company Rusal continued to weigh on prices. Nickel also closed the week in negative territory.
In energy, natural gas saw strong upside move whereas crude shed some of its previous gain.
Cocud saw steep fall in the prices last week as well. From past 12 weeks, continuously it is
moving down, giving nightmare to the farmers and traders. Adulteration of cottonseed oilcake
by adding cheaper feed ingredients seems to have taken a toll on prices, which are near six-
year lows in absence of bulk buyers. Guar seed and gaur gum saw massive fall on expectations
of higher carry forward stocks. Turmeric prices jumped on good offtake in spot market amid
limited stocks.
WEEKLY COMMENTARY
NCDEX TOP GAINERS & LOSERS (% Change) MCX TOP GAINERS & LOSERS (% Change)
12
COMMODITY UNIT 18.04.18 26.04.18 DIFFERENCE
QTY. QTY.
BLACK PEPPER MT 0.00 0.00 0.00
CARDAMOM MT 9.40 7.20 -2.20
COTTON BALES 138300.00 142800.00 4500.00
GOLD KGS 21.00 21.00 0.00
GOLD MINI KGS 4.30 4.30 0.00
GOLD GUINEA KGS 3.18 3.18 0.00
MENTHA OIL KGS 369875.15 384951.45 15076.30
SILVER (30 KG Bar) KGS 17012.39 17312.48 300.09
WEEKLY STOCK POSITIONS IN WAREHOUSE (MCX)
COMMODITY UNIT 19.04.18 26.04.18 DIFFERENCE
QTY. QTY.
BARLEY MT 3546 3588 42CASTOR SEED MT 16009 20871 4862CHANA MT 13408 19986 6578CORIANDER MT 7559 7975 416COTTON SEED OIL CAKE MT 62780 63844 1064GUARGUM MT 25911 26359 448GUARSEED MT 32717 32335 -382JEERA NEW MT 2470 460 -2010MAIZE KHARIF MT 59 59 0RM SEED MT 67563 78954 11391SOYBEAN MT 96230 67078 -29152SUGAR MT 50 50 0TURMERIC MT 2526 3017 491WHEAT MT 3304 3534 230
WEEKLY STOCK POSITIONS IN WAREHOUSE (NCDEX)
Moscow is holding off on taking retaliatory measures against the United States for imposing sanctions on Rusal, hoping the EU can persuade Washington to ease restrictions.
U.S. consumer confidence rebounded in April and new home sales increased more than expected in March.
Russian aluminium giant Rusal is stockpiling large quantities of aluminium at one of its plants in Siberia.
Work has resumed at two gold mines operated by Randgold Resources in Mali, after strikes halted production.
The Government capped the import of yellow peas, used largely as a substitute for chana, at 100,000 tons for Apr-Jun.
Exports of spices by India during Apr-Dec rose 20% on year to 797,145 tons, and in value terms, the exports were up 4% at 131.67 billion rupees. - Spices Board India
India guar gum export during the fiscal year 2017-18 (April-March) rose nearly 18% at 494,126 tons as compared with 419,948 tons during the same period a year ago. - Agriculture & Processed Food Products Export Development Authority
NCDEX eased the castor seed contract allowing more varieties for delivery. Also, allowed moisture content variation in outbound deliveries to 1.0% from 0.5% earlier over and above the basis level of 4.5% as per contract norms.
The existing special cash margin of 5% on long side and short side of all the running contracts and yet to be launched contracts in Coriander (DHANIYA) shall be withdrawn w.e.f April 25, 2018.
2.01%
1.15% 1.07%0.88%
0.60%
-8.44%
-4.29%
3.14%
-2.75%-2.39%
-10%
-8%
-6%
-4%
-2%
0%
2%
4%
TURMERIC COPPER PEPPER WHEAT COTTON 29 MM
COTTON SEED OIL CAKE
CORIANDER KAPAS SUGARM RM SEEDS
7.08%
5.02%
1.85%
1.12% 1.03%
-8.26%
-2.82% -2.76%
-2.14%
-1.09%
-10%
-8%
-6%
-4%
-2%
0%
2%
4%
6%
8%
MENTHA OILGAS
CARDAMOM BRASS LEAD ALUMINIUM SILVER MINI NICKEL ZINC COTTON
COMMODITY
PRICES OF METALS IN LME/ COMEX/ NYMEX (in US $)
WEEKLY STOCK POSITIONS IN LME (IN TONNES)
INTERNATIONAL COMMODITY PRICES
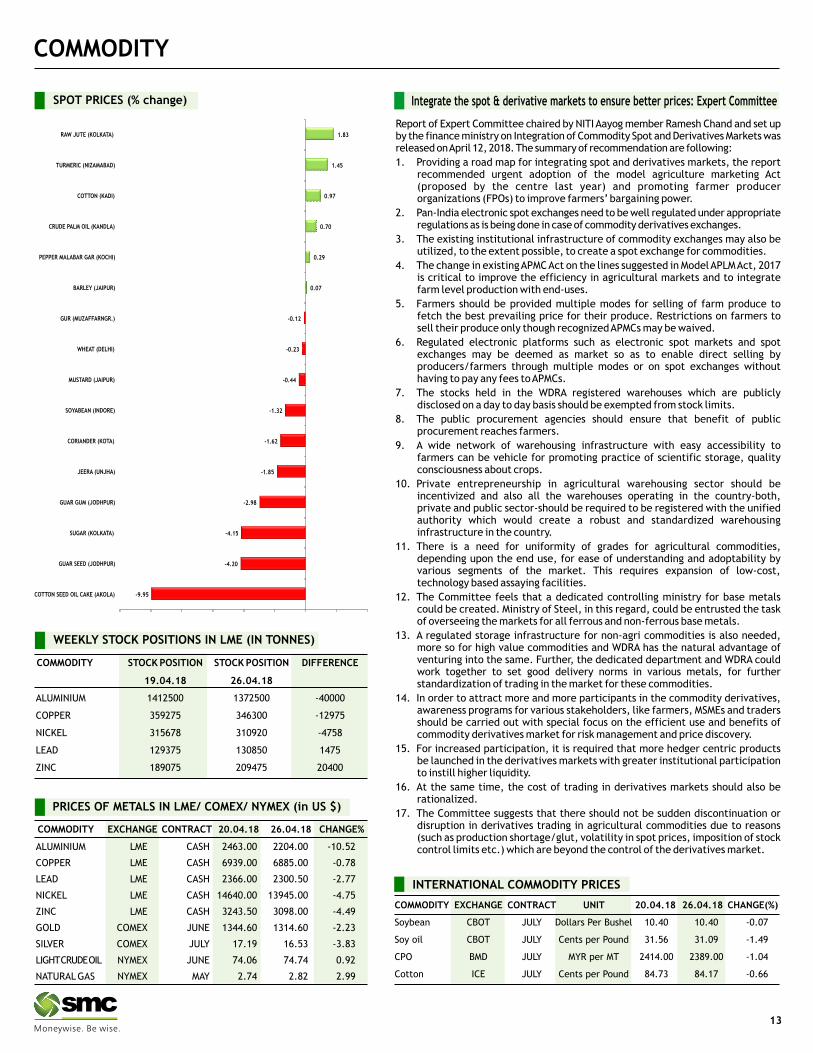
SPOT PRICES (% change) Integrate the spot & derivative markets to ensure better prices: Expert Committee
13
COMMODITY EXCHANGE CONTRACT UNIT 20.04.18 26.04.18 CHANGE(%)
Soybean CBOT JULY Dollars Per Bushel 10.40 10.40 -0.07
Soy oil CBOT JULY Cents per Pound 31.56 31.09 -1.49
CPO BMD JULY MYR per MT 2414.00 2389.00 -1.04
Cotton ICE JULY Cents per Pound 84.73 84.17 -0.66
COMMODITY EXCHANGE CONTRACT 20.04.18 26.04.18 CHANGE%
ALUMINIUM LME CASH 2463.00 2204.00 -10.52
COPPER LME CASH 6939.00 6885.00 -0.78
LEAD LME CASH 2366.00 2300.50 -2.77
NICKEL LME CASH 14640.00 13945.00 -4.75
ZINC LME CASH 3243.50 3098.00 -4.49
GOLD COMEX JUNE 1344.60 1314.60 -2.23
SILVER COMEX JULY 17.19 16.53 -3.83
LIGHT CRUDE OIL NYMEX JUNE 74.06 74.74 0.92
NATURAL GAS NYMEX MAY 2.74 2.82 2.99
COMMODITY STOCK POSITION STOCK POSITION DIFFERENCE
19.04.18 26.04.18
ALUMINIUM 1412500 1372500 -40000
COPPER 359275 346300 -12975
NICKEL 315678 310920 -4758
LEAD 129375 130850 1475
ZINC 189075 209475 20400
Report of Expert Committee chaired by NITI Aayog member Ramesh Chand and set up by the finance ministry on Integration of Commodity Spot and Derivatives Markets was released on April 12, 2018. The summary of recommendation are following:
1. Providing a road map for integrating spot and derivatives markets, the report recommended urgent adoption of the model agriculture marketing Act (proposed by the centre last year) and promoting farmer producer organizations (FPOs) to improve farmers’ bargaining power.
2. Pan-India electronic spot exchanges need to be well regulated under appropriate regulations as is being done in case of commodity derivatives exchanges.
3. The existing institutional infrastructure of commodity exchanges may also be utilized, to the extent possible, to create a spot exchange for commodities.
4. The change in existing APMC Act on the lines suggested in Model APLM Act, 2017 is critical to improve the efficiency in agricultural markets and to integrate farm level production with end-uses.
5. Farmers should be provided multiple modes for selling of farm produce to fetch the best prevailing price for their produce. Restrictions on farmers to sell their produce only though recognized APMCs may be waived.
6. Regulated electronic platforms such as electronic spot markets and spot exchanges may be deemed as market so as to enable direct selling by producers/farmers through multiple modes or on spot exchanges without having to pay any fees to APMCs.
7. The stocks held in the WDRA registered warehouses which are publicly disclosed on a day to day basis should be exempted from stock limits.
8. The public procurement agencies should ensure that benefit of public procurement reaches farmers.
9. A wide network of warehousing infrastructure with easy accessibility to farmers can be vehicle for promoting practice of scientific storage, quality consciousness about crops.
10. Private entrepreneurship in agricultural warehousing sector should be incentivized and also all the warehouses operating in the country-both, private and public sector-should be required to be registered with the unified authority which would create a robust and standardized warehousing infrastructure in the country.
11. There is a need for uniformity of grades for agricultural commodities, depending upon the end use, for ease of understanding and adoptability by various segments of the market. This requires expansion of low-cost, technology based assaying facilities.
12. The Committee feels that a dedicated controlling ministry for base metals could be created. Ministry of Steel, in this regard, could be entrusted the task of overseeing the markets for all ferrous and non-ferrous base metals.
13. A regulated storage infrastructure for non-agri commodities is also needed, more so for high value commodities and WDRA has the natural advantage of venturing into the same. Further, the dedicated department and WDRA could work together to set good delivery norms in various metals, for further standardization of trading in the market for these commodities.
14. In order to attract more and more participants in the commodity derivatives, awareness programs for various stakeholders, like farmers, MSMEs and traders should be carried out with special focus on the efficient use and benefits of commodity derivatives market for risk management and price discovery.
15. For increased participation, it is required that more hedger centric products be launched in the derivatives markets with greater institutional participation to instill higher liquidity.
16. At the same time, the cost of trading in derivatives markets should also be rationalized.
17. The Committee suggests that there should not be sudden discontinuation or disruption in derivatives trading in agricultural commodities due to reasons (such as production shortage/glut, volatility in spot prices, imposition of stock control limits etc.) which are beyond the control of the derivatives market.
-9.95
-4.20
-4.15
-2.98
-1.85
-1.62
-1.32
-0.44
-0.23
-0.12
0.29
0.70
0.97
1.45
1.83
COTTON SEED OIL CAKE (AKOLA)
GUAR SEED (JODHPUR)
SUGAR (KOLKATA)
GUAR GUM (JODHPUR)
JEERA (UNJHA)
CORIANDER (KOTA)
SOYABEAN (INDORE)
MUSTARD (JAIPUR)
WHEAT (DELHI)
GUR (MUZAFFARNGR.)
BARLEY (JAIPUR)
PEPPER MALABAR GAR (KOCHI)
CRUDE PALM OIL (KANDLA)
COTTON (KADI)
TURMERIC (NIZAMABAD)
RAW JUTE (KOLKATA)
0.07

CURRENCY
Currency Table
Currency Pair Open High Low Close
USD/INR 66.24 67.18 66.15 66.95
EUR/INR 81.27 82.11 80.93 81.76
GBP/INR 92.90 93.84 92.43 93.59
JPY/INR 61.39 61.65 60.92 61.42
News Flows of last week
EUR/INR (MAY) contract closed at 81.82 on 26th April’ 18. The contract made its high of 82.11 on 25th Arpil’18 and a low of 80.93 on 24th April’18 (Weekly Basis). The 14-day Exponential Moving Average of the EUR/INR is currently at 81.18.
On the daily chart, EUR/INR has Relative Strength Index (14-day) value of 62.09.One can buy above 81.40 for a target of 82.40 with the stop loss of 80.90.
(* NSE Currency future, Source: Reliable, Open: Monday 9.00 AM IST, Close: Thursday (5.00 PM IST)
23rd Apr Euro Zone Private Sector Growth Rebounds In April
23rd Apr U.S. home sales increase strongly; inventory remains tight
24th Apr U.S. Consumer Confidence Rises in April
26th Apr U.S. Durable Goods Orders Rise More Than Forecast In March
26th Apr U.S. Jobless Claims Fall by 24,000 in Latest Week
27th Apr China's March industrial profits up 3.1 percent year-on-year, slowing from start of year
Market Stance
Once again Indian currency hammered down sharply against the dollar and
tails its previous week losses to hit its 14 month low amid surging crude prices
coupled with headwinds on the macro-economic front in form of widening
trade deficit. Brent crude at $75 a barrel is at the highest level since
November, 2014, due to production cuts by the Organization of the Petroleum
Exporting Countries (Opec) and heightened tensions between the US and Iran.
The panic buying in dollar by corporate and importers shattered the
sentiments for local unit. Beside that a massive exodus of capital outflows
from both equity and debt market against the grim backdrop of US Federal
Reserve's anticipated interest rate policy is also triggering panic in forex
market. In meantime US bond yield surpassed the key 3 per cent mark which
also continued to support US dollar.
EUR/INR
USD/INR (MAY) contract closed at 66.95 on 26th April’ 18. The contract made its high of 67.18 on 26th April’18 and a low of 66.15 on 23rd April’18 (Weekly Basis). The 14-day Exponential Moving Average of the USD/INR is currently at 66.05.
On the daily chart, the USD/INR has Relative Strength Index (14-day) value of 76.17.One can buy around 66.75 for the target of 67.75 with the stop loss of 66.20.
GBP/INR (MAY) contract closed at 93.59 on 26th April’18. The contract made its high of 93.84 on 25th April’18 and a low of 92.43 on 24th April’18 (Weekly Basis). The 14-day Exponential Moving Average of the GBP/INR is currently at 93.00.
On the daily chart, GBP/INR has Relative Strength Index (14-day) value of 59.78. One can buy above 92.65 for a target of 93.65 with the stop loss of 92.15.
JPY/INR (MAY) contract closed at 61.42 on 26th April’18. The contract made its high of 61.65 on 25th April’18 and a low of 60.92 on 24th April’18 (Weekly Basis). The 14-day Exponential Moving Average of the JPY/INR is currently at 61.28.
On the daily chart, JPY/INR has Relative Strength Index (14-day) value of 53.91. One can buy above 61.50 for a target of 62.50 with the stop loss of 61.00
USD/INRTechnical Recommendation
Economic gauge for the next week
Date Currency Event Previous
30th Apr USD Core Personal Consumption Expenditure - Price 1.6 Index (YoY)
02nd May EUR Gross Domestic Product s.a. (YoY) 2.7
02nd May EUR Gross Domestic Product s.a. (QoQ) 0.6
02nd May USD Fed's Monetary Policy Statement -
02nd May USD Fed Interest Rate Decision 1.75
03rd May EUR Consumer Price Index (YoY) -
03rd May EUR Consumer Price Index - Core (YoY) 1
03rd May EUR Consumer Price Index - Core (YoY) -
04th May USD Average Hourly Earnings (YoY) 2.7
04th May USD Nonfarm Payrolls 103
GBP/INR
14
JPY/INR

Company Sector M.Cap (In Rs Cr.) Issue Size (in Rs Cr.) List Date Issue Price List Price Last Price %Gain/Loss (from Issue price)*
Lemon Tree Hotels ltd Hotel 5756.54 1038.00 9-Apr-18 56.00 61.60 73.20 30.71
ICICI Securities Ltd Broking House 13697.45 4016.00 4-Apr-18 520.00 431.10 425.20 -18.23
Mishra Dhatu Nigam Ltd Metal 2880.35 439.00 4-Apr-18 90.00 87.00 153.75 70.83
Karda Construction Ltd Construction 233.33 78.00 2-Apr-18 180.00 136.00 189.70 5.39
Sandhar Technologies Ltd Auto Industry 2262.57 513.00 2-Apr-18 332.00 345.00 375.90 13.22
Hindustan Aeronautics Ltd Defence 37874.40 4229.00 28-Mar-18 1240.00 1169.00 1132.65 -8.66
Bandhan Bank Ltd Bank 59019.99 4473.00 27-Mar-18 375.00 485.00 494.80 31.95
Bharat Dynamics Ltd Defence 7442.14 961.00 23-Mar-18 428.00 360.00 406.05 -5.13
H.G. Infra Engineering Ltd Infrastructure 2187.79 4229.00 9-Mar-18 270.00 270.00 335.70 24.33
Aster DM Healthcare Health Care 8396.88 981.00 26-Feb-18 190.00 182.10 166.20 -12.53
Galaxy Surfactants Ltd FMCG 5162.39 937.00 8-Feb-18 1480.00 1520.00 1456.05 -1.62
Amber Enterprises India Consumer Durables 3390.88 600.00 30-Jan-18 859.00 1180.00 1078.30 25.53
Newgen Software Tech Software 1625.31 424.00 29-Jan-18 245.00 253.00 234.75 -4.18
Apollo Micro Systems Ltd Defense 492.42 156.00 22-Jan-18 275.00 478.00 237.15 -13.76
Astron Paper & Board Mill paper 578.93 70.00 28-Dec-17 50.00 120.00 124.50 149.00
Future Supply Chain Sol Logistics 2803.54 650.00 18-Dec-17 664.00 674.00 699.90 5.41
Shalby Ltd Hopsital 2343.27 504.00 15-Dec-17 248.00 237.00 216.95 -12.52
HDFC Standard Insurance 107245.86 8695.00 17-Nov-17 290.00 311.00 533.10 83.83
Khadim India Ltd Footwear 1379.91 544.00 14-Nov-17 750.00 727.00 768.10 2.41
New India Assurance Insurance 55084.40 9600.00 13-Nov-17 800.00 748.90 668.50 -16.44
Mahindra Logistics Logistics 3436.87 830.00 10-Nov-17 429.00 432.00 483.10 12.61
Reliance Nippon Life Insurance 15553.98 1542.00 6-Nov-17 252.00 294.00 254.15 0.85
General Insurance General Insurance 62544.36 11373.00 25-Oct-17 912.00 850.00 713.00 -21.82
Indian Energy Exchange Power Trading 5045.01 1000.00 23-Oct-17 1650.00 1500.00 1663.45 0.82
MAS Financial Services Financial Services 3382.21 460.00 18-Oct-17 459.00 660.00 618.75 34.80
Godrej Agrovet Agri Business 13514.98 1157.00 16-Oct-17 460.00 621.00 703.80 53.00
Prataap Snacks Ltd FMCG 3069.89 482.00 5-Oct-17 938.00 1250.00 1308.95 39.55
SBI Life Insurance Insurance 76235.00 8400.00 3-Oct-17 700.00 733.30 762.35 8.91
ICICI Lombard Insurance 34161.88 5701.00 27-Sep-17 661.00 650.00 752.55 13.85
Capacit'e Infraprojects Infrastructure 2431.53 400.00 25-Sep-17 250.00 399.00 358.15 43.26
Matrimony.com Online Matchmaking 1946.33 501.00 21-Sep-17 985.00 985.00 857.00 -12.99
Dixon Technologies (India) Consumer Durable 3901.32 600.00 18-Sep-17 1766.00 2725.00 3444.85 95.07
Bharat Road Network Ltd Infrastructure 1509.84 600.00 18-Sep-17 205.00 204.90 179.85 -12.27
Apex Frozen Foods Ltd Sea Food 2029.22 153.00 4-Sep-17 175.00 199.90 649.35 271.06
IPO TRACKER
IPO
IPO NEWS
*Closing price as on 26-04-2018
Nazara Technologies gets Sebi's go-ahead for IPO
Mobile gaming company Nazara Technologies has received markets regulator Sebi's go-ahead to float an initial public offering. The company is popularly known
for its games on World Cricket Championship, Chhota Bheem and Motu Patlu series.Nazara, which filed draft papers with Sebi to launch an IPO on February 1,
obtained its "observations" on April 20. Nazara's public issue will see sale of 5,543,052 equity shares by existing shareholders WestBridge Ventures Investment
Holdings and Mitter Infotech. the company said listing of equity shares will enhance its brand name and provide liquidity to the existing shareholders. ICICI
Securities and Edelweiss Financial Services will manage the company's IPO. The equity shares are proposed to be listed on BSE and NSE. Nazara runs gaming
subscription services to mass mobile internet users comprising largely of first time gamers across Africa, the Middle East, South East Asia, Latin America and the
Indian subcontinent. It has operations in over 60 countries across emerging markets.
Lodha Developers to soon file initial papers for IPO, plans to raise Rs 5,500 cr
Realty major Lodha Developers will soon file draft prospectus with markets regulator Sebi to launch its IPO to raise about Rs 5,500 crore mainly for repaying its
debt. Mumbai-based Lodha Developers has revived its plans to launch an initial public offer (IPO) and will soon file draft red herring prospectus (DRHP) with Sebi.
The company had filed its DRHP in September 2009 to raise about Rs 2,800 crore. It received Sebi's nod in January 2010, but later shelved its plan to launch the
IPO due to bad market conditions post the global financial crisis. The group achieved sales bookings of about Rs 8,500 crore during 2016-17 fiscal from both
domestic market and London despite slowdown in the real estate market. In July, Abhishek Lodha had said its Indian debt stood at Rs 14,500 crore, while the debt
of the London business was about 300 million pounds. Privately-held Lodha Group is currently developing around 40 million sq ft area and has 31 ongoing projects
in London, Mumbai Metropolitan Region, Pune, Bengaluru and Hyderabad. It has a land bank of 350 million sq ft for future development. The group had forayed
into the London realty market in 2013 and acquired two prime sites in central London for an investment of about 400 million pounds.
15

16
FIXED DEPOSIT MONITOR
* Interest Rate may be revised by company from time to time. Please confirm Interest rates before submitting the application.
* For Application of Rs.50 Lac & above, Contact to Head Office.
* Email us at [email protected]
FIXED DEPOSIT COMPANIES
PERIOD MIN.ADDITIONAL RATE OF INTEREST (%)
S.NO (NBFC COMPANY -NAME) 12M 18M 24M 36M 45M 48M 60M 84M INVESTMENT
1 BAJAJ FINANCE LTD.(UPTO RS. 5 CR.) 7.60 7.60 7.80 7.85 - 7.85 7.85 - 25000/-
2 DEWAN HOUSING FINANCE CORPORATION LTD 13M=7.75% 14M=7.75% 18M=7.80% 13M=50000; 40M=7.95%
14M=10000;
40M=2000
3 DEWAN HOUSING FINANCE CORPORATION LTD (AASHRAY) 7.70 - 7.80 7.90 - 8.05 8.05 8.00 10,000/-
4 GRUH FINANCE LTD. 7.25 13M=7.25 7.25 7.25 - 7.25 7.00 7.00 96-120M=7.00%; 0.25% FOR FEMALE, 1000/-
SENIOR CITIZEN & TRUST
5 HDFC PREMIUM DEPOSIT FOR INDIVIUAL (UPTO RS. 2 CR.) 15M=7.50 22M= 7.50 30M=7.45 44M= 7.50 0.25% FOR SENIOR CITIZEN UPTO RS. 2 CR
- -6 HDFC SPECIAL DEPOSIT FOR INDIVIDUAL & TRUST 33M=7. 55 66M= 7.55 - - 0.25% FOR SENIOR CITIZEN UPTO RS. 2 CR
(UPTO RS. 5 CR.)
- -7 HDFC PREMIUM DEPOSIT FOR TRUST & INSTITUTION 15M=7. 50 30M= 7.45 - - -
(UPTO RS. 5 CR.)
8 HDFC LTD FOR INDIVIDUAL & TRUST (UPTO RS.3 CR.) 7.40 - 7.35 7.35 - 7.35 7.35 - 0.25% FOR SENIOR CITIZEN UPTO RS. 1 CR.
9 HUDCO LTD.(IND & HUF) 7.25 - 7.25 7.25 - 7.00 7.00 7.00 0.25% FOR SR. CITIZEN 10000/-
10 HUDCO LTD.(TRUST/CO/INSTITUTION) 7.00 - 7.00 7.00 - 6.75 6.75 6.75 - 10000/-
11 KTDFC (Kerela Transport) 8.25 - 8.25 8.25 - 8.00 8.00 - 0.25% EXTRA FOR SR. CITIZEN, 10000/-
12 LIC HOUSING FINANCE LTD. (UPTO RS. 5 CR.) 7.30 7.35 7.40 7.45 - - 7.45 - 0.25% FOR SENIOR CITIZEN IF APP ABOVE 10000/-
Rs. 50,000/- & 0.10% IF APP UPTO Rs. 50,000/-
13 M&M FINANCIAL SERVICES LTD (FOR BELOW RS. 1 CRORE) 7.70 7.75 7.90 8.05 - 8.05 8.05 - 0.25% FOR SENIOR CITIZEN 10000/-
15 PNB HOUSING FINANCE LTD.(UPTO RS. 5 CR.) 7.45 - 7.45 7.45 - 7.45 7.45 7.45 0.25% EXTRA FOR SR. CITIZEN UPTO RS.1 CRORE 20000/-
16 PNB HOUSING FINANCE LTD.(UPTO RS. 5 CR.) 15M=7.5 5 22M=7 .55 4 4M= 7.55 0.25% FOR SENIOR CITIZEN 30M=7.55
17 SHRIRAM TRANSPORT FINANCE-UNNATI SCHEME 7.65 - 7.65 8.00 - 8.00 8.25 - 0.25% FOR SENIOR CITIZEN 5000/-
18 SHRIRAM CITY UNION SCHEME 7.50 - 7.50 7.85 - 7.90 8.00 - 0.25% FOR SENIOR CITIZEN 5000/-
(FOR TRUST ONLY) (FOR WOMEN ONLY)
20000/- BUT
40000/-
IN MONTHLY
0.35% EXTRA FOR SR. CITIZEN OR 0.25% EXTRA
FOR EXISTING CUSTOMER (2 MONTH GAP IN
FIRST & SECOND DEPOSIT) & 0.25% EXTRA IN
RENEWAL UPTO RS.5 CR.
0.40% EXTRA FOR SR CITIZEN,WIDOW, EXISTING
DHFL HOME BORROWERS & DHFL MORTGAGE &
SME LOAN CUSTOMERS, 0.15% EXTRA FOR
RENEWAL BUT APP SHOULD REACH IN COMPANY
BEFORE DUE DATE.

MUTUAL FUND
INDUSTRY & FUND UPDATE
Sundaram Mutual Fund assigns fund manager responsibility to Mr. S. Bharath
Following the transfer of Mr. S. Bharath to the mutual fund division of the Sundaram Mutual Fund as Head – Research and Fund Manager, he shall be solely managing Sundaram Smart NIFTY 100 Equal Weight Fund, Sundaram Value Fund-Series II, III, VII, VIII, IX & X and Sundaram Long Term Tax Advantage Fund-Series I & II. He shall be jointly managing Sundaram Rural India Fund with Mr. S. Krishna Kumar. The change is effective from Apr 25.
IDFC Mutual Fund announces modification of certain schemes
Pursuant to SEBI circular dated Oct 6, 2017, and Dec 4, 2017, on categorization and rationalization of mutual fund schemes, IDFC Mutual Fund has announced modification of the features of IDFC Corporate Bond Fund, IDFC Classic Equity Fund, IDFC Sterling Equity Fund and IDFC Monthly Income Plan, with effect from May 28, 2018. Amongst the changes announced, the name of IDFC Classic Equity Fund, IDFC Sterling Equity Fund and IDFC Monthly Income Plan has been revised to IDFC Core Equity Fund, IDFC Sterling Value Fund and IDFC Monthly Income Plan, respectively.
ICICI Prudential Mutual Fund changes scheme type of certain schemes
ICICI Prudential Mutual Fund has announced change in the scheme type of ICICI Prudential Long Term Equity Fund (Tax Saving), ICICI Prudential Value Discovery Fund, ICICI Prudential Balanced Advantage Fund, ICICI Prudential Equity - Arbitrage Fund, ICICI Prudential Global Stable Equity Fund and ICICI Prudential Regular Gold Savings Fund. Additionally, it has also renamed ICICI Prudential Balanced Fund as ICICI Prudential Equity & Debt Fund.
Franklin Templeton Mutual Fund announces merger of schemes
As a part of the categorization and rationalization of schemes process, Franklin Templeton Mutual Fund has announced merger of Franklin India Government Securities Fund (FIGSF) - Composite and PF Plan (Merging Plans) into FIGSF – Long Term Plan (Surviving Plan) as on Jun 4, 2018. Consequently, from the date of merger i.e., effective Jun 4, 2018, the investors of merging plans would become investors of surviving plan.
Principal Mutual Fund modified scheme type of several funds
Pursuant to SEBI circular dated Oct 6, 2017 on categorization and rationalization of mutual fund schemes, Principal Mutual Fund has announced modification of the scheme type of Principal Dividend Yield Fund, Principal Dynamic Bond Fund, Principal Arbitrage Fund, Principal Tax Savings Fund and Principal Growth Fund. Additionally, it has also announced change in the nomenclature and benchmark of Principal Growth Fund. Accordingly, the fund shall be named as Principal Multi Cap Growth Fund and the benchmark is changed from S&P BSE 200 to Nifty 500. Such changes are effective from Apr 23.
17
NEW FUND OFFER
Scheme Name IIFL Capital Enhancer Fund - Series 1 - Regular Plan (G)
Fund Type Open-Ended
Fund Class Growth
Opens on 23-Apr-2018
Closes on 04-May-2018
Investment Objective To achieve long term capital appreciation by investing in equity and equity related securities, with strategy of hedging the portfolio with Nifty 50 Put Option and other Equity derivatives.
Min. Investment Rs.5000/-
Fund Manager Prashasta Seth
Scheme Name Kotak India Growth Fund - Series V - Regular Plan (G)
Fund Type Close-Ended
Fund Class Growth
Opens on 25-Apr-2018
Closes on 09-May-2018
Investment Objective To generate capital appreciation from a diversified portfolio of equity & equity related instruments across market capitalisation and sectors.
Min. Investment Rs.5000/-
Fund Manager Harsha Upadhyaya / Harish Krishnan
Scheme Name Sundaram Long Term Tax Advantage Fund - Series - IV - Regular Plan (G)
Fund Type Close-Ended
Fund Class Growth
Opens on 27-Mar-2018
Closes on 27-Jun-2018
Investment Objective To generate capital appreciation over a period of ten years by investing predominantly in equity and equity-related instruments of companies along with income tax benefit.
Min. Investment Rs.5000/-
Fund Manager S Krishna kumar / Dwijendra Srivastava
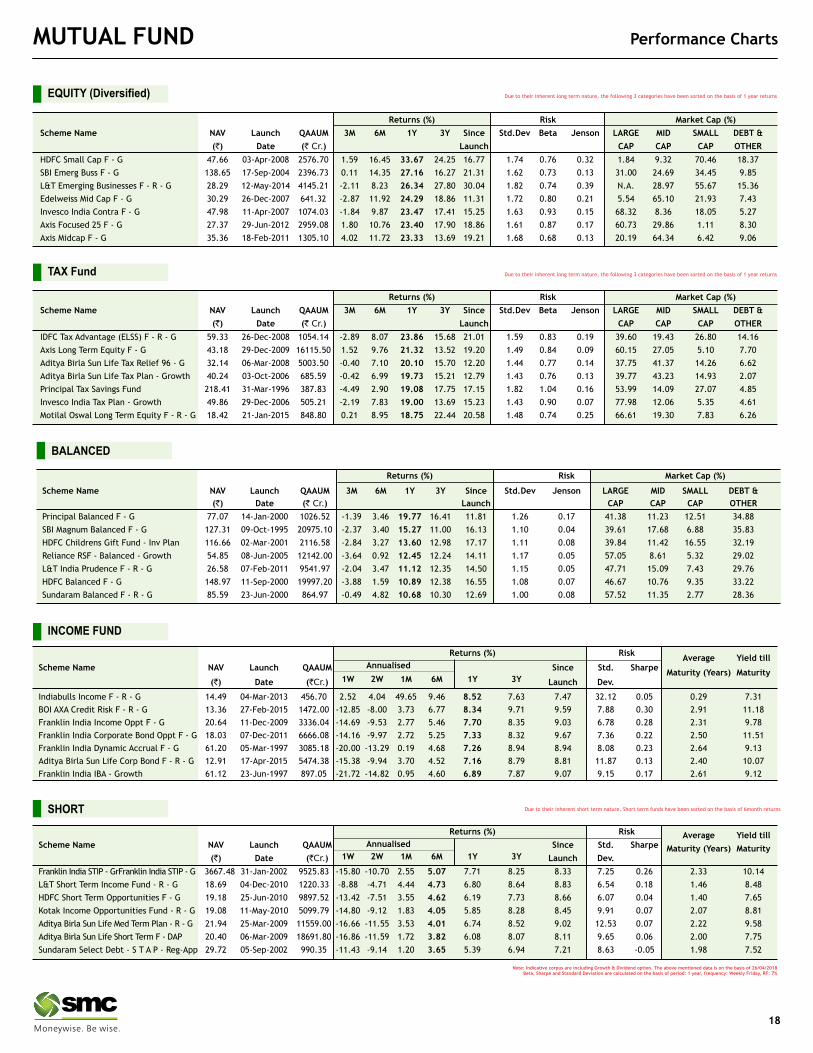
Note: Indicative corpus are including Growth & Dividend option . The above mentioned data is on the basis of 26/04/2018Beta, Sharpe and Standard Deviation are calculated on the basis of period: 1 year, frequency: Weekly Friday, RF: 7%
MUTUAL FUND Performance Charts
Returns (%) Risk Market Cap (%)
Scheme Name NAV Launch QAAUM 3M 6M 1Y 3Y Since Std.Dev Beta Jenson LARGE MID SMALL DEBT &
(`) Date (` Cr.) Launch CAP CAP CAP OTHER
IDFC Tax Advantage (ELSS) F - R - G 59.33 26-Dec-2008 1054.14 -2.89 8.07 23.86 15.68 21.01 1.59 0.83 0.19 39.60 19.43 26.80 14.16
Axis Long Term Equity F - G 43.18 29-Dec-2009 16115.50 1.52 9.76 21.32 13.52 19.20 1.49 0.84 0.09 60.15 27.05 5.10 7.70
Aditya Birla Sun Life Tax Relief 96 - G 32.14 06-Mar-2008 5003.50 -0.40 7.10 20.10 15.70 12.20 1.44 0.77 0.14 37.75 41.37 14.26 6.62
Aditya Birla Sun Life Tax Plan - Growth 40.24 03-Oct-2006 685.59 -0.42 6.99 19.73 15.21 12.79 1.43 0.76 0.13 39.77 43.23 14.93 2.07
Principal Tax Savings Fund 218.41 31-Mar-1996 387.83 -4.49 2.90 19.08 17.75 17.15 1.82 1.04 0.16 53.99 14.09 27.07 4.85
Invesco India Tax Plan - Growth 49.86 29-Dec-2006 505.21 -2.19 7.83 19.00 13.69 15.23 1.43 0.90 0.07 77.98 12.06 5.35 4.61
Motilal Oswal Long Term Equity F - R - G 18.42 21-Jan-2015 848.80 0.21 8.95 18.75 22.44 20.58 1.48 0.74 0.25 66.61 19.30 7.83 6.26
TAX Fund Due to their inherent long term nature, the following 3 categories have been sorted on the basis of 1 year returns
Returns (%) Risk Market Cap (%)
Scheme Name NAV Launch QAAUM 3M 6M 1Y 3Y Since Std.Dev Beta Jenson LARGE MID SMALL DEBT &
(`) Date (` Cr.) Launch CAP CAP CAP OTHER
HDFC Small Cap F - G 47.66 03-Apr-2008 2576.70 1.59 16.45 33.67 24.25 16.77 1.74 0.76 0.32 1.84 9.32 70.46 18.37
SBI Emerg Buss F - G 138.65 17-Sep-2004 2396.73 0.11 14.35 27.16 16.27 21.31 1.62 0.73 0.13 31.00 24.69 34.45 9.85
L&T Emerging Businesses F - R - G 28.29 12-May-2014 4145.21 -2.11 8.23 26.34 27.80 30.04 1.82 0.74 0.39 N.A. 28.97 55.67 15.36
Edelweiss Mid Cap F - G 30.29 26-Dec-2007 641.32 -2.87 11.92 24.29 18.86 11.31 1.72 0.80 0.21 5.54 65.10 21.93 7.43
Invesco India Contra F - G 47.98 11-Apr-2007 1074.03 -1.84 9.87 23.47 17.41 15.25 1.63 0.93 0.15 68.32 8.36 18.05 5.27
Axis Focused 25 F - G 27.37 29-Jun-2012 2959.08 1.80 10.76 23.40 17.90 18.86 1.61 0.87 0.17 60.73 29.86 1.11 8.30
Axis Midcap F - G 35.36 18-Feb-2011 1305.10 4.02 11.72 23.33 13.69 19.21 1.68 0.68 0.13 20.19 64.34 6.42 9.06
EQUITY (Diversified) Due to their inherent long term nature, the following 3 categories have been sorted on the basis of 1 year returns
Annualised
Returns (%) RiskAverage Yield till
Scheme Name NAV Launch QAAUM Since Std. Sharpe
1W 2W 1M 6M 1Y 3YMaturity (Years) Maturity
(`) Date (`Cr.) Launch Dev.
Indiabulls Income F - R - G 14.49 04-Mar-2013 456.70 2.52 4.04 49.65 9.46 8.52 7.63 7.47 32.12 0.05 0.29 7.31
BOI AXA Credit Risk F - R - G 13.36 27-Feb-2015 1472.00 -12.85 -8.00 3.73 6.77 8.34 9.71 9.59 7.88 0.30 2.91 11.18
Franklin India Income Oppt F - G 20.64 11-Dec-2009 3336.04 -14.69 -9.53 2.77 5.46 7.70 8.35 9.03 6.78 0.28 2.31 9.78
Franklin India Corporate Bond Oppt F - G 18.03 07-Dec-2011 6666.08 -14.16 -9.97 2.72 5.25 7.33 8.32 9.67 7.36 0.22 2.50 11.51
Franklin India Dynamic Accrual F - G 61.20 05-Mar-1997 3085.18 -20.00 -13.29 0.19 4.68 7.26 8.94 8.94 8.08 0.23 2.64 9.13
Aditya Birla Sun Life Corp Bond F - R - G 12.91 17-Apr-2015 5474.38 -15.38 -9.94 3.70 4.52 7.16 8.79 8.81 11.87 0.13 2.40 10.07
Franklin India IBA - Growth 61.12 23-Jun-1997 897.05 -21.72 -14.82 0.95 4.60 6.89 7.87 9.07 9.15 0.17 2.61 9.12
INCOME FUND
Returns (%) Risk Average Yield tillScheme Name NAV Launch QAAUM Since Std. Sharpe
1W 2W 1M 6M 1Y 3YMaturity (Years) Maturity
(`) Date (`Cr.) Launch Dev.
Franklin India STIP - GrFranklin India STIP - G 3667.48 31-Jan-2002 9525.83 -15.80 -10.70 2.55 5.07 7.71 8.25 8.33 7.25 0.26 2.33 10.14
L&T Short Term Income Fund - R - G 18.69 04-Dec-2010 1220.33 -8.88 -4.71 4.44 4.73 6.80 8.64 8.83 6.54 0.18 1.46 8.48
HDFC Short Term Opportunities F - G 19.18 25-Jun-2010 9897.52 -13.42 -7.51 3.55 4.62 6.19 7.73 8.66 6.07 0.04 1.40 7.65
Kotak Income Opportunities Fund - R - G 19.08 11-May-2010 5099.79 -14.80 -9.12 1.83 4.05 5.85 8.28 8.45 9.91 0.07 2.07 8.81
Aditya Birla Sun Life Med Term Plan - R - G 21.94 25-Mar-2009 11559.00 -16.66 -11.55 3.53 4.01 6.74 8.52 9.02 12.53 0.07 2.22 9.58
Aditya Birla Sun Life Short Term F - DAP 20.40 06-Mar-2009 18691.80 -16.86 -11.59 1.72 3.82 6.08 8.07 8.11 9.65 0.06 2.00 7.75
Sundaram Select Debt - S T A P - Reg-App 29.72 05-Sep-2002 990.35 -11.43 -9.14 1.20 3.65 5.39 6.94 7.21 8.63 -0.05 1.98 7.52
SHORT Due to their inherent short term nature, Short term funds have been sorted on the basis of 6month returns
Annualised
Returns (%) Risk Market Cap (%)
Scheme Name NAV Launch QAAUM 3M 6M 1Y 3Y Since Std.Dev Jenson LARGE MID SMALL DEBT &
(`) Date (` Cr.) Launch CAP CAP CAP OTHER
Principal Balanced F - G 77.07 14-Jan-2000 1026.52 -1.39 3.46 19.77 16.41 11.81 1.26 0.17 41.38 11.23 12.51 34.88
SBI Magnum Balanced F - G 127.31 09-Oct-1995 20975.10 -2.37 3.40 15.27 11.00 16.13 1.10 0.04 39.61 17.68 6.88 35.83
HDFC Childrens Gift Fund - Inv Plan 116.66 02-Mar-2001 2116.58 -2.84 3.27 13.60 12.98 17.17 1.11 0.08 39.84 11.42 16.55 32.19
Reliance RSF - Balanced - Growth 54.85 08-Jun-2005 12142.00 -3.64 0.92 12.45 12.24 14.11 1.17 0.05 57.05 8.61 5.32 29.02
L&T India Prudence F - R - G 26.58 07-Feb-2011 9541.97 -2.04 3.47 11.12 12.35 14.50 1.15 0.05 47.71 15.09 7.43 29.76
HDFC Balanced F - G 148.97 11-Sep-2000 19997.20 -3.88 1.59 10.89 12.38 16.55 1.08 0.07 46.67 10.76 9.35 33.22
Sundaram Balanced F - R - G 85.59 23-Jun-2000 864.97 -0.49 4.82 10.68 10.30 12.69 1.00 0.08 57.52 11.35 2.77 28.36
BALANCED
18

