brainstorm: manic depression, occupational choice and...
TRANSCRIPT

Brainstorm: Manic Depression, OccupationalChoice And Creativity
Carol Horton Tremblay* and Shawna GrosskopfDepartment of Economics
Ballard Extension Hall 303Oregon State University
Corvallis, OR 97331-3612∗
This version: September 2003
∗We gratefully acknowledge helpful comments from James F. Ragan, Jr., Victor J.Tremblay and the participants at the SEA meetings in Tampa FL, 2001. Please relayall correspondence to Carol Horton Tremblay at the address above or by phone: (541)737-1468, FAX: (541) 737-5917, or e-mail: [email protected].
1

Brainstorm: Manic Depression, Occupational Choice AndCreativity
Abstract
Manic-depressive illness (bipolar disorder) afflicts approximately 2.3 mil-lion American adults. Although earnings, unemployment, and labor forceparticipation patterns have been analyzed for manic-depressives in the eco-nomics literature, occupational choice has yet to be explored. A numberof psychiatric studies link bipolar illness and occupational choice, focusingon occupational creativity. These are typically case studies or use smallsamples and may suffer from selection bias. Here we employ a population-based data set, the Epidemiologic Catchment Area Study. We first estimatea multinomial logit model of occupational outcomes as a function of bipo-lar diagnosis, then match the occupation of each individual to a measure ofoccupational creativity. We find that manic-depressives are disproportion-ately concentrated in the managerial and professional occupations, the mostcreative occupational category, as well as service occupations.
2

1 Introduction
If a man comes to the door of poetry untouched by the madness ofthe Muses, believing that technique alone will make him a goodpoet, he and his sane compositions never reach perfection, butare utterly eclipsed by the performances of the inspired madman.
Socrates1
The hypothesized association between creativity and manic-depressive ill-ness is an age- old controversy.2 Manic depression or bipolar illness is charac-terized by pronounced mood swings alternating periods of elation, normalcy,and despondency, which can be accompanied by hallucinations or delusionsduring the peaks and troughs of the cycles. Although we might expect bipo-lar illness to hamper occupational and artistic achievement, the creativityand energy characteristic of persons with mania may actually improve theirlabor market outcomes (Frank and McGuire, 2000).
About 2.3 million American adults, or 1.2 percent of the population, havemanic- depressive illness (Weissman et al., 1991). The employment rate ofmanic-depressives is approximately 71 percent compared to about 82 percentfor the general population, and manic- depressives earn about 57 percent ofthe earnings of others, all else equal (Ettner et al., 1997). Employers mightbe more willing to hire, retain and accommodate the disabilities of bipolarworkers, for example by allowing flexible work schedules, if they know thatthere may be some payoff in productivity and innovation.
There is a fair amount of economic literature regarding mental illness ingeneral and in the labor market. As might be expected, research on thementally ill as a group has shown that they earn less than the well on aver-age, all else equal (Bartel and Taubman, 1979, 1986; Benham and Benham,1982, with the exception of neurotics; Frank and Gertler, 1991, for two ofthree measures of mental illness). Further, even when accounting for endo-geneity, the mentally ill are less likely to be employed (Hamilton et al., 1997).
Following Bartel and Taubman (1986), who emphasized the importanceof distinguishing among types of mental illness in economic analysis, the
1Plato (1974 translation).2See Jamison (1993) for a thorough history and literature review of the topic.
3

literature began to focus on more specific illnesses. Regarding the class of af-fective disorders (manic-depressive and unipolar depressive illnesses), Millerand Kelman (1992) find that affective illness is positively associated withincome, but disclaim their results due to selection bias. Focusing on unipo-lar depression, Berndt et al. (1998) show that depression lowers perceivedwork performance. In contrast to poorer employment and earnings outcomesin the Ettner et al. (1997) study discussed above, Marcotte et al. (2000)find that bipolar status in the past year does not significantly affect incomeor employment for men or women, but that length of time with a bipolardisorder positively and significantly affects employment for women. Further,the lifetime number of episodes of bipolar disease appears to significantlyincrease income for men. These mixed findings for the bipolar populationsuggest a need for further study.
None of the economic studies to date have addressed the issue of occu-pational outcomes for those with manic-depressive illnesses. Yet there is asubstantial body of research on the possible link between creative and artis-tic occupations and manic-depressive illness in the medical and behavioralsciences literature. About 75% of these studies find evidence of such a link(Jamison, 1993). Much of this research derives from case studies, biographiesof prominent historical figures in the arts, or diagnostic and psychologicalstudies of living writers, artists, and composers. Although rich and informa-tive in their own right, these studies may suffer from small sample sizes orfrom selection bias. For example, biographers likely do not choose their sub-jects at random. Manic-depressives may be more interesting and colorful towriters and to readers, and if so, focusing on biography subjects may resultin an erroneous apparent correlation between the illness and artistic ability.In addition, researchers may over- or under-diagnose bipolar disorder amongcreative figures, being influenced by the prominence of the hypothesis at thetime.
We use two samples: the first is a large population-based sample withautomated implementation of the diagnostic criteria to distinguish manic-depressives from the rest of the sample, the second is also a large population-based sample but with self reported diagnosis of bipolar illness. These shouldhelp to avoiding small sample and selection biases. Our goal here is to exam-ine the link between manic-depression and occupation by estimating a tradi-tional economic model of occupational outcomes, namely a mulitnomial logit
4
model of occupational choice. We also investigate whether manic-depressivesare concentrated in more creative occupations.
The general outline of the paper is as follows. We begin with a briefdescription of manic depression and some of the issues related to occupa-tional choice and outcome for those diagnosed as bipolar. We turn next to adiscussion of our data sets, the Epidemiologic Catchment Area (ECA) dataset and the Mental Health Supplement (MHS) of the Mental Health Inter-view Survey, which we employ to provide evidence concerning occupationalchoice and the “creativity” of the occupation based on a measure from theDictionary of Occupational Titles. After discussing our multinomial logitresults, we turn to additional evidence based on nonparametric estimationtechniques and other forms of manic-depressive illness.
2 The Nature of Manic Depression and its
Relation to Creativity
And Something’s odd withinThat person that I wasAnd this One do not feel the sameCould it be Madness this?
Emily Dickinson
The expression of manic-depressive illness varies considerably across indi-viduals and over time for a given individual. There is a spectrum of severityof symptoms, both on the depressive and manic side, and considerable varia-tion in the age of onset, presence and severity of hallucinations and delusions,and the frequency, duration, and pattern of manic, depressive, and normalepisodes. For example, in a recent study, Post et al. (2003) follow the dailycourse of illness for 258 bipolar outpatients for one year. They found thateven with state-of-the-art medications, 26.4 percent spent at least 9 monthsof the yer in a manic or depressive state. An additional 40.7 percent wereepisodically ill, while 32.9 percent of the patients were minimally impairedover the year. This sample probably overstates the severity of illness of the
5

bipolar population since these patients were at ‘treatment centers with arecord of excellence’ which may draw an over-representation of people withparticularly severe or treatment-resistant illness. Those who are function-ing well do not usually seek help, and those wtih manageable symptoms arereadily treated by local psychiatrists.3
The clinical definition of mania may help to clarify the meaning of manicdepression. Because depression characterizes both unipolar and bipolar ill-ness, it is an episode of mania that is indicative of manic depression (orbipolar I disorder). Detailed symptoms of mania are included in the first col-umn of the appendix table, but generally speaking, a manic episode entails“a distinct period of abnormally and persistently elevated, expansive or irri-table mood,” which may alternate with depressive mood. A manic episodeis characterized by at least three of the following symptoms: increased ac-tivity, talkativeness, flight of ideas, inflated self-esteem, decreased need forsleep, distractibility, and excessive involvement in risky activities. Physio-logical evidence of manic phases are illustrated in Figure 1 of brain scansof a patient during manic and depressive phases, which is reproduced fromGoodwin and Jamison (1990).
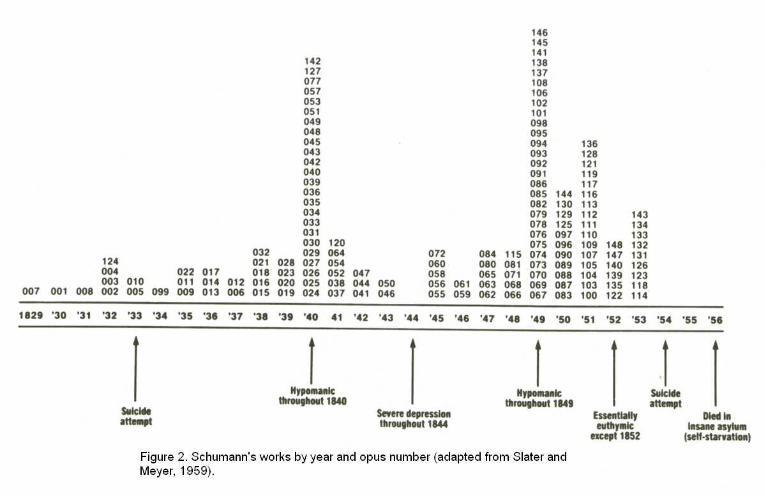
The aforementioned list of symptoms provides some motivation for thelink between the disorder and creativity for example “flight of ideas” evokesimages of poets, writers or musicians in the throes of creativity. The “talka-tiveness” feature enables some manic-depressives to easily and fluently vocal-ize rhymes and formulate word associations, facilitating the writing of poetryand verse (Jamison, 1993). Increased activity and decreased need for sleepmay bolster productivity in a number of occupations. Figure 2 (reproducedfrom Goodwin and Jamison, 1990, p.348) tracks Schumann’s manic and de-pressive phases and compositions by year, suggesting a link between manicepisodes and creative output. On the other hand, many of the symptoms ofmania listed above such as distractibility would typically be associated withreduced effectiveness in virtually any occupation.
3Post el al. argue that daily participation in the project requires motivation and com-
mitment which may counter the selection bias discussed above. It may be however, that
those who are most impaired have the greatest to gain from participation in the study.
6

Because they experience the height and depth of emotion, manic-depressivesmay be able to produce rich and moving poetry, art, and music to a greaterextent than if they were well. Additionally, the disease may drive manic-depressives to use artistic expression to soothe their turmoil. Perhaps cre-ative persons are prone to manic depression due to genetic factors. Unaf-flicted close relatives of bipolars tend to be more creative than the generalpopulation (Jamison, 1993), suggesting that there is a genetic link betweenthe illness and creativity. We do not presume to disentangle these potentialcausal factors here, but attempt to first establish whether or not there is anassociation between manic depression and occupational creativity.
3 Data and Methods
The main dataset we utilize is the Epidemiologic Catchment Area Study(ECA), collected by researchers at Yale University, Johns Hopkins Univer-sity, Washington University, Duke University and University of California atLos Angeles in collaboration with the National Institute of Mental Health(NIMH; U.S. Department of Health and Human Services, 1994). Data wereobtained by personal interviews of 20,861 adults residing in the communitiesof these universities: New Haven, Baltimore, St. Louis, Durham and LosAngeles. Respondents were selected using multistage probability sampling.We use the most recent wave of the survey, Wave II, which was collected in1981-1985.
To determine if an individual meets the criteria for having a particularmental illness, the ECA interviewers elicited responses to the NIMH Diagnos-tic Interview Schedule (DIS). Questions are designed to identify symptomscorresponding to criteria in the Diagnostic and Statistical Manual of MentalDisorders, third edition (DSM-III; American Psychiatric Association, 1980).Appendix Table A.1 compares the DSM-III criteria to the corresponding DISquestions for the diagnosis of mania. Once the DIS responses are entered intoa data file, the DSM-III criteria are operationalized by computer, and diag-noses are generated for mania as well as a number of other mental illnesses.4
4Individuals who have had a manic episode but experienced psychotic symptoms before
or independent of an episode or who have an organic brain disorder are excluded from the
7

We also consider an alternative diagnostic criteria, the 1987 revised ver-sion of the DSM III, abbreviated DSM III-R. In addition to the mania diag-nosis requirements in the DSM III, the DSM III-R includes the criterion ofhospitalization or marked impairment in occupational functioning or usualsocial activities. Excluding those who do not meet this severity criterion,reduces the number of individuals with a DSM III-R manic episode diagno-sis to a total of 55 or 0.35 percent of the sample. For this group the mean(4.54) and median (0.38) values of the occupational creativity variable aregreater than for the general population, but with a higher mean but lowermedian than for the DSM III manic-depressives, see Table 2. The estimatedoccupational segregation index for DSM III-R bipolars relative to the well is18.7 percent, higher than for the bipolars diagnosed under the less restrictiveDSM III criteria.
To supplement the ECA results, we consider information from anotherdata source: the National Health Interview Survey, 1989: Mental HealthSupplement (MHS).5 Rather than using the DSM-III or DSMIII-R criteriato identify bipolar illness in the sample, The MHS identifies manic-depressionby simply asking the respondent in the interview whether or not he or shehas had the disease in the past 12 months. Thus, the reference is in thelast 12 months rather than lifetime as in the ECA data, and the diagnosisis self-reported rather than identified based on identification of symptons asin the ECA. We would expect that those identified as bipolars in the MHSwould typically be more severely impaired than those identified as bipolar inthe ECA study.
mania diagnosis. This reduces the fraction of the sample with a DSM III manic episode
diagnosis to 0.65 or 101 people.5In a preliminary draft of this paper, we also made use of the National Comorbidity
Survey (NCS), 1990-1992 (Kessler, 2002). We are concerned about the NCS mania diag-
nosis (Kessler, 2001), however, and will await the release of the new NCS surveys in July
2004 for future work (Harvard, 2003). Originally, the NCS diagnosis was tied to DSM
III-R but was found to over-diagnose manic depression. The criteria were adjusted and
appear to be free of generating false positives, but now they under-diagnose manic depres-
sion relative to generally accepted rates of prevalence. We understand that improvements
in diagnosis are in place for the upcoming NCS surveys (Kessler, 2001).
8
Both the ECA and MHS samples also contain occupational codes. Table1 lists the percent of employment in each major occupational group by manicepisode status for our two samples and the two forms of bipolar diagnosis inthe ECA sample (DSM-III and DSM-IIR). There is a greater representationof those with a bipolar I diagnosis than the rest of the population employed inthe managerial and professional occupations and services based on the ECAsample data, but not in the MHS data. In both the ECA and MHS samples,bipolars are relatively ‘overrepresented’ in the services. In the MHS databipolars are most highly concentrated in the technical, sales and & clericalcategory. The occupational segregation index (Duncan and Duncan Index ofOccupational Dissimilarity) corresponding to the figures in Table 1 is 13.3,indicating that identical occupation distributions for manic-depressives andthose with no history of mania would arise if 13.3 percent of either groupchanged occupations for bipolar DSM-IIIs in the ECA sample. To put thisfigure in perspective, note that it equals the value of the occupational segrega-tion index for African and white American women in 1995 (Blau et al., 1998).
We do not have a measure of creativity for each individual, but we useoccupation creativity scores from England and Kilbourne (1988) matched toindividuals by 3-digit occupation codes. The occupational creativity mea-sure represents the percentage of employees in a particular occupation whoengage in abstract and creative activities. Examples of abstract and creativeactivities include: painting, hairstyling, writing, music teaching, interpretingpublic opinion surveys in light of contemporary society, creating dramaticstage lighting, planning advertising campaigns, and diagnosing illness (U.S.Department of Labor, 1972).
Table 2 shows that the mean and median values of the occupational cre-ativity index vary substantially by occupation group.6 Managerial and pro-fessional occupations have the highest mean and median creativity level rel-ative to the other occupational groups, and based on the ECA sample, theyemploy an over-representation of those with manic depression. Further, themanagerial and professional occupational group includes all of the 3-digitoccupations classified by Filer (1986) as “artistic.”7 In the services, where
6These indexes are based on the entire ECA sample.7These include actors and directors; authors; dancers; designers working in the theater,
9

manic-depressives are also over-represented, the extent of creativity is lessclear. Taking a more direct approach, we segment the sample by diagnosisstatus and compute the occupational creativity index. For the ECA sample,we find that both the mean and median values of the occupational creativityindex are higher for manic- depressive DSM-IIIs and DSM-IIIRs (means =4.35 and 4.54, medians = 0.46 and 0.38) than by those not so afflicted (mean= 3.07, median = 0.12).8 The results for the MHS data are the reverse, al-though the differences between bipolar and non-bipolar means and mediansare quite small.
We explore two other measures of creativity from the psychology and ca-reer counseling literature: the Holland Artistic (A) Occupational Code (Got-tfredson and Holland, 1996) and the Myers-Briggs Type Indicator (MBTI)intuitive (N) and intuitive-perceptive (NP) scales.9 We merged the Holland
motion pictures, or art museums; musicians and composers; painters, sculptors, craft
artists, and artistic printmakers; photographers; postsecondary teachers of art, drama and
music; and artists, performers and related workers not elsewhere classified.8Bipolar II is a bipolar disorder with more moderate manic episodes than bipolar I
disorder.9According to Gottfredson and Holland (p. 2), the Artistic occupational environment
”requires innovation or creative ability. It rewards the display of imagination in artis-
tic, literary, or musical accomplishments, and allows the expression of unconventional
ideas or manners. Occupations classified as Artistic generally involve creative work in the
arts: music, writing, performance, sculpture, or other relatively unstructured and intellec-
tual endeavors.” The Holland model classifies five additional occupational environments:
Realistic (R, e.g. carpenter or truck operator), Investigative (I, e.g. psychologist or mi-
crobiologist), Social (S, e.g. counselor or clergy member), Enterprising (E, e.g. lawyer
or retail store manager), and Conventional (C, e.g. production editor, bookkeeper). For
seven different occupational coding systems, Gottfredson and Holland assign three of the
six categories, in descending order of importance, to each occupation. For example, the
code for economists is ISA, investigative rated most important, followed by social (which
includes teaching, mentoring and concern for the welfare of others), and then artistic
(likely for the creativity and innovation features). The statistics referred to above apply
10
codes to our ECA sample by 3-digit occupational code, and we used theDSM-III criteria to distinguish manic-depressives from others in the mergedsample. We find that the percent of individuals who are employed in occu-pations with an Artistic component is greater for the bipolar group, 10.71percent, than for the non-bipolar group, 8.40 percent. The small sample ofbipolar individuals, 75 in the non-artistic occupations and only 9 in the artis-tic occupations, limit the weight of this evidence. We turn to an additionalsource on occupational creativity.
In the next section we turn to traditional empirical models used in eco-nomics to analyze occupational choice. Specifically we use multinomial logitestimation of occupational choice to determine if bipolar status results insignificantly different occupational choices than those of the nonbipolar pop-ulation. We then return to analyzing the relationship between manic depres-sion and the occupational creativity index. The large differences betweenthe mean and median values of the index, displayed in Table 2, indicate thatthe distribution is highly skewed. Thus, parametric techniques may not beappropriate, particularly since the distribution is unknown. Consequently,we also use kernel density estimation and nonparametric hypothesis tests toexplore potential differences in the occupational creativity index densities formanic-depressives and for other individuals.
4 Results
4.1 Multinomial Logit Occupation Regressions
In what follows, we estimate a multinomial logit model of the probabilityof employment in each occupational group as a function of bipolar I sta-tus. Control variables in the base model include RACE = 1 if individual i isAfrican-American (= 0 otherwise), FEM = 1 if i is female (= 0 otherwise),MARRIED = 1 if i is presently married (= 0 otherwise), and AGE. Sets ofdummy variables for year of interview and interview site are also included.Although it would be desirable to include education level in the regression,
to all occupations that have an Artistic component (i.e., Axx, xAx, or xxA where x = R,
I, S, E, C).
11

it was not collected at Johns Hopkins or Washington University. For theset of observations from the Yale, Duke, and UCLA communities, the meaneducation level is higher for bipolar I’s than for the rest of the sample (12.97compared to 11.53 years). Because education is likely correlated with occu-pational creativity, omitting it might result in biased parameter estimates.Thus, we report estimates for the Yale-Duke-UCLA sample using education(ED) as a regressor as well as for the full sample excluding the educationregressor.
Multinomial logit parameter estimates on the manic-depression dummyvariable for alternative occupation groups are presented in Table 3a. The ref-erence category is operators, fabricators and laborers. Results show that thecoefficient on the dummy variable for a manic episode is positive and signifi-cant in the service occupation equation, but the dummy parameter does notreach statistical significance for any other occupational group. When educa-tion is included in the logit model and the Johns Hopkins and WashingtonUniversity community observations drop out, however, the mania dummy issignificantly related to the likelihood of employment in the managerial andprofessional category as well as the services category.10
In additional specifications we explore the potential impact of illness du-ration on occupational outcomes. Marcotte et al. (2000, Table 10) estimate asignificant negative relationship between the length of time since first episodeof mania and the probability of employment for women. We employ an ill-ness duration variable (DUR = respondent’s age minus the age of onset formanic-depressives, = 0 otherwise) as an additional regressor in our model.The duration variable is positive and significantly related to the probability
10The increase in the significance level of the parameter estimate on the mania vari-
able discussed above may be due to including an important previously omitted regressor,
education, or it may be due to the omission of the observations from the Johns Hopkins
and Washington University communities. We estimate the logit model for the other three
sites without the education variable and find similar coefficients and t-ratios on the manic
episode variable in the professions (coefficient = 0.87, t-ratio = 2.18) and services (coeffi-
cient = 0.90, t-ratio = 2.16) as when the education variable is included. This is consistent
with Weissman et al. (1991) who find differences in the ECA data across sites.
12

of employment in the professional and managerial occupations, although theparameter estimate on the manic-depression variable becomes negative. Inthe service jobs, neither of the two illness- related parameter estimates issignificant. If education is included in the model, DUR loses significance inthe managerial/professional category. This might indicate a link between theduration of the illness and education level, site differences, or lack of preci-sion due to few numbers of bipolars in the 3-site sample.
We also consider the alternative bipolar diagnostic criterion, DSM III-R.Recall that DSM III-R requires hospitalization or marked impairment in oc-cupational functioning or usual social activities, which reduces the number ofindividuals classified as bipolar to 55. We note that the added restriction mayinduce endogeneity regarding occupational accomplishment. Specifically, ifwe wish to investigate the relationship between manic depression and occupa-tional creativity, and we use occupational impairment as a criterion for manicdepression, we will likely understate occupational creativity for all personsmeeting the DSM III criteria for a manic episode. Nevertheless, we estimatethe model using the DSM III-R diagnosis to identify manic-depressive regres-sor for comparative purposes.
In the multinomial occupation logit model, when the DSM III variableis replaced by the DSM III-R dummy variable for a mania diagnosis, co-efficient estimates are not significant for any occupational group for thefull sample (see Table 3a). Adding education as a regressor and using theYale/Duke/UCLA sample, manic-depressives are significantly more likely tobe in managerial and professional jobs or in service jobs if one is willing to ac-cept a 10 percent significance level. The occupational impairment rule in theDSM III-R diagnostic criteria has identified manic-depressives with lower cen-tral measures of occupational creativity, a greater degree of occupational seg-regation relative to the well, and weaker evidence linking the presence of thedisease to managerial/professional occupations than the manic-depressivesidentified under the DSM III rules. Nevertheless, even with the potentialbias this new screen may impose, there appears to be some evidence of a linkbetween occupational outcomes, creativity, and manic depression.
We also estimated the logit model using the ECA sample; recall that inthis data set bipolars are self-identified based on their preception of manicepisodes in the 12 months prior to the interview. We would expect this de-
13

finition to identify only those with fairly extreme symptoms. The resultsfor the logit model estimation are displayed in Table 3b and suggest thatthe patterns of occupational choice for the bipolars in this sample are notsignificantly different from those not so identified.
Next we turn to some additional evidence based on nonparametric testsand estimation.
4.2 Additional Evidence
In the previous section we reported results concerning occupational choiceof those with bipolar disorder relative to those without this disorder. Theseresults provide some evidence that bipolars select into occupations whichhave relatively high occupational creativity indexes discussed in section 2.In this section we provide additional empirical evidence relating to the oc-coupational creativity indexes and bipolar illness. We begin with our effortsto statistically test for differences in occupational creativity in the bipolarand nonbipolar samples.
4.2.1 Nonparametric Tests
We would like to test whether the differences in occupational creativity wenoted in section 2 are statistically significant. This is not straightforward,however, since the density of the occupational creativity index is unknownand the empirical density is highly skewed, thus traditional T-tests are notappropriate to test for significant differences in location parameters. Con-sequently, we turn to nonparametric tests and estimation techniques to ad-dress these issues. We begin by conducting nonparametric tests for a differ-ence in the median of the occupational creativity index for DSM III manic-depressives and for the well in the ECA sample and find that the differencein medians is marginally significant (Fisher’s exact p-value = 0.080 and p-value for the Pearson χ2 = 0.076). Next we conduct a Wilcoxon rank-sum(Mann-Whitney) test and obtain an insignificant test statistic (p-value =0.217). Using a Kolmogorov-Smirnov test for the equality of distributionsresults in a corrected p-value of 0.103. For the MHS data (where bipolar ill-ness is self-reported), the median, Wilcoxon and Kolmogorov-Smirnov testsindicate no significant difference in the occupational creativity index for the
14

two groups. Overall, the evidence of significant differences in occupationalcreativity densities by manic history status from these nonparametric testsis weak, suggesting the need for further empirical evidence.
Next we constructed nonparametric kernel densities for the occupationalcreativity index for the normal and manic-depressive groups. We used theEpanechnikov kernel and the “optimal” bandwidth,11 which minimizes themean integrated square error. The densities indicate that many individualsare in occupations which do not involve creative tasks in both the normal andmanic-depressive groups. It is difficult to distinguish between the two densi-ties, with the exception of considerably higher values of the density near zerofor the group without manic depression using the ECA data. The “optimal”bandwidth, however, tends to over smooth highly skewed densities (Silver-man, 1986), which may be masking differences in the densities. Alternativebandwidth strategies may help address this problem, however, at this pointwe turn to our alternative data.
Recall that the MHS identifies manic-depression by simply asking the re-spondent in the interview whether or not he or she has had the disease in thepast 12 months. Again we estimated kernel densities for manic depressivesand those without manic depression in the MHS. The densities are similarto those for the ECA although the spike at zero (i.e., lowerst occupationalcreativity) appears higher for manic-depressives and lower for others, whichis the reverse of what we observed with the ECA data. This may be dueto the difference in the time period specified for the illness, the previous 12months in the MHS versus lifetime in the ECA, or the different approach todetermining manic- depressive status, self reported versus computer gener-ated in the ECA.
Drugs, prescribed or unprescribed, as well as alcohol, can temper or ex-acerbate the peaks and valleys of manic depression. The ECA survey didnot enquire about medication for all of the bipolars in the sample, but theMHS did ask whether or not the person was receiving medication for manicdepression.
11We used N c©software by Jeff Racine for these estimates.
15

4.2.2 Other Forms of Manic-Depressive Illness
Bipolar II disorder and cyclothymia are also manic-depressive illnesses butwith milder, non-psychotic manic periods termed hypomania. Bipolar IIdisorder occurs when an individual experiences periods of depression and hy-pomania, and cyclothymia is characterized by only mild depression and hy-pomania. Thus we might expect these milder forms of bipolar illness to moreclosely mimic the non-bipolar population in terms of occupational choice andoccupational creativity. Previous evidence is, however, mixed. Berndt et al.(1998) find poorer labor market outcomes of unipolar depressives, suggest-ing that bipolar II’s (with as serious depression as bipolar I’s but mildermanic periods) may also have adverse effects. On the other hand, the psy-chiatric literature indicates that (unipolar) depression is also associated withcreativity.
5 Conclusion
Earlier work investigating links between occupational creativity and bipolarillness (manic-depression) is largely based on psychiatric case studies or verysmall samples. Here we use population based data sets and traditional econo-metric framework—multinomial logit—to analyze occupational outcomes forbipolar and the general population. We find some evidence that manic-depressives are concentrated in service occupations as well as in managerialand professional occupations. We match the occupations to a measure of oc-cupational creativity from the Dictionary of Occupational Titles. The man-agerial and professional occupations which include artists, musicians, andauthors, are the most creative occupational category based on this index.We also find significantly higher median occupational creativity and edu-cation levels for manic-depressives than for the general population. Theseresults imply that employers may benefit by hiring, keeping, and facilitatingthe productive and creative capacity of workers with manic-depressive illness.
16
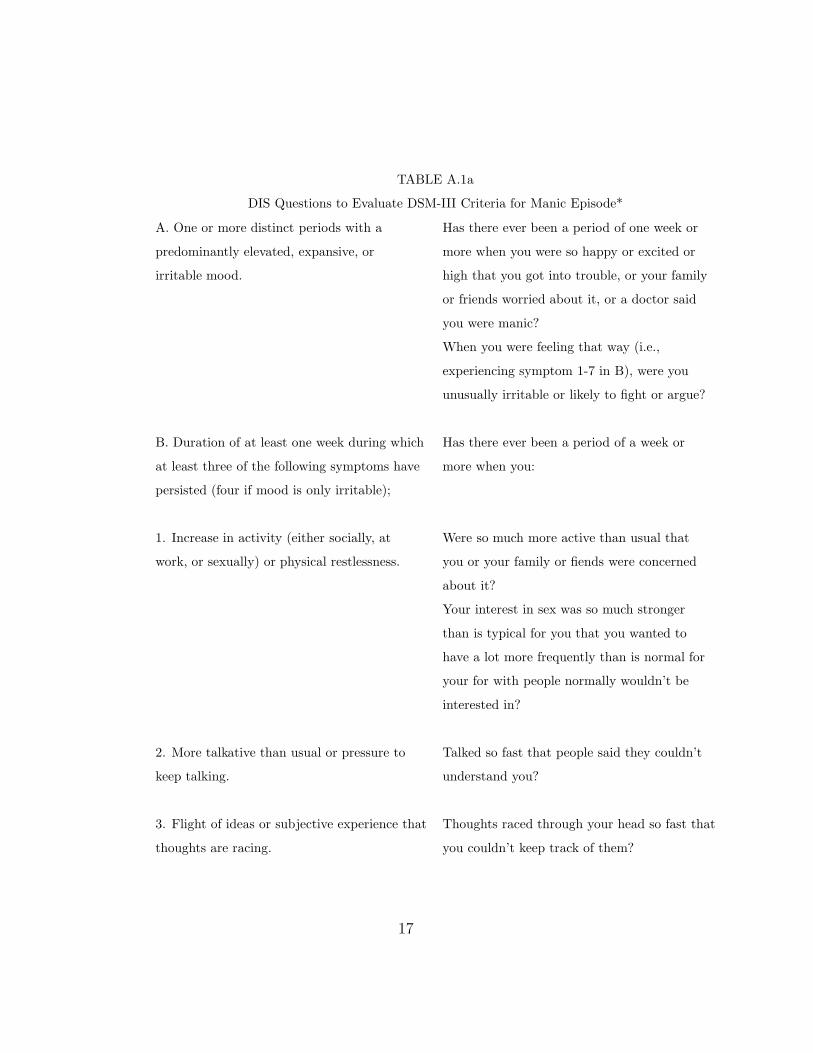
TABLE A.1a
DIS Questions to Evaluate DSM-III Criteria for Manic Episode*
A. One or more distinct periods with a Has there ever been a period of one week or
predominantly elevated, expansive, or more when you were so happy or excited or
irritable mood. high that you got into trouble, or your family
or friends worried about it, or a doctor said
you were manic?
When you were feeling that way (i.e.,
experiencing symptom 1-7 in B), were you
unusually irritable or likely to fight or argue?
B. Duration of at least one week during which Has there ever been a period of a week or
at least three of the following symptoms have more when you:
persisted (four if mood is only irritable);
1. Increase in activity (either socially, at Were so much more active than usual that
work, or sexually) or physical restlessness. you or your family or fiends were concerned
about it?
Your interest in sex was so much stronger
than is typical for you that you wanted to
have a lot more frequently than is normal for
your for with people normally wouldn’t be
interested in?
2. More talkative than usual or pressure to Talked so fast that people said they couldn’t
keep talking. understand you?
3. Flight of ideas or subjective experience that Thoughts raced through your head so fast that
thoughts are racing. you couldn’t keep track of them?
17

TABLE A.1b
DIS Questions to Evaluate DSM-III Criteria for Manic Episode*
4. Inflated self-esteem Felt that you had a special gift or special
powers to do things others couldn’t do or that
you were a specially important person?
5. Decreased need for sleep Hardly slept at all but still didn’t feel tired or
sleepy?
6. Distractibility, i.e., attention is too easily Easily distracted so that any little interruption
drawn to unimportant irrelevant external could get you off the track?
stimuli
7. Excessive involvement in activities that Went on a spending spree-spending so much
have a high potential for painful money that it caused you or your family some
consequences which is not recognized. financial trouble?
* Reproduced from Weissman et al. (1991)
18

References
1. American Psychiatric Association, Diagnostic and Statistical Manual of Mental
Disorders, Third Edition and Third Edition-Revised, Washington, D.C.: The As-
sociation, 1980 and 198
2. Bartel, Ann and Paul Taubman, “Some Economic and Demographic Consequences
of Mental Illness,” Journal of Labor Economics 4(2), April 1986: 243-56.
3. Berndt, Ernst, S.N. Finkelstein, P.E. Greenberg, et al., “Workplace Performance
Effects from Chronic Depression and its Treatment,” Journal of Health Economics
17:511-535.
4. Blau, Francine D., Marianne A. Ferber and Anne E. Winkler, The Economics of
Women, Men, and Work, Third Edition, Upper Saddle River, NJ: Prentice Hall,
1998.
5. Dickinson, Emily, “The First Day’s Night Had Come,” poem 410, The Poems of
Emily Dickinson, Thomas H. Johnson (ed.), Cambridge: Harvard University Press,
1955.
6. England, Paula and Barbara Kilbourne, Occupational Measures from the Dictio-
nary of Occupational Titles for 1980 Census Detailed Occupations [computer file],
Ann Arbor, MI: Inter-university Consortium for Political and Social Research [dis-
tributor], 1988.
7. Ettner, Susan L., Richard G. Frank, and Ronald C. Kessler, “The Impact of Psy-
chiatric Disorders on Labor Market Outcomes,” Industrial and Labor Relations
Review 51(1), October 1997: 64-81.
8. Filer, Randall K., “The ’Starving Artist’– Myth or Reality? Earnings of Artists in
the United States,” Journal of Political Economy 94(1), 1986.
9. Frank, Richard and Paul Gertler, “An Assessment of Measurement Error Bias for
Estimating the Effect of Mental Distress on Income,” Journal of Human Resources
26(1), Winter 1991: 154-64.
19
10. Frank, Richard and T. McGuire, “Economics and Mental Health,” Handbook of
Health Economics Vol. 1B, Culyer, A.J. and J.P. Newhouse (eds.), Elsevier, 2000.
11. Goodwin, Frederick K. and Kay Redfield Jamison, Manic-Depressive Illness, New
York: Oxford University Press, 1990.
12. Hamilton, Vivian H., Philip Merrigan, and Eric Dufresne, “Down and Out: Es-
timating the Relationship Between Mental Health and Unemployment,” Health
Economics 6, 1997: 397-406.
13. Jamison, Kay Redfield, Touched with Fire: Manic-Depressive Illness and the Artis-
tic Temperament, New York: Simon and Schuster, 1993.
14. Marcotte, Dave E., Virginia Wilcox-Gk, and D. Patrick Redmon, “The Labor Mar-
ket Effects of Mental Illness: The Case of Affective Disorders,” Sorkin, Alan (ed.),
Research in Human Capital and Development, Volume 13, Stamford, Conn.: JAI
Press Inc., 2000.
15. Miller, Leonard S. and Sander Kelman, “Estimates of the Loss of Individual Pro-
ductivity from Alcohol and Drug Abuse and from Mental Illness,” Frank, Richard
G. and Willard G. Manning, Jr. (eds.), Economics and Mental Health, Baltimore:
Johns Hopkins University Press, 1992.
16. Mullahy, John and Jody L. Sindelar, “Alcoholism, Work, and Income,” Journal of
Labor Economics 11(3), July 1993: 494-520.
17. N Version 3.141 Beta (C) J. Racine 1989-2003.
18. Ownby, Raymond L. and Paul J. Goodnick, “Lithium,” Paul J. Goodnick (ed.), Ma-
nia: Clinical and Research Perspectives, Washington, D.C.: American Psychiatric
Press, Inc., 1998.
19. Pagan, Adrian and Aman Ullah, Nonparametric Econometrics, New York: Cam-
bridge University Press, 1999.
20. Plato, Phaedrus and the Seventh and Eighth Letters, trans. Walter Hamilton,
Middlesex, England: Penguin, 1974: 48.
20

21. Silverman, B.W., Density Estimation for Statistics and Data Analysis, New York:
Chapman and Hall, 1986.
22. U.S. Department of Health and Human Services, National Institute of Mental
Health, Epidemiologic Catchment Area Study, 1980-1985 [computer file], Rockville,
MD: NIMH [producer], 1992. Ann Arbor, MI: Inter-university Consortium for Po-
litical and Social Research [distributor], 1994.
23. U.S. Department of Labor, Manpower Administration, Handbook for Analyzing
Jobs, 1972.
24. Weissman, Myrna M., Martha Livingston Bruce, Philip J. Leaf, et al., “Affective
Disorders,” Robins, Lee N. and Darrel A. Regier (eds.), Psychiatric Disorders in
America, New York: Free Press, 1991.
21

Table 1
Occupational Distributions by Manic Episode Status
ECA DATAa MHS DATAb
Occupation No Manic Manic Manic No Manic Manic
Episode Episode Episode Episode Episode
(III) (III-R)
Managerial & 20.59 27.38 30.43 27.94 16.87
Professional
Technical, Sales 29.54 26.19 21.74 31.21 42.17
& Clerical
Services 17.27 23.81 26.09 13.00 14.46
Crafts 10.86 7.14 4.35 12.18 6.02
Operators, 21.73 15.48 17.39 15.67 20.48
Fabricators &
Laborers
Total 100 100 100 100 100aECA data: DSM III: Prior episode defined over lifetime.
ECA data: DSM III-R: same as DSM-III, but must also have been
hospitalized or ‘markedly occupationally impaired’.bMHS: Prior episode self-reported over last 12 months.
22

Table 2
Occupational Creativity Index
Mean Median
Creativity Creativity
By Occupation:
Managerial & 10.14 2.00
Professional
Technical, Sales 0.95 0.17
& Clerical
Services 3.47 0.05
Crafts 0.66 0.05
Operators,
Fabricators & 0.45 0.02
Laborers
By Diagnosis:
ECA Data
bipolar (DSM III) 4.35 0.46
bipolar (DSM III-R) 4.54 0.38
bipolar II 2.08 0.13
nonbipolar 3.07 0.12
MHS Data
bipolar 3.48 0.11
nonbipolar 4.13 0.21
23
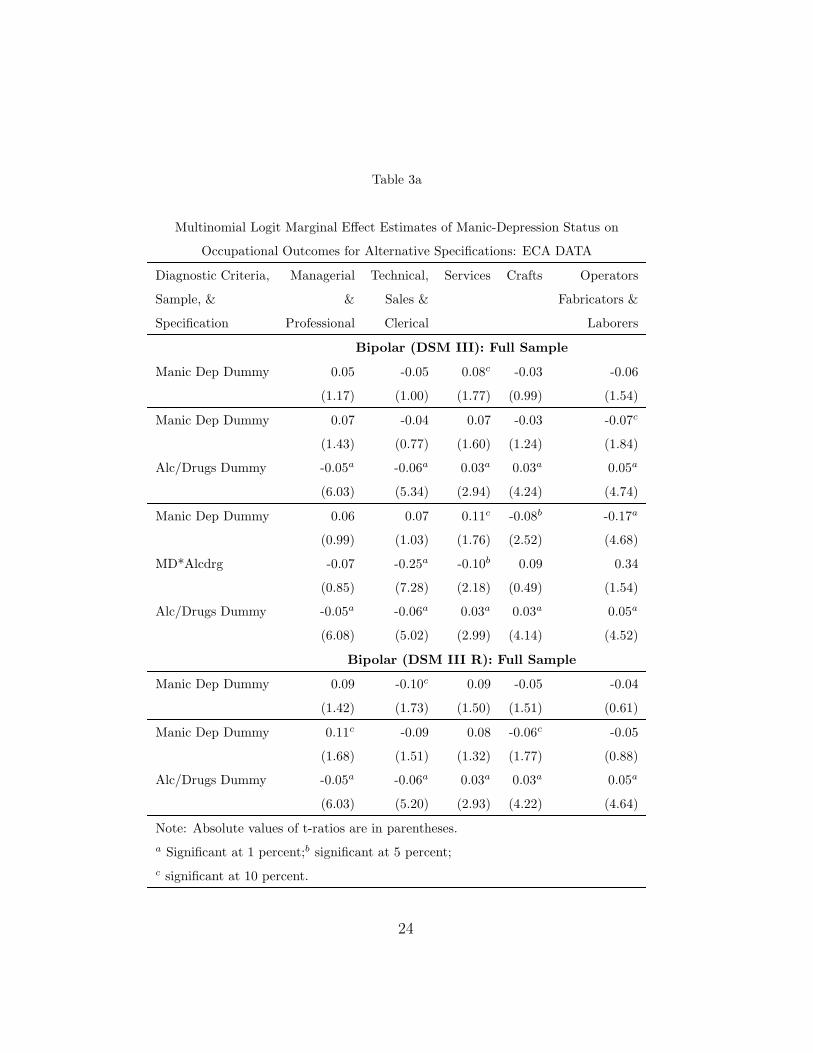
Table 3a
Multinomial Logit Marginal Effect Estimates of Manic-Depression Status on
Occupational Outcomes for Alternative Specifications: ECA DATA
Diagnostic Criteria, Managerial Technical, Services Crafts Operators
Sample, & & Sales & Fabricators &
Specification Professional Clerical Laborers
Bipolar (DSM III): Full Sample
Manic Dep Dummy 0.05 -0.05 0.08c -0.03 -0.06
(1.17) (1.00) (1.77) (0.99) (1.54)
Manic Dep Dummy 0.07 -0.04 0.07 -0.03 -0.07c
(1.43) (0.77) (1.60) (1.24) (1.84)
Alc/Drugs Dummy -0.05a -0.06a 0.03a 0.03a 0.05a
(6.03) (5.34) (2.94) (4.24) (4.74)
Manic Dep Dummy 0.06 0.07 0.11c -0.08b -0.17a
(0.99) (1.03) (1.76) (2.52) (4.68)
MD*Alcdrg -0.07 -0.25a -0.10b 0.09 0.34
(0.85) (7.28) (2.18) (0.49) (1.54)
Alc/Drugs Dummy -0.05a -0.06a 0.03a 0.03a 0.05a
(6.08) (5.02) (2.99) (4.14) (4.52)
Bipolar (DSM III R): Full Sample
Manic Dep Dummy 0.09 -0.10c 0.09 -0.05 -0.04
(1.42) (1.73) (1.50) (1.51) (0.61)
Manic Dep Dummy 0.11c -0.09 0.08 -0.06c -0.05
(1.68) (1.51) (1.32) (1.77) (0.88)
Alc/Drugs Dummy -0.05a -0.06a 0.03a 0.03a 0.05a
(6.03) (5.20) (2.93) (4.22) (4.64)
Note: Absolute values of t-ratios are in parentheses.a Significant at 1 percent;b significant at 5 percent;c significant at 10 percent.
24

Table 3b
Multinomial Logit Marginal Effect Estimates of Manic-Depression Status on
Occupational Outcomes for Alternative Specifications: ECA DATA
Diagnostic Criteria, Managerial Technical, Services Crafts Operators
Sample, & & Sales & Fabricators &
Specification Professional Clerical Laborers
Bipolar (DSM III): Yale/UCLA/WASHU
Manic Dep Dummy 0.07 -0.02 0.07 00.03 -0.08b
(1.53) (0.49) (1.50) (0.91) (2.11)
Manic Dep Dummy 0.07 -0.02 0.06 -0.03 -0.08b
(1.57) (0.34) (1.41) (0.98) (2.21)
Alc/Drugs Dummy -0.01 -0.04a 0.02 0.01 0.02
(0.68) (2.71) (1.49) (1.27) (1.33)
Manic Dep Dummy 0.06 0.10 0.11c -0.08b -0.19a
(0.96) (1.40) (1.79) (2.32) (6.72)
MD*Alcdrgs -0.07 -0.25a -0.11a 0.03 0.41c
(0.86) (8.59) (3.60) (0.20) (1.83)
Alc/Drugs Dummy -0.01 -0.03b 0.02 0.01 0.01
(0.77 (2.35) (1.57) (1.16) (1.04)
Bipolar (DSM III R): Yale/UCLA/WASHU
Manic Dep Dummy 0.12c -0.08 0.11 -0.07b -0.07
(1.95) (1.28) (1.63) (2.12) (1.27)
Manic Dep Dummy 0.12b -0.08 0.11 -0.07b -0.07
(1.99) (1.13) (1.54) (2.23) (1.34)
Alc/Drugs Dummy -0.01 -0.04b 0.02 0.01 0.01
(0.71) (2.53) (1.50) (1.23) (1.18)
Note: Absolute values of t-ratios are in parentheses.a Significant at 1 percent;b significant at 5 percent;c significant at 10 percent.
25
Table 3c
Multinomial Logit Marginal Effect Estimates of Manic-Depression Status on
Occupational Outcomes for Alternative Specifications: MHS DATA
Diagnostic Criteria, Managerial Technical, Services Crafts Operators,
Sample, & & Sales & Fabricators, &
Specification Professional Clerical Laborers
Full Sample: All Manic
Manic Dep Dummy -0.07 0.09c -.0004 -0.05c 0.03
(1.64) (1.75) (0.01) (1.88) (0.85)
Manic Dep Dummy -0.10 0.08 -0.04 -0.09a 0.15b
(1.59) (1.00) (0.82) (2.64) (2.09)
unmed 0.03 -0.04 0.03 0.09 -0.11a
(0.27) (0.46) (0.38) (0.63) (4.03)
Note: Absolute value of t is in parentheses.a Significant at 1 percent;b significant at 5 percent;c significant at 10 percent.
26