brainard (2002) display characterization - wexler.free.frwexler.free.fr/library/files/brainard...
TRANSCRIPT
172 DISPLAY CHARACTERIZATION
26. M. Ramkumar and A. N. Akansu, IEEE 2nd WorkshopMultimedia Signal Process. Dec. 1998, pp. 267–272.
27. M. Ramkumar and A. N. Akansu, SPIE Multimedia Syst.Appl. 3528, 482–492 (1998).
28. S. D. Servetto, C. I. Podilchuk, and K. Ramachandran, IEEEInt. Conf. Image Process. 1, 445–448 (1998).
29. A. Cohen and A. Lapidoth, Proc. Int. Symp. Inf. Theory, June2000, p. 48.
30. P. Jessop, Int. Conf. Acoust. Speech Signal Process., 80,2,077–2,080.
31. F. Mintzer and G. W. Braudaway, Int. Conf. Acoust. SpeechSignal Process. 80, 2,067–2,070.
32. M. Holliman, N. Memon, and M. M. Yeung, SPIE Securityand Watermarking of Multimedia Contents, Jan. 1999,pp. 134–146.
33. F. Hartung, J. K. Su, and B. Girod, SPIE Security andWatermarking of Multimedia Contents, 1999, pp. 147–158.
34. J. Dittmann et al., SPIE Security and Watermarking ofMultimedia Contents, 1999, pp. 171–182.
35. J. Fridrich and M. Goljan, SPIE Security and Watermarkingof Multimedia Contents, 1999, pp. 214–225.
36. M. Kutter and F. A. P. Petitcolas, SPIE Security and Water-marking of Multimedia Contents, 1999, pp. 226–239.
37. Special Issue, Proc. IEEE 87(7) (1999).38. W. Zhu, Z. Xiong, and Y. Q. Zhang, IEEE Trans. Circuits Syst.
Video Technol. 9(4), 545–550 (1999).39. Proc. Int. Workshop Inf. Hiding.40. Special Issue, IEEE J. Selected Areas Commun. (May 1998).41. M. D. Swanson, M. Kobayashi, and A. H. Tewfik, Proc. IEEE
86(6), 1,064–1,087 (1998).42. G. C. Langelaar et al., IEEE Signal Process. Mag. 17(5),
20–46 (2000).43. C. Podilchuk and E. Delp, IEEE Signal Process Mag. 18(4),
33–46 (2001).
DISPLAY CHARACTERIZATION
DAVID H. BRAINARD
University of PennsylvaniaPhiladelphia, PA
DENIS G. PELLI
New York UniversityNew York, NY
TOM ROBSON
Cambridge ResearchSystems, Ltd.Rochester, Kent, UK
INTRODUCTION
This article describes the characterization and use ofcomputer-controlled displays.1 Most imaging devices are
1 The display literature often distinguishes between calibrationand characterization (e.g. 1–3), calibration refers to the process ofadjusting a device to a desired configuration, and characterizationrefers to modeling the device and measuring its properties to allowaccurate rendering. We adopt this nomenclature here.
now computer controlled, and this makes it possible for thecomputer to take into account the properties of the imagingdevice to achieve the intended image. We emphasize CRT(cathode ray tube) monitors and begin with the standardmodel of CRT imaging. We then show how this modelmay be used to render the desired visual image accuratelyfrom its numerical representation. We discuss the domainof validity of the standard CRT model. The model makesseveral assumptions about monitor performance that areusually valid but can fail for certain images and CRTs.We explain how to detect such failures and how to copewith them.
Here we address primarily users who will be doingaccurate imaging on a CRT. Inexpensive color CRTmonitors can provide spatial and temporal resolutionsof at least 1024 × 768 pixels and 85 Hz, and the emittedintensity is almost perfectly independent of viewing angle.CRTs are very well suited for accurate rendering. Ourtreatment of LCDs (liquid crystal displays) is brief, inpart because this technology is changing very rapidly andin part because the strong dependence of emitted light onviewing angle in current LCD displays is a great obstacle toaccurate rendering. Plasma displays seem more promisingin this regard.
We present all the steps of a basic characterizationthat will suffice for most readers and cite the literaturefor the fancier wrinkles that some readers may need,so that all readers may render their images accurately.The treatment emphasizes accuracy both in color and inspace. Our standard of accuracy is visual equivalence:substituting the desired for the actual stimulus would notaffect the observer.2 We review the display characteristicsthat need to be taken into account to present an arbitraryspatiotemporal image accurately, that is, luminance andchromaticity as a function of space and time. We also treata number of topics of interest to the vision scientist whorequires precise control of a displayed stimulus.
The International Color Consortium (ICC, http://www.color.org/) has published a standard file format (4) forstoring ‘‘profile’’ information about any imaging device.3 Itis becoming routine to use such profiles to achieve accurateimaging (e.g. by using the popular Photoshop program).4
The widespread support for profiles allows most users toachieve characterization and correction without needing tounderstand the underlying characteristics of the imagingdevice. ICC monitor profiles use the standard CRT modelpresented in this article. For applications where thestandard CRT model and instrumentation designed for themass market are sufficiently accurate, users can simplybuy a characterization package consisting of a program
2 The International Color Consortium (4) calls this ‘‘absolutecolorimetric’’ rendering intent, which they distinguish from theirdefault ‘‘perceptual’’ rendering intent. Their ‘‘perceptual’’ intentspecifies that ‘‘the full gamut of the image is compressed orexpanded to fill the gamut of the destination device. Gray balanceis preserved but colorimetric accuracy might not be preserved.’’3 On Apple computers, ICC profiles are called ‘‘ColorSync’’ profilesbecause the ICC standard was based on ColorSync. Free C sourcecode is available to read and write ICC profiles (5,6).4 Photoshop is a trademark of Adobe Systems Inc.

DISPLAY CHARACTERIZATION 173
and a simple colorimeter that automatically produces ICCprofiles for their monitors.5 The ICC-required data in amonitor profile are just enough6 to specify the standardCRT model, as presented here. The ICC standard alsoallows extra data to be included in the profile, makingit possible to specify extended versions of the standardCRT model and other relevant aspects of the monitor (e.g.,modulation transfer function and geometry).
This article explains the standard CRT model (and nec-essary basic colorimetry) and describes simple visual tests(available online at http://psychtoolbox.org/tips/display-test.html) that establish the model’s validity for your mon-itor. Then, we show how to use the standard model tocharacterize your display for accurate rendering. Finally,the Discussion briefly presents several more advancedtopics, including characterization of non-CRT displays.7
CRT MONITOR BASICS
We begin with a few basic ideas about the way CRTmonitors produce light and computers control displays.The light emitted from each location on a monitor isproduced when an electron beam excites a phosphorcoating at the front of the monitor. The electron beamscans the monitor faceplate rapidly in a raster pattern(left to right, top to bottom), and the intensity of thebeam is modulated during the scan so that the amountof light varies with the spatial position on the faceplate.It is helpful to think of the screen faceplate as beingdivided up into contiguous discrete pixels. The videovoltage controlling the beam intensity is usually generatedby a graphics card, which emits a new voltage on everytick of its pixel clock (e.g., 100 MHz). The duration of eachvoltage sample (e.g., 10 ns) determines the pixel’s width(e.g., 0.3 mm). Each pixel is a small fraction of a rasterline painted on the phosphor as the beam sweeps fromleft to right. The pixel height is the spacing of rasterlines. Most monitors today are ‘‘multisync,’’ allowing theparameters of the raster (pixels per line, lines per frame,and frames per second) to be determined by the graphicscard. Color monitors contain three interleaved phosphortypes (red, green, and blue) periodically arranged as dotsor stripes across the face of the monitor. There are threeelectron beams and a shadow mask arranged so that eachbeam illuminates only one of the three phosphor types.
5 Vendors of such packages include Monaco (http://www.monaco-sys.com/) and ColorBlind (http://www.color.com/).6 Actually, as noted by Gill (7), it is . . . ‘‘a pity that the mediablack point is not a mandatory part of the profile in the same way[that] the media white point is, since the lack of the black pointmakes absolute colorimetric profile interpretation inaccurate’’.Thus, before purchasing monitor characterization software, oneshould consider whether the software will include the optionalmedia black point tag in the monitor profiles it produces. Wehave not found a precise definition of the term ‘‘media blackpoint’’ in the ICC documentation, but we infer that it refers to aspecification of the ambient light A(λ) defined in Eq. (1) below.7 More detailed treatments of CRTs (e.g., 2,8–11; see 12),colorimetry (e.g., 13–15), and use of ICC profiles (3) may befound elsewhere.
The phosphor interleaving is generally much finer than apixel, so that the fine red-green-blue dots or stripes arenot resolved by the observer at typical viewing distances.We will not discuss it here, but for some applications, forexample, rendering text, it is useful to take into accountthe tiny displacements of the red, green, and blue subpixelcomponents (16,17).
The stimulus for color is light. The light from each pixelmay be thought of as a mixture of the light emitted by thered, green, and blue phosphors. Denote the spectrum of thelight emitted from a single monitor pixel by C(λ). Then,
C(λ) = rR(λ) + gG(λ) + bB(λ) + A(λ), (1)
where λ represents wavelength, R(λ), G(λ), and B(λ) arethe spectra of light emitted by each of the monitor’sphosphors when they are maximally excited by the electronbeam, r, g, and b are real numbers in the range [0, 1], andA(λ) is the ambient (or ‘‘flare’’) light emitted (or reflected)by the monitor when the video voltage input to the monitoris zero for each phosphor. We refer to the values r, g, andb as the phosphor light intensities.8
Later, we discuss the kind of equipment one can use tomeasure light, but bear in mind that the characterizationof a display should be based on the same light asthe observer will see. Thus the light sensor shouldgenerally be in approximately the same position as theobserver’s eye. Happily, the luminance of CRTs is almostperfectly independent of viewing angle (i.e., it is nearly alambertian light source), allowing characterization fromone viewing point to apply to a wide range. (LCDs lackthis desirable property. From a fixed head position, youcan see variations in hue across a flat panel caused by thedifferent viewing angles of the nearer and farther parts.This is a serious obstacle to characterization of LCDsfor accurate rendering unless the viewpoint can be fixed.Plasma displays are much better in this regard.)
Note that Eq. (1) depends on the assumption of channelconstancy: to a very good approximation, the relativespectrum of light emitted by each (R, G, or B) monitorchannel is independent of the degree to which it isexcited.9 To simplify the main development below, weassume that A(λ) = 0. Correcting for nonzero ambient is
8 Spectrally, Eq. (1) says that the light is a linear combinationof contributions from the three phosphors. Similarly, spatially,the light measured at a particular pixel location is a linearcombination of contributions from several pixels. The weightingof the contributions is the point-spread function. The pointspread may be neglected while characterizing the display’s colorproperties if you use a uniform test patch that is much bigger thanthe point spread. Thus, Eq. (1) does not take into account blurintroduced by the optics of the electron beam and the finite sizeof the phosphor dots: the intensities r, g, and b describe the totallight intensity emitted at a pixel but not how this light is spreadspatially. Treatment of the point-spread function is provided inthe Discussion (see Modulation Transfer Function).9 Strictly speaking, Eq. (1) only requires phosphor constancy, theassumption that the relative spectrum of light emitted by each ofthe CRT’s phosphors is invariant. It is possible for phosphorconstancy to hold and channel constancy to be violated, forexample, when the degree to which electrons intended for one

174 DISPLAY CHARACTERIZATION
Figure 1. Schematic of graphics card and CRT monitor. The figure illustrates the video chainfrom digital pixel value to emitted light. As mentioned in the text and illustrated in Fig. 2, mostgraphics cards can run either in 24-bit mode, in which mred, mgreen, and mblue are independent,or in 8-bit mode, in which mred = mgreen = mblue. The digital video output of each lookup table is8 bits in most commercial graphics cards, but a few cards have more than 8 bits to achieve finersteps at the digital-to-analog converter (DAC) output. See color insert.
both straightforward and recommended, as explained inthe Discussion.
Figure 1 shows how a pixel is processed. The graphicscard generates the video voltages based on values storedin the onboard memory. Typically, user software canwrite digital values into two components of graphics cardmemory: a frame buffer and a color lookup table. The toppanel of Fig. 2 illustrates the operation of the frame bufferand lookup table for what is referred to as ‘‘true color’’or 24-bit (‘‘millions of colors’’) mode.10 Three 8-bit bytesin the frame buffer are allocated for each monitor pixel.As shown in the figure, this memory can be thought ofas three image planes, each arranged in a spatial gridcorresponding to the layout of the monitor pixels. Theseare labeled Red, Green, and Blue in the figure. Each imageplane controls the light emitted by one monitor phosphor.Consider a single pixel. The 8-bit (256 level) value mred
in the Red image plane is used as an index to the redlookup table Fred(). This table has 256 entries, and eachentry specifies the digital video value R used to generatethe video voltage vred that goes to the monitor to controlthe intensity of the electron beam as it excites the redphosphor at the pixel of interest. Similar indirection isused to obtain the digital video values G and B for the
phosphor dot excite another varies with digital video value(see, e.g., 1; also 18,19). For the presentation here, it is moreconvenient not to distinguish explicitly between phosphor andchannel constancy.10 This mode is also sometimes referred to as 32-bit mode: the 24bits of data per pixel are usually stored in 32-bit words becausethis alignment provides faster memory access on most computers.
green and blue phosphors:
R = Fred(mred),
G = Fgreen(mgreen),
B = Fblue(mblue). (2)
In most graphics cards sold today, R, G, and B are 8-bitnumbers driving 8-bit digital-to-analog converters (DACs).This is very coarse compared to the 12- to 14-bit analog-to-digital converters used in practically all image scannerssold today. It is odd that the digital imaging industry doesnot allow us to display with the same fidelity as we capture.However, some graphics cards for demanding applicationssuch as radiology and vision science, do provide higherprecision more-than-8-bit DACs, using the lookup table Fto transform the 8-bit values of mred, mgreen, and mblue intovalues of R, G, and B selected from a palette of more finelyquantized numbers.
The numbers R, G, and B drive the graphic card’sdigital-to-analog converters, which produce video voltagesproportional to the numbers, except for small errors in thedigital-to-analog conversion:
vred = R + ered(R, R′),
vgreen = G + egreen(G, G′),
vblue = B + eblue(B, B′), (3)
where v represents voltage on a dimensionless scaleproportional to the actual voltage, e is the error, and R′, G′,and B′ are the values of R, G, and B for the immediatelypreceding pixel in the raster scan. The error e has astatic and a dynamic component. The static error depends

DISPLAY CHARACTERIZATION 175
0 2 4
Frame buffer
Lookuptables
Frame buffer
Color lookuptable
5
R
17 240 117
G B
Red
Red Green
Green
Blue
Blue
17
240
117
Figure 2. Graphics card operation. Top panel: 24-bit mode. The frame buffer may be thoughtof as three separate planes, one each for the red, green, and blue channels. Each plane allowsspecification of an 8-bit number (0–255) for each image location. In the figure, values for the pixelat x = 4, y = 3 are shown: these are 0 for the red plane, 2 for the green plane, and 4 for the blueplane. For each plane, the frame buffer value is used as an index to a lookup table. A frame buffervalue of 0 indexes the first entry of the lookup table, and a frame buffer value of 255 indexes thelast entry. Thus the configuration shown in the figure causes digital RGB values (17, 240, 117) tobe sent to the DACs for the pixel at x = 4, y = 3 Bottom panel: 8-bit mode. The frame buffer is asingle image plane, allowing specification of a single 8-bit number for each image location. Thisnumber is used to index to a color lookup table that provides the RGB values to be sent to theDACs. The 8-bit configuration shown in the bottom panel displays the same color for the pixel atx = 4, y = 3 as the 24-bit configuration shown in the top panel.
only on the current number and is sometimes specifiedby the manufacturer. It is generally less than one-halfof the smallest step, that is, ±0.5 in the dimensionlessscale we are using here (e.g., 0–255 for 8-bit DACs).The dynamic error is called a ‘‘glitch’’ and is a brief(few ns) error that depends on the relationship betweenthe current value and that immediately preceding. Theglitch is caused by the change of state of the switches(one per bit) inside the digital-to-analog converter. Theglitch has a fixed duration, whereas the pixel duration isdetermined by the pixel clock rate, so the contribution ofthe glitch to the light intensity is proportionally reducedas the pixel duration is increased. The glitch is usuallynegligible.
The three video voltages produced by the graphics card,as described in Eq. (3), are transmitted by a cable tothe CRT. Within the monitor, a video amplifier drivesa cathode ray tube that emits light. The light emittedby the phosphors is proportional to the electron beamintensity, but that intensity is nonlinearly related to thevideo voltage, so the light intensity is a nonlinear functionof video voltage:
r = fred(vred),
g = fgreen(vgreen),
b = fblue(vblue), (4)

176 DISPLAY CHARACTERIZATION
where r, g, and b have the same meaning as in Eq. (1) andfred(), fgreen(), and fblue() are so-called gamma functions11
that characterize the input–output relationship for eachmonitor primary.
Note that the term ‘‘gamma function’’ is often usedtoday to describe the single-pixel nonlinear transformationof many display devices, including printers. There aredifferences in both the form of the nonlinearities and themechanisms that cause them. The gamma function of aCRT is caused by a space charge effect in the neck of thetube, whereas the gamma function of printers is usuallycaused by the spreading and overlapping of ink dots andthe scatter of light within the paper. Different models areneeded to account satisfactorily for the nonlinearities ofdifferent devices. Some analog-input LCD displays andprojectors process the incoming signal electronically toprovide a nonlinear response that approximates that of atraditional CRT, but they are being displaced by newerdigital-input LCDs.
Equations (3) and (4) incorporate further assumptionsabout monitor performance, including assumptions ofpixel independence and channel independence. Theseassumptions, particularly pixel independence, greatlysimplify the CRT model and make it practical to invert it.
Pixel independence is the assumption that the phosphorlight intensities (r, g, and b) at each pixel depend solelyon the digital video values for that pixel, independentof the digital video values for other pixels. Recall that,as a matter of convenience, Eq. (1) defines the phosphorintensities r, g, and b before blur by the point-spreadfunction of the CRT. The real blurry pixels overlap,but pixel independence guarantees that the contributionof each pixel to the final image may be calculatedindependently of the other pixels. The final image is thesum of all of the blurry pixels (21).
Channel independence is the assumption that the lightintensity for one phosphor channel depends solely on thedigital video value for that channel, independent of thedigital video values for the other channels. The validity ofthese assumptions is discussed later.
There is a second common mode for graphics cards.This is typically referred to as ‘‘indexed color’’ or 8-bit (‘‘256colors’’) mode. It is illustrated at the bottom of Fig. 2. Here,there is only a single plane of 8-bit frame buffer values.These index to a single color lookup table to obtain R,G, and B values; at each pixel, the same index value isused for all three channels so that mred = mgreen = mblue.Thus, for 8-bit mode, only 256 colors (distinct R, G, Bcombinations) are available to paint each frame. It isusually possible to load an entirely new lookup table for
11 The term gamma function is also used to describe therelationship between phosphor intensities (i.e., r, g, and b)and digital video values (i.e., R, G, and B) because thislatter relationship is often the one measured. It is called a‘‘gamma function’’ because the relationship has traditionally beendescribed by power-law like functions where the symbol gammadenotes the exponent, for example, r ∝ [(R − R0)/(255 − R0)]γ forR > R0 and r = 0, otherwise [see Eq. (16) later]. Gamma is usuallyin the range 2 to 3, with a value of 2.3 quoted as typical (11; seealso 20).
each frame. Most current graphic cards can be configuredto operate in either 8- or 24-bit mode. The advantage of 8-bit mode is that images can be moved into the frame buffermore rapidly, because less data must be transferred. Thedisadvantage is that only 256 colors are available for eachframe. Both 8- and 24-bit modes are important and widelyused in visual psychophysics (see 22).
Although it is useful to understand the differencebetween 8- and 24-bit graphics modes, the distinctionis not crucial here. The digital part of the CRT video chainis simple and does not introduce distortions. As illustratedby Fig. 3, the key point is that, for each pixel, we mustcompute the appropriate R, G, and B values to producearbitrary desired phosphor intensities r, g, and b. Thiscomputation relies on measurements of the analog portionof the video chain and on the properties of the display.In particular, it is necessary to characterize the spectralproperties of the light emitted by the monitor phosphors[Eq. (1)] and the gamma functions [Eqs. (3) and (4)].
BASIC COLORIMETRY
Equation (1) shows that monitors can produce only a verylimited set of spectra C(λ), those that consist of a weightedsum of the three fixed primaries. But that is enoughbecause human color vision is mediated by three classes oflight-sensitive cones, referred to as the L, M, and S cones(most sensitive to long, middle, and short wavelengths,respectively). The response of each class of cones to aspectrum incident at the eye depends on the rate at whichthe cone pigment absorbs photons, and this absorptionrate may be computed via the spectral sensitivity of thatclass of cones. Denote the spectral sensitivities of the L,M, and S cones as L(λ), M(λ), and S(λ), respectively. Thenthe quantal absorption rates l, m, and s of the L, M, andS cones for a color stimulus whose spectrum is C(λ) aregiven by the integrals
l =780 nm∫
380 nm
L(λ)C(λ) dλ,
m =780 nm∫
380 nm
M(λ)C(λ) dλ,
s =780 nm∫
380 nm
S(λ)C(λ) dλ, (5)
where each integral is taken across the visible spectrum,approximately 380 nm to 780 nm. We refer to thesequantal absorption rates as the cone coordinates of thespectrum C(λ).
The integrals of Eq. (5) may be approximated bythe sums
l =n∑
i=1
L(λi)C(λi)�λ,
m =n∑
i=1
M(λi)C(λi)�λ,

DISPLAY CHARACTERIZATION 177
Figure 3. The standard CRT model.Based on Fig. 1, this reduced schematicshows the subsection of the video chaindescribed by the standard CRT model.This subsection takes the digital videovalues R, G, and B as input and producesintensities r, g, and b as output. See colorinsert.
s =n∑
i=1
S(λi)C(λi)�λ, (6)
across wavelengths λi evenly spaced across the visiblespectrum, where �λ is the interval between wavelengthsamples. The CIE recommends sampling from 380 nm and780 nm at 5 nm intervals, making n = 81. Using matrixnotation,
s =[ l
ms
],
S =[ L(λ1) L(λ2) · · ·
M(λ1) M(λ2) · · ·S(λ1) S(λ2) · · ·
]�λ,
c =
C(λ1)
C(λ2)...
, (7)
we can rewrite Eq. (6) as
s = S c. (8)
Equation (8) computes cone coordinates s from thespectrum c of the color stimulus.
When two physically distinct lights that have thesame spatial structure result in the same quantalabsorption rates for the L, M, and S cones, the lightsare indistinguishable to cone-mediated vision.12 Thus,accurately rendering a desired image on a characterizedmonitor means choosing R, G, and B values so that thespectrum c emitted by the monitor produces the same conecoordinates s as the desired image.
12 We neglect for now a possible effect of rod signals that can occurat light levels typical of many color monitors. See Discussion: Useof Standard Colorimetric Data.
CHARACTERIZATION USING THE STANDARD CRTMODEL
The CRT model presented above is the standard CRTmodel used for color characterization (e.g., 1,2,23).13 Usingthe standard CRT model, we can find the digital videovalues R, G, and B required to render a spectrum C(λ)
through the following computational steps:
1. Computing cone coordinates. Use Eq. (8) to find thel, m, and s quantal absorption rates correspondingto C(λ).
2. Computing phosphor light intensities. Find r, g, andb such that the mixture expressed on the right side ofEq. (1) produces the same quantal absorption rates.This computation relies on measurements of thephosphor spectra but is independent of the gammafunctions.
3. Gamma correction. Find DAC values R, G, and Bthat will produce the desired phosphor intensities r,g, and b. This computation relies on measurementsof the gamma functions but is independent of thephosphor spectra. Because each intensity r, g, and bunder the standard CRT model is a simple monotonicfunction of the corresponding digital video value (R,G, or B), it is straightforward to invert each gammafunction to find the necessary digital video value toproduce any desired output (assuming that the DACerror e is negligible).
The measurements and computations required for eachof these steps are discussed in more detail below. Notethat before actually using the standard model, you willwant to make sure it is valid for your monitor and stimuli.
13 Both Post (1) and Cowan (2) provide systematic developmentsof the standard model. Different authors have used differentterms for the assumptions embodied by the standard model. Ournomenclature here is similar to Post’s (1).

178 DISPLAY CHARACTERIZATION
Detecting failure of the standard CRT model and possibleremedies are also discussed below.
Most CRT monitors have controls labeled ‘‘contrast’’ and‘‘brightness’’ that affect the gamma function, the ambientlight A(λ), and the maximum luminance. These shouldbe adjusted before beginning the characterization process.Write the date and ‘‘do not touch’’ next to the controls oncethey are adjusted satisfactorily.
Computing Cone Coordinates
Recall that, given the spectrum of a color stimulusc, Eq. (8) allows us to compute the cone coordinatess. Measuring spectra requires a spectroradiometer. Butspectroradiometers are expensive, so it is more commonto use a less expensive colorimeter to characterize thespectral properties of the desired light. A colorimetermeasures the CIE XYZ tristimulus coordinates of light.XYZ tristimulus coordinates are closely related to conecoordinates. Indeed, the cone coordinates s of the lightmay be obtained, to a good approximation, by the lineartransformation
s = Tx (9)
where
T =[ 0.2420 0.8526 −0.0445
−0.3896 1.1601 0.08530.0034 −0.0018 0.5643
](10)
and
x =[ X
YZ
].
The matrix T was calculated from the Smith–Pokornyestimates (24,25) of cone spectral sensitivities, each conesensitivity was normalized to a peak sensitivity of one, andthe XYZ functions were as tabulated by the CIE (26,27).The appropriate matrix may be easily computed for any setof cone spectral sensitivities (14). A detailed discussion ofthe relationship between cone coordinates and tristimuluscoordinates is available elsewhere (14,15).
Computing Phosphor Intensities
Adopting matrix notation for the phosphor spectra P andintensities w,
P =
R(λ1) G(λ1) B(λ1)
R(λ2) G(λ2) B(λ2)...
......
,
w =[ r
gb
], (11)
allows us to rewrite Eq. (1) [neglecting A(λ)] as
c = Pw. (12)
Using this to substitute for c in Eq. (8) yields
s = SPw = Mw, (13)
where the 3 × 3 matrix M equals S P. We can compute thematrix inverse of M and solve for w,
w = M−1s. (14)
Equation (14) computes the phosphor intensities w (r, g,and b) that will produce the desired cone coordinates s (l,m, and s).
Calculation of Eq. (14) requires knowledge of thematrix M,
M = SP
=
n∑i=1
L(λi)R(λi)�λ
n∑i=1
L(λi)G(λi)�λ
n∑i=1
L(λi)B(λi)�λ
n∑i=1
M(λi)R(λi)�λ
n∑i=1
M(λi)G(λi)�λ
n∑i=1
M(λi)B(λi)�λ
n∑i=1
S(λi)R(λi)�λ
n∑i=1
S(λi)G(λi)�λ
n∑i=1
S(λi)B(λi)�λ
(15)
Each element of M is the quantal absorption rate ofone cone class for one phosphor spectrum at maximumexcitation. Each column of M is the set of cone coordinatess of one phosphor spectrum [Eqs. 6 and 7]. Thus,to implement Eq. (14), it is necessary to know thesecone coordinates for each phosphor. The best way tofind them is to use a spectroradiometer to measurethe phosphor emission spectra R(λ), G(λ), and B(λ). Ifsuch measurements are not feasible and only the XYZtristimulus coordinates of each phosphor are available,then the matrix M may be computed using the relationshipbetween the cone and tristimulus coordinates given inEqs. (9) and (10).
00.0
0.2
0.4
0.6
0.8
1.0
50 100 150
Digital video input
Ligh
t int
ensi
ty o
utpu
t
200 250 300
Figure 4. Typical gamma function. The plot shows the gammafunction for a typical CRT monitor. The solid circles showmeasured data. The measurement procedure is described in thetext. The intensity data were normalized to a maximum of one fora digital video value of 255. The line shows the best fit obtainedusing Eq. (16), with parameter estimates γ = 2.11 and G0 = 0.

DISPLAY CHARACTERIZATION 179
Alternatively, if one prefers to specify color stimuli interms of XYZ coordinates rather than cone coordinates, onemay set T as the identity matrix and work directly in XYZcoordinates, starting with the colorimetric measurementsand replacing the cone spectral sensitivities used to formthe matrix S in the previous derivations by the CIE XYZcolor matching functions.
Gamma Correction
Figure 4 shows a typical gamma function measurement.To obtain this curve, the spectrum of light emitted bythe green phosphor was measured for 35 values of the Gdigital video value where R = B = 0. A measurement ofthe ambient light (R = G = B = 0) was subtracted fromeach individual measurement. Then, for each measuredspectrum, a scalar value was found that expressed thatspectrum as a fraction of the spectrum G(λ) obtained fromthe maximum digital video value (G = 255). These scalarstake on values between 0 and 1 and are the measuredgamma function fgreen().
Given a desired value for the green-phosphor intensityg, gamma correction consists of using the measuredgamma function to find the digital value G thatproduces the best approximation to g. This is conceptuallystraightforward, but there are several steps.
The first step is to interpolate the measured values.Although exhaustive measurement is possible, fitting aparametric function to the measured values has theadvantage of smoothing any error in the gamma functionmeasurements.14 For most CRT monitors, measuredgamma functions are well fit by the functional form (e.g.,for the green phosphor)
g = fgreen(G + egreen) =[
(G − G0)
(255 − G0)
]γ
, for G > G0
g = fgreen(G + egreen) = 0, otherwise. (16)
In Eq. (16), parameter G0 represents a cutoff digital videovalue below which no incremental light is emitted, andparameter γ describes the nonlinear form of the typicalgamma function. The constant 255 in Eq. (16) normalizesthe digital video value and is appropriate when G isspecified by 8-bit numbers. To be consistent with Eq. (4),we retain egreen, which is usually negligible. The curvethrough the data in Fig. 4 represents the best fit of Eq. (16)to the measured data. Note that Eq. (16) requires thatphosphor intensity g = 0 when digital video value G = 0.This is appropriate because both our definition of phosphorintensities [Eq. (1)] and our measurement procedure (seeabove) account explicitly for the ambient light.
Equation (16) is easily inverted to determine, forexample, G from g:
G = (255 − G0)g1/γ + G0. (17)
14 In a demanding application using 8-bit DACs, it may bedesirable to measure light intensity accurately for all 256 digitalvideo values and to use the measured data directly instead offitting a smooth function, so that the DAC’s static error is takeninto account in the gamma correction.
Because G must be an integer and the value computedby Eq. (17) is real, the computed value of G should berounded up or down to minimize the error in g predictedby Eq. (16).
DETECTING FAILURES OF THE STANDARD CRT MODEL
The standard CRT model is useful because it generallyprovides an acceptably accurate description of the perfor-mance of actual CRT monitors, because measurement ofits parameters is straightforward, and because it is eas-ily inverted. Use of the standard CRT model is implicitin the information stored in ICC monitor profiles: theseprofiles store information about the XYZ tristimulus coor-dinates and gamma function for each channel (R, G, andB). For very accurate rendering, however, it is importantto be aware of the assumptions that the model embodiesand how these assumptions can fail. A number of authorsprovide detailed data on how far actual CRT monitorsdeviate from the assumptions of the standard CRT model(1,2,18,19,21,28–31).
As noted above, the key assumption for the standardCRT model is pixel independence, expressed implicitlyby Eqs. (3) and (4). Pixel independence is particularlyimportant because, though it is easy to extend thestandard CRT model to deal with dependent pixels, theextended model is hard to invert, making it impracticalfor fast image rendering. The next section (Extending theStandard CRT Model) briefly discusses other assumptionsfor the standard CRT model. It is generally possible tocope with the failures of these other assumptions becausethe standard CRT model can be extended to handle themin a fashion that still allows it to be inverted rapidly.
Pixel Independence
There are at least six causes for the failure of pixelindependence (also see 21). Dependence on other pixelsin the same frame (failures 1–4, below) has beencalled ‘‘spatial dependence’’, and dependence on pixelsin preceding frames (failures 5 and 6) has been called‘‘temporal dependence’’ (1). Failures 1 and 2 are shortrange, causing each pixel’s color to depend somewhaton the preceding pixel in the raster scan. Failures 3–6are long range in the current frame (3 and 4) or in thepreceding frames (5 and 6).
1. Glitch. As mentioned earlier, the glitch (thedynamic component of the DAC error) dependson the preceding as well as the current pixel.The DAC manufacturer generally specifies that thecontribution of the glitch to the average voltage forthe duration of a pixel at maximum clock rate is afraction of a least significant step, so it is usuallynegligible.
2. Finite video bandwidth and slew rate. The wholevideo signal chain — including the DACs on thegraphics card, the video cable, and the monitor’samplifiers — has a finite bandwidth so that it can-not instantly follow the desired voltage change frompixel to pixel, resulting in more gradual voltage

180 DISPLAY CHARACTERIZATION
transitions. Because this filtering effect precedesthe nonlinear gamma function, it is not equiva-lent to simply blurring the final image horizontallyalong the raster lines. Smoothing or averagingbefore the nonlinear gamma function makes thefinal image dimmer. (Because the gamma functionis accelerating, the average of two luminances pro-duced by two voltages is greater than the luminanceproduced by the average voltage.) An excellent testfor this effect is to compare the mean luminanceof two fine gratings, one vertical and one horizon-tal (21,29,31,32). This test is available on-line athttp://psychtoolbox.org/tips/displaytest.html. Eachgrating consists of white and black one-pixel lines.Only the vertical grating is attenuated by the ampli-fier’s bandwidth, so it is dimmer. Like the glitch, thiseffect can be reduced by slowing the pixel clock inthe graphics card or, equivalently, by using two dis-play pixels horizontally (and thus two clock cycles) torepresent each sample in the desired image. Videobandwidth is normally specified by the manufac-turer and should be considered when choosing aCRT monitor.
3. Poor high-voltage regulation. The electron beamcurrent is accelerated by a high-voltage (15 to 50 kV)power supply, and on cheaper monitors, the voltagemay slowly drop when the average beam currentis high. This has the effect of making the intensityof each pixel dependent on the average intensityof all of the pixels that preceded it. (The high-voltage supply will generally recuperate betweenframes.) You can test for such long-distance effectsby displaying a steady white bar in the centerof your display surrounded by a uniform field ofvariable luminance. Changing the surround fromwhite to black ideally would have no effect on theluminance of the bar. To try this informally withouta photometer, create a cardboard shield with a holesmaller than the bar to occlude a flickering surround,and observe whether the bar is steady. This effectdepends on position. The effect is negligible at thetop of the screen and maximal at the bottom. Asingle high-voltage supply generally provides thecurrent for all three channels (R, G, and B), so thatthe effect on a particular test spot is independentof the channel used for background modulation.When the high voltage is very poorly regulated, thewhole screen image expands as the image is madebrighter, because as the increased current pulls thehigh voltage down, the electrons take longer to reachthe screen and deflect more.
4. Incomplete DC restoration. Unfortunately, the videoamplifier in most CRT monitors is not DC cou-pled (21). Instead it is AC coupled most of the time,and momentarily DC coupled to make zero voltsproduce black at the end of the vertical blankinginterval. (DC, ‘‘direct current,’’ refers to zero tem-poral frequency; AC, ‘‘alternating current,’’ refers toall higher frequencies.) This is called ‘‘DC restora-tion,’’ which is slightly cheaper to design and buildthan a fully DC coupled video circuit. If the AC
time constant were much longer than a frame, theDC restoration would be equivalent to DC coupling,but, in practice, the AC time constant is typicallyshort relative to the duration of a frame, so thatthe same video voltage will produce different screenluminances depending on the average voltage sincethe last blanking interval. As for failure 3, this effectis negligible at the top of the screen and maximalat the bottom. However, this effect can be distin-guished from failure 3 by using silent substitution.To test, say, the green primary, use a green test spot,and switch the background (the rest of the screen)back and forth between green and blue. The greenand blue backgrounds are indistinguishable to thehigh-voltage power supply (it serves all three guns)but are distinct to the video amplifiers (one per gun).
5. Temporal dependence. This is a special case ofpixel dependence, where the pixel intensities dependon pixels in preceding frames. A typical exampleof this occurs when a full-field white screen ispresented after a period of dark. Amongst otherthings, the large change in energy delivered tothe screen results in distortions of the shadowmask and displayed luminances that are temporarilyhigher than desired. This effect may persist forseveral frames. It is normally difficult to characterizethese phenomena precisely, especially in a generalmodel, and the best line of defense is to avoidstimuli that stress the display. Measurement oftemporal dependence requires an instrument thatcan measure accurately frame by frame.
6. Dynamic brightness stabilization. This is anothercause of temporal dependence. Since the mid-1990s, some CRT manufacturers (e.g., Eizo) haveincorporated a new ‘‘feature’’ in their CRT monitors.The idea was to minimize objectionable flickerwhen switching between windows, by stabilizingthe total brightness of the display. To this end,the monitor compensates for variations in the meanvideo voltage input to the display. This has the effectof making the intensity of each pixel dependenton the average voltage of all of the pixels in thepreceding frame. This artifact, too, will be detectedby the test described in 3 above. However, this effectis independent of spot position and thus can bedistinguished from failures 3 and 4, by testing atthe top of the screen, where failures 3 and 4 arenegligible.
Different monitors conform in different degrees to thestandard CRT model. More expensive monitors tend tohave higher video bandwidth and better regulation ofthe high-voltage power supply. If accuracy matters, it isworth performing tests like those described here to find amonitor whose performance is acceptable. A suite of testpatterns for display in your web browser is available athttp://psychtoolbox.org/tips/displaytest.html.
Coping with Pixel Dependence
The standard CRT model is easily extended to deal withdependent pixels, but the resulting model is hard to invert,

DISPLAY CHARACTERIZATION 181
making it impractical for many applications. However, anextended model may be useful in estimating the errors inyour stimuli.
Once you understand the nature of pixel dependence,you may be able to minimize its effect by avoidingproblematic stimuli. For example, the preceding pixeleffects (failures 1 and 2 of pixel independence) can bereduced by reducing the rate of change of the video signal,either by spacing the changes out (e.g., double the viewingdistance, and use a block of four pixels, 2 × 2, in placeof each original pixel) or making a fine grating horizontal(parallel to the raster lines) instead of vertical. The spatial-average effects (failures 3–6 of pixel independence) canbe reduced by maintaining a constant mean luminanceduring characterization and display. If the image to bedisplayed does not occupy the whole screen, then it isgenerally possible to mask a small section of the screenfrom view and to modulate the light emitted from thissection to counterbalance modulations of the image thatare visible. In this way, the total light output from theentire display may be held constant.
EXTENDING THE STANDARD CRT MODEL
Channel Constancy
As noted above, Eq. (1) embodies an assumption of channelconstancy, that the relative spectrum emitted by an RGBmonitor channel is independent of its level of excitation.
4000 100
1 10−3
2 10−3
3 10−3
4 10−3
5 10−3
450
Pow
er (
wat
ts/s
r-m
2 -5
nm)
500
Wavelength (nm)
550 600
Figure 5. LCD primary spectra. A plot of the relative spectralpower distribution of the blue primary of an LCD monitor (Mar-shall, V-LCD5V) in the spectral range 400–600 nm measuredat two digital video values. Measurements were made in DavidBrainard’s lab. The spectrum of the ambient light was subtractedfrom each measurement. The solid curve shows the spectrum fora digital video value of 255. The dashed curve shows the spec-trum for a digital video value of 28, scaled to provide the bestleast-squares fit to the spectrum for a digital video value of 255.The plot reveals a change in the relative spectrum of the emittedlight as the digital video value changes from 28 to 255. If therewere no change, the two curves would coincide.
In our experience, channel constancy holds quite well forCRTs. However, for other display technologies, there canbe significant violations of this assumption. Figure 5, forexample, shows the relative spectrum of the green primaryof an LCD monitor (see discussion of LCD displays later)at two digital video value levels, revealing a substantialchange in the spectrum of this primary. It is possible tomeasure such changes systematically and correct for them.For example, Brainard et al. (33) describe a method basedon using small-dimensional linear models to characterizespectral changes. This method was developed for handlingspectral changes that occur when the voltage to filteredlamps is varied, but it also works well for LCD displays.Other authors have also proposed methods designedexplicitly to deal with failures of channel constancy (28).Lookup table methods (see Channel Independence) mayalso be used to handle the effects of spectral changes.
Channel Independence
In Eq. (4), the form of the gamma function for the greenphosphor is g = fgreen(vgreen). A more general form forthis function would be g = fgreen(vred, vgreen, vblue), so that gdepends on its corresponding digital video value G and alsoon R and B. Failures of the simple form [Eq. (4)] are calledfailures of channel independence. Channel independencecan fail because of inadequate power supply regulation(see item 3 under pixel independence above). Cowanand Rowell (18) and Brainard (19) describe procedures fortesting for failures of channel independence.
Channel inconstancy and dependence go beyondthe standard CRT color model but still obey pixelindependence and are within the domain of a generalcolor transformation model. Lookup tables may be usedto characterize CRT monitors whose performance violatesthe assumptions of channel constancy and independence.To create a table, one measures the monitor output (e.g.,XYZ) for a large number of monitor digital video valuetriplets (i.e., RGB values). Then, interpolation is employedto invert the table and find the appropriate digital videovalue for any desired output. Cowan (2) provides anintroduction to lookup table methods (see also 34,35).The ICC profile standard allows for storing and invertinga sampled representation of a general three-space to athree-space nonlinear transform.
Spatial Homogeneity
In general, all of the properties of a CRT may vary acrossthe face of the CRT, and, for some applications, it maybe necessary to measure this variation and correct for it.Luminance at the edge of a CRT is often 20% less thanin the center (19). Failures of spatial homogeneity can beeven larger for projectors. Brainard (19) found that thespatial inhomogeneity of a monitor could be characterizedby a single light-attenuation factor at each location.
Spatial inhomogeneity does not violate pixel indepen-dence, because the light output at each pixel is stillindependent of the light output at other pixel locations.Spatial homogeneity may be handled by allowing theparameters of the standard model to depend on the pixellocation.

182 DISPLAY CHARACTERIZATION
Temporal Homogeneity
There are two common causes of temporal variations inmany types of display: those caused by warm-up andlifetime decay. CRTs and LCD panels (as a result of theirbacklight) take a significant time to warm up after beingturned on. This can be long as 45 to 60 minutes duringwhich time the luminance of a uniform patch will graduallyincrease by as much as 20%. There may also be significantcolor changes during this period.
CRTs have finite lifetimes, partly because of browningof the phosphors by X rays. This causes the phosphorsto absorb some light that would otherwise have beenemitted. The same process affects the backlights used inLCD panels. The magnitude of this effect is proportionalto the total light that has ever been emitted from thetube. Thus, presenting very bright stimuli for long periodswill cause it to happen faster. Typical magnitudes of thisphenomenon can be a 50% decrease in luminance across afew thousand hours.
In addition to an overall decrease in the amountof emitted light, repeated measurements of the gammafunction of a 1989-vintage monochrome CRT monitorduring its life revealed an increase in the cutoff parameterG0 [Eq. (16)] by about six per month (on a scale of 0 to 255),when the monitor was left on continuously. We tentativelyattribute this to loss of metal from the cathode, which mayaffect the MTF as well.
DISCUSSION
The preceding development has specified the steps of basicdisplay characterization. Here we touch on several moreadvanced points.
Further Characterization
There are other imaging properties, beyond color transfor-mation, that you may want to characterize.
Modulation Transfer Function (MTF). The optics of theelectron beam and phosphor blur the displayed imagesomewhat. This is linear superposition and does not violatethe pixel independence assumption. (The contribution ofeach blurry pixel may be calculated independently, and thefinal image is the sum of all of the blurry pixels.) Althoughit is easier to think of blur as convolution by a pointspread, it is usually best to characterize it by measuringthe Fourier analog of the point spread, the MTF. To dothis, we recommend displaying drifting sinusoidal gratingsand using a microphotometer to measure the light froma small slit (parallel to the gratings) on the display.(Your computer should read the photometer once perframe.) This should be done for a wide range of spatialfrequencies. Adjust the drift rate to maintain a fixedtemporal frequency, so that the results will not be affectedby any temporal frequency dependence of the photometer.Results of such measurements are shown in Fig. 6. Themonitor’s MTF is given by the amplitude of the sinusoidalluminance signal as a function of spatial frequency. Whenthe grating is horizontal (no modulation along individualraster lines), the blur is all optical and is well characterized
as a linear system that has the specified MTF. When thegrating is vertical, some of the ‘‘blur’’ is due to the finitevideo bandwidth (failure 2 of pixel independence, above),and because the effect is nonlinear, the MTF is only anapproximate description.
Geometry. For some experiments, for example, judgingsymmetry, it may be important to produce images whoseshape is accurately known. For this, you may wishto measure and correct for the geometric distortionsacross the face of your monitor (36). Some monitors allowadjusting of the geometry of the displayed image and suchadjustment may be used to minimize spatial distortions.
Ambient Light or ‘‘Flare’’
Correcting for the presence of ambient light [termA(λ) in Eq. (1)] is easy. If we want to produce C(λ),first we compute C′(λ) = C(λ) − A(λ) and simply proceedas described previously (see Characterizing with theStandard CRT Model), using C′(λ) in place of C(λ). Thesame correction can also be applied if one starts with conecoordinates s or tristimulus coordinates x. In these cases,one computes s’ or x’ by subtracting the coordinates of
0.11 10
Horizontal grating
Vertical grating
Spatial frequency (c/screen)
Spatial frequency (c/pixel)
1000100
Con
tras
t gai
n
10.01 0.1 1
Figure 6. CRT monitor Modulation Transfer Function (MTF).The measured contrast of a drifting sinusoidal grating as afunction of spatial frequency (normalized to 1 at zero frequency)for a CRT monitor, a 1989-vintage Apple High-ResolutionMonochrome Monitor made by Sony. It has a fixed scan resolutionof 640 × 480, a gamma of 2.28, and a maximum luminanceof 80 cd/m2. As explained in the text, the contrast gain usinghorizontal gratings is independent of contrast, and thus is theMTF. The ‘‘contrast gain’’ using vertical gratings, normalized bythe horizontal-grating result, characterizes the nonlinear effectof limited bandwidth of the video amplifier, which will depend oncontrast. It is best to avoid presenting stimuli at frequencies atwhich the video amplifier limits performance, that is, where thedashed curve falls below the solid curve.

DISPLAY CHARACTERIZATION 183
the ambient light from the desired coordinates and thenproceeds as before.
When a monitor viewed in an otherwise dark room hasbeen adjusted to minimize emitted light when R = G =B = 0, and only a negligible fraction of its emission isreflected back to it from surfaces in the room, correctingfor the ambient light is probably not necessary. Underother conditions, the correction can be quite important.
What If I Care Only About Luminance?
For many experiments it is desirable to use just oneprimary and set the others to zero. Or, because observerstypically prefer white to tinted displays, you may wish toset R = G = B and treat the display as monochrome, usinga one-channel version of the standard CRT model.
Fine Control of Contrast
As noted above, both 8-bit and 24-bit modes on graphicscards usually use 8-bit DACs to produce the video voltagesthat drive the CRT. The 256-level quantization of the 8-bitDACs is too coarse to measure threshold on a uniformbackground. A few companies sell video cards that havemore-than-8-bit DACs.15
There are several ways to obtain finer contrast stepsusing 8-bit DACs, but none is trivial to implement:
1. Use a half-silvered mirror to mix two monitorsoptically (37).
2. Optically mix a background light with the monitorimage, for example, by using a slide projector toilluminate the face of the CRT (38).
3. For gray-scale patterns, add together the three videovoltages produced by a graphics card to produce asingle-channel signal that has finer steps (see 39).For color patterns, add together the correspondingvred, vgreen, and vblue voltages from two synchronizedgraphics cards. (Synchronizing monitors can betechnically difficult, however.)
4. Move the observer far enough away so thatindividual pixels cannot be resolved and usedithering or error diffusion (40,41).
5. Use a high frame rate, and dither over time.
Use of Standard Colorimetric Data
Standard estimates of color matching functions representpopulation averages for color normal observers andare typically provided for foveal viewing at high lightlevels. These estimates may not be appropriate forindividual observers or particular viewing conditions.First, there is variation among observers in which lightsmatch, even among color normal observers (42,43; seealso 25,27,44–50). Second, the light levels produced bytypical CRTs may not completely saturate the rods. Ifrods participate significantly in the visual processingof the stimulus, then color matches computed on the
15 A list of such video cards may be found at http://psychtoolbox.org/tips/videocards.html.
basis of standard colorimetry will be imperfect for lightsviewed outside the fovea. Some guidance is available fordetermining whether rods are likely to have an effect attypical CRT levels (see 51; also 13).
Unfortunately, correcting for individual variationis not trivial, because determining the appropriatecolor matching functions for a given individual andviewing conditions requires substantial measurement. Ifindividual cone sensitivities or color matching functionsare known, then it is straightforward to employ them bysubstituting them for the standard functions in the matrixS of Eq. (7). In some experiments, stimuli are presentedon monitors to nonhuman observers. Here it is crucialto customize the rendering calculations for the spectralsensitivities appropriate for the species of interest (see 52).
For psychophysical experiments where taking therole of rods into account is critical, one can considerconstructing custom four-primary displays, restrictingstimuli to the rod-free fovea or employing an auxiliarybleaching or adapting light to minimize rod activity.
For experiments where silencing luminance is ofprimary interest, individual variation can be taken intoaccount by using a psychophysical technique such asflicker photometry to equate the luminance of stimulithat diller in chromaticity (15).
Other Display Devices
Although CRT monitors remain the dominant technologyfor soft copy display, they are by no means the onlydisplay technology. Liquid crystal display (LCD) devicesare becoming increasingly popular and in fact are thedominant display technology used in laptop computersand data projection systems. Other emerging technologiesinclude the digital light processor (DLP; 53) and plasmadisplays. Printers, obviously, are also important.
Characterization of other display devices requiresapplying the same visual criterion of accuracy. For eachtype of display device, a model of its performance must bedeveloped and evaluated. The standard CRT model is areasonable point of departure for LCD, DLP, and plasmadisplays. We discuss these in more detail below.
Printers are more difficult to characterize. The standardCRT model does not provide an acceptable description ofprinters. First, printers employ subtractive (adding inkcauses more light to be absorbed) rather than additivecolor mixture, so that Eq. (1) does not hold. Second, theabsorption spectrum of a mixture of inks is not easy topredict from the absorption spectra of individual inks.Third, the spectrum of reflected light depends on theinks laid down by the printer and also on the spectrumof the ambient illumination. The illumination underwhich the printed paper will be viewed is often notunder the control of the person who makes the print.Lookup tables (see above) are generally employed tocharacterize the relationship between digital values inputto the printer and the reflected light, given a particularreference illuminant. Accordingly, ICC printer profilesprovide for specification of tabular data to characterizeprinter performance. A detailed treatment of printercharacterization is beyond the scope of this article(see 2,3,35,54,55).

184 DISPLAY CHARACTERIZATION
LCD Panels. LCDs appear commonly in two manifes-tations: as flat panel equivalents of the CRT for desktopand laptop computers and as the light control elementin projection displays. When designed to replace moni-tors, some manufacturers have tried to imbue them withsome of the characteristics of CRT displays, so LCDshave typically accepted the same analog video signalfrom the computer that is used to drive a CRT. How-ever, since the 1999 publication of the Digital VisualInterface (DVI) standard (http://www.ddwg.org/; see alsohttp://www.dell.com/us/en/arm/topics/vectors 2000-dvi.htm), a rapidly increasing proportion of LCD displaysaccept digital input. At least in principle, digital-inputLCDs can provide independent digital control of each pixeland promise excellent pixel independence. LCDs can becharacterized similarly to CRT displays, but bear in mindthe following points:
1. Angular dependence. The optical filtering propertiesof LCD panels can have a strong angular depen-dence, so it is important to consider the observer’sviewing position when characterizing LCD displays.This is especially important if the observer will beoff-axis or there will be multiple observers. Angulardependence may be the greatest obstacle to the useof LCDs for accurate rendering.
2. Temporal dependencies. The temporal response ofLCD panels can be sluggish, resulting in moresevere violations of the assumption of temporalindependence than typically observed in CRTdisplays. For example, when measuring the gammafunction, a different result will be obtained if onemeasures the output for each digital video value aftera reasonable settling time than if one sandwiches oneframe at the test level between two frames of fulloutput. It is important to try to match the timing ofthe characterization procedure to the timing of thetarget display configuration.
3. Warm-up. The LCD panel achieves color by filteringa backlight normally provided by a cold-cathodefluorescent display. These behave similarly to CRTswhen warming up, so be prepared to wait for45 minutes after turning one on before expectingconsistent characterization.
4. Channel constancy. As illustrated by Fig. 5, someLCD displays do not exhibit channel constancy. Thisdoes not appear to be inherent in LCD technology,however. Measurements of other LCD panels (56,57)indicate reasonable channel constancy, at least asassessed by examining variation in the relativevalues of XYZ tristimulus coordinates.
5. Output timing. It can be important to know whenthe light is emitted from the display with respect togenerating video signals. In a CRT-based display, thevideo signal modulates the electron beam directly, soit is easy to establish that the light from one frameis emitted in a 10 ms burst (assuming a 100 Hzframe rate) starting somewhere near the time ofthe frame synchronization pulse and the top of thescreen, but this need not be so in an LCD system.To evaluate the output timing, arrange to display a
single light frame followed by about ten dark frames.Connect one of the video signals (say the Green)to one channel of an oscilloscope and connect theother channel to a photodiode placed near the top ofthe screen. (Note that no electronics are needed touse the photodiode but the signal may be invertedand the voltage produced is logarithmically, ratherthan linearly, related to the incident light.) Whenobserving a CRT, it will be possible to identify ashort pulse of light about 1 ms or so wide locatedsomewhere near the beginning of the video stream.If the detector is moved down the screen, the pulseof light will move correspondingly toward the endof the video frame. When observing an LCD panel,the signals look completely different. The light pulseis no longer a pulse but a frame-length block, andthere may be a significant delay between the videostream and the arrival of the light. In fact, in somedisplays, the two may have no fixed relationship atall (see Fig. 7).
6. Resolution. Analog-input LCD panels (and projec-tors) contain interlace electronics that automaticallyresample the video signal and interpret it in a man-ner suitable for their own internal resolution andrefresh rate. This is desirable for easy interface todifferent computers, but the resampling can intro-duce both spatial and temporal dependencies thatmake accurate imaging more difficult. If possible,LCD displays should be run at their native spa-tial and temporal resolution. Even then, it is notguaranteed that the electronics pass the video sig-nal unaltered, and one should be alert for spatialand temporal dependencies. This consideration alsoapplies to DLP displays.
7. Internal quantization. Analog-input LCDs mayactually digitize the incoming video voltages witha resolution of only 6 or 8 bits before displaying it,so be prepared to observe quantization beyond thatcreated by the graphics card.
8. Gamma. There is no inherent mechanism in an LCDpanel to create the power-law nonlinearity of a CRT;therefore a power-type function [e.g., Eq. (16)] doesnot work very well to describe the function relatingdigital video value to phosphor light intensity. Oneway to deal with this is to make measurements ofthe light out for every possible digital video valve inand invert the function numerically.
LCD Projectors. Analog-input LCD displays currentlyoffer little advantage in terms of image quality overa CRT display, but the unique problems posed bysome environments such as the intense magnetic fieldsinside a MRI scanner mandate the use of a projector.Apart from CRT-based projectors, there are two typesof projection displays commonly available: those basedon LCDs, and those based on digital light processors(DLPs).
LCD projectors have properties very similar to LCDpanels except that the light source is often an arc lamprather than a cold-cathode fluorescent device, and thepixel processing is more elaborate. Therefore, the same

DISPLAY CHARACTERIZATION 185
5 ms
Video
CRT
LCD
Figure 7. Delay in LCD projection. Diagram showing how the light output from the center of aprojection screen, illuminated by an analog-input LCD projector, varies with time when the patchis nominally illuminated for two frames before being turned off. This is compared to the light froma CRT driven by the same video signal. Note the extra 12-ms delay imposed by the LCD projector’selectronics.
considerations that apply to LCD panels generally applyto LCD projectors as well. Projectors are often usedin conjunction with ‘‘gain’’ screens, which have non-lambertian viewing characteristics, and as for LCD panels,the light that reaches the observer varies with viewingposition.
DLP Projectors. Digital light processing (DLP) projec-tors work by using a two-dimensional array of tinymirrors (digital micromirrors) that can be deflected byabout 20° at high speed; 15 µs switching times are usual.These are used as light valves to direct the light from ahigh-intensity source either through the projection lensor off to the side. A color display is generated eitherby using three of these devices to deflect colored lightfiltered from the main source (as in modern LCD pro-jectors) or by using one array operating at three timesthe net frame rate to deflect colored light provided bya rotating filter wheel. Typically, this rotates at about150 Hz to give a 50 Hz display. The picture breakupthat occurs when the eye makes saccadic movementsmakes projectors based on the filter wheel design difficultto use.
Currently three-mirror DLP projectors are quiteexpensive in comparison to LCD projectors, and many aredesigned for large-scale projection (e.g., digital cinema).Packer et al. (58) evaluate how well a three-mirror DLPdevice conforms to a number of the assumptions of thestandard CRT model.
Plasma. Plasma displays are much more expensive thanCRTs and LCDs but are currently favored by museums(e.g., the Museum of Modern Art and the MetropolitanMuseum of Art in New York City) because the plasmadisplay is both flat like an LCD and nearly lambertian(i.e., emitted light is independent of viewing angle) likea CRT.
Instrumental Considerations
Three types of instrument are typically used to char-acterize display devices: spectroradiometers, colorime-ters, and photometers. Spectroradiometers measure thefull spectral power distribution of light. Colorimeterstypically allow measuring of CIE XYZ tristimulus coor-dinates. Photometers measure only luminance (propor-tional to CIE Y). Zalewski (59) provides a detailed treat-ment of light measurement. Several sources (1,11,60,61;http://psychtoolbox.org/tips/lightmeasure.html) discussinstrumentation for display characterization.
A spectroradiometer provides the most general char-acterization of the spectral properties of a display. Onemay compute cone coordinates or XYZ tristimulus coor-dinates from the spectral power distributions measuredby spectroradiometers. If one wishes to use a descrip-tion of color vision that differs from that specified by theCIE system (e.g., 24,25,27,42,62,63), then it is necessaryto characterize the display by using a spectroradiometer.However, spectroradiometers are expensive (thousandsof dollars), whereas colorimeters often cost less than athousand dollars and the XYZ measurements they pro-vide are sufficient for many applications. Photometersmeasure only luminance and thus are suitable only forapplications where the color of the stimuli need not becharacterized.
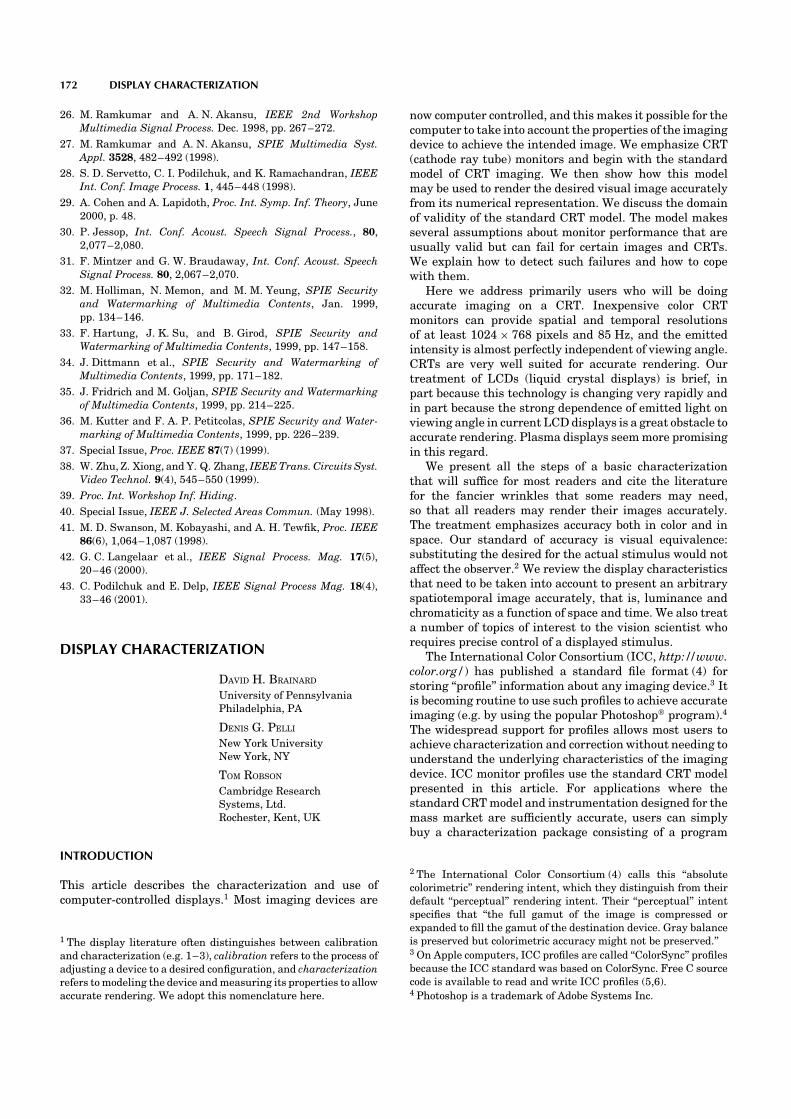
How much instrumental precision is required? Theanswer, of course, depends on the application. A simplecalculation can often be used to convert the effect ofinstrumental error into a form more directly relevantto a given application. As an example, suppose thatwe wish to modulate a uniform field so that only oneof the three classes of cones is stimulated, and themodulation is invisible to the other two. Such ‘‘silentsubstitution’’ techniques are commonly used in visualpsychophysics to allow isolation of individual mechanisms(e.g., individual cone types; see 64,65). Figure 8 shows an
186 DISPLAY CHARACTERIZATION
0.0400 450 500 550
Wavelength (nm)
600 650 700 750
Pow
er o
r se
nsiti
vity
(ar
bitr
ary
units
)
0.2
0.4
0.6
0.8
1.0
Figure 8. CRT red primary emission compared with L conesensitivity. The solid line is a plot of the spectral powerdistribution of a typical CRT red primary. The measurementswere made in David Brainard’s lab and have approximately1-nm resolution. The dashed line is a plot of an estimate (24)of the human L cone spectral sensitivity. Both curves have beennormalized to a maximum of 1. Note that considerable lightpower is concentrated in a region where the slope of the L conesensitivity is steep.
estimate of the spectral sensitivity of the human L conealong with the spectral power distribution of a typicalCRT red phosphor emission. Considerable phosphor poweris concentrated in the spectral interval where the slopeof the L cone sensitivity function is steep. One mightimagine that calculations of the L cone response to lightfrom this phosphor are quite sensitive to imprecisions inthe phosphor measurement. To investigate, we proceededas follows. We started with measurements of a CRT’sphosphor emissions that had roughly a 1-nm resolution.Then, we simulated two types of imprecision. To simulate aloss of spectral resolution, we convolved the initial spectrausing a Gaussian kernel 5 nm wide (standard deviation).To simulate an error in spectral calibration, we shifted thespectra 2 nm toward the longer wavelengths. We computedthree stimulus modulations for each set of simulatedmeasurements. Each modulation was designed to generate20% contrast for one cone type and silence the othertwo. Then, we used the original spectral measurements tocompute the actual effect of the simulated modulations.The effect is very small for the reduced resolution case.The maximum magnitude of modulation in cone classesthat should be silenced is 0.25%. However, the 2-nmwavelength shift had a larger effect. Here, a nominallysilenced cone class can see almost 2% contrast. Forthis application, spectral calibration is more critical thanspectral resolution.
One point that is often overlooked when consideringthe accuracy of colorimeters and photometers is howwell the instrument’s spectral sensitivities match thoseof their target functions: X, Y, and Z color matching
functions for colorimeters or luminance sensitivity (Y) forphotometers. To characterize the accuracy of a photometer,for example, it is typical to weight differences betweeninstrumental and luminance spectral sensitivity at eachwavelength in proportion to luminance sensitivity atthat wavelength. This means that the specified accuracyis predominantly affected by discrepancies betweeninstrumental and luminance sensitivity in the middleof the visible spectrum, where luminance sensitivity ishigh. The specified accuracy is not very sensitive todiscrepancies in the short- or long-wavelength regionsof the spectrum, where luminance sensitivity is low. Aphotometer that is specified to have good agreement withthe luminance sensitivity function will accurately measurethe luminance of a broadband source, but it may performvery poorly when measurements are made of spectrallynarrower light, such as that emitted by CRT phosphors.The indicated luminance in such a situation can be wrongby 50% or more.
A final question that arises when using any type oflight measuring instrument for a CRT is whether theinstrument was designed to measure pulsatile sources.The very short bursts of light emitted as the raster scansthe faceplate of the CRT have peak intensities of 10 to100 times the average intensity. This can distort theresult obtained by using electronics not designed for thispossibility.
Recommended Software
ICC. For many purposes, sufficiently accurate imagingmay be obtained simply by using any available commercialpackage to characterize the CRT and create an ICCprofile and then using an ICC-compatible image displayprogram.
Vision Research. After using a wide variety of softwarepackages (e.g., see directories 66,67) for running visionexperiments, we have come to the conclusion that it is verydesirable that the top level, in which the experimenterdesigns new experiments, be a full-fledged language,preferably interactive, like BASIC or MATLAB. Writingsoftware from scratch is hard. Some packages overcomethis limitation by allowing users to design experiments byjust filling out a form rather than actually programming.However, this limits the experiment to what the authorof the form had in mind and makes it impossible to do areally new experiment. The best approach seems to be toprogram in a general purpose language and write as littlenew code as possible for each new experiment by mod-ifying the most similar existing program. In that spirit,the free Psychophysics Toolbox (http://psychtoolbox.org/)provides a rich set of extensions to MATLAB to allowprecise control and synthesis of visual stimuli withina full-featured interactive programming environment,along with a suite of demo programs (68,69). Psychophys-ica (http://vision.arc.nasa.gov/mathematica/psychophy-sica/), also free, provides similar extensions for Mathe-matica (70).
Rush — ‘‘Hogging’’ the Machine. Today’s popular com-puters interrupt the user’s program frequently to grant

DISPLAY CHARACTERIZATION 187
time to other processes. This is how the computer createsthe illusion of doing everything at once. The difficulty withthis is that the interruptions can cause unwanted pausesin the temporal presentation of a stimulus sequence.Although it is difficult to shut down the interrupting pro-cesses completely, we have found it both possible anddesirable to suppress interrupts, hogging the machine, forthe few seconds it takes to present a visual stimulus. In thePsychophysics Toolbox (see above), this facility is calledRush and allows a bit of MATLAB code to run at highpriority without interruption.
SUMMARY
Today’s graphics cards and CRT monitors offer a cheap,stable, and well-understood technology suited to accuraterendering after characterization in terms of a simplestandard model. This article describes the standard modeland how to use it to characterize CRT displays. Certainstimuli will strain the assumption of pixel independence,but it is easy to test for such failures and often possibleto avoid them. New technologies, particularly LCD, DLP,and plasma displays, are emerging as alternatives to CRTdisplays. Because these technologies are less mature, thereare not yet standard models available for characterizingthem. Development of such models can employ the samerendering intent and color vision theory introduced here,but the specifics of the appropriate device model are likelyto differ. Digital-input LCD displays promise excellentpixel independence but may be difficult to use for accuraterendering because of the high dependence of the emittedlight on the viewing angle.
AcknowledgmentsWe thank J. M. Foley, G. Horwitz, A. W. Ingling, T. Newman,and two anonymous reviewers for helpful comments on themanuscript. More generally, we learned much about monitorsand their characterization from W. Cowan, J. G. Robson, andB. A. Wandell. This work was supported by grant EY10016 toDavid Brainard and EY04432 to Denis Pelli.
BIBLIOGRAPHY
1. D. L. Post, in H. Widdel and D. L. Post, eds., Color inElectronic Displays, Plenum, NY, 1992, pp. 299–312.
2. W. B. Cowan, in M. Bass, ed., Handbook of Optics, vol. 1,Fundamentals, Techniques, and Design, McGraw-Hill, NY,1995, pp. 27.1–27.44.
3. R. Adams and J. Weisberg, GATF Practical Guide to ColorManagement, Graphic Arts Technical Foundation, Sewickley,PA 1998.
4. ICC, Specification ICC.1:1998-09 file format for color profiles,1998, http://www.color.org/profiles.html.
5. G. Gill, ICC File I/O README, http://web.access.net.au/argyll/color.html.
6. D. Wallner, Building ICC Profiles — The Mechanics andEngineering, 2000, http://www.color.org/iccprofiles.html.
7. G. Gill, What’s wrong with the ICC profile format anyway?1999, http://web.access.net.au/argyll/icc problems.html.
8. D. E. Pearson, Transmission and Display of Pictorial Infor-mation, Pentech Press, Wiley, New York, 1975.
9. P. A. Keller, The Cathode-Ray Tube: Technology, History, andApplications, Palisades Press, NY, 1991.
10. T. R. H. Wheeler and M. G. Clark, in H. Widdel and D. L.Post, eds., Color in Electronic Displays, Plenum Press, NY,1992, pp. 221–256.
11. P. A. Keller, Electronic Display Measurement — Concepts,Techniques and Instrumentation, J Wiley, NY, 1997.
12. D. H. Brainard and D. G. Pelli, Raster graphics psy-chophysics bibliography, http://psychtoolbox.org/tips/ras-terbib.html.
13. G. Wyszecki and W. S. Stiles, Color Science — Concepts andMethods, Quantitative Data and Formulae, 2nd ed., J Wiley,NY, 1982.
14. D. H. Brainard, in M. Bass, ed., Handbook of Optics, vol. 1,Fundamentals, Techniques, and Design, McGraw-Hill, NY,1995, pp. 26.1–26.54.
15. P. K. Kaiser and R. M. Boynton, Human Color Vision,2nd ed., Optical Society of America, Washington, DC, 1996.
16. S. Daly, Soc. Inf. Display 2001 Dig. XXXII, 1,200–1,203(2001).
17. R. A. Tyrell, T. B. Pasquale, T. Aten, and E. L. Francis, Soc.Inf. Display 2001 Dig. XXXII, 1,205–1,207 (2001).
18. W. B. Cowan and N. Rowell, Color Res. Appl. Suppl. 11,S33–S38 (1986).
19. D. H. Brainard, Color Res. Appl. 14, 23–34 (1989).20. C. Poynton, Frequently-asked questions about gamma,
http://www.inforamp.net/∼poynton/GammaFAQ.html.21. D. G. Pelli, Spatial Vision 10, 443–446 (1997); http://vision.
nyu.edu/VideoToolbox/PixelIndependence.html.22. A. B. Watson et al., Behav. Res. Methods Instrum. Comp. 18,
587–594 (1986).23. B. A. Wandell, Foundations of Vision, Sinauer, Sunderland,
MA, 1995.24. V. Smith and J. Pokorny, Vision Res. 15, 161–171 (1975).25. P. DeMarco, J. Pokorny, and V. C. Smith, J. Opt. Soc. A 9,
1,465–1,476 (1992).26. CIE, Colorimetry, 2nd ed., Bureau Central de la CIE,
VIENNA, 1986, publication 15.2.27. A. Stockman and L. T. Sharpe, Color and vision database,
http://cvision.ucsd.edu/index.htm.28. D. L. Post and C. S. Calhoun, Color Res. Appl. 14, 172–186
(1989).29. N. P. Lyons and J. E. Farrell, Soc. Inf. Display Int. Sym. Tech.
Dig. 20, 220–223 (1989).30. R. S. Berns, R. J. Motta, and M. E. Gorzynski, Color Res.
Appl. 18, 299–314 (1993).31. A. C. Naiman and W. Makous, SPIE Conf. Human Vision
Visual Process. Digital Display, III, 1666, 1992, 41–56.32. Q. J. Hu and S. A. Klein, Soc. Inf. Display 94 Dig. 25, 19–22
(1994).33. D. H. Brainard, W. A. Brunt, and J. M. Speigle, J. Opt. Soc.
Am. A 14, 2,091–2,110 (1997).34. E. S. Olds, W. B. Cowan, and P. Jolicoeur, J. Opt. Soc. A 16,
1,501–1,505 (1999).35. P. C. Hung, J. Electron. Imaging 2, 53–61 (1993).36. L. T. Maloney and K. Koh, Behav. Res. Methods Instrum.
Comput. 20, 372–389 (1988).37. C. C. Chen, J. M. Foley, and D. H. Brainard, Vision Res. 40,
773–788 (2000).38. A. B. Poirson and B. A. Wandell, Vision Res. 36, 515–526
(1996).39. D. G. Pelli and L. Zhang, Vision Res. 31, 1,337–1,350 (1991).

188 DYE TRANSFER PRINTING TECHNOLOGY
40. C. W. Tyler, Spatial Vision 10, 369–77 (1997).
41. J. B. Mulligan and L. S. Stone, J. Opt. Soc. Am. A 6,1,217–1,227 (1989).
42. W. S. Stiles and J. M. Burch, Optica Acta 6, 1–26 (1958).
43. M. A. Webster and D. I. A. MacLeod, J. Opt. Soc. Am. A 5,1,722–1,735 (1988).
44. J. Pokorny, V. C. Smith, G. Verriest, and A. J. L. G. Pinckers,Congenital and Acquired Color Vision Defects, Grune andStratton, NY, 1979.
45. J. Nathans et al., Science 232, 203–210 (1986).
46. J. Neitz and G. H. Jacobs, Vision Res. 30, 621–636 (1990).
47. J. Winderickx et al., Nature 356, 431–433 (1992).
48. J. Neitz, M. Neitz, and G. H. Jacobs, Vision Res. 33, 117–122(1993).
49. M. Neitz and J. Neitz, Science 267, 1,013–1,016 (1995).
50. J. Carroll, C. McMahon, M. Neitz, and J. Neitz, J. Opt. Soc.A 17, 499–509 (2000).
51. A. G. Shapiro, J. Pokorny, and V. C. Smith, J. Opt. Soc. Am.A 13, 2,319–2,328 (1996).
52. L. J. Fleishman et al., Anim. Behav. 56, 1,035–1,040 (1998).
53. L. J. Hornbeck, Digital light processing for high-brightnesshigh-resolution applications. Texas Instruments Report,1997.
54. R. W. G. Hunt, The Reproduction of Colour, 4th ed., FountainPress, Tolworth, England, 1987.
55. B. A. Wandell and L. D. Silverstein, in S. K. Shevell, ed.,The Science of Color, 2nd ed., Optical Society of America,Washington, DC, 2001.
56. M. D. Fairchild and D. R. Wyble, Colorimetric charac-terization of the Apple Studio Display (Flat PanelLCD). Munsell Color Science Laboratory Report,Rochester Institute of Technology, Rochester, NY, 1998;http://www.cis.rit.edu/mcsl/research/reports.shtml.
57. J. E. Gibson and M. D. Fairchild, Colorimetric characteriza-tion of three computer displays (LCD and CRT). MunsellColor Science Laboratory Report, Rochester Institute ofTechnology, Rochester, NY, 2001; http://www.cis.rit.edu/mcsl/research/reports.shtml.
58. O. Packer et al., Vision Res. 41, 427–439 (2001).
59. E. F. Zalewski, in M. Bass, ed., Handbook of Optics, vol. 2,McGraw-Hill, NY, 1995, pp. 24.3–24.51.
60. R. S. Berns, M. E. Gorzynski, and R. J. Motta, Color Res.Appl. 18, 315–325 (1993).
61. D. H. Brainard and D. G. Pelli, Light measurement instru-mentation, http://psychtoolbox.org/tips/lightmeasure.html.
62. J. J. Vos, Color Res. Appl. 3, 125–128 (1978).
63. A. Stockman, D. I. A. MacLeod, and N. E. Johnson, J. Opt.Soc. Am. A 10(12), 2,491–2,521 (1993).
64. O. Estevez and H. Spekreijse, Vision Res. 22, 681–691 (1982).
65. D. H. Brainard, in P. K. Kaiser and R. M. Boynton, eds.,Human Color Vision, Optical Society of America, Washington,DC, 1996, pp. 563–579.
66. LTSN Psychology, http://www.psychology.ltsn.ac.uk/sear-ch resources.html.
67. F. Florer, Powermac software for experimental psychology,http://vision.nyu.edu/Tips/FaithsSoftwareReview.html.
68. D. H. Brainard, Spatial Vision 10, 433–436 (1997).
69. D. G. Pelli, Spatial Vision 10, 437–442 (1997).
70. A. B. Watson and J. A. Solomon, Spatial Vision 10, 447–466(1997).
DYE TRANSFER PRINTING TECHNOLOGY
NOBUHITO MATSUSHIRO
Okidata CorporationGunma, Japan
INTRODUCTION
This article describes the structure and operation ofdye-sublimation thermal-transfer printing technology. Inaddition to the structure and operation, the capabilitiesand limitations of the technology such as resolution, speed,intensity levels, color accuracy, and size are described.Though the subject of this chapter is the dye-sublimationprinter, the details of other thermal transfer printersare included to assist in understanding and comparingthe capabilities and limitations of the dye-sublimationprinter.
HISTORY OF PRINTERS USING DYE TRANSFER
Dye-transfer printers form images on sheets usingdifferent types of energy such as mechanical pressure,heat, and light. Impact printers use mechanical pressurewhereas nonimpact printers use heat and light. In thisarticle, the histories of both impact and nonimpact printersare overviewed. Which is important to understand theposition of the dye-sublimation printer in the history ofdye-transfer printers. The history following includes bothimpact printers and nonimpact printers which include thedye-sublimation printer.
Impact Printers Using Dye Transfer
1960 Development of the horizontal chain line printer,the original line printer.
1961 The golf ball printer established the position ofthe serial impact printer.
1970 Development of the daisy wheel printer, a type-face-font serial impact printer, the successor tothe golf ball printer.
1970 The dot matrix printer is the mainstay of currentserial impact printers.
Nonimpact Printers Using Dye Transfer
1930s Development of wax-type thermal-transferrecording paper.Development of the early sublimation dyetransfer method.
1940s Development of heat-sensitive paper usingalmost colorless metallic salts.
1950s Commercialization of colorant melting by expo-sure to infrared radiation.Disclosure of the patent for the thermal printer.Development of a prototype electrosensitivetransfer printer.
1960s Development of the leuco-dye-based heat-sensitive recording sheet, a current mainstayin the market.
1969 Development of the heat-mode laser-basedtransfer printer.