bp p.l.c. group results first quarter 2012 · settlement agreements with the plaintiffs’ steering...
TRANSCRIPT

1
BP p.l.c. Group results First quarter 2012
London 1 May 2012
FOR IMMEDIATE RELEASE
First Fourth First quarter quarter quarter 2012 2011 2011 $ million Profit for the period(a) 5,915 7,685 7,254 Inventory holding (gains) losses, net of tax (986) (79) (1,643) Replacement cost profit(b) 4,929 7,606 5,611 Net (favourable) unfavourable impact of non-operating items and fair value accounting effects, net of tax(c) (130) (2,620) (107) Underlying replacement cost profit(b) 4,799 4,986 5,504
Replacement cost profit - per ordinary share (cents) 25.97 40.10 29.82 - per ADS (dollars) 1.56 2.41 1.79 Underlying replacement cost profit - per ordinary share (cents) 25.29 26.28 29.25 - per ADS (dollars) 1.52 1.58 1.76
BP’s first-quarter replacement cost (RC) profit was $4,929 million, compared with $5,611 million a year ago. After adjusting for a net credit from non-operating items of $185 million and net unfavourable fair value accounting effects of $55 million (both on a post-tax basis), underlying RC profit for the first quarter was $4,799 million, compared with $5,504 million for the same period last year. RC profit or loss for the group, underlying RC profit or loss and fair value accounting effects are non-GAAP measures and further information is provided on pages 4, 18 and 20.
Non-operating items for the first quarter included a gain of $933 million relating to the sale of businesses and fixed assets and a loss of $233 million relating to impairment and losses on sale of businesses and fixed assets(c). All amounts relating to the Gulf of Mexico oil spill have been treated as non-operating items, with a de minimis net impact on the results this quarter. For further information on the Gulf of Mexico oil spill and its consequences see pages 2 – 3, Note 2 on pages 22 – 26, Legal proceedings on pages 31 – 32 and Legal proceedings on pages 160 – 164 of BP’s Annual Report and Form 20-F 2011.
Finance costs and net finance income or expense relating to pensions and other post-retirement benefits were $230 million for the first quarter, compared with $239 million for the same period last year.
The effective tax rate on RC profit for the first quarter was 33% compared with 37% a year ago. For the first quarter of 2011, the effective tax rate included the impact of a $683-million one-off deferred tax adjustment in respect of the increase in the supplementary charge on UK oil and gas production. Excluding this impact, the effective tax rate for the first quarter of 2011 was 29%. The increase in the effective tax rate for the first quarter of 2012 compared with the first quarter of 2011 (excluding the impact of the one-off deferred tax adjustment) is mainly due to the impact of the divestment programme in 2011.
Including the impact of the Gulf of Mexico oil spill, net cash provided by operating activities for the first quarter was $3.4 billion, compared with $2.4 billion in the same period last year. The amount for the first quarter of 2012 included a net cash outflow of $1.2 billion relating to the Gulf of Mexico oil spill (first quarter 2011, $2.8 billion outflow).
Net debt at the end of the quarter was $31.2 billion, compared with $27.5 billion a year ago. The ratio of net debt to net debt plus equity was 20.7% compared with 21.0% a year ago. Net debt is a non-GAAP measure. See page 5 for further information.
Total capital expenditure for the first quarter was $5.6 billion, almost all of which was organic(d). Disposal proceeds were $1.3 billion for the quarter. Since the start of 2010, we have announced disposals for a total of around $23 billion.
The quarterly dividend expected to be paid on 27 June 2012 is 8 cents per share ($0.48 per ADS). The corresponding amount in sterling will be announced on 13 June 2012. A scrip dividend alternative is available, allowing shareholders to elect to receive their dividend in the form of new ordinary shares and ADS holders in the form of new ADSs. Details of the scrip dividend programme are available at bp.com/scrip.
(a) Profit attributable to BP shareholders. (b) See footnote (a) on page 4 for definitions of RC profit and underlying RC profit. (c) See pages 19 and 20 respectively for further information on non-operating items and fair value accounting effects. (d) Organic capital expenditure excludes acquisitions and asset exchanges (see page 17).
The commentaries above and following are based on RC profit and should be read in conjunction with the cautionary statement on page 12.

2
Gulf of Mexico oil spill Completing the response We remain committed to meeting our responsibilities to the US federal, state and local governments and communities of the Gulf Coast following the Deepwater Horizon accident and oil spill (the Incident). During the first quarter of 2012, BP, working under the direction of the US Coast Guard’s Federal On-Scene Coordinator (FOSC), and collaboratively with the individual federal and state entities, continued to patrol and maintain areas of the shoreline impacted by the oil spill. These shoreline segments will continue to be patrolled and maintained until they meet the applicable clean-up standards. Economic restoration Settlement agreements with the Plaintiffs’ Steering Committee On 18 April 2012, BP reached definitive and fully documented agreements with the Plaintiffs’ Steering Committee (PSC) in the Multi-District Litigation pending in New Orleans (MDL 2179), subject to court approval, to resolve the substantial majority of legitimate private economic loss and medical claims stemming from the Incident. The settlement approval process began with the parties’ request that the court grant preliminary approval of the settlement agreements. The parties have also asked the court to approve proposed plans to notify class members of their rights under the settlement agreements and to schedule fairness hearings. Once these hearings have taken place, the court will decide whether to grant final approval of each settlement agreement. The timing of both the fairness hearings and future MDL 2179 proceedings will be determined by the court. The proposed settlement provides for a transition from the Gulf Coast Claims Facility (GCCF). On 8 March, a transitional claims process for economic loss claims commenced operation while the infrastructure for the new court-supervised claims process is put in place. BP estimates that the settlement will cost approximately $7.8 billion, including administration costs, plaintiffs’ attorneys’ fees and expenses. The cost is expected to be paid from the $20-billion Deepwater Horizon Oil Spill Trust fund (Trust). While BP has sought to reliably estimate the cost of the settlement agreements, it is possible that the actual cost could be higher or lower than this estimate depending on the outcomes of the court-supervised claims processes. Claims update To support the economic restoration of the impacted Gulf Coast communities, as at 31 March 2012, BP had paid a total of $8.3 billion for individual, business and government entity claims, advances and other payments, including payments made by BP prior to the establishment of the Trust. As at 31 March 2012, $6.6 billion in total had been paid to individual and business claimants, and BP had paid federal, state and local government entities $1.4 billion for claims and advances. BP has also paid an additional $319 million of contributions, settlements and other payments for research, tourism, seafood testing and marketing, and behavioural health. From its inception in August 2010 until 7 March 2012, the GCCF received a total of 1,059,873 claims from 574,379 claimants and paid out over $6.1 billion to individuals and businesses. A total of 195,438 final offers were accepted by claimants with 195,085 final payments issued and an additional 353 final payments pending. From 8 March 2012 to 18 April 2012, the date that definitive agreements were reached, the transitional court-supervised claims facility paid out more than $168 million in economic loss claims. Environmental restoration During the first quarter we continued to work with scientists and trustee agencies through the Natural Resource Damages (NRD) assessment process to identify natural resources that may have been exposed to oil or otherwise impacted by the oil spill, and to look for evidence of injury. To date, BP has paid approximately $675 million for NRD assessment efforts. Under an agreement signed with federal and state agencies in April 2011, BP voluntarily committed to provide up to $1 billion to fund early restoration projects aimed at accelerating restoration efforts in the Gulf coast areas that were impacted by the accident. The agreement enables work on restoration projects to begin at the earliest opportunity, before funding is required by the Oil Pollution Act 1990 (OPA 90). These projects will be funded from the Trust. The Phase 1 Early Restoration Plan was finalized on 18 April 2012 by the Natural Resource Damage Assessment (NRDA) Trustee Council following extensive public review. This plan includes eight projects along the Gulf Coast with a total estimated cost of approximately $60 million. The NRDA trustees are working to move the next phase of early restoration projects forward. Collectively, the projects are intended to restore and enhance wildlife and habitats, and provide additional access for recreational use.

3
Gulf of Mexico oil spill (continued)
Financial update The group income statement includes a pre-tax credit of $24 million for the first quarter in relation to the Incident. This primarily reflects a credit relating to certain claims administration costs now expected to be paid from the Trust, partially offset by an increase in the provision for the costs of patrolling and maintenance of shoreline, and functional expenses of the Gulf Coast Restoration Organization (GCRO). The total cumulative charge recognized to date for the incident amounts to $37.2 billion. The total amounts that will be paid by BP in relation to all obligations relating to the oil spill are subject to significant uncertainty as described further in Note 2 on pages 22 – 26. Trust update During the first quarter, BP made contributions totalling $1.5 billion to the trust fund, including a $250-million cash settlement received in January from Cameron. As at 31 March 2012, BP’s cumulative contributions to the Trust amounted to $16.6 billion. Payments from the Trust during the first quarter were $494 million, consisting of $353 million paid for individual and business claims, $62 million for NRD assessment costs, and $79 million for state and local government claims and other resolved items. As at 31 March 2012, the cumulative amount paid from the Trust since its inception was $7.2 billion. As at 31 March 2012, the cumulative charges for provisions to be paid from the Trust and the associated reimbursement asset recognized amounted to $17.1 billion. This represents an increase of $0.5 billion for the quarter, including updates to provisions for claims payments, estimated NRD assessment costs and costs of claims administration. A further $2.9 billion could be provided in subsequent periods for items covered by the Trust, with no net impact on the income statement. Legal proceedings and investigations In addition to the information provided on page 2 relating to the settlement agreements with the PSC, see also Legal proceedings on pages 31 – 32 herein, and Gulf of Mexico oil spill on pages 76 – 79 and Legal proceedings on pages 160 – 164 of BP’s Annual Report and Form 20-F 2011 for details of legal proceedings, including external investigations relating to the Incident.

4
Analysis of underlying RC profit and RC profit before interest and tax and reconciliation to profit for the period
First Fourth First quarter quarter quarter $ million 2012 2011 2011 Underlying RC profit before interest and tax(a) Upstream 6,290 5,924 6,684 Downstream 924 759 2,196 TNK-BP(b) 1,157 987 1,127 Other businesses and corporate (436) (618) (297) Consolidation adjustment - unrealized profit in inventory(c) (541) 127 (542) Underlying RC profit before interest and tax 7,394 7,179 9,168 Finance costs and net finance income or expense relating to pensions and other post-retirement benefits (224) (248) (223) Taxation on an underlying RC basis (2,310) (1,856) (3,380) Minority interest (61) (89) (61) Underlying RC profit attributable to BP shareholders 4,799 4,986 5,504
Non-operating items and fair value accounting effects(a)
Upstream 689 640 739 Downstream (68) (195) (117) TNK-BP, net of tax (93) – – Other businesses and corporate (236) (454) (181) Gulf of Mexico oil spill response(d) 30 4,108 (384) Total before interest and taxation 322 4,099 57 Finance costs(e) (6) (13) (16) Taxation credit (charge)(f) (186) (1,466) 66 Total after taxation for the period 130 2,620 107
RC profit before interest and tax(a) Upstream 6,979 6,564 7,423 Downstream 856 564 2,079 TNK-BP(b) 1,064 987 1,127 Other businesses and corporate (672) (1,072) (478) Gulf of Mexico oil spill response(d) 30 4,108 (384) Consolidation adjustment - unrealized profit in inventory(c) (541) 127 (542) RC profit before interest and tax 7,716 11,278 9,225 Finance costs and net finance income or expense relating to pensions and other post-retirement benefits (230) (261) (239) Taxation on a RC basis (2,496) (3,322) (3,314) Minority interest (61) (89) (61) RC profit attributable to BP shareholders 4,929 7,606 5,611 Inventory holding gains (losses) 1,437 101 2,412 Taxation (charge) credit on inventory holding gains and losses (451) (22) (769) Profit for the period attributable to BP shareholders 5,915 7,685 7,254
(a) Replacement cost (RC) profit or loss reflects the replacement cost of supplies and is arrived at by excluding inventory holding gains
and losses from profit or loss. RC profit or loss is the measure of profit or loss for each operating segment that is required to be disclosed under International Financial Reporting Standards (IFRS). RC profit or loss for the group is not a recognized GAAP measure. For further information on RC profit or loss, see page 18.
Underlying RC profit or loss is RC profit or loss after adjusting for non-operating items and fair value accounting effects. Underlying RC profit or loss and fair value accounting effects are not recognized GAAP measures. On pages 19 and 20 respectively, we provide additional information on the non-operating items and fair value accounting effects that are used to arrive at underlying RC profit or loss in order to enable a full understanding of the events and their financial impact. BP believes that underlying RC profit or loss is a useful measure for investors because it is a measure closely tracked by management to evaluate BP’s operating performance and to make financial, strategic and operating decisions and because it may help investors to understand and evaluate, in the same manner as management, the underlying trends in BP’s operational performance on a comparable basis, period on period, by adjusting for the effects of these non-operating items and fair value accounting effects.
(b) Net of finance costs, taxation and minority interest. (c) The consolidation adjustment in the first quarter of 2012 was impacted by higher margins (driven both by a lower average cost of
production and higher prices) and an increase in the volume of equity crude within the US refining and marketing system. In the first quarter of 2011, it was impacted by increases in volume (particularly in Europe) and higher prices.
(d) See Note 2 on pages 22 – 26 for further information on the accounting for the Gulf of Mexico oil spill response. (e) Finance costs relate to the Gulf of Mexico oil spill. See Note 2 on pages 22 – 26 for further details. (f) Tax is calculated by applying discrete quarterly effective tax rates (excluding the impact of the Gulf of Mexico oil spill, equity-
accounted earnings from the first quarter 2012, and, for the first quarter 2011, the impact of a $683-million one-off deferred tax adjustment in respect of an increase in the supplementary charge on UK oil and gas production) on group profit or loss. However, the US statutory tax rate has been used for recoveries relating to the Gulf of Mexico oil spill and expenditures that qualify for tax relief. Excludes tax relating to TNK-BP items, which are reported after tax in the BP group income statement.

5
Per share amounts
First Fourth First quarter quarter quarter 2012 2011 2011 Per ordinary share (cents) Profit for the period 31.17 40.51 38.55 RC profit for the period 25.97 40.10 29.82 Underlying RC profit for the period 25.29 26.28 29.25
Per ADS (dollars) Profit for the period 1.87 2.43 2.31 RC profit for the period 1.56 2.41 1.79 Underlying RC profit for the period 1.52 1.58 1.76
See Note 6 on page 29 for details of the calculation of earnings per share.
Net debt ratio – net debt: net debt + equity
First Fourth First quarter quarter quarter 2012 2011 2011 $ million Gross debt 46,470 44,213 47,102 Less: fair value asset of hedges related to finance debt 1,224 1,133 870 45,246 43,080 46,232 Less: Cash and cash equivalents 14,092 14,067 18,726 Net debt 31,154 29,013 27,506 Equity 119,220 112,482 103,313 Net debt ratio 20.7% 20.5% 21.0%
See Note 7 on page 30 for further details on finance debt. Net debt and net debt ratio are non-GAAP measures. Net debt includes the fair value of associated derivative financial instruments that are used to hedge foreign exchange and interest rate risks relating to finance debt, for which hedge accounting is claimed. The derivatives are reported on the balance sheet within the headings ‘Derivative financial instruments’. We believe that net debt and net debt ratio provide useful information to investors. Net debt enables investors to see the economic effect of gross debt, related hedges and cash and cash equivalents in total. The net debt ratio enables investors to see how significant net debt is relative to equity from shareholders.
Dividends
Dividends payable BP today announced a dividend of 8 cents per ordinary share expected to be paid in June. The corresponding amount in sterling will be announced on 13 June 2012, calculated based on the average of the market exchange rates for the four dealing days commencing on 7 June 2012. Holders of American Depositary Shares (ADSs) will receive $0.48 per ADS. The dividend is due to be paid on 27 June 2012 to shareholders and ADS holders on the register on 11 May 2012. A scrip dividend alternative is available, allowing shareholders to elect to receive their dividend in the form of new ordinary shares and ADS holders in the form of new ADSs. Details of the first-quarter dividend and timetable are available at bp.com/dividends and details of the scrip dividend programme are available at bp.com/scrip. Dividends paid
First Fourth First quarter quarter quarter 2012 2011 2011 Dividends paid per ordinary share cents 8.000 7.000 7.000 pence 5.0958 4.4694 4.3372 Dividends paid per ADS (cents) 48.00 42.00 42.00 Scrip dividends Number of shares issued (millions) 39.6 11.4 66.6 Value of shares issued ($ million) 306 83 510

6
Upstream
First Fourth First quarter quarter quarter 2012 2011 2011 $ million Profit before interest and tax 6,895 6,551 7,479 Inventory holding (gains) losses 84 13 (56) RC profit before interest and tax 6,979 6,564 7,423 Net (favourable) unfavourable impact of non-operating items and fair value accounting effects (689) (640) (739) Underlying RC profit before interest and tax(a) 6,290 5,924 6,684
(a) See footnote (a) on page 4 for information on underlying RC profit and see page 7 for a reconciliation to segment RC profit before
interest and tax by region.
With effect from 1 January 2012, the Exploration and Production segment was separated to form two new operating segments, Upstream and TNK-BP, reflecting the way in which our investment in TNK-BP is now managed. Comparative data has been restated to reflect this change.
The replacement cost profit before interest and tax for the first quarter in Upstream was $6,979 million, compared with $7,423 million for the same period in 2011. The first quarter of 2012 benefited from a net non-operating credit of $822 million, arising primarily due to gains on disposals as a result of the ongoing asset divestment programme, partly offset by losses on embedded derivatives. A year ago, there were net non-operating gains of $710 million. Fair value accounting effects in the first quarter had an unfavourable impact of $133 million, compared with a favourable impact of $29 million in the same period a year ago.
After adjusting for non-operating items and fair value accounting effects, the underlying replacement cost profit before interest and tax for the first quarter was $6,290 million, compared with $6,684 million a year ago. The decrease was primarily due to higher costs, (reflecting increased activity levels, sector inflationary impacts, and higher depreciation, depletion and amortization), the impact of the divestment programme and the impact of lower production volumes from higher margin areas, partly offset by higher realizations and a higher contribution from gas marketing and trading.
Production for the quarter was 2,452mboe/d, 6% lower than the first quarter 2011. After adjusting for the effect of divestments, and entitlement impacts in our production-sharing agreements (PSAs), production increased slightly year on year. This primarily reflects stronger performance in Angola and new production from India, offset by production decline in the Gulf of Mexico, which continues to be impacted by the drilling moratorium in 2010 and 2011.
Looking ahead, we expect second-quarter reported production to be lower, and costs to be higher, as a result of normal seasonal turnaround activity concentrated on high-margin production in the Gulf of Mexico at Atlantis, Mad Dog and Holstein.
We continued to make strategic progress during the first quarter.
We completed the sale of our interests in the Hugoton Jayhawk gas processing plant and associated producing gas fields in Kansas to LINN Energy Holdings, LLC for $1.2 billion in cash.
The Brazilian National Petroleum Agency approved our farm-in to four deepwater exploration and production concessions operated by Petrobras in the Brazilian equatorial margin. We are taking a 40% interest in each of the blocks, located in the Barreirinhas and Ceará basins and covering a total area of 2,100 square kilometres.
We reached agreement with the Associated Landowners of the Ohio Valley to establish a position of 300 square kilometres in northeast Ohio for future oil and gas production in the Utica/Point Pleasant shale formation.
We agreed to sell our interests in our southern gas assets in the UK North Sea to Perenco UK Ltd for $400 million in cash. Completion of the sale, which is expected before the end of 2012, is subject to a number of third-party and regulatory approvals.
Together with other Alaska North Slope leaseholders, we settled a six-year-old legal dispute with the state of Alaska over the pace and method of development of the Point Thomson Unit (PTU) (BP 32%), east of Prudhoe Bay on the North Slope of Alaska. The dispute arose over the termination of the PTU by the State of Alaska Department of Natural Resources in November 2006. The settlement means that BP can explore further options to commercialize gas condensate and natural gas from the field.
In Uruguay we were successful in the recent exploration licence round, winning three licence blocks covering 26,000 square kilometres in water depths ranging from 50 to 2,000 metres. Confirmation of the licences, which is subject to government approval, is expected by the end of the third quarter of 2012.
In April, we completed our disposal of the Canadian natural gas liquids (NGL) business to Plains Midstream Canada ULC, a wholly-owned subsidiary of Plains All American Pipeline, L.P.
On 17 April, the Shah Deniz consortium (BP 25.5% and operator) announced that the decision had been taken to start the front-end engineering and design on the Shah Deniz Stage 2 project intended to bring gas from the Caspian Sea to markets in Turkey and Europe.
Today we are announcing our intention to sell certain non-strategic assets in the Gulf of Mexico. These include our interests in the Marlin, Horn Mountain, Holstein, Ram Powell and Diana Hoover fields.

7
Upstream
First Fourth First $ million quarter quarter quarter Underlying RC profit before interest and tax 2012 2011 2011 By region
US 1,658 1,310 1,846 Non-US 4,632 4,614 4,838 6,290 5,924 6,684 Non-operating items US 947 831 4 Non-US (125) (247) 706 822 584 710 Fair value accounting effects(a) US (71) 17 25 Non-US (62) 39 4 (133) 56 29 RC profit before interest and tax US 2,534 2,158 1,875 Non-US 4,445 4,406 5,548 6,979 6,564 7,423
Exploration expense US 62 80 308 Non-US(b) 198 262 91 260 342 399 Production (net of royalties)(c) Liquids (mb/d)(d) US 454 439 523 Europe 123 145 166 Rest of World 671 687 725
1,248 1,271 1,414 Natural gas (mmcf/d) US 1,820 1,817 1,905 Europe 500 497 373 Rest of World 4,665 4,617 4,589
6,985 6,931 6,867 Total hydrocarbons (mboe/d)(e) US 768 752 851 Europe 209 230 230 Rest of World 1,475 1,484 1,517 2,452 2,466 2,598 Average realizations(f) Total liquids ($/bbl) 108.13 101.84 93.93 Natural gas ($/mcf) 4.68 5.07 4.21 Total hydrocarbons ($/boe) 64.02 63.49 59.00
(a) These effects represent the favourable (unfavourable) impact relative to management’s measure of performance. Further
information on fair value accounting effects is provided on page 20. (b) First quarter 2011 includes $44 million classified within the ‘other’ category of non-operating items. (c) Includes BP’s share of production of equity-accounted entities. (d) Crude oil and natural gas liquids. (e) Natural gas is converted to oil equivalent at 5.8 billion cubic feet = 1 million barrels. (f) Based on sales of consolidated subsidiaries only – this excludes equity-accounted entities.
Because of rounding, some totals may not agree exactly with the sum of their component parts.

8
Downstream
First Fourth First quarter quarter quarter 2012 2011 2011 $ million Profit before interest and tax 2,351 657 4,367 Inventory holding (gains) losses (1,495) (93) (2,288) RC profit before interest and tax 856 564 2,079 Net (favourable) unfavourable impact of non-operating items and fair value accounting effects 68 195 117 Underlying RC profit before interest and tax(a) 924 759 2,196
(a) See footnote (a) on page 4 for information on underlying RC profit and see page 9 for a reconciliation to segment RC profit before
interest and tax by region and by business. With effect from 1 January 2012, we are reporting the Refining and Marketing segment as Downstream, with no changes in the composition of the segment. The replacement cost profit before interest and tax for the first quarter was $856 million, compared with $2,079 million for the same period last year. The decrease was primarily due to reduced contributions from the fuels and petrochemicals businesses. The first-quarter result included a net non-operating charge of $106 million, compared with a net charge of $17 million for the same period a year ago. Fair value accounting effects had a favourable impact of $38 million for the first quarter, compared with an unfavourable impact of $100 million in the first quarter of 2011. After adjusting for non-operating items and fair value accounting effects, the underlying replacement cost profit before interest and tax for the first quarter was $924 million, compared with $2,196 million a year ago. Replacement cost profit before interest and tax for the fuels, lubricants and petrochemicals businesses is set out on page 9. The fuels business had a challenging first quarter, delivering an underlying replacement cost profit before interest and tax of $487 million compared with $1,305 million in the same quarter last year in a broadly similar refining environment. Compared with the same period last year we continued to benefit from strong refining feedstock optimization in the US Midwest due to high refinery availability and BP’s location advantage in accessing WTI-priced crude grades. This benefit was, however, more than offset by a significantly weaker performance from supply and trading, unfavourable local crude differentials in Europe, a difficult fuels marketing environment resulting from weaker demand, and the impact of the temporary shut-down of our Cherry Point refinery following a fire in February. The lubricants business delivered an underlying replacement cost profit before interest and tax of $325 million in the first quarter compared with $372 million in the same quarter last year reflecting robust performance despite weak demand in some OECD markets and continued high base oil prices. The petrochemicals business delivered an underlying replacement cost profit before interest and tax of $112 million in the first quarter compared with $519 million in the same period last year. This reflects a challenging margin environment compared with the particularly strong aromatics margins a year ago, although we have seen volumes improve from the low levels in the fourth quarter as a result of improved demand and higher availability. Looking ahead to the second quarter, we expect refining margins to improve in line with seasonal trends and fuels marketing volumes and petrochemicals margins to remain subdued given the difficult economic conditions. The Cherry Point refinery is expected to resume full operations in May having completed both repairs and the scheduled second-quarter turnaround. We continue to progress our plans for the sale of our Texas City refinery and the southern part of the US West Coast fuels value chain, including the Carson refinery, and are aiming to announce the sales by the end of 2012. During the first quarter, we received regulatory approval for the purchase of aviation fuels assets at seven Brazilian airports from Shell and Cosan Industria e Commercio, which we expect to complete in the second quarter of 2012.

9
Downstream
First Fourth First $ million quarter quarter quarter Underlying RC profit before interest and tax - by region 2012 2011 2011 US 289 195 704 Non-US 635 564 1,492 924 759 2,196 Non-operating items US (88) (123) (16) Non-US (18) (17) (1) (106) (140) (17) Fair value accounting effects(a) US (43) (41) (48) Non-US 81 (14) (52) 38 (55) (100) RC profit before interest and tax US 158 31 640 Non-US 698 533 1,439 856 564 2,079
Underlying RC profit before interest and tax - by business(b)(c)
Fuels 487 400 1,305 Lubricants 325 263 372 Petrochemicals 112 96 519 924 759 2,196 Non-operating items and fair value accounting effects(a) Fuels (68) (206) (130) Lubricants – 11 13 Petrochemicals – – – (68) (195) (117) RC profit before interest and tax(b)(c) Fuels 419 194 1,175 Lubricants 325 274 385 Petrochemicals 112 96 519 856 564 2,079
BP Average refining marker margin (RMM) ($/bbl)(d) 11.60 9.10 11.02
Refinery throughputs (mb/d) US 1,218 1,352 1,194 Europe 775 790 768 Rest of World 277 312 307 2,270 2,454 2,269 Refining availability (%)(e) 94.9 95.3 93.9
Marketing sales volumes (mb/d)(f) US 1,349 1,409 1,375 Europe 1,216 1,302 1,267 Rest of World 574 607 610 3,139 3,318 3,252 Trading/supply sales 2,380 2,515 2,256 Total refined product sales 5,519 5,833 5,508 Petrochemicals production (kte) US 1,078 1,001 1,135 Europe(c) 1,011 864 985 Rest of World 1,817 1,715 1,918 3,906 3,580 4,038
(a) Fair value accounting effects represent the favourable (unfavourable) impact relative to management’s measure of performance. For
Downstream, these arise solely in the fuels business. Further information is provided on page 20. (b) Segment-level overhead expenses are included in the fuels business result. (c) BP’s share of income from petrochemicals at our Gelsenkirchen and Mülheim sites in Germany is reported in the fuels business. (d) The RMM is the average of regional indicator margins weighted for BP’s crude refining capacity in each region. They may not be
representative of the margins achieved by BP in any period because of BP’s particular refinery configurations and crude and product slate. The quarterly regional marker margins can be found on bp.com and are updated weekly.
(e) Refining availability represents Solomon Associates’ operational availability, which is defined as the percentage of the year that a unit is available for processing after subtracting the annualized time lost due to turnaround activity and all planned mechanical, process and regulatory maintenance downtime.
(f) Marketing sales do not include volumes relating to crude oil.

10
TNK-BP(a)
First Fourth First
quarter quarter quarter 2012 2011 2011
$ million Profit before interest and tax 1,481 1,489 1,526 Finance costs (36) (27) (35) Taxation (231) (363) (246) Minority interest (124) (91) (59)
Net income (BP share)(b) 1,090 1,008 1,186 Inventory holding (gains) losses, net of tax (26) (21) (59) Net income on a RC basis 1,064 987 1,127 Net charge (credit) for non-operating items(c), net of tax 93 – –
Net income on an underlying RC basis(d) 1,157 987 1,127
Cash flow Dividends received 690 1,688 –
Production (net of royalties) (BP share) Crude oil (mb/d) 879 886 856 Natural gas (mmcf/d) 813 783 719 Total hydrocarbons (mboe/d)(e) 1,019 1,021 980
Balance sheet 31 March 31 December 2012 2011 Investments in associates 10,621 10,013
(a) All amounts shown relate to BP’s 50% share in TNK-BP. (b) TNK-BP is an associate accounted for using the equity method and therefore BP's share of TNK-BP's earnings after interest and tax
is included in the group income statement within BP's profit before interest and tax. (c) Disclosure of non-operating items for TNK-BP began in the first quarter of 2012. (d) See footnote (a) on page 4 for information on underlying RC profit. (e) Natural gas is converted to oil equivalent at 5.8 billion cubic feet = 1 million barrels.
With effect from 1 January 2012, the Exploration and Production segment was separated to form two new operating segments, Upstream and TNK-BP, reflecting the way in which our investment in TNK-BP is now managed. The net income on a replacement cost basis from BP's investment in TNK-BP for the first quarter was $1,064 million, compared with $1,127 million for the same period a year ago. The first-quarter result included a non-operating impairment charge of $93 million after tax, relating to the temporary shutdown of the Lisichansk refinery in the Ukraine due to deteriorating economic conditions. Prior to this quarter, non-operating items relating to BP's investment in TNK-BP were not identified or disclosed. The net income on an underlying replacement cost basis from BP’s investment in TNK-BP for the first quarter was $1,157 million, compared with $1,127 million for the same period in 2011. The primary factors impacting the first-quarter result, compared with the same period last year, were increased realizations offset by cost inflation and increased production taxes. Production for the quarter was 1,019mboe/d, 4% higher than the first quarter of 2011. After adjusting for the effect of the acquisition of BP's upstream interests in Vietnam and Venezuela, the increase was 1.6%. This increase arises due to the ramp-up of recent new developments, partially offset by a decline in mature fields.
11
Other businesses and corporate
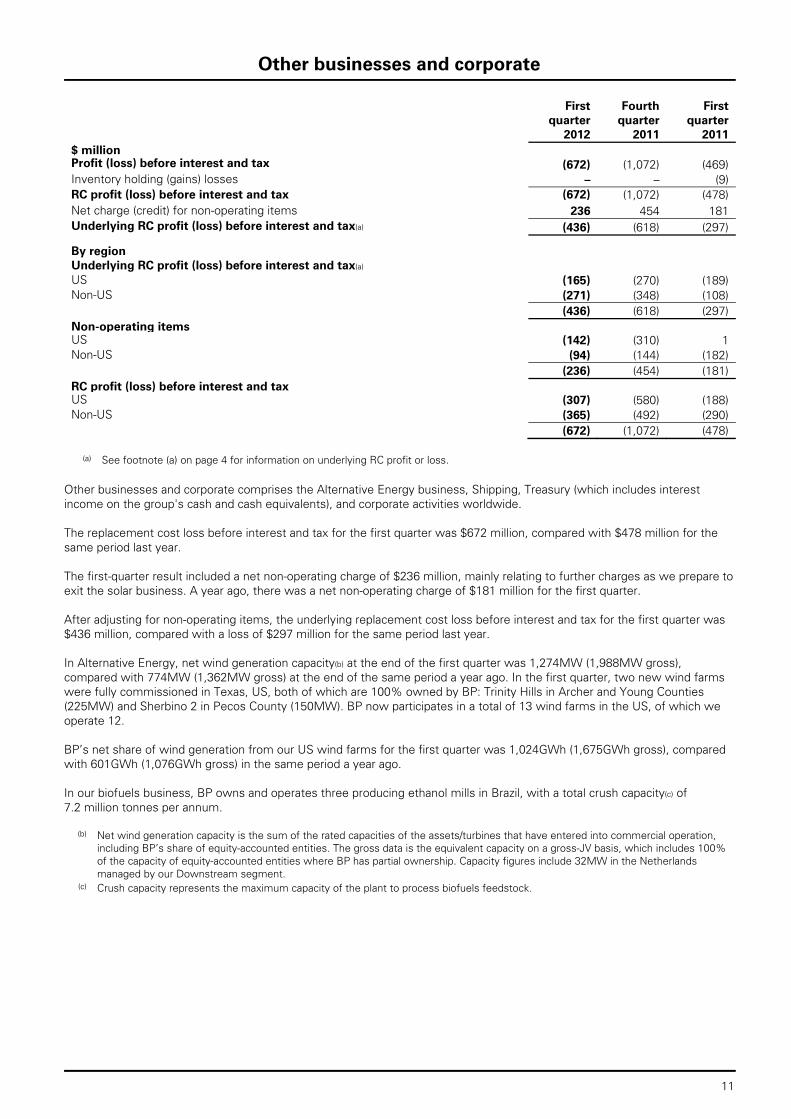
First Fourth First quarter quarter quarter 2012 2011 2011 $ million Profit (loss) before interest and tax (672) (1,072) (469) Inventory holding (gains) losses – – (9) RC profit (loss) before interest and tax (672) (1,072) (478) Net charge (credit) for non-operating items 236 454 181 Underlying RC profit (loss) before interest and tax(a) (436) (618) (297)
By region Underlying RC profit (loss) before interest and tax(a) US (165) (270) (189) Non-US (271) (348) (108) (436) (618) (297) Non-operating items US (142) (310) 1 Non-US (94) (144) (182) (236) (454) (181) RC profit (loss) before interest and tax US (307) (580) (188) Non-US (365) (492) (290) (672) (1,072) (478)
(a) See footnote (a) on page 4 for information on underlying RC profit or loss.
Other businesses and corporate comprises the Alternative Energy business, Shipping, Treasury (which includes interest income on the group's cash and cash equivalents), and corporate activities worldwide. The replacement cost loss before interest and tax for the first quarter was $672 million, compared with $478 million for the same period last year. The first-quarter result included a net non-operating charge of $236 million, mainly relating to further charges as we prepare to exit the solar business. A year ago, there was a net non-operating charge of $181 million for the first quarter. After adjusting for non-operating items, the underlying replacement cost loss before interest and tax for the first quarter was $436 million, compared with a loss of $297 million for the same period last year. In Alternative Energy, net wind generation capacity(b) at the end of the first quarter was 1,274MW (1,988MW gross), compared with 774MW (1,362MW gross) at the end of the same period a year ago. In the first quarter, two new wind farms were fully commissioned in Texas, US, both of which are 100% owned by BP: Trinity Hills in Archer and Young Counties (225MW) and Sherbino 2 in Pecos County (150MW). BP now participates in a total of 13 wind farms in the US, of which we operate 12. BP’s net share of wind generation from our US wind farms for the first quarter was 1,024GWh (1,675GWh gross), compared with 601GWh (1,076GWh gross) in the same period a year ago. In our biofuels business, BP owns and operates three producing ethanol mills in Brazil, with a total crush capacity(c) of 7.2 million tonnes per annum.
(b) Net wind generation capacity is the sum of the rated capacities of the assets/turbines that have entered into commercial operation, including BP’s share of equity-accounted entities. The gross data is the equivalent capacity on a gross-JV basis, which includes 100% of the capacity of equity-accounted entities where BP has partial ownership. Capacity figures include 32MW in the Netherlands managed by our Downstream segment.
(c) Crush capacity represents the maximum capacity of the plant to process biofuels feedstock.

12
Cautionary statement
Cautionary statement regarding forward-looking statements: The discussion in this results announcement contains forward-looking statements, particularly those regarding the quarterly dividend payment; BP’s intentions to continue to patrol and maintain certain shoreline segments impacted by the oil spill; the prospects for the approval of the settlement agreements with the Plaintiffs’ Steering Committee (PSC), and the timing of the fairness hearings in connection therewith; the timing of future MDL 2179 proceedings; the expected cost of the settlement agreements with the PSC, and the source of funding thereof; the source of funding for BP’s $1-billion commitment to early restoration projects, and the prospects for these early restoration projects; the prospects for and expected timing of certain claims and litigation outcomes; the expected level of production in the second quarter of 2012; the expected timing for the award of licenses in connection with certain blocks in Uruguay; the expected level of refining margins in the second quarter of 2012; the prospects for the fuels marketing environment in the second quarter of 2012; the prospects for the petrochemicals margin environment; the expected timing for the resumption of operations at the Cherry Point refinery; prospects for the completion of planned and announced divestments, including the planned disposals of the Texas City refinery and the southern part of the US West Coast fuels value chain; and the expected timing of the completion of BP’s purchase of certain aviation fuels assets in Brazil. By their nature, forward-looking statements involve risk and uncertainty because they relate to events and depend on circumstances that will or may occur in the future. Actual results may differ from those expressed in such statements, depending on a variety of factors including the timing of bringing new fields onstream; future levels of industry product supply; demand and pricing; OPEC quota restrictions; PSA effects; operational problems; general economic conditions; political stability and economic growth in relevant areas of the world; changes in laws and governmental regulations; regulatory or legal actions including the types of enforcement action pursued and the nature of remedies sought; the impact on our reputation following the Gulf of Mexico oil spill; exchange rate fluctuations; development and use of new technology; the success or otherwise of partnering; the actions of competitors, trading partners, creditors, rating agencies and others; natural disasters and adverse weather conditions; changes in public expectations and other changes to business conditions; wars and acts of terrorism or sabotage; and other factors discussed under “Risk factors” in our Annual Report and Form 20-F 2011 as filed with the US Securities and Exchange Commission.

13
Group income statement
First Fourth First quarter quarter quarter 2012 2011 2011 $ million Sales and other operating revenues (Note 4) 94,040 93,441 85,329 Earnings from jointly controlled entities – after interest and tax 290 211 392 Earnings from associates – after interest and tax 1,260 1,144 1,409 Interest and other income 175 170 124 Gains on sale of businesses and fixed assets 933 1,377 1,188 Total revenues and other income 96,698 96,343 88,442 Purchases 71,643 71,791 61,721 Production and manufacturing expenses(a) 6,721 3,628 6,508 Production and similar taxes (Note 5) 2,346 2,072 1,831 Depreciation, depletion and amortization 3,208 2,982 2,835 Impairment and losses on sale of businesses and fixed assets 140 405 59 Exploration expense 260 342 399 Distribution and administration expenses 3,128 3,910 2,907 Fair value (gain) loss on embedded derivatives 99 (166) 545 Profit before interest and taxation 9,153 11,379 11,637 Finance costs(a) 283 326 308 Net finance income relating to pensions and other post-retirement benefits (53) (65) (69) Profit before taxation 8,923 11,118 11,398 Taxation(a) 2,947 3,344 4,083 Profit for the period 5,976 7,774 7,315 Attributable to BP shareholders 5,915 7,685 7,254 Minority interest 61 89 61 5,976 7,774 7,315 Earnings per share – cents (Note 6) Profit for the period attributable to BP shareholders Basic 31.17 40.51 38.55 Diluted 30.74 39.99 38.10
(a) See Note 2 on pages 22 – 26 for further details of the impact of the Gulf of Mexico oil spill on the income statement line items.

14
Group statement of comprehensive income
First Fourth First quarter quarter quarter 2012 2011 2011 $ million Profit for the period 5,976 7,774 7,315 Currency translation differences 586 (106) 657 Exchange (gains) losses on translation of foreign operations transferred to gain or loss on sales of businesses and fixed assets – – 11 Actuarial gain (loss) relating to pensions and other post-retirement benefits 1,420 (5,960) – Available-for-sale investments marked to market 64 96 266 Available-for-sale investments – recycled to the income statement – – (2) Cash flow hedges marked to market 75 (24) 118 Cash flow hedges – recycled to the income statement 2 3 (16) Cash flow hedges – recycled to the balance sheet 5 (6) 2 Share of equity-accounted entities' other comprehensive income, net of tax 203 (57) – Taxation (451) 1,601 (5) Other comprehensive income (expense) 1,904 (4,453) 1,031 Total comprehensive income 7,880 3,321 8,346 Attributable to BP shareholders 7,813 3,243 8,269 Minority interest 67 78 77
7,880 3,321 8,346
Group statement of changes in equity
BP shareholders’ Minority Total equity interest equity $ million At 1 January 2012 111,465 1,017 112,482
Total comprehensive income 7,813 67 7,880 Dividends (1,211) (1) (1,212) Share-based payments (net of tax) 59 – 59 Transactions involving minority interests – 11 11 At 31 March 2012 118,126 1,094 119,220
BP shareholders’ Minority Total equity interest equity $ million At 1 January 2011 94,987 904 95,891
Total comprehensive income 8,269 77 8,346 Dividends (808) (6) (814) Share-based payments (net of tax) (110) – (110) At 31 March 2011 102,338 975 103,313
15
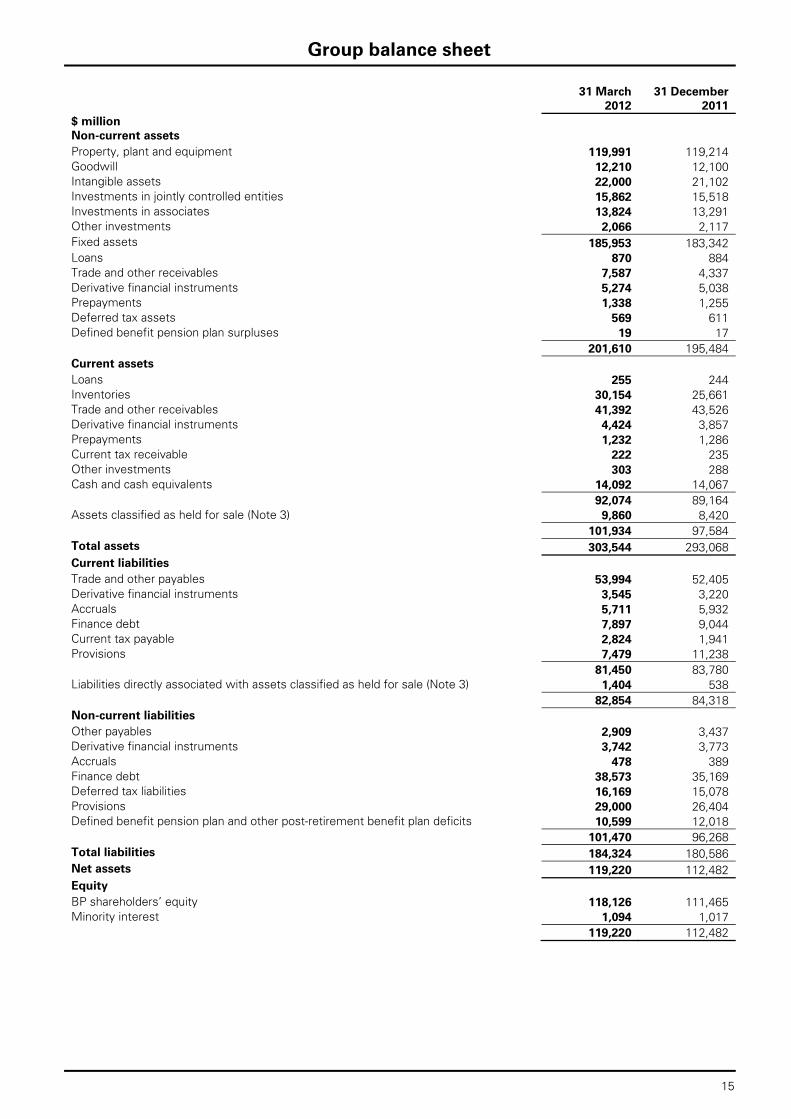
Group balance sheet
31 March 31 December 2012 2011 $ million Non-current assets Property, plant and equipment 119,991 119,214 Goodwill 12,210 12,100 Intangible assets 22,000 21,102 Investments in jointly controlled entities 15,862 15,518 Investments in associates 13,824 13,291 Other investments 2,066 2,117 Fixed assets 185,953 183,342 Loans 870 884 Trade and other receivables 7,587 4,337 Derivative financial instruments 5,274 5,038 Prepayments 1,338 1,255 Deferred tax assets 569 611 Defined benefit pension plan surpluses 19 17 201,610 195,484 Current assets Loans 255 244 Inventories 30,154 25,661 Trade and other receivables 41,392 43,526 Derivative financial instruments 4,424 3,857 Prepayments 1,232 1,286 Current tax receivable 222 235 Other investments 303 288 Cash and cash equivalents 14,092 14,067 92,074 89,164 Assets classified as held for sale (Note 3) 9,860 8,420 101,934 97,584 Total assets 303,544 293,068 Current liabilities Trade and other payables 53,994 52,405 Derivative financial instruments 3,545 3,220 Accruals 5,711 5,932 Finance debt 7,897 9,044 Current tax payable 2,824 1,941 Provisions 7,479 11,238 81,450 83,780 Liabilities directly associated with assets classified as held for sale (Note 3) 1,404 538 82,854 84,318 Non-current liabilities Other payables 2,909 3,437 Derivative financial instruments 3,742 3,773 Accruals 478 389 Finance debt 38,573 35,169 Deferred tax liabilities 16,169 15,078 Provisions 29,000 26,404 Defined benefit pension plan and other post-retirement benefit plan deficits 10,599 12,018 101,470 96,268 Total liabilities 184,324 180,586 Net assets 119,220 112,482 Equity BP shareholders’ equity 118,126 111,465 Minority interest 1,094 1,017 119,220 112,482

16
Condensed group cash flow statement
First Fourth First quarter quarter quarter 2012 2011 2011 $ million Operating activities Profit before taxation 8,923 11,118 11,398 Adjustments to reconcile profit before taxation to net cash provided by operating activities Depreciation, depletion and amortization and exploration expenditure written off 3,288 3,083 3,127 Impairment and (gain) loss on sale of businesses and fixed assets (793) (972) (1,129) Earnings from equity-accounted entities, less dividends received (524) 856 (1,576) Net charge for interest and other finance expense, less net interest paid (14) (54) 51 Share-based payments 34 (205) (124) Net operating charge for pensions and other post-retirement benefits, less contributions and benefit payments for unfunded plans (160) (300) (439) Net charge for provisions, less payments 165 2,212 273 Movements in inventories and other current and non-current assets and liabilities(a) (6,160) (8,190) (7,823) Income taxes paid (1,392) (2,538) (1,354) Net cash provided by operating activities 3,367 5,010 2,404 Investing activities Capital expenditure (5,439) (5,805) (3,709) Acquisitions, net of cash acquired – (3,018) (2,002) Investment in jointly controlled entities (244) (362) (154) Investment in associates (23) (19) (11) Proceeds from disposal of fixed assets 1,267 1,396 384 Proceeds from disposal of businesses, net of cash disposed(b) 45 (3,357) 586 Proceeds from loan repayments 65 87 35 Net cash used in investing activities (4,329) (11,078) (4,871) Financing activities Net issue of shares 21 30 12 Proceeds from long-term financing 3,813 3,596 4,917 Repayments of long-term financing (2,416) (1,515) (2,622) Net increase in short-term debt 664 1,580 949 Dividends paid – BP shareholders (1,212) (1,244) (808) Dividends paid – Minority interest (1) (63) (6) Net cash provided by financing activities 869 2,384 2,442 Currency translation differences relating to cash and cash equivalents 118 (246) 195 Increase (decrease) in cash and cash equivalents 25 (3,930) 170 Cash and cash equivalents at beginning of period 14,067 17,997 18,556 Cash and cash equivalents at end of period 14,092 14,067 18,726
(a) Includes
Inventory holding (gains) losses (1,437) (101) (2,412) Fair value (gain) loss on embedded derivatives 99 (166) 545 Movements related to Gulf of Mexico oil spill response (1,861) (8,106) (2,864)
Inventory holding gains and losses and fair value gains and losses on embedded derivatives are also included within profit before taxation. See Note 2 for further information on the cash flow impacts of the Gulf of Mexico oil spill.
(b) Fourth quarter 2011 includes the repayment of the deposit of $3,530 million following the termination of the Pan American Energy LLC sale agreement as described in Note 5 of BP Annual Report and Form 20-F 2011 on page 197.

17
Capital expenditure and acquisitions
First Fourth First quarter quarter quarter 2012 2011 2011 $ million By business Upstream US(a) 1,646 2,336 1,023 Non-US(b) 2,829 3,313 2,111 4,475 5,649 3,134 Downstream US 674 713 522 Non-US 202 656 215 876 1,369 737 Other businesses and corporate US 158 423 130 Non-US 139 204 20 297 627 150 5,648 7,645 4,021 By geographical area US(a) 2,478 3,472 1,675 Non-US(b) 3,170 4,173 2,346 5,648 7,645 4,021 Included above: Acquisitions and asset exchanges(b) 10 282 9
(a) First quarter 2012 and fourth quarter 2011 included $311 million and $1,096 million respectively associated with deepening our
natural gas asset base. (b) Fourth quarter 2011 includes $69 million relating to the acquisition from Reliance Industries of interests in 21 oil and gas production-
sharing agreements in India.
Exchange rates
First Fourth First quarter quarter quarter 2012 2011 2011 US dollar/sterling average rate for the period 1.57 1.57 1.60 US dollar/sterling period-end rate 1.59 1.54 1.61 US dollar/euro average rate for the period 1.31 1.35 1.37 US dollar/euro period-end rate 1.33 1.29 1.41

18
Analysis of replacement cost profit before interest and tax and reconciliation to profit before taxation(a)
First Fourth First quarter quarter quarter 2012 2011 2011 $ million By business Upstream 6,979 6,564 7,423 Downstream 856 564 2,079 TNK-BP(b) 1,064 987 1,127 Other businesses and corporate (672) (1,072) (478)
8,227 7,043 10,151 Gulf of Mexico oil spill response 30 4,108 (384) Consolidation adjustment - unrealized profit in inventory (541) 127 (542) RC profit before interest and tax(c) 7,716 11,278 9,225 Inventory holding gains (losses)(d) Upstream (84) (13) 56 Downstream 1,495 93 2,288 TNK-BP (net of tax) 26 21 59 Other businesses and corporate – – 9 Profit before interest and tax 9,153 11,379 11,637 Finance costs 283 326 308 Net finance income relating to pensions and other post-retirement benefits (53) (65) (69) Profit before taxation 8,923 11,118 11,398
RC profit before interest and tax By geographical area US 1,935 5,887 1,813 Non-US 5,781 5,391 7,412
7,716 11,278 9,225
(a) IFRS requires that the measure of profit or loss disclosed for each operating segment is the measure that is provided regularly to the chief operating decision maker for the purposes of performance assessment and resource allocation. For BP, both RC profit or loss before interest and tax and underlying RC profit or loss before interest and tax (see page 4 for further information) are provided regularly to the chief operating decision maker. In such cases IFRS requires that the measure of profit disclosed for each operating segment is the measure that is closest to IFRS, which for BP is RC profit or loss before interest and tax. In addition, a reconciliation is required between the total of the operating segments' measures of profit or loss and the group profit or loss before taxation.
(b) Net of finance costs, taxation and minority interest. (c) RC profit or loss reflects the replacement cost of supplies. The RC profit or loss for the period is arrived at by excluding from profit or
loss inventory holding gains and losses and their associated tax effect. RC profit or loss for the group is not a recognized GAAP measure.
(d) Inventory holding gains and losses represent the difference between the cost of sales calculated using the average cost to BP of supplies acquired during the period and the cost of sales calculated on the first-in first-out (FIFO) method after adjusting for any changes in provisions where the net realizable value of the inventory is lower than its cost. Under the FIFO method, which we use for IFRS reporting, the cost of inventory charged to the income statement is based on its historic cost of purchase, or manufacture, rather than its RC. In volatile energy markets, this can have a significant distorting effect on reported income. The amounts disclosed represent the difference between the charge (to the income statement) for inventory on a FIFO basis (after adjusting for any related movements in net realizable value provisions) and the charge that would have arisen if an average cost of supplies was used for the period. For this purpose, the average cost of supplies during the period is principally calculated on a monthly basis by dividing the total cost of inventory acquired in the period by the number of barrels acquired. The amounts disclosed are not separately reflected in the financial statements as a gain or loss. No adjustment is made in respect of the cost of inventories held as part of a trading position and certain other temporary inventory positions. Management believes this information is useful to illustrate to investors the fact that crude oil and product prices can vary significantly from period to period and that the impact on our reported result under IFRS can be significant. Inventory holding gains and losses vary from period to period due principally to changes in oil prices as well as changes to underlying inventory levels. In order for investors to understand the operating performance of the group excluding the impact of oil price changes on the replacement of inventories, and to make comparisons of operating performance between reporting periods, BP’s management believes it is helpful to disclose this information.

19
Non-operating items(a)
First Fourth First quarter quarter quarter 2012 2011 2011 $ million Upstream Impairment and gain (loss) on sale of businesses and fixed assets 928 1,124 1,089 Environmental and other provisions – (2) – Restructuring, integration and rationalization costs – (1) – Fair value gain (loss) on embedded derivatives (100) 166 (328) Other(b) (6) (703) (51) 822 584 710 Downstream Impairment and gain (loss) on sale of businesses and fixed assets (85) (114) 5 Environmental and other provisions – (25) – Restructuring, integration and rationalization costs (12) 13 (1) Fair value gain (loss) on embedded derivatives – – – Other (9) (14) (21) (106) (140) (17) TNK-BP (net of tax)(c) Impairment and gain (loss) on sale of businesses and fixed assets (93) – – Environmental and other provisions – – – Restructuring, integration and rationalization costs – – – Fair value gain (loss) on embedded derivatives – – – Other – – – (93) – – Other businesses and corporate Impairment and gain (loss) on sale of businesses and fixed assets (50) (38) 35 Environmental and other provisions (15) (73) – Restructuring, integration and rationalization costs – (24) 1 Fair value gain (loss) on embedded derivatives(d) 1 – (217) Other(e) (172) (319) – (236) (454) (181) Gulf of Mexico oil spill response 30 4,108 (384) Total before interest and taxation 417 4,098 128 Finance costs(f) (6) (13) (16) Total before taxation 411 4,085 112 Taxation credit (charge)(g) (226) (1,466) 44 Total after taxation for period 185 2,619 156
(a) Non-operating items are charges and credits arising in consolidated entities and in TNK-BP that are included in the financial
statements and that BP discloses separately because it considers such disclosures to be meaningful and relevant to investors. They are items that management considers not to be part of underlying business operations and are disclosed in order to enable investors better to understand and evaluate the group’s reported financial performance. An analysis of non-operating items by region is shown on pages 7, 9 and 11.
(b) Fourth quarter 2011 includes a charge of $700 million associated with the termination of the agreement to sell our 60% interest in Pan American Energy LLC to Bridas Corporation.
(c) Non-operating items for TNK-BP are reported in the group income statement within earnings from associates – after interest and tax. (d) First quarter 2011 includes a loss on an embedded derivative arising from a financing arrangement. (e) First quarter 2012 and fourth quarter 2011 include charges of $161 million and $319 million respectively, in relation to our exit from
the solar business. (f) Finance costs relate to the Gulf of Mexico oil spill. See Note 2 on pages 22 – 26 for further details. (g) Tax is calculated by applying discrete quarterly effective tax rates (excluding the impact of the Gulf of Mexico oil spill, equity-
accounted earnings from the first quarter 2012, and, for the first quarter 2011, the impact of a $683-million one-off deferred tax adjustment in respect of an increase in the supplementary charge on UK oil and gas production) on group profit or loss. However, the US statutory tax rate has been used for recoveries relating to the Gulf of Mexico oil spill and expenditures that qualify for tax relief. Excludes tax relating to TNK-BP items, which are reported after tax in the BP group income statement.
20
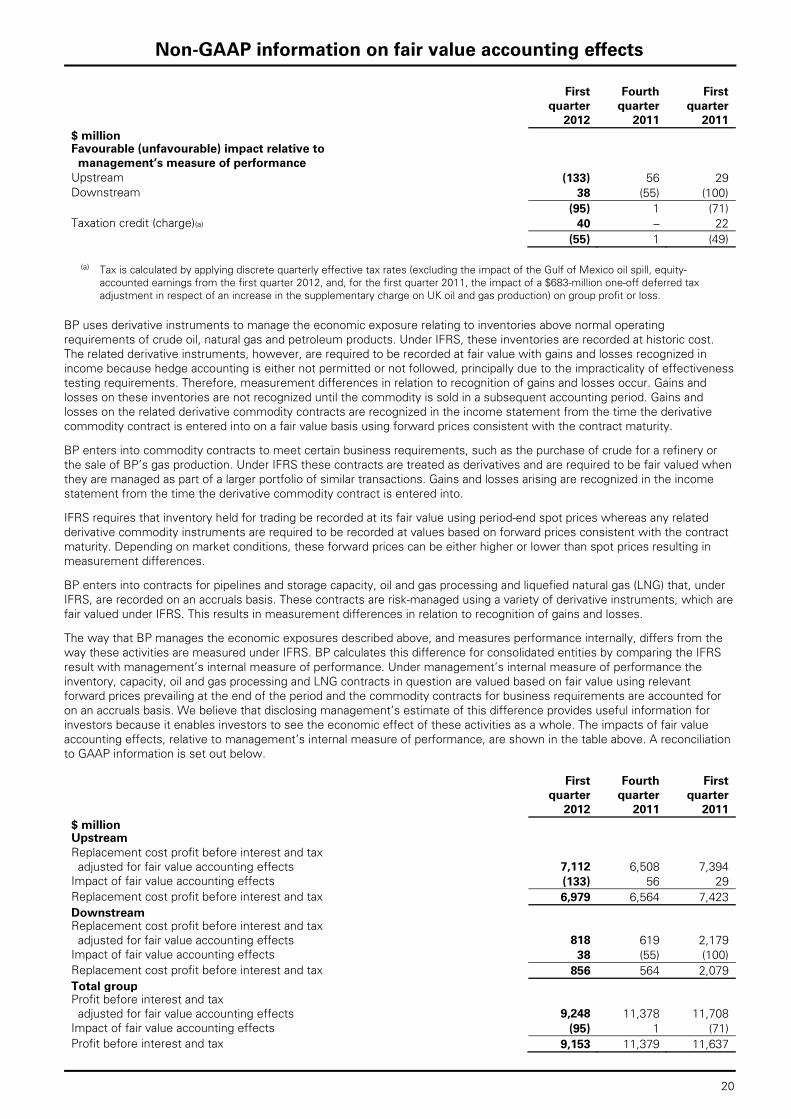
Non-GAAP information on fair value accounting effects
First Fourth First quarter quarter quarter 2012 2011 2011 $ million Favourable (unfavourable) impact relative to management’s measure of performance Upstream (133) 56 29 Downstream 38 (55) (100) (95) 1 (71) Taxation credit (charge)(a) 40 – 22 (55) 1 (49)
(a) Tax is calculated by applying discrete quarterly effective tax rates (excluding the impact of the Gulf of Mexico oil spill, equity-
accounted earnings from the first quarter 2012, and, for the first quarter 2011, the impact of a $683-million one-off deferred tax adjustment in respect of an increase in the supplementary charge on UK oil and gas production) on group profit or loss.
BP uses derivative instruments to manage the economic exposure relating to inventories above normal operating requirements of crude oil, natural gas and petroleum products. Under IFRS, these inventories are recorded at historic cost. The related derivative instruments, however, are required to be recorded at fair value with gains and losses recognized in income because hedge accounting is either not permitted or not followed, principally due to the impracticality of effectiveness testing requirements. Therefore, measurement differences in relation to recognition of gains and losses occur. Gains and losses on these inventories are not recognized until the commodity is sold in a subsequent accounting period. Gains and losses on the related derivative commodity contracts are recognized in the income statement from the time the derivative commodity contract is entered into on a fair value basis using forward prices consistent with the contract maturity.
BP enters into commodity contracts to meet certain business requirements, such as the purchase of crude for a refinery or the sale of BP’s gas production. Under IFRS these contracts are treated as derivatives and are required to be fair valued when they are managed as part of a larger portfolio of similar transactions. Gains and losses arising are recognized in the income statement from the time the derivative commodity contract is entered into.
IFRS requires that inventory held for trading be recorded at its fair value using period-end spot prices whereas any related derivative commodity instruments are required to be recorded at values based on forward prices consistent with the contract maturity. Depending on market conditions, these forward prices can be either higher or lower than spot prices resulting in measurement differences.
BP enters into contracts for pipelines and storage capacity, oil and gas processing and liquefied natural gas (LNG) that, under IFRS, are recorded on an accruals basis. These contracts are risk-managed using a variety of derivative instruments, which are fair valued under IFRS. This results in measurement differences in relation to recognition of gains and losses.
The way that BP manages the economic exposures described above, and measures performance internally, differs from the way these activities are measured under IFRS. BP calculates this difference for consolidated entities by comparing the IFRS result with management’s internal measure of performance. Under management’s internal measure of performance the inventory, capacity, oil and gas processing and LNG contracts in question are valued based on fair value using relevant forward prices prevailing at the end of the period and the commodity contracts for business requirements are accounted for on an accruals basis. We believe that disclosing management’s estimate of this difference provides useful information for investors because it enables investors to see the economic effect of these activities as a whole. The impacts of fair value accounting effects, relative to management’s internal measure of performance, are shown in the table above. A reconciliation to GAAP information is set out below.
First Fourth First quarter quarter quarter
2012 2011 2011 $ million Upstream Replacement cost profit before interest and tax adjusted for fair value accounting effects 7,112 6,508 7,394 Impact of fair value accounting effects (133) 56 29 Replacement cost profit before interest and tax 6,979 6,564 7,423 Downstream Replacement cost profit before interest and tax adjusted for fair value accounting effects 818 619 2,179 Impact of fair value accounting effects 38 (55) (100) Replacement cost profit before interest and tax 856 564 2,079 Total group Profit before interest and tax adjusted for fair value accounting effects 9,248 11,378 11,708 Impact of fair value accounting effects (95) 1 (71) Profit before interest and tax 9,153 11,379 11,637

21
Realizations and marker prices
First Fourth First quarter quarter quarter 2012 2011 2011 Average realizations(a) Liquids ($/bbl)(b) US 99.39 99.05 86.53 Europe 116.96 107.31 102.37 Rest of World 114.79 102.89 99.68 BP Average 108.13 101.84 93.93 Natural gas ($/mcf) US 2.24 3.07 3.20 Europe 7.83 9.11 6.96 Rest of World 5.34 5.45 4.41 BP Average 4.68 5.07 4.21 Total hydrocarbons ($/boe) US 62.94 65.53 60.30 Europe 87.50 87.04 84.94 Rest of World 60.30 57.24 52.79 BP Average 64.02 63.49 59.00 Average oil marker prices ($/bbl) Brent 118.60 109.35 105.43 West Texas Intermediate 103.10 94.02 94.49 Alaska North Slope 118.47 110.30 103.22 Mars 115.50 106.85 101.95 Urals (NWE – cif) 116.87 108.65 102.55 Russian domestic oil 58.22 49.69 49.18 Average natural gas marker prices Henry Hub gas price ($/mmBtu)(c) 2.72 3.54 4.11 UK Gas – National Balancing Point (p/therm) 59.38 56.75 56.94
(a) Based on sales of consolidated subsidiaries only – this excludes equity-accounted entities. (b) Crude oil and natural gas liquids. (c) Henry Hub First of Month Index.

22
Notes
1. Basis of preparation
The interim financial information included in this report has been prepared in accordance with IAS 34 ‘Interim Financial Reporting’. The results for the interim periods are unaudited and in the opinion of management include all adjustments necessary for a fair presentation of the results for the periods presented. All such adjustments are of a normal recurring nature. BP prepares its consolidated financial statements included within BP Annual Report and Form 20-F on the basis of International Financial Reporting Standards (IFRS) as issued by the International Accounting Standards Board (IASB), IFRS as adopted by the European Union (EU) and in accordance with the provisions of the UK Companies Act 2006. IFRS as adopted by the EU differs in certain respects from IFRS as issued by the IASB, however, the differences have no impact on the group’s consolidated financial statements for the periods presented. The financial information presented herein has been prepared in accordance with the accounting policies expected to be used in preparing BP Annual Report and Form 20-F 2012, which do not differ significantly from those used in the BP Annual Report and Form 20-F 2011. Segmental reporting For the purposes of segmental reporting, the group’s operating segments are established on the basis of those components of the group that are evaluated regularly by the chief operating decision maker in deciding how to allocate resources and in assessing performance. With effect from 1 January 2012, the former Exploration and Production segment was separated to form two new operating segments, Upstream and TNK-BP, reflecting the way in which our investment in TNK-BP is now managed. In addition, we began reporting the Refining and Marketing segment as Downstream. New or amended International Financial Reporting Standards adopted There are no new or amended standards or interpretations adopted with effect from 1 January 2012 that have a significant impact on the financial statements. Comparative group balance sheet as at 31 December 2011 The comparative group balance sheet as at 31 December 2011 presented in this report is the balance sheet approved by the board of directors on 6 March 2012 and published in the BP Annual Report and Form 20-F 2011. This differs from the group balance sheet as at 31 December 2011 published in BP’s fourth quarter and full year 2011 results announcement published on 7 February 2012. The differences relate to the announcement on 3 March 2012 of the proposed settlement with the Plaintiffs’ Steering Committee in the federal Multi-District Litigation proceedings pending in New Orleans (MDL 2179), which was an adjusting event after the reporting period, subsequent to the preliminary announcement of the fourth quarter 2011 results. The effect of the adjustment arising from the proposed settlement was to increase the provision for litigation and claims included within current and non-current provisions by $1,900 million and $241 million respectively, and the reimbursement asset included within current and non-current Trade and other receivables by the same amounts. There was no net impact on the group income statement or the group cash flow statement. For further details see Note 2 and Legal proceedings on pages 31 – 32 herein.
2. Gulf of Mexico oil spill (a) Overview As a consequence of the Gulf of Mexico oil spill, BP continues to incur costs and has also recognized liabilities for future costs. The information presented in this note should be read in conjunction with BP Annual Report and Form 20-F 2011 – Financial statements – Note 2, Note 36 and Note 43, and Legal proceedings on pages 31 – 32 herein. The group income statement includes a pre-tax credit of $24 million for the first quarter in relation to the Gulf of Mexico oil spill. This primarily reflects a credit relating to certain claims administration costs now expected to be paid from the Deepwater Horizon Oil Spill Trust, partially offset by an increase in the provision for the costs of patrolling and maintenance of shoreline, and functional expenses of the Gulf Coast Restoration Organization (GCRO). The cumulative pre-tax income statement charge since the incident amounts to $37,169 million.

23
Notes
2. Gulf of Mexico oil spill (continued)
The amounts set out below reflect the impacts on the financial statements of the Gulf of Mexico oil spill for the periods presented, as described on pages 2 – 3. The income statement, balance sheet and cash flow statement impacts are included within the relevant line items in those statements as set out below. First Fourth First quarter quarter quarter 2012 2011 2011 $ million Income statement Production and manufacturing expenses (30) (4,108) 384 Profit (loss) before interest and taxation 30 4,108 (384) Finance costs 6 13 16 Profit (loss) before taxation 24 4,095 (400) Less: Taxation (26) (1,469) 201 Profit (loss) for the period (2) 2,626 (199)
31 March 2012 31 December 2011
Of which: Of which: amount related amount related
Total to the trust fund Total to the trust fund $ million Balance sheet Current assets Trade and other receivables 4,985 4,985 8,487 8,233 Current liabilities Trade and other payables (3,800) (3,368) (5,425) (4,872) Provisions (5,877) – (9,437) – Net current assets (liabilities) (4,692) 1,617 (6,375) 3,361 Non-current assets Other receivables 4,881 4,881 1,642 1,642 Non-current liabilities Provisions (9,048) – (5,896) – Deferred tax 7,211 – 7,775 – Net non-current assets (liabilities) 3,044 4,881 3,521 1,642
Net assets (1,648) 6,498 (2,854) 5,003
First Fourth First quarter quarter quarter 2012 2011 2011 $ million Cash flow statement - Operating activities Profit (loss) before taxation 24 4,095 (400) Adjustments to reconcile profit (loss) before taxation to net cash provided by operating activities Net charge for interest and other finance expense, less net interest paid 6 13 16 Net charge for provisions, less payments 85 2,343 202 Movements in inventories and other current and non-current assets and liabilities (1,861) (8,106) (2,864) Pre-tax cash flows (1,746) (1,655) (3,046)
Net cash used in operating activities relating to the Gulf of Mexico oil spill, on a post-tax basis, amounted to $1,208 million in the first quarter of 2012. For the first and fourth quarters of 2011 the amounts were $2,808 million and $1,178 million respectively.

24
Notes
2. Gulf of Mexico oil spill (continued)
Trust fund In 2010, BP established the Deepwater Horizon Oil Spill Trust (the Trust) to be funded in the amount of $20 billion over the period to the fourth quarter of 2013, which is available to satisfy legitimate individual and business claims administered by the Gulf Coast Claims Facility (GCCF), state and local government claims resolved by BP, final judgments and settlements, state and local response costs, and natural resource damages and related costs. During 2010 and 2011, BP contributed a total of $15,140 million to the fund, including cash settlements of $5,140 million received from co-owners and other third parties. A further cash settlement of $250 million was received in the first quarter of 2012 and was also contributed to the trust fund in addition to a regular contribution of $1,250 million. As a result of these accelerated contributions, it is now expected that the $20-billion commitment will have been paid in full by the end of 2012. The income statement charge for 2010 included $20 billion in relation to the trust fund, adjusted to take account of the time value of money. Fines and penalties are not covered by the trust fund. The table below shows movements in the funding obligation during the period to 31 March 2012. This liability is recognized within current other payables on the balance sheet. $ million At 1 January 2012 4,872 Unwinding of discount 5 Contributions (1,500) Other (9) At 31 March 2012 3,368
An asset has been recognized representing BP’s right to receive reimbursement from the trust fund. This is the portion of the estimated future expenditure provided for that will be settled by payments from the trust fund. We use the term ‘reimbursement asset’ to describe this asset. BP will not actually receive any reimbursements from the trust fund, instead payments will be made directly from the trust fund, and BP will be released from its corresponding obligation. The reimbursement asset is recorded within other receivables on the balance sheet apportioned between current and non-current elements. The table below shows movements in the reimbursement asset during the period to 31 March 2012. The amount of the reimbursement asset at 31 March 2012 is equal to the amount of provisions recognized at that date that will be covered by the trust fund – see below. $ million At 1 January 2012 9,875 Increase in provision for items covered by the trust fund 485 Amounts paid directly by the trust fund (494) At 31 March 2012 9,866 Of which – current 4,985 – non-current 4,881
As noted above, the obligation to fund the $20-billion trust fund was recognized in full. Any increases in the provision that will be covered by the trust fund (up to the amount of $20 billion) have no net income statement effect as a reimbursement asset is also recognized, as described above. As at 31 March 2012, the cumulative charges for provisions, and the associated reimbursement asset recognized, amounted to $17,090 million. Thus, a further $2,910 million could be provided in subsequent periods for items covered by the trust fund with no net impact on the income statement. Such future increases in amounts provided could arise from adjustments to existing provisions, or from the initial recognition of provisions for items that currently cannot be estimated reliably, namely final judgments and settlements and natural resource damages and related costs. Further information on those items that currently cannot be reliably estimated is provided under Provisions and contingencies below. It is not possible at this time to conclude whether the $20-billion trust fund will be sufficient to satisfy all claims under the Oil Pollution Act 1990 (OPA 90) or otherwise that will ultimately be paid. The Trust agreement does not require BP to make further contributions to the trust fund in excess of the agreed $20 billion should this be insufficient to cover all claims administered by the GCCF or by the PSC court-supervised claims processes, or to settle other items that are covered by the trust fund, as described above. Should the $20-billion trust fund not be sufficient, BP would commence settling legitimate claims and other costs by making payments directly. In this case, increases in estimated future expenditure above $20 billion would be recognized as provisions with a corresponding charge in the income statement. The provisions would be utilized and derecognized at the point that BP made the payments.

25
Notes
2. Gulf of Mexico oil spill (continued)
The proposed settlement agreement with the Plaintiffs’ Steering Committee (PSC) (see page 2 for further information) provides for a transition from the GCCF and a transitional claims process for economic loss claims commenced operation in March 2012 while the infrastructure for a new court-supervised claims process is put in place. It is expected that the cost of the settlement will be paid from the Trust.
(b) Provisions and contingencies
BP has recorded certain provisions and disclosed certain contingencies as a consequence of the Gulf of Mexico oil spill. These are described below and in more detail in BP Annual Report and Form 20-F 2011 – Financial statements – Notes 2, 36 and 43.
Provisions
BP has recorded provisions relating to the Gulf of Mexico oil spill in relation to environmental expenditure, spill response costs, litigation and claims, and Clean Water Act penalties. Movements in each class of provision during the first quarter are presented in the table below.
The environmental provision includes amounts for BP’s commitment to fund the Gulf of Mexico Research Initiative, natural resource damage (NRD) assessment costs, emergency NRD restoration projects and early NRD restoration projects under the $1-billion framework agreement.
Further amounts for spill response costs were provided during the first quarter primarily to recognize increased costs of patrolling and maintenance of the shoreline. The majority of the active clean-up of the shorelines was completed in 2011.
The litigation and claims provision includes the estimated future cost of settling Individual and Business claims, and State and Local claims under OPA 90 and claims for personal injuries, both reported and unreported, as well as claims administration costs and legal fees. BP announced on 3 March 2012 that a proposed settlement had been reached with the Plaintiffs’ Steering Committee (PSC), subject to final written agreement and court approvals, to resolve the substantial majority of legitimate economic loss and property damage claims and medical claims (Individual and Business claims) stemming from the Deepwater Horizon accident and oil spill. The PSC acts on behalf of the individual and business plaintiffs in the Multi-District Litigation proceedings pending in New Orleans (MDL 2179). The proposed settlement was an adjusting event after the 2011 reporting period and the estimated $7.8-billion cost was therefore reflected in the 2011 financial statements. On 18 April 2012 BP announced that it had reached definitive and fully documented settlement agreements with the PSC which have been filed for preliminary court approval. See page 2 and Legal proceedings on pages 31 – 32 herein for further information.
During the first quarter certain claims administration costs, previously treated as payable from outside the trust fund, have been reallocated as payable by the trust fund, as a result of the definitive PSC settlement agreements noted above. In addition, an increase in the provision for Individual and Business claims, payable from the Trust, was recognized in the period.
A provision was recognized in 2010 for the estimated penalties for strict liability under the Clean Water Act, which are based on a specified range per barrel of oil released. No adjustments have been made subsequently to this estimate. The penalty rate per barrel used to calculate the provision is based upon the company’s conclusion, amongst other things, that it did not act with gross negligence or engage in wilful misconduct.
BP considers that it is not possible, at this time, to measure reliably any obligation in relation to Natural Resource Damages claims under OPA 90 (other than the estimated costs of the assessment phase and the costs of emergency and early restoration agreements referred to above) or litigation arising from alleged violations of OPA 90, any amounts in relation to fines and penalties except for those relating to the Clean Water Act and any obligation in relation to litigation. These items are therefore disclosed as contingent liabilities – see below.
Spill Litigation Clean Water Environmental response and claims Act penalties Total $ million At 1 January 2012 1,517 336 9,970 3,510 15,333 Increase (decrease) in provision – items not covered by the trust fund – 82 (178) – (96) Increase in provision – items covered by the trust fund 65 – 420 – 485 Unwinding of discount 1 – – – 1 Utilization – paid by BP (11) (68) (225) – (304) – paid by the trust fund (62) – (432) – (494) At 31 March 2012 1,510 350 9,555 3,510 14,925 Of which – current 680 277 4,920 – 5,877 – non-current 830 73 4,635 3,510 9,048 Of which – payable from the trust fund 1,069 – 8,797 – 9,866

26
Notes
2. Gulf of Mexico oil spill (continued)
The total credit in the income statement is analysed in the table below.
First quarter 2012 $ million Net increase in provisions 389 Recognition of reimbursement asset (485) Other costs charged directly to the income statement 66 Profit before interest and taxation (30) Finance costs 6 Profit before taxation (24)
The total amounts that will ultimately be paid by BP in relation to all obligations relating to the incident are subject to significant uncertainty and the ultimate exposure and cost to BP will be dependent on many factors. Furthermore, significant uncertainty exists in relation to the amount of claims that will become payable by BP, the amount of fines that will ultimately be levied on BP (including any determination of BP’s culpability based on any findings of negligence, gross negligence or wilful misconduct), the outcome of litigation and arbitration proceedings, and any costs arising from any longer-term environmental consequences of the oil spill, which will also impact upon the ultimate cost for BP. Although the provision recognized is the current best reliable estimate of expenditures required to settle certain present obligations at the end of the reporting period, there are future expenditures for which it is not possible to measure the obligation reliably as noted below under Contingent liabilities. Further information on provisions is provided in BP Annual Report and Form 20-F 2011 – Financial statements – Note 36. Contingent liabilities BP has provided for its best estimate of certain claims under OPA 90 that will be paid through the $20-billion trust fund. It is not possible, at this time, to measure reliably any other items that will be paid from the trust fund, namely any obligation in relation to Natural Resource Damages claims (except for the estimated costs of the assessment phase and the costs relating to emergency and early restoration agreements as described above under Provisions) and claims asserted in civil litigation including any further litigation through potential opt-outs from the PSC settlement, nor is it practicable to estimate their magnitude or possible timing of payment. Therefore no amounts have been provided for these items as at 31 March 2012. For those items not covered by the trust fund it is not possible to measure reliably any obligation in relation to other litigation or potential fines and penalties except, subject to certain assumptions, for those relating to the Clean Water Act. Therefore no amounts have been provided for these items as at 31 March 2012. Under the settlement agreements with co-owners Anadarko and MOEX, and with Cameron International, the designer and manufacturer of the Deepwater Horizon blowout preventer, with M-I SWACO, the mud contractor (M-I), and with Weatherford, the designer and manufacturer of the float collar used on the Macondo well, BP has agreed to indemnify Anadarko, MOEX, Cameron, M-I and Weatherford for certain claims arising from the accident. It is therefore possible that BP may face claims under these indemnities, but it is not currently possible to reliably measure any obligation in relation to such claims and therefore no amount has been provided as at 31 March 2012. See Legal proceedings on pages 31 – 32 for further information on contingent liabilities, including information on the federal multi-district litigation proceeding in New Orleans. Any settlements which may be reached relating to the Deepwater Horizon oil spill could impact the amount and timing of any future payments.

27
Notes
3. Non-current assets held for sale
As a result of the group’s disposal programme following the Gulf of Mexico oil spill, various assets, and associated liabilities, have been presented as held for sale in the group balance sheet at 31 March 2012. The carrying amount of the assets held for sale is $9,860 million, with associated liabilities of $1,404 million. Included within these amounts are the following items, which relate to the Upstream segment unless otherwise stated. On 18 October 2010, BP announced that it had reached agreement to sell its upstream and midstream assets in Vietnam, together with its upstream businesses and associated interests in Venezuela, to TNK-BP for $1.8 billion in cash, subject to post-closing adjustments. The sale of the Venezuelan business and the upstream and certain midstream assets in Vietnam completed during 2011. BP is in ongoing negotiations and expects to complete a sale of its equity-accounted investment in the Phu My 3 plant facility in Vietnam in 2012, subject to the satisfaction of regulatory and other approvals and conditions. The investment in the Phu My 3 plant facility has been classified as held for sale in the group balance sheet at 31 March 2012. On 1 December 2011, BP announced that it had agreed to sell its Canadian natural gas liquids (NGL) business to Plains Midstream Canada ULC, a wholly-owned subsidiary of Plains All American Pipeline, L.P., for $1.67 billion in cash, subject to post-closing adjustments. The assets, and associated liabilities, of this business have been classified as held for sale in the group balance sheet at 31 March 2012. Completion of the transaction occurred on 1 April 2012. On 27 March 2012, BP announced that it had agreed to sell its interests in its southern gas assets (SGA) in the UK North Sea to Perenco UK Ltd (Perenco) for $400 million in cash. Perenco has made an initial payment to BP of $100 million in cash and the remaining $300 million will be paid on completion. A further $10 million may be paid in the future contingent on the prevailing gas prices. The assets, and associated liabilities, of SGA have been classified as held for sale in the group balance sheet at 31 March 2012. Completion of the transaction is subject to a number of third-party and regulatory approvals, and is expected to occur before the end of 2012. Within the Downstream segment, BP intends to divest the Texas City refinery and related assets, and the southern part of its US West Coast fuels value chain, including the Carson refinery. The non-current assets, together with the inventories, of these businesses have been classified as held for sale in the group balance sheet at 31 March 2012. BP aims to announce the sales by the end of 2012. Deposits of $30 million ($30 million at 31 December 2011) received in advance of completion of certain of these transactions have been classified as finance debt on the group balance sheet at 31 March 2012. See Note 7 for further information. The majority of the transactions noted above are subject to post-closing adjustments, which may include adjustments for working capital and adjustments for profits attributable to the purchaser between the agreed effective date and the closing date of the transaction. Such post-closing adjustments may result in the final amounts received by BP from the purchasers differing from the disposal proceeds noted above.

28
Notes
4. Sales and other operating revenues
First Fourth First quarter quarter quarter 2012 2011 2011 $ million By business Upstream 19,258 20,655 18,405 Downstream 85,931 84,538 77,433 Other businesses and corporate 428 439 856 105,617 105,632 96,694 Less: sales and other operating revenues between businesses Upstream 10,657 11,331 10,525 Downstream 746 650 626 Other businesses and corporate 174 210 214 11,577 12,191 11,365 Third party sales and other operating revenues Upstream 8,601 9,324 7,880 Downstream 85,185 83,888 76,807 Other businesses and corporate 254 229 642 Total third party sales and other operating revenues 94,040 93,441 85,329 By geographical area US 33,727 33,975 30,847 Non-US 70,340 69,525 63,855 104,067 103,500 94,702 Less: sales and other operating revenues between areas 10,027 10,059 9,373 94,040 93,441 85,329
5. Production and similar taxes First Fourth First quarter quarter quarter 2012 2011 2011 $ million US 490 523 374 Non-US 1,856 1,549 1,457 2,346 2,072 1,831

29
Notes
6. Earnings per share and shares in issue
Basic earnings per ordinary share (EpS) amounts are calculated by dividing the profit or loss for the period attributable to ordinary shareholders by the weighted average number of ordinary shares outstanding during the period. The calculation of EpS is performed separately for each discrete quarterly period, and for the year-to-date period. As a result, the sum of the discrete quarterly EpS amounts in any particular year-to-date period may not be equal to the EpS amount for the year-to-date period. For the diluted EpS calculation the weighted average number of shares outstanding during the period is adjusted for the number of shares that are potentially issuable in connection with employee share-based payment plans using the treasury stock method.
First Fourth First quarter quarter quarter 2012 2011 2011 $ million Results for the period Profit for the period attributable to BP shareholders 5,915 7,685 7,254 Less: Preference dividend – 1 – Profit attributable to BP ordinary shareholders 5,915 7,684 7,254 Inventory holding (gains) losses, net of tax (986) (79) (1,643) RC profit attributable to BP ordinary shareholders 4,929 7,605 5,611 Net (favourable) unfavourable impact of non-operating items and fair value accounting effects, net of tax (130) (2,620) (107) Underlying RC profit attributable to BP shareholders 4,799 4,985 5,504
Number of shares(a) Basic weighted average number of shares outstanding (thousand) 18,976,062 18,966,159 18,816,868 ADS equivalent (thousand) 3,162,677 3,161,026 3,136,145
Weighted average number of shares outstanding used to calculate diluted earnings per share (thousand) 19,240,896 19,215,844 19,038,387 ADS equivalent (thousand) 3,206,816 3,202,641 3,173,065
Shares in issue at period-end (thousand) 19,016,208 18,977,214 18,866,532 ADS equivalent (thousand) 3,169,368 3,162,869 3,144,422
(a) Excludes treasury shares and the shares held by the Employee Share Ownership Plan Trusts (ESOPs) and includes certain
shares that will be issued in the future under employee share plans.

30
Notes
7. Analysis of changes in net debt(a)
First Fourth First quarter quarter quarter 2012 2011 2011 $ million Opening balance Finance debt 44,213 45,283 45,336 Less: Cash and cash equivalents 14,067 17,997 18,556 Less: FV asset of hedges related to finance debt 1,133 1,454 916 Opening net debt 29,013 25,832 25,864
Closing balance Finance debt 46,470 44,213 47,102 Less: Cash and cash equivalents 14,092 14,067 18,726 Less: FV asset of hedges related to finance debt 1,224 1,133 870 Closing net debt 31,154 29,013 27,506 Increase in net debt (2,141) (3,181) (1,642)
Movement in cash and cash equivalents (excluding exchange adjustments) (93) (3,684) (25) Net cash outflow (inflow) from financing (excluding share capital) (2,061) (3,661) (3,244) Movement in finance debt relating to investing activities(b)(c) – 4,470 1,595 Other movements (7) (184) (21) Movement in net debt before exchange effects (2,161) (3,059) (1,695) Exchange adjustments 20 (122) 53 Increase in net debt (2,141) (3,181) (1,642)
(a) Net debt is a non-GAAP measure. (b) During the first quarter 2012 no disposal transactions were completed in respect of which deposits had been received in
advance (fourth quarter 2011 $940 million, first quarter 2011 $1,595 million). At 31 March 2012, finance debt includes $30 million of deposits received in advance relating to disposal transactions ($30 million at 31 December 2011, $4.6 billion at 31 March 2011).
(c) Fourth quarter 2011 includes the repayment of the deposit of $3,530 million following the termination of the Pan American Energy LLC sale agreement as described in Note 5 of BP Annual Report and Form 20-F 2011 on page 197.
At 31 March 2012, $136 million of finance debt ($131 million at 31 December 2011 and $796 million at 31 March 2011) was secured by the pledging of assets, and no finance debt was secured in connection with deposits received relating to disposal transactions expected to complete in subsequent periods (nil at 31 December 2011 and $3,530 million at 31 March 2011). In addition, in connection with $2,201 million of finance debt ($2,344 million at 31 December 2011 and $3,799 million at 31 March 2011), BP has entered into crude oil sales contracts in respect of oil produced from certain fields in offshore Angola and Azerbaijan to provide security to the lending banks. The remainder of finance debt was unsecured. During the first quarter 2011, the company signed new three-year committed standby facilities totalling $6.8 billion, available to draw and repay until mid-March 2014, largely replacing existing arrangements. At 31 March 2012, the total available undrawn committed borrowing facilities stood at $6.9 billion ($6.9 billion at 31 December 2011 and $7.5 billion at 31 March 2011).
8. Statutory accounts The financial information shown in this publication, which was approved by the Board of Directors on 30 April 2012, is unaudited and does not constitute statutory financial statements. BP Annual Report and Form 20-F 2011 has been filed with the Registrar of Companies in England and Wales; the report of the auditors on those accounts was unqualified and did not contain a statement under section 498(2) or section 498(3) of the UK Companies Act 2006.

31
Legal proceedings
The following discussion sets forth the developments in the group’s material legal proceedings during the recent period. For a full discussion of the group’s material legal proceedings, please see pages 160 - 166 of our Annual Report and Form 20-F 2011. Proceedings relating to the Deepwater Horizon oil spill i) On 18 April 2012 BP announced that it had reached definitive and fully documented agreements with the Plaintiffs’
Steering Committee (PSC) in the federal Multi-District Litigation proceedings pending in New Orleans (MDL 2179) to resolve the substantial majority of legitimate private economic loss and medical claims stemming from the Deepwater Horizon accident and resulting oil spill. The settlement agreements are consistent with the terms of the proposed settlement announced on 3 March 2012, one resolving economic loss and property damage claims and the other resolving medical claims.
Under the economic loss agreement, there are agreed compensation protocols for the payment of class members’ economic losses and property damages. In addition, many economic loss class members will also receive payments based on negotiated risk transfer premiums (RTPs), which are multipliers designed to compensate claimants for potential future losses relating to the accident, along with other potential damages. A new claims facility will open within 30 days of the granting of preliminary approval by the court (unless otherwise ordered by the court) and will operate under the frameworks established by the economic loss and property damage settlement agreement.
Under the medical settlement agreement, payments will be made based on a matrix for certain specified physical conditions. Although claims will not be paid until final approval of the medical settlement agreement, class members will be permitted to file claim forms in advance of any effective date of the settlement to facilitate prompt administration of the medical settlement should it be approved. The agreement also provides for a 21-year periodic medical consultation programme for qualifying class members. Class members claiming later-manifested physical conditions may pursue their claims in the future through a mediation/litigation process, but waive the right to seek punitive damages. Under the agreement, BP has also agreed to provide $105 million to the Gulf Region Health Outreach Program to improve the availability, scope and quality of healthcare in Gulf communities. This healthcare outreach programme is intended to benefit both class members and others in those communities. The parties have filed for preliminary approval of the settlement agreements. As part of the motions seeking approval, the parties have asked the court to approve proposed plans to notify class members of their rights under the settlement agreements and schedule fairness hearings. Once these hearings have taken place, the court will decide whether to give final approval to each settlement agreement. BP has also asked the court to adjourn the MDL 2179 liability trial until after it determines whether to grant final approval of the settlement agreements. Under US federal law, there is an established procedure for determining the fairness, reasonableness and adequacy of class action settlements. Pursuant to this procedure, there would be an extensive notification to the public, including through direct mail, print and broadcast media, and a website, to explain settlement agreements, class members’ rights, including the right to “opt out” of the classes, and the processes for making claims. Under the settlement, class members would release and dismiss their claims against BP. After final approval of the settlement, claims of class members who have not excluded themselves from the settlement will be dismissed. The settlement is not an admission of liability by BP. The settlement agreements do not include claims made against BP by the Department of Justice or other federal agencies (including under the Clean Water Act and for Natural Resource Damages under the Oil Pollution Act) or by the states and local governments. Also excluded are certain other claims against BP, such as securities and shareholder claims pending in MDL 2185, and claims based solely on the deepwater drilling moratorium and/or the related permitting process.
ii) On 30 March 2012, the judge in the federal multi-district litigation proceeding in Houston (MDL 2185) issued a decision
granting the defendants’ motions to dismiss the ERISA case related to BP share funds in several employee benefit savings plans. On 11 April 2012, plaintiffs requested leave to file an amended complaint.
On 19 and 20 April 2012, five new cases were filed in state and federal courts on behalf of one or more state, county or municipal pension funds against BP entities and several current and former officers and directors seeking damages for alleged losses those funds suffered because of their holdings of BP ordinary shares and, in two cases, ADSs. The funds assert various state law and federal law claims.

32
Legal proceedings
Other legal proceedings On 23 April 2012, BP Argentina Exploration Company and BP Alternative Energy North America Inc. (BP) filed a declaratory judgment action in federal court in New York against Bridas Corporation and Bridas Investments Ltd. (Bridas). BP seeks a declaration of the validity of (1) the 28 November 2010 Share Purchase Agreement between BP and Bridas, including the Area of Mutual Interest Waiver and Release, and (2) the 28 November 2010 Settlement Agreement. BP claims that after Bridas terminated the Share Purchase Agreement in November 2011 and BP wired $700 million to Bridas after termination, the Area of Mutual Interest Waiver and Release and the Settlement Agreement remained enforceable, notwithstanding Bridas’ fraud claims, which BP believes have no basis.
Contacts
London United States
Press Office David Nicholas Scott Dean +44 (0)20 7496 4708 +1 630 420 4990 Investor Relations Jessica Mitchell Nick Wayth bp.com/investors +44 (0)20 7496 4962 +1 281 366 3123