boreal partners in flight working group 1996 annual … partners in flight working group 1996 annual...
TRANSCRIPT
Boreal Partners in Flight Working Group
1996 Annual Report
Brad A. Andres, U. S. Fish and Wildlife ServiceColleen M. Handel, National Biological Service
Charla Sterne, National Biological ServiceMark Schroeder, National Park Service
Anne Morkill, Bureau of Land Management
14 February 1997

BOREAL PARTNERS IN FLIGHT WORKSHOP AGENDA . . . . . . . . . . . . . . . . . . . . . . . . . . . 1
INVENTORY, MONITORING, AND RESEARCH . . . . . . . . . . . . . . . . . . . . . . . . . . . . . . . . . . 4
BREEDING BIRD INVENTORIES . . . . . . . . . . . . . . . . . . . . . . . . . . . . . . . . . . . . . . . . . 4BREEDING BIRD SURVEY ROUTES . . . . . . . . . . . . . . . . . . . . . . . . . . . . . . . . . . . . . . 4MIST-NETTING AND BANDING . . . . . . . . . . . . . . . . . . . . . . . . . . . . . . . . . . . . . . . . . . 9OFF-ROAD POINT COUNT PROGRAM . . . . . . . . . . . . . . . . . . . . . . . . . . . . . . . . . . . 15
INFORMATION AND EDUCATION . . . . . . . . . . . . . . . . . . . . . . . . . . . . . . . . . . . . . . . . . . . . 21
1996 INTERNATIONAL MIGRATORY BIRD DAY . . . . . . . . . . . . . . . . . . . . . . . . . . 211997 INTERNATIONAL MIGRATORY BIRD DAY . . . . . . . . . . . . . . . . . . . . . . . . . . 25RESOURCES . . . . . . . . . . . . . . . . . . . . . . . . . . . . . . . . . . . . . . . . . . . . . . . . . . . . . . . . . 29
CONSERVATION PLANNING . . . . . . . . . . . . . . . . . . . . . . . . . . . . . . . . . . . . . . . . . . . . . . . . . 29
BIRD INVENTORY AND MONITORING IN NORTHWEST ALASKA AREAS . . . . . . . . . 31
1996 PROJECT DESCRIPTIONS . . . . . . . . . . . . . . . . . . . . . . . . . . . . . . . . . . . . . . . . . 31PROPOSED PROJECTS FOR 1997 . . . . . . . . . . . . . . . . . . . . . . . . . . . . . . . . . . . . . . . . 32
ACTION PLAN . . . . . . . . . . . . . . . . . . . . . . . . . . . . . . . . . . . . . . . . . . . . . . . . . . . . . . . . . . . . . . 33
INVENTORY AND MONITORING . . . . . . . . . . . . . . . . . . . . . . . . . . . . . . . . . . . . . . . 33RESEARCH . . . . . . . . . . . . . . . . . . . . . . . . . . . . . . . . . . . . . . . . . . . . . . . . . . . . . . . . . . . 34INFORMATION AND EDUCATION . . . . . . . . . . . . . . . . . . . . . . . . . . . . . . . . . . . . . . 36

1
BOREAL PARTNERS IN FLIGHT WORKSHOP AGENDADecember 3-4, 1996
U.S. Fish and Wildlife Service Regional OfficeGordon W. Watson Conference Room
1011 East Tudor RoadAnchorage, Alaska
Tuesday, December 3rd
8:10 am Welcome and introductions — Brad Andres, Chair, Boreal PIF.
Inventory, Monitoring, Research
8:20 am 1996 Breeding Bird Survey in Alaska — Brad Andres, USFWS.
8:40 am 1996 Mist-netting and banding efforts in Alaska, British Columbia andYukon — Donna Dewhurst, Alaska Peninsula/ Becharof NWR.
9:00 am 1996 off-road point count program — Colleen Handel, USGS-BRD.
9:20 am Trends from feeder counts in Fairbanks — John Wright, ADF&G.
9:40 am Highlights of five years of mist-netting at Creamer’s Field — Anna MarieBarber, Alaska Bird Observatory.
10:00 am Break.
Information and Education
10:10 am Update on "Teaming with Wildlife", the Fish and Wildlife DiversityFunding Initiative — John Schoen, ADF&G.
10:20 am International Migratory Bird Day 1996 — Charla Sterne, USGS-BRD.
10:40 am Status of BPIF slide show — Mark Schroeder, Northwest Areas, NPS.
11:00 am Availability of Alaska bird song CD and Bird Song Master software —John Wright.
11:20 am Additional references for the Alaska Landbird Bibliographic Database —Brad Andres.

2
11:30 am Discussion on training needs and opportunities for 1996 — Brad Andres.
11:50 am Lunch.
Management
1:00 pm Report on the spruce bark beetle workshop held at Anchorage in October1996 — Colleen Handel.
1:20 pm Effects of placer mining on riparian birds — Anne Morkill, BLM,Northern District.
The Conservation Plan
1:40 pm Partners in Flight in the western United States -- where we are heading —Terry Rich, Chair, PIF Western Working Group.
2:20 pm Overview of the Conservation planning process and The Flight Plan —Carol Beardmore, PIF Western Regional Coordinator.
3:20 pm Break.
3:30 pm Step 1. Identify species and habitat priorities for landbird conservation —Carol Beardmore, Terry Rich.
3:50 pm Species and habitat prioritization for Southeast Alaska — Brad Andres.
4:10 pm Break out into biogeographic regional groups and finalize ranks andprimary/secondary habitats for all landbird species breeding within theregion. Tools: draft species/habitat priority lists, BBS trends.
5:30 pm Adjourn.
6:00 pm No host reception at the Railroad Brewing Company
Wednesday, December 4th
8:10 am Continue review of species/habitat priority lists in regional groups.
10:20 am Break.

3
10:30 am Identify monitoring/research needs: baseline, human-induced changes,comparative, global responsibility for all species. Determine level ofmonitoring needed for each species: distribution, relative abundance,population trends, habitat requirements, reproductive success,survivorship, wintering.
11:30 am Lunch.
12:40 pm Review habitat requirements of priority species and assign species toparticipants. Summarize progress in Biogeographic regional groups.
2:40 pm Break.
2:50 pm Break out into technical working groups to review action items and set onenew action item that will be accomplished in 1997.
5:00 pm Summarize technical action items for 1997.
5:30 pm Adjourn.
4
INVENTORY, MONITORING, AND RESEARCH
BREEDING BIRD INVENTORIES
Brad A. Andres, U.S. Fish and Wildlife Service
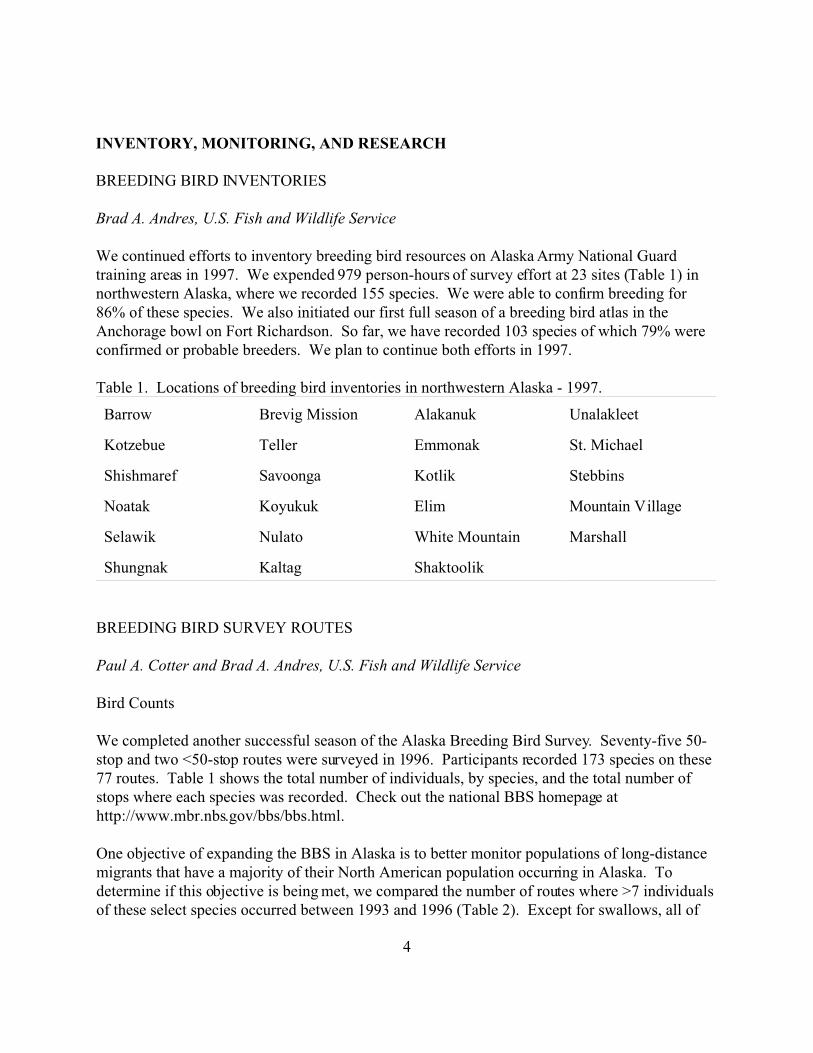
We continued efforts to inventory breeding bird resources on Alaska Army National Guardtraining areas in 1997. We expended 979 person-hours of survey effort at 23 sites (Table 1) innorthwestern Alaska, where we recorded 155 species. We were able to confirm breeding for86% of these species. We also initiated our first full season of a breeding bird atlas in theAnchorage bowl on Fort Richardson. So far, we have recorded 103 species of which 79% wereconfirmed or probable breeders. We plan to continue both efforts in 1997.
Table 1. Locations of breeding bird inventories in northwestern Alaska - 1997.
Barrow Brevig Mission Alakanuk Unalakleet
Kotzebue Teller Emmonak St. Michael
Shishmaref Savoonga Kotlik Stebbins
Noatak Koyukuk Elim Mountain Village
Selawik Nulato White Mountain Marshall
Shungnak Kaltag Shaktoolik
BREEDING BIRD SURVEY ROUTES
Paul A. Cotter and Brad A. Andres, U.S. Fish and Wildlife Service
Bird Counts
We completed another successful season of the Alaska Breeding Bird Survey. Seventy-five 50-stop and two <50-stop routes were surveyed in 1996. Participants recorded 173 species on these77 routes. Table 1 shows the total number of individuals, by species, and the total number ofstops where each species was recorded. Check out the national BBS homepage athttp://www.mbr.nbs.gov/bbs/bbs.html.
One objective of expanding the BBS in Alaska is to better monitor populations of long-distancemigrants that have a majority of their North American population occurring in Alaska. Todetermine if this objective is being met, we compared the number of routes where >7 individualsof these select species occurred between 1993 and 1996 (Table 2). Except for swallows, all of

5
these species were recorded on more, or the same number of, routes in 1996 than in 1993. Formany species the increases were fairly dramatic (i.e. the increase exceeded the 13% increase inroute coverage). Thus, the new routes are increasing coverage of these long-distance migrantspecies.
With completion of the 1996 field season, Marjorie Ward is retiring from her Sitka BBS route. She has consistently surveyed this route for 13 years from 1984 to 1996. I applaud her for herperseverance. Marjorie is certainly a model of observer consistency that we should all try toemulate.
Table 2. Total numbers of birds recorded in Alaska Breeding Bird Survey routes in 1996 (n = 77 routes) and the
number of stops where species were detected (n = 3805).
Species Total birds Total stops Species Total birds Total stops
Red-throated Loon 11 9 Peregrine Falcon 3 2
Pacific Loon 23 16 Gyrfalcon 2 2
Common Loon 35 30 Ring-necked Pheasant 10 9
Horned Grebe 8 6 Spruce Gro use 2 2
Red-necked Grebe 40 22 Blue Grouse 53 50
Double-crested Cormorant 3 1 Willow Ptarmigan 88 67
Pelagic Cormorant 8 3 Rock Ptarmigan 27 20
Great Blue Heron 6 5 Ruffed Grouse 3 3
Whistling Swan 64 9 Sora 2 2
Trumpeter Swan 36 22 Sandhill Crane 73 44
Greater W hite-fronted Goose 124 23 American Golden-Plover 19 17
Canada G oose 356 99 Pacific Golden-Plover 31 20
Green-winged Teal 160 50 Semipalmated Plover 42 32
Mallard 102 38 Killdeer 2 1
Northern Pintail 24 12 Black Oystercatcher 2 1
Cinnamon Teal 1 1 Greater Yellowlegs 58 48
Northern Shoveler 64 13 Lesser Yellowlegs 199 156
American Wigeon 317 82 Solitary Sandpiper 39 35
Ring-necked Duck 19 7 Wandering Tattler 7 7
Greater Scaup 124 34 Spotted Sandpiper 179 127
Lesser Scaup 65 20 Upland Sandpiper 1 1
Unidentified Eider 2 1 Whimbrel 46 34
Harlequin Duck 56 14 Bristle-thighed Curlew 1 1
Oldsquaw 17 8 Hudso nian God wit 2 2
Black Scoter 29 8 Bar-tailed G odwit 25 18
Surf Scoter 93 27 Ruddy Turnstone 6 6
White-winged Scoter 7 2 Semipalmated Sandpiper 7 3
Comm on Gold eneye 12 9 Western Sandpiper 24 21
Barrow 's Goldene ye 17 6 Least Sandpiper 52 39
Bufflehead 39 13 Rock Sandpiper 130 48

Species Total birds Total stops Species Total birds Total stops
6
Common Merganser 19 16 Short-billed Dowitcher 20 16
Red-breasted Merganser 74 33 Common Snipe 601 498
Osprey 5 5 Red-necked Phalarope 63 22
Bald E agle 323 166 Parasitic Jaeger 2 2
Northern Harrier 6 6 Long-tailed Jaeger 124 86
Sharp-shinned Hawk 4 4 Bonap arte's Gull 7 6
Northern Goshawk 1 1 Mew G ull 404 138
Red-tailed Hawk 7 7 California G ull 1 1
Rough-legged Hawk 3 2 Herring G ull 23 11
American Kestrel 3 3 Glauco us-winged G ull 459 110
Merlin 8 7 Glauco us Gull 77 11
Black-legged Kittiwake 395 7 Boreal Chickadee 59 47
Unidentified Gull 4 2 Chestnut-backed Chickadee 178 116
Arctic Tern 218 67 Red-breasted Nuthatch 22 22
Aleutian Tern 23 8 Brown Creeper 3 3
Pigeon Guillemot 27 8 Winter Wren 362 266
Marbled Murrelet 148 62 Arctic Warbler 271 164
Rock Dove 31 6 Golden-crowned Kinglet 58 49
Great Horned Owl 3 3 Ruby-crowned Kinglet 889 699
Northern Hawk Owl 3 3 Bluethroat 5 5
Northern Pygmy-Owl 1 1 Northern Wheatear 10 10
Great Gray Owl 1 1 Townsend's Solitaire 12 12
Short-eared Owl 21 18 Gray-cheeked T hrush 593 410
Rufous Hummingbird 51 46 Swainson's Thrush 2261 1274
Belted Kingfisher 42 37 Hermit Thrush 1298 779
Yellow-bellied Sapsucker 1 1 American Robin 1975 1302
Red-breasted Sapsucker 45 41 Varied Th rush 1654 977
Downy Woodpecker 24 21 Yellow W agtail 95 69
Hairy Woodpecker 36 33 American Pipit 28 22
Three-toed Woodpecker 14 12 Bohemian Waxw ing 35 27
Black-backed Woodpecker 1 1 European Starling 5 4
Yellow-shafted Flicker 27 26 Warbling Vireo 24 21
Red-shafted Flicker 1 1 Tennessee Warbler 1 1
Olive-sided Flycatcher 147 138 Orange-crowned Warbler 1811 1221
Western Wood-Pewee 47 38 Yellow Warbler 647 437
Yellow-bellied Flycatcher 1 1 Yellow-rumped Warbler 1312 955
Alder Flycatcher 1285 791 Townsend's Warbler 346 234
Least Flycatcher 1 1 Blackpoll Warbler 416 325
Unidentified Empidonax 1 1 American Redstart 11 9
Hammond's Flycatcher 114 101 Northern W aterthrush 774 444
Pacific-slope Flycatcher 203 157 MacGillivray's Warbler 15 15
Say's Phoebe 10 9 Common Yellowthroat 24 18

Species Total birds Total stops Species Total birds Total stops
7
Horned Lark 3 3 Wilson's Warbler 1373 915
Tree Swallow 253 120 Western Tanager 8 8
Violet-green Swallow 120 57 American Tree Sparrow 545 344
Bank Swallow 428 64 Chipping Sparrow 31 29
Cliff Swallow 417 28 Savannah Sparrow 1106 674
Barn Swallow 24 10 Fox Sparrow 1155 783
Gray Jay 379 303 Song Sparrow 129 94
Steller's Jay 99 81 Lincoln's Sparrow 427 304
Black-billed Magp ie 134 83 Golden-crowned Sparrow 534 323
Northwestern Crow 493 111 White-crowned Sparrow 1750 1056
Common Raven 406 240 Dark-eyed Junco 1900 1268
Black-capped Chickadee 76 53 Lapland Longspur 678 254
Snow Bunting 3 3 Red Cr ossbill 138 12
Red-winged Blackbird 6 5 White-win ged Cro ssbill 288 43
Rusty Blackbird 57 49 Comm on Red poll 1377 748
Gray-crowned Rosy-Finch 10 7 Pine Siskin 218 107
Pine Grosbeak 32 27
Table 3. Numbers of Breeding Bird Survey routes where >7 individuals were recorded in 1993 (n = 68 routes) and
1996 (n = 77 routes). Depicted species are long-distance migrants that have >25% of their North American
population occurring in Alaska.
No. of routes No. of routes
Species 1993 1996 Species 1993 1996
Rufous Hummingbird 2 2 Hermit Thrush 22 30
Alder Flycatcher 32 39 American Pipit 1 1
Hammond's Flycatcher 2 7 Orange-crowned Warbler 38 57
Pacific-slope Flycatcher 6 6 Yellow-rumped Warbler 29 44
Say's Phoebe 0 0 Townsend's Warbler 8 12
Violet-green Swallow 8 5 Blackpoll Warbler 10 16
Bank Swallow 14 12 Northern W aterthrush 11 18
Ruby-crowned Kinglet 18 40 Wilson's Warbler 28 40
Townsend's Solitaire 0 0 Savannah Sparrow 28 35
Gray-cheeked T hrush 21 24 Lincoln's Sparrow 13 20
Swainson's Thrush 41 47 White-crowned Sparrow 42 46

8
Habitat Classification
In 1996, we began a habitat assessment of Breeding Bird Survey (BBS) routes in Alaska. Habitatclassification was adapted from the 5-level Alaska vegetation classification scheme of Viereck etal. (1992). This system identifies vegetation communities in Alaska from general structuralcomponents (level I) to species composition (level V). Due to the detail needed to classify tolevel V, and its questionable relevance to bird-use patterns, we chose to restrict our habitatassessment to level III (that emphasized structural components of the habitat).
Viereck et al. (1992) divide primary vegetation types into 3 major (level I) classes: forest, scruband herbaceous. Each vegetation type is further divided by structural features (e.g., percentcanopy cover, height) and taxonomic characteristics. Level II forests include needleleaf,broadleaf and mixed. Level III forest classifications describe crown canopy coverage: closed (60- 100% canopy cover), open (25 - 60% canopy cover) and woodland (10 - 25% canopy cover). Asecondary classification, that described percent and type of cover provided by understoryvegetation, was added for open and woodland forests.
Scrub classes II and III are based on shrub height and percent canopy cover. Level II scrubclasses include: dwarf tree, tall scrub, low scrub, and dwarf scrub. Dwarf tree scrub consists ofcommunities with >10% vegetative cover in tree species that will not, at that location, attain aheight >3 m. Tall scrub vegetation is >1.5 m, with tall shrubs contributing >25% total cover. Scrub communities consisting of 0.2 - 1.5 m shrubs (>25% cover) are low scrub. Dwarf scrubvegetation is characterized by prostrate shrubs (<20 cm in height) that make up >25% ofvegetation cover. Level III classifications for dwarf tree scrub are the same as those used forforests (closed, open and woodland). Both tall and low scrub vegetation types are designated asclosed (>75% cover) or open (< 75% cover) at level III. Level III designations of dwarf scrubare by taxonomic group: Dryas dwarf scrub, ericaceous dwarf scrub, and willow dwarf scrub.
Herbaceous vegetation at level II is divided into 4 classes: graminoid herbaceous, forbherbaceous, bryoid herbaceous, and aquatic herbaceous. Level III divisions for graminoidherbaceous and forb herbaceous are based on substrate moisture content (dry, mesic, and wet). Herbaceous bryoid vegetation is divided into 2 classes at level III: mosses and lichens. Relativesalinity of surrounding water differentiates 3 classes of aquatic vegetation: freshwater, brackish,and marine.
To classify non-vegetated habitats, we added several categories adapted from Kessel (1979):beaches and tidal flats, coastal cliffs and block fields, inland cliffs and block fields, alluvia, andsubterranean soil (e.g., cut banks). Water bodies were categorized as fluviatile, lacustrine, ornear-shore (marine). Houses, buildings, parking lots and other areas modified by humans weredesignated as disturbed. Burned and logged areas were classified according to their primaryhabitat (e.g., closed, low scrub) and were noted as being either a burn or cut.
9
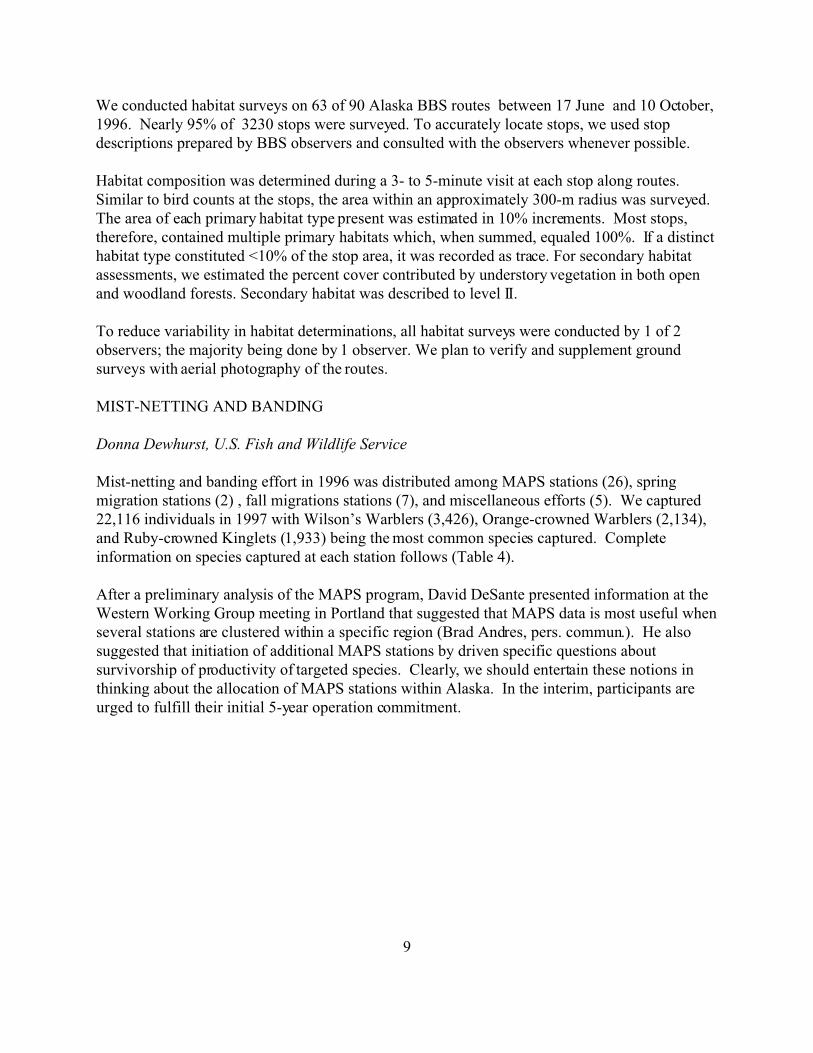
We conducted habitat surveys on 63 of 90 Alaska BBS routes between 17 June and 10 October,1996. Nearly 95% of 3230 stops were surveyed. To accurately locate stops, we used stopdescriptions prepared by BBS observers and consulted with the observers whenever possible.
Habitat composition was determined during a 3- to 5-minute visit at each stop along routes. Similar to bird counts at the stops, the area within an approximately 300-m radius was surveyed. The area of each primary habitat type present was estimated in 10% increments. Most stops,therefore, contained multiple primary habitats which, when summed, equaled 100%. If a distincthabitat type constituted <10% of the stop area, it was recorded as trace. For secondary habitatassessments, we estimated the percent cover contributed by understory vegetation in both openand woodland forests. Secondary habitat was described to level II.
To reduce variability in habitat determinations, all habitat surveys were conducted by 1 of 2observers; the majority being done by 1 observer. We plan to verify and supplement groundsurveys with aerial photography of the routes.
MIST-NETTING AND BANDING
Donna Dewhurst, U.S. Fish and Wildlife Service
Mist-netting and banding effort in 1996 was distributed among MAPS stations (26), springmigration stations (2) , fall migrations stations (7), and miscellaneous efforts (5). We captured22,116 individuals in 1997 with Wilson’s Warblers (3,426), Orange-crowned Warblers (2,134),and Ruby-crowned Kinglets (1,933) being the most common species captured. Completeinformation on species captured at each station follows (Table 4).
After a preliminary analysis of the MAPS program, David DeSante presented information at theWestern Working Group meeting in Portland that suggested that MAPS data is most useful whenseveral stations are clustered within a specific region (Brad Andres, pers. commun.). He alsosuggested that initiation of additional MAPS stations by driven specific questions aboutsurvivorship of productivity of targeted species. Clearly, we should entertain these notions inthinking about the allocation of MAPS stations within Alaska. In the interim, participants areurged to fulfill their initial 5-year operation commitment.

10

11

12

13

14

15
16
OFF-ROAD POINT COUNT PROGRAM
Colleen M. Handel, USGS-BRD
Background
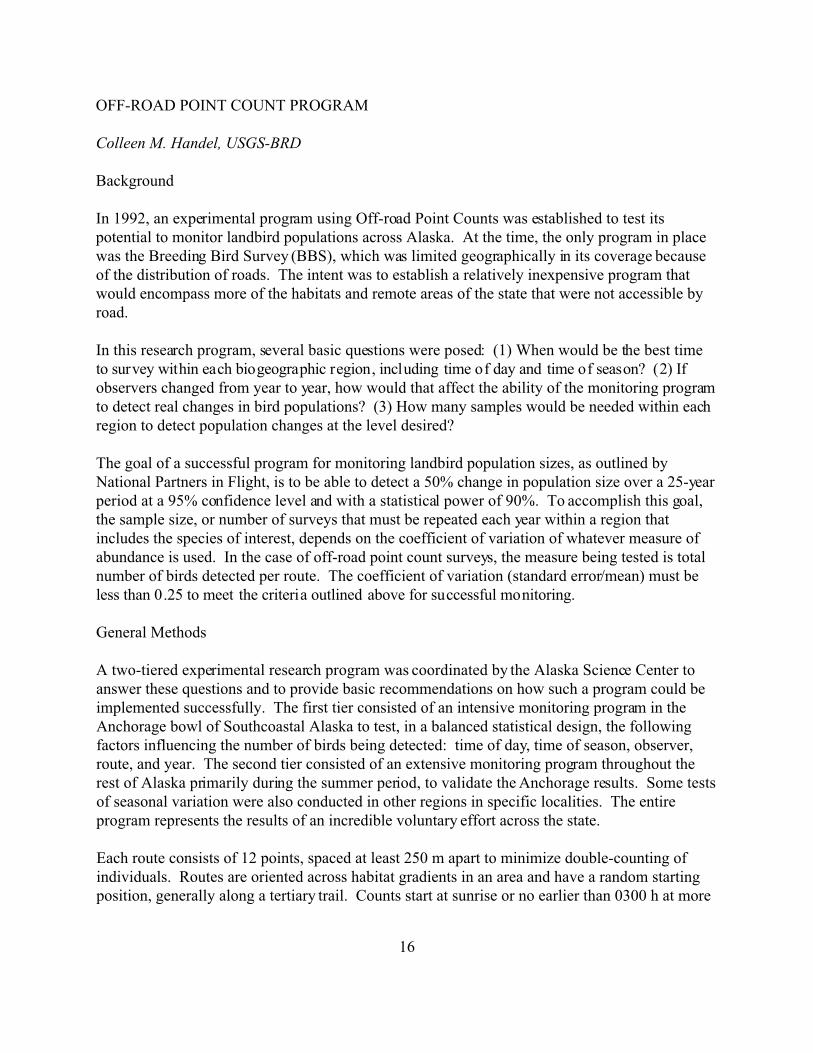
In 1992, an experimental program using Off-road Point Counts was established to test itspotential to monitor landbird populations across Alaska. At the time, the only program in placewas the Breeding Bird Survey (BBS), which was limited geographically in its coverage becauseof the distribution of roads. The intent was to establish a relatively inexpensive program thatwould encompass more of the habitats and remote areas of the state that were not accessible byroad.
In this research program, several basic questions were posed: (1) When would be the best timeto survey within each biogeographic region, including time of day and time of season? (2) Ifobservers changed from year to year, how would that affect the ability of the monitoring programto detect real changes in bird populations? (3) How many samples would be needed within eachregion to detect population changes at the level desired?
The goal of a successful program for monitoring landbird population sizes, as outlined byNational Partners in Flight, is to be able to detect a 50% change in population size over a 25-yearperiod at a 95% confidence level and with a statistical power of 90%. To accomplish this goal,the sample size, or number of surveys that must be repeated each year within a region thatincludes the species of interest, depends on the coefficient of variation of whatever measure ofabundance is used. In the case of off-road point count surveys, the measure being tested is totalnumber of birds detected per route. The coefficient of variation (standard error/mean) must beless than 0.25 to meet the criteria outlined above for successful monitoring.
General Methods
A two-tiered experimental research program was coordinated by the Alaska Science Center toanswer these questions and to provide basic recommendations on how such a program could beimplemented successfully. The first tier consisted of an intensive monitoring program in theAnchorage bowl of Southcoastal Alaska to test, in a balanced statistical design, the followingfactors influencing the number of birds being detected: time of day, time of season, observer,route, and year. The second tier consisted of an extensive monitoring program throughout therest of Alaska primarily during the summer period, to validate the Anchorage results. Some testsof seasonal variation were also conducted in other regions in specific localities. The entireprogram represents the results of an incredible voluntary effort across the state.
Each route consists of 12 points, spaced at least 250 m apart to minimize double-counting ofindividuals. Routes are oriented across habitat gradients in an area and have a random startingposition, generally along a tertiary trail. Counts start at sunrise or no earlier than 0300 h at more

17
northern latitudes. Each count is conducted for 5 minutes, with birds detected within the first 3minutes denoted separately for comparison with BBS data. The count circle is of unlimitedradius, with birds detected within 50 m of the point denoted separately for comparison withhabitat data. Most statewide surveys were conducted during one of two 10-day blocks (11-20June, 21-30 June); some surveys in Southeastern Alaska were conducted from 1-10 June.
In Anchorage, five routes were surveyed once in each 5-day block from 21 April to 30 May andthen once in each 10-day block from 31 May to 9 July to determine seasonal patterns ofdetectability. Observers were rotated in a balanced pattern, and surveys were repeated from1993-1996 to test interannual variability. An additional eight routes distributed across theAnchorage bowl were sampled from 1993-1996 according to the statewide protocol. During1992, observers were trained, diurnal variability was tested on 3 routes in five 2-hour time blocksstarting at 0430 h, and the optimal number of points per route was determined. Trainingconsisted of listening to taped songs and calls of local species as well as practicing identificationand survey methods in the local field setting.
Preliminary Results of Analyses
Some results of preliminary analyses of the Anchorage data are summarized here. Please notethat the statewide data have not yet been analyzed and the Anchorage results have not yet beenvalidated for other regions. These analyses will continue this winter, and recommendationsshould be made for the statewide program in April 1997.
Time of day — Detections of total numbers of birds and number of species remained stablethrough the first three time blocks tested: 0430-0630, 0630-0830, and 0830-1030. Numbers ofindividuals and numbers of species detected both dropped significantly during the 1030-1230time block and rose again only slightly during the 1230-1430 time block. Therefore, the firstrecommendation is that all surveys be completed between sunrise and 1030 h.
Seasonal period — Seasonal patterns of detection in the Anchorage area varied significantlyamong species. For most species, however, the patterns were quite similar among the four yearsstudied. Peak abundance consistently occurred early in the season (late April to early May) forseveral species: Black-capped Chickadee, Common Snipe, Black-billed Magpie, Ruby-crownedKinglet, Varied Thrush, American Robin, and Slate-colored Junco. A few species peaked in lateMay or early June: Myrtle Warbler, Orange-crowned Warbler, Townsend’s Warbler, Wilson’sWarbler, and Lincoln’s Sparrow. Two late-arriving species did not reach peak detectability untilmid-June: Swainson’s Thrush and Alder Flycatcher. The remaining species (of the 28 regularlyoccurring ones examined) either had long periods of high detectability or were highly variableamong years.
The next step in the analysis will be to calculate, for each species, the coefficient of variationwithin each seasonal period to determine the optimal period of sampling per species. We willthen examine the entire suite of species to determine the best single period to monitor the greatest

18
number of species from the community. We will also examine other periods to see if samplingduring an additional one or two periods would increase our ability significantly to monitor thecommunity as a whole. It is clear that if we wish to monitor the late-arriving species such asAlder Flycatchers, we will need to survey between 10 and 30 June. All other species can bemonitored during this period as well: their abundance is generally lower than earlier in theseason, but the variability is also lower. Therefore, the second recommendation is to continue tosurvey from 10-30 June if only a single survey can be completed in an area each year.
Other factors contributing to variability in counts — For the core 28 species regularly occurringon the five replicated Anchorage area routes during the four 10-day summer periods (31 May-9July), we partitioned the variance around the mean to identify which factors contributedsignificantly. For 23 of the 28 species (82%), the mean number of detections varied significantlyamong the five routes, which was not unexpected since they sampled different arrays of habitat inthe study area. Over half (54%) of the species showed significant seasonal variation indetectability among the four summer periods, but none of the species varied significantlybetween the last two 10-day periods of June. Only 6 of the species (21%) showed significantvariability among the four years, and there was no apparent temporal trend in numbers for those.
Surprisingly, only 5 of the species (18%) showed significant variation in detectability amongdifferent observers. These were Ruby-crowned Kinglet, Hermit Thrush, Slate-colored Junco,Golden-crowned Sparrow, and Common Redpoll. Only for the Slate-colored Junco was observerthe primary source of explained variation. For the others, the variability due to observer wasovershadowed by that due to route, seasonal period, or year. Because Slate-colored Juncos occurin relatively high abundance, this species may be one of the most difficult to count accurately,even for trained observers. In addition, their song can be easily confused, especially at adistance, with that of the Orange-crowned Warbler. It is possible that differences inmisidentification rates could contribute to the high variability recorded among observers. Since asimilar trend was not recorded for Orange-crowned Warblers, however, this may not be the case.
A few interactions between factors also explained significant amounts of variation indetectability for some species. For 6 species (21%), seasonal patterns of detection varied amongroutes. For 8 species (29%), annual patterns of detection varied among routes. And for only 2species (7%), seasonal patterns varied among years.
Based on these preliminary analyses, a tentative recommendation is that for most species,variability among observers will not be an overriding concern in design of the monitoringprogram. The caveat is, of course, that the observers must go through a rigorous trainingprogram and be very familiar with the vocalizations of birds in the survey area. The same resultswill not hold if untrained observers or individuals new to an area are used.
Minimum number of routes required — We calculated the number of routes that would berequired to monitor the population size of the 28 species of birds that were regularly recorded,based on their coefficients of variation of detectability on the 13 routes surveyed in the
19
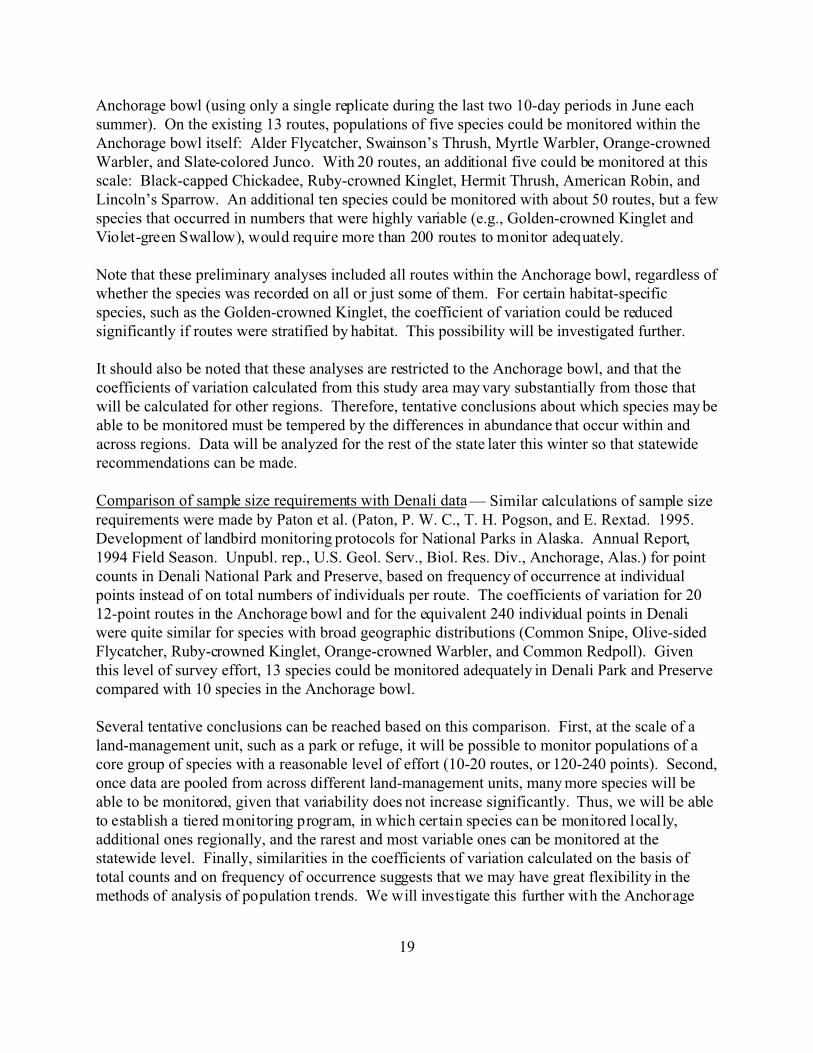
Anchorage bowl (using only a single replicate during the last two 10-day periods in June eachsummer). On the existing 13 routes, populations of five species could be monitored within theAnchorage bowl itself: Alder Flycatcher, Swainson’s Thrush, Myrtle Warbler, Orange-crownedWarbler, and Slate-colored Junco. With 20 routes, an additional five could be monitored at thisscale: Black-capped Chickadee, Ruby-crowned Kinglet, Hermit Thrush, American Robin, andLincoln’s Sparrow. An additional ten species could be monitored with about 50 routes, but a fewspecies that occurred in numbers that were highly variable (e.g., Golden-crowned Kinglet andViolet-green Swallow), would require more than 200 routes to monitor adequately.
Note that these preliminary analyses included all routes within the Anchorage bowl, regardless ofwhether the species was recorded on all or just some of them. For certain habitat-specificspecies, such as the Golden-crowned Kinglet, the coefficient of variation could be reducedsignificantly if routes were stratified by habitat. This possibility will be investigated further.
It should also be noted that these analyses are restricted to the Anchorage bowl, and that thecoefficients of variation calculated from this study area may vary substantially from those thatwill be calculated for other regions. Therefore, tentative conclusions about which species may beable to be monitored must be tempered by the differences in abundance that occur within andacross regions. Data will be analyzed for the rest of the state later this winter so that statewiderecommendations can be made.
Comparison of sample size requirements with Denali data — Similar calculations of sample sizerequirements were made by Paton et al. (Paton, P. W. C., T. H. Pogson, and E. Rextad. 1995. Development of landbird monitoring protocols for National Parks in Alaska. Annual Report,1994 Field Season. Unpubl. rep., U.S. Geol. Serv., Biol. Res. Div., Anchorage, Alas.) for pointcounts in Denali National Park and Preserve, based on frequency of occurrence at individualpoints instead of on total numbers of individuals per route. The coefficients of variation for 2012-point routes in the Anchorage bowl and for the equivalent 240 individual points in Denaliwere quite similar for species with broad geographic distributions (Common Snipe, Olive-sidedFlycatcher, Ruby-crowned Kinglet, Orange-crowned Warbler, and Common Redpoll). Giventhis level of survey effort, 13 species could be monitored adequately in Denali Park and Preservecompared with 10 species in the Anchorage bowl.
Several tentative conclusions can be reached based on this comparison. First, at the scale of aland-management unit, such as a park or refuge, it will be possible to monitor populations of acore group of species with a reasonable level of effort (10-20 routes, or 120-240 points). Second,once data are pooled from across different land-management units, many more species will beable to be monitored, given that variability does not increase significantly. Thus, we will be ableto establish a tiered monitoring program, in which certain species can be monitored locally,additional ones regionally, and the rarest and most variable ones can be monitored at thestatewide level. Finally, similarities in the coefficients of variation calculated on the basis oftotal counts and on frequency of occurrence suggests that we may have great flexibility in themethods of analysis of population trends. We will investigate this further with the Anchorage
20
and statewide datasets.
Status of Statewide Monitoring Program
During 1996, 72 routes with at least 12 points were surveyed. This represents a 20% declinefrom the 90 routes that were run in 1995 and a 40% drop from the 119 routes surveyed in 1994,the year of peak effort statewide (Table 5). Almost half (31) of the routes surveyed last summerwere in Central Alaska, 15 were run in Southcoastal Alaska, and 10 were surveyed inSouthwestern Alaska. Efforts in Western Alaska have remained low but remarkably steady, with6 routes surveyed last summer. Southeastern and Northern Alaska had the fewest routessurveyed last summer, each with a total of only 5. This represents a substantial increase forNorthern Alaska and a marked decline for efforts in Southeastern. At the current level of effort,it is unlikely that any species could be monitored at the regional level, except perhaps withinCentral and Southcoastal Alaska. Specific recommendations will be made once the statewidedata are analyzed.
A total of 156 routes has been surveyed since 1992. Among these, 9 (6%) have been surveyedfor 5 years, 22 (14%) for 4 years, 42 (27%) for 3 years, 15 (10%) for 2 years, and 68 (44%) foronly a single year. The latter group includes many that have been discontinued for a variety ofreasons and a few that were newly established in 1996. The power analysis for number of routesrequired for a monitoring project assumes that the same routes are replicated across years. Ifroutes are changed among years, it is likely that the coefficient of variation will increase, sinceroute was the single greatest contributor to variance in detections for almost all (82%) of thespecies. If routes are changed among years, then the sample size required to monitor thepopulations will increase dramatically. Therefore, a major recommendation as this experimentalprogram evolves into a bonafide monitoring program is to make a strong commitment tocontinue surveying whatever routes are permanently established for the next 20 years. Routesthat are currently established should continue to be surveyed, if resources are available, toprovide a solid baseline for monitoring long-term trends. Specific recommendations for thegeographical allocation of effort across each region will be made based on the goals formonitoring specific species.
Future Analyses
Over the next few months we will be conducting many more analyses, particularly of thestatewide data. One important issue we will examine will be how the spatial scale of monitoringwill influence sample size requirements. Will we be able to monitor some species statewide (rareor uncommon or highly variable species) and others regionally and locally? Another issue wewill address is whether or not we can use habitat data that have been collected for each point tostratify the routes and decrease the coefficient of variation. Finally, we will compare severalpossible analytical methods to determine which will be the best, in light of regular changing ofobservers and some changing of routes, for detecting declines in population size.
21
Once the analyses are completed, we will provide a set of recommendations for a basicmonitoring program, identifying key species and sample sizes needed within each region. Wewill also investigate the feasibility of establishing an additional early-season survey to monitorresident species and early breeders more effectively. Finally, we will need to determine, as aWorking Group, how to implement this monitoring program statewide and how to provide timelyfeedback to managers to trigger conservation actions when needed.
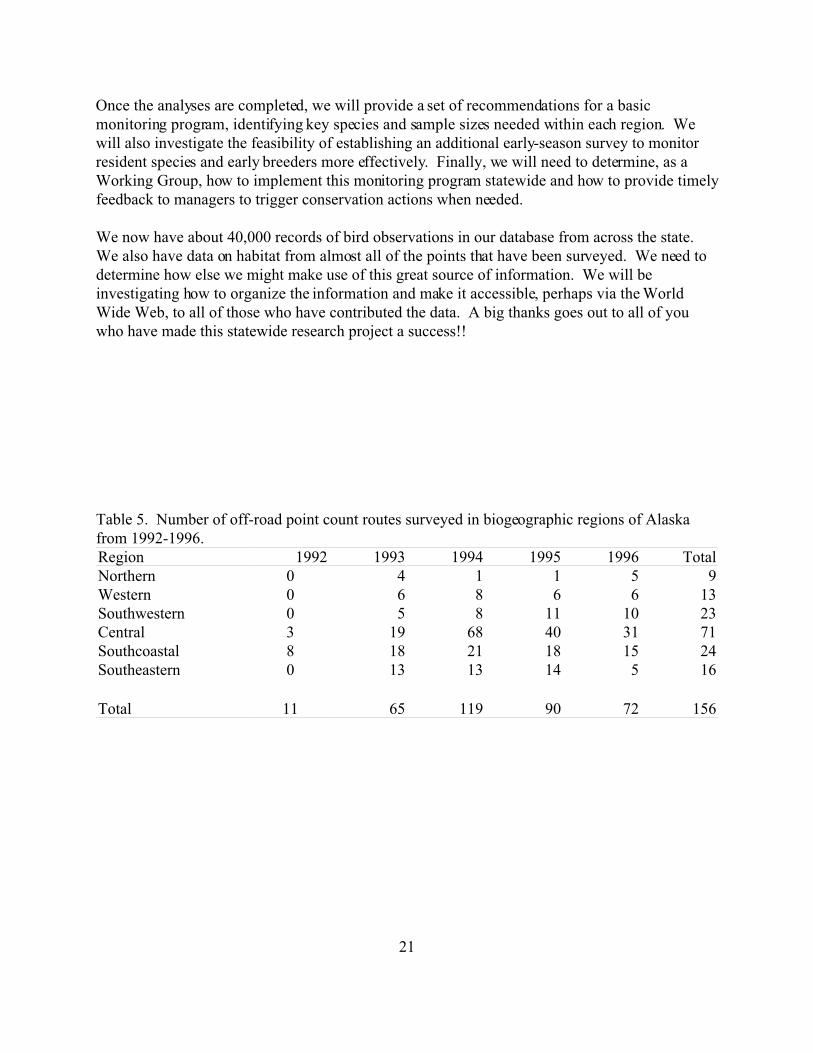
We now have about 40,000 records of bird observations in our database from across the state. We also have data on habitat from almost all of the points that have been surveyed. We need todetermine how else we might make use of this great source of information. We will beinvestigating how to organize the information and make it accessible, perhaps via the WorldWide Web, to all of those who have contributed the data. A big thanks goes out to all of youwho have made this statewide research project a success!!
Table 5. Number of off-road point count routes surveyed in biogeographic regions of Alaskafrom 1992-1996.Region 1992 1993 1994 1995 1996 TotalNorthern 0 4 1 1 5 9Western 0 6 8 6 6 13Southwestern 0 5 8 11 10 23Central 3 19 68 40 31 71Southcoastal 8 18 21 18 15 24Southeastern 0 13 13 14 5 16
Total 11 65 119 90 72 156

22
INFORMATION AND EDUCATION
Charla Sterne, USGS-BRD
1996 INTERNATIONAL MIGRATORY BIRD DAY
At the BPIF 1995 workshop the I&E technical committee identified the need to bring all IMBDparticipants together in one coordinated activity while maintaining the array of educationalopportunities currently being provided during the week long celebration. To this end, the NorthAmerican Migration Count was adopted as Alaska's IMBD hallmark event.
The timing and easy protocol of this count makes it an ideal educational tool. The NAMC is aone day count tallying species and individuals. Like the Christmas Bird Count and the BreedingBird Survey, it is a continental effort, and several Alaskans already participate. For educationalpurposes the protocol was modified to allow counts to be conducted during any continuous 24hour period between May 5 and 12. However, in order for a count to be submitted to the nationalprogram, it had to occur on May 11.
The efforts of all counters were awarded with IMBD 1996 t-shirts, posters, pins or stickers. Seventy-three individuals in 16 groups recorded a total of 162 species. The Kachemak Baygroup lead the state with 101 species and the most unusual bird, a Sora, was recorded by the Tokgroup. We had impressive coverage - from Wrangell to Barrow - and counts in several remotelocations including Hinchinbrook Island and the Noatak and Sheshalik rivers.
Overall, 10 governmental units and three nongovernmental organizations hosted activitiesincluding guided bird walks, presentations and community events. More than 1100 children,2200 adults, 10 local officials and seven members of the media participated in IMBD activities. Media outreach included 14 newspaper articles, six magazine/newsletter articles, 24 radio spotsand two television reports. IMBD 1996 participants include:
Contact ActivitySandy Frost, USFS & Cordova Chamber of Comm. Cordova Shorebird FestivalChris Dau, USFWS, Izembek NWR Birdwalk, youth programLaurie DeWispelaere, NPS, Wrangell-St. Elias NP Birdwalk, radio/tv, NAMCPeg Robertsen, USFS, Wrangell RD Radio/tv, NAMCTerry Doyle, USFWS, Tetlin NWR Adult program, NAMCJanet Warburton, USFWS, Selawik NWR Birdwalk, radio/tv, youth program, NAMCTodd Trapp, USFWS, Region 7 Birdwalk, youth program, NAMCStewart Bentley, USFS, Sitka RD BirdwalkPoppy Benson, USFWS, Alaska Maritime NWR Birdwalk, youth/adult programs, Homer
Shorebird Festival, radio/tv, NAMCC. McIntyre, NPS, Denali NP NAMC

23
Table 6. International Migratory Bird Day 1996 North American Migration Count Species List.
Red-throated LoonPacific LoonCommon LoonHorned GrebeRed-necked GrebeDouble-crested CormorantPelagic CormorantRed-faced CormorantGreat Blue HeronTundra SwanTrumpeter SwanGreater White-fronted GooseSnow GooseBrantCanada GooseGreen-winged TealMallardNorthern PintailNorthern ShovelerEurasian WigeonAmerican WigeonCanvasbackRedheadRing-necked DuckGreater ScaupLesser ScaupCommon EiderKing EiderHarlequin DuckOldsquawBlack ScoterSurf ScoterWhite-winged ScoterCommon GoldeneyeBarrow's GoldeneyeBuffleheadCommon MerganserRed-breasted MerganserOspreyBald EagleNorthern Harrier
Sharp-shinned HawkNorthern GoshawkRed-tailed HawkRough-legged HawkAmerican KestrelPeregrine FalconGyrfalconRing-necked PheasantSpruce GrouseBlue GrouseWillow PtarmiganRock PtarmiganRuffed GrouseSharp-tailed GrouseSoraSandhill CraneBlack-bellied PloverAmerican Golden-PloverSemipalmated PloverKilldeerBlack OystercatcherGreater YellowlegsLesser YellowlegsSolitary SandpiperWandering TattlerSpotted SandpiperWhimbrelHudsonian GodwitMarbled GodwitBlack TurnstoneSurfbirdRed KnotSemipalmated SandpiperWestern SandpiperLeast SandpiperPectoral SandpiperRock SandpiperDunlinShort-billed DowitcherLong-billed DowitcherCommon Snipe
Red-necked PhalaropePomarine JaegerLong-tailed JaegerBonaparte's GullMew GullHerring GullGlaucous-winged GullGlaucous GullBlack-legged KittiwakeIvory GullCaspian TernArctic TernAleutian TernCommon MurrePigeon GuillemotMarbled MurreletKittlitz's MurreletTufted PuffinHorned PuffinRock DoveGreat Horned OwlNorthern Hawk OwlShort-eared OwlNorthern Saw-whet OwlRufous HummingbirdBelted KingfisherRed-breasted SapsuckerDowny WoodpeckerHairy WoodpeckerThree-toed WoodpeckerNorthern FlickerHammond's FlycatcherPacific-slope FlycatcherTree SwallowViolet-green SwallowCliff SwallowHorned LarkGray JaySteller's JayBlack-billed MagpieAmerican Crow
24
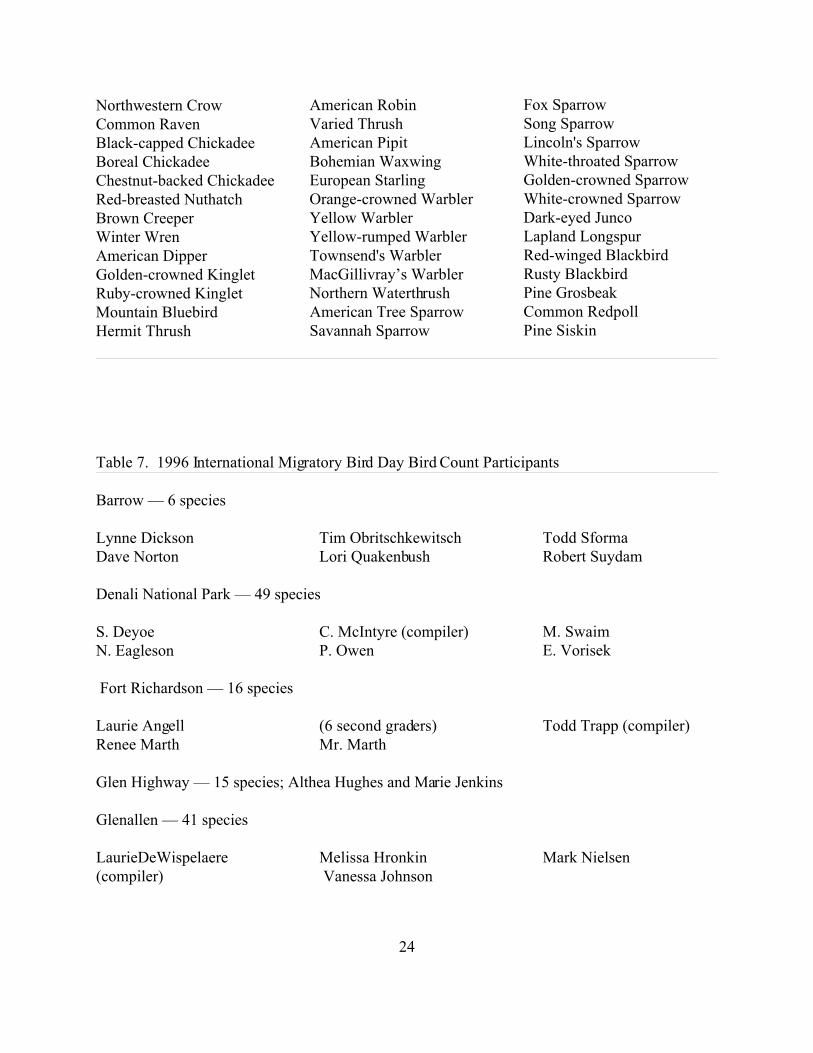
Northwestern CrowCommon RavenBlack-capped ChickadeeBoreal ChickadeeChestnut-backed ChickadeeRed-breasted NuthatchBrown CreeperWinter WrenAmerican DipperGolden-crowned KingletRuby-crowned KingletMountain BluebirdHermit Thrush
American RobinVaried ThrushAmerican PipitBohemian WaxwingEuropean StarlingOrange-crowned WarblerYellow WarblerYellow-rumped WarblerTownsend's WarblerMacGillivray’s WarblerNorthern WaterthrushAmerican Tree SparrowSavannah Sparrow
Fox SparrowSong SparrowLincoln's SparrowWhite-throated SparrowGolden-crowned SparrowWhite-crowned SparrowDark-eyed JuncoLapland LongspurRed-winged BlackbirdRusty BlackbirdPine GrosbeakCommon RedpollPine Siskin
Table 7. 1996 International Migratory Bird Day Bird Count Participants
Barrow — 6 species
Lynne DicksonDave Norton
Tim ObritschkewitschLori Quakenbush
Todd SformaRobert Suydam
Denali National Park — 49 species
S. DeyoeN. Eagleson
C. McIntyre (compiler)P. Owen
M. SwaimE. Vorisek
Fort Richardson — 16 species
Laurie AngellRenee Marth
(6 second graders)Mr. Marth
Todd Trapp (compiler)
Glen Highway — 15 species; Althea Hughes and Marie Jenkins
Glenallen — 41 species
LaurieDeWispelaere(compiler)
Melissa Hronkin Vanessa Johnson
Mark Nielsen

25
Hinchinbrook Island — 17 species; Even Evanson
Kachemak Bay — 101 species
Gentie AndersonEd BaileyBrad BenterAmy BollenbachTami BoyerMarcus Bradley
Dale ChormanHeidi CliffordBeth CummingsDon CunninghamWilly Dunne (compiler)Nina Faust
Mossy KilcherRich KleinlederDennis PaulsonAnne Weiland
Kenny Lake — 35 species; E. T. McHenry
Klutina River — 9 species; Brad Henspeter
Matanuska-Susitna Valley — 65 species; Brad Andres
Noatak — 10 species; Sally McClellan
Sheshalik — 12 species; Bob Uhl
Stikine River Delta — Peter Walsh; 54 species
Tok — 69 species
Terry Doyle (compiler)Bob FreyJim GowenNancy MazurekKathy O’Reilly-DoyleRuss Persson
Louisa ReitterBob SchulzFrances SchulzSheila ThomasHank TimmJeb Timm
Mary TimmChara TrimbleKatherine VossRichard Voss
Wrangell Island - 51 species
Scott PosnerDiane Posner
Peg RobertsonJulianne Thompson
Yakutat — 58 species; Brian Browne and Richard Capitan
26
1997 INTERNATIONAL MIGRATORY BIRD DAY
We would like to continue providing diverse opportunities for people to learn more aboutmigratory birds during IMBD week, MAY 2 - MAY 11, in 1997. Like last year, we arepromoting the North American Migration Count as Alaska’s IMBD ‘97 hallmark event. Thetiming and easy protocol of this count makes it an ideal educational tool for IMBD. Like theChristmas Bird Count and the Breeding Bird Survey, this is a continental effort. We realize thatseveral Alaskans and Yukoners are already participating in the count and several Audubonchapters hold bird-a-thons around this time. We hope to augment these existing counts, not tocompete with them.
As in 1996, we would like to target all age and skill levels in 1997. Counts should be submittedto Brad Andres who will compile the results and submit them to NAMC coordinator Jim Stasz. Don’t let any of the following rules prevent you from coordinating a count. If you have a uniquesituation and are uncertain about your ability to participate, give Brad a call (907-786-3378).
To be official and have your count submitted to the national program, the count should beconducted on the second Saturday in May (May 10, 1997) and should span no more than 24hours. For educational purposes only, we would like to extend the period to any 24 hour spanbetween May 2 and May 11.
The counting unit in Alaska should be Game Management Units rather than counties asprescribed by the protocol. Game Management Units are assigned for the entire state by AlaskaDepartment of Fish and Game. This information is essential; data will be compiled by GMU forsubmission to Jim Stasz, the NAMC national coordinator. Where your reporting form calls forcount area, enter Game Management Unit number.
One form per count should be submitted. For example, if you coordinate four small groupcounts, you will be submitting four count sheets - one for each of the counts - regardless of howmany observers were in each group. It is the coordinator’s responsibility to ensure that hours andmiles are reported correctly, to compile data from the counts he or she coordinates and to submitthe results to Brad.
All count forms should be submitted to Brad Andres no later than June 1, 1997. All participantswill receive an IMBD ‘97 poster and a summary of all species recorded on counts between May 2and May 11. Tabulated results will be submitted to NAMC national coordinator no later thanJune 30, 1997.
Following are the 1997 IMBD North American Migration Count instructions and an activityreporting form. Please submit a report of all of your IMBD activities to Brad Andres. If youwould like additional IMBD materials as they become available, please contact Brad.

27

28

29

30
31
RESOURCES
Alaska bird song CD ($30) and Bird Song Master software ($60) is available. Contact theAlaska Bird Observatory. Thanks to John Wright for seeing this project through.
Mark Schroeder, NPS, is putting the final touches on an Alaskan version of the Partners in Flightslide show. We still need to work on cost and distribution but copies may be available forIMBD. Thanks for the effort Mark.
Cordova and Homer will hold their shorebird festivals during the weekend of IMBD. Fairbanksand Anchorage are planning city-wide events for weekends around IMBD.
CONSERVATION PLANNING
As I have previously mentioned, Partners in Flight is embarking on a national conservationplanning effort. The general purpose is to use the tools of PIF (monitoring, research, I&E,management, international) to actively conserve birds and their habitats and associated humanuse of avian resources. The planning process is not a new dimension of PIF, but a way to haveits following a better blueprint. Below is a summary of the plan that I have previously presented.
PIF principles:! conserve before endangerment! enhance conservation of habitats! conserve on breeding, migration and wintering areas! inform birding constituency! develop innovative partnerships
Key points: Conservation of bird habitats — across the landscape, ecosystem, hemisphere, globe— focused, cooperative, adaptive, effective
Steps:1. Identify and rank species most in need of conservation.2. Establish population and habitat conservation objectives.
a. describe the habitat conditions and management practices favorable topriority species or species suites.
b. set objectives for the nature, extent, and distribution of favorable habitatconditions or populations of priority birds.
3. Identify habitat conservation partnerships that will accomplish objectives of step2.a. landscape-wide conservation partnershipsb. important bird areas (discrete, core sites)c. best management practices
4. Implement plans and monitor progress

32
Carol Beardmore, Western Regional PIF Coordinator, and Terry Rich, Western Working GroupChair, sparked the Alaska conservation planning process at our December meeting. BPIF hasdecided to pursue conservation plans at the biogeographic regional level. At that meeting, wemet in biogeographic regional groups to work on species and habitat priorities and habitatrequirements of priority species. Drafts of FINAL species/habitat priories are available forSouthcoastal from Colleen Handel, and will some be available for the other regions. As draftsbiogeographic regional plans take shape, please distribute them to BPIF members in theregion and to all technical/biogeographic regional chairs. At the meeting, we assignedparticipants to produce general habitat/distribution descriptions of high priority (being collatedby Paul Cotter, USFWS). The list of species assignments follows.
WWCR, ALFL: Paul CotterTISP: Terry DoyleOSFL, HAFL, BOOW, GGOW: John WrightBLPW, GCTH: Brian McCafferyMCBU, GCSP: Brad AndresARWA, SEOW: Mark SchroederSITI: Mark Schroeder/Buddy JohnsonBOCH: Buddy JohnsonSMLO: Shelli Swanson/Bruce BennettRLHA, GYRF: Shelli SwansonNOWA: Bruce BennettWTPT: Andy AdermanVATH: Andy Aderman/Mark BertramRUBL: Kristine SowlBOWA: Mark Schroeder/Kristine SowlNSHR: Ted Swem/Buddy JohnsonTOWA: Anne Morkill/Steve MatsuokaGOEA: Carol McIntyreAMDI: Shelly Swanson/Anne MorkillSTGR: Steve DuboisNOGO:
When identifying monitoring/research needs of high priority, and all, species the followingconsiderations were suggested.
1. baseline--prior to disturbance2. for changes due to human or natural impacts3. for comparative purposes with lower 48, i.e. high priority species affected by
cowbird parasitism4. for global monitoring responsibility
33
Information on the level of monitoring needed for each species was should also be considered inconservation plans:
1. distribution 2. relative abundance 3. population trends (what techniques should be used) 4. habitat requirements 5. reproductive success ( and/or demographic data) 6. survivorship
7. winter
BIRD INVENTORY AND MONITORING IN NORTHWEST ALASKA AREAS
Mark Schroeder, National Park Service
1996 PROJECT DESCRIPTIONS
Survey Breeding Songbirds: This project consisted of a Breeding Bird Survey (BBS) andOff-Road Point Counts (ORPC). The BBS was completed by USFWS personnel tosystematically count birds at 50 points along the Red Dog haul road. The ORPC's wereconcentrated near the Kelly River Field Station. The ORPC effort is a statewide effort to obtainsimilar data as the BBS, but in roadless areas. Because only 12 points can be completed in amorning and weather is an important consideration, several mornings were required. Two routeswere completed in 1996. The objectives of both efforts are to systematically monitor passerinepopulation trends in a statistically valid manner. The Noatak possesses prime tracts of borealforest and we are committed to contributing to national databases as well as to monitor keypasserine species for the entire US if possible. For example, two important species that breed inthe Noatak are the Blackpoll warbler and the Gray-cheeked thrush, neotropical migrants thatwinter in the Caribbean and Amazon basin, respectively. The Noatak is perhaps the only park inthe US where these birds breed in sufficient numbers to adequately monitor. As such, NWAK isevaluating the feasibility of taking the lead in monitoring these and similar migratory species.
Shorebird Nest Plots: Nesting shorebirds were studied as part of a special focus project1991-1993. Mark Schroeder assumed responsibility for the project in mid-1992 and completed afinal report. An important recommendation in that report called for determining migrationpatterns of coastal species as well as continued monitoring of the most productive shorebirdnesting plots in key tundra habitats. With continual turnover in the NPS NWAK resourcemanagement staff neither has received any attention. No follow-up shorebird work wasconducted until 1996, despite stationing NWAK personnel at CAKR in 1993 and 1994. In 1996,Schroeder and a GS-3 assistant rope-dragged six nesting plots in one specific shorebird breedinghabitat. This 2-person effort was inadequate to locate shorebird nests, determine differences inproductivity between habitats, and assess natural year-to-year variation. Future minimal efforts
34
we propose include stationing a seasonal biologist at CAKR prior to migration in order todocument arrival times and peak abundance of the most important species. A minimumthree-person team would complete rope-dragging on the three most productive nesting habitats. These studies would be integrated with shorebird projects conducted at Cape Espenberg (BELA)as much as possible.
Bird Inventory--Area Searches: Interagency biologists continued to survey for montane nestingshorebirds. Using GIS technology, several areas were identified as possible Bristle-thighedCurlew nesting areas. About a third of these remote areas were searched in 1996. While nocurlews were found during these limited surveys, important brood aggregation areas andpreviously unknown high density breeding areas for other shorebird species were documented(Gill, Schroeder, and Schnorr 1996). The remaining areas to be searched will require helicopteraccess during the break-up period.
A recently published bird checklist summarized published information for the birds found ineach of the park units. This list will be updated following the documentation of several speciesin each of the units by biologists in 1996. Additional surveys in new areas will most likely addadditional species, increasing our understanding of the biodiversity of each park unit.
PROPOSED PROJECTS FOR 1997
Document Coastal Stopover Areas: Seven sites have been identified for possible inclusion in theWestern Hemisphere Shorebird Reserve Network, an international coalition of public and privatelandowners cooperating to conserve shorebird habitat. Membership in the network bringsinternational recognition to critical wetland sites and enhances local capacity for effectiveconservation. Membership in the network is strictly voluntary and is based on biological criteria. The primary objective of this project is to obtain biological information for the seven sites: CapeKrusenstern, Noatak River Delta, Cape Espenberg, Shishmaref Inlet, Arctic Lagoon, Lopplagoon, and the central Seward peninsula. The central Seward peninsula would be proposed forinclusion in the network primarily due to the importance of this site to breeding Bristle-thighedCurlews. Migrating shorebirds would be counted at the six sites and the Kobuk river delta aspart of a 2-year effort to determine their relative importance. Cooperation of state, federal, andlocal Native Corporations and communities is essential.
Survey Tundra Swans: Tundra swans are a conspicuous breeder in CAKR. The CAKR/KobukLake vicinity is also important as a staging areas for post-breeding swans migrating south in earlySeptember. Recent interest in hunting swans calls for an assessment of swans numbers in orderto determine if a harvest could be supported and, if so, under what conditions. The NPScompleted swan surveys until 1992. We propose to complete these transects in 1997 as well asattempt to accurately count aggregating swans using airborne video technology.
Cooperate with Biological Resources Division on Curlew Study: The Bristle-thighed curlew isconsidered Threatened by BirdLife International and a Species of Special Management Concern
35
(formerly Category 2 under the Endangered Species Act). They breed in subarctic tundra in twoknown areas of western Alaska and winter on small islands in the tropical and subtropical Pacificocean. The world breeding population probably consists of less than 7000 birds. Of these, abouthalf of the known breeders do so in the Yukon Delta NWR and the other half breed in the centralSeward Peninsula. These may represent separate populations. Observations indicate there maybe a third breeding site in the Cape Krusenstern vicinity. The NPS has collaborated with the BRDin surveying areas for curlews in potential breeding habitats of CAKR.
In addition to locating a possible third breeding site for the rare Bristle-thighed Curlew in remoteareas of CAKR, scientific efforts have focussed on documenting curlew wintering areas inOceania. Under a collaborative interagency agreement with the Biological Resources Division(USGS), six curlews from the central Seward Peninsula would be instrumented and tracked viasatellite to remote oceanic islands in tropical and subtropical Pacific Ocean. Curlews breeding inthe central Seward Peninsula (BELA) appear to bypass the Hawaiian Islands en route towintering areas. This separation of races increases the risk that breeding populations willdecline. Wintering birds are susceptible to oil spills, human harvest, and displacement by coastaldevelopments as well as being vulnerable to human harvest and predation by non-nativepredators during a flightless molting period. As the primary threats to high concentrations ofcurlews occur in wintering areas, the documentation of these sites is the essential first steptowards working with international partners to foster protection of curlews throughout theirrange. Locating curlew wintering areas by traditional telemetry techniques is inadequate andinefficient; fortunately, recent miniaturization of satellite transmitter technology has permittedconsideration of obtaining this information. The Shorebird Sister School Program would involvelocal students in the study.
ACTION PLAN
INVENTORY AND MONITORING
A. Develop and maintain an Alaska list of landbird species classified by migration strategy,population status, habitat use, biogeographic distribution, relative abundance, and potentialthreats on breeding and wintering grounds.
1. Using the neotropical migratory bird list developed by the Research WorkingGroup, develop a list of neotropical migratory birds in Alaska. 12/92
2. Develop a list of Alaska landbirds occurring in each biogeographic region duringthe breeding season, with a summary of their relative abundance, habitat use, andthe extent of habitat loss in Alaska. Incorporate into Western Working Groupdatabase for ranking species of concern. 2/97
3. Maintain records of current distribution of Alaska landbirds. Ongoing
36
B. Coordinate inventory and monitoring of bird populations and their habitats in Alaska.
1. Assemble and distribute a packet of standardized forms, codes, and instructions tocooperators. Ongoing
2. Summarize annual coverage of various monitoring programs by species,biogeographic region, and habitat. Ongoing
3. Identify species, regions, and habitats not receiving adequate coverage by currentinventory and monitoring programs. Ongoing
4. Expand BBS coverage in the state and to 80 routes per year. 12/97
6. Maintain effort, based on educated decisions, in all monitoring programs.Ongoing
RESEARCH
C. Coordinate efforts among researchers to develop and test sampling designs andmethodology for inventory and monitoring of landbird populations and their habitats inAlaska.
1. Test and establish bird monitoring and inventory methods with guidelines forstandardization within Alaska and across North America. Ongoing
a. Coordinate field efforts for testing methodology. Ongoing
b. Recommend most appropriate censusing methods by species, habitat, and region.Ongoing
c. Develop recommendations for statewide implementation of MAPS program. 12/97
d. Draft letter to DeSante to address issue of immigrant flux. 2/95
e. Determine which terrestrial habitat classification system to recommend asstandard or construct cross-references between classification systems. 12/97
f. Recommend appropriate scales and time frames for inventory and monitoring.Ongoing
g. Initiate habitat data collection along BBS routes. 9/97

37
d. Prepare report on recommendations for migration monitoring. 2/95
38
D. Coordinate efforts among researchers to understand population dynamics, habitatrequirements, and seasonal patterns of distribution of landbirds in Alaska.
1. Coordinate cooperative efforts in collection and analysis of data. Ongoing
2. Share preliminary findings with other researchers through workshops, scientificmeetings, reports, and newsletters. Ongoing
3. Coordinate efforts to link bird and habitat data sets across various levels fromlocal study plots to landscapes, ecosystems, and regions. Ongoing
4. Prepare session on aging and sexing of Alaska’s landbirds. 12/95
5. Register ALL MAPS stations with the IBP. 12/97
6. Coordinate between Boreal PIF and the Alaska Land Cover Committee. Ongoing
7. Evaluate accuracy of vegetation classifications on the Alaska Land Characteristicsmap compiled by Mike Fleming, EROS Data Center, USGS, Anchorage. 12/97
8. Identify research needs by biogeographic region and initiate projects that addressimportant species and habitats. Ongoing
9. Organize a passerine session for the Alaska Bird Conference in April 1996. 3/96
E. Identify and prioritize research needs and coordinate research efforts in Alaska.
1. Summarize existing information and identify gaps in knowledge of distribution,habitat associations, population status and trends, role of Alaska in neotropicalbird ecology, population dynamics, and methodology. Ongoing
2. Solicit input from managers on needs for information and research. Ongoing
INFORMATION AND EDUCATION
F. Identify training and educational needs and recommend programs for use by agencies andnongovernmental organizations. Training programs relating to conservation of neotropicalmigratory birds could include topics such as management of biodiversity; monitoringtechniques and analysis; inventory techniques and analysis; and habitat management.
1. Identify and provide existing mechanisms to educate biologists and resourcemanagers about neotropical migratory bird ecology and management. Ongoing

39
2. Identify new training programs and materials. Ongoing
3. Compile and disseminate a computerized bibliography of references on landbirdsin Alaska. 10/94, 2/97
4. Compile and disseminate a directory of projects being currently conducted onneotropical migratory birds in Alaska. 12/97
5. Attend Western Working Group meetings and report on activities of BPIF.Ongoing
6. Have at least 1 representative from each agency and, at least, 1 NGOrepresentative attend the Cape May meeting. 10/95
G. Incorporate PIF themes into public outreach.
1. Identify existing public outreach opportunities that can incorporate Partners inFlight. 12/95
2. Develop materials appropriate for Alaska that are related to neotropical migratorybirds. Ongoing
a. “Alaskanize” PIF slide show. 12/96
b. Adapt Songbird Blues kits for use in Alaska schools 12/96
c. Distribute CD of Alaska bird songs and software. 9/96
d. Develop information on shade-grown coffee, coordinate with the AudubonSociety. 5/95
e. Provide copies of Colleen Handel’s overview presentation (one for eachagency) to show to managers and administrators. 12/97
f. Develop, print, distribute poster map of migration pathways of Alaskalandbird migrants. 12/97
3. Coordinate activities for IMBD. Ongoing

40
MANAGEMENT
I. Develop a Conservation Plan
1. Identify species and habitats most in need of conservation.
a. Each biogeographic region should review the species priority list, andselect the top 10-20 species most in need of conservation. 6/97
b. Each biogeographic region should identify habitats and relatedmanagement issues. 6/97
c. Finalize biogeographic lists into statewide list of species and habitats. 12/97
2. Establish population and habitat conservation objectives. 12/97
J. Implement Conservation Plans
1. Develop actions to meet population and habitat objectives (e.g. management prescriptions, best management practices). 12/98
2. Work with I&E Committee to develop a strategy to inform and educate managerson implementation of the Conservation Plan. 6/98
K. Monitor, evaluate, and report on progress and accomplishments of Boreal Partners InFlight activities in Alaska.
1. Schedule annual meeting of BPIF and prepare annual report. Ongoing
2. Prepare semiannual state reports to be presented at meetings of the WesternWorking Group. Ongoing
3. Identify an Alaskan representative who will attend meetings of the Western Working Group and act as liaison for Boreal PIF. Ongoing
4. Draft letter to director NBS supporting BBS. 1/95