bond covenants and investment policy - nyu la covenants...finally, this paper contributes to the...
TRANSCRIPT

Electronic copy available at: https://ssrn.com/abstract=3241645
Bond Covenants and Investment Policy
Sandrine Docgne Penlap∗
August 30, 2018
Abstract
I provide evidence that covenants in bond indentures affect the firm’s investment policy outside of
covenant violations. Using a large dataset of public bonds, and controlling for the self-selectivity of
covenant inclusion, I find that bonds with investment (financing) restrictions are associated with
a decrease (increase) in investment in the two years following the issue. The effect of investment
restrictions is entirely driven by firms that are more financially constrained. Both financially
constrained and unconstrained firms have significantly higher investment spending after issuing a
bond with financing restrictions, although the magnitude of the effect is higher in the latter group.
These findings suggest that while bond covenants can help mitigate agency problems and reduce
the cost of debt, they may also have externalities that lead to more investment distortions in firms
that are closer to financial distress. This paper is the first to document a positive relationship
between a covenant restriction and ex-post investment.
Keywords: Agency conflicts, Bond covenants, Investment, capital expenditures
JEL classification: G31 G32 D82 E22
∗C.T. Bauer College of Business, University of Houston, 334 Melcher Hall. Email:[email protected].

Electronic copy available at: https://ssrn.com/abstract=3241645
1 Introduction
How do restrictive covenants in bonds affect investment policy ex-post? Although covenants
are ubiquitous in debt contract, we still have limited empirical evidence on how different types
of covenants affect firms policies. Most empirical studies have looked either at the likelihood
of including covenants given a firms growth opportunities or at what happens to investment
once a covenant is violated. By contrast, this paper investigates firms’ investment behavior
in the years following the issuance of bonds that include covenant with restrictions on in-
vestment or financing activities. Because covenant violations are less frequent with public
bonds due to the very high cost of renegotiation, this paper focuses on public bonds to flush
out the ex-post effect of covenant inclusion before any violation occurs.
The costly contracting hypothesis, stemming from the work of Jensen and Meckling
(1976), Myers (1977), and Smith and Warner (1979) provide the main theoretical framework
for the inclusion of covenants in debt contracts. Managers of a levered firm, acting on behalf
of shareholders, have an incentive to adopt investment, financing and dividend policies that
maximize the value of equity rather than the value of the firm. Rationale bondholders
anticipate these agency conflicts and impose the entire expected cost to the firm in the
pricing of debt. Because stockholders bear the full costs of agency conflicts, they have an
incentive to minimize these costs. The theory argues that restrictive covenants are effective
instruments in mitigating these agency conflicts by aligning the interests of managers with
those of bondholders. By agreeing to these restrictive covenants, shareholders can reduce
agency costs and thus the cost of debt. However, these restrictions impose limitations on
managerial actions and thus can have a negative effect on profitability as managers might
be unable to undertake optimal decisions in certain states of the world because of limited
flexibility (Jensen and Meckling, 1976). Shareholders agree to restrictive covenants when the
expected cost (loss of flexibility) is less than the expected profit (lower cost of debt).
The costly contracting hypothesis implies therefore that firms policies depend on whether
1

Electronic copy available at: https://ssrn.com/abstract=3241645
or not the bond contains a covenant. However, most studies on the role and purpose of
covenants have focused on ex-ante firms characteristics to try and understand which firms
are more likely to include a specific type of covenants. The question of how firms behavior
change depending on the type of restriction in their debt contract is still largely unexplored.
Studies by Chava and Roberts (2008) and Nini et al. (2009) show that after a violation
or a deterioration of credit quality, covenants restriction lead to lower capital expenditure.
However, these studies highlight the monitoring role of private lenders who use the threat
of recalling the loan to intervene with management. In this paper, I look at capital expen-
diture spending in the years following a bond issue with or without a covenant restriction.
Bond creditors are more dispersed and have little influence on management. However, the
cost of violating a covenant is higher for bonds since renegotiation rarely occurs outside
of bankruptcy. These characteristics make bond contract ideal to studying the effect of
covenant outside of technical default.
The primary challenge when attempting to determine the causal effect of covenant re-
strictions on investment policy is that covenant choice is not exogenous. Managers anticipate
these effects when making their financing decisions. To address the endogeneity of covenant
inclusion, I use a two-stage estimation method. Ziliak and Kniesner (1998) and Wooldridge
(2002) show that under the assumption of normality, adding the inverse Mills ratio from the
first stage selection model to the differenced equation in the second stage results in a consis-
tent estimation. Following several studies that estimate the likelihood of covenant inclusion
(Malitz, 1986; Begley, 1994; Nash et al., 2003; Billett et al., 2007; Reisel, 2014), I estimate
a first stage probit regression using firms and loan characteristics. From this regression, I
obtain the inverse Mills ratio, with which I augment a traditional q model of investment.
The analysis focuses on two groups of covenants: restrictions on investment and financing
activities. I find that following a bond issuance, firms with a covenant restricting investment
have lower capital expenditures relative to those firms that do not have the covenants in
their bond contracts. However, this effect is entirely driven by firms that are more financially
2

Electronic copy available at: https://ssrn.com/abstract=3241645
constrained. Since these firms are also more likely to overinvest in risky assets, these results
may suggest that covenant restricting risky investment are effective a mitigating the agency
problems of overinvestment and asset substitution. I also find that covenant restricting
financing activities have an externality on investment policy. Following the issuance of
bonds, firms with financing restrictions have higher capital expenditures than firms without
those covenants. Both financially constrained and unconstrained firms have significantly
higher investment spending after issuing a bond with financing restrictions, although the
magnitude of the effect is higher in the latter group. These results may suggest that issuing
bonds with only financing restrictions may help lower the cost of debt, which allows firm
to undertake more investment, but it might also exacerbate the overinvestment problem in
firms that are closer to financial distress.
This paper contributes to the literature on the role of covenant in public bonds. Some
researchers argue that covenants in bond indentures are boilerplate contracts and have no
effect on the firms. Kahan and Yermack (1998) argue that the absence of covenants in pub-
licly traded convertible bonds is a proof that convertibility is a more effective mechanism to
mitigate agency problems linked to investment policies in public debt. Verde (1999) contends
that bond covenants are written loosely and offer very little protection to bondholders when
compared to covenants in private loan agreements. Within this view, covenants in bonds
should have no impact on the firm’s behavior, and creditors should rely on other mechanisms
to resolve the agency conflicts. This paper shows that covenants in bond affect investment
behavior. It shows that while covenants in public bonds can mitigate agency problems, they
can also exacerbate investment distortions.
This paper is also related to studies that investigate the agency costs of debt and their
consequence for investment policies. Because the primary purpose of covenants in bond is
to alleviate agency problems, several studies have looked at the role of covenant in miti-
gating investment distortions. Secured debt, leasing, dividend restrictions can alleviate the
underinvestment problem (Smith and Warner, 1979; Kalay, 1982; Stulz and Johnson, 1985;
3

Electronic copy available at: https://ssrn.com/abstract=3241645
Smith and Wakeman, 1985) but can also increase overinvestment (Berkovitch and Kim,
1990). This paper document a positive relationship between covenants restricting financing
activities, which includes restrictions on the issuance of additional debt and negative pledge
covenants, and investment. However, I cannot conclude if the observed behavior is reducing
underinvestment or increasing overinvestment.
Finally, this paper contributes to the literature on financial frictions in the debt market
and their impact on investment. Whited (1992) and Hennessy (2004) use structural econo-
metric models to show that financially unhealthy firms have difficulty obtaining external
finance, which results in lower investment. Lang et al. (1996) show that high leverage neg-
atively impacts investment. Whited (2006) show that external financing constraints affect
the timing of large investment projects. These results are consistent with the findings in
this paper. Investment restrictions are more likely to be imposed on firms that are already
financially constrained, and lead to lower levels of investment. These firms may have lower
capital expenditure because they are delaying investment. One reason that firms with fi-
nancing restrictions have higher levels of investment could be that they are able to have a
lower cost of debt which enables them to undertake more investment sooner. My analysis
suggests that the terms of the bond contract could affect the timing of investment.
2 Motivation and Literature
2.1 Motivation
The main theoretical framework that we have for understanding the purpose and impli-
cation of covenants stems from the work of Jensen and Meckling (1976), Myers (1977), and
Smith and Warner (1979). Jensen and Meckling define the concept of agency costs of debt
and its effect on firm’s value. Myers extend the model to show that levered corporation
with growth options have an incentive to underinvest. Finally, Smith and Warner show how
4

Electronic copy available at: https://ssrn.com/abstract=3241645
covenants are included in bond contract in order to reduce the agency cost. The Costly
Contracting Hypothesis posits that bond covenants can increase the value of the firm by re-
ducing the opportunity loss that results from the fact that stockholder’s in a levered firm have
an incentive to adopt equity value maximizing rather than firm value maximizing policies.
Smith and Warner (1979) argue that covenants reduce the agency costs of debt and that the
benefits accrue to the firm’s owners. However, covenants also impose direct and opportunity
costs that are substantial and explain the observed heterogeneity in debt contracts. Only
firms that expect the cost-reducing benefits of covenants to exceed the costs associated with
their restrictions will agree to have covenants included in their debt contracts.
Most studies on the role of covenants focus on ex-ante firms’ characteristics to explain
the observed heterogeneity in covenant choice. Malitz (1986) finds that the presence of
covenants in public debt is negatively related to the size of the firm and positively related to
the firm’s leverage. Begley (1994) finds that firms with a higher probability of bankruptcy,
less assets in place, and generating less cash flow from operations are more likely to include
covenants restricting dividends and additional debt in bonds contracts. Growth opportunity
is negatively (Kahan and Yermack, 1998; Nash et al., 2003; Reisel, 2014), positively (Billett
et al., 2007; Bradley and Roberts, 2015) correlated with covenant inclusion. Chava et al.
(2010) show that managerial entrenchment and the risk of managerial fraud significantly
impact the choice of bond covenants. These studies show that ex-ante firms characteristics
affect the choice of covenants in public and private debt, providing support for the costly
contracting hypothesis.
However, the question of how firms characteristics are affected ex-post by covenant choice
remains largely unexplored. More specifically, there is insufficient empirical evidence on the
direct and indirect consequences of covenants on firm’s investment policy despite theoretical
predictions on the externality of covenants on investment policy. Brennan and Schwartz
(1984) build a theoretical model of firm’s financing and show that in the presence of fi-
nancial frictions, firms with low levels of profitability and leverage that issue bonds with
5

Electronic copy available at: https://ssrn.com/abstract=3241645
covenants restricting debt issuance have a higher level of investment than if they issued the
bond without covenants. This shows that while the purpose of financing restrictions is to
prevent wealth expropriation through claim dilution, the covenants can have an externality
on investment policy. Brennan and Schwartz (1984) analysis does not suggest whether the
externality is good or bad for firm’s value, several studies suggest that covenants can have
negative indirect consequences on investment policy. Stulz and Johnson (1985) and Smith
and Wakeman (1985) show that secured debt and leasing can alleviate the underinvest-
ment problem. Smith and Warner (1979) and Kalay (1982) show that dividend restrictions
might help alleviate the underinvestment problem. Berkovitch and Kim (1990) show that
senior debt and debt with dividend covenants may decrease underinvestment while increas-
ing overinvestment. Hennessy (2004) show that the issuance of additional secured debt can
mitigate underinvestment stemming from debt overhang. These results suggest that includ-
ing covenants in bonds that restrict financing activities can have an impact on investment
policy.
2.2 Related Literature
Few studies look at the ex-post effect of covenants on investment, and those studies
usually look at the effect after a technical default or a deterioration of credit quality. Looking
at a sample of private loans, (Chava and Roberts, 2008) examine the effect of violation of
financial covenants such as minimum net worth and current ratio on investment. Exploiting
a discontinuity around the covenant threshold, they are able to show that capital expenditure
declines sharply following a covenant violation. This decline is higher for firms with relatively
larger agency and information problems. Also using a sample of private loans, (Nini et al.,
2009) find that capital expenditure restrictions reduce firms’ investment and that these
restrictions are more likely to be put in place after credit quality deteriorates, which may
suggest that these firms have already violated a covenant. Both of these studies provide
6
Electronic copy available at: https://ssrn.com/abstract=3241645
support for the role that financial covenants play in the contingent allocation of control rights;
after violation, creditors use the right to recall the loan to intervene in firm’s management. In
contrast to these studies, I focus on the ex-post effect of restrictive covenants in public bonds
on investment expenditure, outside of violation. Restrictive covenants differ from financial
covenants in that they impose a limitation of managerial action, while financial covenants
impose threshold on accounting ratios that are volatile and not under the full control of
managers. Financial covenants are less prevalent in public bonds because the high number
of dispersed investor reduces the incentive to monitor and renegotiation rarely occurs outside
of bankruptcy.
Other studies look at the ex-post effect of covenants on various firms performance.
Demiroglu and James (2010) find that following the issuance of loans with tight covenants,
the accounting ratios associated with the covenant improve while investment expenditure and
net debt issuance decreases. They also focus their analysis on the ex-post effect of covenants
outside of default and show that tight financial covenants are correlated with lower level
of investment. In this paper, I extend a similar analysis to bond covenants to further our
understanding in the difference of covenants in private and public debt. Cook and Easter-
wood (1994) examine the effect of poison put covenants in bonds and find a negative effect of
stockholders wealth but a positive effect on the wealth of bondholders. Spyridopoulos (2018)
show that stricter loan covenants lead to higher profitability and lower operating costs, but
the effect is driven only by firms with poor governance, providing support for the disciplin-
ing role of debt. Asquith and Wizman (1990) show that public bonds with strong covenant
protection gain value in leveraged buyouts while those with no protection lose value. These
studies show issuing debt with covenants affect firm’s value in the long run. This paper
extend this literature by showing that restrictive covenants in public bonds can also results
in unanticipated impact, from the agency theory perspective, on investment behavior.
7

Electronic copy available at: https://ssrn.com/abstract=3241645
3 Data and Sample Characteristics
3.1 Data Sources
The data comes from 2016 Fixed Investment Securities Database (FISD) for bond data,
Compustat annual files for firm’s financial statement data, CRSP monthly stock data for
market value, and the Federal Reserve bank of St Louis (FRED) for secondary yields on
the Treasury and corporate bonds required to compute term and credit spreads respectively.
FISD contains various information on the covenants associated with a bond at the time of
issuance for a large set of firms.
Following Billett et al. (2007) and Reisel (2014), I only consider public bonds issued by
U.S. domiciled non-financial companies that are in U.S. dollars. I exclude Yankee, Canadian,
foreign currency, and government and utilities companies bonds. In addition, I exclude all
bonds for which covenant information, subsequent data from prospectuses or other detailed
sources, offering yield, offering date, maturity date, or security level are not available. Finally,
I exclude medium term notes (MTN), private placements, and bonds with rule 144a. The
final sample is in the intersection of FISD, CRSP and Compustat during 1989-2015 and
includes 4221 bonds issued by 1005 firms. I winsorize firm and bond data at the 1% and
99% levels to alleviate the effect of outliers.
3.2 Key variables
The investment variable is CAPEX, which is the ratio of capital expenditure to the
start of period assets. In all the regression, the dependent variable is the change in capital
expenditure, δCAPEX, after the bond is issued relative to the year prior to the bond
issuance. I investigate the change in investment expenditure in the first and second fiscal
years after the fiscal year in which the bond is issued. The two specifications attempt to
shade a light on what happens to investment over time after a firm issue a bond with a
8

Electronic copy available at: https://ssrn.com/abstract=3241645
covenant relative to if the it had issued the bond without the covenant.
Bond covenants are provisions in the bond contract that impose restrictions on the issuer
once the bond is issued. I use the framework provided by Smith and Warner (1979) to
group covenants into primary categories based on the nature of the restriction, with a focus
on covenants that restrict investment and financing activities. Appendix A provides more
details on the specific covenants in each category. Investment restrictions are covenants that
either directly restricts risky investments or do so indirectly by imposing restrictions on the
firms dealings with it subsidiaries, and on the acquisition and sale of assets. There are 12.4%
of bonds that are issued with a restriction on investments.
Financing restrictions include covenants on the issuance of additional debt, sale-leaseback
transactions, and negative pledge. 19.4% of the bonds include restrictions on the issuance
of additional debt which restricts the seniority and the amount of debt that the firm can
incurred as well as impose leverage and net earnings test that must be met before the firm
can issue any new debt. Restrictions on sale-leaseback activities are present in 61.7% of the
sample and restrict the firm to the type and amount of property used in a sale-leaseback
transaction. 70% of the bonds include a negative pledge covenant that requires the firm to
issue secured debt only if it secures the current issue on a pari passu basis. In total, 81.2%
of bonds include restrictions on financing activities.
3.3 Firms characteristics and covenant inclusion
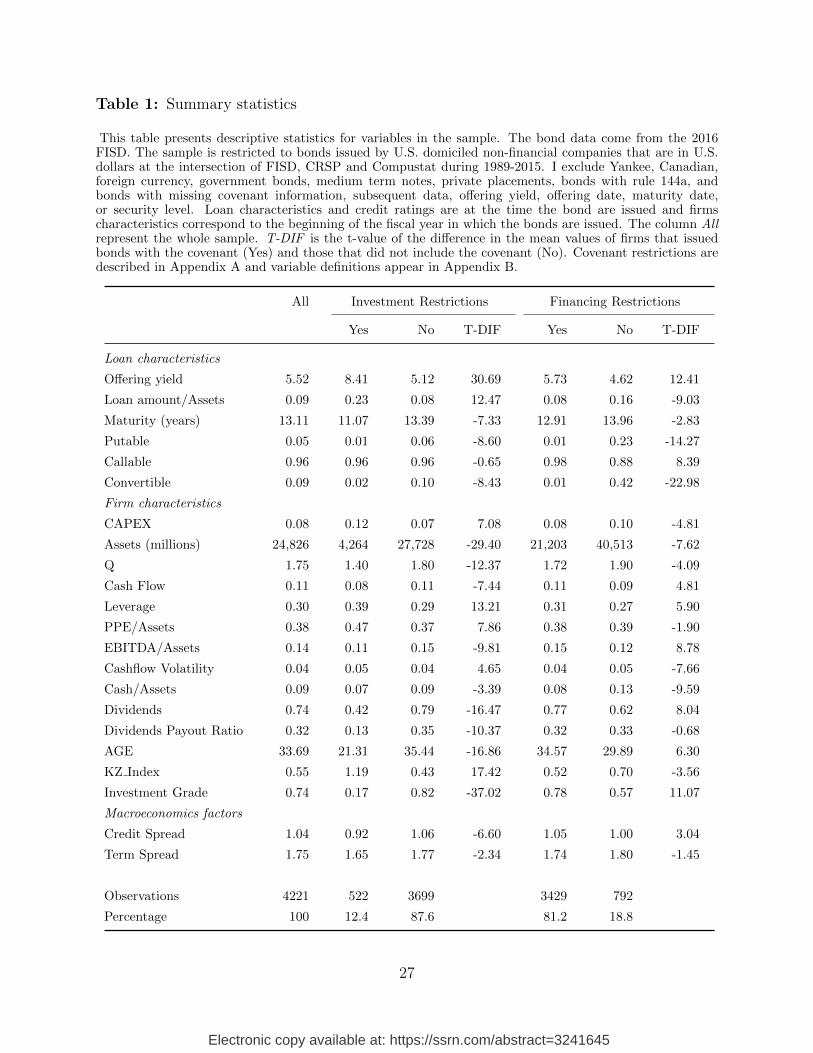
Table 1 presents some summary statistics for the whole sample (All) as well for the
subsamples of loan with and without the indicated category of covenants; restrictions on
investment or on financing activities. The values under columns “Yes” and “No” represent
the sample mean of the corresponding variable, and the value under column “T-DIF” is
the t-value of the difference in the means of the two subsamples. Covenant restrictions are
described in Appendix A and variable definitions appear in Appendix B. The table shows
9

Electronic copy available at: https://ssrn.com/abstract=3241645
significant heterogeneity between firms that issue bonds with covenant restrictions and those
that issue without. The data shows that the yield is higher for bonds with covenants. Bradley
and Roberts (2015) and Reisel (2014) show that covenant inclusion leads to a reduction of
the price of debt. Put together, the results from the table suggests that the yield would
have been even higher if those bonds did not include a covenant. The data also shows
a negative relation with covenant and bond maturity. This may suggests that in bonds,
restrictive covenants and maturity are complement and not substitute. However a more
formal analysis is required before drawing conclusions.
The data in Table 1 shows that firms that issue bonds with restrictive covenants are on
average smaller, where size is measured by the log of book assets. Firms without an invest-
ment restriction are approximate 6.5 times larger than firms with the restriction. The data
also shows a negative relation between covenants and firm’s growth option (Q), as measured
by market-to-book, and with cash on hands, but a positive relation with leverage. These are
consistent with the agency theory of debt. The theory predicts that firms that are closer to
financial distress are more likely to include restrictive covenants in their debt contract. Cash
flow, profitability, dividend payments, and age are negatively related to investment restric-
tions, but positively correlated with restrictions on financing activities. Asset tangibility,
cash flow volatility, KZ index which indicates a firm’s relative level of financial constraint
are positively (negatively) correlated with investment (financing) restrictions. Finally, credit
spread has a negative (positive) relation with investment (financing) covenants, suggesting
that firms are more likely to agree to covenants that restrict their investment decisions, but
not future financing when the risk premium is low.
10

Electronic copy available at: https://ssrn.com/abstract=3241645
4 Ex-Post Effect of Restrictive Covenants
4.1 Empirical strategy
The non randomness of covenant inclusion introduces a significant identification prob-
lem when trying to measure the impact of the restriction on firm investment. The costly
contracting hypothesis predicts that borrowers weight the costs and benefits of restrictive
covenants when making decisions. Thus there exist some unobservable firm characteristics
that affect both investment policy and covenant selection. To control for the endogeneity
of covenant inclusion dummy, I follow the two-step estimation methodology similar to the
one used by Goyal (2005) and Reisel (2014). In the first stage, I estimate the probability of
covenant inclusion using a reduced form probit.
Covt = ΓZt−1 + ηt (1)
where Cov is a dummy variable that equals 1 if the bond contains the restrictive covenant,
Z is a set of variables that affect the decision to include the covenant in the bond contract,
and η is a random error with mean zero and a normalized variance of 1. Under assumption
of normality, I obtain from the equation (1)the estimates of the inverse Mills ratios that
equal φ(ΓZ)/Φ(ΓZ) for bonds with covenants and −φ(ΓZ)/[1 − Φ(ΓZ)] for bonds with-
out covenants. φ is the standard normal density function and Φ is the standard normal
cumulative distribution function.
In the second stage, I estimate a traditional investment equation with the covenant
dummy and the inverse Mills ratio as explanatory variables
∆CAPEXt+1 = β0Covt + α0 IMRi + β1 ∆Xt−1 + εt+1. (2)
∆CAPEX is the change in capital expenditure relative to its value before the bond was
11

Electronic copy available at: https://ssrn.com/abstract=3241645
issued, X is a vector of control variables. Ziliak and Kniesner (1998) and Wooldridge (2002)
show that under assumption of normality, adding the inverse Mills ratio from the probit
regression to the differenced equation results in consistent estimation.
The motivation for the specification in equation (2) comes from the theory and empirical
work. Classical q theory implies that investment is only a function of marginal q, which is
unobservable. However several works such Hennessy (2004) and Bakke and Whited (2010)
show that empirical proxies of marginal q along with additional control variables such as
cash flow, size, and leverage are effective in addressing a potential omitted variable issue in
the investment regression. The difference-in-difference approach accounts for time-invariant
unobservable differences between firms that issue bonds with covenants and those that do
not. The parameter of interest is β0, which represents the impact of a covenant inclusion on
investment (i.e. the treatment effect). The coefficient of the inverse Mills ratio, α0 captures
the correlation between the error terms ε and η
4.2 Primary Results
4.2.1 Covenant selection
The covenant selection model is based on the theory and empirical evidence on the factors
that affect covenant inclusion in a debt agreement. I use firms and bond characteristics, and
macroeconomic factors to determine the likelihood of covenant inclusion. According to the
Costly Contracting Hypothesis, firms that are associated with higher agency costs are more
likely to have covenants included in their debt contracts. In line with this theory, size and
leverage (Malitz, 1986), growth option (Nash et al., 2003; Billett et al., 2007), the proportion
of tangible assets and cash flow (Begley, 1994) are firms characteristics associated with the
likelihood of covenant inclusion. Following Reisel (2014) I also include company credit ratings
since they may provide additional information about firm performance. Because other loan
characteristics can be used to mitigate agency costs (see Nash et al., 2003, for a discussion), I
12

Electronic copy available at: https://ssrn.com/abstract=3241645
include the bond’s maturity and amount, and dummies for putable, callable, and convertible
features. Following Bradley and Roberts (2015) I control for macroeconomic factors using the
difference between the 10-year and 1-year treasury bonds (Term Spread) and the difference
in the yields on BAA and AAA corporate bonds (Credit Spread). Since agency costs may
vary across industries, I include dummies for one-digit sic codes in all the regressions.
Table 2 reports the results of the probit model for the probability of including a covenant
in the bond contract. The results of this estimation are used to estimate the inverse mill ratios
use in the investment regression. Consistent with previous findings, firm size is negatively
correlated with covenant inclusion. The coefficient on market-to-book has a negative sign,
but is only statistically significant for investment restrictions. This suggests that firms with
high growth options may find covenant restricting investment very costly, but not those
restricting financing activities. Firms with more tangible assets are more likely to have
investment restrictions but less likely to have financing restrictions in their bond indenture.
One of the strongest determinant of covenant inclusion is convertibility, as indicated by
the t-statistics on the coefficient. The negative sign suggest that restrictive covenants and
convertibility might be substitute in addressing agency conflicts.
4.2.2 Investment restrictions
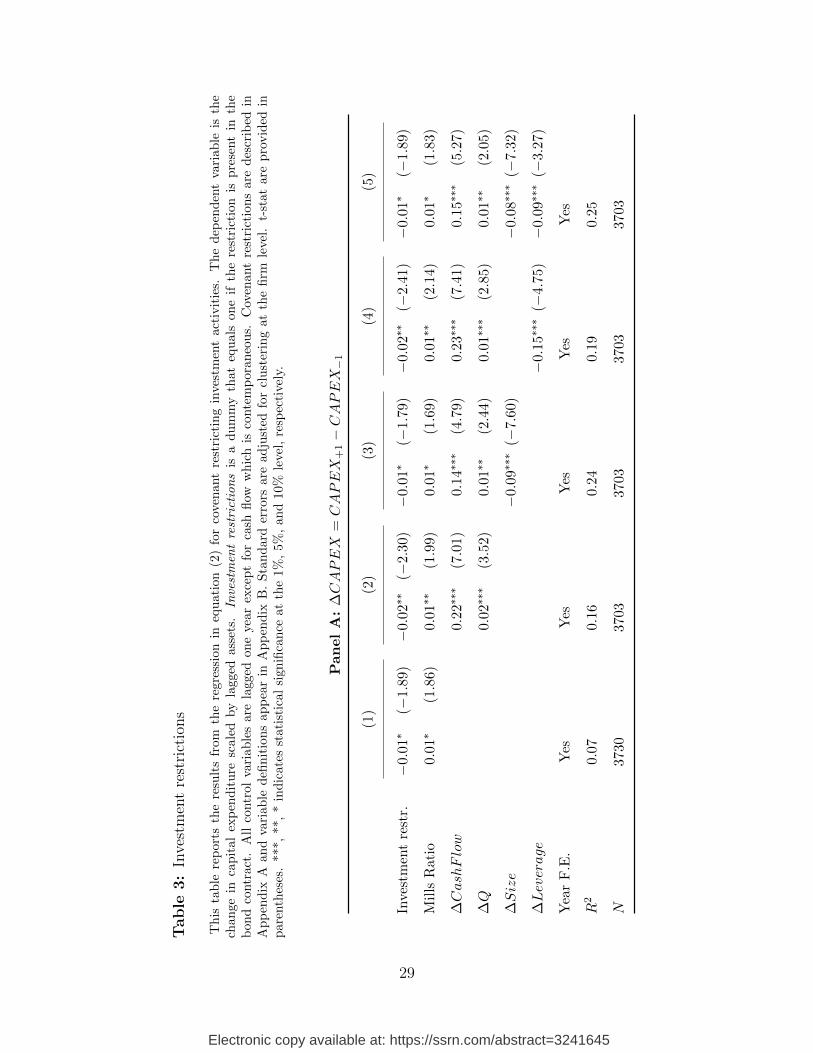
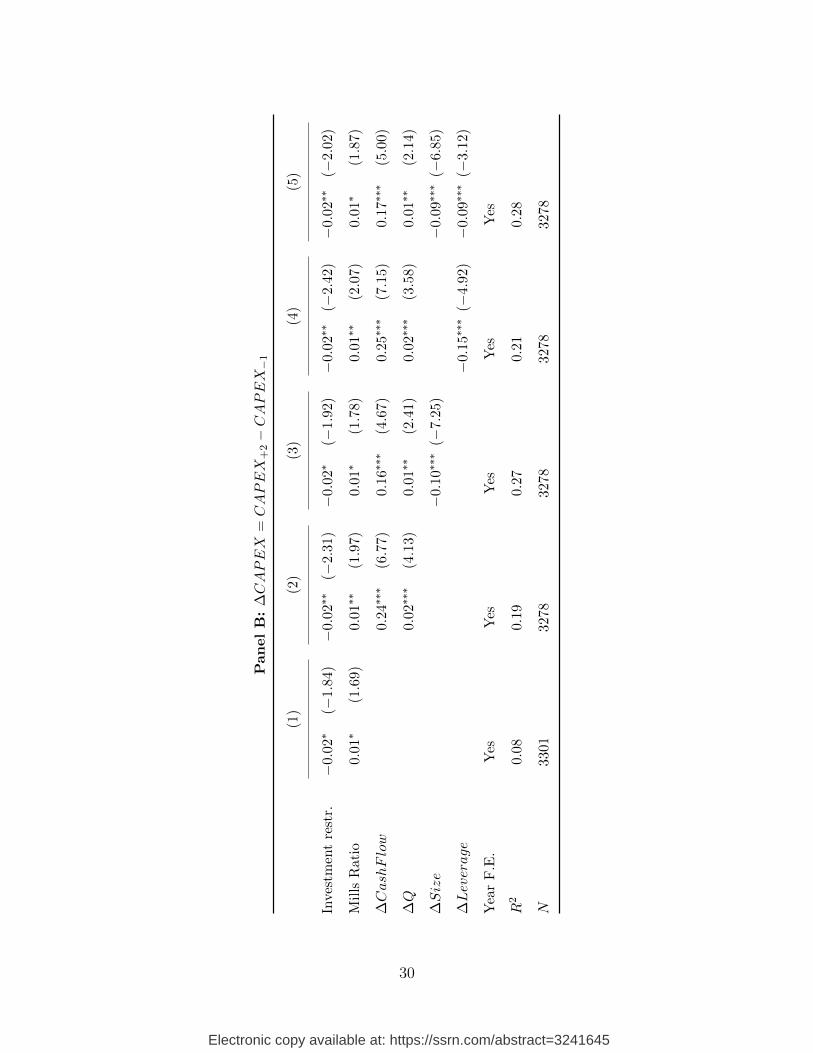
Table 3 presents the estimation results of the investment regression for covenants re-
stricting investments. All specifications include year fixed effects. In Panel A the dependent
variable is the change in capital expenditure one year after the bond is issued relative to the
year before the issuance. In Panel B the dependent variable is the change two years after.
In all specifications, the coefficient on the inverse mills ratio is positive and significant. This
implies that I can reject the null hypothesis that there is no self selection bias. The positive
sign on the inverse Mills ratio suggest that unobservable firm characteristics that increase
the likelihood of the inclusion of covenant restricting investments are positively correlated
with an increase in investment spending. According to the costly contracting hypothesis, the
13
Electronic copy available at: https://ssrn.com/abstract=3241645
purpose of investment restrictions in bond indenture is to mitigate the agency risk of over-
investment in risky assets (Smith and Warner, 1979). The positive and significant sign on
the inverse Mills ratio suggest that covenant restricting risky investment in bond indentures
might be effective at mitigating the agency cost of asset substitution and overinvestment.
It also implies that it is important to control for the endogeneity of the covenant decision
when investigating the effect on firm’s policies.
Consistent with previous findings that restrictions on investment lead to lower investment
expenditure, I find the coefficient on the covenant dummy is always negative and significant
after controlling for the self selection bias. Using the specification in column (4) that includes
all control variables, I find that in the first year following the year of the bond issuance, the
change in the proportion of capital expenditure to assets is 1.17 percentage points lower for
firms with investment restrictions relative to those firms without the restriction. Given the
average capital expenditure of 8% of assets prior to the security issuance, this correspond
to a difference of almost 15%. In the second year following the issuance, the difference is
even more substantial. Firms with investment restriction have a capital expenditure 1.58
percentage points lower than firms without the covenant, which correspond to a difference of
20% relative to the average capital expenditure in the year before the bond is issued. This
results show that the effect of investment restrictions on capital expenditure is economically
significant and persistent. The coefficient estimates on cash flow, Tobin’s Q, size, and leverage
are consistent with previous studies examining capital expenditures.
4.2.3 Financing restrictions
Table 4 reports the estimation results of the investment regression for covenants restrict-
ing financing activities. In Panel A (B) the dependent variable is the change in capital
expenditure one (two) year after the bond is issued relative to the year prior to the issuance.
The inverse mills ratio is significant at the 1% level in all the specifications, indicating
the prevalence of self selection in the decision to include financing restrictions in the bond
14

Electronic copy available at: https://ssrn.com/abstract=3241645
contract. The negative sign on the selectivity variable suggests that firms with a higher
probability of issuing bonds with restrictions on financing activities are also more likely to
reduce capital expenditure. The purpose of financing restrictions is to prevent wealth trans-
fer through claim dilution. However, the presence of financial frictions create a link between
financing and investment activities. One possible reason for the negative sign on the inverse
Mills ratio is that these firms have liquidity constrains ex-ante and would not have been able
to undertake additional investment without issuing the bond. Another possible explanation
is that these firms are more likely to underinvest. Mauer and Ott (2000) show that a levered
firm tend to underinvest when shareholders must bear the full cost of new investment while
sharing the profits with bondholders. This analysis does not distinguishes between both
explanation, but simply suggest that these firms are more likely to reduce investment.
In all the specification in table 4, the coefficient estimates on the financing restrictions
dummy is positive and significant at the 1% level after controlling for the selection bias. The
results are also economically significant. Firms that issue bonds with covenant restricting
financing show capital expenditure of 2.32 percentage point higher than firms without the
covenants. This difference correspond to 29% of the average investment spending in year
prior to the bond being issued, using specification in column (4). In the second year following
the year of the bond, the change in investment spending for firms with financing restriction is
3.89 percentage points higher, which correspond to 49% of th capital expenditure spending in
the year prior to the bond issuance. These results suggest that after issuing bonds with only
financing restrictions, firms are able to undertake more investment relative to those firms
that issue bonds without these covenants. These results are consistent with the theoretical
prediction of the model by Brennan and Schwartz (1984). A possible explanation for the
observed behavior is that agreeing to the restrictions allows firm to reduce the cost of debt
and thus undertake more investment. Another possible explanation is that these firms are
financially constrained and are more willing to gamble with the new influx of cash. Since
they don’t have investment restrictions, they overinvest in risky investment. My analysis
15

Electronic copy available at: https://ssrn.com/abstract=3241645
does not differentiate between these possible explanations.
4.3 Robustness
For robustness purpose, I also perform a counterfactual analysis of the effect of covenant
inclusion on ex-post investment in the second stage. I estimate the investment regression,
with the appropriate inverse Mills ratio, separately for firms with and without the covenants.
Using the estimates from these regression excluding the inverse Mills ratio, I obtain two sets
of predicted capital expenditure for the whole sample: one corresponding to loans with a
particular covenant and the other corresponding to loans without the covenant. I am thus
able to estimate a counterfactual for each loan in the sample. Table 5 reports the average
value of the predicted capital expenditure with and without investment restrictions, and
their difference. On average, investment spending decrease in the years following the bond
issuance. However, the decrease is larger if the bond contains restrictions on investment ac-
tivities. The difference is statistically and economically significant. In the first year following
the bond, the difference is 1.2 percentage points and 2.15 percentage point in th second year.
These difference correspond to 15% and 27% of the average capital expenditure in the year
prior to the bond, respectively. These results implies that after controlling for the self se-
lection of covenant inclusion, firms that issue bonds with investment restriction will see a
larger decrease in investment spending relative to if they had not agreed to the restriction.
Table 6 show the same results for loans with and without financing restrictions. While
investment spending decrease in the years following the issuance of the bond relative to the
year prior to the issue, the decrease is much larger when the firm issues bond without financ-
ing restrictions. The difference in change in capital expenditure is 2.27 and 3.56 percentage
points in the first and second year respectively. These values correspond to 29% and 45%
of the average capital expenditure in the year preceding the bond issue. Thus similar to
the results in previous section, firms that issue bonds with financing restrictions are able
16

Electronic copy available at: https://ssrn.com/abstract=3241645
to invest more in the following years relative to if they had issue the bond without the
covenants. Again this could be that these firms are able to reduce the cost of debt which
allows them to invest more, or it could be that they are taking on more risky investment in
order to maximize their expected returns. In the next section, I investigate how this effect
differ among firms with different level of financial constraints.
5 Cross-Sectional Variations
In this section I test whether the ex-post effect of covenants on investment covary with
the ex-ante financial health of the firm using several proxies for financing constraints. This
is important to further understand what is driving the investment response to the inclusion
of restrictive covenants.
5.1 Proxies for financial constraints
I examine four different proxies for financial constraints. The first proxy is the age of
the firm as measured by the number of years in Compustat. Since younger firms are more
likely to face more frictions in capital-markets, firm age can be used as a proxy for financial
constraints (Hovakimian and Titman, 2006; Almeida and Campello, 2007). If a firm has
a higher probability of investing in negative net present value project with a high upward
potential, the agency cost will be higher for a younger firm relative to an older firm. In this
case, younger firms that issue bonds with restrictive covenants on investment should see a
larger decrease in capital expenditure. On the other hand, younger firms are less likely to
underinvest and thus should see a smaller impact on investment after issuing bonds with
financing restrictions.
The second proxy is the proportion of assets held in cash. Financial slack has been
associated with financial constraints by many researchers. Some have argued that firms
accumulate more cash when they expect higher cost of external financing (Fazzari et al.,
17

Electronic copy available at: https://ssrn.com/abstract=3241645
2000; Almeida et al., 2011). However, others argue that firms with large cash balance are
not financially constrained since it is an indication that investment is not limited by an
availability of internal funds (Kaplan and Zingales, 1997). Although the evidence supports
the fact that cash holdings are more valuable for constrained firms, Denis and Sibilkov (2010)
also show that some constrained firms exhibit low level of cash holdings due to persistent
low cash flow. In our sample firms that issue bond with investment restrictions are younger
with higher leverage, lower cash flow, lower profitability, higher cash flow volatility, lower
dividend payout ratio, higher KZ index and lower cash flow. This suggest that these firms
are financially constrained. I expect then that firms with lower cash balances that agree
to restrictions on investment are more likely to overinvest and thus should see the larger
decrease in investment. On the other hand, firms with larger cash balances that agree to
financing restrictions should display more sensitivity to covenant inclusion since these firms
are more likely to delay investment.
The third proxy is the dividend payout ratio. I classify firms in three groups following
Fazzari et al. (1988). Several studies have linked a firm’s payout ratio to financial constraints
(Alti, 2003; Almeida and Campello, 2007). Firms that have a higher earnings retention rate
display excess sensitivity of investment to internal funds. The higher retention rate suggests
that these firms face steeper cost of external finance and must rely on internally generated
cash flow to fund investments. The response of investment to covenant for lower and higher
dividend firms is the same as for cash holdings. The final proxy is the KZ index based
on the work of Kaplan and Zingales (1997). The synthetic index is constructed following
several authors who have used it to classify firms as financially constrained or not (Baker
et al., 2003; Bakke and Whited, 2010). Firms with higher values are considered financially
constrained. In so far as the constraints is caused by the agency conflicts, more financially
constrained firms should see the stronger effect after covenant inclusion.
18

Electronic copy available at: https://ssrn.com/abstract=3241645
5.2 Test of cross-sectional variations
To test for the hypotheses of cross sectional variations in investment response, I augment
the model in equation (2) by interacting all the variables with a proxy of financing constraints.
The specification follows Chava and Roberts (2008) and provides a more straightforward test
to compare the two main coefficients of interest. The empirical model is
∆CAPEXi = β0 I(A)Covi + β1 (1 − I(A))Covi + α0 I(A)IMRi
+ α1 (1 − I(A))IMRi + Γ0 I(A)∆Xi + Γ1 (1 − I(A))∆Xi + εi, (3)
where I(A) is an indicator function equal to one if the event A is true, and zero otherwise.
The indicator function correspond to one of the proxy discussed above and is measured at
the end of the fiscal year preceding the bond issuance. The coefficients of interest are β0
and β1 which correspond, respectively, to the interaction of the covenant dummy with I(A)
and (1 − I(A)). The first represent the effect of covenant inclusion on the investment of
firms that are financially constrained and the second the effect for firms that are financially
unconstrained. In all the regressions, Xi is a vector of covariates that include Cash Flow,
Tobin’s Q, Leverage. I also include year fixed effects.
To construct the dummy variable for financially constrained firms, I divided the sample
in three for each proxy. Firms in the lower (upper) third of the distribution for age and
cash holdings are considered financially constrained (unconstrained). Firms that pay less
than 10% of their income are classified as low dividend firms and firms that pay more than
30% are considered high paying firms. Firms that have negative payout rate because of
reported negative earnings are also considered high dividend paying firms since by definition
they are paying more than 100% of their earnings. Low (high) dividend paying firms are
considered financially constrained (unconstrained). Finally, firms in the higher(lower) third
of the distribution for KZ index are considered financially constrained (unconstrained).
19

Electronic copy available at: https://ssrn.com/abstract=3241645
Table 7 display the results of the analysis for covenant restricting investment activities.
I only display the estimated coefficients and t-statistics of β0 and β1 as well as the t-statistic
of the difference between these two estimates. In Panel A, the dependent variable is the
change in capital expenditure one year after the bond is issued relative to the year before
the issue. In Panel B, I look at the change two years after. The results show that capital
spending response to covenants restricting investment activities is driven by firms that are
financially constrained. If the firm is younger, has low cash on hand, or low dividend payout
ratio, then issuing bonds with investment restrictions lead to a significant decrease in capital
expenditure in the following years, relative to a similar firm who issue the bond without
the covenant. These results may suggest that covenant restricting risky investment in bond
indenture might be effective at addressing the overinvestment problem since firms that are
closer to financial distress are also more likely to engage in asset substitution.
Table 8 reports the result of the analysis for covenant restricting financing activities.
While all groups of firms see a significant impact on investment from the inclusion of the
covenant, firm that are classified as less constrained exhibit a higher sensitivity. Across
all measured of financial health, firms that classify as unconstrained see a very significant
increase in investment after issuing bonds with financing restrictions relative to those firms
that issue the bonds without the covenants. This may suggest that financially unconstrained
firms that issue bonds with financing restrictions do so in order to reduce the cost of debt,
which enables them to undertake more investment opportunities. However, firms that are
classified as financially constrained also see a significant increase in investment following the
issuance of a bond with covenant restricting financing activities, relative to similar firms
that issue the bond without the covenants. Because agency cost is higher for these firms,
including the covenant may also reduce the cost of debt relative to similarly constrained
firms and thus enable them to invest more. However, these firms are also more likely to
engage in risky asset substitution and overinvestment. Because they are closer to financial
distress, higher investment volatility is more valuable since it increases the upside without
20

Electronic copy available at: https://ssrn.com/abstract=3241645
changing the downside. This suggests that issuing bonds with only financing restriction may
exacerbate the overinvestment problem in financially constrained firms.
6 Conclusion
This paper investigates the ex-post effect of covenants restricting investment and financ-
ing activities on investment policy. Using a two-stage estimation method to control for the
fact that firms choose to include covenants, I find that the investment response differs be-
tween the two groups of covenants. Firms that issue bonds with investment restrictions
have lower level of capital expenditure in the following years, relative to similar firms that
issue bonds without the restrictions. This effect is concentrated among firms that are more
financially constrained. This results suggest that investment restrictions can be effective at
mitigating overinvestment in risky assets. On the other hand, firms that issue bonds with
financing restrictions have higher level of capital expenditure in the following years, relative
to similar firms that issue the bond without the restrictions. The effect is just as strong
in firms that are financially constrained and those that are not. These results may imply
that issuing bonds only with financing restrictions enables firms to lower the cost of debt
and invest more, but may exacerbate overinvestment behavior in firms that are closer to
financial distress.
21

Electronic copy available at: https://ssrn.com/abstract=3241645
References
Almeida, Heitor, and Murillo Campello, 2007, Financial Constraints, Asset Tangibility, andCorporate Investment, Review of Financial Studies 20, 1429–1460.
Almeida, Heitor, Murillo Campello, and Dirk Hackbarth, 2011, Liquidity Mergers, Journalof Financial Economics 102, 526–558.
Alti, Aydogan, 2003, How Sensitive Is Investment to Cash Flow When Financing Is Fric-tionless?, Journal of Finance 58, 707–722.
Asquith, Paul, and Thierry A. Wizman, 1990, Event Risk, Covenants, and BondholderReturns in Leveraged Buyouts, Journal of Financial Economics 27, 195–213.
Baker, Malcolm, Jeremy C. Stein, and Jeffrey Wurgler, 2003, When Does the Market Matter?Stock Prices and the Investment of Equity-Dependent Firms, The Quarterly Journal ofEconomics 118, 969–1005.
Bakke, Tor-erik, and Toni M. Whited, 2010, Which Firms Follow the Market? An Analysisof Corporate Investment Decisions, Review of Economic Studies 23, 1941–1980.
Begley, Joy, 1994, Restrictive Covenants Included in Public Debt Agreements: An EmpiricalInvestigation by, Working Paper .
Berkovitch, Elazar, and E. Han Kim, 1990, Financial Contracting and Leverage InducedOver- and Under-Investment Incentives, Journal of Finance 45, 765–794.
Billett, Matthew T., Tao-hsien Dolly King, and David C. Mauer, 2007, Growth Opportunitiesand the Choice of Leverage , Debt Maturity , and Covenants, Journal of Finance 62, 697–730.
Bradley, Michael, and Michael R. Roberts, 2015, The Structure and Pricing of CorporateDebt Covenants, Quarterly Journal of Finance 05, 1550001.
Brennan, Michael J., and Eduardo S. Schwartz, 1984, Optimal Financial Policy and FirmValuation, Journal of Finance 39, 593–607.
Chava, Sudheer, Praveen Kumar, and Arthur Warga, 2010, Managerial Agency and BondCovenants, Review of Financial Studies 23, 1120–1148.
Chava, Sudheer, and Michael R. Roberts, 2008, How Does Financing Impact Investment?The Role of Debt Covenants, Journal of Finance 63, 2085–2121.
Cook, Douglas O., and John C. Easterwood, 1994, Poison Put Bonds: An Analysis of TheirEconomic Role, Journal of Finance 49, 1905–1920.
Demiroglu, Cem, and Christopher M. James, 2010, The Information Content of Bank LoanCovenants, Review of Financial Studies 23, 3700–3737.
22

Electronic copy available at: https://ssrn.com/abstract=3241645
Denis, David J., and Valeriy Sibilkov, 2010, Financial Constraints, Investment, and the Valueof Cash Holdings, Review of Financial Studies 23, 247–269.
Fazzari, Steven M., R. Glenn Hubbard, and Bruce C. Petersen, 1988, Financing CorporateConstraints Investment, Brookings Papers on Economic Activity 1, 141–206.
Fazzari, Steven M., R. Glenn Hubbard, and Bruce C. Petersen, 2000, Investment-CashFlow Sensitivities are Useful: a Comment on Kaplan and Zingales, Quarterly Journal ofEconomics 115, 695–705.
Goyal, Vidhan K., 2005, Market Discipline of Bank Risk: Evidence from Subordinated DebtContracts, Journal of Financial Intermediation 14, 318–350.
Hennessy, Christopher A., 2004, Tobin ’ s Q, Debt Overhang, and Investment, Journal ofFinance 59, 1717–1742.
Hovakimian, Gayane, and Sheridan Titman, 2006, Corporate Investment with FinancialConstraints : Sensitivity of Investment to Funds from Voluntary Asset Sales, Journal ofMoney, Credit and Banking 38, 357–374.
Jensen, Michael C., and William H. Meckling, 1976, Theory of the Firm : ManagerialBehavior, Agency Costs and Ownership Structure, Journal of Financial Economics 3,305–360.
Kahan, Marcel, and David Yermack, 1998, Investment Opportunities and the Design of DebtSecurities, Journal of Law, Economics, and Organization 14, 136–151.
Kalay, Avner, 1982, Stockholder-Bondholder Conflict and Dividend Constraints, Journal ofFinancial Economics 10, 211–233.
Kaplan, Steven N., and Luigi Zingales, 1997, Do Investment-Cash Flow Sensitivities ProvideUseful Measures of Financing Constraints ?, Quarterly Journal of Economics 112, 169–215.
Lang, Larry, Eli Ofek, and Rene M. Stulz, 1996, Leverage, Investment, and Firm Growth,Journal of Financial Economics 40, 3–29.
Malitz, Ileen, 1986, On Financial Contracting: of Bond The Determinants, Financial Man-agement 15, 18–25.
Mauer, David C., and Steven H. Ott, 2000, Agency Costs, Underinvestment, and OptimalCapital Structure, Project flexibility, agency, and competition: New developments in thetheory and application of real options. Oxford 151–179.
Myers, Stewart C., 1977, Determinants of Corporate Borrowing, Journal of Financial Eco-nomics 5, 147–175.
Nash, Robert C., Jeffry M. Netter, and Annette B. Poulsen, 2003, Determinants of Con-tractual Relations between Shareholders and Bondholders: Investment Opportunities andRestrictive Covenants, Journal of Corporate Finance 9, 201–232.
23

Electronic copy available at: https://ssrn.com/abstract=3241645
Nini, Greg, David C. Smith, and Amir Sufi, 2009, Creditor Control Rights and Firm Invest-ment Policy, Journal of Financial Economics 92, 400–420.
Reisel, Natalia, 2014, On the Value of Restrictive Covenants: Empirical Investigation ofPublic Bond Issues, Journal of Corporate Finance 27, 251–268.
Smith, Clifford W., and L. MacDonald Wakeman, 1985, Determinants of Corporate LeasingPolicy, Journal of Finance 40, 895–908.
Smith, Clifford W., and Jerold B. Warner, 1979, On Financial Contracting, Journal ofFinancial Economics 7, 117–161.
Spyridopoulos, Ioannis, 2018, Tough Love: The Causal Effects of Debt Covenants on FirmPerformance, Working Paper .
Stulz, Rene M., and Herb Johnson, 1985, An Analysis of Secured Debt, Journal of FinancialEconomics 14, 501–521.
Verde, Mariarosa, 1999, Loan Preserver: The Value of Covenants, FitchIBCA Loan ProductsSpecial Report .
Whited, Toni M., 1992, Debit, Liquidity Constraints, and Corporate Investment: Evidencefrom Panel Data, Journal of Finance 47, 1425–1460.
Whited, Toni M., 2006, External Finance Constraints and the Intertemporal Pattern ofIntermittent Investment, Journal of Financial Economics 81, 467–502.
Wooldridge, Jeffrey M., 2002, Econometric Analysis of Cross Section and Panel Data, vol-ume 58 (MIT Press).
Ziliak, James P., and Thomas J. Kniesner, 1998, The Importance of Sample Attrition in LifeCycle Labor Supply Estimation, Journal of Human Resources 33, 507–530.
24

Electronic copy available at: https://ssrn.com/abstract=3241645
Appendix A: Classification of bond covenants
Bond Covenant in FISD Description in FISD
Investment Restrictions
AFTER ACQUIRED PROPERTY CLAUSE Property acquired after the sale of current debt issues willbe included in the current issuer’s mortgage.
TRANSACTION AFFILIATES Issuer is restricted in certain business dealings with its sub-sidiaries.
SUBSIDIARY REDESIGNATION Indicates if restricted subsidiaries may be reclassified as anunrestricted subsidiaries.
ASSET SALE CLAUSE Covenant requiring the issuer to use net proceeds from thesale of certain assets to redeem the bonds at par or at apremium.
SALE XFER ASSETS UNRESTRICTED Issuer must use proceeds from sale of subsidiaries’ assets toreduce debt.
SECURITY LEVEL = SS Indicates if the security is a secured issue of the issuer.STOCK TRANSFER SALE DISP Restricts the issuer from transferring, selling, or disposing
of it’s own common stock or the common stock of a sub-sidiary.
INVESTMENTS Restricts issuer’s investment policy to prevent risky invest-ments.
INVESTMENTS UNRESTRICTED SUBS Restricts subsidiaries’ investments.
Financing Restrictions
FUNDED DEBT IS Restricts issuer from issuing additional funded debt.INDEBTEDNESS IS Restricts user from incurring additional debt with limits on
absolute dollar amount of debt outstanding or percentagetotal capital.
FUNDED DEBT SUB Restricts issuer’s subsidiaries from issuing additionalfunded debt.
INDEBTEDNESS SUB Restricts the total indebtedness of the subsidiaries.SENIOR DEBT ISSUANCE Restricts issuer to the amount of senior debt it may issue
in the future.SUBORDINATED DEBT ISSUANCE Restricts issuance of junior or subordinated debt.NET EARNINGS TEST ISSUANCE To issue additional debt the issuer must have achieved or
maintained certain profitability levels.LEVERAGE TEST IS Restricts total-indebtedness of the issuer.LEVERAGE TEST SUB Limits subsidiaries’ leverage.BORROWING RESTRICTED Indicates subsidiaries are restricted from borrowing, except
from parent.NEGATIVE PLEDGE COVENANT The issuer cannot issue secured debt unless it secures the
current issue on a pari passu basis.SALES LEASEBACK IS Restricts issuer to the type or amount of property used in
a sale leaseback transaction and may restrict its use of theproceeds of the sale.
SALES LEASEBACK SUB Restricts subsidiaries from selling then leasing back assetsthat provide security for the debtholder.
25

Electronic copy available at: https://ssrn.com/abstract=3241645
Appendix B: Variable Definitions
CAPEX : Capital expenditure divided by start of period assets (lagged assets).
CashFlow : Sum of Income Before Extraordinary Items and Depreciation and Amortiza-
tion divided by start of period assets.
Q (Market to book): Book value of assets minus book value of equity plus market value
of equity divided by book value of assets. Book value of equity is stockholders equity minus
preferred stock redemption value plus deferred taxes and investment tax credit.
Size: Natural logarithm of total assets.
Leverage: Sum of debt in current liabilities and long-term debt divided by assets.
Cash: Cash and cash equivalents divided by assets.
PPE/Assets : Ratio of net property, plant and equipment to total assets.
EBITDA/Assets :Ratio of earnings before interest to total assets.
Cash Flow Volatility : Standard deviation of the ratio of EBITDA/Assets and is computed
using historical data for up to 10 years as available.
Dividends : A dummy variable that indicates whether the firm declared any dividends to
its common shareholders.
Dividend Payout Ratio: Ratio of Dividends declared to common shareholders to Income
Before Extraordinary Items.
AGE : Number of years in Compustat.
KZ Index : Sum of (-1.002) times CashFlow, (-39.368) times total dividend divided by
assets, (-1.315) times Cash, 3.139 times Leverage, and 0.283 times Q.
Investment Grade: A dummy variable that equals 1 if the company S&P long-term credit
rating is ’BBB-” or better, and equals 0 if the rating is worse than ’BBB-” or the company
is unrated.
Offering yield is the yield-to-maturity at the time of issuance.
Loan amount/Assets is the ratio of the bond offering amount to total assets.
Maturity is the number of years between the offering date and the maturity date.
Putable, Callable, Convertible are dummies equal to one if the feature is present in the
bond.
Credit Spread is the difference in the yields on BAA and AAA corporate bonds.
Term Spread is the difference between the 10-year and 1-year treasury bonds.
26
Electronic copy available at: https://ssrn.com/abstract=3241645
Table 1: Summary statistics
This table presents descriptive statistics for variables in the sample. The bond data come from the 2016FISD. The sample is restricted to bonds issued by U.S. domiciled non-financial companies that are in U.S.dollars at the intersection of FISD, CRSP and Compustat during 1989-2015. I exclude Yankee, Canadian,foreign currency, government bonds, medium term notes, private placements, bonds with rule 144a, andbonds with missing covenant information, subsequent data, offering yield, offering date, maturity date,or security level. Loan characteristics and credit ratings are at the time the bond are issued and firmscharacteristics correspond to the beginning of the fiscal year in which the bonds are issued. The column Allrepresent the whole sample. T-DIF is the t-value of the difference in the mean values of firms that issuedbonds with the covenant (Yes) and those that did not include the covenant (No). Covenant restrictions aredescribed in Appendix A and variable definitions appear in Appendix B.
All Investment Restrictions Financing Restrictions
Yes No T-DIF Yes No T-DIF
Loan characteristics
Offering yield 5.52 8.41 5.12 30.69 5.73 4.62 12.41
Loan amount/Assets 0.09 0.23 0.08 12.47 0.08 0.16 -9.03
Maturity (years) 13.11 11.07 13.39 -7.33 12.91 13.96 -2.83
Putable 0.05 0.01 0.06 -8.60 0.01 0.23 -14.27
Callable 0.96 0.96 0.96 -0.65 0.98 0.88 8.39
Convertible 0.09 0.02 0.10 -8.43 0.01 0.42 -22.98
Firm characteristics
CAPEX 0.08 0.12 0.07 7.08 0.08 0.10 -4.81
Assets (millions) 24,826 4,264 27,728 -29.40 21,203 40,513 -7.62
Q 1.75 1.40 1.80 -12.37 1.72 1.90 -4.09
Cash Flow 0.11 0.08 0.11 -7.44 0.11 0.09 4.81
Leverage 0.30 0.39 0.29 13.21 0.31 0.27 5.90
PPE/Assets 0.38 0.47 0.37 7.86 0.38 0.39 -1.90
EBITDA/Assets 0.14 0.11 0.15 -9.81 0.15 0.12 8.78
Cashflow Volatility 0.04 0.05 0.04 4.65 0.04 0.05 -7.66
Cash/Assets 0.09 0.07 0.09 -3.39 0.08 0.13 -9.59
Dividends 0.74 0.42 0.79 -16.47 0.77 0.62 8.04
Dividends Payout Ratio 0.32 0.13 0.35 -10.37 0.32 0.33 -0.68
AGE 33.69 21.31 35.44 -16.86 34.57 29.89 6.30
KZ Index 0.55 1.19 0.43 17.42 0.52 0.70 -3.56
Investment Grade 0.74 0.17 0.82 -37.02 0.78 0.57 11.07
Macroeconomics factors
Credit Spread 1.04 0.92 1.06 -6.60 1.05 1.00 3.04
Term Spread 1.75 1.65 1.77 -2.34 1.74 1.80 -1.45
Observations 4221 522 3699 3429 792
Percentage 100 12.4 87.6 81.2 18.8
27

Electronic copy available at: https://ssrn.com/abstract=3241645
Table 2: Covenant selection reduced form probit
This table presents the results of the probit regression of covenant inclusion from equation (1). The bonddata come from the 2016 FISD. The sample is restricted to bonds issued by U.S. domiciled non-financialcompanies that are in U.S. dollars at the intersection of FISD, CRSP and Compustat during 1989-2015.I exclude Yankee, Canadian, foreign currency, government bonds, medium term notes, private placements,bonds with rule 144a, and bonds with missing covenant information, subsequent data, offering yield, offeringdate, maturity date, or security level. Loan characteristics and credit ratings are at the time the bond areissued and firms characteristics correspond to the beginning of the fiscal year in which the bonds are issued.Covenant restrictions are described in Appendix A and variable definitions appear in Appendix B. Standarderrors are adjusted for clustering at the firm level. t-stats are provided in parentheses. ***, **, * indicatesstatistical significance at the 1%, 5%, and 10% respectively.
Investment Restrictions Financing Restrictions
Estimate t-stat Estimate t-stat
Log(Assets) −0.41∗∗∗ (−7.06) −0.23∗∗∗ (−3.46)
Log(Market to Book) −0.82∗∗∗ (−5.09) −0.22 (−1.38)
Leverage 0.65∗ (1.84) 1.68∗∗∗ (3.24)
PPE/Assets 0.58∗∗ (2.33) −0.80∗∗ (−2.53)
EBITDA/Assets −0.50 (−0.70) 1.92∗∗ (2.08)
Cashflow Volatility −2.38 (−1.52) −2.27 (−1.41)
Firm Rating
A −0.52∗∗∗ (−2.73) 0.39∗ (1.92)
BBB −1.14∗∗∗ (−6.14) 0.87∗∗∗ (4.37)
BB 0.62∗∗∗ (3.62) 0.55∗∗ (2.53)
B 0.83∗∗∗ (3.57) 0.37 (1.54)
Log(Maturity) 0.08 (0.99) 0.05 (1.00)
Loan amount/Assets 1.12∗∗∗ (3.09) −0.29 (−0.71)
Putable −0.62∗ (−1.69) −0.75∗∗∗ (−3.35)
Callable 0.19 (0.62) 1.04∗∗∗ (4.95)
Convertible −2.02∗∗∗ (−9.53) −2.54∗∗∗ (−12.87)
Credit Spread 0.06 (0.49) 0.04 (0.47)
Term Spread 0.02 (0.57) −0.13∗∗∗ (−3.73)
Intercept 2.34∗∗∗ (3.44) 2.76∗∗∗ (3.59)
One digit sic code Yes Yes
R2 0.51 0.41
N 4221 4221
covenant = yes 522 3429
28
Electronic copy available at: https://ssrn.com/abstract=3241645
Tab
le3:
Inve
stm
ent
rest
rict
ions
Th
ista
ble
rep
orts
the
resu
lts
from
the
regr
essi
on
ineq
uati
on
(2)
for
cove
nant
rest
rict
ing
inves
tmen
tact
ivit
ies.
The
dep
end
ent
vari
ab
leis
the
chan
gein
capit
alex
pen
dit
ure
scal
edby
lagge
dass
ets.
Inve
stm
ent
rest
rict
ion
sis
ad
um
my
that
equ
als
on
eif
the
rest
rict
ion
ispre
sent
inth
eb
ond
contr
act.
All
contr
olva
riab
les
are
lagg
edon
eye
ar
exce
pt
for
cash
flow
wh
ich
isco
nte
mp
ora
neo
us.
Cov
enant
rest
rict
ion
sare
des
crib
edin
Ap
pen
dix
Aan
dva
riab
led
efin
itio
ns
app
ear
inA
pp
endix
B.
Sta
nd
ard
erro
rsare
ad
just
edfo
rcl
ust
erin
gat
the
firm
leve
l.t-
stat
are
pro
vid
edin
par
enth
eses
.**
*,**
,*
ind
icat
esst
atis
tica
lsi
gnifi
can
ceat
the
1%
,5%
,an
d10%
leve
l,re
spec
tive
ly.
PanelA:
∆CAPEX
=CAPEX
+1−CAPEX
−1
(1)
(2)
(3)
(4)
(5)
Inve
stm
ent
rest
r.−
0.01
∗(−
1.89
)−
0.02
∗∗(−
2.30
)−
0.01
∗(−
1.79
)−
0.02∗
∗(−
2.41
)−
0.01∗
(−1.
89)
Mil
lsR
ati
o0.
01∗
(1.8
6)0.
01∗∗
(1.9
9)0.
01∗
(1.6
9)0.
01∗∗
(2.1
4)
0.01
∗(1.8
3)
∆CashFlow
0.2
2∗∗∗
(7.0
1)0.
14∗∗
∗(4.7
9)0.
23∗
∗∗(7.4
1)0.
15∗
∗∗(5.2
7)
∆Q
0.0
2∗∗∗
(3.5
2)0.
01∗∗
(2.4
4)0.
01∗∗
∗(2.8
5)
0.01
∗∗(2.0
5)
∆Size
−0.0
9∗∗∗
(−7.6
0)−
0.0
8∗∗∗
(−7.3
2)
∆Leverage
−0.1
5∗∗∗
(−4.7
5)−
0.0
9∗∗∗
(−3.2
7)
Yea
rF
.E.
Yes
Yes
Yes
Yes
Yes
R2
0.0
70.1
60.2
40.1
90.2
5
N37
30
3703
3703
3703
3703
29
Electronic copy available at: https://ssrn.com/abstract=3241645
PanelB:
∆CAPEX
=CAPEX
+2−CAPEX
−1
(1)
(2)
(3)
(4)
(5)
Inve
stm
ent
rest
r.−
0.02
∗(−
1.84
)−
0.02
∗∗(−
2.31
)−
0.02
∗(−
1.92
)−
0.02∗
∗(−
2.42
)−
0.02∗
∗(−
2.02
)
Mil
lsR
ati
o0.
01∗
(1.6
9)0.
01∗∗
(1.9
7)0.
01∗
(1.7
8)0.
01∗∗
(2.0
7)
0.01
∗(1.8
7)
∆CashFlow
0.2
4∗∗∗
(6.7
7)0.
16∗∗
∗(4.6
7)0.
25∗
∗∗(7.1
5)0.
17∗
∗∗(5.0
0)
∆Q
0.0
2∗∗∗
(4.1
3)0.
01∗∗
(2.4
1)0.
02∗∗
∗(3.5
8)
0.01
∗∗(2.1
4)
∆Size
−0.1
0∗∗∗
(−7.2
5)−
0.0
9∗∗∗
(−6.8
5)
∆Leverage
−0.1
5∗∗∗
(−4.9
2)−
0.0
9∗∗∗
(−3.1
2)
Yea
rF
.E.
Yes
Yes
Yes
Yes
Yes
R2
0.0
80.1
90.2
70.2
10.2
8
N33
01
3278
3278
3278
3278
30

Electronic copy available at: https://ssrn.com/abstract=3241645
Tab
le4:
Fin
anci
ng
rest
rict
ions
Th
ista
ble
rep
orts
the
resu
lts
from
the
regr
essi
on
ineq
uati
on
(2)
for
cove
nant
rest
rict
ing
fin
an
cin
gact
ivit
ies.
Th
ed
epen
den
tva
riab
leis
the
chan
ge
inca
pit
alex
pen
dit
ure
scal
edby
lagg
edas
sets
.F
inan
cin
gre
stri
ctio
ns
isa
du
mm
yth
at
equ
als
on
eif
the
rest
rict
ion
isp
rese
nt
inth
eb
on
dco
ntr
act
.A
llco
ntr
olva
riab
les
are
lagg
edon
eye
arex
cep
tfo
rca
shflow
wh
ich
isco
nte
mp
ora
neo
us.
Cov
enant
rest
rict
ion
sare
des
crib
edin
Ap
pen
dix
Aan
dva
riab
led
efin
itio
ns
app
ear
inA
pp
end
ixB
.S
tan
dard
erro
rsare
ad
just
edfo
rcl
ust
erin
gat
the
firm
leve
l.t-
stat
are
pro
vid
edin
pare
nth
eses
.***,
**,
*in
dic
ates
stat
isti
cal
sign
ifica
nce
atth
e1%
,5%
,an
d10%
leve
l,re
spec
tive
ly.
PanelA:
∆CAPEX
=CAPEX
+1−CAPEX
−1
(1)
(2)
(3)
(4)
(5)
Fin
anci
ng
rest
r.0.0
4∗∗∗
(4.0
0)0.
03∗∗
∗(4.0
1)0.
02∗∗
∗(3.0
6)0.
03∗
∗∗(3.9
3)0.
02∗
∗∗(3.0
6)
Mil
lsR
atio
−0.0
1∗∗∗
(−4.0
0)−
0.0
1∗∗∗
(−3.9
9)−
0.0
1∗∗∗
(−3.1
3)−
0.0
1∗∗∗
(−3.9
4)−
0.0
1∗∗∗
(−3.1
3)
∆CashFlow
0.2
1∗∗∗
(6.8
5)0.
14∗∗
∗(4.7
1)0.
22∗∗
∗(7.2
5)
0.15
∗∗∗
(5.1
8)
∆Q
0.0
2∗∗∗
(3.7
1)0.
01∗∗
∗(2.5
8)0.
01∗
∗∗(3.0
4)0.
01∗
∗(2.1
9)
∆Size
−0.0
9∗∗∗
(−7.5
8)−
0.0
8∗∗∗
(−7.2
8)
∆Leverage
−0.1
5∗∗∗
(−4.6
6)−
0.0
9∗∗∗
(−3.1
9)
Yea
rF
.E.
Yes
Yes
Yes
Yes
Yes
R2
0.0
80.1
70.2
40.1
90.2
5
N37
30
3703
3703
3703
3703
31

Electronic copy available at: https://ssrn.com/abstract=3241645
PanelB:
∆CAPEX
=CAPEX
+2−CAPEX
−1
(1)
(2)
(3)
(4)
(5)
Fin
anci
ng
rest
r.0.0
5∗∗∗
(4.5
3)0.
05∗∗
∗(4.8
0)0.
04∗∗
∗(4.0
2)0.
05∗
∗∗(4.7
3)0.
04∗
∗∗(4.0
1)
Mil
lsR
atio
−0.0
2∗∗∗
(−4.5
6)−
0.0
2∗∗∗
(−4.6
8)−
0.0
1∗∗∗
(−4.0
4)−
0.0
2∗∗∗
(−4.6
1)−
0.0
1∗∗∗
(−4.0
2)
∆CashFlow
0.2
4∗∗∗
(6.7
6)0.
16∗∗
∗(4.6
5)0.
24∗∗
∗(7.1
3)
0.17
∗∗∗
(4.9
7)
∆Q
0.0
2∗∗∗
(4.4
3)0.
01∗∗
∗(2.6
4)0.
02∗
∗∗(3.8
8)0.
01∗
∗(2.3
7)
∆Size
−0.1
0∗∗∗
(−7.0
8)−
0.0
9∗∗∗
(−6.6
5)
∆Leverage
−0.1
5∗∗∗
(−4.7
5)−
0.0
9∗∗∗
(−2.9
9)
Yea
rF
.E.
Yes
Yes
Yes
Yes
Yes
R2
0.0
80.1
90.2
70.2
10.2
8
N33
01
3278
3278
3278
3278
32

Electronic copy available at: https://ssrn.com/abstract=3241645
Tab
le5:
Cou
nte
rfac
tual
regr
essi
onin
vest
men
tre
stri
ctio
ns
Th
ista
ble
rep
orts
the
mea
nof
pre
dic
ted
chan
gein
cap
ital
exp
end
itu
reu
sin
geq
uati
on
∆CAPEX
=α0IMR
+β1
∆Cashfow
+β2
∆Q
+β3
∆Size
+β4
∆Leverage
+ε i
Th
ed
epen
den
tva
riab
leis
the
chan
gein
cap
ital
exp
end
iture
scale
dby
lagged
ass
ets.
Th
ere
gre
ssio
nis
esti
mate
dse
para
tely
for
firm
sw
ith
an
dw
ith
out
Inve
stm
ent
rest
rict
ion
s.T
wo
sets
ofp
red
icte
dch
an
ge
inca
pit
al
exp
end
itu
reis
then
com
pu
ted
,ex
clu
din
gth
ein
vers
eM
ills
rati
o,
for
the
enti
resa
mp
leu
sin
gth
ees
tim
ates
from
bot
hre
gre
ssio
ns,
on
ese
tw
ith
the
coven
ant
rest
rict
ion
s)an
da
corr
esp
on
din
gse
tw
ith
ou
tit
.A
llco
ntr
ol
vari
able
sar
ela
gged
one
year
exce
pt
for
cash
flow
wh
ich
isco
nte
mp
ora
neo
us.
Cov
enant
rest
rict
ion
sare
des
crib
edin
Ap
pen
dix
Aan
dva
riab
led
efin
itio
ns
app
ear
inA
pp
end
ixB
.S
tan
dar
der
rors
are
ad
just
edfo
rcl
ust
erin
gat
the
firm
leve
l.t-
stat
are
pro
vid
edin
pare
nth
eses
.***,
**,
*in
dic
ates
stat
isti
cal
sign
ifica
nce
atth
e1%
,5%
,an
d10%
leve
l,re
spec
tive
ly.
∆CAPEX
=CAPEX
+1−CAPEX
−1
∆CAPEX
=CAPEX
+2−CAPEX
−1
(1)
(2)
(3)
(4)
Inve
stm
ent
rest
rict
ions
Yes
No
Yes
No
Ave
rage
Pre
dic
ted
∆CAPEX
∗10
0-1
.68
-0.4
8-2
.93
-0.7
8
Std
.er
r(0
.09)
(0.0
5)(0
.10)
(0.0
6)
Diff
eren
cein
pre
dic
ted
mea
ns
-1.2
0***
-2.1
5***
st.
err
(0.1
0)(0
.11)
t-va
lue
-12.
27-1
9.36
Reg
ress
ions
resu
lts
R2
0.35
0.26
0.38
0.30
Obse
rvat
ions
411
3292
371
2907
33

Electronic copy available at: https://ssrn.com/abstract=3241645
Tab
le6:
Cou
nte
rfac
tual
regr
essi
onfinan
cing
rest
rict
ions
Th
ista
ble
rep
orts
the
mea
nof
pre
dic
ted
chan
gein
cap
ital
exp
end
itu
reu
sin
geq
uati
on
∆CAPEX
=α0IMR
+β1
∆Cashfow
+β2
∆Q
+β3
∆Size
+β4
∆Leverage
+ε i
Th
ed
epen
den
tva
riab
leis
the
chan
gein
cap
ital
exp
end
iture
scale
dby
lagged
ass
ets.
Th
ere
gre
ssio
nis
esti
mate
dse
para
tely
for
firm
sw
ith
an
dw
ith
out
Fin
an
cin
gre
stri
ctio
ns.
Tw
ose
tsof
pre
dic
ted
chan
ge
inca
pit
al
exp
end
itu
reis
then
com
pute
d,
excl
ud
ing
the
inve
rse
Mil
lsra
tio,
for
the
enti
resa
mp
leu
sin
gth
ees
tim
ates
from
bot
hre
gre
ssio
ns,
on
ese
tw
ith
the
coven
ant
rest
rict
ion
s)an
da
corr
esp
on
din
gse
tw
ith
ou
tit
.A
llco
ntr
ol
vari
able
sar
ela
gged
one
year
exce
pt
for
cash
flow
wh
ich
isco
nte
mp
ora
neo
us.
Cov
enant
rest
rict
ion
sare
des
crib
edin
Ap
pen
dix
Aan
dva
riab
led
efin
itio
ns
app
ear
inA
pp
end
ixB
.S
tan
dar
der
rors
are
ad
just
edfo
rcl
ust
erin
gat
the
firm
leve
l.t-
stat
are
pro
vid
edin
pare
nth
eses
.***,
**,
*in
dic
ates
stat
isti
cal
sign
ifica
nce
atth
e1%
,5%
,an
d10%
leve
l,re
spec
tive
ly.
∆CAPEX
=CAPEX
+1−CAPEX
−1
∆CAPEX
=CAPEX
+2−CAPEX
−1
(1)
(2)
(3)
(4)
Fin
anci
ng
rest
rict
ions
Yes
No
Yes
No
Ave
rage
pre
dic
ted
∆CAPEX
∗10
0-1
.06
-3.3
3-1
.35
-4.9
2
Std
.er
r(0
.05)
(0.0
6)(0
.05)
(0.0
8)
Diff
eren
cein
pre
dic
ted
mea
ns
2.27
***
3.56
***
st.
err
(0.0
8)(0
.10)
t-va
lue
29.8
337
.04
Reg
ress
ions
resu
lts
R2
0.24
0.36
0.25
0.44
Obse
rvat
ions
3001
702
2669
609
34

Electronic copy available at: https://ssrn.com/abstract=3241645
Table 7: Investment restrictions and financial constraints
This table reports the estimated coefficients and t-statistics of β0 and β1 as well as the t-statistic of thedifference between these two estimates from the regression in equation (3) for covenant restricting investmentactivities. The dependent variable is the change in capital expenditure scaled by lagged assets. All controlvariables are lagged one year except for cash flow which is contemporaneous. Covenant restrictions are de-scribed in Appendix A and variable definitions appear in Appendix B. The regressions specification interactsan indicator variable corresponding to different proxies for financial constraints with every right-hand sidevariable. The indicator proxies are all measured at the end of the fiscal year prior to the bond issuanceand include. A firm is classified as Younger (Older), Low (High), or Small (Large) if it is in the lower(upper) third of the distribution for AGE, CASH, or KZ INDEX, and is considered financially constrained(unconstrained). A firm is classified as Low for DPR and considered financially constrained if it declaredless than 10% of income in dividend, and as High and considered financially unconstrained if it declaredmore than 30% or dpr has a negative value. Standard errors are adjusted for clustering at the firm level.t-stat are provided in parentheses. ***, **, * indicates statistical significance at the 1%, 5%, and 10% level,respectively.
Panel A: ∆CAPEX = CAPEX+1 − CAPEX−1
AGE CASH DPR KZ INDEX
Younger -0.021** Low -0.025** Low -0.015* Large -0.014
(-2.14) (-2.57) (-1.91) (-1.63)
Older 0.002 High -0.002 High -0.004 Small -0.006
(0.26) (-0.16) (-0.60) (-0.56)
T-Dif 2.55 T-Dif 1.80 T-Dif 1.40 T-Dif 0.73
Obs. 2632 Obs. 2444 Obs. 3335 Obs. 1493
Panel B: ∆CAPEX = CAPEX+2 − CAPEX−1
AGE CASH DPR KZ INDEX
Younger -0.030** Low -0.026** Low -0.025*** Large -0.021**
(-2.53) (-2.27) (-2.60) (-2.01)
Older 0.004 High -0.0181 High 0.000 Small 0.007
(0.39) (-1.26) (-0.02) (0.55)
T-Dif 3.02 T-Dif 0.51 T-Dif 2.68 T-Dif 2.41
Obs. 2332 Obs. 2149 Obs. 2961 Obs. 1335
35

Electronic copy available at: https://ssrn.com/abstract=3241645
Table 8: Financing restrictions and financial constraints
This table reports the estimated coefficients and t-statistics of β0 and β1 as well as the t-statistic of thedifference between these two estimates from the regression in equation (3) for covenant restricting financingactivities. The dependent variable is the change in capital expenditure scaled by lagged assets. All controlvariables are lagged one year except for cash flow which is contemporaneous. Covenant restrictions are de-scribed in Appendix A and variable definitions appear in Appendix B. The regressions specification interactsan indicator variable corresponding to different proxies for financial constraints with every right-hand sidevariable. The indicator proxies are all measured at the end of the fiscal year prior to the bond issuanceand include. A firm is classified as Younger (Older), Low (High), or Small (Large) if it is in the lower(upper) third of the distribution for AGE, CASH, or KZ INDEX, and is considered financially constrained(unconstrained). A firm is classified as Low for DPR and considered financially constrained if it declaredless than 10% of income in dividend, and as High and considered financially unconstrained if it declaredmore than 30% or dpr has a negative value. Standard errors are adjusted for clustering at the firm level.t-stat are provided in parentheses. ***, **, * indicates statistical significance at the 1%, 5%, and 10% level,respectively.
Panel A: ∆CAPEX = CAPEX+1 − CAPEX−1
AGE CASH DPR KZ INDEX
Younger 0.028** Low 0.034*** Low 0.028*** Large 0.022*
(2.29) (3.21) (3.06) (1.85)
Older 0.041*** High 0.045*** High 0.034*** Small 0.033***
(3.48) (4.14) (3.72) (2.76)
T-Dif 3.17 T-Dif 2.59 T-Dif 1.94 T-Dif 3.65
Obs. 2632 Obs. 2444 Obs. 3335 Obs. 1493
Panel B: ∆CAPEX = CAPEX+2 − CAPEX−1
AGE CASH DPR KZ INDEX
Younger 0.043*** Low 0.051*** Low 0.042*** Large 0.024*
(3.41) (4.36) (3.42) (1.91)
Older 0.056*** High 0.053*** High 0.051*** Small 0.041***
(4.50) (4.43) (4.25) (3.45)
T-Dif 3.31 T-Dif 0.49 T-Dif 2.40 T-Dif 4.32
Obs. 2332 Obs. 2149 Obs. 2961 Obs. 1335
36