bolivar dev plan_final draft_16 sept 2013
DESCRIPTION
el mejor documentoTRANSCRIPT
Bolivar Development Plan
September 16, 2013
Bolivar Block
Colombia
Prepared for
By
Ralph E. Davis Associates, Inc.

RALPH E. DAVIS ASSOCIATES, INC. Texas Registered Engineering Firm F‐1529 Page | 2
LEGAL DISCLAIMER
Ralph E. Davis Associates, Inc. (“RED”) has been retained by Global Energy Development plc and its affiliates (together “GED” or the “Company”) to prepare a comprehensive development plan for the Company’s reserves within the Bolivar Association Contract, onshore Colombia (the “Bolivar Development Plan”).
This Bolivar Development Plan contains certain forward looking statements relating to, but not limited to, Company’s operations, anticipated financial performance, business prospects and strategies, including expectations relating to production levels; capital expenditure programs; the quantity of oil and gas reserves; projections of market prices; projections of costs; supply and demand for oil and gas commodities; expectations regarding the ability to raise capital and to continually develop the Company’s reserves located within the Bolivar Association Contract; assumptions related to governmental regulatory regimes affecting royalties, taxes, environmental and general operating permits and licenses. The Bolivar Development Plan also relies on numerous other assumptions regarding factors and risks that could cause actual results to vary materially, including, without limitation to, the following factors: risks associated with oil and gas development, substantial capital requirements and financing, prices, markets and marketing, government regulation, third party risk, environmental, hydraulic fracturing, dependence on key personnel, availability of drilling equipment and access, risks may not be insurable, variations in exchange rates, expiration of licenses and leases, reserves and resources estimates, development of oil and natural gas properties, competition, management of growth, conflicts of interest, and issuance of debt. There is no representation by the Company that actual results achieved will be the same in whole or in part as those set out in the forward looking information.
The Bolivar Development Plan is for informational purposes only. RED AND THE COMPANY AND EACH OF THEIR RESPECTIVE AFFILIATES, OFFICERS, DIRECTORS, EMPLOYEES, AGENTS AND REPRESENTATIVES, MAKE NO EXPRESS OR IMPLIED REPRESENTATIONS OR WARRANTIES AND ASSUME NO LIABILITY FOR THE ACCURACY OR COMPLETENESS OF THE BOLIVAR DEVELOPMENT PLAN; AND RED AND THE COMPANY MAKE NO REPRESENTATIONS CONCERNING THE PRESENT OR FUTURE VALUE OF THE ANTICIPATED INCOME, COSTS OR PROFITS, IF ANY, TO BE DERIVED FROM THE EXECUTION OF, INVESTMENT OR PARTICIPATION IN, THE BOLIVAR DEVELOPMENT PLAN.
Provision of the Bolivar Development Plan does not constitute an offer, an acceptance, or a contract to negotiate or enter into a possible transaction involving the Company’s interest in the Bolivar Association Contract, nor is it intended to require the Company to proceed with or continue such negotiations or transaction.

RALPH E. DAVIS ASSOCIATES, INC. Texas Registered Engineering Firm F‐1529 Page | 3
Table of Contents

RALPH E. DAVIS ASSOCIATES, INC. Texas Registered Engineering Firm F‐1529 Page | 4
TABLE OF CONTENTS Introduction 5
Bolivar Block Opportunity Description 9
Bolivar Block Overview 27
Bolivar Geology & Historical Wells
─ Regional Geological Overview
─ General Stratigraphic Section
─ Bolivar Area Field Project Geological Summary
─ Reservoir Description
─ Reservoir Properties
─ Middle La Luna Comparison
─ Buturama Field Drilling Results
─ Catalina 1 Geochemical Analysis
─ Thermal Maturities
─ Hydrocarbon Generation & Migration
─ Historic Drilling & Seismic Coverage
─ Exxon/Canacol Mono Araña 1 Well
31
32
33
34
39
43
44
46
47
50
51
52
53
Development Concept
─ Multiple Stacked Light Oil Producing Zones
─ Bolivar Shale Tests
─ Tablazo Interval with Recorded Oil Flow
─ Fracture Intensity vs. Curvature
─ Well Design Selection Criteria Guided by Significant Natural Fracturing
─ Bolivar Fracture Frequency Analysis
─ Bolivar’s High Natural Fracture Permeability Requires Vertical Well Development
─ Well Design for Vertical vs. Horizontal Fractured Oil Wells
─ Extensive Fracture Intersections and Drilling Fluid Damage Remediation
─ Vertical Completion Profile Possible at Bolivar Due to Intense Natural Fracturing
─ Reserves & Resources
─ Projected Production & Cost Profiles
─ La Luna, Tablazo and Simiti Shale Type Curves
─ Bolivar Development Plan – Facilities, Oil Marketing Transport and Manpower
─ Development Well Plan
─ Environmental License
─ Bolivar Block Multi‐Well Platform
─ Facilities & Transportation
54
55
56
59
60
61
62
63
64
65
66
67
68
70
73
77
78
81
83
Cash Flow and Economic Summaries 85
Production Plots 101
Contract Information 104
Appendix
─ Vertical Well Cost for Five Formation Stacked Pay
─ Olivo 2 Preliminary Frac Design
─ Olivo 2 Well Bore Schematic
─ Ryvol Oil Reservoir Volumetric Data Sheets
107
108
111
112
113

RALPH E. DAVIS ASSOCIATES, INC. Texas Registered Engineering Firm F‐1529 Page | 5
INTRODUCTION
Global Energy Development is focusing its efforts on developing its oil and gas reserves from
the Middle La Luna, Simiti and Tablazo oil shales and the Rosa Blanca and Salada limestones in
the Bolivar Block located in the middle Magdalena Basin, Colombia. The Rosa Blanca, Salada,
Simiti, Tablazo and La Luna formations will be developed by drilling and simultaneously being
produced in vertical wells. The Development Plan will be funded using existing and future
generated cash flow from Global producing properties in the Llanos Basin, Colombia and/or
farm‐in partners.
CONCLUSIONS REGARDING BOLIVAR DEVELOPMENT PROGRAM
The development program as shown herein can be implemented and carried out using
internal cash flow generated from Global's Llanos Production Base, vendor financing
and/or farm‐in partners.
The development program is designed for a six (6) rig drilling program with a total of
252 new vertical wells.
Peak 2P gross production of 49,000 BOPD (net of 27,000 BOPD) is expected in 2019.
Peak 3P gross production of 200,000 BOPD (net of 155,000 BOPD) is expected by early
2020.
At contract term expiration in mid‐2024, a total of 99 MMbo and 104 Bcf (Net of 55
MMbo and 54 Bcf) of 2P reserves (Proved and Probable) will be produced generating 2P
Future Net Income (FNI) of $3.9 billion ($2.2 billion @ 10%).
At contract term expiration in mid‐2024, a gross total of 337 MMbo and 227 Bcf (Net
184 MMbo and 110 Bcf) of 3P Reserves (Proved, Probable, Possible) will be produced
generating Future Net Income (FNI) of $13.3 billion ($7.7 billion @ 10 %).
The gross project production of 337 mmbo represents 88% of the 381 mmbo of the
technically recoverable oil.

RALPH E. DAVIS ASSOCIATES, INC. Texas Registered Engineering Firm F‐1529 Page | 6
The proposed hydraulic fracturing test of the Middle La Luna in the Olivo 1 and the
Simiti shale in the Catalina 1 could significantly affect the 3P Reserves and production
rates. Although not horizontal in the test zones, the Catalina 1 and the Olivo 1 were
drilled directionally through the La Luna and Simiti and the tests will give some
indication of how well these two shale formations react to fracture treatment.
The project becomes internally self‐funding for 3P reserve development in 2014. The
maximum cumulative negative cash flow experienced during the development project is
less than $3 million. The Figure that follows shows the 3P cumulative undiscounted cash
flow estimated for the project to be $13.3 billion at contract termination in mid‐2024.
Global has informed us that they expect Ecopetrol to minimize its capital exposure and
operating risk by backing in for a 50% working interest after allowing Global to achieve
200% payout of its capex prior to back‐in. This is scheduled to occur in the economic
projections during late mid‐2019. All reserves and economics are calculated on a net
basis using this back‐in formula and do not include any out of pocket payments by
Ecopetrol to accelerate their participation. It should be noted that Ecopetrol will
continue to receive a 20% royalty at all times regardless of their back‐in status.
Therefore, to maximize internal rate of return, Ecopetrol will back‐in after 200% payout
when the project becomes self‐funding. Such timing insures Ecopetrol will incur zero
capital expenditure exposure and infinite IRR.

RALPH E. DAVIS ASSOCIATES, INC. Texas Registered Engineering Firm F‐1529 Page | 7
BOLIVAR ASSOCIATION CONTRACT

RALPH E. DAVIS ASSOCIATES, INC. Texas Registered Engineering Firm F‐1529 Page | 8
Formation Depth* Porosity SwReservoir
tempReservoir
PressOil
GravityGas
Gravity GOR Net Pay%
Recovery OOIP Block Rec. Reserves Acres
1 La Luna 4,080 9.5% 20 108 1958 23 0.6 100 400.0 3.7% 4,572,622,055 169,187,016 20,321
2 Salada 4,530 11.8% 15.5 120 2174 14 0.6 1200 78.5 17.0% 212,829,802 36,181,066 7,859
3 Simiti 4,800 7.2% 20 127 2304 32 0.8 1000 280.0 6.0% 1,467,261,700 88,035,702 20,321
4 Tablazo 5,675 8.0% 20 150 2724 36 0.8 1000 150.0 3.7% 853,911,046 31,594,709 20,321
5 Rosablanca 5,900 4.5% 18.8 156 2832 36 0.8 1200 180.7 25.0% 223,028,277 55,757,069 7,859
TD 6,440 170 3091
Total 1089.2 7,329,652,879 380,755,562
* Catalina Depths taken as average
6,893,794,801 Shale Volume
NOTES:
1 RED believes the recovery efficiency in the Simiti will be better than the other two shales. Used 6% recovery factor however RED only counts
the lower 280 feet believing the upper Simiti is likely to be too gassy. Schlumberger analysis does not indicate Upper Simiti is gassy.
2 The 30% recovery factor previously used for the Rosablanca was performance driven. With the larger volumes RED has
compensated by reducing the recovery factor to 25%. Weighted average recovery factor for all five reservoirs is 5.2%.
3 Separator Temperature=90degF, Separator Pressure=100psi.
4 Constant pressure gradient=0.48 psi/ft, temperature gradient = 0.0264 degF/ft.
(94% of OOIP)
MIDDLE MAGDALENA VALLEY, COLOMBIA
Original Oil in Place Petrophysical, Fluid, Pressure and Temperature Data

RALPH E. DAVIS ASSOCIATES, INC. Texas Registered Engineering Firm F‐1529 Page | 9
Bolivar Block Opportunity Description

RALPH E. DAVIS ASSOCIATES, INC. Texas Registered Engineering Firm F‐1529 Page | 10
BOLIVAR DEVELOPMENT PLAN
Global Energy Development PLC conducts operations in the Llanos and Middle Magdalena
Valley regions of Colombia through its wholly owned subsidiary, Colombia Energy Development
Company (CEDCO).
Over the past several years Global has focused its efforts and capital on complying with
contractual obligations in the Llanos Basin and has now completed these obligations.
The majority of Global’s production in Colombia comes from the Llanos area; however, the recent higher crude oil prices have created substantial cash flow that can be used by the company to focus its efforts on their largest reserve assets located in the Bolivar and Bocachico blocks of the Middle Magdalena Basin. Newly identified production process technology and horizontal drilling with multistage fracs will enable the company to accelerate the development

RALPH E. DAVIS ASSOCIATES, INC. Texas Registered Engineering Firm F‐1529 Page | 11
of these assets using the existing and future internal cash flows from the Llanos, industry partners or capital sources. Development in the Torcaz Field (Bocachico Block) will be accomplished by drilling wells and using the modified CHOPS (Cold Heavy Production with Sand) technology which is in use in producing fields in Canada. Global has recently shown that CHOPS sanding was successful in the Mugrosa formation through the Torcaz No. 5 well. Additional tests will be performed in the Torcaz No. 3 well before full application of the technology is used. The plans for the Bolivar Block, the focus of this report, will be to develop the Rosa Blanca plus Salada limestones and the La Luna, Tablazo and Simiti shales by drilling vertical wells with multi stage hydraulic fracturing currently being used for development of the natural gas and oil bearing shales in North America. The sequential operating plan shown below illustrates the company’s plans for funding and development.

RALPH E. DAVIS ASSOCIATES, INC. Texas Registered Engineering Firm F‐1529 Page | 12
The following table summarizes the Bolivar Development Concept. As previously mentioned
the zones of opportunity are the Rosa Blanca, Salada, Simiti, Tablazo and La Luna. Table 1: Bolivar Project Overview
AREA DESCRIPTION HISTORY OPPORTUNITY BOLIVAR‐ROSA BLANCA (CATALINA)
Vertically fractured limestone containing light oil.
Horizontal well drilled in 1998 in the Rosa Blanca produced at 10,000 boepd.
Well produced 600,000 barrels over 24 months.
Resume field development given much lower well costs due to use of vertical drilling techniques.
BOLIVAR‐ SALTO/SALADA (OLIVO)
Vertically fractured limestone containing heavy oil.
Olivo 1 produced in 1998 heavy oil at rates of up to 5000 bopd of 14 gravity oil.
Well still producing with cumulative of 675,000 bbls.
Hydraulically fracture the Middle La Luna formation in the existing wellbore of Olivo #1 including the Salto/Salada.
BOLIVAR‐LA LUNA & SIMITI
Shale Oil project located in the world class La Luna source rock and possible light oil rich Simiti shale.
No prior well tests of the Simiti.
Lower La Luna tested oil productive in Olivo #1 and Olivo #2.
Simiti test in Catalina 1.
Substantial P3 barrels of oil are potentially recoverable in the Bolivar Middle and Upper La Luna (not including Salto/Salada reserves).
Expect Olivo #1 test or Catalina #1 Simiti test to begin before year end.
Several major oil companies (Exxon, Shell and Conoco‐Phillips) have recently acquired properties adjacent or nearby to Bolivar.

RALPH E. DAVIS ASSOCIATES, INC. Texas Registered Engineering Firm F‐1529 Page | 13
Contract Summary
Global was awarded the Bolivar contract in July 1996 with duration of twenty eight (28) years.
All contractual minimum work commitments and exploration obligations have been met. The
royalties are 20% of production which Ecopetrol can take in kind and has the right to back in
with a 50% working interest after 200% reimbursement of direct costs. To date Ecopetrol has
not exercised their back in option and Global retains a 100% working interest.
Geology Summary
The Bolivar block is located at the narrowing northern end of the Middle Magdalena Basin
where the Western and Eastern Cordillera converge creating a series of faulted anticlines and
highly fractured reservoirs. The high initial rates seen in Table 1 are due mainly to the natural
fracturing. RED anticipates that the addition of hydraulic fracturing will improve the initial rates
and reserve recovery. The target reservoirs are at depths from 4000 to 8000 feet below sea
level and range in thickness from 300 to 500 feet. A more detailed geologic description
prepared by Global personnel of the area is included in the Geology section of this report.
Bolivar Field Reserves
The reserves shown in this report were estimated using volumetric, performance and
analogous wells. These estimates conform to the definition of proved, probable and possible
reserves approved by the SPE/WPC/AAPG/SPEE Petroleum Resources Management System
(SPE‐PRMS) documents as co‐sponsored by the Society of Petroleum Engineers, the World
Petroleum Council, the American Associations of Petroleum Geologists and the Society of
Petroleum Evaluation Engineers. A copy of these definitions and guidelines is included in this
report.
The Rosa Blanca and Salada formations have current and past production and are considered
reserves with Proved, Probable and Possible drilling locations. The La Luna volumes included in
this report are considered Possible reserves as the presence of oil established. The La Luna is a
known source rock for the area and the Olivo No. 2 inclined well briefly tested 80 BOPD of 14
degree gravity oil with no stimulation. The production rates and reserves attributed to the La
Luna completions are modeled using a type well developed from historical and current
production from the “oil window” of the Eagle Ford Shale in South Texas.

RALPH E. DAVIS ASSOCIATES, INC. Texas Registered Engineering Firm F‐1529 Page | 14
Tables 2 shows the estimates for 2P reserves at year end 2012. These estimates do not include reserve estimates for the La Luna, Tablazo or Simiti as they are classified as possible and resource potential respectively. Table 2: December 31, 2012 Proved + Probable (2P)
PROVED + PROBABLE (2P)
PROVED PROBABLE TOTAL
Net Reserves
Oil/Condensate‐MBbls 25,514.3 9,530.8 35,045.1
Gas‐MMCF 31,281.8 7,916.6 39,198.4
Income Data (M$)
Future Gross Revenue $ 2,564,332.1 $ 952,520.8 $ 3,516,852.9
Operating Costs $ 466,065.2 $ 173,620.0 $ 639,685.2
Capital Costs $ 175,556.8 $ 75,894.7 $ 251,451.5
Future Net Income (FNI) $ 1,922,710.0 $ 703,006.1 $ 2,625,716.1
FNI @ 10% $ 1,311,929.6 $ 446,222.5 $ 1,758,152.1
Table 3 shows the estimates for 3P reserves at year end 2012. Table 3: December 31, 2012 Proved + Probable + Possible (3P)
PROVED + PROBABLE + POSSIBLE (3P)
PROVED PROBABLE POSSIBLE TOTAL
Net Reserves
Oil/Condensate‐MBbls 25,514.3 9,530.8 83,951.1 118,996.2
Gas‐MMCF 31,281.8 7,916.6 9,585.7 48,784.1
Income Data (M$)
Future Gross Revenue $ 2,564,332.1 $ 952,520.8 $ 8,260,009.4 $ 11,776,862.3
Operating Costs $ 466,065.2 $ 173,620.0 $ 1,515,925.4 $ 2,155,610.6
Capital Costs $ 175,556.8 $ 75,894.7 $ 1,923,745.8 $ 2,175,197.3
Future Net Income (FNI) $ 1,922,710.0 $ 703,006.1 $ 4,820,338.0 $ 7,446,054.1
FNI @ 10% $ 1,311,929.6 $ 446,222.5 $ 2,605,466.3 $ 4,363,618.4

RALPH E. DAVIS ASSOCIATES, INC. Texas Registered Engineering Firm F‐1529 Page | 15
Any differences in these estimates when compared to prior reserve reports are due to contract expiration date, commodity prices and reserve additions. The substantial increase in possible reserves is due to the addition of 219 MMBO attributed to the future development of the La Luna, Tablazo and Simiti. Also, the probable reserves for wells not yet drilled decreased because the contract expiration in 2024 results in a loss of a year of future production.
Development Plan The development plan outlined in this report is based on drilling 252 new vertical wells utilizing a six (6) rig drilling program that commences in 2014 and is completed in mid‐2020. The availability of rigs should not be a concern as the number of rigs in Colombia has increased dramatically in the past five years and local contractors have sufficient equipment to support a multi rig drilling program at Bolivar. Global plans to shoot additional seismic to identify the fracture trends at Bolivar. The initial phase of development in 2014 is to hydraulically fracture the Middle La Luna in the Olivo No. 1 well and the Simiti in Catalina 1. If successful, the initial test rate in Olivo 1 could be 300 to 1100 BOPD. The Catalina 1, also during 2014, would then by hydraulically fractured in the Simiti with a rate of several hundred BOPD expected. There are also development locations that can be drilled in 2014 under the existing environmental permit. The planned development after 2014 will require modifying the existing permit to include the new development plan and approval should be during early 2015. The five prospective zones will require hydraulic fracturing. The recent interest in shale development programs in Colombia and Argentina using established completion techniques from the United States will require a substantial increase in the number of crews and equipment in these countries. Service companies operating in the US have informed Global that there is a surplus of equipment in the US that is readily available and can be transported to the Bolivar area. Water should also be readily available and in ample supply in the area. Initially the required volumes of frac sand can easily be transported from the US until a domestic supply in Colombia can be developed. In this report development drilling will be completed in 2020 with the gross crude oil production peaking at approximately 200,000 barrels per day during 2020.

RALPH E. DAVIS ASSOCIATES, INC. Texas Registered Engineering Firm F‐1529 Page | 16

RALPH E. DAVIS ASSOCIATES, INC. Texas Registered Engineering Firm F‐1529 Page | 17
Northern South America Geologic Introduction
Excerpt from EIA/ARI World Shale Gas And Shale Oil Resource Assessment
MIDDLE MAGDALENA VALLEY BASIN
Introduction and Geologic Setting The 13,000‐mi2 Middle Magdalena Valley Basin (MMVB) is a north‐south trending intermontane basin in central Colombia situated between the Eastern and Central cordilleras and located 150 miles north of Bogota. The MMVB is Colombia’s most explored conventional oil and gas producing basin, with over 40 discovered oil fields that produce mainly from Tertiary sandstone reservoirs. Although within the Andes Mountains region, with its complex tectonics including numerous thrust and extensional faults, the interior of the MMVB has simpler structure with relatively flat surface topography. The eastern side of the basin is structurally more complex and overthrusted.
Northern South America Geologic Introduction

RALPH E. DAVIS ASSOCIATES, INC. Texas Registered Engineering Firm F‐1529 Page | 18
Northern South America Shale Oil Reservoir Properties
and Resources (EIA)

RALPH E. DAVIS ASSOCIATES, INC. Texas Registered Engineering Firm F‐1529 Page | 19
Middle Magdalena Oil Source Rock Assessment (EIA) Oil in the Middle Magdalena was generated by marine, dominantly carbonate‐rich source rocks with variable siliciclastic mud content. Source rocks include the Rosablanca, Paja, Tablazo, Simiti, La Luna and Umir formations. Among these source rocks, the main units are two stratigraphic intervals which correspond to the flooding surface distal facies of the Paja‐Tablazo and La Luna formations.
South American Source Rock and Conventional Reservoir Stratigraphy

RALPH E. DAVIS ASSOCIATES, INC. Texas Registered Engineering Firm F‐1529 Page | 20
Northern South America Geologic Introduction
Middle Magdalena Valley Basin, Shale‐Prospective Areas and Shale Exploration
RALPH E. DAVIS ASSOCIATES, INC. Texas Registered Engineering Firm F‐1529 Page | 21
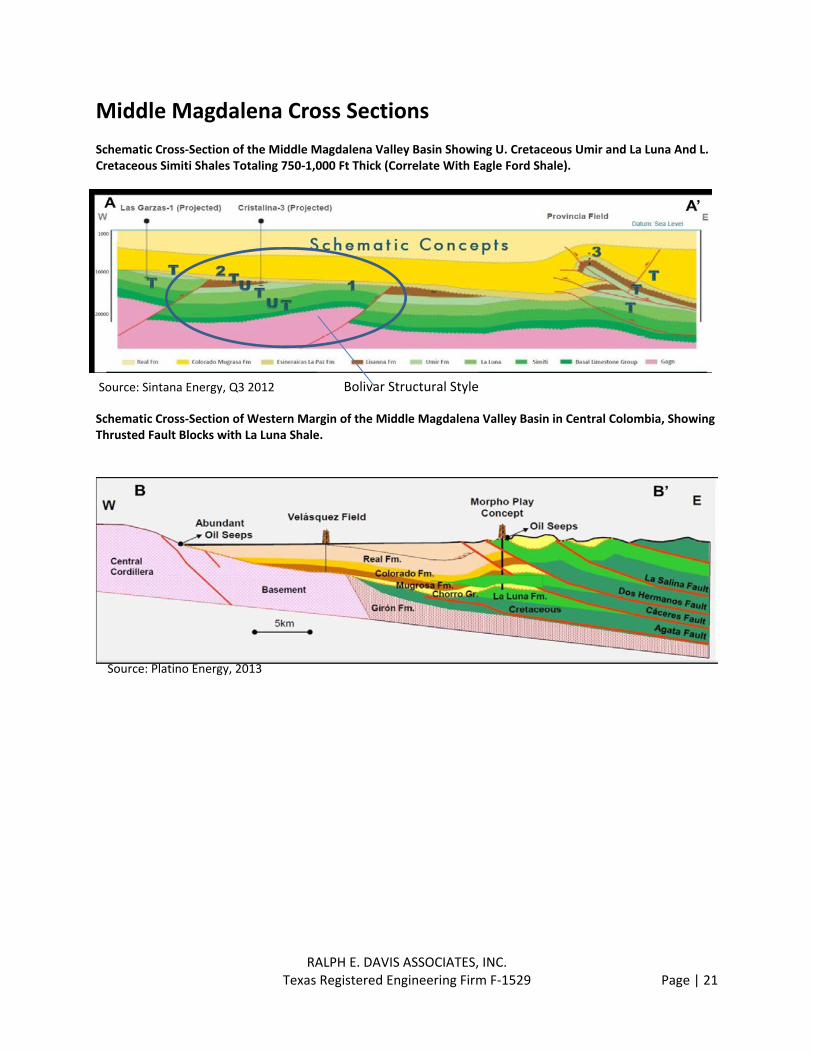
Middle Magdalena Cross Sections Schematic Cross‐Section of the Middle Magdalena Valley Basin Showing U. Cretaceous Umir and La Luna And L. Cretaceous Simiti Shales Totaling 750‐1,000 Ft Thick (Correlate With Eagle Ford Shale).
Schematic Cross‐Section of Western Margin of the Middle Magdalena Valley Basin in Central Colombia, Showing Thrusted Fault Blocks with La Luna Shale.
Source: Sintana Energy, Q3 2012 Bolivar Structural Style
Source: Platino Energy, 2013

RALPH E. DAVIS ASSOCIATES, INC. Texas Registered Engineering Firm F‐1529 Page | 22
Middle Magdalena Seismic Section
Seismic Line in the Middle Magdalena Valley Basin Showing Cretaceous La Luna and Simiti Shales
Truncated by Erosional Unconformity

RALPH E. DAVIS ASSOCIATES, INC. Texas Registered Engineering Firm F‐1529 Page | 23
La Luna Reservoir and Source Rock Properties
• The Cretaceous La Luna formation has been identified as one of the richest source rocks in the world and is the principal source rock for the Middle Magdalena in Colombia and the prolific Maracaibo Basin in Venezuela. The La Luna has been identified as a self‐sourced” or “hybrid” interval, holding conventional porosity juxtaposed in direct contract with source rock intervals. Such hybrid properties (similar to the Eagle Ford) suggest potentially higher recovery factors and superior economics when compared to simple source rocks. The La Luna mostly contains a kerogen (type II), which qualifies the unit as an oil producer and shows excellent characteristics as a hydrocarbon source rock, as represented by the quality and quantity of its organic matter.
• The La Luna consists of calcareous mudstones and planktonic limestones in a middle‐to outer marine shelf. Total organic content (“TOC”) in the La Luna varies between 0.3% and 12.25% but most values are between 1.0% and 6.4%. The average 2.6% TOC content corresponds to a very good‐to‐excellent source rock. Maturity data indicates that the La Luna formation is in the early oil generation window in the north central portion of the basin and reaches the gas generation window further to the south.
• The La Luna formation is approximately 1,000 feet thick and ranges from 3,000 feet to slightly over 15,000 feet deep across the Middle Magdalena. Mapping indicates a large (3,800 km²) oil‐prone prospective window for the La Luna shale extending through the northern region of the basin, while a much smaller (322 km²) prospective window for wet gas and condensate has been identified in the south central portion of the basin.
• The La Luna formation comprises three members: the Salada, Pujamana, and Galembo. The most organic rich (3‐12% TOC) is the 150 m thick Salada member (productive at Bolivar) which consists of hard, black, thinly bedded and finely laminated limy shales, along with thin interbeds of black fine‐grained limestone. The lower TOC Pujamana member consists of gray to black thinly‐bedded and calcareous shale. The 220 m thick Galembo member has moderate TOC (1‐4%) and also consists of black, thinly‐bedded calcareous shale but with only thin limestone interbeds.

RALPH E. DAVIS ASSOCIATES, INC. Texas Registered Engineering Firm F‐1529 Page | 24
Other Source Rocks and Stacked Target Development
• The Middle Magdalena, in addition to the La Luna source rock, exploration upside exists in secondary horizons including the Rosablanca, Simiti and Umir source rocks, and the Tablazo and Paja conventional reservoirs. As with the La Luna, both the Rosablanca and the Tablazo horizons have also been identified as “self‐sourced” or “hybrid” containing conventional and source rock intervals. The Salada, Simiti, Rosablanca and Tablazo will likely be drilled with the La Luna, creating a much larger stacked target. The stacked targets dictate a vertical well development plan.
• The Rosablanca formation underlies the Tablazo formation and is a calcareous unit consisting of grainstones and wakestones interbedded with mudstones deposited in a shallow marine shelf environment. Organic richness varies widely due to variations in a depositional environment and maturity. TOC values range from 1.0% to 2.4%, indicating excellent original organic richness. In the north of the basin, including Bolivar, the unit is in the oil generation window but some wells are located in the gas generation window as the unit becomes increasingly mature the further south in the basin.
• The Simiti unit consists of carbonaceous, black shales deposited on an outer marine shelf. The TOC content of the Simiti formation varies between 0.55% and 12.0% with an average TOC of 2.6% indicating a good level of organic content. Present‐day generation potential of this unit is fair‐to‐poor due to its thermal maturity, which is near the end of oil generation in the southwest portion of the basin and the beginning of oil generation in the northern portion of the basin in the Bolivar area. The Simiti is producing light oil from un‐stimulated perforations approximately 5 miles from Bolivar.
• The Umir unit consists of gray mudstones with thin siltstone interbeds, fine‐grained sandstones and thin siltstones deposited in inner marine shelf and coastal plain environments. TOC content ranges from 0.67% to 6.72%. Maturity data indicates the beginning of oil generation to the south and southeast portion of the basin.
• The Paja unit consists of shallow‐marine, calcareous mudstones and shales with limestone interbeds and abundant carbonate concretions. The average TOC content varies between 2% and 3% indicating good organic richness. In the central part of the basin maturity data indicates that the unit reaches the end of oil generation, while organic richness increases to the east and the south of the basin.
• The Tablazo unit consists of calcareous, fine‐grained fossiliferous sandstones, limestones and interbedded black mudstones deposited in an inner marine shelf. TOC content varies between 0.48% and 4.7% with average values between 2.0% and 3.5%. Good to excellent organic richness exists in most of the basin for the Tablazo unit with the exception of the northeastern portion where regular to poor organic richness values have been seen. As mentioned above, the Tablazo is also believed to be a “self‐sourced” reservoir.
RALPH E. DAVIS ASSOCIATES, INC. Texas Registered Engineering Firm F‐1529 Page | 25
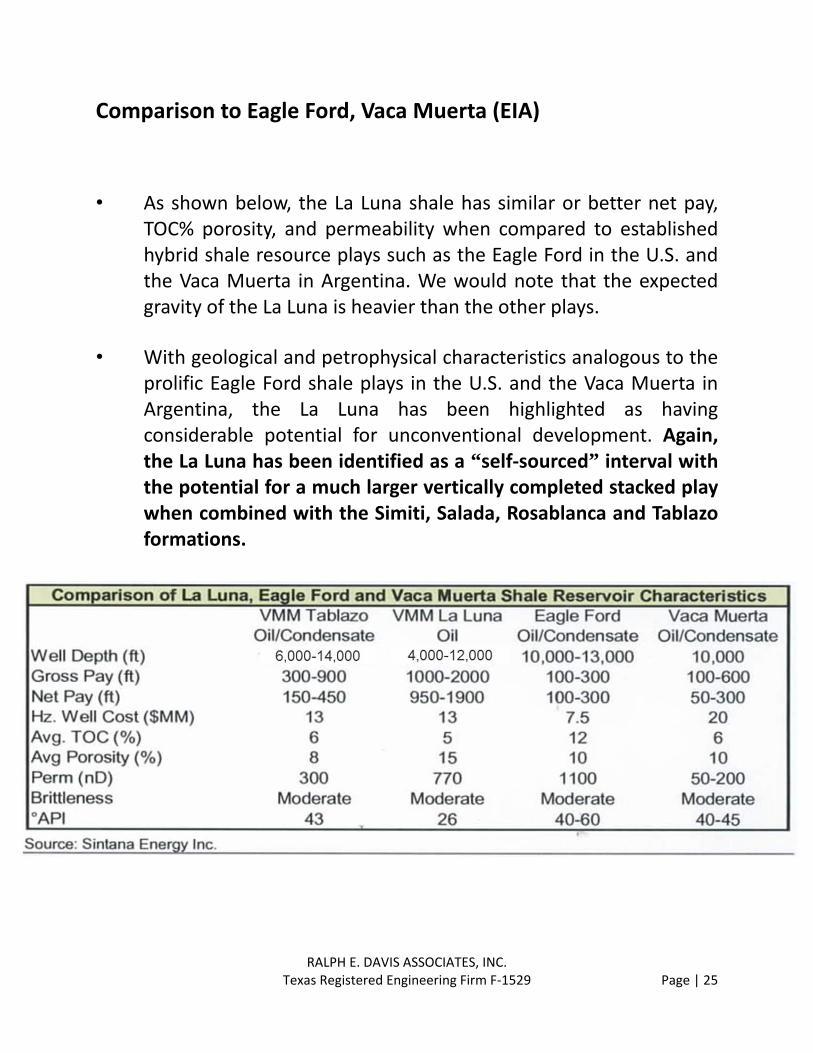
Comparison to Eagle Ford, Vaca Muerta (EIA)
• As shown below, the La Luna shale has similar or better net pay, TOC% porosity, and permeability when compared to established hybrid shale resource plays such as the Eagle Ford in the U.S. and the Vaca Muerta in Argentina. We would note that the expected gravity of the La Luna is heavier than the other plays.
• With geological and petrophysical characteristics analogous to the prolific Eagle Ford shale plays in the U.S. and the Vaca Muerta in Argentina, the La Luna has been highlighted as having considerable potential for unconventional development. Again, the La Luna has been identified as a “self‐sourced” interval with the potential for a much larger vertically completed stacked play when combined with the Simiti, Salada, Rosablanca and Tablazo formations.

RALPH E. DAVIS ASSOCIATES, INC. Texas Registered Engineering Firm F‐1529 Page | 26
Shale Potential Validation Criteria (EIA) The La Luna shale play in Colombia satisfies all the five requirements mentioned below of a potential world‐class resource play. 1. A large amount of original oil or gas in place with which to work;
2. A wide geographical distribution that will suggest/support a minimum level
of materiality for the play;
3. A brittle source or reservoir rock that is silica‐ or carbonate‐rich that can be effectively fractured (and therefore result in high rates of deliverability);
4. A structurally simple play at the right vertical depth (a structurally simple play reduces geological risk while being at a “proper” depth increases the chance that the reservoir is neither immature nor over‐mature); and
5. Extraneous factors (pricing, infrastructure, water, policy) conducive to large scale, “manufacturing type” development programs.
Resulting Middle Magdalena Resource Assessment (EIA)
The risked, technically recoverable shale gas and shale oil resources in the combined Cretaceous La Luna and Tablazo shales of the Middle Magdalena Valley Basin are estimated to be 18 Tcf and 4.6 billion barrels, out of risked shale gas and shale oil in‐place of 135 Tcf and 79 billion barrels. By comparison Ecopetrol has estimated the MMV Basin has 29 Tcf of shale gas potential (methodology not disclosed, nor was oil potential noted).

RALPH E. DAVIS ASSOCIATES, INC. Texas Registered Engineering Firm F‐1529 Page | 27
Bolivar Block Overview

RALPH E. DAVIS ASSOCIATES, INC. Texas Registered Engineering Firm F‐1529 Page | 28
Introduction
Located in the Middle Magdalena Basin of Colombia ─ ca. 800 km north of Bogota
Adjacent to the Magdalena River
GED was awarded the Bolivar Block Association Contract in 1996 ─ 20,321 gross acres ─ Three successful wells drilled to date (Olivo‐1, Catalina‐1, Olivo‐2) ─ Originally licenced for the exploitation of the Catalina Field (fractured limestone), discovered by Esso in 1953
Independent consultants, Ralph E. Davis Associates, Inc. (“RED”) have assessed the reserve potential of five intervals on the block: ─ Middle La Luna Shale ─ Rosa Blanca Limestone ─ Salada Limestone ─ Simiti Shale ─ Tablazo Shale
GED has prepared an indicative development plan for the acreage in conjunction with RED
Bolivar Block Location

RALPH E. DAVIS ASSOCIATES, INC. Texas Registered Engineering Firm F‐1529 Page | 29
Activity by other companies and geologic conditions lead Global to believe they control the premier acreage in the Middle Magdalena Oil Shale play

RALPH E. DAVIS ASSOCIATES, INC. Texas Registered Engineering Firm F‐1529 Page | 30

RALPH E. DAVIS ASSOCIATES, INC. Texas Registered Engineering Firm F‐1529 Page | 31
Bolivar Geology & Historic Wells

RALPH E. DAVIS ASSOCIATES, INC. Texas Registered Engineering Firm F‐1529 Page | 32
Regional Geological Overview and Information Developed by
the U.S. Energy Information Agency (EIA)
Middle Magdalena Basin
─ Narrow structural depression located between central and eastern Cordilleras ─ Similar stratigraphy to the Llanos foreland basin, but with thick Cretaceous
Carbonate section ─ Areas of intense tectonic deformation: Three regional fracture sets occur in Middle
Magdalena Basin Cretaceous rocks: longitudinal, transverse & conjugate (Linares et al, 2001). Result of two Tertiary compressional events during uplift of the Eastern Cordillera
─ Well documented, world‐class source rock potential in La Luna Formation ─ Flat to gently rolling topography which is drained longitudinally by the navigable Rio
Magdalena

RALPH E. DAVIS ASSOCIATES, INC. Texas Registered Engineering Firm F‐1529 Page | 33
General Stratigraphic Section – Bolivar Block

RALPH E. DAVIS ASSOCIATES, INC. Texas Registered Engineering Firm F‐1529 Page | 34
BOLIVAR AREA FIELD PROJECT GEOLOGICAL SUMMARY The following summary was provided by Global and was reviewed by RED and is included as a part of this report.
The Catalina Field is located within Global’s Bolivar Block in the center part of the Magdalena River
Valley approximately 800 kms north of Bogotá, the capital of Colombia. The oil accumulation was
discovered by ESSO (now Exxon) in 1953 and their field, originally named the Buturama Field, represents
some of the first commercial oil production from fractured Cretaceous limestone in Colombia. ESSO
drilled six vertical wells in the Buturama Field, a fault bounded anticlinal closure. It is clear that
fracturing in this structure, as in others of a similar nature, is related to faulting. Four of the wells in
Buturama Field were producers. A total over 520,000 barrels of oil was produced before field
abandonment by ESSO in 1965. One well, the Buturama #2 produced about 450,000 barrels of that field
wide total. Another well, the Buturama #6 produced about 75,000 barrels of oil and the remaining small
amount of oil attributed to Buturama # 1 and #3 wells. The Buturama # 2 well remained unplugged and
Harken International, the predecessor of Global Energy learned that Ecopetrol, the Colombian national
oil company had in the late 1980’s conducted down hole pressure testing in this well and determined
that bottom hole pressure had returned to what had been reported as original reservoir pressure. This
situation could only take place if the Cretaceous reservoir rocks were recharged with new oil or water.
Global believed the situation suggested that the re‐pressuring was more likely the result of recharge of
the reservoir with more new oil rather than infiltration of water. Subsequently Harken International
acquired the Bolivar Contract Block and drilled two horizontal wells in this field, each within a different
Cretaceous formation and with good initial success. The field was renamed the Catalina Field, after the
first horizontal well, the Catalina #1. An additional unsuccessful horizontal well was drilled by Harken
International on a related (and on‐trend) structure, which emphasized the critical role faults play in
these types of structures, and the need for more precise fault definition. The planned work program in
the Bolivar Block will consist of a seismic survey and the drilling of three development wells. Global
proposes to better image this field area, paying particular attention to obtaining a higher resolution of
fault patterns within the Catalina field and to image, if possible, fracture concentrations and orientation
seismically. To accomplish these goals a high definition 3‐D seismic survey with be shot across the field
area. Drill sites for the additional three horizontal (or high angle deviated) development wells will be
selected from this interpreted survey and will be drilled as part of this program.
Geologically, Bolivar is located in the narrowing northern end of the Middle Magdalena Structural Basin,
which is bounded on the west by the Central Cordillera and on the east by the Santander Massif portion
of the northern section of the Eastern Cordillera. This is also an area located between where two major
strike‐slip faults that are on trend and verging toward one another. The Palestina Fault, a right‐lateral
strike slip fault is located on the west side in the Central Cordillera, and the Bucaramanga Fault, a left‐
lateral strike‐slip fault, is located on the east side of the Middle Magdalena Basin and within the western
margin of the Santander Massif. Clearly, the additional tectonic forces, from lateral movement, on these
large faults exert additional stresses on rocks within this portion of the basin, as evidenced by the series
of NE‐SW oriented faults, fractures, and lineaments that transect this area. These features can be traced
to the southwest into the igneous and metamorphic terrain of the Central Cordillera and are easily
observed in this region on Landsat images.

RALPH E. DAVIS ASSOCIATES, INC. Texas Registered Engineering Firm F‐1529 Page | 35
BOLIVAR
TORCAZ

RALPH E. DAVIS ASSOCIATES, INC. Texas Registered Engineering Firm F‐1529 Page | 36
This same structural grain is carried into the subsurface and can be easily identified on regional seismic
lines. The seismic record indicates that most of these faults with this orientation are high angle and did
not cut the major unconformity at the base of the Miocene age Real Formation. It is faults of this
orientation that are also associated with the fractured Cretaceous Limestone oil production in the
northern part of the Middle Magdalena Basin, of which the Buturama Field is a prominent example.
Profound structural events impacted this region, and each provided the opportunity to fracture brittle
carbonate rocks and calcareous shales in different ways. The structural events began with rifting and the
development of normal faults in the late Cretaceous. This was followed by several episodes of
compression in the Tertiary which resulted in folding and thrusting with reverse fault development some
of which by the reactivation of earlier normal faults, and some wrenching which may have resulted in
strike‐slip movement along some of these fault planes. There may have also been later and separate
bouts of wrenching. Some of this tectonic activity is still ongoing. A series of horsts and graben and
related more complex fault structures were developed intermittently along these NE‐SW oriented fault
trends in the northern part of the Middle Magdalena Basin. Global has referred to as them as fault
bounded fairways and the Buturama/Catalina Field is clearly evident on the following Cretaceous age
Rosa Blanca Formation Structure Map on the most prominent and structurally complex one of these
structural ridges (designated “Fairway III”).
The Middle Magdalena is a Tertiary depositional basin formed by a major Andean Orogeny in the late
Miocene time from a portion of a much larger Cretaceous geosyncline. A maximum of over 40,000 feet
of sediments (both Cretaceous and Tertiary) has been deposited in this basin. The basin is asymmetric,
Original Contract Boundary

RALPH E. DAVIS ASSOCIATES, INC. Texas Registered Engineering Firm F‐1529 Page | 37
and it deepens gently to the southeast where it disappears beneath thrust faults at the edge of the
Central Cordillera. Northward, the stratigraphic section thins and the easterly sloping eastern margin
adjacent to the Santander Massif has been uplifted and eroded, quite deeply in some places. There is a
very pronounced angular unconformity, in the northern portion of the Middle Magdalena Basin, at the
base of the Eocene that can be very clearly seen on regional seismic lines. Here, Cretaceous rocks may
subcrop below the unconformity and such a situation exists only about 4 kms north and west of the
Buturama Field as seem on Seismic Line 77‐01
which runs parallel to the structural axis of fault bounded “Fairway III” from the Buturama Field moving
up‐dip to the undeveloped Crisol Gas Field, a complexly faulted and partly eroded anticlinal feature that
is probably genetically related to the Buturama Structure. The two features may in fact still be in fluid
communications and there is some pressure data that supports that contention. If that is correct, then
the Crisol Structure may actually represent the gas cap on the Buturama Field. An oil‐water contact has
not yet been found for the Buturama Field.

RALPH E. DAVIS ASSOCIATES, INC. Texas Registered Engineering Firm F‐1529 Page | 38
It is the carbonate rocks of the lower half of the Cretaceous, almost exclusively, that are of interest to oil
explorationists in the northern part of the Middle Magdalena Basin. The figure on page 39 illustrates the
typical stratigraphic section in that part of the basin.
Current Contract Boundary

RALPH E. DAVIS ASSOCIATES, INC. Texas Registered Engineering Firm F‐1529 Page | 39
Reservoir Description
Five key formations as potential hydrocarbon bearing intervals (all Cretaceous) from earliest to most recent:
Middle La Luna Shale
o Shale located within the larger La Luna Formation
o Exhibits high TOC content (up to 10%)
o Finely bedded black calcareous shale sequences with limestone intercalations
o Estimated that almost all production in northern South America originates from La Luna Formation sources
Salada Fractured Limestone
o ca. 300 ft thick comprising argillaceous, very fine grained and finely laminated limestones
o Deposition occurred by direct settling of sediment from suspension, most likely in moderately deep water with
restricted circulation. Olivo 1 produced at a rate of 5000 bopd from the Salada
Simiti Shale
o Offset well Pimiento 2 producing 32 degree light oil from limited perforations in the Simiti
Tablazo Shale
o GED and other operators in the area have identified the Tablazo as a high potential interval for shale oil
production
o Buturama‐2 tested up to 250 bopd from Tablazo during drilling
o Catalina 1 produced light oil from the Tablazo at 400 bopd during drilling
Rosa Blanca Fractured Limestone
o Basal formation deposited in low energy conditions in moderate water depth
o Formation exhibits little to no matrix porosity, averaging 5% or less
o Catalina 1 produced the Rosa Blanca at an initial rate of 7000 bopd

RALPH E. DAVIS ASSOCIATES, INC. Texas Registered Engineering Firm F‐1529 Page | 40
General Stratigraphic Section – Bolivar Block

RALPH E. DAVIS ASSOCIATES, INC. Texas Registered Engineering Firm F‐1529 Page | 41
The reservoir targets here are the limestone units of the La Luna Formation, in particular the Salada
Limestone Member, and the Cretaceous Basal Limestone consisting of the upper Tablazo Formation and
the limestone beds of the underlying Rosa Blanca Formation. The Salada Limestone is almost 300 feet
thick and it is contained within thick sequences of dark colored, organic rich shale of the La Luna
Formation above and the Simiti Formation below. This limestone is argillaceous, very fine grained and
finely laminated. Little or no matrix porosity has been preserved in these rocks. It is believed to have
been deposited in moderately deep water with restricted circulation. In the Basal Limestone it is the
Rosa Blanca that is of primary interest The Rosa Blanca, up to 500 feet thick, but with only about 200
feet of interest, is a limestone deposited in shallower, more open marine waters that those of the
Salada. The rock type consists of poorly bedded bioclastic limestone. It too, has little or no matrix
porosity, usually 5% or less.
Harken International drilled two horizontal wells within the old Buturama Field. Absent any other
analytical data it was thought that the best fracture porosity, in these otherwise tight limestone units,
would likely have been developed adjacent to faults and that perhaps those with the larger
displacement (horizontal as well as vertical) would be the most suitable positions in which to drill.
Further, a well spud position as high up on the structure and as close to the best producing well
(Buturama # 2) was selected for both wells. The first well, the Catalina #1 was completed in the Rosa
Blanca as a 1200 foot lateral horizontal well along the fault trace. The test potential tested for over 7000
barrels of 38°gravity oil per day, and to date has produced in excess of 600,000 barrels of oil. The second
horizontal well, the Olivo #1, with a northward path parallel to the western bounding fault, was
completed in the Salada Limestone Member of the La Luna Formation. This well potential tested for
10,800 barrels of 15° gravity of oil per day and to date has also produced over 600,000 barrels of oil. The
oil produced from each zone is rather gassy. The solution GOR for the Rosa Blanca is around 750 Cubic
feet per barrel. For the lower gravity Salada oil, the solution GOR is 60, but the producing GOR runs
between 50,000 and 100,000 cubic feet per barrel. Complete suites of modern electrical logs were run in
both the wells including FMI fracture finding logs. Cores were also cut. So these two new wells supplied
an abundance of data never before available for review. Large numbers of small aperture fractures
trending NE‐SW and oriented at very high angle or vertical were encountered. Many were calcite
cemented, totally or partially, but quite a few were found to be open. Some fractures also exhibited oil
staining. Larger portions of the cores were missing, suggesting that other fractures or very close set
fracture zones with greater apertures may also be present in the subsurface.
Source rock for this accumulation is believed to also be from Cretaceous age rocks. Of primary
importance are the high TOC content (up to 10% organic carbon) shales of the La Luna Formation. This
source rock formation (and its age equivalents) is believed to be responsible for sourcing most of the oil
deposits in northern South America. The dark organic rich shales of both the Simiti Formation and the
Rosa Blanca Formation are also thought to have been a local source for hydrocarbons in this area.
The structure of the Buturama/Catalina field is a horst block “pop‐up” feature of the type sometimes
referred to as a flower structure. This geometry is perfectly displayed on Seismic Line BCP 77‐06 that
crossed this fault‐bounded fairway perpendicular to its axis, and the seismic line crosses the flower

RALPH E. DAVIS ASSOCIATES, INC. Texas Registered Engineering Firm F‐1529 Page | 42
structure just south of the termination of the Catalina # 1 lateral. From this seismic line, it is clear that
both the Catalina and Olivo wells were drilled on the structurally simpler side of this feature.
Fortunately, the selection criteria employed for well placement in highly fractured areas was successful
in these two cases. It is also clear that the faulting is of greater complexity on the east side of the
structure, but that the details are not so well resolved here, and drilling on this side would appear to be
a higher risk. To resolve this issue, a high resolution 3‐D seismic
survey will be shot by Global over the field to completely resolve these structural issues. Clearly a
velocity survey will be required to assure proper depth conversion for mapping purposes. It is believed
that a 3‐D seismic survey may actually allow the areas of heavy fracturing, and perhaps even the
orientation of these fractures to be identified and mapped by seismic attribute differences between
fractured and non (or less) fractured carbonate rocks. The gassy nature of the produced oil from both
formations may assist in this recognition. It is envisioned that gas evolving from oil contained in the
fractures (which is essentially the only storage capacity of these rocks) will be released in sufficient
volume to produce a “gas effect” over fractured zones that can also be recognized seismically. Three
locations for horizontal wells will be selected from the interpretation of the planned 3‐D seismic survey
in areas that are believed to be structurally “safe” and in highly fractured zones.

RALPH E. DAVIS ASSOCIATES, INC. Texas Registered Engineering Firm F‐1529 Page | 43
Reservoir Properties
Bolivar Block Reservoir PropertiesLa Luna Salada Simiti Tablazo Rosa Blanca
Interval Thickness (ft) 757 – 1,560 221 – 381 900 163 – 308 112 – 540
Total Porosity (%) 9.4 – 14.3 4.9 – 8.1 10.7 5.2 – 14.0 1.6 – 9.3
Fracture Porosity (%) 0.1 – 1.5 0.3 – 1.2 0.9 0.1 – 0.8 0.0 – 0.8
Matrix Porosity (%) 7.9 – 13.4 4.6 – 7.0 9.8 5.1 – 13.2 1.6 – 9.1
System Water Saturation (%) 29.7 – 42.2 23.4 – 34.7 40.0 33.0 – 39.3 18.1 – 40.9
Fracture Water Saturation (%) - 0 – 26.7 - - -
Net Pay (ft) 78 – 238 50 – 169 450 30 – 77 65 – 105
Partitioning Coefficient (%) 0.0 – 16.0 2.6 – 16.1 8.4 0.0 – 9.3 1.2 – 30.9
Intervals have been cored and tested by a number of wells including: ─ Catalina‐1 ─ Olivo‐2 ─ Laurel‐1
Figures contained in the table reflect range of values extracted from these wells

RALPH E. DAVIS ASSOCIATES, INC. Texas Registered Engineering Firm F‐1529 Page | 44
Middle La Luna Shale Comparison

RALPH E. DAVIS ASSOCIATES, INC. Texas Registered Engineering Firm F‐1529 Page | 45
Thickness
The Tablazo and La Luna at Bolivar have approximately the same thickness as the Exxon/Canacol
Mono Araña well based upon regional isopach maps

RALPH E. DAVIS ASSOCIATES, INC. Texas Registered Engineering Firm F‐1529 Page | 46
Buturama Field Drilling Results
Esso discovered the Buturama Field in what is now the Bolivar Block are in 1953 Drill Stem Test Report from 19 November 1953 shows pressures encountered in the La Luna Formation These tests show that the La Luna is over‐pressured
─ Gradient of 0.51 psi/ft Drilling mud density plot for the wells on the Buturama Field also indicate pressures used in the La Luna
exceeding those used in the Buturama Field ─ Hence indicating even higher levels of overpressure in the La Luna
Refractive index data gathered from the Middle La Luna and Salada in the Buturama‐3 well show ca. 23‐degree API oil in the Middle La Luna
Lighter oils per the geochemistry show up after the light oil zone pore space is fractured open

RALPH E. DAVIS ASSOCIATES, INC. Texas Registered Engineering Firm F‐1529 Page | 47
Catalina‐1 Geochemical Analysis
4,000’ to 5,500’ features normalized oil content of over 100 mg per gram of TOC indicating productive oil section
Best productive zones are:
─ 3790’‐4520’ (Middle La Luna Shale) ─ 4810’‐5533’ (Simiti Shale)
Higher Production Indices (PI) in zones of high normalized oil
content suggests lighter crude oils Samples such as 4671’ show a high concentration of light
hydrocarbons The tight Middle La Luna Shale in this section appears to not
have expelled hydrocarbons with the light hydrocarbons being trapped
or adsorbed in the poor space of the rock Intervals with the highest normalized oil content appear to
contain the highest quality oil Intervals with low TOC values appear to contain the most
productive zones due to better reservoir properties of porosity and low adsorptive capacity

RALPH E. DAVIS ASSOCIATES, INC. Texas Registered Engineering Firm F‐1529 Page | 48

RALPH E. DAVIS ASSOCIATES, INC. Texas Registered Engineering Firm F‐1529 Page | 49

RALPH E. DAVIS ASSOCIATES, INC. Texas Registered Engineering Firm F‐1529 Page | 50
Thermal Maturities Bolivar La Luna is in the mid stage of oil generation Solution gas for La Luna is above 100 and thus oil gravity should be in the medium range of 25° API The burial history of the Bolivar Block has the La Luna deeper and hotter than its current position thereby
accelerating oil generation beyond the early stage The structurally high position Bolivar occupies in the basin benefits from the migration of deeper, lighter oils
from down dip ─ Light oil in the Rosa Blanca and Tablazo that has been tested at Bolivar is likely sourced from the La
Luna down dip

RALPH E. DAVIS ASSOCIATES, INC. Texas Registered Engineering Firm F‐1529 Page | 51
Hydrocarbon Generation & Migration
Migration of hydrocarbons into the Bolivar Block is very likely to have occurred from the more mature
La Luna and Simiti/Rosa Blanca formations to the south Potential source rocks tend to pinch out or become immature out of the area to the east and west
due to uplift and erosion associated with the development of the Andes Therefore, migration from these areas would be less significant than the potential for migration of
hydrocarbons generated from the south Potential for migration from the north could not be determined based on the available data However, the presence of gas accumulations in the Crisol wells, are estimated to be relatively
immature, could indicate that the source rocks do become more mature to the north allowing for migration into the northern part of the Bolivar Block
The northern section of the block shows more evidence of gas accumulation than the remainder of the block
Geomath Bolivar Block Geochemistry Study

RALPH E. DAVIS ASSOCIATES, INC. Texas Registered Engineering Firm F‐1529 Page | 52
Historic Drilling & Seismic Coverage
Esso discovered the Buturama Field in what is now the Bolivar Block are in 1953
─ 6 vertical wells drilled, four of which produced oil ─ 520,000 bbls oil produced before relinquishment in 1965 ─ Tested +35° API oil from the Tablazo in Buturama‐2 at 250 bopd on DST
Static pressure test on Buturama‐3 well in 1988 indicated recharge to original level GED (then Harken International) acquired rights to the area in 1996 Four wells drilled by GED on block:
─ Catalina‐1 (1997) 1,200 ft horizontal between Rosa Blanca / Tablazo tested at 7,073 bbls/d 36° API crude and 11.5 mscfd in the
Rosa Blanca and 400 bopd of 34° oil from the Tablazo produced ca. 612,725 bbls ─ Olivo‐1 (1998)
6,000 ft horizontal well in Salada Limestone tested at 5,000 bbls/d 16º API crude still producing, cumulative over 705,000 bbls ─ Laurel‐1 (1999)
Drilled 5,400 ft horizontal section before losing the string Well logged but not tested
─ Olivo‐2 (2001) High angle well penetrated Salada Limestone Encountered low fracture density zone Well subsequently acidized although only produced 80 bopd
180 km 2D seismic and 5 km2 3D available on the block

RALPH E. DAVIS ASSOCIATES, INC. Texas Registered Engineering Firm F‐1529 Page | 53
Exxon/Canacol Mono Araña 1 Well
24 January 2013 Canacol Energy announced initial results from Mono Araña 1 well ─ ExxonMobil (70.1%) and Vetra E&P (9.9%, operator) ─ VMM‐2 block lies 12 km to the southeast of the Bolivar Block
Designed to test the oil potential of both the shallow conventional Tertiary Lisama sandstone reservoir and deeper shale and carbonate reservoirs within the La Luna and Tablazo oil source rocks
Two intervals within the tertiary Lisama sandstone were tested, which flowed at a combined average gross rate of 1,242 bopd during short term tests
Drilled to 9,942 ft MD within the La Luna Formation ─ 760 feet of La Luna were encountered ─ good oil and gas shows noted throughout ─ at 9,585 ft within the La Luna ca. 280 barrels of oil flowed into the mud pits ─ deeper prospective zones in the La Luna and Tablazo sections were not penetrated due to high pressure
encountered while drilling
Implications for the Bolivar Block The well is south of the Laurel‐1 well drilled by CEDCO The La Luna in the Catalina field area is approximately 1,000 feet thick. Canacol Exxon appeared to have set casing
through approximately 75% of the La Luna The depth of 9585 ft where the La Luna flowed 280 bbls of oil is approximately the position of the Middle La Luna in the
Olivo‐1 and Olivo‐2 wells

RALPH E. DAVIS ASSOCIATES, INC. Texas Registered Engineering Firm F‐1529 Page | 54
Development Concept

RALPH E. DAVIS ASSOCIATES, INC. Texas Registered Engineering Firm F‐1529 Page | 55
Multiple Stacked Light Oil Producing Zones in the Catalina Field of the Bolivar
Association Contract Suggests Vertical Development Plan
●Zones already tested for oil: Rosa Blanca, Tablazo and Simiti in the offset Pimiento 2 well ●Zone to be further tested in 2013: Simiti in the Catalina 1

RALPH E. DAVIS ASSOCIATES, INC. Texas Registered Engineering Firm F‐1529 Page | 56
Bolivar Shale Tests
Global plans to reenter the Catalina 1, Olivo 1 and/or the Olivo No. 2 wells and hydraulically
fracture the Middle La Luna Shale and/or Simiti Shale. The estimated cost is $4.0 million. There
has been established production from the Salada and the Rosa Blanca in the immediate area
from the Olivo No. 1 and the Catalina No. 1 as shown in the figure below.
Olivo 2
In 2001 Global drilled the Olivo 2 through the La Luna and the Salada formations as shown in the figure
above. The open hole section through these formations swab tested 80 Bopd with no hydraulic
fracturing or any other completion stimulation to enhance this rate. Global plans to run casing across
this open hole interval to perforate and hydraulically fracture the carbonate rich Middle La Luna
sections. The La Luna as well as the Salada and the Rosa Blanca have intense natural fracturing. The
combination of the naturally occurring fractures and the induced hydraulic fracturing should increase
the production rates substantially.

RALPH E. DAVIS ASSOCIATES, INC. Texas Registered Engineering Firm F‐1529 Page | 57
The Olivo 2 was selected for one of the initial shale oil hydraulic fracturing tests based upon the large
amount of carbonate present in the Middle La Luna section of the wellbore as shown in the following log
section. Generally, successful hydraulic fracturing will increase the natural flow rate by four to ten times
and in some cases even higher. The Olivo 2 completion therefore could possibly see an initial producing
rate of 320 to 800 Bopd.
In this report the productive Eagle Ford Shale in South Texas is used as an analogous formation.
Petrophysical data shows that the Middle La Luna and the Eagle Ford are comparable. The oil window
of the Eagle Ford is commercial because of the recent multi‐stage hydraulic fracturing techniques. Post
frac production rates range from 1000 to 2500 Bopd depending on lateral length and the number of frac
stages. The Eagle Ford however does not exhibit the natural fracturing seen in the La Luna. With the
combination of the naturally occurring and the multi‐stage fracturing the production rates for the
completions in the La Luna are expected to be comparable to those seen in the Eagle Ford.
The flow rates can also be affected by the oil gravity and viscosity. The La Luna will likely produce a 23
degree medium crude oil that would usually flow at lower rates than light oil but the naturally occurring
and induced fracturing will augment the flow. The analogous Eagle Ford produces low viscosity 35
degree oil but as previously mentioned there are fewer naturally occurring fractures.
Although the Olivo 2 is not a horizontal well, the results of the proposed test could significantly affect
the La Luna 3P Reserves and production rates included in this report.
The log section following is from the Olivo No. 2 and shows the middle La Luna section (400
feet) to be completed with up to a 4 stage frac.

RALPH E. DAVIS ASSOCIATES, INC. Texas Registered Engineering Firm F‐1529 Page | 58
(
)
Drilled in 2001; swab test of 80 bopd
4 Potential frac stages indicated by perf green markers
Heavy dolomitized (increases
brittleness which is favorable for
production rate stimulation using
hydraulic fracturing)
Olivo 2 is one of three potential re‐entry wells including Olivo 1 and
Catalina 1

RALPH E. DAVIS ASSOCIATES, INC. Texas Registered Engineering Firm F‐1529 Page | 59
Tablazo is one of five (5) productive formations found on or adjacent to Bolivar
During Drilling of Catalina 1 in 1998

RALPH E. DAVIS ASSOCIATES, INC. Texas Registered Engineering Firm F‐1529 Page | 60
Notes: 1. Graphic Source; “Testing Curvature’s Impact on Fractures”, AAPG Explorer, July 2013, Pg. 42
2. Bolivar Compression: +45º
Conclusion: Bolivar has significant Fracture Intensity and Fracture Permeability
Bolivar Curvature from derivative of dip
maps

RALPH E. DAVIS ASSOCIATES, INC. Texas Registered Engineering Firm F‐1529 Page | 61
Well Design Selection Criteria Guided By Significant Natural Fracturing
High Frequency and Large Aperture Fractures in Bolivar

RALPH E. DAVIS ASSOCIATES, INC. Texas Registered Engineering Firm F‐1529 Page | 62
BOLIVAR FRACTURE FREQUENCY ANALYSIS
Formation Thickness (Ft.)
Open Fractures
Fractures Per Foot
FracturesPer Meter
La Luna (includes Salada)*1 949 320 .34 1.11
Simiti *1 870 196 .23 .74
Tablazo *2 140 8 .057 .19
Rosa Blanca *2 217 21 .097 .32
Source *1: “Fracture Analysis from Formation Image Data in Simiti and La Luna shales in Catalina 1” Source *2: “FMI Analysis, Catalina 1 and Laurel 1”, August 4, 1998
Fracture Frequency Analysis Used to Calculate Fracture Permeability

RALPH E. DAVIS ASSOCIATES, INC. Texas Registered Engineering Firm F‐1529 Page | 63
Bolivar’s High Natural Fracture Permeability Requires Vertical
Well Development
Catalina vs. Eagle Ford Natural Fracture Permeability (Undamaged) to Oil
Viscosity Ratio
In his text, Geologic Aspects of Naturally Fractured Reservoirs, Aguillera showed that fracture permeability was closely tied to fracture width, stating that kf=8.35x10^6xwo^2darcys where fracture width wo is measured in centimeters. He concluded: “Consequently, the intrinsic permeability attached to single point properties of a fracture 0.01 in. thick would be 5,400 darcys or 5,400,000 md. These extremely high values of permeability clearly indicate the importance of fractures on production of tight reservoirs which otherwise would be noncommercial, even in the presence of high hydrocarbon saturations.” GED feels that the more conservative approach to fracture permeability given by Crain still demonstrates that very high overall effective permeabilities should be anticipated on the Bolivar Block.
Interval Gravity Aperture Freq. Phifrac Kfrac hnet Rate** Reservoir K/u
Ft API Wf mm Df % mD ft BOPD*** Viscosity Ratio
La Luna (inc. Salada) Catalina 1 3581-4530 23 0.3 1.11 0.03330% 2497 232 15,643 17.854 140
Simiti Catalina 1 5300-5674 30 0.3 0.74 0.02220% 1664 187 26,123 1.493 1115
Tablazo Catalina 1 5674-5892 32 0.3 0.19 0.00570% 427 30 7,809 0.906 472
Rosablanca Catalina 1 5892-6392 38 0.3 0.32 0.00960% 720 105 75,011 0.541 1330
Total 554 124,586
Eagleford Normalized 8000-8075 34 0.25 0.1 0.00250% 130 75 14,260 0.561 232
Quantitative prediction of porosity and permeability of fractures* relies on the fracture aperture,
measured in millimeters, from resistivity micro-scanner or observation of cores or core images:
1: PHIfrac = 0.001 * Wf * Df * KF1 Where: KF1 = number of main fracture directions
2: Kfrac = 833 * 10^11 * PHIfrac^3 / (Df^2 * KF1^2) = 1 for sub-horizontal or sub-vertical
*3: Kfrac = 833 * 10^5 * PHIfrac * Wf^2 = 2 for orthogonal sub-vertical
4: Kfrac = 833 * 10^2 * Wf^3 * Df * KF1 = 3 for chaotic or brecciated
PHIfrac = fracture porosity (fractional)
Df = fracture frequency (fractures per meter)
Wf = fracture aperture (millimeters)
Kfrac = fracture permeability (millidarcies)
Completion Profile1. Vertical or near vertical completion profile dictated by available engineering analysis.2. All five Catalina zones (La Luna, Simiti and Tablazo) can be produced simultaneously.3. Initial production rates combined total 124,586 bopd (undamaged flow rates).
* Reference: Crain's Petrophysical Handbook** Theoretical Rate Calculated from Darcy flow equation using reservoir parameters from Catalina Field and Eagleford literature
Catalina reservoir pressure calculated using 0.48psi/ft, 30% Drawdown (by zone), GOR per RED, temp gradient=0.0264degF/ft, 80 acres.
Eagleford reservoir pressure of 4400 psi, 30% Drawdown (Pwf=3065psi), GOR=800, temp=175 F, 80 acres.*** Rates are for "undamaged" formation rock properties prior to Hydraulic Fracturing
WellZone
Catalina vs. Eagleford Natural Fracture Permeability (Undamaged) to Oil Viscosity Ratio

RALPH E. DAVIS ASSOCIATES, INC. Texas Registered Engineering Firm F‐1529 Page | 64
WELL DESIGN FOR VERTICAL VS. HORIZONTAL FRACTURED OIL WELLS
Key Conclusions: 1. For horizontal wells with transverse hydraulic fractures, there is a choking effect as a result of the large contrast between the propped fracture flow area and the area of contact between the hydraulic fracture and the wellbore. This results in a loss of productivity that will increase with reservoir permeability.
2. For horizontal wells in oil formations, transverse hydraulic fractures are very attractive for low permeability formations and for higher permeability formations to approximately 10 md. Above this permeability, vertical fractured wells or horizontal wells with longitudinal hydraulic fractures should be considered.
Source: CSU/SPE Paper #137328

RALPH E. DAVIS ASSOCIATES, INC. Texas Registered Engineering Firm F‐1529 Page | 65
Conventional Low Porosity Sandstone intervals of the Simiti Shale Representing Pay and Stimulation Objectives identified by Schlumberger
Extensive Fracture Intersections and Drilling Fluid Damage Remediation

RALPH E. DAVIS ASSOCIATES, INC. Texas Registered Engineering Firm F‐1529 Page | 66
Vertical Completion Profile Possible At Bolivar Due to Intense
Natural Fracturing

RALPH E. DAVIS ASSOCIATES, INC. Texas Registered Engineering Firm F‐1529 Page | 67
Reserves & Resources
Bolivar Development Plan – August 2013, prepared by Ralph E. Davis Associates, Inc. (“RED”) ─ Recoverable 2P reserves for Rosa Blanca and Salada Fractured Limestone formations ─ Recoverable 3P reserves for Middle La Luna Shale and the Rosa Blanca and Salada Fractured
Limestone formations Development plan based on 6 rig drilling program with total of 252 new vertical wells Wells produce till mid‐2024 when contract term expires Possible Middle La Luna Shale reserves and production rates will be revised after the hydraulic fracturing
test of the Olivo‐1 well. Additional revisions of reserve classifications are expected. Ecopetrol expected to back in for 50% after Global has recovered 200% capex payout 337 mmbo or 88% of the 381 mmbo technically recoverable oil can be produced prior to contract
termination

RALPH E. DAVIS ASSOCIATES, INC. Texas Registered Engineering Firm F‐1529 Page | 68
Projected Production & Cost Profiles
Gross production and cost profiles presented pre‐royalty and pre potential back‐in of Ecopetrol Profiles presented include production and costs for all undeveloped Rosa Blanca and Salada Limestone well
locations and all Middle La Luna, Simiti and Tablazo Shale locations No learning curve effects modelled e.g.:
─ Reduction in drilling and completions time and costs ─ Improved well performance as frac methodology is perfected
Profiles exclude abandonment, as it is assumed that Ecopetrol will take over the area at the expiration of the Concession, thus removing the requirement for GED to abandon the wells on site
Total of $42.7 million spent on the Bolivar Block to date

RALPH E. DAVIS ASSOCIATES, INC. Texas Registered Engineering Firm F‐1529 Page | 69

RALPH E. DAVIS ASSOCIATES, INC. Texas Registered Engineering Firm F‐1529 Page | 70
La Luna, Tablazo and Simiti Shales Type Curves All completions in the three shale productive zones have been modeled using the “shape of curve” that is generally used for the oil window completions in the Eagle Ford Shale in the United States. Comparison of formation parameters in each of the three shales exceed those parameters found in the Eagle Ford. Since adequate production data is not currently available for the Colombia shales, RED feels that use of this “shape of curve” is the most reasonable method of forecasting production without such data. The following illustrates the “shape of curve” used for all three reservoirs.

RALPH E. DAVIS ASSOCIATES, INC. Texas Registered Engineering Firm F‐1529 Page | 71
Curves for each of the individual productive zones are available but have been summarized in the table
below. Except for the Initial Production value and resulting ultimate recoverable volume, all of the Shale
curves are identical to the shape curve above.
Summary of initial rates and technically recoverable EURs by zone used to create type curve. IP (BOPD) EUR (MBO) M.LA LUNA 1,180 503.7 SALADA 335 418.4 SIMITI 790 413.8
TABLAZO 390 204.3 ROSA BLANCA 650 802.8
Total 3,345 2343.0 Optimum locations will be productive from all five intervals, and as is documented elsewhere in the plan, will be produced from two strings. The deeper, lighter gravity crudes of the Simiti, Tablazo and Rosablanca will produce from on string, while the heavier crudes of the Middle La Luna/Salada will produce from a second string. Curves for each string in this configuration are presented below.
LONG STRING
SIMITI‐TABLAZO‐ROSABLANCA
Initial rates from this string will be 1,830 BOPD with technically recoverable reserves of 1.42 MMBO.

RALPH E. DAVIS ASSOCIATES, INC. Texas Registered Engineering Firm F‐1529 Page | 72
SHORT STRING MIDDLE LA LUNA‐SALADA
Initial rates from this string will be 1,515 BOPD with technically recoverable reserves of 922 MBO.

RALPH E. DAVIS ASSOCIATES, INC. Texas Registered Engineering Firm F‐1529 Page | 73
BOLIVAR DEVELOPMENT PLAN FACILITIES, OIL MARKETING TRANSPORT AND
MANPOWER
Facilities The current surface facility in the Bolivar area has a storage capacity of approximately 30,000 barrels. The treatment capacity is between 16,000 to 20,000 BFPD, depending on the condition of the fluids to be processed.
Oil Marketing Transport
In order to market the crude, several alternatives have been evaluated.
Pipeline: The Bolivar area possesses a 12 inch pipeline from the facility to the main Barranca‐Ayacucho (BA) pipeline. This pipeline has not been connected to the BA. Currently, the BA does not have the capacity to allow more oil to be transported. However, it is expected that with the new Bicentenario pipeline project that is under construction, new oil transport capacity will be available during 2015 or 2016.
Trucks: Currently Colombia has the capacity of moving Bolivar oil by truck. The nearest pumping station is located at Ayacucho which is only 30kms from Bolivar. This is the likely destination for trucking produced Bolivar oil to market.
Barges: The third oil transportation option is to use barges in order to transport oil on the Magdalena River from Gamarra port which is 15 kms from Bolivar. Oil would therefore be trucked to Gamarra and then barged to the Caribbean port of Barranquilla for export. Currently, a large Colombian construction company is improving and dredging the Magdalena River to enable barge transport to operate easily from Gamarra to Barranquilla. The improvement project should be completed by late 2015.

RALPH E. DAVIS ASSOCIATES, INC. Texas Registered Engineering Firm F‐1529 Page | 74
Manpower The Bolivar Development Plan will require an entire team of professionals to be hired and used in field operations. The following types of professionals are recommended:
Drilling Manager o Drilling Engineers o Completion engineers o Cost controller o Field drilling superintendent
Drill site managers Drilling technical assistant
o Field completion superintendent Completion specialists Operations technical assistant
Construction Manager o Facility engineers o Field construction superintendent
Mechanical specialists Electrical specialists
Operations Manager o Field operations superintendent o Field Senior production Engineer o Field production coordinator o Field production engineers o Field production operators
Engineering Manager o Reservoir Engineers o Development geologists
HR Manager o Recruitment specialist o Field administrator
Materials Manager o Field warehouse supervisors
Materials technical assistant
Security Manager o Field security supervisors
HES & Communities Relationship Manager o Safety specialist o Environmental specialist o Social & Communities specialist o Field safety specialists o Field social coordinators

RALPH E. DAVIS ASSOCIATES, INC. Texas Registered Engineering Firm F‐1529 Page | 75
Current Operations
Olivo‐1 well currently producing at low rates of 40‐60 bopd Crude oil products from the Bolivar contract are trucked 30 km from well head gathering stations to the
Ayacucho Pump Station Current crude blend from the Bolivar Block is 14° API
─ Blended at Palo Blanco facilities before transportation via the Palo Blanco‐Santiago pipeline
Note: Bolivar Field development production will be barged to north coast markets

RALPH E. DAVIS ASSOCIATES, INC. Texas Registered Engineering Firm F‐1529 Page | 76

RALPH E. DAVIS ASSOCIATES, INC. Texas Registered Engineering Firm F‐1529 Page | 77
Development Well Plan
Bolivar Block covers 20,321 gross acres It is anticipated that 6 wells can be drilled in 2014 from the existing Catalina operational area under existing
environmental authority Once an updated environmental licence is granted by Autoridad Nacional de Licencias Ambientales (“ANLA”)
drilling across the entirety of the block can commence Key assumptions:
─ All reserves can be developed on 80 acre spacing with vertical or directional s‐curve wells (returning inclination to 0° at the top of the Middle La Luna)
─ Spacing dimension conforms to reasonable anticipated fracture lengths and conservative recovery factor of 4‐6%
─ Rosa Blanca and Salada Limestone reserves anticipated to be accessible from a subset of the same surface locations as those used for the development of Middle La Luna Shale, Simiti Shale and Tablazo Shale and no additional pads will be required

RALPH E. DAVIS ASSOCIATES, INC. Texas Registered Engineering Firm F‐1529 Page | 78
Environmental Licence
GED currently holds an environmental permit to conduct drilling activities from one location on the Bolivar Block
Existing environmental licence for 1 platform (complete) and 4 wells (two drilled: Catalina‐1 & Olivo‐1)
An update to the existing environmental permit is being sought from the Autoridad Nacional de Licencias Ambientales (“ANLA”)
Updated environmental licence to accommodate development of the entire block over the life of the licence: ─ Multiple platforms, wells, production facilities, access roads, flow lines, electrical lines, aerial runway, heliport, groundwater wells etc.
Water disposal options: ─ Reinjection, dumping in surface water, infiltration into the soil, disposal in others fields, disposal with third parties, evaporation, secondary recovery
Studies and cost for environmental license modification ($450k total): ─ Environmental Impact Study (including Archaeology) $300k ─ Fees assessed by Environmental Authorities $120k ─ Supervision by consultants, payroll allocation and contingencies $30k
Specific sites for future well pads not yet determined Flat terrain will allow for wells to be drilled across the entire block

RALPH E. DAVIS ASSOCIATES, INC. Texas Registered Engineering Firm F‐1529 Page | 79
Map showing proposed surface pad locations in relation to environmentally restricted areas. The pad
locations shown here are contained in the expanded environmental license request which is now being
processed.
RALPH E. DAVIS ASSOCIATES, INC. Texas Registered Engineering Firm F‐1529 Page | 80

RALPH E. DAVIS ASSOCIATES, INC. Texas Registered Engineering Firm F‐1529 Page | 81
BOLIVAR BLOCK
MULTI‐WELL PLATFORM

RALPH E. DAVIS ASSOCIATES, INC. Texas Registered Engineering Firm F‐1529 Page | 82
MULTI‐WELL PLATFORM
6Ha, 9 Drilling Wells & 1 Injector Well

RALPH E. DAVIS ASSOCIATES, INC. Texas Registered Engineering Firm F‐1529 Page | 83
Facilities & Transportation
Estimated $230 million spending on facilities required for the development of the whole block:─ increase capacity at production facilities and storage tanks ─ build gathering lines ─ refurbish dock loading facilities ─ refurbish water and natural gas handling facilities ─ four water disposal wells to handle water production ─ four injection wells for disposal of produced gas into the Crisol gas cap ─ Anticipated break down of costs presented in table (bottom right)
Oil initially to be exported by truck or barge via the Magdalena River (located 5 to 10 km from future production locations)
Existing loading docks and facilities available on the river which will be upgraded as part of the facilities upgrade Pipeline to be built from Bolivar central production facilities to the docks Crude shipped to Coveñas on the coast via the Magdalena and intracoastal canal systems
─ 10,000 barrel capacity barges ─ Round trip in six days
Transport by 200 barrel truck until the dock and pipeline are ready ─ Round trip to Coveñas in four days ─ Trucks in conjunction with the barges or as a backup if needed
Estimated transport cost of $5 per barrel (barge or truck) Currently no plans to transport crude to market by pipeline

RALPH E. DAVIS ASSOCIATES, INC. Texas Registered Engineering Firm F‐1529 Page | 84
Production Facilities
There are 30,000 barrels of existing storage capacity and 16,000 BOPD separation facilities currently at Bolivar that were previously installed. Global plans to spend a significant amount of capital, approximately $230 million, to increase production facilities, storage tanks, build gathering lines, refurbish dock loading facilities and water and natural gas handling facilities. Four water disposal wells are planned to handle the future water production and four (4) gas injection wells are planned to inject any produced gas into the Crisol gas cap. The following table shows the breakdown of estimated costs for incremental facilities.
Incremental Facility Module and Estimated Cost/4 Facility Modules Required
Processing and Separation Equipment 50,000 BOPD $ 18,000,000
Water Disposal and Related Injection Facility
1 vertical well $ 9,000,000
Gas Injection and Related Injection Facility 1 vertical well $ 9,000,000
Crude Sales Pipeline Gathering/Transport to barge dock $ 6,000,000
Barge Dock Module Upgrade for loading crude oil $ 4,000,000
Storage Tank Module 10,000 Barrel Capacity $ 7,500,000
Breakout Tanks Per Loading Requirements $ 4,000,000
$ 57,500,000
Crude Oil Transportation Transportation options for the crude oil production are by pipeline, truck or barges which are all located in the vicinity of Bolivar. Global has no plans to transport by pipeline at this time but prefers to use barges on the Magdalena River which is 5 to 10 kilometers away. There are existing loading docks and facilities available on the river but need to be upgraded. A pipeline can easily be built from the proposed central production facilities at Bolivar to the docks. The crude oil will be shipped to Coveñas on the coast in 10,000 barrel capacity barges that can make the roundtrip from Bolivar in approximately six (6) days. Global will contract the necessary number of barges at an estimated current transport cost of $5.00 per barrel. Initially the crude oil will have to be transported by trucks until the dock and pipeline commences operation and all licenses are approved. Each truck has the capacity of 200 barrels and can make the round trip to Coveñas in four (4) days. There are an abundant number of trucks currently operating in Colombia. The trucks can be in conjunction with the barges or as a backup if needed.

RALPH E. DAVIS ASSOCIATES, INC. Texas Registered Engineering Firm F‐1529 Page | 85
Cash Flow And
Economic Summaries

RALPH E. DAVIS ASSOCIATES, INC. Texas Registered Engineering Firm F‐1529 Page | 86
BolivarDevelopmentPlan2Pand3PCashFlowSummaries
&Assumptions
Total2Pand3PReserveEconomics/CashFlow

RALPH E. DAVIS ASSOCIATES, INC. Texas Registered Engineering Firm F‐1529 Page | 87
Global Energy Development PLCBolivar Development PlanNear-Term Three-Year Monthly Economic Summary, Cash Flow and Assumptions2014 - 2016(in thousands, except BOPD)
ASSUMPTIONS:
I. Well Capital Costs
Project Project RevenueStart Completion Start IP Rate Reserve
Year Project Cost Date Date Date (BOPD) Classification2014 Olivo #1 Re-entry 3,000$ Feb-14 Mar-14 Mar-14 1,180 Possible Non-Producing
Catalina #1 Re-entry 1,700 Jul-14 Aug-14 Aug-14 790 Possible Non-Producing4,700$
2015 Catalina #3 7,210$ May-15 Jun-15 Jul-15 3,350 Probable UndevelopedCatalina #4 7,210 Jun-15 Jul-15 Aug-15 3,350 Probable UndevelopedCatalina #5 7,210 Jul-15 Aug-15 Sep-15 3,350 Proved UndevelopedCatalina #6 7,210 Aug-15 Sep-15 Oct-15 3,350 Proved UndevelopedOlivo #2 1,751 Sep-15 Oct-15 Nov-15 800 Possible Undeveloped
30,591$
2016 Catalina #7 7,426$ May-16 Jun-16 Jul-16 3,350 Proved UndevelopedCatalina #8 7,426 May-16 Jun-16 Jul-16 3,350 Proved UndevelopedCatalina #9 7,426 May-16 Jun-16 Jul-16 3,350 Proved UndevelopedCatalina #10 7,426 Jun-16 Jul-16 Aug-16 3,350 Proved UndevelopedCatalina #11 7,426 Jun-16 Jul-16 Aug-16 3,350 Proved UndevelopedCatalina #12 7,426 Jun-16 Jul-16 Aug-16 3,350 Proved UndevelopedCatalina #13 7,426 Jul-16 Aug-16 Sep-16 3,350 Proved UndevelopedCatalina #14 7,426 Jul-16 Aug-16 Sep-16 3,350 Proved UndevelopedCatalina #15 7,426 Jul-16 Aug-16 Sep-16 3,350 Proved UndevelopedCatalina #16 7,426 Aug-16 Sep-16 Oct-16 3,350 Proved UndevelopedCatalina #17 7,426 Aug-16 Sep-16 Oct-16 3,350 Proved UndevelopedCatalina #18 7,426 Aug-16 Sep-16 Oct-16 3,350 Proved UndevelopedCatalina #19 7,426 Sep-16 Oct-16 Nov-16 3,350 Proved UndevelopedCatalina #20 7,426 Sep-16 Oct-16 Nov-16 3,350 Proved UndevelopedCatalina #21 7,426 Sep-16 Oct-16 Nov-16 3,350 Proved UndevelopedCatalina #22 7,426 Oct-16 Nov-16 Dec-16 3,350 Proved UndevelopedCatalina #23 7,426 Oct-16 Nov-16 Dec-16 3,350 Proved UndevelopedCatalina #24 7,426 Oct-16 Nov-16 Dec-16 3,350 Proved UndevelopedCatalina #25 7,426 Nov-16 Dec-16 Jan-17 3,350 Proved UndevelopedCatalina #26 7,426 Nov-16 Dec-16 Jan-17 3,350 Proved UndevelopedCatalina #27 7,426 Nov-16 Dec-16 Jan-17 3,350 Proved UndevelopedCatalina #28 7,426 Dec-16 Jan-17 Feb-17 3,350 Proved UndevelopedCatalina #29 7,426 Dec-16 Jan-17 Feb-17 3,350 Proved UndevelopedCatalina #30 7,426 Dec-16 Jan-17 Feb-17 3,350 Proved Undeveloped
178,224$
II. Additional Capital Requirements - Facility Costs
Year Cost2016 Processing and Separation Equipment 50,000 BOPD 18,000$
Water Disposal and Injection Facility 1 vertical well 9,000 Gas Injection and Injection Facility 1 vertical well 9,000 Crude Sales Pipeline Gathering/transport to barge dock 6,000 Barge Dock Module Upgrade for loading oil 4,000 Storage Tank Module 10,000 barrel capacity 7,500 Breakout Tanks Per loading requiremenst 4,000
57,500$
III.Pricing, Discounts and Fees:Gravity Discount/ Net
Year Oil Price Benchmark Escalation API Transp Fee Pricing2014 107.50$ Brent None 25 20.29$ 87.21$ 2015 110.73$ Brent 3% 25 20.29$ 90.44$ 2016 114.05$ Brent 3% compounding 25 20.29$ 93.76$
IV. Average Operating Expenses:
LOE/Bbl2014 22.31$ 2015 15.25$ 2016 14.80$
Note: Costs/barrel decrease as a result of the large increase in produced volumes. Thisdoes not include the negative $20.29 deductions to price.
V. Initial Production Rates (IP) for Development Wells
All development wells shown above assume IP rates as follows:
Formation IP Rate (BOPD)Rosa Blanca 650 Salada 335 Tablazo 390 La Luna 1,180 Simiti 790 Total 3,345
Project Description

RALPH E. DAVIS ASSOCIATES, INC. Texas Registered Engineering Firm F‐1529 Page | 88
GLOBAL ENERGY DEVELOPMENT PLCNEAR-TERM CASH FLOW ECONOMIC SUMMARYNEW BOLIVAR DEVELOPMENT PLAN
--END-- WELL GROSS OIL GROSS GAS NET OIL NET GAS NET OIL NET GAS NET NET TOTAL DIRECT OPER FACILITY WELL CAPITAL FUTURE NET CUML CUM. DISC.
MO-YEAR COUNT PRODUCTION PRODUCTION PRODUCTION PRODUCTION PRICE PRICE OIL SALES GAS SALES NET SALES EXPENSE EXPENSE COST CASHFLOW CASHFLOW CASHFLOW------- ------- ---MBBLS--- ----MMCF--- ---MBBLS--- ----MMCF--- ---$/BBL--- ---$/MCF--- -----M$---- -----M$---- -----M$---- -----M$---- -----M $---- -----M$---- -----M$---- -----M$---- -----M$----
01-2014 1 1.444 14.437 1.155 11.549 87.21$ - 101$ -$ 101$ 52$ -$ 3,000$ (2,951)$ (2,951)$ (2,951)$ 02-2014 1 1.431 14.310 1.145 11.448 87.21$ - 100$ -$ 100$ 52$ -$ -$ 48$ (2,903)$ (2,904)$ 03-2014 2 33.004 14.185 26.404 11.348 87.21$ - 2,303$ -$ 2,303$ 805$ -$ -$ 1,498$ (1,406)$ (1,436)$ 04-2014 2 26.686 14.061 21.349 11.249 87.21$ - 1,862$ -$ 1,862$ 657$ -$ -$ 1,205$ (201)$ (264)$ 05-2014 2 22.610 13.938 18.088 11.151 87.21$ - 1,577$ -$ 1,577$ 561$ -$ -$ 1,016$ 815$ 716$ 06-2014 2 19.742 13.816 15.793 11.053 87.21$ - 1,377$ -$ 1,377$ 494$ -$ 1,700$ (817)$ (2)$ (72)$ 07-2014 2 17.603 13.696 14.083 10.957 87.21$ - 1,228$ -$ 1,228$ 444$ -$ -$ 784$ 782$ 672$ 08-2014 3 36.999 23.473 29.599 10.861 87.21$ - 2,581$ -$ 2,581$ 701$ -$ -$ 1,880$ 2,663$ 2,444$ 09-2014 3 31.462 21.378 25.169 10.766 87.21$ - 2,195$ -$ 2,195$ 613$ -$ -$ 1,582$ 4,245$ 3,923$ 10-2014 3 27.658 19.987 22.126 10.672 87.21$ - 1,930$ -$ 1,930$ 551$ -$ -$ 1,379$ 5,623$ 5,201$ 11-2014 3 24.836 18.976 19.869 10.578 87.21$ - 1,733$ -$ 1,733$ 504$ -$ -$ 1,229$ 6,852$ 6,332$ 12-2014 3 22.637 18.194 18.110 10.486 87.21$ - 1,579$ -$ 1,579$ 467$ -$ -$ 1,113$ 7,965$ 7,347$
266.112 200.451 212.890 132.118 18,566 18,566 5,901 - 4,700 7,965 7,965 7,347$
01-2015 3 20.863 17.562 16.691 10.394 90.44$ - 1,509$ -$ 1,509$ 453$ -$ -$ 1,056$ 9,021$ 8,303$ 02-2015 3 19.394 17.035 15.515 10.303 90.44$ - 1,403$ -$ 1,403$ 427$ -$ -$ 976$ 9,996$ 9,180$ 03-2015 3 18.153 16.583 14.523 10.213 90.44$ - 1,313$ -$ 1,313$ 405$ -$ -$ 908$ 10,904$ 9,989$ 04-2015 3 17.088 16.188 13.670 10.124 90.44$ - 1,236$ -$ 1,236$ 386$ -$ -$ 850$ 11,754$ 10,741$ 05-2015 3 16.162 15.836 12.929 10.036 90.44$ - 1,169$ -$ 1,169$ 370$ -$ 7,210$ (6,410)$ 5,344$ 5,092$ 06-2015 3 15.347 15.518 12.278 9.948 90.44$ - 1,110$ -$ 1,110$ 355$ -$ 7,210$ (6,455)$ (1,111)$ (550)$ 07-2015 4 54.660 49.791 43.728 31.978 90.44$ - 3,954$ -$ 3,954$ 921$ -$ 7,210$ (4,176)$ (5,287)$ (4,180)$ 08-2015 5 91.260 81.885 73.008 52.719 90.44$ - 6,602$ -$ 6,602$ 1,446$ -$ 7,210$ (2,053)$ (7,340)$ (5,963)$ 09-2015 6 125.892 113.374 100.713 78.826 90.44$ - 9,108$ -$ 9,108$ 1,943$ -$ -$ 7,165$ (175)$ 125$ 10-2015 7 158.960 144.907 127.168 104.741 90.44$ - 11,500$ -$ 11,500$ 2,420$ -$ -$ 9,080$ 8,905$ 7,780$ 11-2015 8 150.678 140.561 120.542 101.822 90.44$ - 10,901$ -$ 10,901$ 2,304$ -$ -$ 8,597$ 17,502$ 14,970$ 12-2015 8 144.034 136.595 115.228 99.120 90.44$ - 10,421$ -$ 10,421$ 2,211$ -$ -$ 8,210$ 25,712$ 21,782$
832.491 765.835 665.993 530.224 60,229 60,229 13,642 - 28,840 17,747 25,712$ 21,782$
01-2016 8 138.395 132.905 110.716 96.579 93.76$ - 10,380$ -$ 10,380$ 2,193$ -$ -$ 8,188$ 33,900$ 28,522$ 02-2016 8 133.431 129.430 106.746 94.167 93.76$ - 10,008$ -$ 10,008$ 2,121$ -$ -$ 7,887$ 41,787$ 34,963$ 03-2016 8 128.959 126.130 103.167 91.859 93.76$ - 9,673$ -$ 9,673$ 2,056$ -$ -$ 7,616$ 49,403$ 41,134$ 04-2016 8 124.860 122.979 99.888 89.642 93.76$ - 9,365$ -$ 9,365$ 1,997$ -$ -$ 7,368$ 56,771$ 47,056$ 05-2016 8 121.059 119.955 96.847 87.505 93.76$ - 9,080$ -$ 9,080$ 1,942$ -$ 22,279$ (15,141)$ 41,630$ 34,912$ 06-2016 8 117.500 117.044 94.000 85.439 93.76$ - 8,813$ -$ 8,813$ 1,890$ -$ 22,279$ (15,356)$ 26,274$ 22,693$ 07-2016 11 234.251 220.933 187.401 168.797 93.76$ - 17,570$ -$ 17,570$ 3,607$ -$ 22,279$ (8,315)$ 17,958$ 16,097$ 08-2016 14 342.814 322.351 274.252 250.165 93.76$ - 25,713$ -$ 25,713$ 5,211$ -$ 22,279$ (1,777)$ 16,181$ 14,644$ 09-2016 17 445.432 421.354 356.345 329.587 93.76$ - 33,410$ -$ 33,410$ 6,733$ -$ 22,279$ 4,398$ 20,579$ 17,973$ 10-2016 20 543.330 517.995 434.664 407.109 93.76$ - 40,753$ -$ 40,753$ 8,190$ -$ 22,279$ 10,284$ 30,863$ 25,786$ 11-2016 23 637.265 612.328 509.812 482.775 93.76$ - 47,798$ -$ 47,798$ 9,591$ -$ 22,279$ 15,928$ 46,791$ 37,829$ 12-2016 26 727.742 704.407 582.193 556.629 93.76$ - 54,585$ -$ 54,585$ 10,945$ -$ 22,279$ 21,361$ 68,152$ 53,875$
3,695.038 3,547.811 2,956.031 2,740.253 277,148$ 277,148$ 56,476$ -$ 178,231$ 42,440$ 68,152$ 53,875$
03-2017 35 2,696.440 2,640.909 2,157.151 2,076.503 97.178 - 209,628$ -$ 209,628$ 41,552$ -$ 68,842$ 99,234$ 167,386$ 127,285$ 06-2017 48 3,412.908 3,336.373 2,730.326 2,513.778 97.178 - 265,328$ -$ 265,328$ 52,579$ -$ 99,438$ 113,311$ 280,698$ 209,133$ 09-2017 48 4,364.894 4,186.966 3,491.915 3,039.909 97.178 - 339,338$ -$ 339,338$ 67,107$ -$ -$ 272,231$ 552,928$ 401,826$ 12-2017 50 4,060.248 3,931.321 3,248.199 2,859.335 97.178 - 315,654$ -$ 315,654$ 62,760$ -$ 15,298$ 237,595$ 790,524$ 566,043$
14,534.490 14,095.569 11,627.591 10,489.525 1,129,948$ 1,129,948$ 223,998$ -$ 183,578$ 722,372$ 790,524$ 566,043$
03-2018 50 3,931.603 3,810.983 3,145.283 2,762.511 100.702 - 316,737$ -$ 316,737$ 62,537$ -$ -$ 254,199$ 1,044,723$ 737,641$ 06-2018 50 3,603.763 3,512.015 2,883.009 2,551.438 100.702 - 290,325$ -$ 290,325$ 57,667$ -$ -$ 232,658$ 1,277,381$ 890,996$ 09-2018 50 3,323.822 3,250.064 2,659.057 2,364.048 100.702 - 267,773$ -$ 267,773$ 53,518$ -$ -$ 214,255$ 1,491,636$ 1,028,894$ 12-2018 50 3,075.085 3,013.462 2,460.069 2,193.658 100.702 - 247,734$ -$ 247,734$ 49,821$ -$ -$ 197,913$ 1,689,549$ 1,153,275$
13,934.273 13,586.524 11,147.418 9,871.655 1,122,569$ 1,122,569$ 223,545$ -$ -$ 899,025$ 1,689,549$ 1,153,275$
03-2019 50 2,850.378 2,797.240 2,280.302 2,037.308 104.332 - 237,908$ -$ 237,908$ 47,618$ -$ -$ 190,291$ 1,879,839$ 1,270,049$ 06-2019 67 2,764.106 2,740.734 2,211.285 2,006.994 104.332 - 230,708$ -$ 230,708$ 46,462$ -$ 129,839$ 54,407$ 1,934,246$ 1,302,391$ 09-2019 86 3,846.661 4,081.701 3,077.327 3,093.249 104.332 - 321,064$ -$ 321,064$ 64,617$ -$ 146,068$ 110,378$ 2,044,624$ 1,366,532$ 12-2019 88 5,020.041 5,527.449 4,016.035 4,262.128 104.332 - 419,001$ -$ 419,001$ 84,328$ -$ 16,230$ 318,442$ 2,363,066$ 1,548,284$
14,481.186 15,147.124 11,584.949 11,399.679 1,208,680$ 1,208,680$ 243,025$ -$ 292,137$ 673,518$ 2,363,066$ 1,548,284$
03-2020 88 4,952.111 5,480.049 3,961.692 4,235.455 108.071 - 428,142$ -$ 428,142$ 85,893$ -$ -$ 342,249$ 2,705,316$ 1,739,216$ 06-2020 88 4,606.212 5,096.005 2,471.509 2,641.658 108.070 - 267,097$ -$ 267,097$ 53,894$ -$ -$ 213,204$ 2,918,519$ 1,855,587$ 09-2020 88 4,285.341 4,739.311 1,714.137 1,831.352 108.071 - 185,248$ -$ 185,248$ 37,654$ -$ -$ 147,594$ 3,066,113$ 1,934,095$ 12-2020 88 3,987.561 4,407.947 1,595.025 1,703.195 108.071 - 172,375$ -$ 172,375$ 35,286$ -$ -$ 137,090$ 3,203,202$ 2,005,297$
17,831.225 19,723.312 9,742.363 10,411.660 1,052,863$ 1,052,863$ 212,726$ -$ -$ 840,136$ 3,203,202$ 2,005,297$
12-2021 88 13,375.921 14,763.067 3,653.219 3,895.028 111.921 - 408,874$ -$ 408,874$ 84,437$ -$ -$ 324,436$ 3,527,639$ 2,165,738$
12-2022 88 10,059.885 11,062.938 2,011.977 2,135.483 115.888 - 233,164$ -$ 233,164$ 49,805$ -$ -$ 183,358$ 3,710,997$ 2,247,516$
12-2023 88 7,585.359 8,299.584 1,517.072 1,600.671 119.973 - 182,008$ -$ 182,008$ 40,510$ -$ -$ 141,498$ 3,852,496$ 2,304,887$
12-2024 88 3,065.836 3,329.525 613.167 641.519 124.181 - 76,144$ -$ 76,144$ 17,570$ -$ -$ 58,574$ 3,911,069$ 2,326,952$
TOTAL 99,661.816 104,521.740 55,732.670 53,847.815 - 5,770,191$ - 5,770,191$ 1,171,636$ -$ 687,486$ 3,911,069$ 3,911,069$ 2,326,952$
* Note: The totals presented here vary slightly from the totals on the following annualized runs due to mathematical calculation differences within Aries between monthly, quarterly and annual reporting periods.
TOTAL 2P RESERVESPROVED + PROBABLE
CASH FLOW ECONOMIC SUMMARY
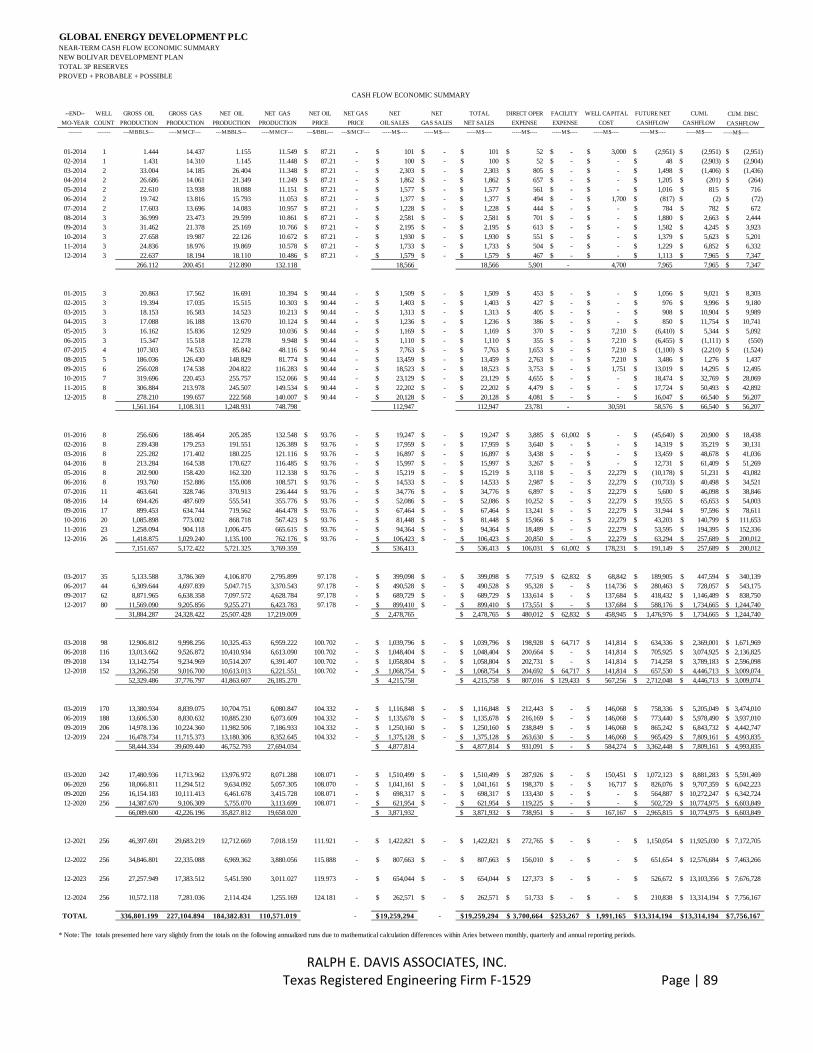
RALPH E. DAVIS ASSOCIATES, INC. Texas Registered Engineering Firm F‐1529 Page | 89
GLOBAL ENERGY DEVELOPMENT PLCNEAR-TERM CASH FLOW ECONOMIC SUMMARYNEW BOLIVAR DEVELOPMENT PLAN
--END-- WELL GROSS OIL GROSS GAS NET OIL NET GAS NET OIL NET GAS NET NET TOTAL DIRECT OPER FACILITY WELL CAPITAL FUTURE NET CUML CUM. DISC.
MO-YEAR COUNT PRODUCTION PRODUCTION PRODUCTION PRODUCTION PRICE PRICE OIL SALES GAS SALES NET SALES EXPENSE EXPENSE COST CASHFLOW CASHFLOW CASHFLOW
------- ------- ---MBBLS--- ----MMCF--- ---MBBLS--- ----MMCF--- ---$/BBL--- ---$/MCF--- -----M$---- -----M$---- -----M$---- -----M$---- -----M$---- -----M$---- -----M$---- -----M$---- -----M$----
01-2014 1 1.444 14.437 1.155 11.549 87.21$ - 101$ -$ 101$ 52$ -$ 3,000$ (2,951)$ (2,951)$ (2,951)$ 02-2014 1 1.431 14.310 1.145 11.448 87.21$ - 100$ -$ 100$ 52$ -$ -$ 48$ (2,903)$ (2,904)$ 03-2014 2 33.004 14.185 26.404 11.348 87.21$ - 2,303$ -$ 2,303$ 805$ -$ -$ 1,498$ (1,406)$ (1,436)$ 04-2014 2 26.686 14.061 21.349 11.249 87.21$ - 1,862$ -$ 1,862$ 657$ -$ -$ 1,205$ (201)$ (264)$ 05-2014 2 22.610 13.938 18.088 11.151 87.21$ - 1,577$ -$ 1,577$ 561$ -$ -$ 1,016$ 815$ 716$ 06-2014 2 19.742 13.816 15.793 11.053 87.21$ - 1,377$ -$ 1,377$ 494$ -$ 1,700$ (817)$ (2)$ (72)$ 07-2014 2 17.603 13.696 14.083 10.957 87.21$ - 1,228$ -$ 1,228$ 444$ -$ -$ 784$ 782$ 672$ 08-2014 3 36.999 23.473 29.599 10.861 87.21$ - 2,581$ -$ 2,581$ 701$ -$ -$ 1,880$ 2,663$ 2,444$ 09-2014 3 31.462 21.378 25.169 10.766 87.21$ - 2,195$ -$ 2,195$ 613$ -$ -$ 1,582$ 4,245$ 3,923$ 10-2014 3 27.658 19.987 22.126 10.672 87.21$ - 1,930$ -$ 1,930$ 551$ -$ -$ 1,379$ 5,623$ 5,201$ 11-2014 3 24.836 18.976 19.869 10.578 87.21$ - 1,733$ -$ 1,733$ 504$ -$ -$ 1,229$ 6,852$ 6,332$ 12-2014 3 22.637 18.194 18.110 10.486 87.21$ - 1,579$ -$ 1,579$ 467$ -$ -$ 1,113$ 7,965$ 7,347$
266.112 200.451 212.890 132.118 18,566 18,566 5,901 - 4,700 7,965 7,965 7,347$
01-2015 3 20.863 17.562 16.691 10.394 90.44$ - 1,509$ -$ 1,509$ 453$ -$ -$ 1,056$ 9,021$ 8,303$ 02-2015 3 19.394 17.035 15.515 10.303 90.44$ - 1,403$ -$ 1,403$ 427$ -$ -$ 976$ 9,996$ 9,180$ 03-2015 3 18.153 16.583 14.523 10.213 90.44$ - 1,313$ -$ 1,313$ 405$ -$ -$ 908$ 10,904$ 9,989$ 04-2015 3 17.088 16.188 13.670 10.124 90.44$ - 1,236$ -$ 1,236$ 386$ -$ -$ 850$ 11,754$ 10,741$ 05-2015 3 16.162 15.836 12.929 10.036 90.44$ - 1,169$ -$ 1,169$ 370$ -$ 7,210$ (6,410)$ 5,344$ 5,092$ 06-2015 3 15.347 15.518 12.278 9.948 90.44$ - 1,110$ -$ 1,110$ 355$ -$ 7,210$ (6,455)$ (1,111)$ (550)$ 07-2015 4 107.303 74.533 85.842 48.116 90.44$ - 7,763$ -$ 7,763$ 1,653$ -$ 7,210$ (1,100)$ (2,210)$ (1,524)$ 08-2015 5 186.036 126.430 148.829 81.774 90.44$ - 13,459$ -$ 13,459$ 2,763$ -$ 7,210$ 3,486$ 1,276$ 1,437$ 09-2015 6 256.028 174.538 204.822 116.283 90.44$ - 18,523$ -$ 18,523$ 3,753$ -$ 1,751$ 13,019$ 14,295$ 12,495$ 10-2015 7 319.696 220.453 255.757 152.066 90.44$ - 23,129$ -$ 23,129$ 4,655$ -$ -$ 18,474$ 32,769$ 28,069$ 11-2015 8 306.884 213.978 245.507 149.534 90.44$ - 22,202$ -$ 22,202$ 4,479$ -$ -$ 17,724$ 50,493$ 42,892$ 12-2015 8 278.210 199.657 222.568 140.007 90.44$ - 20,128$ -$ 20,128$ 4,081$ -$ -$ 16,047$ 66,540$ 56,207$
1,561.164 1,108.311 1,248.931 748.798 112,947 112,947 23,781 - 30,591 58,576 66,540$ 56,207$
01-2016 8 256.606 188.464 205.285 132.548 93.76$ - 19,247$ -$ 19,247$ 3,885$ 61,002$ -$ (45,640)$ 20,900$ 18,438$ 02-2016 8 239.438 179.253 191.551 126.389 93.76$ - 17,959$ -$ 17,959$ 3,640$ -$ -$ 14,319$ 35,219$ 30,131$ 03-2016 8 225.282 171.402 180.225 121.116 93.76$ - 16,897$ -$ 16,897$ 3,438$ -$ -$ 13,459$ 48,678$ 41,036$ 04-2016 8 213.284 164.538 170.627 116.485 93.76$ - 15,997$ -$ 15,997$ 3,267$ -$ -$ 12,731$ 61,409$ 51,269$ 05-2016 8 202.900 158.420 162.320 112.338 93.76$ - 15,219$ -$ 15,219$ 3,118$ -$ 22,279$ (10,178)$ 51,231$ 43,082$ 06-2016 8 193.760 152.886 155.008 108.571 93.76$ - 14,533$ -$ 14,533$ 2,987$ -$ 22,279$ (10,733)$ 40,498$ 34,521$ 07-2016 11 463.641 328.746 370.913 236.444 93.76$ - 34,776$ -$ 34,776$ 6,897$ -$ 22,279$ 5,600$ 46,098$ 38,846$ 08-2016 14 694.426 487.609 555.541 355.776 93.76$ - 52,086$ -$ 52,086$ 10,252$ -$ 22,279$ 19,555$ 65,653$ 54,003$ 09-2016 17 899.453 634.744 719.562 464.478 93.76$ - 67,464$ -$ 67,464$ 13,241$ -$ 22,279$ 31,944$ 97,596$ 78,611$ 10-2016 20 1,085.898 773.002 868.718 567.423 93.76$ - 81,448$ -$ 81,448$ 15,966$ -$ 22,279$ 43,203$ 140,799$ 111,653$ 11-2016 23 1,258.094 904.118 1,006.475 665.615 93.76$ - 94,364$ -$ 94,364$ 18,489$ -$ 22,279$ 53,595$ 194,395$ 152,336$ 12-2016 26 1,418.875 1,029.240 1,135.100 762.176 93.76$ - 106,423$ -$ 106,423$ 20,850$ -$ 22,279$ 63,294$ 257,689$ 200,012$
7,151.657 5,172.422 5,721.325 3,769.359 536,413$ 536,413$ 106,031$ 61,002$ 178,231$ 191,149$ 257,689$ 200,012$
03-2017 35 5,133.588 3,786.369 4,106.870 2,795.899 97.178 - 399,098$ -$ 399,098$ 77,519$ 62,832$ 68,842$ 189,905$ 447,594$ 340,139$ 06-2017 44 6,309.644 4,697.839 5,047.715 3,370.543 97.178 - 490,528$ -$ 490,528$ 95,328$ -$ 114,736$ 280,463$ 728,057$ 543,175$ 09-2017 62 8,871.965 6,638.358 7,097.572 4,628.784 97.178 - 689,729$ -$ 689,729$ 133,614$ -$ 137,684$ 418,432$ 1,146,489$ 838,750$ 12-2017 80 11,569.090 9,205.856 9,255.271 6,423.783 97.178 - 899,410$ -$ 899,410$ 173,551$ -$ 137,684$ 588,176$ 1,734,665$ 1,244,740$
31,884.287 24,328.422 25,507.428 17,219.009 2,478,765$ 2,478,765$ 480,012$ 62,832$ 458,945$ 1,476,976$ 1,734,665$ 1,244,740$
03-2018 98 12,906.812 9,998.256 10,325.453 6,959.222 100.702 - 1,039,796$ -$ 1,039,796$ 198,928$ 64,717$ 141,814$ 634,336$ 2,369,001$ 1,671,969$ 06-2018 116 13,013.662 9,526.872 10,410.934 6,613.090 100.702 - 1,048,404$ -$ 1,048,404$ 200,664$ -$ 141,814$ 705,925$ 3,074,925$ 2,136,825$ 09-2018 134 13,142.754 9,234.969 10,514.207 6,391.407 100.702 - 1,058,804$ -$ 1,058,804$ 202,731$ -$ 141,814$ 714,258$ 3,789,183$ 2,596,098$ 12-2018 152 13,266.258 9,016.700 10,613.013 6,221.551 100.702 - 1,068,754$ -$ 1,068,754$ 204,692$ 64,717$ 141,814$ 657,530$ 4,446,713$ 3,009,074$
52,329.486 37,776.797 41,863.607 26,185.270 4,215,758$ 4,215,758$ 807,016$ 129,433$ 567,256$ 2,712,048$ 4,446,713$ 3,009,074$
03-2019 170 13,380.934 8,839.075 10,704.751 6,080.847 104.332 - 1,116,848$ -$ 1,116,848$ 212,443$ -$ 146,068$ 758,336$ 5,205,049$ 3,474,010$ 06-2019 188 13,606.530 8,830.632 10,885.230 6,073.609 104.332 - 1,135,678$ -$ 1,135,678$ 216,169$ -$ 146,068$ 773,440$ 5,978,490$ 3,937,010$ 09-2019 206 14,978.136 10,224.360 11,982.506 7,186.933 104.332 - 1,250,160$ -$ 1,250,160$ 238,849$ -$ 146,068$ 865,242$ 6,843,732$ 4,442,747$ 12-2019 224 16,478.734 11,715.373 13,180.306 8,352.645 104.332 - 1,375,128$ -$ 1,375,128$ 263,630$ -$ 146,068$ 965,429$ 7,809,161$ 4,993,835$
58,444.334 39,609.440 46,752.793 27,694.034 4,877,814$ 4,877,814$ 931,091$ -$ 584,274$ 3,362,448$ 7,809,161$ 4,993,835$
03-2020 242 17,480.936 11,713.962 13,976.972 8,071.288 108.071 - 1,510,499$ -$ 1,510,499$ 287,926$ -$ 150,451$ 1,072,123$ 8,881,283$ 5,591,469$ 06-2020 256 18,066.811 11,294.512 9,634.092 5,057.305 108.070 - 1,041,161$ -$ 1,041,161$ 198,370$ -$ 16,717$ 826,076$ 9,707,359$ 6,042,223$ 09-2020 256 16,154.183 10,111.413 6,461.678 3,415.728 108.071 - 698,317$ -$ 698,317$ 133,430$ -$ -$ 564,887$ 10,272,247$ 6,342,724$ 12-2020 256 14,387.670 9,106.309 5,755.070 3,113.699 108.071 - 621,954$ -$ 621,954$ 119,225$ -$ -$ 502,729$ 10,774,975$ 6,603,849$
66,089.600 42,226.196 35,827.812 19,658.020 3,871,932$ 3,871,932$ 738,951$ -$ 167,167$ 2,965,815$ 10,774,975$ 6,603,849$
12-2021 256 46,397.691 29,683.219 12,712.669 7,018.159 111.921 - 1,422,821$ -$ 1,422,821$ 272,765$ -$ -$ 1,150,054$ 11,925,030$ 7,172,705$
12-2022 256 34,846.801 22,335.088 6,969.362 3,880.056 115.888 - 807,663$ -$ 807,663$ 156,010$ -$ -$ 651,654$ 12,576,684$ 7,463,266$
12-2023 256 27,257.949 17,383.512 5,451.590 3,011.027 119.973 - 654,044$ -$ 654,044$ 127,373$ -$ -$ 526,672$ 13,103,356$ 7,676,728$
12-2024 256 10,572.118 7,281.036 2,114.424 1,255.169 124.181 - 262,571$ -$ 262,571$ 51,733$ -$ -$ 210,838$ 13,314,194$ 7,756,167$
TOTAL 336,801.199 227,104.894 184,382.831 110,571.019 - 19,259,294$ - 19,259,294$ 3,700,664$ 253,267$ 1,991,165$ 13,314,194$ 13,314,194$ 7,756,167$
* Note: The totals presented here vary slightly from the totals on the following annualized runs due to mathematical calculation differences within Aries between monthly, quarterly and annual reporting periods.
TOTAL 3P RESERVESPROVED + PROBABLE + POSSIBLE
CASH FLOW ECONOMIC SUMMARY

RALPH E. DAVIS ASSOCIATES, INC. Texas Registered Engineering Firm F‐1529 Page | 90
Economic Summaries
Houston,Texas

RALPH E. DAVIS ASSOCIATES, INC. Texas Registered Engineering Firm F‐1529 Page | 91
GLOBAL ENERGY DEVELOPMENT PLC DATE : 08/27/2013 GRAND TOTAL TIME : 07:55:12 TOTAL 3P RESERVES DBS : DEMO PROVED + PROBABLE + POSSIBLE SETTINGS : RED123112 NEW BOLIVAR DEVELOPMENT PLAN JULY, 2013 SCENARIO : RED123112E R E S E R V E S A N D E C O N O M I C S AS OF DECEMBER 31, 2013 --END-- GROSS OIL GROSS GAS GROSS NGL NET OIL NET GAS NET NGL NET OIL NET GAS NET NGL TOTAL MO-YEAR PRODUCTION PRODUCTION PRODUCTION PRODUCTION PRODUCTION PRODUCTION REVENUE REVENUE REVENUE REVENUE ------- ---MBBLS--- ----MMCF--- ----MBBLS-- ---MBBLS-- ----MMCF-- ---MBBLS-- ---M$--- ---M$--- ---M$--- ----$--- 12-2014 264.5 183.9 0.0 211.6 118.9 0.0 18450.8 0.0 0.0 18450.8 12-2015 1559.7 1093.4 0.0 1247.7 736.9 0.0 112839.5 0.0 0.0 112839.5 12-2016 7150.3 5159.0 0.0 5720.3 3758.7 0.0 536312.4 0.0 0.0 536312.4 12-2017 31883.1 24316.4 0.0 25506.5 17209.4 0.0 2478671.0 0.0 0.0 2478671.0 12-2018 52328.4 37765.9 0.0 41862.8 26176.6 0.0 4215667.5 0.0 0.0 4215667.5 12-2019 58443.4 39599.7 0.0 46752.0 27686.2 0.0 4877727.5 0.0 0.0 4877727.5 12-2020 66088.8 42217.4 0.0 35827.3 19653.3 0.0 3871881.8 0.0 0.0 3871881.8 12-2021 46396.9 29675.3 0.0 12712.5 7016.0 0.0 1422796.8 0.0 0.0 1422796.8 12-2022 34846.1 22328.0 0.0 6969.2 3878.6 0.0 807646.6 0.0 0.0 807646.6 12-2023 27253.0 17334.5 0.0 5450.6 3001.2 0.0 653926.8 0.0 0.0 653926.8 12-2024 10570.1 7261.2 0.0 2114.0 1251.2 0.0 262521.8 0.0 0.0 262521.8 12-2025 12-2026 12-2027 12-2028 S TOT 336784.2 226934.8 0.0 184374.4 110487.0 0.0 19258442.0 0.0 0.0 19258442.0 AFTER 0.0 0.0 0.0 0.0 0.0 0.0 0.0 0.0 0.0 0.0 TOTAL 336784.2 226934.8 0.0 184374.4 110487.0 0.0 19258442.0 0.0 0.0 19258442.0 --END-- NET OIL NET GAS NET NGL SEVERANCE PROD & OTHER NET OPER OPERATING EQUITY UNDISC NET DISC NET MO-YEAR PRICE PRICE PRICE TAXES TAXES EXPENSES CASH FLOW INVESTMENT CASH FLOW CASH FLOW ------- ---$--- ---$--- ---$--- ------M$---- -----M$----- ----M$---- ----M$---- ----M$---- -----M$---- -----M$---- 12-2014 87.21 0.00 0.00 0.0 0.0 5901.5 12549.4 4700.0 7849.4 7164.8 12-2015 90.43 0.00 0.00 0.0 0.0 23780.5 89059.0 30591.0 58468.0 48615.1 12-2016 93.76 0.00 0.00 0.0 0.0 106031.0 430281.5 239233.0 191048.5 142924.7 12-2017 97.18 0.00 0.00 0.0 0.0 480011.9 1998659.1 521777.1 1476881.1 1039315.1 12-2018 100.70 0.00 0.00 0.0 0.0 807015.6 3408652.5 696690.2 2711962.2 1754311.5 12-2019 104.33 0.00 0.00 0.0 0.0 931090.6 3946638.2 584273.9 3362367.5 1975149.5 12-2020 108.07 0.00 0.00 0.0 0.0 738949.8 3132932.2 167167.3 2965763.2 1590783.9 12-2021 111.92 0.00 0.00 0.0 0.0 272765.4 1150030.2 0.0 1150030.2 562896.6 12-2022 115.89 0.00 0.00 0.0 0.0 156009.9 651637.1 0.0 651637.1 289956.0 12-2023 119.97 0.00 0.00 0.0 0.0 127266.7 526660.5 0.0 526660.5 213041.4 12-2024 124.18 0.00 0.00 0.0 0.0 51684.3 210837.4 0.0 210837.4 79380.4 12-2025 12-2026 12-2027 12-2028 S TOT 104.45 0.00 0.00 0.0 0.0 3700507.5 15557936.0 2244432.5 13313505.0 7703539.0 AFTER 0.00 0.00 0.00 0.0 0.0 0.0 0.0 0.0 0.0 0.0 TOTAL 104.45 0.00 0.00 0.0 0.0 3700507.5 15557936.0 2244432.5 13313505.0 7703539.0 OIL GAS P.W. % P.W., M$ --------- --------- ------ -------- GROSS WELLS 436.0 278.0 LIFE, YRS. 10.50 5.00 10032552.000 GROSS ULT., MB & MMF 337493.750 230116.656 DISCOUNT % 10.00 10.00 7703527.500 GROSS CUM., MB & MMF 709.518 3181.867 UNDISCOUNTED PAYOUT, YRS. 0.37 15.00 6014551.500 GROSS RES., MB & MMF 336784.250 226934.781 DISCOUNTED PAYOUT, YRS. 0.39 20.00 4766132.500 NET RES., MB & MMF 184374.438 110487.031 UNDISCOUNTED NET/INVEST. 6.93 25.00 3827473.500 NET REVENUE, M$ 19258442.000 0.000 DISCOUNTED NET/INVEST. 6.16 30.00 3110767.000 INITIAL PRICE, $ 100.751 0.000 RATE-OF-RETURN, PCT. 100.00 40.00 2120770.000 INITIAL N.I., PCT. 80.000 80.000 INITIAL W.I., PCT. 98.307 60.00 1092229.500 80.00 624443.562 100.00 385985.906

RALPH E. DAVIS ASSOCIATES, INC. Texas Registered Engineering Firm F‐1529 Page | 92
GLOBAL ENERGY DEVELOPMENT PLC DATE : 08/27/2013 GRAND TOTAL TIME : 08:08:18 TOTAL 2P RESERVES DBS : DEMO PROVED + PROBABLE SETTINGS : RED123112 NEW BOLIVAR DEVELOPMENT PLAN JULY, 2013 SCENARIO : RED123112E R E S E R V E S A N D E C O N O M I C S AS OF DECEMBER 31, 2013 --END-- GROSS OIL GROSS GAS GROSS NGL NET OIL NET GAS NET NGL NET OIL NET GAS NET NGL TOTAL MO-YEAR PRODUCTION PRODUCTION PRODUCTION PRODUCTION PRODUCTION PRODUCTION REVENUE REVENUE REVENUE REVENUE ------- ---MBBLS--- ----MMCF--- ----MBBLS-- ---MBBLS-- ----MMCF-- ---MBBLS-- ---M$--- ---M$--- ---M$--- ----$--- 12-2014 14.9 148.6 0.0 11.9 118.9 0.0 1037.0 0.0 0.0 1037.0 12-2015 659.7 713.2 0.0 527.7 518.3 0.0 47725.5 0.0 0.0 47725.5 12-2016 3588.5 3512.8 0.0 2870.8 2729.6 0.0 269158.1 0.0 0.0 269158.1 12-2017 14455.3 14067.9 0.0 11564.2 10479.9 0.0 1123791.1 0.0 0.0 1123791.1 12-2018 13870.5 13563.3 0.0 11096.4 9863.0 0.0 1117431.2 0.0 0.0 1117431.2 12-2019 14427.4 15127.1 0.0 11542.0 11391.9 0.0 1204194.2 0.0 0.0 1204194.2 12-2020 17784.6 19705.6 0.0 9717.2 10406.9 0.0 1050144.6 0.0 0.0 1050144.6 12-2021 13334.6 14747.3 0.0 3642.1 3892.9 0.0 407629.0 0.0 0.0 407629.0 12-2022 10022.8 11048.8 0.0 2004.6 2134.1 0.0 232304.1 0.0 0.0 232304.1 12-2023 7547.7 8244.3 0.0 1509.5 1590.9 0.0 181105.0 0.0 0.0 181105.0 12-2024 3048.7 3306.7 0.0 609.7 637.5 0.0 75718.9 0.0 0.0 75718.9 12-2025 12-2026 12-2027 12-2028 S TOT 98754.8 104185.8 0.0 55096.2 53763.9 0.0 5710239.0 0.0 0.0 5710239.0 AFTER 0.0 0.0 0.0 0.0 0.0 0.0 0.0 0.0 0.0 0.0 TOTAL 98754.8 104185.8 0.0 55096.2 53763.9 0.0 5710239.0 0.0 0.0 5710239.0 --END-- NET OIL NET GAS NET NGL SEVERANCE PROD & OTHER NET OPER OPERATING EQUITY UNDISC NET DISC NET MO-YEAR PRICE PRICE PRICE TAXES TAXES EXPENSES CASH FLOW INVESTMENT CASH FLOW CASH FLOW ------- ---$--- ---$--- ---$--- ------M$---- -----M$----- ----M$---- ----M$---- ----M$---- -----M$---- -----M$---- 12-2014 87.21 0.00 0.00 0.0 0.0 622.1 414.9 0.0 414.9 395.7 12-2015 90.43 0.00 0.00 0.0 0.0 10085.8 37639.8 28840.0 8799.8 6609.0 12-2016 93.76 0.00 0.00 0.0 0.0 54101.7 215056.3 178231.3 36825.1 27403.9 12-2017 97.18 0.00 0.00 0.0 0.0 222113.7 901677.6 183578.1 718099.2 507432.0 12-2018 100.70 0.00 0.00 0.0 0.0 221932.4 895498.8 0.0 895498.8 583394.5 12-2019 104.33 0.00 0.00 0.0 0.0 241585.8 962608.5 292137.0 670471.4 392177.0 12-2020 108.07 0.00 0.00 0.0 0.0 211838.0 838306.7 0.0 838306.7 451351.5 12-2021 111.92 0.00 0.00 0.0 0.0 84022.3 323606.6 0.0 323606.6 158393.2 12-2022 115.89 0.00 0.00 0.0 0.0 49512.7 182791.5 0.0 182791.5 81335.9 12-2023 119.97 0.00 0.00 0.0 0.0 40125.0 140979.9 0.0 140979.9 57028.4 12-2024 124.18 0.00 0.00 0.0 0.0 17386.5 58332.4 0.0 58332.4 21962.2 12-2025 12-2026 12-2027 12-2028 S TOT 103.64 0.00 0.00 0.0 0.0 1153326.0 4556913.0 682786.4 3874126.5 2287483.5 AFTER 0.00 0.00 0.00 0.0 0.0 0.0 0.0 0.0 0.0 0.0 TOTAL 103.64 0.00 0.00 0.0 0.0 1153326.0 4556913.0 682786.4 3874126.5 2287483.5 OIL GAS P.W. % P.W., M$ --------- --------- ------ -------- GROSS WELLS 179.0 26.0 LIFE, YRS. 10.50 5.00 2949121.000 GROSS ULT., MB & MMF 99464.281 107367.625 DISCOUNT % 10.00 10.00 2287483.250 GROSS CUM., MB & MMF 709.518 3181.867 UNDISCOUNTED PAYOUT, YRS. 0.00 15.00 1803845.375 GROSS RES., MB & MMF 98754.758 104185.758 DISCOUNTED PAYOUT, YRS. 0.00 20.00 1443429.125 NET RES., MB & MMF 55096.184 53763.855 UNDISCOUNTED NET/INVEST. 6.67 25.00 1170171.875 NET REVENUE, M$ 5710239.000 0.000 DISCOUNTED NET/INVEST. 5.85 30.00 959768.312 INITIAL PRICE, $ 98.561 0.000 RATE-OF-RETURN, PCT. 100.00 40.00 665597.062 INITIAL N.I., PCT. 80.000 80.000 INITIAL W.I., PCT. 100.000 60.00 352878.562 80.00 206210.406 100.00 129409.023

RALPH E. DAVIS ASSOCIATES, INC. Texas Registered Engineering Firm F‐1529 Page | 93
GLOBAL ENERGY DEVELOPMENT PLC DATE : 08/27/2013 GRAND TOTAL TIME : 08:04:26 BOLIVAR BLOCK DBS : DEMO TOTAL PROVED RESERVES SETTINGS : RED123112 NEW BOLIVAR DEVELOPMENT PLAN JULY, 2013 SCENARIO : RED123112E R E S E R V E S A N D E C O N O M I C S AS OF DECEMBER 31, 2013 --END-- GROSS OIL GROSS GAS GROSS NGL NET OIL NET GAS NET NGL NET OIL NET GAS NET NGL TOTAL MO-YEAR PRODUCTION PRODUCTION PRODUCTION PRODUCTION PRODUCTION PRODUCTION REVENUE REVENUE REVENUE REVENUE ------- ---MBBLS--- ----MMCF--- ----MBBLS-- ---MBBLS-- ----MMCF-- ---MBBLS-- ---M$--- ---M$--- ---M$--- ----$--- 12-2014 14.9 148.6 0.0 11.9 118.9 0.0 1037.0 0.0 0.0 1037.0 12-2015 214.5 375.1 0.0 171.6 300.1 0.0 15520.1 0.0 0.0 15520.1 12-2016 2379.8 2961.7 0.0 1903.8 2369.3 0.0 178496.0 0.0 0.0 178496.0 12-2017 7410.4 8987.8 0.0 5928.3 7190.3 0.0 576104.0 0.0 0.0 576104.0 12-2018 5604.4 6811.1 0.0 4483.5 5448.9 0.0 451499.9 0.0 0.0 451499.9 12-2019 8429.6 10192.7 0.0 6743.6 8154.2 0.0 703577.2 0.0 0.0 703577.2 12-2020 13295.1 16023.6 0.0 7265.6 8756.1 0.0 785199.9 0.0 0.0 785199.9 12-2021 9931.1 11979.9 0.0 2713.6 3273.2 0.0 303710.8 0.0 0.0 303710.8 12-2022 7418.5 8958.4 0.0 1483.7 1791.7 0.0 171941.7 0.0 0.0 171941.7 12-2023 5537.5 6658.1 0.0 1107.5 1331.6 0.0 132869.3 0.0 0.0 132869.3 12-2024 2217.9 2661.5 0.0 443.6 532.3 0.0 55085.2 0.0 0.0 55085.2 12-2025 12-2026 12-2027 12-2028 S TOT 62453.6 75758.7 0.0 32256.8 39266.6 0.0 3375041.2 0.0 0.0 3375041.2 AFTER 0.0 0.0 0.0 0.0 0.0 0.0 0.0 0.0 0.0 0.0 TOTAL 62453.6 75758.7 0.0 32256.8 39266.6 0.0 3375041.2 0.0 0.0 3375041.2 --END-- NET OIL NET GAS NET NGL SEVERANCE PROD & OTHER NET OPER OPERATING EQUITY UNDISC NET DISC NET MO-YEAR PRICE PRICE PRICE TAXES TAXES EXPENSES CASH FLOW INVESTMENT CASH FLOW CASH FLOW ------- ---$--- ---$--- ---$--- ------M$---- -----M$----- ----M$---- ----M$---- ----M$---- -----M$---- -----M$---- 12-2014 87.21 0.00 0.00 0.0 0.0 622.1 414.9 0.0 414.9 395.7 12-2015 90.43 0.00 0.00 0.0 0.0 3693.1 11827.0 14420.0 -2593.0 -2528.7 12-2016 93.76 0.00 0.00 0.0 0.0 36701.3 141794.6 178231.3 -36436.6 -29601.8 12-2017 97.18 0.00 0.00 0.0 0.0 117368.1 458736.0 0.0 458736.0 328584.6 12-2018 100.70 0.00 0.00 0.0 0.0 93538.6 357961.3 0.0 357961.3 233202.7 12-2019 104.33 0.00 0.00 0.0 0.0 144399.8 559177.4 292137.0 267040.3 153245.2 12-2020 108.07 0.00 0.00 0.0 0.0 159913.5 625286.6 0.0 625286.6 336659.7 12-2021 111.92 0.00 0.00 0.0 0.0 63282.6 240428.2 0.0 240428.2 117680.5 12-2022 115.89 0.00 0.00 0.0 0.0 37099.5 134842.2 0.0 134842.2 60000.1 12-2023 119.97 0.00 0.00 0.0 0.0 29844.7 103024.5 0.0 103024.5 41674.9 12-2024 124.18 0.00 0.00 0.0 0.0 12857.0 42228.2 0.0 42228.2 15899.0 12-2025 12-2026 12-2027 12-2028 S TOT 104.63 0.00 0.00 0.0 0.0 699320.2 2675721.0 484788.2 2190932.5 1255211.9 AFTER 0.00 0.00 0.00 0.0 0.0 0.0 0.0 0.0 0.0 0.0 TOTAL 104.63 0.00 0.00 0.0 0.0 699320.2 2675721.0 484788.2 2190932.5 1255211.9 OIL GAS P.W. % P.W., M$ --------- --------- ------ -------- GROSS WELLS 126.0 0.0 LIFE, YRS. 10.50 5.00 1641776.750 GROSS ULT., MB & MMF 63163.078 78940.531 DISCOUNT % 10.00 10.00 1255211.875 GROSS CUM., MB & MMF 709.518 3181.867 UNDISCOUNTED PAYOUT, YRS. 0.00 15.00 976860.500 GROSS RES., MB & MMF 62453.562 75758.664 DISCOUNTED PAYOUT, YRS. 0.00 20.00 772322.188 NET RES., MB & MMF 32256.814 39266.578 UNDISCOUNTED NET/INVEST. 5.52 25.00 619259.250 NET REVENUE, M$ 3375041.250 0.000 DISCOUNTED NET/INVEST. 4.87 30.00 502822.062 INITIAL PRICE, $ 100.112 0.000 RATE-OF-RETURN, PCT. 100.00 40.00 342571.656 INITIAL N.I., PCT. 80.000 80.000 INITIAL W.I., PCT. 100.000 60.00 176539.719 80.00 100864.766 100.00 62063.840

RALPH E. DAVIS ASSOCIATES, INC. Texas Registered Engineering Firm F‐1529 Page | 94
GLOBAL ENERGY DEVELOPMENT PLC DATE : 08/27/2013 GRAND TOTAL TIME : 07:54:42 BOLIVAR BLOCK DBS : DEMO TOTAL PROBABLE RESERVES SETTINGS : RED123112 NEW BOLIVAR DEVELOPMENT PLAN JULY, 2013 SCENARIO : RED123112E R E S E R V E S A N D E C O N O M I C S AS OF DECEMBER 31, 2013 --END-- GROSS OIL GROSS GAS GROSS NGL NET OIL NET GAS NET NGL NET OIL NET GAS NET NGL TOTAL MO-YEAR PRODUCTION PRODUCTION PRODUCTION PRODUCTION PRODUCTION PRODUCTION REVENUE REVENUE REVENUE REVENUE ------- ---MBBLS--- ----MMCF--- ----MBBLS-- ---MBBLS-- ----MMCF-- ---MBBLS-- ---M$--- ---M$--- ---M$--- ----$--- 12-2014 0.0 0.0 0.0 0.0 0.0 0.0 0.0 0.0 0.0 0.0 12-2015 445.1 338.0 0.0 356.1 218.2 0.0 32205.5 0.0 0.0 32205.5 12-2016 1208.7 551.2 0.0 967.0 360.2 0.0 90662.1 0.0 0.0 90662.1 12-2017 7044.9 5080.1 0.0 5635.9 3289.6 0.0 547687.1 0.0 0.0 547687.1 12-2018 8266.1 6752.2 0.0 6612.9 4414.1 0.0 665931.4 0.0 0.0 665931.4 12-2019 5997.9 4934.4 0.0 4798.3 3237.7 0.0 500617.1 0.0 0.0 500617.1 12-2020 4489.5 3682.0 0.0 2451.6 1650.8 0.0 264944.7 0.0 0.0 264944.7 12-2021 3403.5 2767.5 0.0 928.5 619.7 0.0 103918.1 0.0 0.0 103918.1 12-2022 2604.3 2090.4 0.0 520.9 342.4 0.0 60362.4 0.0 0.0 60362.4 12-2023 2010.3 1586.1 0.0 402.1 259.2 0.0 48235.7 0.0 0.0 48235.7 12-2024 830.8 645.2 0.0 166.2 105.2 0.0 20633.7 0.0 0.0 20633.7 12-2025 12-2026 12-2027 12-2028 S TOT 36301.2 28427.1 0.0 22839.4 14497.3 0.0 2335198.2 0.0 0.0 2335198.2 AFTER 0.0 0.0 0.0 0.0 0.0 0.0 0.0 0.0 0.0 0.0 TOTAL 36301.2 28427.1 0.0 22839.4 14497.3 0.0 2335198.2 0.0 0.0 2335198.2 --END-- NET OIL NET GAS NET NGL SEVERANCE PROD & OTHER NET OPER OPERATING EQUITY UNDISC NET DISC NET MO-YEAR PRICE PRICE PRICE TAXES TAXES EXPENSES CASH FLOW INVESTMENT CASH FLOW CASH FLOW ------- ---$--- ---$--- ---$--- ------M$---- -----M$----- ----M$---- ----M$---- ----M$---- -----M$---- -----M$---- 12-2014 0.00 0.00 0.00 0.0 0.0 0.0 0.0 0.0 0.0 0.0 12-2015 90.43 0.00 0.00 0.0 0.0 6392.7 25812.8 14420.0 11392.8 9137.7 12-2016 93.76 0.00 0.00 0.0 0.0 17400.4 73261.7 0.0 73261.7 57005.8 12-2017 97.18 0.00 0.00 0.0 0.0 104745.6 442941.6 183578.1 259363.3 178847.3 12-2018 100.70 0.00 0.00 0.0 0.0 128393.8 537537.6 0.0 537537.6 350191.8 12-2019 104.33 0.00 0.00 0.0 0.0 97186.0 403431.1 0.0 403431.1 238931.8 12-2020 108.07 0.00 0.00 0.0 0.0 51924.5 213020.2 0.0 213020.2 114691.9 12-2021 111.92 0.00 0.00 0.0 0.0 20739.7 83178.4 0.0 83178.4 40712.7 12-2022 115.89 0.00 0.00 0.0 0.0 12413.1 47949.3 0.0 47949.3 21335.8 12-2023 119.97 0.00 0.00 0.0 0.0 10280.3 37955.4 0.0 37955.4 15353.5 12-2024 124.18 0.00 0.00 0.0 0.0 4529.5 16104.2 0.0 16104.2 6063.2 12-2025 12-2026 12-2027 12-2028 S TOT 102.24 0.00 0.00 0.0 0.0 454005.7 1881192.2 197998.1 1683193.9 1032271.4 AFTER 0.00 0.00 0.00 0.0 0.0 0.0 0.0 0.0 0.0 0.0 TOTAL 102.24 0.00 0.00 0.0 0.0 454005.7 1881192.2 197998.1 1683193.9 1032271.4 OIL GAS P.W. % P.W., M$ --------- --------- ------ -------- GROSS WELLS 53.0 26.0 LIFE, YRS. 10.50 5.00 1307344.000 GROSS ULT., MB & MMF 36301.195 28427.086 DISCOUNT % 10.00 10.00 1032271.312 GROSS CUM., MB & MMF 0.000 0.000 UNDISCOUNTED PAYOUT, YRS. 1.56 15.00 826984.812 GROSS RES., MB & MMF 36301.195 28427.086 DISCOUNTED PAYOUT, YRS. 1.58 20.00 671107.000 NET RES., MB & MMF 22839.371 14497.270 UNDISCOUNTED NET/INVEST. 9.50 25.00 550912.562 NET REVENUE, M$ 2335198.250 0.000 DISCOUNTED NET/INVEST. 8.03 30.00 456946.312 INITIAL PRICE, $ 96.386 0.000 RATE-OF-RETURN, PCT. 100.00 40.00 323025.406 INITIAL N.I., PCT. 80.000 80.000 INITIAL W.I., PCT. 100.000 60.00 176338.844 80.00 105345.625 100.00 67345.188

RALPH E. DAVIS ASSOCIATES, INC. Texas Registered Engineering Firm F‐1529 Page | 95
GLOBAL ENERGY DEVELOPMENT PLC DATE : 08/27/2013 GRAND TOTAL TIME : 08:06:17 BOLIVAR BLOCK DBS : DEMO TOTAL POSSIBLE RESERVES SETTINGS : RED123112 NEW BOLIVAR DEVELOPMENT PLAN JULY, 2013 SCENARIO : RED123112E R E S E R V E S A N D E C O N O M I C S AS OF DECEMBER 31, 2013 --END-- GROSS OIL GROSS GAS GROSS NGL NET OIL NET GAS NET NGL NET OIL NET GAS NET NGL TOTAL MO-YEAR PRODUCTION PRODUCTION PRODUCTION PRODUCTION PRODUCTION PRODUCTION REVENUE REVENUE REVENUE REVENUE ------- ---MBBLS--- ----MMCF--- ----MBBLS-- ---MBBLS-- ----MMCF-- ---MBBLS-- ---M$--- ---M$--- ---M$--- ----$--- 12-2014 249.6 35.3 0.0 199.7 0.0 0.0 17413.8 0.0 0.0 17413.8 12-2015 900.0 380.3 0.0 720.0 218.6 0.0 65114.0 0.0 0.0 65114.0 12-2016 3561.8 1646.2 0.0 2849.4 1029.1 0.0 267154.3 0.0 0.0 267154.3 12-2017 17427.8 10248.5 0.0 13942.2 6729.5 0.0 1354879.9 0.0 0.0 1354879.9 12-2018 38457.9 24202.6 0.0 30766.4 16313.6 0.0 3098236.2 0.0 0.0 3098236.2 12-2019 44015.9 24472.6 0.0 35210.0 16294.3 0.0 3673533.8 0.0 0.0 3673533.8 12-2020 48304.2 22511.8 0.0 26110.1 9246.4 0.0 2821737.2 0.0 0.0 2821737.2 12-2021 33062.3 14928.0 0.0 9070.4 3123.1 0.0 1015167.8 0.0 0.0 1015167.8 12-2022 24823.3 11279.2 0.0 4964.7 1744.6 0.0 575342.5 0.0 0.0 575342.5 12-2023 19705.3 9090.2 0.0 3941.1 1410.4 0.0 472821.8 0.0 0.0 472821.8 12-2024 7521.4 3954.4 0.0 1504.3 613.7 0.0 186802.9 0.0 0.0 186802.9 12-2025 12-2026 12-2027 12-2028 S TOT 238029.5 122749.0 0.0 129278.2 56723.2 0.0 13548205.0 0.0 0.0 13548205.0 AFTER 0.0 0.0 0.0 0.0 0.0 0.0 0.0 0.0 0.0 0.0 TOTAL 238029.5 122749.0 0.0 129278.2 56723.2 0.0 13548205.0 0.0 0.0 13548205.0 --END-- NET OIL NET GAS NET NGL SEVERANCE PROD & OTHER NET OPER OPERATING EQUITY UNDISC NET DISC NET MO-YEAR PRICE PRICE PRICE TAXES TAXES EXPENSES CASH FLOW INVESTMENT CASH FLOW CASH FLOW ------- ---$--- ---$--- ---$--- ------M$---- -----M$----- ----M$---- ----M$---- ----M$---- -----M$---- -----M$---- 12-2014 87.21 0.00 0.00 0.0 0.0 5279.3 12134.5 4700.0 7434.5 6769.1 12-2015 90.43 0.00 0.00 0.0 0.0 13694.8 51419.2 1751.0 49668.2 42006.1 12-2016 93.76 0.00 0.00 0.0 0.0 51929.3 215225.2 61001.7 154223.4 115520.8 12-2017 97.18 0.00 0.00 0.0 0.0 257898.2 1096981.4 338199.0 758781.8 531883.1 12-2018 100.70 0.00 0.00 0.0 0.0 585083.2 2513153.8 696690.2 1816463.6 1170917.0 12-2019 104.33 0.00 0.00 0.0 0.0 689504.8 2984029.8 292137.0 2691895.8 1582972.5 12-2020 108.07 0.00 0.00 0.0 0.0 527111.8 2294625.5 167167.3 2127456.5 1139432.4 12-2021 111.92 0.00 0.00 0.0 0.0 188743.1 826423.7 0.0 826423.7 404503.5 12-2022 115.89 0.00 0.00 0.0 0.0 106497.2 468845.7 0.0 468845.7 208620.1 12-2023 119.97 0.00 0.00 0.0 0.0 87141.7 385680.5 0.0 385680.5 156013.0 12-2024 124.18 0.00 0.00 0.0 0.0 34297.8 152505.0 0.0 152505.0 57418.2 12-2025 12-2026 12-2027 12-2028 S TOT 104.80 0.00 0.00 0.0 0.0 2547181.2 11001023.0 1561646.2 9439379.0 5416056.0 AFTER 0.00 0.00 0.00 0.0 0.0 0.0 0.0 0.0 0.0 0.0 TOTAL 104.80 0.00 0.00 0.0 0.0 2547181.2 11001023.0 1561646.2 9439379.0 5416056.0 OIL GAS P.W. % P.W., M$ --------- --------- ------ -------- GROSS WELLS 257.0 252.0 LIFE, YRS. 10.50 5.00 7083431.000 GROSS ULT., MB & MMF 238029.453 122749.023 DISCOUNT % 10.00 10.00 5416045.000 GROSS CUM., MB & MMF 0.000 0.000 UNDISCOUNTED PAYOUT, YRS. 0.39 15.00 4210706.500 GROSS RES., MB & MMF 238029.453 122749.023 DISCOUNTED PAYOUT, YRS. 0.41 20.00 3322703.250 NET RES., MB & MMF 129278.250 56723.184 UNDISCOUNTED NET/INVEST. 7.04 25.00 2657301.750 NET REVENUE, M$ 13548205.000 0.000 DISCOUNTED NET/INVEST. 6.30 30.00 2150998.500 INITIAL PRICE, $ 101.206 0.000 RATE-OF-RETURN, PCT. 100.00 40.00 1455173.125 INITIAL N.I., PCT. 80.000 80.000 INITIAL W.I., PCT. 97.964 60.00 739350.938 80.00 418233.188 100.00 256576.922

RALPH E. DAVIS ASSOCIATES, INC. Texas Registered Engineering Firm F‐1529 Page | 96
GLOBAL ENERGY DEVELOPMENT PLC DATE : 08/27/2013 GRAND TOTAL TIME : 07:54:28 BOLIVAR BLOCK DBS : DEMO TOTAL PROVED PRODUCING RESERVES SETTINGS : RED123112 NEW BOLIVAR DEVELOPMENT PLAN JULY, 2013 SCENARIO : RED123112E R E S E R V E S A N D E C O N O M I C S AS OF DECEMBER 31, 2013 --END-- GROSS OIL GROSS GAS GROSS NGL NET OIL NET GAS NET NGL NET OIL NET GAS NET NGL TOTAL MO-YEAR PRODUCTION PRODUCTION PRODUCTION PRODUCTION PRODUCTION PRODUCTION REVENUE REVENUE REVENUE REVENUE ------- ---MBBLS--- ----MMCF--- ----MBBLS-- ---MBBLS-- ----MMCF-- ---MBBLS-- ---M$--- ---M$--- ---M$--- ----$--- 12-2014 14.9 148.6 0.0 11.9 118.9 0.0 1037.0 0.0 0.0 1037.0 12-2015 13.4 133.8 0.0 10.7 107.0 0.0 967.8 0.0 0.0 967.8 12-2016 12.0 120.4 0.0 9.6 96.3 0.0 903.0 0.0 0.0 903.0 12-2017 10.8 108.4 0.0 8.7 86.7 0.0 842.4 0.0 0.0 842.4 12-2018 9.8 97.5 0.0 7.8 78.0 0.0 785.6 0.0 0.0 785.6 12-2019 8.8 87.8 0.0 7.0 70.2 0.0 732.5 0.0 0.0 732.5 12-2020 7.9 79.0 0.0 4.2 42.5 0.0 459.3 0.0 0.0 459.3 12-2021 7.1 71.1 0.0 1.9 19.1 0.0 214.0 0.0 0.0 214.0 12-2022 6.4 64.0 0.0 1.3 12.8 0.0 148.3 0.0 0.0 148.3 12-2023 1.5 15.0 0.0 0.3 3.0 0.0 35.9 0.0 0.0 35.9 12-2024 12-2025 12-2026 12-2027 12-2028 S TOT 92.5 925.5 0.0 63.5 634.6 0.0 6125.9 0.0 0.0 6125.9 AFTER 0.0 0.0 0.0 0.0 0.0 0.0 0.0 0.0 0.0 0.0 TOTAL 92.5 925.5 0.0 63.5 634.6 0.0 6125.9 0.0 0.0 6125.9 --END-- NET OIL NET GAS NET NGL SEVERANCE PROD & OTHER NET OPER OPERATING EQUITY UNDISC NET DISC NET MO-YEAR PRICE PRICE PRICE TAXES TAXES EXPENSES CASH FLOW INVESTMENT CASH FLOW CASH FLOW ------- ---$--- ---$--- ---$--- ------M$---- -----M$----- ----M$---- ----M$---- ----M$---- -----M$---- -----M$---- 12-2014 87.21 0.00 0.00 0.0 0.0 434.1 602.9 0.0 602.9 575.0 12-2015 90.44 0.00 0.00 0.0 0.0 447.1 520.7 0.0 520.7 451.5 12-2016 93.76 0.00 0.00 0.0 0.0 460.5 442.5 0.0 442.5 348.8 12-2017 97.18 0.00 0.00 0.0 0.0 474.4 368.0 0.0 368.0 263.7 12-2018 100.70 0.00 0.00 0.0 0.0 488.6 297.0 0.0 297.0 193.5 12-2019 104.33 0.00 0.00 0.0 0.0 503.2 229.3 0.0 229.3 135.8 12-2020 108.07 0.00 0.00 0.0 0.0 345.6 113.7 0.0 113.7 61.2 12-2021 111.92 0.00 0.00 0.0 0.0 178.0 36.1 0.0 36.1 17.7 12-2022 115.89 0.00 0.00 0.0 0.0 137.5 10.8 0.0 10.8 4.8 12-2023 119.97 0.00 0.00 0.0 0.0 35.4 0.5 0.0 0.5 0.2 12-2024 12-2025 12-2026 12-2027 12-2028 S TOT 96.54 0.00 0.00 0.0 0.0 3504.3 2621.5 0.0 2621.5 2052.3 AFTER 0.00 0.00 0.00 0.0 0.0 0.0 0.0 0.0 0.0 0.0 TOTAL 96.54 0.00 0.00 0.0 0.0 3504.3 2621.5 0.0 2621.5 2052.3 OIL GAS P.W. % P.W., M$ --------- --------- ------ -------- GROSS WELLS 1.0 0.0 LIFE, YRS. 9.25 5.00 2303.559 GROSS ULT., MB & MMF 802.064 4107.329 DISCOUNT % 10.00 10.00 2052.285 GROSS CUM., MB & MMF 709.518 3181.867 UNDISCOUNTED PAYOUT, YRS. 0.00 15.00 1850.147 GROSS RES., MB & MMF 92.546 925.462 DISCOUNTED PAYOUT, YRS. 0.00 20.00 1684.932 NET RES., MB & MMF 63.456 634.560 UNDISCOUNTED NET/INVEST. 0.00 25.00 1547.970 NET REVENUE, M$ 6125.867 0.000 DISCOUNTED NET/INVEST. 0.00 30.00 1432.981 INITIAL PRICE, $ 87.210 0.000 RATE-OF-RETURN, PCT. 100.00 40.00 1251.557 INITIAL N.I., PCT. 80.000 80.000 INITIAL W.I., PCT. 100.000 60.00 1010.547 80.00 859.173 100.00 755.732

RALPH E. DAVIS ASSOCIATES, INC. Texas Registered Engineering Firm F‐1529 Page | 97
GLOBAL ENERGY DEVELOPMENT PLC DATE : 08/27/2013 GRAND TOTAL TIME : 07:54:37 BOLIVAR BLOCK DBS : DEMO TOTAL PROVED UNDEVELOPED RESERVES SETTINGS : RED123112 NEW BOLIVAR DEVELOPMENT PLAN JULY, 2013 SCENARIO : RED123112E R E S E R V E S A N D E C O N O M I C S AS OF DECEMBER 31, 2013 --END-- GROSS OIL GROSS GAS GROSS NGL NET OIL NET GAS NET NGL NET OIL NET GAS NET NGL TOTAL MO-YEAR PRODUCTION PRODUCTION PRODUCTION PRODUCTION PRODUCTION PRODUCTION REVENUE REVENUE REVENUE REVENUE ------- ---MBBLS--- ----MMCF--- ----MBBLS-- ---MBBLS-- ----MMCF-- ---MBBLS-- ---M$--- ---M$--- ---M$--- ----$--- 12-2014 0.0 0.0 0.0 0.0 0.0 0.0 0.0 0.0 0.0 0.0 12-2015 201.1 241.4 0.0 160.9 193.1 0.0 14552.3 0.0 0.0 14552.3 12-2016 2367.7 2841.3 0.0 1894.2 2273.0 0.0 177593.0 0.0 0.0 177593.0 12-2017 7399.6 8879.5 0.0 5919.7 7103.6 0.0 575261.7 0.0 0.0 575261.7 12-2018 5594.6 6713.6 0.0 4475.7 5370.9 0.0 450714.2 0.0 0.0 450714.2 12-2019 8420.8 10104.9 0.0 6736.6 8083.9 0.0 702844.7 0.0 0.0 702844.7 12-2020 13287.2 15944.6 0.0 7261.4 8713.6 0.0 784740.6 0.0 0.0 784740.6 12-2021 9924.0 11908.8 0.0 2711.7 3254.0 0.0 303496.8 0.0 0.0 303496.8 12-2022 7412.1 8894.5 0.0 1482.4 1778.9 0.0 171793.4 0.0 0.0 171793.4 12-2023 5536.0 6643.2 0.0 1107.2 1328.6 0.0 132833.3 0.0 0.0 132833.3 12-2024 2217.9 2661.5 0.0 443.6 532.3 0.0 55085.2 0.0 0.0 55085.2 12-2025 12-2026 12-2027 12-2028 S TOT 62361.0 74833.2 0.0 32193.4 38632.0 0.0 3368915.2 0.0 0.0 3368915.2 AFTER 0.0 0.0 0.0 0.0 0.0 0.0 0.0 0.0 0.0 0.0 TOTAL 62361.0 74833.2 0.0 32193.4 38632.0 0.0 3368915.2 0.0 0.0 3368915.2 --END-- NET OIL NET GAS NET NGL SEVERANCE PROD & OTHER NET OPER OPERATING EQUITY UNDISC NET DISC NET MO-YEAR PRICE PRICE PRICE TAXES TAXES EXPENSES CASH FLOW INVESTMENT CASH FLOW CASH FLOW ------- ---$--- ---$--- ---$--- ------M$---- -----M$----- ----M$---- ----M$---- ----M$---- -----M$---- -----M$---- 12-2014 0.00 0.00 0.00 0.0 0.0 188.0 -188.0 0.0 -188.0 -179.3 12-2015 90.43 0.00 0.00 0.0 0.0 3246.0 11306.3 14420.0 -3113.7 -2980.2 12-2016 93.76 0.00 0.00 0.0 0.0 36240.8 141352.2 178231.3 -36879.0 -29950.6 12-2017 97.18 0.00 0.00 0.0 0.0 116893.7 458368.0 0.0 458368.0 328320.9 12-2018 100.70 0.00 0.00 0.0 0.0 93050.0 357664.2 0.0 357664.2 233009.2 12-2019 104.33 0.00 0.00 0.0 0.0 143896.5 558948.1 292137.0 266811.0 153109.4 12-2020 108.07 0.00 0.00 0.0 0.0 159567.9 625172.8 0.0 625172.8 336598.4 12-2021 111.92 0.00 0.00 0.0 0.0 63104.6 240392.1 0.0 240392.1 117662.9 12-2022 115.89 0.00 0.00 0.0 0.0 36962.0 134831.3 0.0 134831.3 59995.3 12-2023 119.97 0.00 0.00 0.0 0.0 29809.3 103024.0 0.0 103024.0 41674.7 12-2024 124.18 0.00 0.00 0.0 0.0 12857.0 42228.2 0.0 42228.2 15899.0 12-2025 12-2026 12-2027 12-2028 S TOT 104.65 0.00 0.00 0.0 0.0 695815.9 2673099.2 484788.2 2188311.0 1253159.6 AFTER 0.00 0.00 0.00 0.0 0.0 0.0 0.0 0.0 0.0 0.0 TOTAL 104.65 0.00 0.00 0.0 0.0 695815.9 2673099.2 484788.2 2188311.0 1253159.6 OIL GAS P.W. % P.W., M$ --------- --------- ------ -------- GROSS WELLS 125.0 0.0 LIFE, YRS. 10.50 5.00 1639473.250 GROSS ULT., MB & MMF 62361.020 74833.211 DISCOUNT % 10.00 10.00 1253159.500 GROSS CUM., MB & MMF 0.000 0.000 UNDISCOUNTED PAYOUT, YRS. 3.09 15.00 975010.375 GROSS RES., MB & MMF 62361.020 74833.211 DISCOUNTED PAYOUT, YRS. 3.10 20.00 770637.188 NET RES., MB & MMF 32193.357 38632.023 UNDISCOUNTED NET/INVEST. 5.51 25.00 617711.312 NET REVENUE, M$ 3368915.250 0.000 DISCOUNTED NET/INVEST. 4.86 30.00 501389.062 INITIAL PRICE, $ 100.121 0.000 RATE-OF-RETURN, PCT. 100.00 40.00 341320.062 INITIAL N.I., PCT. 80.000 80.000 INITIAL W.I., PCT. 100.000 60.00 175529.172 80.00 100005.594 100.00 61308.109

RALPH E. DAVIS ASSOCIATES, INC. Texas Registered Engineering Firm F‐1529 Page | 98
GLOBAL ENERGY DEVELOPMENT PLC DATE : 08/27/2013 GRAND TOTAL TIME : 07:54:42 BOLIVAR BLOCK DBS : DEMO TOTAL PROBABLE UNDEVELOPED RESERVES SETTINGS : RED123112 NEW BOLIVAR DEVELOPMENT PLAN JULY, 2013 SCENARIO : RED123112E R E S E R V E S A N D E C O N O M I C S AS OF DECEMBER 31, 2013 --END-- GROSS OIL GROSS GAS GROSS NGL NET OIL NET GAS NET NGL NET OIL NET GAS NET NGL TOTAL MO-YEAR PRODUCTION PRODUCTION PRODUCTION PRODUCTION PRODUCTION PRODUCTION REVENUE REVENUE REVENUE REVENUE ------- ---MBBLS--- ----MMCF--- ----MBBLS-- ---MBBLS-- ----MMCF-- ---MBBLS-- ---M$--- ---M$--- ---M$--- ----$--- 12-2014 0.0 0.0 0.0 0.0 0.0 0.0 0.0 0.0 0.0 0.0 12-2015 445.1 338.0 0.0 356.1 218.2 0.0 32205.5 0.0 0.0 32205.5 12-2016 1208.7 551.2 0.0 967.0 360.2 0.0 90662.1 0.0 0.0 90662.1 12-2017 7044.9 5080.1 0.0 5635.9 3289.6 0.0 547687.1 0.0 0.0 547687.1 12-2018 8266.1 6752.2 0.0 6612.9 4414.1 0.0 665931.4 0.0 0.0 665931.4 12-2019 5997.9 4934.4 0.0 4798.3 3237.7 0.0 500617.1 0.0 0.0 500617.1 12-2020 4489.5 3682.0 0.0 2451.6 1650.8 0.0 264944.7 0.0 0.0 264944.7 12-2021 3403.5 2767.5 0.0 928.5 619.7 0.0 103918.1 0.0 0.0 103918.1 12-2022 2604.3 2090.4 0.0 520.9 342.4 0.0 60362.4 0.0 0.0 60362.4 12-2023 2010.3 1586.1 0.0 402.1 259.2 0.0 48235.7 0.0 0.0 48235.7 12-2024 830.8 645.2 0.0 166.2 105.2 0.0 20633.7 0.0 0.0 20633.7 12-2025 12-2026 12-2027 12-2028 S TOT 36301.2 28427.1 0.0 22839.4 14497.3 0.0 2335198.2 0.0 0.0 2335198.2 AFTER 0.0 0.0 0.0 0.0 0.0 0.0 0.0 0.0 0.0 0.0 TOTAL 36301.2 28427.1 0.0 22839.4 14497.3 0.0 2335198.2 0.0 0.0 2335198.2 --END-- NET OIL NET GAS NET NGL SEVERANCE PROD & OTHER NET OPER OPERATING EQUITY UNDISC NET DISC NET MO-YEAR PRICE PRICE PRICE TAXES TAXES EXPENSES CASH FLOW INVESTMENT CASH FLOW CASH FLOW ------- ---$--- ---$--- ---$--- ------M$---- -----M$----- ----M$---- ----M$---- ----M$---- -----M$---- -----M$---- 12-2014 0.00 0.00 0.00 0.0 0.0 0.0 0.0 0.0 0.0 0.0 12-2015 90.43 0.00 0.00 0.0 0.0 6392.7 25812.8 14420.0 11392.8 9137.7 12-2016 93.76 0.00 0.00 0.0 0.0 17400.4 73261.7 0.0 73261.7 57005.8 12-2017 97.18 0.00 0.00 0.0 0.0 104745.6 442941.6 183578.1 259363.3 178847.3 12-2018 100.70 0.00 0.00 0.0 0.0 128393.8 537537.6 0.0 537537.6 350191.8 12-2019 104.33 0.00 0.00 0.0 0.0 97186.0 403431.1 0.0 403431.1 238931.8 12-2020 108.07 0.00 0.00 0.0 0.0 51924.5 213020.2 0.0 213020.2 114691.9 12-2021 111.92 0.00 0.00 0.0 0.0 20739.7 83178.4 0.0 83178.4 40712.7 12-2022 115.89 0.00 0.00 0.0 0.0 12413.1 47949.3 0.0 47949.3 21335.8 12-2023 119.97 0.00 0.00 0.0 0.0 10280.3 37955.4 0.0 37955.4 15353.5 12-2024 124.18 0.00 0.00 0.0 0.0 4529.5 16104.2 0.0 16104.2 6063.2 12-2025 12-2026 12-2027 12-2028 S TOT 102.24 0.00 0.00 0.0 0.0 454005.7 1881192.2 197998.1 1683193.9 1032271.4 AFTER 0.00 0.00 0.00 0.0 0.0 0.0 0.0 0.0 0.0 0.0 TOTAL 102.24 0.00 0.00 0.0 0.0 454005.7 1881192.2 197998.1 1683193.9 1032271.4 OIL GAS P.W. % P.W., M$ --------- --------- ------ -------- GROSS WELLS 53.0 26.0 LIFE, YRS. 10.50 5.00 1307344.000 GROSS ULT., MB & MMF 36301.195 28427.086 DISCOUNT % 10.00 10.00 1032271.312 GROSS CUM., MB & MMF 0.000 0.000 UNDISCOUNTED PAYOUT, YRS. 1.56 15.00 826984.812 GROSS RES., MB & MMF 36301.195 28427.086 DISCOUNTED PAYOUT, YRS. 1.58 20.00 671107.000 NET RES., MB & MMF 22839.371 14497.270 UNDISCOUNTED NET/INVEST. 9.50 25.00 550912.562 NET REVENUE, M$ 2335198.250 0.000 DISCOUNTED NET/INVEST. 8.03 30.00 456946.312 INITIAL PRICE, $ 96.386 0.000 RATE-OF-RETURN, PCT. 100.00 40.00 323025.406 INITIAL N.I., PCT. 80.000 80.000 INITIAL W.I., PCT. 100.000 60.00 176338.844 80.00 105345.625 100.00 67345.188

RALPH E. DAVIS ASSOCIATES, INC. Texas Registered Engineering Firm F‐1529 Page | 99
GLOBAL ENERGY DEVELOPMENT PLC DATE : 08/27/2013 GRAND TOTAL TIME : 07:54:42 BOLIVAR BLOCK DBS : DEMO TOTAL POSSIBLE NON-PRODUCING RESERVES SETTINGS : RED123112 NEW BOLIVAR DEVELOPMENT PLAN JULY, 2013 SCENARIO : RED123112E R E S E R V E S A N D E C O N O M I C S AS OF DECEMBER 31, 2013 --END-- GROSS OIL GROSS GAS GROSS NGL NET OIL NET GAS NET NGL NET OIL NET GAS NET NGL TOTAL MO-YEAR PRODUCTION PRODUCTION PRODUCTION PRODUCTION PRODUCTION PRODUCTION REVENUE REVENUE REVENUE REVENUE ------- ---MBBLS--- ----MMCF--- ----MBBLS-- ---MBBLS-- ----MMCF-- ---MBBLS-- ---M$--- ---M$--- ---M$--- ----$--- 12-2014 249.6 35.3 0.0 199.7 0.0 0.0 17413.8 0.0 0.0 17413.8 12-2015 171.3 37.8 0.0 137.1 0.0 0.0 12396.0 0.0 0.0 12396.0 12-2016 105.2 21.6 0.0 84.1 0.0 0.0 7889.4 0.0 0.0 7889.4 12-2017 78.0 15.6 0.0 62.4 0.0 0.0 6063.1 0.0 0.0 6063.1 12-2018 62.7 12.4 0.0 50.2 0.0 0.0 5050.8 0.0 0.0 5050.8 12-2019 52.8 10.3 0.0 42.2 0.0 0.0 4404.4 0.0 0.0 4404.4 12-2020 45.8 8.9 0.0 24.7 0.0 0.0 2666.6 0.0 0.0 2666.6 12-2021 40.5 7.8 0.0 10.9 0.0 0.0 1220.9 0.0 0.0 1220.9 12-2022 36.4 7.0 0.0 7.3 0.0 0.0 842.9 0.0 0.0 842.9 12-2023 32.7 6.3 0.0 6.5 0.0 0.0 785.3 0.0 0.0 785.3 12-2024 15.1 2.9 0.0 3.0 0.0 0.0 375.4 0.0 0.0 375.4 12-2025 12-2026 12-2027 12-2028 S TOT 890.1 165.9 0.0 628.1 0.0 0.0 59108.6 0.0 0.0 59108.6 AFTER 0.0 0.0 0.0 0.0 0.0 0.0 0.0 0.0 0.0 0.0 TOTAL 890.1 165.9 0.0 628.1 0.0 0.0 59108.6 0.0 0.0 59108.6 --END-- NET OIL NET GAS NET NGL SEVERANCE PROD & OTHER NET OPER OPERATING EQUITY UNDISC NET DISC NET MO-YEAR PRICE PRICE PRICE TAXES TAXES EXPENSES CASH FLOW INVESTMENT CASH FLOW CASH FLOW ------- ---$--- ---$--- ---$--- ------M$---- -----M$----- ----M$---- ----M$---- ----M$---- -----M$---- -----M$---- 12-2014 87.21 0.00 0.00 0.0 0.0 5279.3 12134.5 4700.0 7434.5 6769.1 12-2015 90.43 0.00 0.00 0.0 0.0 3555.9 8840.1 0.0 8840.1 7665.4 12-2016 93.76 0.00 0.00 0.0 0.0 2374.7 5514.7 0.0 5514.7 4347.2 12-2017 97.18 0.00 0.00 0.0 0.0 1884.6 4178.4 0.0 4178.4 2994.4 12-2018 100.70 0.00 0.00 0.0 0.0 1612.3 3438.5 0.0 3438.5 2240.1 12-2019 104.33 0.00 0.00 0.0 0.0 1439.5 2964.9 0.0 2964.9 1755.9 12-2020 108.07 0.00 0.00 0.0 0.0 887.9 1778.7 0.0 1778.7 957.7 12-2021 111.92 0.00 0.00 0.0 0.0 414.8 806.1 0.0 806.1 394.6 12-2022 115.89 0.00 0.00 0.0 0.0 292.8 550.0 0.0 550.0 244.8 12-2023 119.97 0.00 0.00 0.0 0.0 278.6 506.7 0.0 506.7 205.0 12-2024 124.18 0.00 0.00 0.0 0.0 135.0 240.4 0.0 240.4 90.5 12-2025 12-2026 12-2027 12-2028 S TOT 94.11 0.00 0.00 0.0 0.0 18155.6 40953.0 4700.0 36253.0 27664.4 AFTER 0.00 0.00 0.00 0.0 0.0 0.0 0.0 0.0 0.0 0.0 TOTAL 94.11 0.00 0.00 0.0 0.0 18155.6 40953.0 4700.0 36253.0 27664.4 OIL GAS P.W. % P.W., M$ --------- --------- ------ -------- GROSS WELLS 2.0 0.0 LIFE, YRS. 10.50 5.00 31420.404 GROSS ULT., MB & MMF 890.061 165.942 DISCOUNT % 10.00 10.00 27664.443 GROSS CUM., MB & MMF 0.000 0.000 UNDISCOUNTED PAYOUT, YRS. 0.39 15.00 24675.227 GROSS RES., MB & MMF 890.061 165.942 DISCOUNTED PAYOUT, YRS. 0.41 20.00 22247.049 NET RES., MB & MMF 628.083 0.000 UNDISCOUNTED NET/INVEST. 8.71 25.00 20239.406 NET REVENUE, M$ 59108.598 0.000 DISCOUNTED NET/INVEST. 6.97 30.00 18553.736 INITIAL PRICE, $ 87.210 0.000 RATE-OF-RETURN, PCT. 100.00 40.00 15884.166 INITIAL N.I., PCT. 80.000 0.000 INITIAL W.I., PCT. 100.000 60.00 12286.337 80.00 9967.760 100.00 8342.006

RALPH E. DAVIS ASSOCIATES, INC. Texas Registered Engineering Firm F‐1529 Page | 100
GLOBAL ENERGY DEVELOPMENT PLC DATE : 08/27/2013 GRAND TOTAL TIME : 07:55:12 BOLIVAR BLOCK DBS : DEMO TOTAL POSSIBLE UNDEVELOPED RESERVES SETTINGS : RED123112 NEW BOLIVAR DEVELOPMENT PLAN JULY, 2013 SCENARIO : RED123112E R E S E R V E S A N D E C O N O M I C S AS OF DECEMBER 31, 2013 --END-- GROSS OIL GROSS GAS GROSS NGL NET OIL NET GAS NET NGL NET OIL NET GAS NET NGL TOTAL MO-YEAR PRODUCTION PRODUCTION PRODUCTION PRODUCTION PRODUCTION PRODUCTION REVENUE REVENUE REVENUE REVENUE ------- ---MBBLS--- ----MMCF--- ----MBBLS-- ---MBBLS-- ----MMCF-- ---MBBLS-- ---M$--- ---M$--- ---M$--- ----$--- 12-2014 0.0 0.0 0.0 0.0 0.0 0.0 0.0 0.0 0.0 0.0 12-2015 728.7 342.5 0.0 582.9 218.6 0.0 52718.0 0.0 0.0 52718.0 12-2016 3456.6 1624.6 0.0 2765.3 1029.1 0.0 259264.9 0.0 0.0 259264.9 12-2017 17349.8 10232.9 0.0 13879.8 6729.5 0.0 1348816.9 0.0 0.0 1348816.9 12-2018 38395.2 24190.2 0.0 30716.2 16313.6 0.0 3093185.5 0.0 0.0 3093185.5 12-2019 43963.1 24462.3 0.0 35167.8 16294.3 0.0 3669129.2 0.0 0.0 3669129.2 12-2020 48258.4 22502.9 0.0 26085.5 9246.4 0.0 2819070.5 0.0 0.0 2819070.5 12-2021 33021.8 14920.2 0.0 9059.5 3123.1 0.0 1013946.9 0.0 0.0 1013946.9 12-2022 24786.9 11272.2 0.0 4957.4 1744.6 0.0 574499.7 0.0 0.0 574499.7 12-2023 19672.6 9083.9 0.0 3934.5 1410.4 0.0 472036.5 0.0 0.0 472036.5 12-2024 7506.3 3951.5 0.0 1501.3 613.7 0.0 186427.5 0.0 0.0 186427.5 12-2025 12-2026 12-2027 12-2028 S TOT 237139.4 122583.1 0.0 128650.2 56723.2 0.0 13489095.0 0.0 0.0 13489095.0 AFTER 0.0 0.0 0.0 0.0 0.0 0.0 0.0 0.0 0.0 0.0 TOTAL 237139.4 122583.1 0.0 128650.2 56723.2 0.0 13489095.0 0.0 0.0 13489095.0 --END-- NET OIL NET GAS NET NGL SEVERANCE PROD & OTHER NET OPER OPERATING EQUITY UNDISC NET DISC NET MO-YEAR PRICE PRICE PRICE TAXES TAXES EXPENSES CASH FLOW INVESTMENT CASH FLOW CASH FLOW ------- ---$--- ---$--- ---$--- ------M$---- -----M$----- ----M$---- ----M$---- ----M$---- -----M$---- -----M$---- 12-2014 0.00 0.00 0.00 0.0 0.0 0.0 0.0 0.0 0.0 0.0 12-2015 90.43 0.00 0.00 0.0 0.0 10138.8 42579.2 1751.0 40828.2 34340.8 12-2016 93.76 0.00 0.00 0.0 0.0 49554.6 209710.5 61001.7 148708.7 111173.6 12-2017 97.18 0.00 0.00 0.0 0.0 256013.6 1092803.0 338199.0 754603.4 528888.7 12-2018 100.70 0.00 0.00 0.0 0.0 583470.9 2509715.2 696690.2 1813025.1 1168677.0 12-2019 104.33 0.00 0.00 0.0 0.0 688065.2 2981065.0 292137.0 2688931.0 1581216.5 12-2020 108.07 0.00 0.00 0.0 0.0 526223.9 2292846.8 167167.3 2125677.8 1138474.6 12-2021 111.92 0.00 0.00 0.0 0.0 188328.3 825617.6 0.0 825617.6 404108.9 12-2022 115.89 0.00 0.00 0.0 0.0 106204.4 468295.7 0.0 468295.7 208375.3 12-2023 119.97 0.00 0.00 0.0 0.0 86863.1 385173.9 0.0 385173.9 155808.0 12-2024 124.18 0.00 0.00 0.0 0.0 34162.8 152264.6 0.0 152264.6 57327.7 12-2025 12-2026 12-2027 12-2028 S TOT 104.85 0.00 0.00 0.0 0.0 2529025.8 10960071.0 1556946.2 9403126.0 5388391.0 AFTER 0.00 0.00 0.00 0.0 0.0 0.0 0.0 0.0 0.0 0.0 TOTAL 104.85 0.00 0.00 0.0 0.0 2529025.8 10960071.0 1556946.2 9403126.0 5388391.0 OIL GAS P.W. % P.W., M$ --------- --------- ------ -------- GROSS WELLS 255.0 252.0 LIFE, YRS. 10.50 5.00 7052010.500 GROSS ULT., MB & MMF 237139.422 122583.086 DISCOUNT % 10.00 10.00 5388380.000 GROSS CUM., MB & MMF 0.000 0.000 UNDISCOUNTED PAYOUT, YRS. 1.04 15.00 4186031.000 GROSS RES., MB & MMF 237139.422 122583.086 DISCOUNTED PAYOUT, YRS. 1.04 20.00 3300456.500 NET RES., MB & MMF 128650.172 56723.184 UNDISCOUNTED NET/INVEST. 7.04 25.00 2637062.250 NET REVENUE, M$ 13489095.000 0.000 DISCOUNTED NET/INVEST. 6.30 30.00 2132445.000 INITIAL PRICE, $ 101.255 0.000 RATE-OF-RETURN, PCT. 100.00 40.00 1439288.875 INITIAL N.I., PCT. 80.000 80.000 INITIAL W.I., PCT. 97.957 60.00 727064.625 80.00 408265.406 100.00 248234.891

RALPH E. DAVIS ASSOCIATES, INC. Texas Registered Engineering Firm F‐1529 Page | 101
Production Plots

RALPH E. DAVIS ASSOCIATES, INC. Texas Registered Engineering Firm F‐1529 Page | 102

RALPH E. DAVIS ASSOCIATES, INC. Texas Registered Engineering Firm F‐1529 Page | 103

RALPH E. DAVIS ASSOCIATES, INC. Texas Registered Engineering Firm F‐1529 Page | 104
Contract Information

RALPH E. DAVIS ASSOCIATES, INC. Texas Registered Engineering Firm F‐1529 Page | 105

RALPH E. DAVIS ASSOCIATES, INC. Texas Registered Engineering Firm F‐1529 Page | 106

RALPH E. DAVIS ASSOCIATES, INC. Texas Registered Engineering Firm F‐1529 Page | 107
Appendix

RALPH E. DAVIS ASSOCIATES, INC. Texas Registered Engineering Firm F‐1529 Page | 108
August, 2013 Moving Drilling TotalEXPENDITURE ITEM CODE 4 Days 20 Days 24 Days
Unit CostROAD & LOCATION 301 150,000 150,000
Civil works 150,000INSURANCE 302 30,000 30,000
EstimatedENVIRONMENTAL 303 5,000 5,000COMMUNITY AID 304 5,000 5,000RIGHT OF WAY AND DAMAGES 306SOLIDS AND FLUIDS TREATMENT 307 100,000 100,000MOBILIZATION / DEMOBILIZATION (RIG) 308 202,143 202,143
Lump Sum Cost 202,143DRILLING RIG 311 560,000 560,000WORKOVER RIG, SWABING UNIT, POWER SWIVEL 312QA/QC 315 27,000 27,000WATER SUPPLIES 316 5,000 10,000 15,000
Tanker Truck 5,000 10,000MUD, DRILLING FLUID & MUD ENGINEERING 318 165,000 165,000
Completion fluidBITS 319 30,000 30,000CORING 321DRILL STEM TESTS / CASED HOLE TESTS 322ELECTRIC LOGGING (OPEN HOLE) 323 99,000 99,000
MUD LOGGING & WELLSITE GEOLOGIST 324 0 0CEMENT AND CEMENTING SERVICES 325 100,000 100,000FISHING TOOLS AND SERVICES 328DIRECTIONAL SERVICES 329 175,000 175,000EQUIPMENT RENTALS & SERVICES 330 30,000 30,000COMMUNICATIONS 331 1,000 1,000 2,000
Mobile Phone Service 1,000 1,000LAND TRANSPORTATION 332 2,750 5,000 7,750
Pick Up 2,750 5,000OIL TRANSPORTATION 333HELICOPTERS / AIRCRAFT RENTAL. AIR TICKETS. 334 2,000 2,000
Air Tickets 2,000POTENTIAL TESTS, PRESSURE SURVEYS 335SECURITY 336 2,000 20,000 22,000PERFORATING 337ACIDIZING/FRACTURING/ESTIMULATION 338GRAVEL PACK AND SAND CONSOLIDATION 340SUPERVISION - CONTRACT 341 7,333 36,667 44,000
Drilling Site Manager 7,333 36,667PROJECT MANAGEMENT 342 6,000 13,000 19,000
Drilling Manager 5,000 10,000Drilling & Workover Engineer 1,000 3,000
MISCELLANEOUS LABOR AND EXPENSES 343 4,000 20,000 24,000Patio Hands & Waitress 4,000 20,000
PLUG AND ABANDONMENT 344 0
CAMP & CATERING 345 10,000 27,000 37,000Meals 10,000 27,000
MISCELLANEOUS SUPPLIES 346 5,000 10,000 15,00010,000
BHA & RIG INSPECTION 347 10,000 10,000Surface & Production Casing inspection 10,000
TOTAL INTANGIBLE COST 397,226 1,421,667 1,875,893CASING:SURFACE AND PRODUCTION CASING 354 70,000 344,200
13-3/8¨ Surface Casing 66,000Casing Accesories 4,000
9-5/8¨ Production Casing 259,200Casing Accesories 15,000
TUBING, PUP AND BLAST JOINTS (3-1/2") 355Tubing
DOWNHOLE EQUIPMENT (Mechanical Pump) 358Stator + rotor +Anchor
DOWN HOLE COMPLETION EQUIPMENT 360Sucker Rods X 25 ft each X 8000 ft + Polished rod
GRAVEL PACK EQUIPMENT 361CHRISTMAS TREE AND WELLHEAD EQUIPMENT 362 15,000 15,000
FLOWLINES, VALVES, METERS AND CONNECTIONS 3674" flow line and construction
SURFACE POWER EQUIPMENT 378OTHER SURFACE EQUIPMENT 382
TOTAL TANGIBLE COST 0 85,000 359,200SUB-TOTAL WELL COST 2,235,093
Contingency (5%) 111,755IVA 16% 375,496
TOTAL WELL COST 2,722,343
Prepared by: Diana C. Oicatá Chica
Revised : Rodolfo Rivera
COLOMBIA ENERGY DEVELOPMENT
Drilling cost estimate for development well in Bolivar
Bolivar Block
Vertical Well Cost for Five Formation Stacked Pay

RALPH E. DAVIS ASSOCIATES, INC. Texas Registered Engineering Firm F‐1529 Page | 109
Aug, 2013 Moving Drilling Moving Completion TotalEXPENDITURE ITEM CODE 4 Days 20 Days 2 Days 20 Days 22 Days
ROAD & LOCATION 301 20,000 20,000Civil works 20,000
INSURANCE 302Estimated
ENVIRONMENTAL 303 0COMMUNITY AID 304 0RIGHT OF WAY AND DAMAGES 306SOLIDS AND FLUIDS TREATMENT 307 0MOBILIZATION / DEMOBILIZATION (DRILLING RIG) 308 0 0
Lump Sum Cost 0MOBILIZATION / DEMOBILIZATION (WORKOVER RIG) 308 101,071 101,071
Lump Sum Cost 101,071DRILLING RIG 311 0WORKOVER RIG, SWABING UNIT, POWER SWIVEL 312 231,022 231,022FUEL AND LUBRICANTS 315QA/QC 316 0 0 27,000 27,000
Tanker Truck 27,000MUD, DRILLING FLUID & MUD ENGINEERING 318 10,000 10,000
Completion fluid 10,000BITS 319 0CORING 321DRILL STEAM TESTS / CASED HOLE TESTS 322ELECTRIC LOGGING (OPEN & CASED HOLE) 323 45,000 45,000
MUD LOGGING & WELLSITE GEOLOGIST 324 0CEMENT AND CEMENTING SERVICES 325 0FISHING TOOLS AND SERVICES 328TANKS 329 74,074 74,074EQUIPMENT RENTALS & SERVICES 330 30,000 30,000COMMUNICATIONS 331 0 0 250 250 500
Mobile Phone Service 250 250LAND TRANSPORTATION 332 0 0 1,250 5,000 6,250
Pick Up 1,250 5,000OIL TRANSPORTATION 333HELICOPTERS / AIRCRAFT RENTAL. AIR TICKETS. 334 0 0
Air Tickets 0POTENTIAL TESTS, PRESSURE SURVEYS 335SECURITY 336 2,000 10,000 12,000PERFORATING 337 150,000 150,000ACIDIZING/FRACTURING/ESTIMULATION 338 1,900,000 1,900,000GRAVEL PACK AND SAND CONSOLIDATION 340SUPERVISION - CONTRACT 341 0 0 3,667 36,667 40,333
Drilling Site Manager 3,667 36,667PROJECT MANAGEMENT 342 0 0 3,000 7,000 10,000
Drilling Manager 2,000 5,000Drilling & Workover Engineer 1,000 2,000
MISCELLANEOUS LABOR AND EXPENSES 343 0 0 2,000 20,000 22,000Patio Hands & Waitress 2,000 20,000
PLUG AND ABANDONMENT 344
CAMP & CATERING 345 0 0 2,500 15,000 17,500Meals 2,500 15,000
MISCELLANEOUS SUPPLIES 346 10,000 10,00010,000
BHA & RIG INSPECTION 347 0 5,000 0Surface - Production Casing & Tubing inspection 5,000
TOTAL INTANGIBLE COST 20,000 0 2,344,991 2,706,751CASING:SURFACE AND PRODUCTION CASING 354 0 0
13-3/8¨ Surface Casing 0Casing Accesories 0
9-5/8¨ Production Casing 0Casing Accesories 0
TUBING, PUP AND BLAST JOINTS (3-1/2") 355 49,584 49,5843-1/2¨ Tubing 49,584
DOWNHOLE EQUIPMENT (Dual Completion) 358 700,000 700,000DOWN HOLE COMPLETION EQUIPMENT 360GRAVEL PACK EQUIPMENT 361CHRISTMAS TREE AND WELLHEAD EQUIPMENT 362 50,000 50,000
FLOWLINES, VALVES, METERS AND CONNECTIONS 3674" flow line and construction
SURFACE POWER EQUIPMENT 378OTHER SURFACE EQUIPMENT 382
TOTAL TANGIBLE COST 0 0 799,584 799,584SUB-TOTAL WELL COST 3,506,335
Contingency (5%) 175,317IVA 16% 589,064
TOTAL WELL COST 4,270,716Prepared by: Diana C. Oicatá Chica
Revised: Rodolfo Rivera
COLOMBIA ENERGY DEVELOPMENT
Cost estimate for a development well in Bolivar - Completion w/ Workover Rig
Río Verde Block
TOTAL COMPLETED WELL COST = $6,993,059

RALPH E. DAVIS ASSOCIATES, INC. Texas Registered Engineering Firm F‐1529 Page | 110

RALPH E. DAVIS ASSOCIATES, INC. Texas Registered Engineering Firm F‐1529 Page | 111
Olivo 2 ‐ Preliminary Frac Design

RALPH E. DAVIS ASSOCIATES, INC. Texas Registered Engineering Firm F‐1529 Page | 112
Olivo 2 Well Bore Schematic

RALPH E. DAVIS ASSOCIATES, INC. Texas Registered Engineering Firm F‐1529 Page | 113
Ryvol Oil Reservoir Volumetric Data Sheets
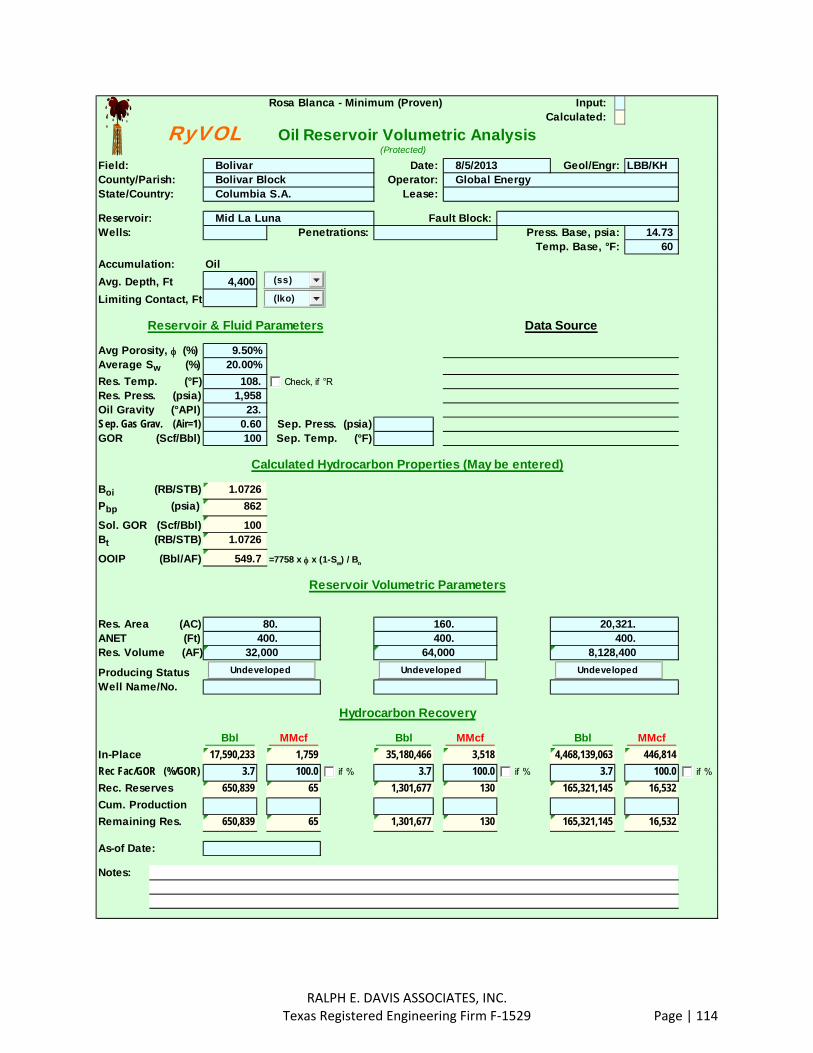
RALPH E. DAVIS ASSOCIATES, INC. Texas Registered Engineering Firm F‐1529 Page | 114
Rosa Blanca - Minimum (Proven) Input: Calculated:
(Protected)
Field: Date: Geol/Engr: LBB/KHCounty/Parish: Operator: State/Country: Lease:
Reservoir: Fault Block: Wells: Penetrations: Press. Base, psia: 14.73
Temp. Base, °F: 60
Accumulation: Oil
Avg. Depth, Ft 4,400
Limiting Contact, Ft
Avg Porosity, (%)Average Sw (%)
Res. Temp. (°F)Res. Press. (psia)Oil Gravity (°API)Sep. Gas Grav. (Air=1) Sep. Press. (psia)GOR (Scf/Bbl) Sep. Temp. (°F)
Calculated Hydrocarbon Properties (May be entered)
Boi (RB/STB)
Pbp (psia)
Sol. GOR (Scf/Bbl)Bt (RB/STB)
OOIP (Bbl/AF) =7758 x x (1-Sw) / Bo
Reservoir Volumetric Parameters
Res. Area (AC)ANET (Ft)Res. Volume (AF)
Producing StatusWell Name/No.
Hydrocarbon Recovery
Bbl MMcf Bbl MMcf Bbl MMcf
In-Place 17,590,233 1,759 35,180,466 3,518 4,468,139,063 446,814
Rec Fac/GOR (%/GOR) 3.7 100.0 3.7 100.0 3.7 100.0
Rec. Reserves 650,839 65 1,301,677 130 165,321,145 16,532
Cum. Production
Remaining Res. 650,839 65 1,301,677 130 165,321,145 16,532
As-of Date:
Notes:
Bolivar
Reservoir & Fluid Parameters
8/5/2013
Mid La Luna
Oil Reservoir Volumetric Analysis
Data Source
862
100
9.50%
108. 1,958
Columbia S.A.
20.00%
Bolivar Block Global Energy
549.7
23. 0.60 100
1.0726
1.0726
400. 8,128,400
80. 400.
32,000
160. 400.
64,000
20,321.
RyVOL
(ss)
(lko)
Undeveloped Undeveloped Undeveloped
Check, if °R
if % if % if %

RALPH E. DAVIS ASSOCIATES, INC. Texas Registered Engineering Firm F‐1529 Page | 115

RALPH E. DAVIS ASSOCIATES, INC. Texas Registered Engineering Firm F‐1529 Page | 116
POSSIBLE Input: Calculated:
(Protected)
Field: Date: Geol/Engr: AKCounty/Parish: Operator: State/Country: Lease:
Reservoir: Fault Block: Wells: Penetrations: Press. Base, psia: 14.73
Temp. Base, °F: 60
Accumulation: Oil
Avg. Depth, Ft
Limiting Contact, Ft
Avg Porosity, (%)Average Sw (%)
Res. Temp. (°F)Res. Press. (psia)Oil Gravity (°API)Sep. Gas Grav. (Air=1) Sep. Press. (psia)GOR (Scf/Bbl) Sep. Temp. (°F)
Calculated Hydrocarbon Properties (May be entered)
Boi (RB/STB)
Pbp (psia)
Sol. GOR (Scf/Bbl)Bt (RB/STB)
OOIP (Bbl/AF) =7758 x x (1-Sw) / Bo
Reservoir Volumetric Parameters
Total 3P Possible OnlyRes. Area (AC)ANET (Ft)Res. Volume (AF)
Producing StatusWell Name/No.
Hydrocarbon Recovery
Bbl MMcf Bbl MMcf Bbl MMcf
In-Place ######### 255,055 73,832,657 88,599
Rec Fac/GOR (%/GOR) 17.0 1,200.0 17.0 1,200.0
Rec. Reserves 36,132,837 43,359 12,551,552 15,062
Cum. Production
Remaining Res. 36,132,837 43,359 12,551,552 15,062
As-of Date:
Notes:
78.5 214,305
1.1041
7,859. 78.5
616,932
2,730.
2.2453
2/16/2009Bolivar Block Global EnergyBolivar
Salada - Average Well
Columbia S.A.
344.5
Oil Reservoir Volumetric Analysis
Data Source
12,284
120
11.80% 15.50%
120. 2,168
Reservoir & Fluid Parameters
14. 0.60 1200
*Warning: In-place Oil and Gas volumeshave been adjusted for "free gas". This isstrictly an approximation. Users shouldconsider adjusting the input GOR orperforming separate oil and gas calculations.
RyVOL
(ss)
(lko)
Undeveloped Undeveloped Undeveloped
Check, if °R
if % if % if %

RALPH E. DAVIS ASSOCIATES, INC. Texas Registered Engineering Firm F‐1529 Page | 117

RALPH E. DAVIS ASSOCIATES, INC. Texas Registered Engineering Firm F‐1529 Page | 118
Input: Calculated:
(Protected)
Field: Date: Geol/Engr: LBB/khCounty/Parish: Operator: State/Country: Lease:
Reservoir: Fault Block: Wells: Penetrations: Press. Base, psia: 14.73
Temp. Base, °F: 60
Accumulation: Oil
Avg. Depth, Ft 5,850
Limiting Contact, Ft
Avg Porosity, (%)Average Sw (%)
Res. Temp. (°F)Res. Press. (psia)Oil Gravity (°API)Sep. Gas Grav. (Air=1) Sep. Press. (psia)GOR (Scf/Bbl) Sep. Temp. (°F)
Calculated Hydrocarbon Properties (May be entered)
Boi (RB/STB)
Pbp (psia)
Sol. GOR (Scf/Bbl)Bt (RB/STB)
OOIP (Bbl/AF) =7758 x x (1-Sw) / Bo
Reservoir Volumetric Parameters
Potential Resource Potential Resource Potential ResourceRes. Area (AC)ANET (Ft)Res. Volume (AF)
Producing StatusWell Name/No.
Hydrocarbon Recovery
Bbl MMcf Bbl MMcf Bbl MMcf
In-Place 3,361,689 3,362 6,723,378 6,723 853,911,046 853,911
Rec Fac/GOR (%/GOR) 3.7 1,000.0 3.7 1,000.0 3.7 1,000.0
Rec. Reserves 124,382 124 248,765 249 31,594,709 31,595
Cum. Production
Remaining Res. 124,382 124 248,765 249 31,594,709 31,595
As-of Date:
Notes:
Bolivar
Reservoir & Fluid Parameters
8/5/2013
Tablazo
Oil Reservoir Volumetric Analysis
Data Source
4,690
525
8.00%
150. 2,724
Columbia S.A.
20.00%
Bolivar Block Global Energy
280.1
36. 0.60 1000
1.3082
1.7724
150. 3,048,150
80. 150.
12,000
160. 150.
24,000
20,321.
RyVOL
(ss)
(lko)
Undeveloped Undeveloped Undeveloped
Check, if °R
if % if % if %