boletín de american meteorological society (tornados)
TRANSCRIPT
AMERICANMETEOROLOGICALSOCIETY
Bulletin of the American Meteorological Society
EARLY ONLINE RELEASEThis is a preliminary PDF of the author-producedmanuscript that has been peer-reviewed and accepted for publication. Since it is being postedso soon after acceptance, it has not yet beencopyedited, formatted, or processed by AMSPublications. This preliminary version of the manuscript may be downloaded, distributed, andcited, but please be aware that there will be visualdifferences and possibly some content differences between this version and the final published version.
The DOI for this manuscript is doi: 10.1175/BAMS-D-12-00147.1
The final published version of this manuscript will replacethe preliminary version at the above DOI once it is available.
© 2013 American Meteorological Society
1
The Tornado Warning Process: A Review of Current Research, Challenges, and Opportunities 1
2
3
J. Brotzge and W. Donner 4
5
6
7
8
9
10
Capsule Summary 11
12
An interdisciplinary review of the Integrated Warning System – prediction, detection, warning 13
decision, warning dissemination, and public response – identifies challenges and new 14
opportunities for improving the tornado warning process. 15
16
17
18
19
20
21
22
23
24
25
2
Abstract 1
2 With the unusually violent tornado season of 2011, there's been a renewed national interest, 3
through such programs as NOAA's Weather Ready Nation initiative, to reevaluate and improve 4
our tornado warning process. This literature review provides an interdisciplinary, end-to-end 5
examination of the tornado warning process. Following the steps outlined by the Integrated 6
Warning System, current research in tornado prediction and detection, the warning decision 7
process, warning dissemination, and public response are reviewed, and some of the major 8
challenges for improving each stage are highlighted. The progress and challenges in multi-day 9
to short-term tornado prediction are discussed, followed by an examination of tornado detection, 10
focused primarily upon the contributions made by weather radar and storm spotters. Next is a 11
review of the warning decision process and the challenges associated with dissemination of the 12
warning, followed by a discussion of the complexities associated with understanding public 13
response. Finally, several research opportunities are considered, with emphases on 14
understanding acceptable risk, greater community and personal preparation, and personalization 15
of the hazard risk. 16
17
18
19
20
21
22
23
3
One of the scientific community’s greatest achievements in meteorology during the 20th
1
century has been the development of a largely effective public tornado warning system. 2
Between 1912 and 1936, tornadoes killed an average 260 persons per year, about 1.8 deaths per 3
million people when normalized by population (Brooks and Doswell 2001). Between 1975 and 4
2000, that number had declined to 54 deaths per year, or 0.12 deaths per million people in 2000 5
(Brooks and Doswell 2001), a reduction of 93% from 1925. In 1986 tornado warning lead time 6
was ~ 5 minutes with only 25% of tornadoes warned; by 2004, mean lead time was 13 minutes 7
with about 75% of tornadoes warned (Erickson and Brooks 2006). 8
The creation of such a comprehensive, national tornado warning system has, however, come 9
at a cost. Over the past several decades, billions of taxpayer dollars have been spent on 10
infrastructure and research to improve our ability to predict, detect, and warn tornadoes. 11
Millions more dollars have been invested by local communities in warning systems to alert the 12
public and encourage a proper sheltering response. With these investments, hundreds of deaths 13
and thousands of injuries have been prevented (Simmons and Sutter 2005), and yet as the 553 14
tornado fatalities from 2011 have demonstrated (Carbin 2012), the current tornado warning 15
system occasionally is still ineffective in preventing significant loss of life. One purpose of this 16
paper is to identify gaps in the warning process where additional targeted research and 17
investment could contribute to a more robust and ultimately more effective warning system. 18
Far from simple, the tornado warning process is a complex chain of events, encompassing 19
institutional action and individual responses, that utilizes sensing technologies, conceptual 20
models, numerical weather prediction (NWP), forecaster and emergency management (EM) 21
decision-making, warning dissemination technologies, and public experience and education (Fig. 22
1). The sequential steps of this process – forecast, detection, warning decision, dissemination, 23
4
and public response - are known as the Integrated Warning System (IWS) (Leik et al. 1981; 1
Doswell et al. 1999). 2
This manuscript reviews the end-to-end tornado warning process and related research, 3
considers the challenges to improving the current system, and explores possible next steps. 4
While this article cannot provide a completely comprehensive review of all research in each 5
specific area, the goal is to provide a broad overview of the tornado warning process and a brief 6
summary of the many avenues of research that could contribute to improvements in the current 7
system. 8
9
TORNADO PREDICTION 10
11
The ability to predict a tornado’s precise path and intensity days in advance could allow for 12
evacuation to take place well ahead of storm development and the pre-deployment of assets 13
needed to support emergency response and recovery. While restrained to less accurate forecasts 14
by the inherent limitations imposed by atmospheric predictability, the last decade has seen a 15
growing recognition of the connection between large-scale patterns and large-scale tornado 16
outbreaks. 17
As high-resolution, convection-allowing (≤ 4 km grid resolution) NWP becomes more 18
accurate at longer time scales, multivariate model output may be used to a greater extent in 19
identifying and predicting tornado outbreak events. Using observational and modeling analysis, 20
Egentowich et al. (2000a, b, c) identified a series of dynamic precursors during the 6 – 84 hours 21
preceding a major tornado outbreak. Shafer et al. (2009) found that Weather Research and 22
Forecasting (WRF) model output could be used to discriminate between tornadic and 23
5
nontornadic events up to three days in advance. Using WRF simulation output, Mercer et al. 1
(2009) developed a statistical objective analysis technique to extract relevant predictive 2
variables, yielding statistically significant accuracy scores > 0.7 and skill scores > 0.5 of these 3
variables one day in advance of storm formation (Shafer et al. 2010). 4
Ever faster computer processing, increasing memory and storage capacities, combined with 5
advances in parallel computing and code efficiency now enable the routine use of mesoscale 6
forecast ensembles at high-resolution hours or even days in advance. Furthermore, analysis of 7
model ensembles provide insight into forecast uncertainty. Stensrud and Weiss (2002) 8
demonstrated that even a relatively coarse (32 km inner grid), small 6-member ensemble, while 9
underdispersive, provided some statistical guidance in predicting the relative locations of 10
expected severe weather 24-hours in advance. Clark et al. (2010) have since shown that the use 11
of convection-allowing resolutions improves the representation and prediction of severe weather 12
features. As a predictive measure of storm severity, Clark et al. (2012) extracted proxy forecasts 13
of tornado path lengths from 36-hour ensemble forecasts. 14
One official National Weather Service (NWS) product to alert local weather forecast offices, 15
emergency personnel, and the public of favorable conditions for tornadoes to occur is the 16
tornado watch. First issued by the Severe Local Storms Forecast Unit (SELS, now the Storm 17
Prediction Center (SPC)) in 17 March 1952 (Galway 1975), the tornado watch is a manually 18
generated product, based upon NWP output and observations, and may be issued up to several 19
hours in advance of initial convective initiation. The skill level of the tornado watch has 20
continued to improve over the years with increased observations, refined conceptual models, and 21
more accurate and higher resolution NWP (Pearson and Weiss 1979; Ostby 1999). Two 22
additional, increasingly popular products issued by SPC are the Convective Outlooks and 23
6
Mesoscale Convective Discussions (MCDs) (Stough et al. 2012). Convective Outlooks are 1
issued up to eight days in advance, highlighting areas of the country with the potential for severe 2
weather. MCDs are used to highlight general areas of concern, often issued just hours ahead of 3
convective initiation or just prior to issuance of a watch. Both Convective Outlooks and MCDs 4
are comprised of a discussion briefing and visual map and provide additional lead-time and 5
probabilistic information. 6
Currently, all official NWS tornado warnings are issued based upon “detections”, where an 7
immediate tornado threat is observed either directly by spotters and media or inferred from 8
observations (e.g., radar). However, as the accuracy and precision of short-term (0 – 3 hr) storm 9
predictions continue to improve, model output is expected to become an increasingly important 10
basis upon which to issue NWS tornado warnings. This is the eventual goal of “Warn-on-11
Forecast” (Stensrud et al. 2009), where NWS tornado warnings may be issued based not only on 12
detected tornadoes or observed precursors, but also based upon model output. Utilizing model 13
output as the basis for some warnings could theoretically extend lead time to tornadogenesis. 14
Significant advances in computer processing, the utilization of new types and greater 15
numbers of real-time weather observations (NRC 2009), and the development and adoption of 16
new data assimilation (DA) techniques (Kalnay 2003; Park and Xu 2009) are making Warn-on-17
Forecast a reality. Computer processing capabilities continue increasing at an exponential rate, 18
as predicted by Moore’s Law (Moore 1965). Faster processing permits higher-resolution NWP, 19
which allows for the direct use of convective-resolving physics, bypassing less accurate 20
parameterization schemes. The use of new observations, such as dual-polarimetric radar (e.g., 21
Jung et al. 2008), wind and temperature profilers (e.g., Otkin et al. 2011), data from aircraft (e.g., 22
ACARS; Benjamin et al. 1991), lightning (Fierro et al. 2012), and new evolving mobile 23
7
platforms (e.g., Mahoney et al. 2010) facilitate a more accurate, three-dimensional analysis of the 1
initial conditions. Model initialization also has been made easier with greater access to real-time 2
observations through the use of such systems as CRAFT (Kelleher et al. 2007), MADIS (Miller 3
et al. 2007), and THREDDS (Unidata 2012). 4
5
<SIDEBAR #1 – PREDICTION CHALLENGES> 6
7
TORNADO DETECTION 8
9
Weather radar is the primary tool used by warning forecasters to identify areas of potential 10
tornado development. Radar reflectivity provides forecasters with a clear view of tornadic 11
features, such as the hook echo (Markowski 2002), and Doppler radial velocity shows horizontal 12
wind shear, sometimes an early indicator of tornado formation (Brown et al. 1971). Radar 13
polarimetric data provide storm microphysical information, such as hydrometeor type and shape, 14
that can be used to identify areas of significant low-level wind shear (referred to as ZDR arcs) and 15
tornado debris (Ryzhkov et al. 2005; Bodine et al. 2013). 16
To better standardize weather radar coverage across the U.S., the national Weather 17
Surveillance Radar-1988 Doppler (WSR-88D) radar network (known as Next Generation 18
Weather Radar (NEXRAD); Crum and Alberty 1993; Crum et al. 1993; Crum et al. 1998) was 19
deployed (Whiton et al. 1998). The WSR-88D scanning geometry was designed to facilitate 20
complete coverage between 610 m (2000 ft) and ~18 km (60,000 ft) AGL, with minimum height 21
coverage at or below 610 m within a range of 102 km from radar (Leone et al. 1989); the final 22
network provided contiguous coverage across the U.S. at 3.05 km (10,000 ft) and above (Crum 23
8
and Alberty 1993). Specific radar site locations were chosen based primarily upon population 1
distribution, severe weather climatology, topography, and proximity to other radars; most radars 2
were sited to provide coverage over and slightly upwind of major metropolitan areas (Leone et 3
al. 1989). As of 2012, 160 WSR-88D (S-band) radar systems comprised the NEXRAD network 4
across the U.S. and territories. 5
NEXRAD deployment had an immediate and significant positive impact on tornado warning 6
statistics (Polger et al. 1994; NRC 1995). Bieringer and Ray (1996) found PODs increased by 10 7
- 15% and warning lead times increased by several minutes after installation of the WSR-88D 8
network. Analyzing all tornadoes in the CONUS between 1986 and 1999, Simmons and Sutter 9
(2005) estimated that the deployment of NEXRAD increased the percentage of tornadoes warned 10
from 35.0% to 59.7%, increased lead time from 5.3 to 9.5 minutes, reduced the FAR from 78.6% 11
to 76.0%, and reduced expected fatalities and injuries by 45% and 40%, respectively. Smith 12
(1999), however, noted that verification procedures changed as the NEXRAD system was 13
deployed, possibly accounting for some of the observed increase in the POD. 14
For enhanced tornado detection, automated detection algorithms, such as the WSR-88D 15
Mesocyclone (MDA; Stumpf et al. 1998) and Tornado Detection Algorithm (TDA; Mitchell et 16
al. 1998), automatically identify radar-based tornado features and are displayed in real-time 17
within AWIPS. Radar data can be combined with additional weather information to linearly 18
project storm motion and extrapolate mesocyclone, tornado and hail core movement (e.g., Smith 19
and Elmore 2004; Lakshmanan et al. 2007; Wang et al. 2008; Ortega et al. 2009; Lakshmanan 20
and Smith 2010; Miller et al. 2013). 21
Storm reports from individuals in the field can provide timely, critical information to warning 22
officials. Trained “storm spotters” provide a valuable service to the NWS, EMs, and media by 23
9
providing reliable, real-time information on storm evolution and tornado development (Moller 1
1978; McCarthy 2002). As well documented by Doswell et al. (1999), storm spotter networks 2
were first organized during World War II largely to protect military installations. By the mid-3
1960s, spotter groups were organized more formally by the Weather Bureau for more general use 4
under its SKYWARN program. With the advent of cell phone and embedded camera 5
technology, widespread access to the Internet, television station helicopters, volunteer and 6
professional storm chasers and the rise of social media, warning forecasters now have greater 7
access to real-time information than ever before. 8
Nearly as important, spotters provide much-needed post-event verification; Brotzge and 9
Erickson (2010) found a systematic increase in the numbers of weak tornadoes verified over 10
densely populated counties when compared with rural counties. However, erroneous reports 11
from the field can impede the warning process; Smith (1999) describes how poor tornado 12
verification overinflates tornado POD and overestimates the FAR. Brotzge et al. (2011) found 13
very high FAR in high population density counties and very low FAR in sparsely populated 14
counties, perhaps indicative of lower warning rates across rural areas due to the prevalence (or 15
lack) of field reports available and a subsequent decrease in forecaster confidence for warning in 16
those areas. 17
18
<SIDEBAR #2 – DETECTION CHALLENGES> 19
20
TORNADO WARNING DECISION 21
22
10
Once the formation of a tornado is considered likely or is reported already in progress, the 1
NWS issues a tornado warning, the official NWS product used to warn the public of a tornado. 2
The first tornado warning was issued on 25 March, 1948, by Air Force Officers E. Fawbush and 3
R. Miller at Tinker Air Force Base in Oklahoma City and which was remarkably successful 4
(Miller and Crisp 1999a; Maddox and Crisp 1999). In fact, this first warning was so successful 5
that it provided the scientific underpinning for establishment of the Air Weather Service Severe 6
Weather Warning Center (SWWC), the first national severe weather warning program. During 7
its first year of operation in 1951, the SWWC issued 156 (multi-county) tornado warnings, of 8
which 102 (65%) verified (Miller and Crisp 1999b). Since that time, tornado warnings, now 9
issued by the local NWS Weather Forecast Offices (WFOs), have continued to improve as 10
measured by the total percentage of tornadoes warned. 11
The final decision by the operational forecaster on whether or not to issue a warning is based 12
upon a number of complex, sometimes competing factors. These factors may include 13
environmental data, access to real-time weather and storm spotter information, forecaster 14
experience, knowledge, distance of event from nearest radar, population density, population 15
vulnerability, tornado climatology, event anticipation, SPC guidance, and/or storm history. The 16
interpretation of such data may be impacted by such things as personal fatigue, office staffing, 17
and inter-office relationships. Andra et al. (2002) provides an excellent case study of warning 18
decision-making during the 3 May 1999 tornado outbreak in central Oklahoma. 19
Despite the difficulty of each decision, the warning forecaster strives to warn on every 20
tornado, with as much lead time as possible, while minimizing the number of false alarm 21
warnings. Having every tornado warned is essential for public safety; the public is much more 22
likely to take shelter once they’ve received an official warning (Balluz et al. 2000). However, 23
11
there is an incentive to keep the warning area size small; the use of smaller warning polygons is 1
estimated to save over $1.9 billion annually in reduced interruption and unnecessary sheltering 2
(Sutter and Erickson 2010). County-based tornado warnings were replaced with storm-based 3
warning polygons in 2007. 4
As of 2011, the national tornado POD was 0.75, with a mean lead time of 14.6 min, and a 5
FAR of 0.74 (NOAA 2011a). A review of the long-term trends in these statistics reveals that the 6
POD and mean lead time have increased dramatically since the installation of the WSR-88D 7
network and NWS modernization program (Friday 1994), with a POD of 0.48 and a mean lead 8
time of 7.6 min in 1994. However, nearly all of this increase in lead time was a direct result of 9
greater numbers of tornadoes being warned (Erickson and Brooks 2006); all tornadoes not 10
warned were assigned a lead time of zero, and then included in calculation of the mean lead time. 11
Using data between 1986 and 2004, Erickson and Brooks recalculated tornado lead time without 12
the missed tornadoes included and found a rather steady lead time of around 18.5 min. While 13
greater numbers of tornadoes are being warned in advance (possibly due to improved radar 14
technology, conceptual models, and training), lead time on warned tornadoes has not increased, 15
and the FAR has remained steady at around 0.75 as well. 16
17
<SIDEBAR #3 – WARNING DECISION CHALLENGES> 18
19
WARNING DISSEMINATION 20
21
Warning the public remains difficult in large part because the “public” is a largely diverse 22
population with tremendous variation in education, physical abilities, family support, and 23
12
situational awareness. To overcome these challenges, a variety of communication alert systems 1
are used. Warnings may reach the public directly from the NWS through NOAA Weather Radio 2
(NWR) and the Internet, or indirectly through media, emergency management, and private sector 3
weather providers. Widely adopted following the April 1974 tornado outbreak (Coleman et al. 4
2011), NWR allows for an in-home method for waking a person from sleep in case of an 5
emergency through its alert tone. Today, over 1,000 NWR transmitters offer 98% national 6
coverage (Zubrick 2010). The NWS also provides direct information to the general public via 7
the Internet with some WFOs now experimenting with social media to distribute warning 8
information. 9
The public most commonly receives tornado warnings from local media through television 10
and radio (e.g., Hammer and Schmidlin 2002). Media utilize a host of methods to catch viewer’s 11
attention and to convey the necessary information, including the use of “cut-ins,” “crawlers,” 12
mobile phone apps, Facebook and Twitter (Coleman et al. 2011). Storm video and radar imagery 13
provide greater spatial and temporal information regarding storm size, severity, storm motion, 14
and geographic impact. Video media also more easily convey non-verbal cues from the TV 15
meteorologist. Indeed, research demonstrates that local populations often develop profound 16
psychological commitments to specific weather stations or forecasters (Sherman-Morris 2006). 17
Television broadcasts are often simulcast over the radio but without the benefit of the images. 18
Emergency managers also play a critical role in disseminating weather information to the 19
local community. As part of their responsibilities, EMs operate local warning systems, such as 20
local outdoor warning sirens or Reverse 911 systems, and coordinate disaster response and 21
recovery efforts. An instant messaging service called NWSChat was created to facilitate direct 22
communication between the NWS and EMs and to better support EM services. However, there 23
13
are few consistent criteria applied across jurisdictions for warning dissemination. A number of 1
meteorological (e.g., presence of a wall cloud) and non-weather related (e.g., public backlash for 2
issuing false alarms) factors influence the judgment of EMs on whether or not to activate 3
warning systems (Sorensen and Mileti 1987; Stewart and Lusk 1994; Donner 2008). 4
5
<SIDEBAR #4 – WARNING DISSEMINATION CHALLENGES> 6
7
PUBLIC RESPONSE 8
9
Warning dissemination sets into motion a process of public response, a complex and 10
multidimensional activity. While research on risk and warning response has been conducted 11
since the 1950s, it was not until the 1990s that scholars began to systematize findings into a 12
general model. Mileti and Sorensen (1990) and Lindell and Perry (1992) shared the common 13
conclusion that warning response was not a single act, but a set of stages through which the 14
public progressed in responding to disseminated warnings. Before taking action, the public must 15
receive, understand, believe, confirm, and personalize warnings. 16
17
Reception 18
Community members receive warning information through formal and informal channels. 19
Formal communication includes NWS, media, emergency management, Reverse 911 or any 20
official warning system. Informal communication includes family, friends, and co-workers. 21
Each form of communication channels warning information to the public, but each does so in 22
dramatically different ways. Formal communication tends to reach members of upper- and 23
14
middle-class populations, while informal communication often better serves the poor, ethnic 1
minorities, and recent migrants. For instance, warnings issued during the 1987 Saragosa, TX, 2
tornadoes failed to reach local Hispanic populations (Aguirre 1988; Ahlborn and Franc 2012). 3
Latinos prefer friends and family as sources of warning information (Peguero 2006) and receive 4
tornado warning information from informal networks (Donner 2007). Poorer populations also 5
were less likely to receive formal warnings (Schmidlin and King 1997). 6
Social networks may play a key role in reception. For instance, Nagarajan et al. (2012) 7
documented the importance of warning dissemination among neighbors in a series of computer 8
simulations. Frequent interaction of family members (Lardry and Rogers 1982), strong 9
community or network involvement (Turner et al. 1979; Sorensen and Gersmehl 1980; Perry and 10
Greene 1983; Rogers and Nehnevajsa 1987; Rogers and Sorensen 1991), regular association with 11
a subculture or voluntary association (Perry et al. 1981), and more frequent community 12
interaction (Scanlon and Frizzell 1979) improved the likelihood of message reception among 13
individuals within the community. 14
15
Understanding 16
How recipients understand and make sense of warning information is deeply connected to 17
human psychology and past experience. With the exception of Quarantelli (1980), research 18
overwhelmingly demonstrates that long-term residents generally tend to hold a better 19
understanding of warning information (Haas et al. 1977; Foster 1980; Perry and Greene 1983; 20
Perry and Lindell 1986; Blanchard-Boehm 1998). Psychologically, the public is more likely to 21
understand warning information if conveyed along with local information and maps (Berry 22
1999). Multiple warning sources increase chances of comprehension (Mileti and Darlington 23
15
1995), while at the same time, excessive information within a single message may lead to higher 1
rates of misunderstanding (DiGiovanni et al. 2002). Probability information attached to tornado 2
warnings (e.g., the tornado has a 30% chance of occurring), for instance, may confuse rather than 3
clarify risks for the public (Morss et al. 2010). 4
One concern is whether individuals understand the difference between warnings and watches. 5
In a study of Austin, TX, residents, Schultz et al. (2010) found that 90% of the sample could 6
adequately distinguish between watches and warnings. Other studies found similar rates of 7
understanding (Balluz 2000; Legates and Biddle 1999), while others encountered more modest 8
results (Mitchem 2003). Still other research suggests much lower rates of comprehension. In a 9
broad survey of 769 residents across Texas, Oklahoma, and California, only 58% of all 10
participants correctly understood the difference between a watch and a warning, though the 11
percentage improved among residents in Oklahoma and Texas and among older and more 12
educated survey participants (Powell and O’Hair 2008). 13
Social scientists have identified a number of social and cultural factors that account for 14
variation in warning comprehension between individuals. Education is consistently associated 15
with greater understanding (Turner et al. 1979), and those with a greater familiarity with science 16
and scientific concepts generally hold a stronger understanding of warnings (Blanchard-Boehm 17
1998). Age, too, shows a direct correlation with understanding (Turner et al. 1979; Blanchard-18
Boehm 1998). 19
20
Belief 21
After understanding a warning message, the recipient evaluates the credibility of the 22
message. Will there really be a tornado or is the warning a false alarm? In other words, should 23
16
the message be taken seriously? Rarely, however, at this stage do recipients arrive at a concrete 1
conclusion about whether a tornado will or will not occur. On the contrary, recipients crudely 2
evaluate the probability of severe weather. The psychological qualities, past experiences, and 3
unique demographic characteristics of the individual play a significant role in shaping these 4
judgments of likelihood. 5
Those closer to a hazard are more likely to believe a warning (Diggory 1956; Sorensen 6
1982), which may be because of the greater likelihood of experiencing environmental cues 7
(Drabek 1969; Quarantelli 1980; Sorensen 1982; Tierney 1987; Mileti and Fitzpatrick 1993; 8
Hammer and Schmidlin 2002). Additional psychological processes also may play a significant 9
role in the process of believing warnings. There are mixed findings regarding whether certain 10
sources are more or less believable. Some research shows the public places greater faith in 11
“official sources” (e.g., NWS warnings) (Li 1991; Drabek 1994), whereas other studies routinely 12
demonstrate “unofficial sources” (e.g., family) to hold greater credibility among the communities 13
(Sorensen 1982; Perry 1983; Li 1991). It may be that the particular source may play a lesser role 14
in credibility when compared to source familiarity. Warning sources to which individuals are 15
personally or emotionally attached (e.g., a favorite weather forecaster) or with which they are 16
more familiar may appear more credible (Mileti and Fitzpatrick 1993). 17
Demographic factors have some influence, as well. Women appear more likely to believe 18
warnings (Drabek 1969; Farley et al. 1993; Sherman-Morris 2010). Why this is the case may be 19
explained through socialization, as well as the fact that women tend to be caregivers (Perry 20
1983). Additionally, the higher one’s socioeconomic class, the more likely one is to believe a 21
warning (Sorensen 1982; Perry 1987). Finally, a society’s culture may also play a role in 22
warning response. Finding the Japanese more likely than U.S. residents to respond to volcano 23

17
warnings, Perry and Hirose (1991) explain that Japanese live within a “collectivist culture in 1
which citizens have higher expectations that authorities will provide care in the event of disasters 2
or other disruptions in social life.” Perry and Hirose suggest that the Japanese population has 3
greater trust in government, and thus greater response rates, than Western societies, and that 4
response to warnings among the Japanese might reflect the broader cultural rules of obedience 5
and authority common in Asian societies. 6
7
Confirmation 8
A common feature of the warning process (Mileti 1999), confirmation serves to clarify and 9
specify warning information, but at the cost of delaying sheltering. Confirmation has been found 10
to take place among neighbors, rather than through formal channels (Kirschenbaum 1992), with 11
information from media sources more likely the subject of confirmation (Frazier 1979). 12
Confirmation may also be something as simple as visual confirmation of the storm. Whether 13
beneficial or detrimental, confirmation remains a certain feature of the warning process. 14
15
Personalization of Risk 16
Risk personalization deals with whether community members believe severe weather will 17
affect them personally. In other words, one can believe that a threat exists somewhere, but the 18
threat is not immediate and therefore action is unnecessary. For example, residents may decide 19
that the mountains or rivers surrounding their community protect them from tornadoes, even if 20
they believe local reports that storms may produce tornadoes (Donner et al. 2012). 21
The psychological elements of risk personalization are well understood. Warning 22
consistency yields greater personalization of risk (McDavid and Marai 1968; Lindell and Perry 23
18
1983). Warning specificity (Perry et al. 1981) and sender credibility (Perry 1979; Rogers and 1
Nehnevajsa 1987) contribute to personalization. Geographical proximity to a threat appears to 2
be the most important in the literature (Flynn 1979; Perry and Lindell 1986; Rogers and 3
Nehnevajsa 1987). With some notable dissent (Mileti and Darlington 1995), most research 4
agrees that past hazards experience leads to a greater likelihood of personalization (Perry 1979; 5
Hansson et al. 1982; Saarinen et al. 1984; Rogers and Nehnevajsa 1987). 6
Demographics also play a role. As with belief, women are more likely to personalize a threat 7
(Flynn 1979; Hodge et al. 1981). Socioeconomic status also may play a role in risk 8
personalization (Flynn 1979; Mileti et al. 1981). 9
10
Action Necessary and Feasible 11
Believing that one is personally at risk sets off a process of determining whether one must 12
and is able to do something to protect oneself. Little research has been conducted in this area of 13
the model. This stage is unique from resource availability in that resources may be available but 14
the potential victim either does not know about them or does not think them useful for 15
protection. 16
Protection from severe weather often takes the form of sheltering. Sheltering may be broadly 17
defined as either “in-home” or “public.” With in-home sheltering, refuge is typically sought in 18
hallways, closets, underground basements, or, ideally, personal shelters. Those under warning 19
may also choose to seek public shelters, which are typically set up and maintained by local 20
government. Public shelters may be stand-alone shelters, in that their only use is as a shelter, or 21
schools, town halls, or other municipal structures may become “shelters” during storms. 22
19
Education, possibly through increased income, is most consistently associated with the 1
availability of resources such as shelters (Edwards 1993; Balluz et al. 2000). 2
3
<SIDEBAR #5 – PUBLIC RESPONSE CHALLENGES> 4
5
NEXT STEPS 6
7
All other things being equal, as the U.S. population density increases, tornado fatalities may 8
be expected to increase, calling for a review of the prediction, detection, and communication 9
processes through which tornadoes are warned. Urban populations continue to rise in hazard 10
prone regions, thereby placing greater numbers of people at risk (Brooks and Doswell 2001; 11
Ashley 2007). In addition, the overall population is aging, with increasing numbers living alone 12
(Gusmano and Rodwin 2006). Greater diversity among the population introduces additional 13
challenges, such as warning dissemination to non-English speaking populations (Donner and 14
Rodriguez 2008). As described herein, a number of challenges limit the effectiveness of the 15
current warning system (Table 1). Based upon the preceding literature review and these 16
associated challenges, the warning process can be fundamentally improved with a greater 17
emphasis and understanding of acceptable risk, preparation, and personalization. 18
A fundamental question society must ask is “How much risk are we willing to tolerate?” The 19
answer to this dilemma will set the limit on how much money should be expended towards 20
further research and warning infrastructure. In other words, the public must define its 21
acceptable risks, and its willingness to provide additional resources or reduce existing services or 22
quality to match those risks (Stallings 1990). The public’s level of acceptable risk likely varies 23
20
across the country as a function of the nature and extent of the risk. This variability calls for an 1
emphasis on local to regional decision-making, such that any top-down, one-size-fits-all strategy 2
will likely be less than optimal. A dense observing, spotter and warning dissemination network 3
in the Plains may vary in function and form from one in the Southeast, whereas neither system 4
may be cost-effective in the West or New England. 5
A second essential subject often overlooked in discussions of the tornado warning process is 6
preparation, both at the organizational and personal levels. Preparation at the organizational 7
level may include the development of public policy regarding the use and availability of public 8
shelters and warning systems, the availability of multilingual warnings, requirements or 9
guidelines for shelters in mobile home parks, building codes, and sheltering procedures. Private 10
preparations may include developing a family disaster plan, copying and storing critical 11
insurance papers and photos in safety deposit boxes, or purchasing a safe room or shelter. Proper 12
preparation at the organizational level can often facilitate the speed and ease of personal 13
decision-making during a moment of crisis. 14
Preparation should focus on maximizing personal safety, minimizing economic loss, and 15
easing recovery efforts. While this manuscript has focused on public safety, total damage 16
estimates from tornadoes between 1950 and 2011 range from $300 to $450 billion (Simmons et 17
al. 2012). A greater focus on personal mitigation could reduce tornado damage. Sutter et al. 18
(2009) found that low-cost home mitigation could reduce tornado damage by as much as 30%. 19
Finally, the one common ingredient to a successful end-to-end tornado warning program is 20
the personalization of the warning; to be successful, warnings must evoke a sense of specific and 21
immediate risk. Even days prior to an event, the efforts of SPC and others are spent narrowing 22
the area of a potential threat; local WFOs narrow the threat further in time and space, issuing 23
21
warnings over specific regions in time. The most effective warnings are those that communicate 1
clearly to individuals the specific information they need to know with enough time to react. The 2
goals of ensemble NWP, warn-on-forecast, phased array and gap-fill radars, and storm-based 3
warnings are to provide more detailed data on when and where tornadoes will strike. Many new 4
and innovative warning dissemination tools, many developed and sold by the private sector, 5
convey this detailed information to individuals, through the use of local media, outdoor warning 6
sirens, NOAA Weather Radio, the Internet, smart phones, and pagers. Similarly, preparation for 7
tornadoes needs to be personalized, and specific mitigation information provided at a household 8
level could see potential dividends in reducing home damage and personal injury. 9
Social and cultural factors may inhibit personalization of warnings. Long lead times and 10
high false alarm rates may tend to depersonalize risk. A continuing program of research and 11
education remains key to systematically improving public response to warnings. 12
A highly integrated and efficient tornado warning system does not necessarily ensure that no 13
fatalities will ever occur, but does set a priori standards of warning capability as a function of the 14
community-defined level of acceptable risk, resources, and will. The effectiveness of the best 15
tornado warning system is dependent largely upon the comprehensiveness and manner of 16
preparedness at the organizational and personal levels. This review has demonstrated the value 17
of research and investment at all stages of the warning process for improving the personalization 18
of the warning. In an era of austerity, additional investments will need to be strategically 19
focused to further prepare and personalize the tornado threat. 20
21
ACKNOWLEDGMENTS. This work is supported by the Engineering Research Centers 22
Program of the National Science Foundation under NSF Award 0313747. The authors thank 23

22
three anonymous reviewers for their insightful comments and suggestions for the improvement 1
of this manuscript. Any opinions, findings, conclusions, or recommendations expressed in this 2
material are those of the authors and do not necessarily reflect those of the National Science 3
Foundation. 4
5
6
7
8
9
10
11
12
13
14
15
16
17
18
19
20
21
22
23
23
REFERENCES 1 2 Aguirre, B.E. 1988: The lack of warnings before the Saragosa tornado. Int. J. Mass Emergencies 3
and Disasters, 6, 65-74. 4
5
Ahlborn, L., and J. Franc, 2012: Tornado hazard communication disparities among Spanish-6
speaking individuals in an English-speaking community. Prehosp. Disaster Med., 26, 1-5. 7
8
Aldoorya, L., J.-N. Kimb, N. Tindall, 2010: The influence of perceived shared risk in crisis 9
communication: Elaborating the situational theory of publics. Public Relations Rev., 36, 134–10
140. 11
12
Ammons, P., 2011: Harvest tornado victims. The Huntsville Times, May 6, 2011. 13
http://blog.al.com/ht/2011/05/katelyn_cornwall_and_harold_bu.html. 14
15
Andra, D., E. Quoetone, and W. Bunting, 2002: Warning decision making: The relative roles of 16
conceptual models, technology, strategy, and forecaster expertise on 3 May 1999. Wea. 17
Forecasting, 17, 559–566. 18
19
Ashley, W., 2007: Spatial and temporal analysis of tornado fatalities in the United States: 1880–20
2005. Wea. Forecasting, 22, 1214–1228. 21
22
Atwood, L. E., and A. M. Major, 1998: Exploring the “cry wolf” hypothesis. Int. J. Mass. 23
Emerg. Disasters, 16, 279-302. 24
24
1
Balluz, L., L. Schieve, T. Holmes, S. Kiezak, and J. Malilay, 2000: Predictors for people's 2
response to a tornado warning, Arkansas, 1 March, 1997. Disasters, 24, 71-77. 3
4
Barnes, L., E. Gruntfest, M. Hayden, D. Schultz, and C. Benight, 2007: False alarms and close 5
calls: A conceptual model of warning accuracy. Wea. Forecasting, 22, 1140–1147. 6
7
Baumgart, L. A., E. J. Bass, B. Philips, and K. Kloesel, 2008: Emergency management decision 8
making during severe weather. Wea. Forecasting, 23, 1268–1279. 9
10
Benjamin, S., K. Brewster, R. Brümmer, B. Jewett, T. Schlatter, T. Smith, and P. Stamus, 1991: 11
An isentropic three-hourly data assimilation system using ACARS aircraft observations. Mon. 12
Wea. Rev., 119, 888–906. 13
14
Berry, L., 1999: Cyclone Rona: Evacuation of Caravonica and Lake Placid report. Centre for 15
Disaster Studies, James Cook University. 16
17
Bieringer, P., and P. Ray, 1996: A comparison of tornado warning lead times with and without 18
NEXRAD Doppler radar. Wea. Forecasting, 11, 47–52. 19
20
Blanchard-Boehm, R. D., 1998: Understanding public response to increased risk from natural 21
hazards: Application of the hazards risk communication framework. Int. J. Mass Emergencies 22
and Disasters, 16, 247-278. 23
25
1
Bodine, D., M. Kumjian, R. Palmer, P. Heinselman, and A. Ryzhkov, 2013: Tornado damage 2
estimation using polarimetric radar. Wea. Forecasting, 28, 139-158. 3
4
Brewster, K., J. Brotzge, K. Thomas, Y. Wang, M. Xue, J. Gao, D. Weber, and K. Howe, 2008: 5
High resolution assimilation in CASA and NEXRAD radar data in near real-time: Results from 6
spring 2007 and plans for spring 2008. Preprints, 12th
Conf. IOAS-AOLS. 20-24 January, New 7
Orleans, LA. 8
9
Breznitz, S., 1984: Cry wolf: The psychology of false alarms. Lawrence Earlbaum Associates, 10
265 pp. 11
12
Brooks, H., 2004: Tornado-warning performance in the past and future: A perspective from 13
signal detection theory. Bull. Amer. Meteor. Soc., 85, 837–843. 14
15
Brooks, H., and C. Doswell, 2001: Normalized damage from major tornadoes in the United 16
States: 1890–1999. Wea. Forecasting, 16, 168–176. 17
18
Brooks, H., C. Doswell, and J. Cooper, 1994: On the environments of tornadic and nontornadic 19
mesocyclones. Wea. Forecasting, 9, 606–618. 20
21
Brotzge, J., and S. Erickson, 2009: NWS tornado warnings with zero or negative lead times. 22
Wea. Forecasting, 24, 140–154. 23
26
1
Brotzge, J., and S. Erickson, 2010: Tornadoes without NWS warning. Wea. Forecasting, 25, 2
159–172. 3
4
Brotzge, J., K. Hondl, B. Philips, L. Lemon, E. Bass, D. Rude, and D. Andra, Jr., 2010: 5
Evaluation of Distributed Collaborative Adaptive Sensing for detection of low-level circulations 6
and implications for severe weather warning operations. Wea. Forecasting, 25, 173-189. 7
8
Brotzge, J., S. Erickson, and H. Brooks, 2011: A 5-yr climatology of tornado false alarms. Wea. 9
Forecasting, 26, 534–544. 10
11
Brown, R., W. Bumgarner, K. Crawford, and D. Sirmans, 1971: Preliminary Doppler velocity 12
measurements in a developing radar hook echo. Bull. Amer. Meteor. Soc., 52, 1186–1188. 13
14
Brown, R., V. Wood, and T. Barker, 2002: Improved detection using negative elevation angles 15
for mountaintop WSR-88Ds: Simulation of KMSX near Missoula, Montana. Wea. Forecasting, 16
17, 223-237. 17
18
Brown, R., T. Niziol, N. Donaldson, P. Joe, and V. Wood, 2007: Improved detection using 19
negative elevation angles for mountaintop WSR-88Ds. Part III: Simulations of shallow 20
convective activity over and around Lake Ontario. Wea. Forecasting, 22, 839-852. 21
22
27
Brown, S., P. Archer, E. Kruger, and S. Mallonee, 2002: Tornado-related deaths and injuries in 1
Oklahoma due to the 3 May 1999 tornadoes. Wea. Forecasting, 17, 343-353. 2
3
Bryan, G., J. Wyngaard, and J. Fritsch, 2003: Resolution requirements for the simulation of deep 4
moist convection. Mon. Wea. Rev., 131, 2394 – 2416. 5
6
Bryan, G., and H. Morrison, 2012: Sensitivity of a simulated squall line to horizontal resolution 7
and parameterization of microphysics. Mon. Wea. Rev., 140, 202–225. 8
9
Carbin, G., cited 2012: Latest U.S. tornado statistics. Storm Prediction Center. Accessed May 10
22, 2012. [Available on-line at: http://www.spc.noaa.gov/climo/online/monthly/newm.html.] 11
12
Clark, A., W. Gallus, M. Xue, and F. Kong, 2010: Convection-allowing and convection-13
parameterizing ensemble forecasts of a mesoscale convective vortex and associated severe 14
weather environment. Wea. Forecasting, 25, 1052–1081. 15
16
Clark, A., J. Kain, P. Marsh, J. Correia, M. Xue, and F. Kong, 2012: Forecasting tornado path 17
lengths using a 3-dimensional object identification algorithm applied to convection-allowing 18
forecasts. Wea. Forecasting, 27, 1090-1113. 19
20
Cola, R. M., 1996: Responses of Pampanga households to lahar warnings: Lessons from two 21
villages in the Pasig-Potrero River watershed. Fire and Mud: Eruptions and Lahars of Mount 22
28
Pinatubo, Philippines, C. G. Newhall and R. S. Punongbayan, Eds., University of Washington 1
Press, 141-149. 2
3
Coleman, T., K. Knupp, J. Spann, J. Elliott, and B. Peters, 2011: The history (and future) of 4
tornado warning dissemination in the United States. Bull. Amer. Meteor. Soc., 92, 567–582. 5
6
Crum, T., and R. Alberty, 1993: The WSR-88D and the WSR-88D Operational Support Facility. 7
Bull. Amer. Meteor. Soc., 74, 1669–1687. 8
9
Crum, T., R. Alberty, and D. Burgess, 1993: Recording, archiving, and using WSR-88D data. 10
Bull. Amer. Meteor. Soc., 74, 645–653. 11
12
Crum, T., R. Saffle, and J. Wilson, 1998: An update on the NEXRAD program and future WSR-13
88D support to operations. Wea. Forecasting, 13, 253–262. 14
15
Dabberdt, W., and Coauthors, 2005: Multifunctional mesoscale observing networks. Bull. Amer. 16
Meteor. Soc., 86, 961–982. 17
18
Davies, J., 2004: Estimations of CIN and LFC associated with tornadic and nontornadic 19
supercells. Wea. Forecasting, 19, 714–726. 20
21
29
Dawson, D., M. Xue, J. Milbrandt, and M. Yau, 2010: Comparison of evaporation and cold pool 1
development between single-moment and multi-moment bulk microphysics schemes in idealized 2
simulations of tornadic thunderstorms. Mon. Wea. Rev., 138, 1152–1171. 3
4
Dawson, D., L. Wicker, E. Mansell, and R. Tanamachi, 2012: Impact of the environmental low-5
level wind profile on ensemble forecasts of the 4 May 2007 Greensburg, Kansas, tornadic storm 6
and associated mesocyclones. Mon. Wea. Rev., 140, 696–716. 7
8
de Elía, R., and I. Zawadzki, 2001: Optimal layout of a bistatic radar network. J. Atmos. Oceanic 9
Technol., 18, 1184-1194. 10
11
DiGiovanni, C., B. Reynolds, R. Harwell, and E. Stonecipher, 2002: A prospective study of the 12
reactions of residents of an American community to a bioterrorist attack. Defense Threat 13
Reduction Agency. 14
15
Diggory, J., 1956: Some consequences of proximity to a disease threat. Sociometry, 19, 47-53. 16
17
Dixon, E., J. Sisskind, and S. Israel, 2012: Helios: Real-time adaptive weather surveillance 18
system using integrated camera networks and enhanced geospatial processing algorithms. 19
Preprints, 16th
Symp. Meteor. Observations Instrumentations, 22-26 January, New Orleans, LA. 20
21
Donner, W., 2007: The political ecology of disaster: An analysis of factors influencing U.S. 22
tornado fatalities and injuries, 1998-2000. Demography, 44, 669-685. 23
30
1
Donner, W., 2008: Decision making as community adaptation: A case study of emergency 2
managers in Oklahoma. Disasters, 32, 292-302. 3
4
Donner, W., and H. Rodríguez, 2008: Population composition, migration, and inequality: The 5
influence of demographic changes on disaster risk and vulnerability. Social forces, 87, 1089-6
1114. 7
8
Donner, W.R., H. Rodrigueuz, and W. Diaz, 2012: Tornado warnings in three South States. J. 9
Homeland Security and Emergency Management, 9, 1-19. 10
11
Doswell, C., A. Moller, and H. Brooks, 1999: Storm spotting and public awareness since the first 12
tornado forecasts of 1948. Wea. Forecasting, 14, 544–557. 13
14
Dow, K. and S. Cutter. 1998: Crying wolf: Repeat responses to Hurricane evacuation orders. 15
Coastal Management, 26, 237-252. 16
17
Drabek, T., 1969: Social processes in disaster: Family evacuation. Social Problems, 16, 336-349. 18
19
Drabek T. E., 1994: Disaster evacuation and the tourist industry. Boulder, CO: Natural Hazards 20
Research and Applications Information Center, Institute of Behavioral Science, University of 21
Colorado. 22
23
31
Edwards, M. L., 1993: Social location and self-protective behavior: Implications for earthquake 1
preparedness. Int. J. Mass Emergencies and Disasters, 11, 293-303. 2
3
Egentowich, J. M., M. L. Kaplan, Y.-L. Lin and A. J. Riordan, 2000a: Mesoscale simulations of 4
dynamical factors discriminating between a tornado outbreak and non-event over the southeast 5
US Part I: 84-48 hour precursors. Meteor. Atmos. Physics, 74, 129-157. 6
7
Egentowich, J. M., M. L. Kaplan, Y.-L. Lin and A. J. Riordan, 2000b: Mesoscale simulations of 8
dynamical factors discriminating between a tornado outbreak and non-event over the southeast 9
US Part II: 48-6 hour precursors. Meteor. Atmos. Physics, 74, 159-187. 10
11
Egentowich, J. M., M. L. Kaplan, Y.-L. Lin and A. J. Riordan, 2000c: Mesoscale simulations of 12
dynamical factors discriminating between a tornado outbreak and non-event over the southeast 13
US Part III: 6 hour precursors. Meteor. Atmos. Physics, 74, 189-215. 14
15
Erickson, S., and H. Brooks, 2006: Lead time and time under tornado warnings: 1986-2004. 16
Preprints, 23rd
Conf. Severe Local Storms, Amer. Meteor. Soc., St. Louis, MO. [Available at: 17
http://ams.confex.com/ams/23SLS/techprogram/paper_115194.htm.] 18
19
Farley, J., H. Barlow, M. Finkelstein, and L. Riley, 1993: Earthquake hysteria, before and after: 20
A survey and follow-up on public response to the Browning forecast. Int. J. Mass Emergencies 21
and Disasters, 11, 305-321. 22
23
32
Fierro, A., E. Mansell, C. Ziegler, and D. Macgorman, 2012: Application of a lightning data 1
assimilation technique in the WRF-ARW model at cloud-resolving scales for the tornado 2
outbreak of 24 May 2011. Mon. Wea. Rev., 140, 2609-2627. 3
4
Flynn, C., 1979: Three Mile Island telephone survey: Preliminary report on procedures and 5
findings. Tempe, AZ, Mountain West Research. 6
7
Foster, H. D., 1980: Disaster Planning: The Preservation of Life and Property. Springer-8
Verlag, 255 pp. 9
10
Frame, J., and P. Markowski, 2010: Numerical simulations of radiative cooling beneath the 11
anvils of supercell thunderstorms. Mon. Wea. Rev., 138, 3024–3047. 12
13
Frazier, K. 1979: Violent Face of Nature: Severe Phenomena and Natural Disasters. William 14
Morrow & Co., 386 pp. 15
16
Friday, E., 1994: The modernization and associated restructuring of the National Weather 17
Service: An overview. Bull. Amer. Meteor. Soc., 75, 43–52. 18
19
Galway, J., 1975: Relationship of tornado deaths to severe weather watch areas. Mon. Wea. Rev., 20
103, 737–741. 21
22
33
Golden, J. H., and C. R. Adams, 2000: The tornado problem: Forecast, warning, and response. 1
Nat. Hazards Rev., 1, 107–118. 2
3
Gusmano, M. K., and V. G. Rodwin, 2006: The elderly and social isolation. Testimony to 4
Committee on Aging, NYC Council, New York, NY. 5
6
Haas, J., H. Cochrane, and D. G. Eddy, 1977: Consequences of a cyclone on a small city. 7
Ekistics, 44, 45-50. 8
9
Hammer, B., and T. Schmidlin, 2002: Response to warnings during the 3 May 1999 Oklahoma 10
City tornado: Reasons and relative injury rates. Wea. Forecasting, 17, 577–581. 11
12
Hansson, R., D. Noulles, and S. Bellovich, 1982: Knowledge, warning and stress. Environment 13
and Behavior, 14, 171-185. 14
15
Heath, S., 1999: Animal Management in Disasters. Mosby, Inc., 320 pp. 16
17
Heinselman, P., D. LaDue, and H. Lazrus, 2012: Exploring impacts of rapid-scan radar data on 18
NWS warning decisions. Wea. Forecasting, 27, 1031-1044. 19
20
Heinselman, P., D. LaDue, D. M. Kingfield, R. Hoffman, and B. W. MacAloney II, 2013: 21
Simulated NWS tornado warning decisions using rapid-scan radar data. Preprint, 29th
Conf. 22
34
Environ. Infor. Processing Technologies. Amer. Meteor. Soc., Austin, TX. [Available at: 1
https://ams.confex.com/ams/93Annual/webprogram/Paper219547.html.] 2
3
Hodge, D., V. Sharp, and M. Marts, 1981: Contemporary responses to volcanism: Case studies 4
from the Cascades and Hawaii. Volcanic Activity and Human Ecology, P. D. Sheets and D. K. 5
Grayson, Eds., Academic Press, 221-248. 6
7
Janis, I. L., 1962: Psychological effects of warnings. Man and Society in Disaster, G. Baker and 8
D. Chapman, Eds., Basic Books, 55–91. 9
10
Jung, Y., M. Xue, G. Zhang, and J. Straka, 2008: Assimilation of simulated polarimetric radar 11
data for a convective storm using the Ensemble Kalman Filter. Part II: Impact of polarimetric 12
data on storm analysis. Mon. Wea. Rev., 136, 2246–2260. 13
14
Junyent, F., and V. Chandrasekar, 2009: Theory and characterization of weather radar networks. 15
J. Atmos. Oceanic Technol., 26, 474–491. 16
17
Kalnay, E., 2003: Atmospheric modeling, data assimilation and predictability. Cambridge Univ. 18
Press, 341 pp. 19
20
Kelleher, K., and Coauthors, 2007: Project CRAFT: A real-time delivery system for NEXRAD 21
Level II data via the internet. Bull. Amer. Meteor. Soc., 88, 1045–1057. 22
23
35
Keller C., M. Siegrist, and H. Gutscher, 2006: The role of the affect and availability heuristics 1
in risk communication. Risk Analysis, 26, 631-639. 2
3
Kirschenbaum, A., 1992: Warning and evacuation during a mass disaster: A multivariate 4
decision making model. Int. J. Mass Emergencies and Disasters, 10, 91-114. 5
6
Kramlich, K., 2007: Rural public response to a tornado warning. Northern Plains Convective 7
Workshop, University of North Dakota, Grand Forks, ND, April 23-25, 2007. 8
9
Kurdzo, J., and R. Palmer, 2012: Objective optimization of weather radar networks for low-level 10
coverage using a genetic algorithm. J. Atmos. Oceanic Technol., 29, 807-821. 11
12
LaDue, D., P. Heinselman, and J. Newman, 2010: Strengths and limitations of current radar 13
systems for two stakeholder groups in the Southern Plains. Bull. Amer. Meteor. Soc., 91, 899-14
910. 15
16
Lakshmanan, V., T. Smith, K. Hondl, G. J. Stumpf, and A. Witt, 2006: A real-time, three 17
dimensional, rapidly updating, heterogeneous radar merger technique for reflectivity, velocity 18
and derived products, Wea. Forecasting, 21, 802-823. 19
20
Lakshmanan, V., T. Smith, G. Stumpf, and K. Hondl, 2007: The Warning Decision Support 21
System–Integrated Information. Wea. Forecasting, 22, 596–612. 22
23
36
Lakshmanan, V., and T. Smith, 2010: An objective method of evaluating and devising storm 1
tracking algorithms, Wea. Forecasting, 29, 721-729. 2
3
Lardry, T. and G. Rogers, 1982: Warning Confirmation and Dissemination. Center for Social 4
and Urban Research, University of Pittsburgh. 5
6
Lazo, J. K., 2012: One economist’s entreaty for increased research on weather risk 7
communication. Wea. Climate Soc., 4, 233–235. 8
9
Leik, R., T. Carter, and J. Clark, 1981: Community response to natural hazard warning. U.S. 10
Dept. of Commerce, 77 pp. [NTIS PB82-111287.] 11
12
Legates D. R., and M. D. Biddle, 1999: Warning response and risk behavior in the Oak Grove—13
Birmingham, Alabama, Tornado of 08 April 1998. Quick Response Report #116. Natural 14
Hazards Research Applications and Information Center, Boulder, CO. 15
16
Leone, D. A., R. M. Endlich, J. Petričeks, R. T. H. Collis, J. R. Porter, 1989: Meteorological 17
considerations used in planning the NEXRAD network. Bull. Amer. Meteor. Soc., 70, 4–13. 18
19
Li, J., 1991: Social responses to the Tangshan earthquake prediction, Preprints, UCLA 20
International Conference on the Impact of Natural Disasters. Los Angeles, CA, University of 21
California-Los Angeles. 22
23
37
Lindell, M. K., and R. W. Perry, 1983: Nuclear power plant emergency warnings: How would 1
the public respond? Nuclear News, February, 49-57. 2
3
Lindell, M. K., and R. W. Perry, 1992: Behavioral Foundations of Community Emergency 4
Planning. Hemisphere Publishing Corporation, 630 pp. 5
6
Lipkus, I. and J. G. Hollands, 1999: The visual communication of risk. J. National Cancer 7
Institute Monographs, 25, 149-163. 8
9
Maddox, R., and C. Crisp, 1999: The Tinker AFB tornadoes of March 1948. Wea. Forecasting, 10
14, 492–499. 11
12
Mahale, V., J. Brotzge, and H. Bluestein, 2012: The analysis of vortices embedded within a 13
quasi-linear convective system using X-band polarimetric radar. Wea. Forecasting, 27, 1520-14
1537. 15
16
Mahoney, B., S. Drobot, P. Pisano, B. McKeever, and J. O' Sullivan, 2010: Vehicles as mobile 17
weather observation systems. Bull. Amer. Meteor. Soc., 91, 1179–1182. 18
19
Manning, M., 2007: The effectiveness of NOAA weather radios as an all-hazards alert method in 20
eastern Loudon County, Virginia. J. Emergency Management, 17, 343-353. 21
22
38
Markowski, P., 2002: Hook echoes and rear-flank downdrafts: A review. Mon. Wea. Rev., 130, 1
852–876. 2
3
Markowski, P., and Y. Richardson, 2009: Tornadogenesis: Our current understanding, 4
forecasting considerations, and questions to guide future research. Atmos. Res., 93, 3-10. 5
6
Markowski, P., and N. Dotzek, 2011: A numerical study of the effects of orography on 7
supercells. Atmos. Research, 100, 457-478. 8
9
Martin, W., and M. Xue, 2006: Sensitivity analysis of convection of the 24 May 2002 IHOP case 10
using very large ensembles. Mon. Wea. Rev., 134, 192–207. 11
12
Maximuk, L., and M. Hudson, 2012: Impact based warning experimental product. NWS Central 13
Region presentation. [Available on-line at: http://www.norman.noaa.gov/nsww/wp-14
content/uploads/2012/03/Hudson_NSWW2012.pdf.] 15
16
McCarthy, D., 2002: The role of ground-truth reports in the warning decision-making process 17
during the 3 May 1999 Oklahoma tornado outbreak. Wea. Forecasting, 17, 647–649. 18
19
McDavid, J., and M. Marai, 1968: Social Psychology. Harper and Row, 479 pp. 20
21
McLaughlin, D., and Coauthors, 2009: Short-wavelength technology and the potential for 22
distributed networks of small radar systems. Bull. Amer. Meteor. Soc., 90, 1797–1817. 23
39
1
Mead, C., 1997: The discrimination between tornadic and nontornadic supercell environments: A 2
forecasting challenge in the Southern United States. Wea. Forecasting, 12, 379–387. 3
4
Mercer, A., C. Shafer, C. Doswell, L. Leslie, and M. Richman, 2009: Objective classification of 5
tornadic and nontornadic severe weather outbreaks. Mon. Wea. Rev., 137, 4355–4368. 6
7
Mileti, D. S., 1999: Disasters by Design. Joseph Henry Press, 376 pp. 8
9
Mileti, D. S., and J. H. Sorensen, 1990: Communication of emergency public warnings: A social 10
science perspective and state-of-the-art assessment. Oak Ridge National Laboratory Tech. Rep. 11
ORNL-6609, 166 pp. 12
13
Mileti, D. S., and C. Fitzpatrick, 1993: Great Earthquake Experiment: Risk Communication and 14
Public Action. Westview Press, 149 pp. 15
16
Mileti, D. S., and J. D. Darlington, 1995: Societal response to revised earthquake probabilities in 17
the San Francisco Bay area. Int. J. Mass Emergencies and Disasters, 13, 119-145. 18
19
Mileti, D. S., J. R. Hutton, and J. H. Sorensen, 1981: Earthquake Prediction Response and 20
Options for Public Policy. Institute of Behavioral Science, University of Colorado. 21
22
40
Miller, R., and C. Crisp, 1999a: The first operational tornado forecast twenty million to one. 1
Wea. Forecasting, 14, 479–483. 2
3
Miller, R., and C. Crisp, 1999b: Events leading to the establishment of the United States Air 4
Force Severe Weather Warning Center in February 1951. Wea. Forecasting, 14, 500–506. 5
6
Miller, P., M. Barth, L. Benjamin, R. Artz, and W. Pendergrass, 2007: MADIS support for 7
UrbaNet. Preprints, 14th Symp. on Meteorological Observation and Instrumentation/16th Conf. 8
on Applied Climatology, San Antonio, TX, Amer. Meteor. Soc., JP2.5. [Available online at 9
http://ams.confex.com/ams/pdfpapers/119116.pdf.] 10
11
Miller, M., V. Lakshmanan, and T. Smith, 2013: An automated method for depicting 12
mesocyclone paths and intensities. Wea. Forecasting, in press. 13
14
Minciardi, R., R. Sacile, and F. Siccardi, 2003: Optimal planning of a weather radar network. J. 15
Atmos. Oceanic Technol., 20, 1251–1263. 16
17
Mitchell, E., S. Vasiloff, G. Stumpf, A. Witt, M. Eilts, J. T. Johnson, and K. Thomas, 1998: The 18
National Severe Storms Laboratory Tornado Detection Algorithm. Wea. Forecasting, 13, 352–19
366. 20
21
41
Mitchem J.D., 2003: An analysis of the September 20, 2002 Indianapolis tornado: Public 1
response to a tornado warning and damage assessment difficulties. Quick Response #161. 2
Natural Hazards Research Applications and Information Center, Boulder, CO. 3
4
Moller, A., 1978: The improved NWS storm spotters’ training program at Ft. Worth, TX. Bull. 5
Amer. Meteor. Soc., 59, 1574–1582. 6
7
Moore, G., 1965: Cramming more components onto integrated circuits. Electronics Magazine, 8
4. 9
10
Moore, T., and R. Dixon, 2012: Tropical cyclone-tornado casualties. Nat. Hazards, 61, 621-634. 11
12
Morss, R., Lazo, J. K., and Demuth, J. L., 2010: Examining the use of weather forecasts in 13
decision scenarios: results from a US survey with implications for uncertainty communication. 14
Meteor. Applications, 17, 149-162. 15
16
Nagarajan, M., D. Shaw, and P. Albores, 2012: Disseminating a warning message to evacuate: A 17
simulation study of the behaviour of neighbours. European J. Operational Res., 220, 810-819. 18
19
National Research Council, 1995: Toward a new National Weather Service: Assessment of 20
NEXRAD coverage and associated weather services. National Academy Press, Washington 21
D.C., 104. 22
23
42
National Research Council, 2009: Observing Weather and Climate from the Ground Up: A 1
Nationwide Network of Networks. National Academies Press, 234 pp. 2
3
NOAA, 2011a: Tornado Warnings (Nation). Accessed July 13, 2012. 4
https://verification.nws.noaa.gov/services/gpra/NWS_GPRA_Metrics.pdf 5
6
NOAA, 2011b: Service assessment: The historic tornadoes of April 2011. [Available at 7
http://www.nws.noaa.gov/os/assessments/pdfs/historic_tornadoes.pdf.] 8
9
Ortega, K. L., T. M. Smith, K. L. Manross, K. A. Scharfenberg, A. Witt, A. G. Kolodziej, and J. 10
J. Gourley, 2009: The Severe Hazards Analysis and Verification Experiment. Bull. Amer. 11
Meteor. Soc., 90, 1519–1530. 12
13
Ostby, F., 1999: Improved accuracy in severe storm forecasting by the Severe Local Storms Unit 14
during the last 25 Years: Then versus now. Wea. Forecasting, 14, 526–543. 15
16
Otkin, J., D. Hartung, D. Turner, R. Petersen, W. Feltz, and E. Janzon, 2011: Assimilation of 17
surface-based boundary layer profiler observations during a cool-season weather event using an 18
Observing System Simulation Experiment. Part I: Analysis impact. Mon. Wea. Rev., 139, 2309–19
2326. 20
21
Park, S., and L. Xu, 2009: Data Assimilation for Atmospheric, Oceanic, and Hydrologic 22
Applications. Springer, 495 pp. 23
43
1
Pearson, A., and S. Weiss, 1979: Some trends in forecast skill at the National Severe Storms 2
Forecast Center. Bull. Amer. Meteor. Soc., 60, 319–326. 3
4
Peguero, A. A., 2006: Latino disaster vulnerability: The dissemination of hurricane mitigation 5
Information among Florida's homeowners. Hispanic J. Behavioral Sciences, 28, 5-22. 6
7
Perry, R. W., 1979: Evacuation decision-making in natural disasters. Int. J. Mass Emergencies 8
and Disasters, 4, 25-38. 9
10
Perry, R., 1983: Population evacuation in volcanic eruptions, floods and nuclear power plant 11
accidents: Some elementary comparisons. J. Community Psychology, 11, 36-47. 12
13
Perry, R. W., 1987: Disaster preparedness and response among minority citizens. Sociology of 14
Disasters, R. R. Dynes, B. DeMarchi, and C. Pelanda, Eds., Franco AngeliLibri, 135-151. 15
16
Perry, R., and M. Greene, 1983: Citizen Response to Volcanic Eruptions: The Case of Mt. St. 17
Helens. Irvington Publishers, 145 pp. 18
19
Perry, R. and M. Lindell, 1986: Twentieth-century volcanicity at Mt. St. Helens: The 20
routinization of life near an active volcano. School of Public Affairs, Arizona State University. 21
22
44
Perry, R.W. and H. Hirose, 1991: Volcano Management in the United States and Japan. Jai 1
Press, 230 pp. 2
3
Perry, R., M. Lindell, and M.R. Greene, 1981: Evacuation Planning in Emergency Management. 4
Lexington Books, 199 pp. 5
6
Pfister, N., 2002: Community response to flood warnings: The case of an evacuation from 7
Grafton, March 2001. Australian J. Emergency Management, 17, 19-29. 8
9
Polger, P., B. Goldsmith, R. Przywarty, J. Bocchieri, 1994: National Weather Service Warning 10
performance based on the WSR-88D. Bull. Amer. Meteor. Soc., 75, 203–214. 11
12
Powell, S. W., and H. D. O’Hair, 2008: Communicating weather information to the public: 13
People’s reactions and understandings of weather information and terminology. Preprints, 3rd
14
Symp. Policy and Socioeconomic Impacts, New Orleans, LA, American Meteorological Society. 15
[Available at http://ams.confex.com/ams/pdfpapers/132939.pdf.] 16
17
Quarantelli, E. L., 1980: Evacuation behavior and problems: Findings and implications from the 18
Research Literature. Disaster Research Center, Ohio State University. 19
20
Quoetone, E., J. Boettcher, and C. Spannagle, 2009: How did that happen? A look at factors that 21
go into forecaster warning decisions. National Weather Association, Norfolk, VA, Oct. 22-27. 22
[Available on-line at http://www.nwas.org/meetings/nwa2009/.] 23
45
1
Rasmussen, E., J. Straka, R. Davies-Jones, C. Doswell, F. Carr, M. Eilts, and D. MacGorman, 2
1994: Verification of the Origins of Rotation in Tornadoes Experiment: VORTEX. Bull. Amer. 3
Meteor. Soc., 75, 995–1006. 4
5
Ray, P., and K. Sangren, 1983: Multiple-Doppler radar network design. J. Climate Appl. 6
Meteor., 22, 1444–1454. 7
8
Richter, H., and L. Bosart, 2002: The suppression of deep moist convection near the Southern 9
Great Plains dryline. Mon. Wea. Rev., 130, 1665–1691. 10
11
Rogers, G., and J. Nehnevajsa, 1987: Warning human populations of technological hazards. 12
Radiological Accidents: Perspectives and Emergency, C. Chester and K. S. Grant, Eds., 13
American Nuclear Society, 357-362. 14
15
Rogers, G., and J. H. Sorensen, 1991: Diffusion of emergency warning: Comparing empirical 16
and simulation results. Risk Analysis, 11, 117-134. 17
18
Ryzhkov, A., T. Schuur, D. Burgess, and D. Zrnic, 2005: Polarimetric tornado detection. J. Appl. 19
Meteor., 44, 557–570. 20
21
Saarinen, T., V. Baker, R. Durrenberger and T. Maddock, 1984: The Tucson, Arizona Flood of 22
October 1983. National Academy Press, 112 pp. 23
46
1
Scanlon, J., and A. Frizzell, 1979: Old theories don’t apply: Implications of communication in 2
crisis. Disasters, 3, 315-319. 3
4
Schenkman, A., M. Xue, A. Shapiro, K. Brewster, and J. Gao, 2011: Impact of CASA radar and 5
Oklahoma Mesonet data assimilation on the analysis and prediction of tornadic mesovortices in 6
an MCS. Mon. Wea. Rev., 139, 3422–3445. 7
8
Schmidlin, T. W., and P. S. King, 1997: Risk factors for death in the March 1, 1997 Arkansas 9
tornadoes. Natural Hazards Research and Applications Information Center, Quick Report 98. 10
[Available on-line at http://www.colorado.edu/hazards/research/qr/qr98.html.] 11
12
Schultz, C., and M. Askelson, 2012: Boundary layer ∆θep in tornadic and nontornadic near-storm 13
environments. Wea. Forecasting, 27, 1489-1506. 14
15
Schultz, D., E. Gruntfest, M. Hayden, C. Benight, S. Drobot, and L. Barnes, 2010: Decision 16
making by Austin, Texas, residents in hypothetical tornado scenarios*. Wea. Climate Soc., 2, 17
249–254. 18
19
Schultz, L., and D. Cecil, 2009: Tropical cyclone tornadoes, 1950–2007. Mon. Wea. Rev., 137, 20
3471-3484. 21
22
47
Shafer, C. M., A. E. Mercer, C. A. Doswell, M. B. Richman, and L.M. Leslie, 2009: Evaluation 1
of WRF forecasts of tornadic and nontornadic outbreaks when initialized with synoptic-scale 2
input. Mon. Wea. Rev., 137, 1250–1271. 3
4
Shafer, C. M., A. E. Mercer, L. M. Leslie, M. B. Richman, and C. A. Doswell III, 2010: 5
Evaluation of WRF model simulations of tornadic and nontornadic outbreaks occurring in the 6
spring and fall. Mon. Wea. Rev.,138, 4098-4119. 7
8
Sherman-Morris, K., 2006: Tornadoes, television, and trust: A closer look at the influence of the 9
local weather forecaster during severe weather. Environ. Hazards, 6, 201-210. 10
11
Sherman-Morris, K., 2010: Tornado warning dissemination and response at a university campus. 12
Nat. Hazards, 52, 623-638. 13
14
Simmons, K., and D. Sutter, 2005: WSR-88D radar, tornado warnings, and tornado casualties. 15
Wea. Forecasting, 20, 301–310. 16
17
Simmons, K., and D. Sutter, 2008: Tornado warnings, lead times, and tornado casualties: An 18
empirical investigation. Wea. Forecasting, 23, 246–258. 19
20
Simmons, K., and D. Sutter, 2009: False alarms, tornado warnings, and tornado casualties. Wea. 21
Climate Soc., 1, 38-53. 22
23
48
Simmons, K., D. Sutter, and R. Pielke, 2012: Normalized tornado damage in the United States: 1
1950-2011. Environ. Hazards, 1-16. 2
3
Smith, P., 1999: Effects of imperfect storm reporting on the verification of weather warnings. 4
Bull. Amer. Meteor. Soc., 80, 1099–1105. 5
6
Smith, T. M. and K. L. Elmore, 2004: The use of radial velocity derivatives to diagnose rotation 7
and divergence. Preprints, 11th Conf. Aviation, Range, and Aerospace, Hyannis, MA, Amer. 8
Meteor. Soc., P5.6. 9
10
Snook, N., M. Xue, and Y. Jung, 2012: Ensemble probabilistic forecasts of a tornadic Mesoscale 11
Convective System from Ensemble Kalman Filter analyses using WSR-88D and CASA radar 12
data. Mon. Wea. Rev., 140, 2126-2146. 13
14
Sorensen, J. H., 1982: Evaluation of emergency warning system at Ft. St. Vrain nuclear power 15
plan. Oak ridge National Laboratory. 16
17
Sorensen, J. H., and P. J. Gersmehl, 1980: Volcanic hazard warning system: Persistence and 18
transferability. Environ. Management, 4, 125-136. 19
20
Sorensen, J. H., and D. S. Mileti, 1987: Decision-making uncertainties in emergency warning 21
system organizations. Int. J. Mass Emergencies and Disasters, 5, 33-61. 22
23
49
Stallings, R., 1990: Media discourse and the social construction of risk. Social Problems, 37, 1
80-95. 2
3
Stensrud, D. J., and S. J. Weiss, 2002: Mesoscale model ensemble forecasts of the 3 May 1999 4
tornado outbreak. Wea. Forecasting, 17, 526–543. 5
6
Stensrud, D., J. Cortinas, and H. Brooks, 1997: Discriminating between tornadic and nontornadic 7
thunderstorms using mesoscale model output. Wea. Forecasting, 12, 613–632. 8
9
Stensrud, D., and Coauthors, 2009: Convective-scale warn-on-forecast system. Bull. Amer. 10
Meteor. Soc., 90, 1487–1499. 11
12
Stuart, N., P. Market, B. Telfeyan, G. Lackmann, K. Carey, H. Brooks, D. Nietfeld, B. Motta, 13
and K. Reeves, 2006: The future of humans in an increasingly automated forecast process. Bull. 14
Amer. Meteor. Soc., 87, 1497–1502. 15
16
Stewart, T. R., and C. M. Lusk, 1994: Seven components of judgmental forecasting skill: 17
Implications for research and the improvement of forecasts. J. Forecasting, 13, 579–599. 18
19
Stough, S., E. Leitman, J. Peters, and J. Correia, 2012: On the role of Storm Prediction Center 20
products in decision making leading up to hazardous weather events. Preprints, 11th
AMS 21
Student Conf., Amer. Meteor. Soc., New Orleans, LA. 22
23
50
Stumpf, G., A. Witt, E. D. Mitchell, P. L. Spencer, J. T. Johnson, M. D. Eilts, K. W. Thomas, 1
and D. W. Burgess, 1998: The National Severe Storms Laboratory Mesocyclone Detection 2
Algorithm for the WSR-88D. Wea. Forecasting, 13, 304–326. 3
4
Sutter, D., and S. Erickson, 2010: The time cost of tornado warnings and the savings with storm-5
based warnings. Wea. Climate Soc., 2, 103–112. 6
7
Sutter, D., and K. Simmons, 2010: Tornado fatalities and mobile homes in the United States. 8
Nat. Hazards, 53, 125-137. 9
10
Sutter, D., D. DeSilva, and J. Kruse, 2009: An economic analysis of wind resistant construction. 11
J. Wind Engineering and Industrial Aerodynamics, 97, 113-119. 12
13
Tierney, K., 1987: Chemical Emergencies, Offsite Exposures and Organizational Response. 14
Natural Hazards Research and Applications Center, Institute of Behavioral Science, University 15
of Colorado. 16
17
Trapp, R., S. Tessendorf, E. Savageau Godfrey, and H. Brooks, 2005: Tornadoes from squall 18
lines and bow echoes. Part I: Climatological distribution. Wea. Forecasting, 20, 23–34. 19
20
Turner, R. H., J. M. Nigg, D. H. Paz, and B. S. Young, 1979: Earthquake threat: The human 21
response in Southern California. Institute for Social Science Research Tech. Rep. 22
23
51
Unidata, 2012: THREDDS. Accessed May 25, 2012. Available at: 1
http://www.unidata.ucar.edu/projects/THREDDS/ 2
3
Wakimoto, R., and J. Wilson, 1989: Non-supercell tornadoes. Mon. Wea. Rev., 117, 1113-1140. 4
5
Wang, Y., T.-Y. Yu, M. Yeary, A. Shapiro, S. Nemati, M. Foster, D. Andra, and M. Jain, 2008: 6
Tornado detection using a neuro–fuzzy system to integrate shear and spectral signatures. J. 7
Atmos. Oceanic Technol., 25, 1136–1148. 8
9
Whiton, R. C., P. L. Smith, S. G. Bigler, K. E. Wilk, A. C. Harbuck, 1998: History of operational 10
use of weather radar by U.S. Weather Services. Part II: Development of operational Doppler 11
weather radars. Wea. Forecasting, 13, 244-252. 12
13
Wood, V., R. Brown, and S. Vasiloff, 2003: Improved detection using negative elevation angles 14
for mountaintop WSR-88Ds. Part II: Simulations of the three radars covering Utah. Wea. 15
Forecasting,18, 393-403. 16
17
Wurman, J., D. Dowell, Y. Richardson, P. Markowski, E. Rasmussen, D. Burgess, L. Wicker, 18
and H. Bluestein, 2012: The Second Verification of the Origins of Rotation in Tornadoes 19
Experiment: VORTEX2. Bull. Amer. Meteor. Soc., 93, 1147-1170. 20
21
Zrnic, D. S., and Coauthors, 2007: Agile-beam phased array radar for weather observations. Bull. 22
Amer. Meteor. Soc., 88, 1753–1766. 23

52
1
Zubrick, S., 2010: Tornadoes: Understanding how they develop and providing early warning; 2
Part III NWS. Hazards Caucus Alliance, Washington D.C., July 21, 2010. [Available at 3
http://www.hazardscaucus.org/briefings/zubrick0710.pdf.] 4
5
6
7
8
9
10
11
12
13
14
15
16
17
18
19
20
21
22
23
24
25
53
PREDICTION CHALLENGES <SIDEBAR #1> 1
2
Several significant challenges remain to be addressed before routine 0-3 hour tornado 3
prediction can be realized. These needs include (i) faster computer processing to permit even 4
higher resolution NWP and more robust ensemble systems; (ii) the ability to enable real-time DA 5
of even larger volumes of data; (iii) greater numbers of observations at high spatial and temporal 6
resolutions; and (iv) the ability to predict marginal, less predictable events with greater accuracy 7
and fewer false alarms. Model grid spacing is tightly coupled with the model physics; for 8
example, Bryan et al. (2003) determined that model grid spacing on the order of 100 m is needed 9
to fully resolve subgrid-scale turbulence. Parameterization schemes, such as cloud microphysics, 10
convective, and planetary boundary layer schemes, fail to capture sub-grid scale processes and 11
which can lead to large sensitivities in storm-scale NWP results (e.g., Dawson et al. 2010; Bryan 12
and Morrison 2012). 13
In a similar manner, storm-scale NWP is equally sensitive to model initialization and 14
analysis. Numerical modeling of convective storms has shown sensitivity to model initialization 15
of low-level thermodynamics (Frame and Markowski 2010), low-level wind profiles (Dawson et 16
al. 2012), surface soil moisture (Martin and Xue 2006), and orography (Markowski and Dotzek 17
2011). Model assimilation sensitivity may be reduced by increasing the number and use of 18
observations in critical areas (Schenkman et al. 2011; Snook et al. 2012) and at critical times 19
(Richter and Bosart 2002). However, the ability to collect, quality control, and properly 20
assimilate all the necessary data in real-time at high-resolutions is a significant challenge (e.g., 21
Brewster et al. 2008). To address this issue, an optimally designed national observing network is 22
54
needed to collect the necessary observations at the high resolutions required (e.g., low level 1
moisture and wind profiles) (Dabberdt et al. 2005; National Research Council 2009). 2
Finally, while our ability to anticipate and predict significant events is relatively good with a 3
probability of detection (POD) of nearly 90% for tornado outbreaks (Brotzge and Erickson 4
2009), the community faces significant challenges in predicting marginal and/or weakly forced 5
tornado events. Brotzge and Erickson (2009) found the first tornado of the day, solitary tornado 6
events, tornadoes from hurricanes, and weak (F0, F1) tornadoes had a much greater chance of 7
not being warned. The false alarm ratio (FAR) has been found to be highest for weakly forced 8
and isolated events (Brotzge et al. 2011). Non-supercell tornadoes, such as from tropical storms 9
(Schultz and Cecil 2009; Moore and Dixon 2012) and squall lines (Trapp et al. 2005), pose a 10
significant difficulty for prediction due to their often transient nature. The ability to predict 11
exactly when a tornado will initiate (Markowski and Richardson 2009), differentiating between 12
tornadic and non-tornadic supercells (Brooks et al. 1994; Stensrud et al. 1997; Mead 1997; 13
Davies 2004; Schultz and Askelson 2012), and identifying threatening non-supercell tornadic 14
storms (Wakimoto and Wilson 1989) remain among the greatest challenges for tornado 15
prediction. 16
17
18
19
20
21
22
23
24
55
DETECTION CHALLENGES <SIDEBAR #2> 1
2
The most common reasons for operational warning forecasters for not detecting (and thereby 3
not warning) tornadoes prior to touchdown often can be traced to having either too little 4
information available – due to inadequacies in existing technology (e.g., LaDue et al. 2010), 5
limited spotter networks, and incomplete conceptual models – or too much information – i.e., 6
data overload. 7
As the primary tool used for detecting tornadoes, weather radar is critical for seeing low- to 8
mid-level rotation prior to tornadogenesis. In areas with limited low-level radar coverage, 9
tornado detection (and prediction) is severely hampered. In a root cause analysis study of 146 10
unwarned tornadoes between 2004 and 2009, “Radar sampling”, “no radar signature”, and ”radar 11
use” were listed as three of the top ten reasons for failure to warn and were cited in over 2/3 of 12
all missed events (Quoetone et al. 2009). Sampling issues were cited in 19 of 31 false alarm 13
events evaluated. Brotzge and Erickson (2010) found a mean 20% increase in the number of 14
tornadoes not warned with increasing distance from radar, once sorted by population density. 15
Solutions to improving radar coverage include the use of lower elevation scans, deployment 16
of gap-filling and rapid-scan radars, and an optimization of the radar network configuration. The 17
WSR-88Ds’ lowest scanning angle is 0.5º elevation, as limited by FCC regulations. At some 18
mountain sites across the western U.S., the WSR-88D radars are located on mountain tops, 19
limiting the views of critical valley areas. One solution now being implemented at a few 20
locations is the use of zero and/or negative elevation angles (Brown et al. 2002, 2007; Wood et 21
al. 2003). A second, long-term solution to improve radar coverage is to simply add more radars 22
to the network. However because of the high cost associated with deploying and operating large 23
56
antenna, S-band (WSR-88D type) radars, a more cost-effective solution may be to deploy limited 1
numbers of “gap filling” (X- or C-band) radars to fill in coverage gaps between WSR-88Ds 2
(McLaughlin et al. 2009). Brotzge et al. (2010) and Mahale et al. (2012) demonstrated the value 3
of gap filling radars for improving detection of tornado radar signatures. A third option for 4
improving radar coverage is to sample more frequently. Replacement of the WSR-88Ds with 5
rapid-scan, phased-array radar (PAR) technology (e.g., Zrnić et al. 2007) could provide 1-min 6
volume scans (or faster single elevation scans), an improvement over the current 4-6 min volume 7
scans provided by the WSR-88Ds. In ongoing evaluations of the impact of PAR data on tornado 8
warnings, Heinselman et al. (2012, 2013) found that the use of faster scans has the potential to 9
extend tornado warning lead times, reduce false alarms, and increase forecaster confidence. 10
Finally, a more rigorous, optimal radar network configuration could improve overall low-level 11
coverage. NEXRAD radars were originally deployed to operate as single autonomous systems, 12
but merged, multi-radar data has proven more effective for extracting severe weather information 13
(Lakshmanan et al. 2006). Geometric, statistical and genetic algorithm techniques have been 14
developed to optimize the low-level coverage and maximize multi-Doppler overlap (Ray and 15
Sangren 1983; de Elia and Zawadzki 2001; Minciardi et al. 2003; Junyent and Chandrasekar 16
2009; Kurdzo and Palmer 2012). Nevertheless, the addition and/or replacement of radars will 17
require a significant financial public investment. 18
Storm spotters provide an equally critical role to the warning forecaster. In the root cause 19
analysis study, a lack of conflicting or erroneous spotter reports were cited as having contributed 20
to warning failure in nearly 2/3 of all missed events, and a lack of reports contributed to 15 of 31 21
false alarms (Quoetone et al. 2009). Sustained education and coordination of spotter groups 22
requires dedicated NWS resources. Fortunately as described previously, access to real-time 23
57
information and video from the field is becoming easier, with the proliferation of new video and 1
wireless technologies (e.g., Dixon et al. 2012). 2
A basic understanding of tornado dynamics still is key to good forecasting and detection. In 3
the Quoetone et al. (2009) root cause analysis study, “Not Anticipated”, “Conceptual model 4
failure”, and “Environment” were listed among the top six reasons for warning misses. Poor 5
radar, environmental conceptual models and environment were listed as three of the top four 6
reasons cited for issuing tornado false alarms. The “Fits radar conceptual model” was cited in 30 7
of the 31 false alarms events studied. Continued improvement in the conceptual models requires 8
sustained advances in basic research. Field programs such as VORTEX (Rasmussen et al. 1994) 9
and VORTEX2 (Wurman et al. 2012) provide valuable observational data from which to study 10
and improve understanding. Continued meteorological training and education is essential for 11
moving research to operations. 12
Finally, with the plethora of new sensors and model output now available to the warning 13
forecaster, many are now experiencing data overload, which is hampering warning operations. 14
“Workload” was cited in 1/3 of all missed warnings, with “Distractions” cited in ¼ of all missed 15
warnings (Quoetone et al. 2009). One solution to this is the use of integrated, “fused” and/or 16
assimilated sensor products (e.g., Wang et al. 2008). A second, complimentary solution is the 17
advent of multi-sensor and three-dimensional visualization (e.g., Gibson Ridge Software, LLC). 18
19
20
21
22
23
24
58
WARNING DECISION CHALLENGES <SIDEBAR #3> 1
2
A significant challenge to the forecaster is reducing the FAR while keeping the POD steady 3
or improving (Brooks 2004). Yet the value provided by the statistical measures (POD, FAR) is 4
ambiguous. For example, POD is dependent largely upon the level of verification. FAR fails to 5
account for close calls (Barnes et al. 2007) and varies with parameters such as tornado order, 6
climatology, and distance from radar (Brotzge et al. 2011). While the POD, FAR, and warning 7
lead time are frequently-cited indices for measuring our ability to warn, additional improvement 8
in these numbers may not translate necessarily into a reduction in tornado casualty rates. All of 9
the deaths on the 27 April 2011 tornado outbreak occurred from tornadoes within active tornado 10
watches and preceded by tornado warnings (NOAA 2011b). Reasons for the high number of 11
casualties from the April event include the rapid speed and severity of the event, the high 12
population density of the areas hit, and delays in seeking shelter. Simmons and Sutter (2008) 13
found warning lead times > 15 min had little additional impact on fatality rates. 14
The impact of false alarms on public response is unknown. Early research found that false 15
alarms may unexpectedly increase the likelihood of future response (Janis 1962). More 16
intuitively, Simmons and Sutter (2009) found that “a one-standard-deviation increase in the 17
false-alarm ratio increases expected fatalities by between 12% and 29% and increases expected 18
injuries by between 14% and 32%.” Other studies (mostly qualitative case studies) remain 19
divided on the role of false alarms in the response process (Breznitz 1984, Atwood and Major 20
1998, Dow and Cutter 1998, Barnes et al. 2007). 21
A second emergent challenge for the warning forecaster is how to best blend information 22
from automated algorithms, nowcasting, and NWP model output with conceptual models and 23

59
human experience (Stuart et al. 2006). At least in the short term, such output have limitations 1
(e.g., Andra et al. 2002), and their use may be limited best as a check or calibration against the 2
conceptual model. 3
4
5
6
7
8
9
10
11
12
13
14
15
16
17
18
19
20
21
22
23
24
25
60
WARNING DISSEMINATION CHALLENGES <SIDEBAR #4> 1
2
A significant challenge in improving warning dissemination is to integrate new technologies 3
in such a manner that those less able to afford such tools can still be warned. The Commercial 4
Mobile Alert System (CMAS), Wireless Emergency Alerts (WEA), and Interactive NWS 5
(iNWS) were recently created to disseminate warnings to mobile devices. However, many are ill 6
equipped to receive text messaging, and so older warning systems, such as outdoor warning 7
sirens, must still play a critical role within an integrated warning system, even as new, more 8
informative services are made available. 9
The limitations of dissemination tools must be clearly recognized when building a public 10
warning dissemination system. For example, mobile phone applications fail if and when cell 11
phone towers and communications are disabled, a frequent problem in storm ravaged areas. 12
Similarly, outdoor warning sirens fail when power is lost to those sirens, such as occurred in 13
some areas during the Alabama tornadoes of 27 April, 2011. The use of outdoor sirens also 14
varies significantly among jurisdictions, with some districts using them to warn on all severe 15
thunderstorm (and sometimes non-weather) related warnings, while other municipalities limit the 16
use of sirens to tornado warnings only. Furthermore, many areas simply do not have sirens 17
available, nor would it be cost-effective to install sirens in many regions of the country. 18
However, the consequences of not having sirens can be deadly; two people died in the 2011 19
Alabama tornadoes when early morning storms knocked out power to their trailer, and because 20
they lived out of range of the nearest sirens, had no warning before they were hit (Ammons 21
2011). Some jurisdictions have replaced all outdoor sirens with calling systems such as Reverse 22
911. However, these systems have been known to take tens of minutes to call all those in the 23
61
tornado path, with no guarantee that those called would be alerted prior to tornado impact. 1
Battery-operated NWR provides an immediate and direct warning method, but NWR ownership 2
is low with limited surveys showing ownership of ~10 to 33% (Manning 2007; Kramlich 2007). 3
NWR often is cited as the least-used method for obtaining warnings; only 3% of 1,650 persons 4
surveyed just after the 3 May 1999 tornado in Moore, Oklahoma, indicated they had received 5
their warning from NWR (Brown et al. 2002). While each system has certain limitations, an 6
integrated and redundant dissemination system is more robust. In a survey following the 3 May 7
1999 Moore, Oklahoma tornado, 55% of residents interviewed received the warning from more 8
than one source (Hammer and Schmidlin 2002). 9
Another challenge for the operational forecaster is how to effectively communicate scientific 10
information to the general public. Instantaneous communication and the growth of 11
meteorological support companies have had a significant impact on the warning process (Golden 12
and Adams 2000). As a result, institutions now communicate risk with unprecedented speed. 13
Nevertheless, problems related to the expertise of institutions may affect the process of risk 14
communication. For example, a recent experiment simulating a tornado outbreak tasked EMs 15
with accessing and interpreting radar data (Baumgart et al. 2008). Despite general competence, 16
study participants experienced significant difficulties interpreting wind velocity data and, more 17
importantly, synthesizing multiple forms of radar data to produce overall judgments, which 18
affected the risk communication process 19
Effective communication also entails that the public understands and makes effective use of 20
warnings (Lazo 2012). The risk communication process is most effective when those at risk hold 21
a “perceived shared experience” with those already victimized (Aldoorya et al. 2010). When 22
those warned could relate to victims (e.g., similar gender or race), threat acknowledgement and 23
62
information seeking increased. Thus, risk communication may be taken more seriously if nearby 1
communities are affected. How warnings are communicated also may shape risk 2
communication. Numerical representations of risk often fail to persuade (Lipkus and Hollands 3
1999). In an experiment on risk perception of flooding, images depicting flood damage 4
reinforced perceived risks (Keller et al. 2006). NOAA is now conducting an Impact Based 5
Warning experiment (Maximuk and Hudson 2012) to evaluate ways in which to improve NWS 6
communication to motivate improved public response. 7
8
9
10
11
12
13
14
15
16
17
18
19
20
21
22
23
24
25
63
PUBLIC RESPONSE CHALLENGES <SIDEBAR #5> 1
2
Although the determinants of shelter seeking are well documented in the literature, little is 3
known about the sheltering process itself. Personal shelters are ideal in that sheltering is 4
immediate; traveling to a public shelter may be dangerous, especially in the context of tornadoes 5
which are rapid and violent in onset. For those in mobile homes or similar vulnerable structures 6
without shelters, evacuation may be the only option; mobile homes comprised 7.6% of U.S. 7
housing stock in 2000, but 43.2% of all tornado fatalities between 1985 and 2007 occurred in 8
mobile homes (Sutter and Simmons 2010). In addition to distance, other more “human” factors 9
may shape the use of shelters. Cola (1996) found that people were less likely to use shelters 10
thought uncomfortable. Pet owners also may be less likely to seek shelter (Heath 1999; Pfister 11
2002). More research is needed to understand shelter use and its relationship to lead time and 12
social factors. Additional work needs to explore the associated needs, optimal locations, and 13
operation of public tornado shelters. 14
There is also the real inability by some to take shelter due to disability. In the Joplin, 15
Missouri, tornado, three mentally handicapped men died when their home was hit. Also in 16
Joplin, twelve residents and a nursing assistant died at the Greenbriar nursing home, and another 17
eight patients died when St. Johns hospital was hit. Both facilities had been warned and had 18
begun taking storm precautions, but neither had enough lead time to evacuate. In Shoal Creek, 19
Alabama, seven people were killed when an assisted living facility was hit. Additional research 20
is needed to explore the lead time requirements for those who must evacuate (e.g., from trailer 21
homes) or need help sheltering (e.g., those with special needs). Indeed, the public at-large 22

64
requires a continuum of lead times, where for some a warning lead time of well over 30 min 1
could be essential, whereas for others, a large lead time could lead to apathy and greater danger. 2
3
4
5
6
7
8
9
10
11
12
13
14
15
16
17
18
19
20
21
22
23
24
25

65
Figure Caption List: 1
2
Fig. 1: Summary of the institutional and individual responses that comprise the tornado warning 3
process. 4
5
6
7
8
9
10
11
12
13
14
15
16
17
18
19
20
21
22
23
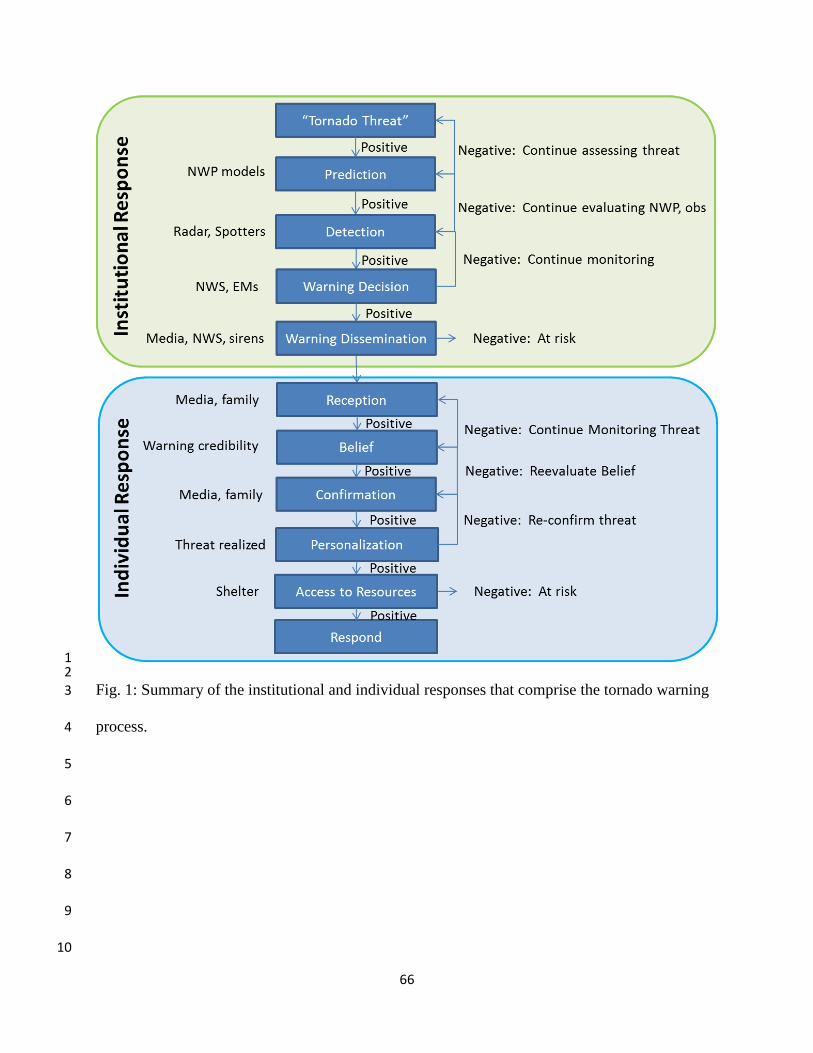
66
1 2
Fig. 1: Summary of the institutional and individual responses that comprise the tornado warning 3
process. 4
5
6
7
8
9
10
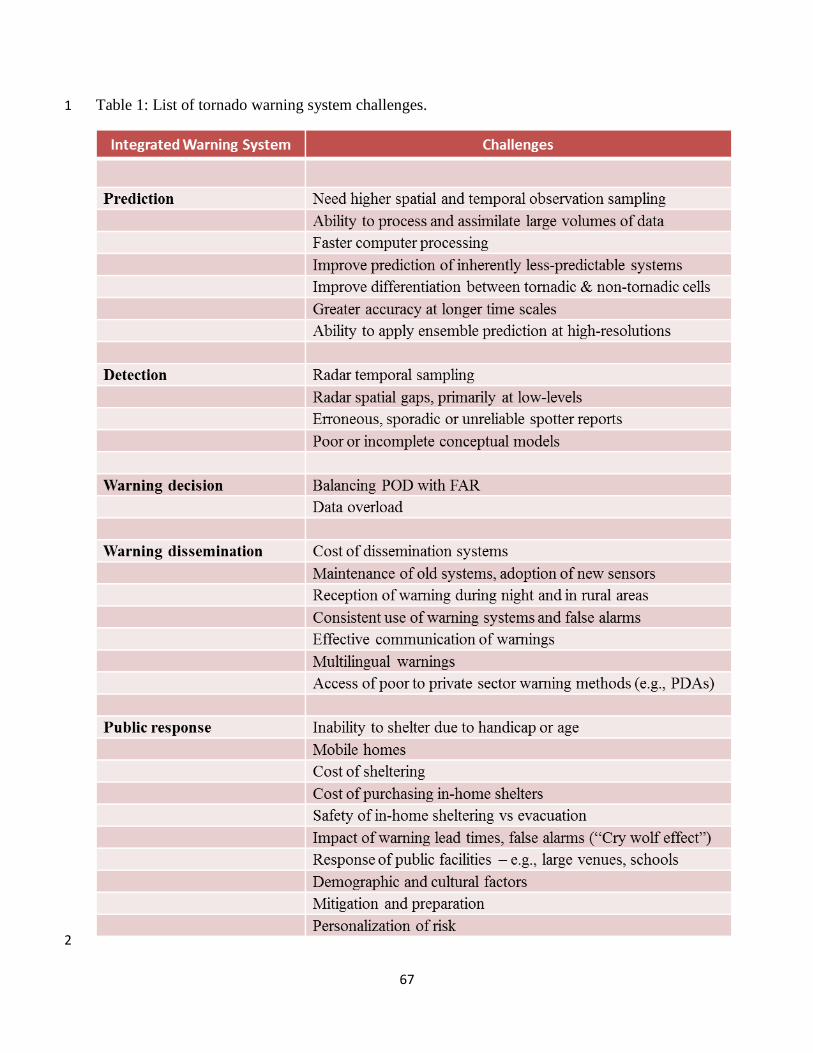
67
Table 1: List of tornado warning system challenges. 1
2