body weight status, eating behavior, sensitivity to reward...
TRANSCRIPT

ORIGINAL RESEARCH ARTICLEpublished: 20 October 2014
doi: 10.3389/fpsyg.2014.01073
Body weight status, eating behavior, sensitivity toreward/punishment, and gender: relationships andinterdependenciesAnja Dietrich1*†, Martin Federbusch1,2 †, Claudia Grellmann1,2 , Arno Villringer 1,2,3,4,5 and
Annette Horstmann1,2,6
1 Department of Neurology, Max Planck Institute for Human Cognitive and Brain Sciences, Leipzig, Germany2 IFB Adiposity Diseases, Leipzig University Medical Center, Leipzig, Germany3 Clinic for Cognitive Neurology, University Hospital Leipzig, Leipzig, Germany4 Mind and Brain Institute, Berlin School of Mind and Brain, Humboldt-University and Charité, Berlin, Germany5 Collaborative Research Center 1052A1, University of Leipzig, Leipzig, Germany6 Collaborative Research Center 1052A5, University of Leipzig, Leipzig, Germany
Edited by:
Tanya Zilberter, Infotonic Conseil,France
Reviewed by:
Caroline Davis, York University,CanadaGilly Koritzky, University of SouthernCalifornia, USA
*Correspondence:
Anja Dietrich, Department ofNeurology, Max Planck Institute forHuman Cognitive and Brain Sciences,Stephanstraße 1a, Leipzig 04103,Germanye-mail: [email protected]†Anja Dietrich and Martin Federbuschhave contributed equally to this work.
Behavioral and personality characteristics are factors that may jointly regulate bodyweight. This study explored the relationship between body mass index (BMI) and self-reported behavioral and personality measures. These measures included eating behavior(based on theThree-Factor Eating Questionnaire; Stunkard and Messick, 1985), sensitivityto reward and punishment (based on the Behavioral Inhibition System/Behavioral ActivationSystem (BIS/BAS) scales) (Carver and White, 1994) and self-reported impulsivity (based onthe Barratt Impulsiveness Scale-11; Patton et al., 1995). We found an inverted U-shapedrelationship between restrained eating and BMI. This relationship was moderated by thelevel of disinhibited eating. Independent of eating behavior, BIS and BAS responsivenesswere associated with BMI in a gender-specific manner with negative relationshipsfor men and positive relationships for women. Together, eating behavior and BIS/BASresponsiveness accounted for a substantial proportion of BMI variance (men: ∼25%,women: ∼32%). A direct relationship between self-reported impulsivity and BMI wasnot observed. In summary, our results demonstrate a system of linear and non-linearrelationships between the investigated factors and BMI. Moreover, body weight statuswas not only associated with eating behavior (cognitive restraint and disinhibition), but alsowith personality factors not inherently related to an eating context (BIS/BAS ). Importantly,these relationships differ between men and women.
Keywords: eating behavior, gender differences, obesity, personality traits, reward sensitivity, punishment
sensitivity, Behavioral Activation System, Behavioral Inhibition System
INTRODUCTIONBody weight regulation and the development of obesity are asso-ciated with multiple interdependent factors and mechanisms.These mechanisms include, at the individual level, genetic andendocrine factors as well as behavioral and personality char-acteristics (e.g., Williamson et al., 1995; Bellisle et al., 2004;Provencher et al., 2004; Dina et al., 2007; Farooqi et al., 2007;Frayling et al., 2007; Klok et al., 2007; Ahima, 2008; Davis andFox, 2008; Rosenbaum et al., 2008; Page et al., 2011). One ofthe most important factors contributing to body weight statusis eating behavior, which is commonly assessed by the Three-Factor Eating Questionnaire (TFEQ; Stunkard and Messick, 1985).The TFEQ measures three dimensions of eating behavior: cog-nitive restraint (CR), disinhibition (DIS), and susceptibility tohunger or hunger (HUN), for short. Cognitive restraint mea-sures individual control over eating. Restrained eaters attemptto suppress impulses to eat in order to pursue long-term weightgoals. Typical characteristics are avoidance of fattening foodsand eating of small portions. The factor disinhibition reflects
overeating tendencies. Disinhibited eaters typically initiate eat-ing because of external environmental cues, such as palatablefood. They have difficulties resisting food stimulation and/oreat under emotional distress. Considering this, cognitive restraint(conscious restriction of food intake) and disinhibition (tendencyto overeat) conceptually represent antagonistic concepts. Thethird factor, hunger, characterizes the extent to which hungerfeelings are experienced and evoke food intake. While hungerand disinhibition are positively associated with body mass index(BMI; e.g., Bond et al., 2001; Boschi et al., 2001; Bellisle et al.,2004; Bryant et al., 2008; Lesdéma et al., 2012), the relation-ship of cognitive restraint and BMI seems to be more complexand non-linear: In normal weight individuals they are usuallypositively associated, but the relationship is typically negativein overweight and obese individuals (e.g., Foster et al., 1998;Lluch et al., 2000; Bellisle et al., 2004; Provencher et al., 2004;de Lauzon-Guillain et al., 2006; Cappelleri et al., 2009). Addi-tionally, cognitive restraint and disinhibition are not indepen-dently related to BMI, they interactively influence body weight
www.frontiersin.org October 2014 | Volume 5 | Article 1073 | 1
Dietrich et al. Relationship BMI, TFEQ, BIS/BAS, and gender
status (Stunkard and Messick, 1985; Westenhoefer et al., 1990;Williamson et al., 1995; Hays et al., 2002; Dykes et al., 2004).Specifically, cognitive restraint attenuates the effect of disinhibi-tion on BMI. What is more, previous investigations indicate thateating behavior (including presumably also underlying biologi-cal mechanisms) and body weight status mutually influence eachother. For example, there are alterations in the level of cogni-tive restraint as well as disinhibition in response to dieting (e.g.,Karlsson et al., 1994; Pekkarinen et al., 1996; Foster et al., 1998;Westerterp-Plantenga et al., 1998; Dalle Grave et al., 2009; Savageet al., 2009; Tucker and Bates, 2009).
In addition to eating behavior, various personality traits arerelated to food consumption and weight status (Faith et al., 2001;Elfhag and Morey, 2008). One of the most popular modelsof personality that may explain individual variations in foodintake is the reinforcement sensitivity theory (RST; Gray, 1970,1982, 1987; Gray and McNaughton, 2000). Based on this the-ory, two general motivational systems that underlie behaviorand affect have been suggested—the Behavioral Inhibition Sys-tem (BIS) and the Behavioral Activation System (BAS), commonlyassessed by the BIS/BAS scales (Carver and White, 1994). TheBIS represents the aversive motivational system. It is sensitiveto signals of punishment, reward omission, and novelty. TheBIS is supposed to inhibit behavior that may lead to negativeor painful outcomes and is associated with negative affect (nega-tive reinforcement). The BAS reflects the appetitive motivationalsystem. It is sensitive to signals of reward and the avoidanceof punishment (positive reinforcement). High BAS responsive-ness is related to enhanced approach behavior and positiveaffect.
As food can be both a positive or negative reinforcer, respon-siveness of these systems potentially plays a substantial role inbody weight regulation. However, the relationship between sen-sitivity to reward (as a facet of BAS responsiveness) and BMIhas been almost exclusively investigated in women. Investigationsshowed positive associations of reward sensitivity with BMI andeating habits supporting weight gain (Davis et al., 2004, 2007;Franken and Muris, 2005). In addition, reward responsivenesshas been related to neural responses. In particular sensitivityto reward was shown to be positively associated with neuralresponses to pictures of highly palatable food in a fronto-striatal-amygdala network (Beaver et al., 2006). Further findings indicatethat long-lasting overeating and obesity account for adapta-tions of the reward system (Wang et al., 2001; Volkow et al.,2008; de Weijer et al., 2011). In combination with the afore-mentioned findings, these studies led to the development of ahyper- vs. hyposensitivity theory of reward in obesity (e.g., Davisand Fox, 2008). According to this theory, some individuals showan inherent heightened reward sensitivity (hypersensitivity) andare particularly susceptible to the rewarding properties of high-calorie food. They are thus supposed to regularly overeat onfattening food and consequently become overweight or obese.Prolonged overeating and corresponding obesity, on the otherhand, are associated with alterations in the dopaminergic (DA)reward circuitry, presumably to compensate for an enhancedDA tone (Wang et al., 2001; Volkow et al., 2008; de Weijer et al.,2011). These alterations are assumed to result in hyposensitivity
to reward in obese individuals as well as in increased hedoniceating to compensate this deficiency. This theory was exploredby Davis and Fox (2008). According to their model, in bothgenders BMI and sensitivity to reward are non-linearly asso-ciated by an inverted U-shaped relationship. More specifically,the authors reported high reward sensitivity in overweight andmildly obese participants and low reward sensitivity in morbidlyobese ones. Thus, although sensitivity to reward and sensitiv-ity to punishment are assumed to be dispositional traits ratherthan transient states or symptoms (Wilksch and Wade, 2009),at least sensitivity to reward seems to be flexible to a certainextent.
To our knowledge, the association between sensitivity to pun-ishment and BMI so far has not yet been studied directly, althoughseveral studies demonstrate a relationship between sensitivityto punishment and eating disorders. Similar to obese subjects,patients suffering from bulimia nervosa and anorexia nervosa(binge/purge subtype) are characterized by overeating. This pointsat possible similarities in the underlying personality structureleading to a shared decision-making profile (Brogan et al., 2010).Studies investigating eating disorders repeatedly report high pun-ishment responsiveness in patients compared to healthy controls(e.g., Harrison et al., 2010, 2011). In addition, sensitivity to pun-ishment has been shown to be positively associated with symptomsof binge eating (Davis, 2013). Again, these studies are almostexclusively restricted to women. Matton et al. (2013) clusteredadolescents with respect to reward and punishment responsive-ness. Interestingly, the cluster of subjects with both high rewardsensitivity and high punishment sensitivity outscored other clus-ters on self-reported eating problems (i.e., data regarding concernsabout eating, body shape and weight as well as emotional andexternal eating). Although girls were more likely to belong tothis cluster, effects were similar for both girls and boys. Based onthese findings, Matton et al. (2013) proposed that adolescents inthis cluster are especially vulnerable to the development of eatingproblems.
Sensitivity to reward is regarded as one aspect of the multi-dimensional psychological construct impulsivity (e.g., Guerrieriet al., 2008). Generally, impulsive behavior is rapid and rash,characterized by a lack of planning and less forethought aboutconsequences of spontaneous actions (Moeller et al., 2001). As theterm “multidimensionality” indicates, impulsivity covers severaldifferent but related concepts. The relationship to overeating isthus not straightforward. While individual differences in someaspects of impulsivity are likely to contribute to the ability toresist overeating, others may not. Various tasks that assess aspectsof impulsive behavior indicate altered decision-making in over-weight and obese individuals. In Delay Discounting Tasks or DelayGratification Paradigms, for example, obese subjects in general(Rasmussen et al., 2010) or obese women in particular (Welleret al., 2008; Weygandt et al., 2013) chose more often immediate butsmaller monetary or food-related reward in comparison to normalweight control subjects. In the Iowa Gambling Task obese volun-teers preferred high immediate reward despite long-term losses.This was shown in both genders (Pignatti et al., 2006; Brogan et al.,2011), women (Horstmann et al., 2011), or men (Koritzky et al.,2012). In addition, obese women and children of both genders
Frontiers in Psychology | Eating Behavior October 2014 | Volume 5 | Article 1073 | 2

Dietrich et al. Relationship BMI, TFEQ, BIS/BAS, and gender
lacked appropriate inhibitory control in the non-reward relatedStop Signal Task (Nederkoorn et al., 2006a,b). Another task mea-suring inhibitory control, the Go/No-Go Task, showed especiallyoverweight and obese adolescent girls to have difficulties inhibitingprepotent motor responses to high-calorie food (Batterink et al.,2010). Heightened impulsivity was also reported for overweightchildren (Braet et al., 2007) as well as overweight and obese adults(e.g., Chalmers et al., 1990; Mobbs et al., 2010) based on differentself-reported measures. For example, Mobbs et al. (2010) reportedhigher levels of urgency, lack of perseverance and strong sensitivityto reward in overweight and obese women. They concluded thatoverweight and obesity are associated with problems in inhibit-ing dominant behavior and intrusive thoughts. Within the obesepopulation, there is evidence for heightened self-reported impul-sivity among severely compared to less severely obese individuals(Rydén et al., 2003), and impulsivity was further related to higherfood intake in women using the Barratt Impulsiveness Scale (BIS;Guerrieri et al., 2007).
An important factor that contributes to differences in eatingbehavior and personality, and probably also to body weight reg-ulation, is gender. Women, for example, have higher scores ofcognitive restraint and disinhibition compared to men (Bellisleet al., 2004; Provencher et al., 2004; Li et al., 2012). Addition-ally, eating disorder symptomatology is more prevalent amongwomen (e.g., Keel et al., 2007; Matton et al., 2013; Yean et al.,2013). Furthermore, men and women differ in personality traitssuch as impulsivity. For example, higher sensation seeking andbehavioral risk taking was observed in men compared to women(Arnett, 1992; Byrnes et al., 1999; Cross et al., 2011). Addition-ally, both gender-independent and gender-specific effects havebeen reported, for example, with respect to the Iowa GamblingTask and weight status (Pignatti et al., 2006; Brogan et al., 2011;Horstmann et al., 2011; Koritzky et al., 2012). The precise rela-tionship between impulsivity, BMI and gender thus is not clearfrom previous data. Furthermore, women are more sensitiveto both reward and punishment compared to men (Carver andWhite, 1994; Jorm et al., 1999; Cross et al., 2011). Yet, the relation-ship of these measures to weight status has not been sufficientlyexplored in males, as described earlier. Differences in the hor-monal repertoire between men and women might account forvariations in the susceptibility to reinforcers like food. Ovarianhormones in particular, which affect mesolimbic DA system (i.e.,reward processing; Sofuoglu et al., 1999; Kaasinen et al., 2001;Evans et al., 2002; Lynch et al., 2002; Carroll et al., 2004) but alsoHPA functioning (i.e., stress response; Burgess and Handa, 1992;Handa et al., 1994; Patchev et al., 1995; Young, 1995), might beresponsible for such differences, making women generally morevulnerable to the reinforcing properties of most drugs of abuse(see Fattore et al., 2008, 2009 for review). As addiction and obe-sity share several properties (see Volkow et al., 2013 for review),there might be also gender differences in the susceptibility tothe reinforcing value of food. For other personality domainsand their association with weight status, the gender interactionhas already been shown. In a study by Faith et al. (2001) BMIwas positively associated with neuroticism and negatively withextraversion in women. In men, BMI was positively associatedwith extraversion and psychoticism (Faith et al., 2001). Finally,
gender moderates obesity-related differences in brain structure.Specifically for women obesity-related variation were observed inregions involved in habitual and goal-directed control of behav-ior such as the dorsal striatum and dorsolateral prefrontal cortex(Horstmann et al., 2011).
Therapeutic approaches to obesity classically target aspects ofeating behavior. Behavioral interventions, for example, aim atincreasing cognitive restraint and decreasing disinhibition (e.g.,Jubbin and Rajesh, 2012). Yet, as described above, individualbody weight status is also related to personality traits. For a moreeffective treatment of obesity it is therefore necessary to regardpersonality traits as well. This study aims to establish a comprehen-sive model relating BMI to eating behavior and the most relevantobesity-related personality traits (self-reported impulsivity andreward/punishment sensitivity). We investigated questionnairemeasures of these traits as they can be easily and quickly assessedin the clinical setting. TFEQ scales cognitive restraint, disinhibi-tion, and hunger (Stunkard and Messick, 1985) served as measuresof eating behavior. The BIS/BAS scales (Carver and White, 1994)were considered as measures of sensitivity to punishment (BIS)and sensitivity to reward (BAS). Further, self-reported impulsiv-ity, assessed by the BIS-11 (Patton et al., 1995), was incorporatedinto the model. The overall goal of our approach was to quan-tify the individual and joint contribution of these scales to BMIvariance explanation.
Based on previous findings, different models were developedto test the following hypotheses:
(1) A significant proportion of BMI variance is explained bydisinhibition, hunger, and cognitive restraint. According toprevious findings, we assumed positive linear associations ofboth disinhibition and hunger with BMI (e.g., Bond et al.,2001; Boschi et al., 2001; Bellisle et al., 2004; Bryant et al.,2008; Lesdéma et al., 2012). As cognitive restraint and BMI arepositively associated in normal weight individuals and nega-tively in overweight and obese individuals (e.g., Foster et al.,1998; Lluch et al., 2000; Bellisle et al., 2004; Provencher et al.,2004; de Lauzon-Guillain et al., 2006; Cappelleri et al., 2009),we expected an inverted U-shaped relationship between thesevariables.
(2) A portion of BMI variance is explained by the interactionof disinhibition and cognitive restraint, indicated by previ-ous studies (Stunkard and Messick, 1985; Westenhoefer et al.,1990; Williamson et al., 1995; Hays et al., 2002; Dykes et al.,2004).
(3) Additional BMI variance is explained by the level of BIS (as ameasure of punishment responsiveness) and BAS (as a mea-sure of reward responsiveness). Based on previous research,we expected positive linear associations for both variables withBMI in women (Davis et al., 2004, 2007; Franken and Muris,2005; Harrison et al., 2010, 2011). Despite the lack of previousdata for these relationships in men, we expect the positive rela-tionships between BIS/BAS and BMI to be specific for women,which is based on gender-dependent differences in the hor-monal repertoire influencing the vulnerability to reinforcers(e.g., Sofuoglu et al., 1999; Kaasinen et al., 2001; Evans et al.,2002; Lynch et al., 2002; Carroll et al., 2004).
www.frontiersin.org October 2014 | Volume 5 | Article 1073 | 3

Dietrich et al. Relationship BMI, TFEQ, BIS/BAS, and gender
(4) Further, BMI variance is explained by the level of self-reportedimpulsivity (BIS-11). According to previous findings, weexpected a positive linear association with BMI (e.g., Chalmerset al., 1990; Rydén et al., 2003; Mobbs et al., 2010). Consider-ing opposing findings with respect to gender (Pignatti et al.,2006; Brogan et al., 2011; Horstmann et al., 2011; Koritzkyet al., 2012), we tested for gender interactions, although theywere not expected.
Besides the study’s main purpose of modeling BMI, we had twosecondary objectives:
(5) Cognitive restraint, disinhibition, and body weight status mutu-ally influence each other (e.g., Karlsson et al., 1994; Pekkarinenet al., 1996; Foster et al., 1998; Westerterp-Plantenga et al.,1998; Dalle Grave et al., 2009; Savage et al., 2009; Tucker andBates, 2009). Therefore, we hypothesized the quadratic rela-tionship between BMI and cognitive restraint to be moderatedby disinhibition. Depending on the level of disinhibition, weexpected the association of BMI and cognitive restraint to beas follows: Normal body weight and low disinhibition is asso-ciated with low cognitive restraint. Normal body weight andhigh disinhibition is associated with high cognitive restraint.Overweight is associated with high cognitive restraint regard-less of the level of disinhibition. Obesity is associated with lowcognitive restraint regardless of the level of disinhibition.
(6) Davis and Fox (2008) demonstrated an inverted U-shaped rela-tionship between sensitivity to reward and BMI. We aimedto corroborate these findings by testing for a quadratic rela-tionship between BAS and BMI. We hypothesized an invertedU-shaped relationship between these measures.
As the focus of this investigation was on self-report question-naires, i.e., explicit, mentally represented data, this study did notconsider implicit or automatic processes (i.e., eating habits) thatinfluence behavior and potentially body weight independently ofexplicit experience (e.g., Berridge and Robinson, 2003; Finlaysonet al., 2008; Papies et al., 2009; Goldstein et al., 2014).
MATERIALS AND METHODSSUBJECTSData were collected by the joint obesity work group of the MaxPlanck Institute for Human Cognitive and Brain Sciences andthe IFB Adiposity Diseases in Leipzig between 2009 and 2013.Healthy adult subjects were invited to participate in differentbehavioral and neurocognitive experiments in the context of obe-sity research and were reimbursed for their participation. Aspart of these experiments, subjects completed various question-naires this cross-sectional study is based on. Exclusion criteriawere age under 18 or over 50 years, BMI under 18 kg/m2,hypertension, dyslipidemia, metabolic syndrome, depression(Beck’s Depression Inventory, cut-off value 18), a history ofneuropsychiatric diseases, smoking, diabetes mellitus, vegetari-anism, and pregnancy. Although there were no restrictions forethnicity, only Caucasian subjects volunteered. Age in years andBMI were assessed at the time of the experiment. Height andweight for BMI calculations were measured by scientific staff atthe Max Planck Institute in Leipzig. As not all questionnaires
Table 1 | Descriptive statistics.
Variable n Mean (SD) Range Mean
women (SD)
Mean
men (SD)
BMI 326 26.6 (6.1) 18.1–46.5 26.4 (6.6) 26.7 (5.6)
192 26.7 (6.2) 18.1–46.5 26.6 (6.5) 26.8 (6.0)
Age 326 26.7 (4.8) 18–46 26.3 (4.8) 27.0 (4.9)
192 26.6 (4.7) 18–46 25.7 (4.1) 27.2 (5.0)
CR 326 6.5 (4.6) 0–19 7.3 (5.0) 5.8 (4.1)
192 6.7 (4.7) 0–19 7.4 (5.0) 6.2 (4.4)
DIS 326 6.1 (3.2) 0–15 6.8 (3.5) 5.6 (2.8)
192 6.1 (3.0) 1–14 6.8 (3.3) 5.6 (2.6)
HUN 326 5.5 (3.3) 0–14 5.6 (3.3) 5.5 (3.3)
192 5.6 (3.3) 0–14 5.9 (3.4) 5.4 (3.3)
BAS 192 30.9 (8.8) 13–51 29.7 (8.5) 31.8 (9.0)
BIS 192 17.0 (3.9) 5–26 16.5 (4.3) 17.4 (3.4)
BIS-11 192 32.2 (8.7) 9–58 32.0 (8.8) 32.3 (8.6)
Descriptive statistics of variables assessed in the TFEQ-only cohort (n = 326,145 women, 181 men) and the TFEQ-plus cohort (subgroup of TFEQ-only cohort(grey), n = 192, 82 women, 110 men). CR, TFEQ cognitive restraint score; DIS,TFEQ disinhibition score; HUN,TFEQ hunger score; BIS-11, Barratt ImpulsivenessScale 11 total score; BAS, Behavioral Activation System total score; BIS, Behav-ioral Inhibition System total score; TFEQ, Three-Factor Eating Questionnaire.
were assessed for all participants, we decided to investigate twocohorts (called TFEQ-only and TFEQ-plus cohort). The totalcohort consisted of 326 healthy subjects (TFEQ-only cohort; 145women, 181 men). Besides BMI, age, and gender, the TFEQscores of CR, DIS, and HUN were assessed in these subjects.In a subgroup of 192 participants, BIS, BAS, and BIS-11 wereadditionally assessed (TFEQ-plus cohort; 92 women, 110 men).Table 1 depicts descriptive statistics of the two cohorts. The studywas carried out in accordance with the Declaration of Helsinkiand approved by the local ethics committee of the Universityof Leipzig. All subjects gave written informed consent beforeparticipation.
QUESTIONNAIRESThree-Factor Eating Questionnaire (Stunkard and Messick, 1985;German version: Pudel and Westenhoefer, 1989)The TFEQ is a 51-item self-report assessment of eating behavior.The questionnaire contains three subscales. The 21-item cognitiverestraint scale (CR, scale range: 0–21, Cronbachs Alpha of Germanversion = 0.84) measures intent to control food intake. The 16-item disinhibition scale (DIS, scale range: 0–16, Cronbachs Alphaof German version = 0.75) quantifies overeating tendencies. The14-item susceptibility to hunger scale (HUN, scale range: 0–14,Cronbachs Alpha of German version = 0.76) is a measure for foodintake in response to feelings of hunger.
The Behavioral Inhibition System/Behavioral Activation SystemScales (Carver and White, 1994; German version: Strobel et al., 2001)This self-report questionnaire consists of 20 items designed toassess the responsiveness of Gray’s (1982, 1987) BAS and BIS as
Frontiers in Psychology | Eating Behavior October 2014 | Volume 5 | Article 1073 | 4
Dietrich et al. Relationship BMI, TFEQ, BIS/BAS, and gender
personality characteristics. The 7-item BIS scale measures reac-tivity of the aversive motivational system (scale range: 7–28,Cronbachs Alpha of German version = 0.78), whereas the 13-item BAS scale measures reactivity of the appetitive motivationalsystem (scale range: 13–52, Cronbachs Alpha of German ver-sion = 0.81). The BAS scale can be divided into three subscales:Drive, Fun-Seeking, and Reward. In this study we applied the BASsum score, as the subscales were not confirmed in the Germanversion.
Barratt Impulsiveness Scale-11 (Patton et al., 1995; German version:Preuss et al., 2008)The BIS-11 is a 30-item self-report questionnaire developedto measure impulsivity. Along a four-point scale subjects ratewhether statements describing impulsivity pertain to themselves(scale range: 0–90, Cronbachs Alpha of German version = 0.69).For the original English version, six factors were identified. Thisoriginally suggested factor structure was not confirmed for theGerman equivalent. We therefore applied the total score of the BIS-11, as it shows adequate internal consistency for German-speakingregions.
STATISTICAL ANALYSESStatistical analyses were performed using SPSS (IBM Corpora-tion Released 2011. IBM SPSS Statistics for Windows, Version20.0. Armonk, NY: IBM Corporation) and the SPSS toolboxPROCESS (Hayes, 2013). Associations between BMI and self-reported behavioral data were explored by means of multipleregression analyses. All variables except gender were treatedas continuous variables. We separately tested for the associa-tion between the three TFEQ scales and BMI in the TFEQ-onlycohort (see Association of the TFEQ Scales with BMI). Age andgender were included as covariates. Significant terms were sub-sequently used to build a regression model for BMI to assessthe proportion of variance solely explained by variables of eat-ing behavior (see BMI Modeling Based on the TFEQ ScalesCognitive Restraint and Disinhibition). Next, we tested BIS-11,BIS, and BAS seperately for their association with BMI in theTFEQ-plus cohort (see Association of the Barratt ImpulsivenessScale-11, Behavioral Activation System, and Behavioral InhibitionSystem Scales with BMI). Additionally, gender interactions forthe relationships of the latter three scores with BMI were tested.Age and gender were included as covariates. Again, all signifi-cant terms were used to build a comprehensive regression modelfor BMI including eating behavior and personality traits (seeBMI Modeling Based on Cognitive Restraint, Disinhibition, theBehavioral Activation System, and Behavioral Inhibition SystemScore).
Based on findings of previous studies, quadratic relationshipsbetween BMI and CR (moderated by DIS, see Interactions betweenCognitive Restraint, Disinhibition, and BMI) and between BMIand BAS (see Quadratic Relationship between BMI and theBehavioral Activation System Score) were tested (Foster et al.,1998; Lluch et al., 2000; Bellisle et al., 2004; Provencher et al.,2004; de Lauzon-Guillain et al., 2006; Davis and Fox, 2008;Cappelleri et al., 2009). BMI was treated as regressor for theseanalyses.
Table 2 | Regression models and corresponding variables.
Association with
regressand
Variables in
model
Tested gender
interaction
Linear A, g, a A*g
Quadratic (e.g., CR2) A, A2, g, a A2*g
2-way interaction
(DIS*CR)
A, B, A*B, g, a –
Quadratic 2-way
interaction (BMI2*DIS)
A, B, A2, A*B,
A2*B, g, a
–
Different regression models were computed to test our individual hypotheses.Corresponding variables of all the investigated models are listed. Partial correla-tions of the underlined terms were tested against 0. A, B: tested variables, e.g.,Three-Factor Eating Questionnaire cognitive restraint (CR) or disinhibition score(DIS); g, gender; a, age.
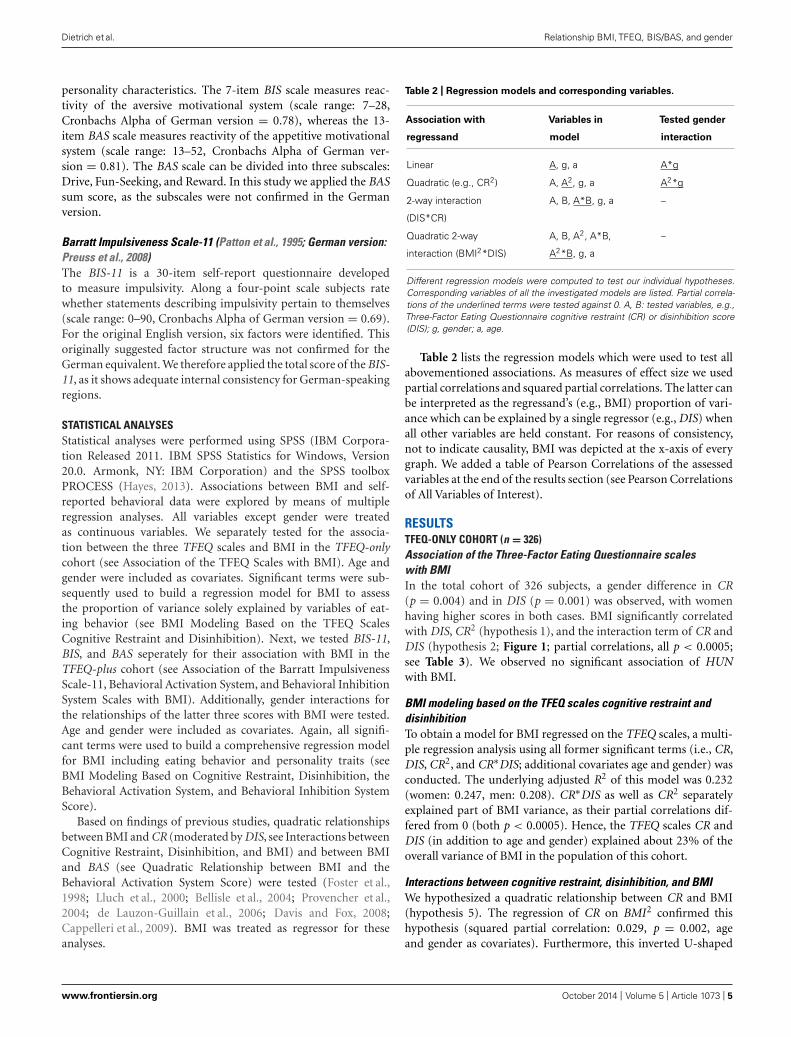
Table 2 lists the regression models which were used to test allabovementioned associations. As measures of effect size we usedpartial correlations and squared partial correlations. The latter canbe interpreted as the regressand’s (e.g., BMI) proportion of vari-ance which can be explained by a single regressor (e.g., DIS) whenall other variables are held constant. For reasons of consistency,not to indicate causality, BMI was depicted at the x-axis of everygraph. We added a table of Pearson Correlations of the assessedvariables at the end of the results section (see Pearson Correlationsof All Variables of Interest).
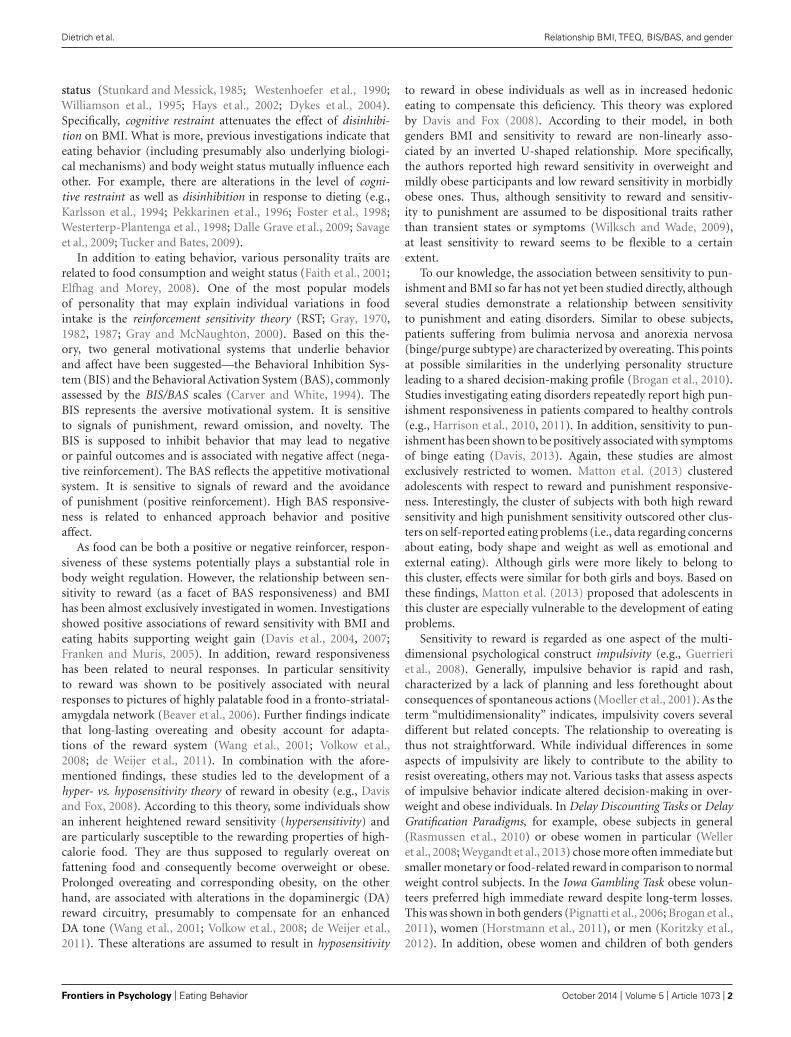
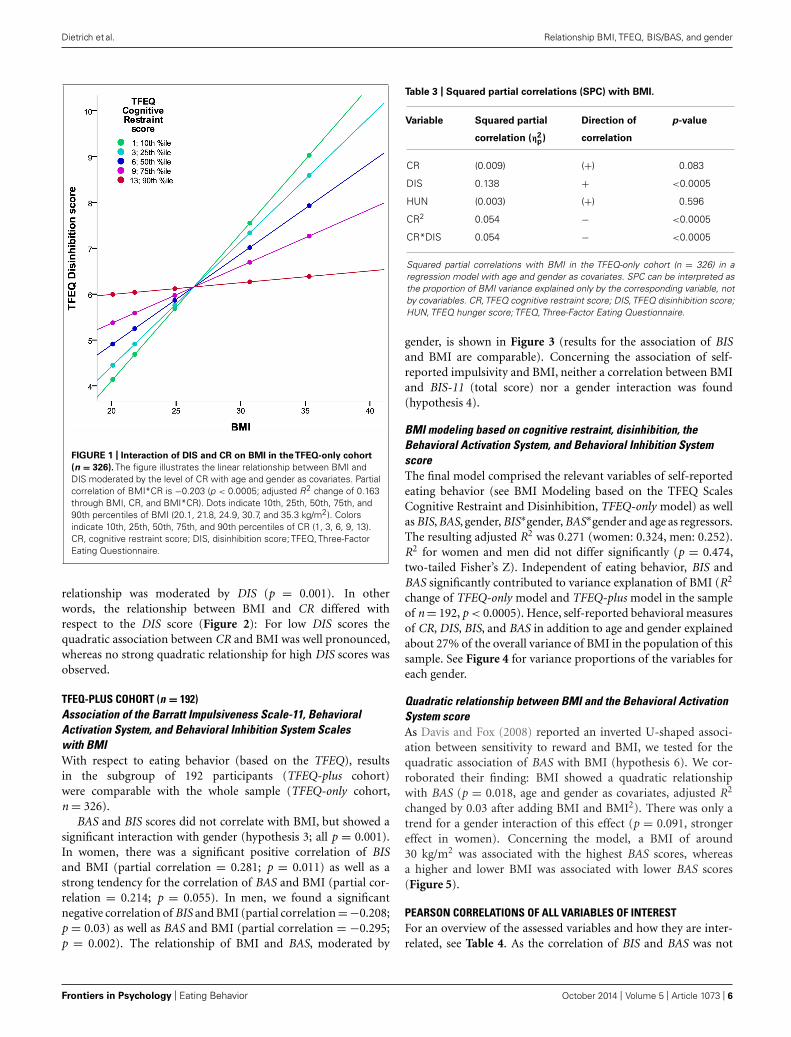
RESULTSTFEQ-ONLY COHORT (n = 326)Association of the Three-Factor Eating Questionnaire scaleswith BMIIn the total cohort of 326 subjects, a gender difference in CR(p = 0.004) and in DIS (p = 0.001) was observed, with womenhaving higher scores in both cases. BMI significantly correlatedwith DIS, CR2 (hypothesis 1), and the interaction term of CR andDIS (hypothesis 2; Figure 1; partial correlations, all p < 0.0005;see Table 3). We observed no significant association of HUNwith BMI.
BMI modeling based on the TFEQ scales cognitive restraint anddisinhibitionTo obtain a model for BMI regressed on the TFEQ scales, a multi-ple regression analysis using all former significant terms (i.e., CR,DIS, CR2, and CR∗DIS; additional covariates age and gender) wasconducted. The underlying adjusted R2 of this model was 0.232(women: 0.247, men: 0.208). CR∗DIS as well as CR2 separatelyexplained part of BMI variance, as their partial correlations dif-fered from 0 (both p < 0.0005). Hence, the TFEQ scales CR andDIS (in addition to age and gender) explained about 23% of theoverall variance of BMI in the population of this cohort.
Interactions between cognitive restraint, disinhibition, and BMIWe hypothesized a quadratic relationship between CR and BMI(hypothesis 5). The regression of CR on BMI2 confirmed thishypothesis (squared partial correlation: 0.029, p = 0.002, ageand gender as covariates). Furthermore, this inverted U-shaped
www.frontiersin.org October 2014 | Volume 5 | Article 1073 | 5
Dietrich et al. Relationship BMI, TFEQ, BIS/BAS, and gender
FIGURE 1 | Interaction of DIS and CR on BMI in theTFEQ-only cohort
(n = 326). The figure illustrates the linear relationship between BMI andDIS moderated by the level of CR with age and gender as covariates. Partialcorrelation of BMI*CR is −0.203 (p < 0.0005; adjusted R2 change of 0.163through BMI, CR, and BMI*CR). Dots indicate 10th, 25th, 50th, 75th, and90th percentiles of BMI (20.1, 21.8, 24.9, 30.7, and 35.3 kg/m2). Colorsindicate 10th, 25th, 50th, 75th, and 90th percentiles of CR (1, 3, 6, 9, 13).CR, cognitive restraint score; DIS, disinhibition score; TFEQ, Three-FactorEating Questionnaire.
relationship was moderated by DIS (p = 0.001). In otherwords, the relationship between BMI and CR differed withrespect to the DIS score (Figure 2): For low DIS scores thequadratic association between CR and BMI was well pronounced,whereas no strong quadratic relationship for high DIS scores wasobserved.
TFEQ-PLUS COHORT (n = 192)Association of the Barratt Impulsiveness Scale-11, BehavioralActivation System, and Behavioral Inhibition System Scaleswith BMIWith respect to eating behavior (based on the TFEQ), resultsin the subgroup of 192 participants (TFEQ-plus cohort)were comparable with the whole sample (TFEQ-only cohort,n = 326).
BAS and BIS scores did not correlate with BMI, but showed asignificant interaction with gender (hypothesis 3; all p = 0.001).In women, there was a significant positive correlation of BISand BMI (partial correlation = 0.281; p = 0.011) as well as astrong tendency for the correlation of BAS and BMI (partial cor-relation = 0.214; p = 0.055). In men, we found a significantnegative correlation of BIS and BMI (partial correlation =−0.208;p = 0.03) as well as BAS and BMI (partial correlation = −0.295;p = 0.002). The relationship of BMI and BAS, moderated by
Table 3 | Squared partial correlations (SPC) with BMI.
Variable Squared partial
correlation (η2p)
Direction of
correlation
p-value
CR (0.009) (+) 0.083
DIS 0.138 + <0.0005
HUN (0.003) (+) 0.596
CR2 0.054 − <0.0005
CR*DIS 0.054 − <0.0005
Squared partial correlations with BMI in the TFEQ-only cohort (n = 326) in aregression model with age and gender as covariates. SPC can be interpreted asthe proportion of BMI variance explained only by the corresponding variable, notby covariables. CR,TFEQ cognitive restraint score; DIS,TFEQ disinhibition score;HUN, TFEQ hunger score; TFEQ, Three-Factor Eating Questionnaire.
gender, is shown in Figure 3 (results for the association of BISand BMI are comparable). Concerning the association of self-reported impulsivity and BMI, neither a correlation between BMIand BIS-11 (total score) nor a gender interaction was found(hypothesis 4).
BMI modeling based on cognitive restraint, disinhibition, theBehavioral Activation System, and Behavioral Inhibition SystemscoreThe final model comprised the relevant variables of self-reportedeating behavior (see BMI Modeling based on the TFEQ ScalesCognitive Restraint and Disinhibition, TFEQ-only model) as wellas BIS, BAS, gender, BIS∗gender, BAS∗gender and age as regressors.The resulting adjusted R2 was 0.271 (women: 0.324, men: 0.252).R2 for women and men did not differ significantly (p = 0.474,two-tailed Fisher’s Z). Independent of eating behavior, BIS andBAS significantly contributed to variance explanation of BMI (R2
change of TFEQ-only model and TFEQ-plus model in the sampleof n = 192, p < 0.0005). Hence, self-reported behavioral measuresof CR, DIS, BIS, and BAS in addition to age and gender explainedabout 27% of the overall variance of BMI in the population of thissample. See Figure 4 for variance proportions of the variables foreach gender.
Quadratic relationship between BMI and the Behavioral ActivationSystem scoreAs Davis and Fox (2008) reported an inverted U-shaped associ-ation between sensitivity to reward and BMI, we tested for thequadratic association of BAS with BMI (hypothesis 6). We cor-roborated their finding: BMI showed a quadratic relationshipwith BAS (p = 0.018, age and gender as covariates, adjusted R2
changed by 0.03 after adding BMI and BMI2). There was only atrend for a gender interaction of this effect (p = 0.091, strongereffect in women). Concerning the model, a BMI of around30 kg/m2 was associated with the highest BAS scores, whereasa higher and lower BMI was associated with lower BAS scores(Figure 5).
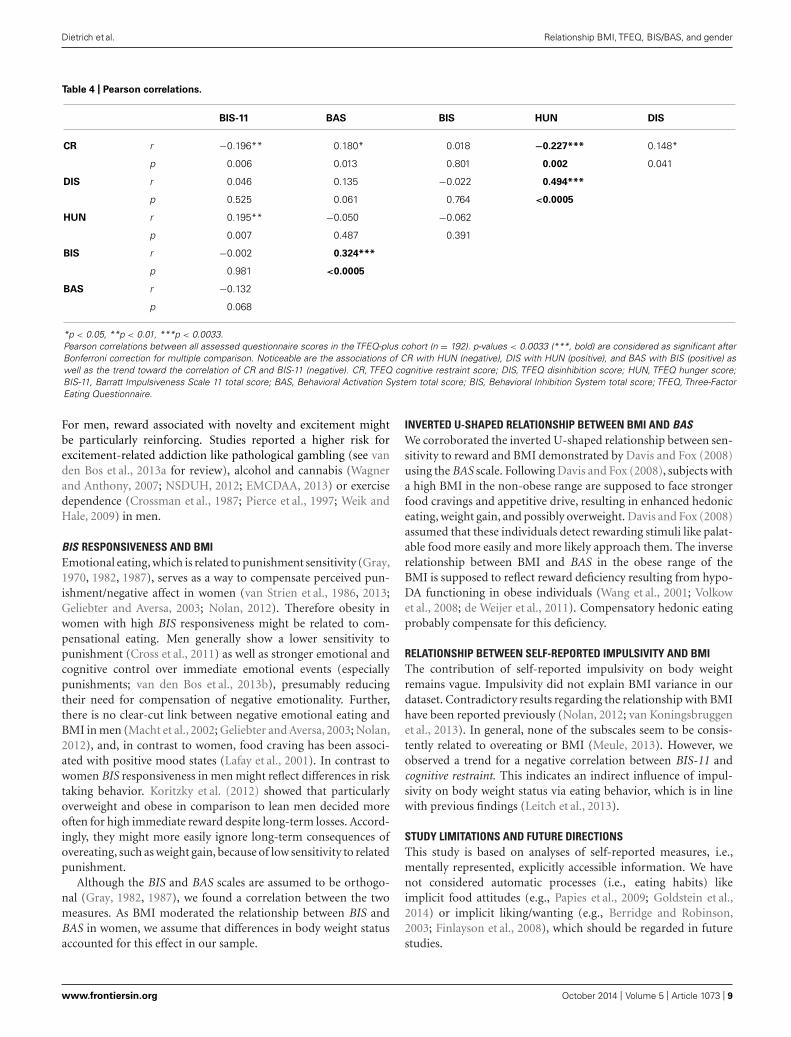
PEARSON CORRELATIONS OF ALL VARIABLES OF INTERESTFor an overview of the assessed variables and how they are inter-related, see Table 4. As the correlation of BIS and BAS was not
Frontiers in Psychology | Eating Behavior October 2014 | Volume 5 | Article 1073 | 6

Dietrich et al. Relationship BMI, TFEQ, BIS/BAS, and gender
FIGURE 2 | Quadratic interaction of BMI and DIS on CR in the
TFEQ-only cohort (n = 326). The figure illustrates the quadraticrelationship between BMI and CR moderated by the level of DIS with ageand gender as covariates. Partial correlation of BMI2*DIS is 0.185(p < 0.001; adjusted R2 change of 0.083 through BMI, DIS, BMI2, BMI*DISand BMI2*DIS). Dots indicate 10th, 25th, 50th, 75th, and 90th percentile ofBMI (20.1, 21.8, 24.9, 30.7, and 35.3 kg/m2). Colors indicate10th, 25th,50th, 75th, and 90th percentiles of CR (2, 4, 6, 8, 10). CR, cognitive restraintscore; DIS, disinhibition score; TFEQ, Three-Factor Eating Questionnaire.
described thus far, this association was further investigated. Onereason for this relationship might be the high proportion of obesesubjects in our sample. Therefore we tested for an interaction ofBMI with BIS or BAS. Also gender interactions of this assumedeffects were tested. We found a 3-way-interaction between BMI,gender and BIS (p = 0.007 for BIS∗BMI∗gender with BAS as regres-sand; age as covariate). Probing this 3-way-interaction revealedthat women with a high BMI had a stronger association of BISwith BAS.
DISCUSSIONRELATIONSHIP BETWEEN EATING BEHAVIOR AND BMIInterestingly, only two measures of eating behavior, disinhibi-tion and cognitive restraint, accounted for much of BMI variance(∼23%). In other words, the individual level of overeating ten-dencies in interaction with the level of conscious efforts to restrictfood intake explained a large amount of variance in individualbody weight status. Susceptibility to hunger did not contribute tovariance explanation of BMI. However, an association of hungerwith disinhibition and cognitive restraint was shown in our sam-ple, which is in line with previous studies (Bellisle et al., 2004;Lesdéma et al., 2012).
Besides modeling of BMI, we aimed to investigate the appar-ent non-linear relationship between cognitive restraint and BMI.
FIGURE 3 | Relationship between BMI and BAS in women and men in
theTFEQ-plus cohort (n = 192). As the relationship of BAS and BMI ismoderated by gender, it is shown separately. Partial correlation ofBMI*gender is −0.255 (p < 0.0005, age as covariate). Partial correlation ofBMI (age as covariate) with BAS is 0.214 in women (n = 82) and −0.295 inmen (n = 110). Dashed lines indicate confidence interval of 95% for the fitlines. BAS, Behavioral Activation System total score.
We found an inverted U-shaped association of BMI with cog-nitive restraint. Our model demonstrates low levels of cognitiverestraint at the outer edges of the BMI range and a high levelaround the overweight range. Interestingly, this relationshipwas moderated by the level of disinhibition. For low levels ofdisinhibition (low overeating tendencies) the curvilinear relation-ship between BMI and cognitive restraint was well pronounced.Accordingly, we conclude that restrained eating is low in normalweight individuals as food restriction is presumably not necessary.With higher BMI, food restriction becomes necessary, as losingweight or avoiding further weight gain are supposedly more fre-quent with higher BMI (maximum in the overweight/moderateobese range of the BMI). In the obese BMI range, the posi-tive relationship between BMI and cognitive restraint is shifted,resulting in relatively low levels of restrained eating amongmorbidly obese individuals. Although restrained eating seemsdesirable in this BMI range, morbidly obese individuals mightnot be able to raise sufficient self-control resources to restrictfood intake. This notion is supported by neuroimaging studiesthat report structural as well as functional obesity-related alter-ations in brain structures associated with self-control (Le et al.,2006, 2007; Horstmann et al., 2011). With higher levels of dis-inhibition there was no strong curvilinear relationship betweenBMI and cognitive restraint. This effect indicates that in responseto heightened overeating tendencies, normal weight individu-als increase conscious efforts to restrict food intake in order tomaintain weight/stay slim. Overweight and moderately obese
www.frontiersin.org October 2014 | Volume 5 | Article 1073 | 7

Dietrich et al. Relationship BMI, TFEQ, BIS/BAS, and gender
FIGURE 4 | BMI variance explained by final regression model in men and
women. The pie charts show the squared part correlations of all variables ofthe final BMI model in the TFEQ-plus cohort (n = 192). All variables withsignificant correlation to BMI were included. As the directions of the effect ofBAS and BIS differed between men and women, separate models comprising
the same variables were computed. R2 for women (n = 82) = 0.382. R2 formen (n = 110) = 0.300. CR, TFEQ cognitive restraint score; DIS, TFEQdisinhibition score; BAS, Behavioral Activation System total score; BIS,Behavioral Inhibition System total score; TFEQ, Three-Factor EatingQuestionnaire.
FIGURE 5 | Quadratic association between BAS and BMI in the
TFEQ-plus cohort (n = 192). Partial correlation of BMI2 is −0.92(p = 0.008, adjusted R2 change of 0.039 through BMI and BMI2, age andgender as covariates). Dashed lines indicate the 95% confidence interval ofthe quadratic fit line. BAS, Behavioral Activation System total score.
individuals presumably do not adequately adapt their dietaryrestraint. On the contrary, the model indicates that attempts torestrict food intake decrease (reflected in lower levels of cognitive
restraint) with stronger disinhibited eating. Eating behavior seemsto be more and more dominated by an uncontrolled eating style,driven by, for example, external eating signals or habitual foodintake.
GENDER-SPECIFIC RELATIONSHIPS BETWEEN BIS/BAS AND BMIThe aforementioned model for BMI based on eating behavior wasextended to incorporate personality factors not inherently relatedto food context but potentially influencing body weight. Both BISand BAS explained part of BMI variance independently of eatingbehavior (∼6%), whereby they inversely accounted for BMI vari-ance in men and women. Both scales were positively associatedwith BMI in women, but negatively in men.
BAS RESPONSIVENESS AND BMIStudies already showed that reward responsiveness is positivelyrelated to body weight status and eating habits contributing toweight gain in women (Davis and Woodside, 2002; Davis et al.,2004; Franken and Muris, 2005; Loxton and Dawe, 2006). Womenreport more food cravings than men, indicating heightened moti-vation for hedonic eating (Lafay et al., 2001; Cepeda-Benito et al.,2003; Meule et al., 2012). Moreover, several studies have shownthat women are highly susceptible to the sociocultural pressureresulting from the “lean ideal” portrayed by the media, lead-ing to attempts to lose weight and be slim (Polivy and Herman,2004; Dittmar, 2005; Mask and Blanchard, 2011; Yean et al., 2013).As a consequence food restriction and avoidance behavior mightboost initial vulnerability to and incentive saliency of highly palat-able “forbidden” food. In males, drive for a lean body has beenshown to be lower (e.g., Cohane and Pope, 2001; Grogan andRichards, 2002; Yean et al., 2013). Their individual motivationalvalue of food might thus be less environmentally influenced.
Frontiers in Psychology | Eating Behavior October 2014 | Volume 5 | Article 1073 | 8
Dietrich et al. Relationship BMI, TFEQ, BIS/BAS, and gender
Table 4 | Pearson correlations.
BIS-11 BAS BIS HUN DIS
CR r −0.196** 0.180* 0.018 −0.227*** 0.148*
p 0.006 0.013 0.801 0.002 0.041
DIS r 0.046 0.135 −0.022 0.494***
p 0.525 0.061 0.764 <0.0005
HUN r 0.195** −0.050 −0.062
p 0.007 0.487 0.391
BIS r −0.002 0.324***
p 0.981 <0.0005
BAS r −0.132
p 0.068
*p < 0.05, **p < 0.01, ***p < 0.0033.Pearson correlations between all assessed questionnaire scores in the TFEQ-plus cohort (n = 192). p-values < 0.0033 (***, bold) are considered as significant afterBonferroni correction for multiple comparison. Noticeable are the associations of CR with HUN (negative), DIS with HUN (positive), and BAS with BIS (positive) aswell as the trend toward the correlation of CR and BIS-11 (negative). CR, TFEQ cognitive restraint score; DIS, TFEQ disinhibition score; HUN, TFEQ hunger score;BIS-11, Barratt Impulsiveness Scale 11 total score; BAS, Behavioral Activation System total score; BIS, Behavioral Inhibition System total score; TFEQ, Three-FactorEating Questionnaire.
For men, reward associated with novelty and excitement mightbe particularly reinforcing. Studies reported a higher risk forexcitement-related addiction like pathological gambling (see vanden Bos et al., 2013a for review), alcohol and cannabis (Wagnerand Anthony, 2007; NSDUH, 2012; EMCDAA, 2013) or exercisedependence (Crossman et al., 1987; Pierce et al., 1997; Weik andHale, 2009) in men.
BIS RESPONSIVENESS AND BMIEmotional eating, which is related to punishment sensitivity (Gray,1970, 1982, 1987), serves as a way to compensate perceived pun-ishment/negative affect in women (van Strien et al., 1986, 2013;Geliebter and Aversa, 2003; Nolan, 2012). Therefore obesity inwomen with high BIS responsiveness might be related to com-pensational eating. Men generally show a lower sensitivity topunishment (Cross et al., 2011) as well as stronger emotional andcognitive control over immediate emotional events (especiallypunishments; van den Bos et al., 2013b), presumably reducingtheir need for compensation of negative emotionality. Further,there is no clear-cut link between negative emotional eating andBMI in men (Macht et al., 2002; Geliebter and Aversa, 2003; Nolan,2012), and, in contrast to women, food craving has been associ-ated with positive mood states (Lafay et al., 2001). In contrast towomen BIS responsiveness in men might reflect differences in risktaking behavior. Koritzky et al. (2012) showed that particularlyoverweight and obese in comparison to lean men decided moreoften for high immediate reward despite long-term losses. Accord-ingly, they might more easily ignore long-term consequences ofovereating, such as weight gain, because of low sensitivity to relatedpunishment.
Although the BIS and BAS scales are assumed to be orthogo-nal (Gray, 1982, 1987), we found a correlation between the twomeasures. As BMI moderated the relationship between BIS andBAS in women, we assume that differences in body weight statusaccounted for this effect in our sample.
INVERTED U-SHAPED RELATIONSHIP BETWEEN BMI AND BASWe corroborated the inverted U-shaped relationship between sen-sitivity to reward and BMI demonstrated by Davis and Fox (2008)using the BAS scale. Following Davis and Fox (2008), subjects witha high BMI in the non-obese range are supposed to face strongerfood cravings and appetitive drive, resulting in enhanced hedoniceating, weight gain, and possibly overweight. Davis and Fox (2008)assumed that these individuals detect rewarding stimuli like palat-able food more easily and more likely approach them. The inverserelationship between BMI and BAS in the obese range of theBMI is supposed to reflect reward deficiency resulting from hypo-DA functioning in obese individuals (Wang et al., 2001; Volkowet al., 2008; de Weijer et al., 2011). Compensatory hedonic eatingprobably compensate for this deficiency.
RELATIONSHIP BETWEEN SELF-REPORTED IMPULSIVITY AND BMIThe contribution of self-reported impulsivity on body weightremains vague. Impulsivity did not explain BMI variance in ourdataset. Contradictory results regarding the relationship with BMIhave been reported previously (Nolan, 2012; van Koningsbruggenet al., 2013). In general, none of the subscales seem to be consis-tently related to overeating or BMI (Meule, 2013). However, weobserved a trend for a negative correlation between BIS-11 andcognitive restraint. This indicates an indirect influence of impul-sivity on body weight status via eating behavior, which is in linewith previous findings (Leitch et al., 2013).
STUDY LIMITATIONS AND FUTURE DIRECTIONSThis study is based on analyses of self-reported measures, i.e.,mentally represented, explicitly accessible information. We havenot considered automatic processes (i.e., eating habits) likeimplicit food attitudes (e.g., Papies et al., 2009; Goldstein et al.,2014) or implicit liking/wanting (e.g., Berridge and Robinson,2003; Finlayson et al., 2008), which should be regarded in futurestudies.
www.frontiersin.org October 2014 | Volume 5 | Article 1073 | 9

Dietrich et al. Relationship BMI, TFEQ, BIS/BAS, and gender
Furthermore, impulsivity is a multifaceted construct (e.g.,Patton et al., 1995; Whiteside and Lynam, 2001). According toinsufficient validity of the factor structure of the BIS-11 in Ger-man (Preuss et al., 2008) we restricted our analysis to the BIS-11total score. Another impulsivity scale, the UPPS Impulsive BehaviorScale (Whiteside and Lynam, 2001), is recommended as an addi-tional self-report measure of impulsivity. This scale is associatedwith obesity (Mobbs et al., 2010), but probably measures aspectsof impulsivity that are not covered by BIS-11 (Meule, 2013).
Moreover, cognitive restraint has been proposed to be subdi-vided into a rigid and flexible component (Westenhoefer, 1991;Westenhoefer et al., 1999). For reasons of construct validity, thecognitive restraint scale has been expanded by several furtheritems (Westenhoefer et al., 1999). We recommend assessment ofthese items, because subscaling allows a more detailed analysis ofcognitive restraint’s influence on body weight.
Finally, BMI, although a common way to assess obesity, is arather course measure. It relates body weight to body height with-out taking actual body composition into account. As it does notmeasure body fat directly, erroneous evaluation of body weight sta-tus with respect to obesity can occur (Rothman, 2008). Addressingthis limitation, we recommend consideration of additional mea-sures like waist/hip ratio or concentration of adipokines like leptin(Badman and Flier, 2005).
SUMMARYThis study demonstrates that responsiveness to the behavioral acti-vation and behavioral inhibition system explains differences inBMI independently of eating behavior. Interestingly the relation-ships of BMI to BIS and BAS depend on gender, with opposingdirections in men and women. Therefore, specified for men andwomen, BIS/BAS responsiveness should be considered in the treat-ment of obesity. Further, our study contributes to a better under-standing of the complex relationships between eating behavior andbody weight status. We showed that cognitive restraint and BMI arenon-linearly associated (inverted U-shaped relationship). Impor-tantly, this relationship is moderated by the level of disinhibition.
ACKNOWLEDGMENTSWe would like to thank Kieran Austin, Andreas Below, Dana Ers-ing, Karolin Gohlke, Stefan Kabisch, Jonas Klinkenberg, ChristinaLell, Katja Macher, David Mathar, Lara Müller-Wieland, JaneNeumann, Haiko Schlögl, and Anke Theilemann for helpingto establish the data collection from which the current datawere drawn. We also would like to thank Jane Neumann, NoraMehl, Isabel Garcia-Garcia, David Mathar, and Jakob Simmank,who provided valuable feedback on an earlier version of thismanuscript.
The work of Martin Federbusch, Claudia Grellmann, ArnoVillringer, and Annette Horstmann is supported by the IFBAdiposity Diseases, Federal Ministry of Education and Research(BMBF), Germany, FKZ: 01E01001 (http://www.bmbf.de). Thework of Arno Villringer and Annette Horstmann is fundedby the German Research Foundation (DFG; http://www.dfg.de),within the framework of the Collaborative Research Center 1052“Obesity Mechanisms.”Anja Dietrich is funded by a research grantfrom the Konrad Adenauer Foundation (www.kas.de).
REFERENCESAhima, R. S. (2008). Revisiting leptin’s role in obesity and weight loss. J. Clin. Invest.
118, 2380–2383. doi: 10.1172/JCI36284.2380Arnett, J. (1992). Reckless behavior in adolescence: a developmental perspective.
Dev. Rev. 12, 339–373. doi: 10.1016/0273-2297(92)90013-R
Badman, M. K., and Flier, J. S. (2005). The gut and energy balance: vis-ceral allies in the obesity wars. Science 307, 1909–1914. doi: 10.1126/science.1109951
Batterink, L., Yokum, S., and Stice, E. (2010). Body mass correlates inversely withinhibitory control in response to food among adolescent girls: an fMRI study.Neuroimage 52, 1696–1703. doi: 10.1016/j.neuroimage.2010.05.059
Beaver, J. D., Lawrence, A. D., van Ditzhuijzen, J., Davis, M. H., Woods, A., andCalder, A. J. (2006). Individual differences in reward drive predict neural responsesto images of food. J. Neurosci. 26, 5160–5166. doi: 10.1523/JNEUROSCI.0350-06.2006
Bellisle, F., Clément, K., Le Barzic, M., Le Gall, A., Guy-Grand, B., and Bas-devant, A. (2004). The Eating Inventory and body adiposity from leannessto massive obesity: a study of 2509 adults. Obes. Res. 12, 2023–2030. doi:10.1038/oby.2004.253
Berridge, K. C., and Robinson, T. E. (2003). Parsing reward. Trends Neurosci. 26,507–513. doi: 10.1016/S0166-2236(03)00233-239
Bond, M. J., McDowell, A. J., and Wilkinson, J.Y. (2001). The measurement of dietaryrestraint, disinhibition and hunger: an examination of the factor structure of theThree Factor Eating Questionnaire (TFEQ). Int. J. Obes. Relat. Metab. Disord. 25,900–906. doi: 10.1038/sj.ijo.0801611
Boschi, V., Iorio, D., Margiotta, N., D’Orsi, P., and Falconi, C. (2001). The three-factor eating questionnaire in the evaluation of eating behaviour in subjectsseeking participation in a dietotherapy programme. Ann. Nutr. Metab. 45, 72–77.doi: 10.1159/000046709
Braet, C., Claus, L., Verbeken, S., and Van Vlierberghe, L. (2007). Impulsiv-ity in overweight children. Eur. Child Adolesc. Psychiatry 16, 473–483. doi:10.1007/s00787-007-0623-622
Brogan, A., Hevey, D., O’Callaghan, G., Yoder, R., and O’Shea, D. (2011). Impaireddecision making among morbidly obese adults. J. Psychosom. Res. 70, 189–196.doi: 10.1016/j.jpsychores.2010.07.012
Brogan, A., Hevey, D., and Pignatti, R. (2010). Anorexia, bulimia, andobesity: shared decision making deficits on the Iowa Gambling Task(IGT). J. Int. Neuropsychol. Soc. 16, 711–715. doi: 10.1017/S1355617710000354
Bryant, E. J., King, N. A., and Blundell, J. E. (2008). Disinhibition: its effects onappetite and weight regulation. Obes. Rev. 9, 409–419. doi: 10.1111/j.1467-789X.2007.00426.x
Burgess, L. H., and Handa, R. J. (1992). Chronic estrogen-induced alter-ations in adrenocorticotropin and corticosterone secretion, and glucocorticoidreceptor-mediated functions in female rats. Endocrinology 131, 1261–1269. doi:10.1210/en.131.3.1261
Byrnes, J. P., Miller, D. C., and Schafer, W. D. (1999). Gender differences inrisk taking: a meta-analysis. Psychol. Bull. 125, 367–383. doi: 10.1037/0033-2909.125.3.367
Cappelleri, J. C., Bushmakin, A. G., Gerber, R. A., Leidy, N. K., Sexton, C.C., Lowe, M. R., et al. (2009). Psychometric analysis of the Three-FactorEating Questionnaire-R21: results from a large diverse sample of obese andnon-obese participants. Int. J. Obes. (Lond.) 33, 611–620. doi: 10.1038/ijo.2009.74
Carroll, M. E., Lynch, W. J., Roth, M. E., Morgan, A. D., and Cosgrove, K. P. (2004).Sex and estrogen influence drug abuse. Trends Pharmacol. Sci. 25, 273–279. doi:10.1016/j.tips.2004.03.011
Carver, C. S., and White, T. L. (1994). Behavioral inhibition, behavioral acti-vation, and affective responses to impending reward and punishment: TheBIS/BAS Scales. J. Pers. Soc. Psychol. 67, 319–333. doi: 10.1037/0022-3514.67.2.319
Cepeda-Benito, A., Fernandez, M. C., and Moreno, S. (2003). Relationship of genderand eating disorder symptoms to reported cravings for food: construct validationof state and trait craving questionnaires in Spanish. Appetite 40, 47–54. doi:10.1016/S0195-6663(02)00145-149
Chalmers, D. K., Bowyer, C. A., and Olenick, N. L. (1990). Problem drinking andobesity: a comparison in personality patterns and life-style. Int. J. Addict. 25,803–817.
Frontiers in Psychology | Eating Behavior October 2014 | Volume 5 | Article 1073 | 10

Dietrich et al. Relationship BMI, TFEQ, BIS/BAS, and gender
Cohane, G. H., and Pope, H. G. (2001). Body image in boys: a review of the literature.Int. J. Eat. Disord. 29, 373–379. doi: 10.1002/eat.1033
Cross, C. P., Copping, L. T., and Campbell, A. (2011). Sex differences in impulsivity:a meta-analysis. Psychol. Bull. 137, 97–130. doi: 10.1037/a0021591
Crossman, J., Jamieson, J., and Henderson, L. (1987). Responses of competitiveathletes to layoffs in training: exercise addiction or psychological relief? J. SportBehav. 10, 28–38.
Dalle Grave, R., Calugi, S., Corica, F., Di Domizio, S., and Marchesini, G.(2009). Psychological variables associated with weight loss in obese patientsseeking treatment at medical centers. J. Am. Diet. Assoc. 109, 2010–2016. doi:10.1016/j.jada.2009.09.011
Davis, C. (2013). A narrative review of binge eating and addictive behaviors: sharedassociations with seasonality and personality factors. Front. Psychiatry 4:183. doi:10.3389/fpsyt.2013.00183
Davis, C., and Fox, J. (2008). Sensitivity to reward and body mass index(BMI): evidence for a non-linear relationship. Appetite 50, 43–49. doi:10.1016/j.appet.2007.05.007
Davis, C., Patte, K., Levitan, R., Reid, C., Tweed, S., and Curtis, C. (2007).From motivation to behaviour: a model of reward sensitivity, overeating,and food preferences in the risk profile for obesity. Appetite 48, 12–19. doi:10.1016/j.appet.2006.05.016
Davis, C., Strachan, S., and Berkson, M. (2004). Sensitivity to reward:implications for overeating and overweight. Appetite 42, 131–138. doi:10.1016/j.appet.2003.07.004
Davis, C., and Woodside, D. B. (2002). Sensitivity to the rewarding effects offood and exercise in the eating disorders. Compr. Psychiatry 43, 189–194. doi:10.1053/comp.2002.32356
de Lauzon-Guillain, B., Basdevant, A., Romon, M., Karlsson, J., Borys, J.-M., Charles,M. A., et al. (2006). Is restrained eating a risk factor for weight gain in a generalpopulation? Am. J. Clin. Nutr. 83, 132–138. doi: 10.1186/2191-219X-1-37
de Weijer, B. A., van de Giessen, E., van Amelsvoort, T. A., Boot, E., Braak, B.,Janssen, I. M., et al. (2011). Lower striatal dopamine D2/3 receptor availability inobese compared with non-obese subjects. EJNMMI Res. 1, 37. doi: 10.1186/2191-219X-1-37
Dina, C., Meyre, D., Gallina, S., Durand, E., Körner, A., Jacobson, P., et al. (2007).Variation in FTO contributes to childhood obesity and severe adult obesity. Nat.Genet. 39, 724–726. doi: 10.1038/ng2048
Dittmar, H. (2005). Introduction to the special issue: body image—vulnerabilityfactors and processes linking sociocultural pressures and body dissatisfaction. J.Soc. Clin. Psychol. 24, 1081–1087. doi: 10.1521/jscp.2005.24.8.1081
Dykes, J., Brunner, E. J., Martikainen, P. T., and Wardle, J. (2004). Socioeconomicgradient in body size and obesity among women: the role of dietary restraint,disinhibition and hunger in the Whitehall II study. Int. J. Obes. Relat. Metab.Disord. 28, 262–268. doi: 10.1038/sj.ijo.0802523
Elfhag, K., and Morey, L. C. (2008). Personality traits and eating behavior inthe obese: poor self-control in emotional and external eating but personalityassets in restrained eating. Eat. Behav. 9, 285–293. doi: 10.1016/j.eatbeh.2007.10.003
EMCDAA. (2013). European Drug Report 2013: Trends and Developments. Availableat: http://www.emcdda.europa.eu/publications/edr/trends-developments/2013
Evans, S. M., Haney, M., and Foltin, R. W. (2002). The effects of smokedcocaine during the follicular and luteal phases of the menstrual cycle in women.Psychopharmacology (Berl.) 159, 397–406. doi: 10.1007/s00213-001-0944-947
Faith, M. S., Flint, J., Fairburn, C. G., Goodwin, G. M., and Allison, D. B. (2001). Gen-der differences in the relationship between personality dimensions and relativebody weight. Obes. Res. 9, 647–650. doi: 10.1038/oby.2001.86
Farooqi, I. S., Bullmore, E., Keogh, J., Gillard, J., O’Rahilly, S., and Fletcher, P. C.(2007). Leptin regulates striatal regions and human eating behavior. Science 317,1355. doi: 10.1126/science.1144599
Fattore, L., Altea, S., and Fratta, W. (2008). Sex differences in drug addiction: areview of animal and human studies. Womens Health (Lond. Engl.) 4, 51–65. doi:10.2217/17455057.4.1.51
Fattore, L., Fadda, P., and Fratta, W. (2009). Sex differences in the self-administrationof cannabinoids and other drugs of abuse. Psychoneuroendocrinology 34(Suppl.1), S227–S236. doi: 10.1016/j.psyneuen.2009.08.008
Finlayson, G., King, N., and Blundell, J. (2008). The role of implicit wanting inrelation to explicit liking and wanting for food: implications for appetite control.Appetite 50, 120–127. doi: 10.1016/j.appet.2007.06.007
Foster, G. D., Wadden, T. A., Swain, R. M., Stunkard, A. J., Platte, P., and Vogt,R. A. (1998). The eating inventory in obese women: clinical correlates and rela-tionship to weight loss. Int. J. Obes. Relat. Metab. Disord. 22, 778–785. doi:10.1038/sj.ijo.0800659
Franken, I. H., and Muris, P. (2005). Individual differences in reward sensitivity arerelated to food craving and relative body weight in healthy women. Appetite 45,198–201. doi: 10.1016/j.appet.2005.04.004
Frayling, T. M., Timpson, N. J., Weedon, M. N., Zeggini, E., Freathy, R. M., Lindgren,C. M., et al. (2007). A common variant in the FTO gene is associated with bodymass index and predisposes to childhood and adult obesity. Science 316, 889–894.doi: 10.1126/science.1141634
Geliebter, A., and Aversa, A. (2003). Emotional eating in overweight, nor-mal weight, and underweight individuals. Eat. Behav. 3, 341–347. doi:10.1016/S1471-0153(02)00100-109
Goldstein, S. P., Forman, E. M., Meiran, N., Herbert, J. D., Juarascio, A. S.,and Butryn, M. L. (2014). The discrepancy between implicit and explicitattitudes in predicting disinhibited eating. Eat. Behav. 15, 164–170. doi:10.1016/j.eatbeh.2013.10.021
Gray, J. (1970). The psychophysiological basis of introversion-extraversion. Behav.Res. Ther. 8, 249–266. doi: 10.1016/0005-7967(70)90069-90060
Gray, J. A. (1982). Neuropsychological Theory of Anxiety. New York: OxfordUniversity Press.
Gray, J. A. (1987). The Physiology of Fear and Stress. Camebridge: CamebridgeUniversity Press.
Gray, J. A., and McNaughton, N. (ed.). (2000). The Neuropsychology of Anxiety, 2ndEdn. Oxford: Oxford University Press.
Grogan, S., and Richards, H. (2002). Body image: focus groups with boys and men.Men Masc. 4, 219–232. doi: 10.1177/1097184X02004003001
Guerrieri, R., Nederkoorn, C., and Jansen, A. (2007). How impulsiveness and varietyinfluence food intake in a sample of healthy women. Appetite 48, 119–122. doi:10.1016/j.appet.2006.06.004
Guerrieri, R., Nederkoorn, C., and Jansen, A. (2008). The effect of an impulsivepersonality on overeating and obesity: current state of affairs. Psychol. Top. 17,265–286.
Handa, R. J., Burgess, L. H., Kerr, J. E., and O’Keefe, J. A. (1994). Gonadal steroidhormone receptors and sex differences in the hypothalamo-pituitary-adrenal axis.Horm. Behav. 28, 464–476. doi: 10.1006/hbeh.1994.1044
Harrison, A., O’Brien, N., Lopez, C., and Treasure, J. (2010). Sensitivity toreward and punishment in eating disorders. Psychiatry Res. 177, 1–11. doi:10.1016/j.psychres.2009.06.010
Harrison, A., Treasure, J., and Smillie, L. D. (2011). Approach and avoid-ance motivation in eating disorders. Psychiatry Res. 188, 396–401. doi:10.1016/j.psychres.2011.04.022
Hayes, A. (2013). Introduction to Mediation, Moderation, and Conditional ProcessAnalysis. New York: Guilford Press.
Hays, N. P., Bathalon, G. P., McCrory, M. A., Roubenoff, R., Lipman, R., andRoberts, S. B. (2002). Eating behavior correlates of adult weight gain and obe-sity in healthy women aged 55-65 y. Am. J. Clin. Nutr. 75, 476–483. doi:10.1176/appi.ajp.158.2.308
Horstmann, A., Busse, F. P., Mathar, D., Müller, K., Lepsien, J., Schlögl,H., et al. (2011). Obesity-related differences between women and men inbrain structure and goal-directed behavior. Front. Hum. Neurosci. 5:58. doi:10.3389/fnhum.2011.00058
Jorm, A. F., Christensen, H., Henderson, A. S., Jacomb, P. A., Korten, P. A., andRodgers, B. (1999). Using the BIS/BAS scales to measure behavioural inhibitionand behavioural activation: factor structure, validity and norms in a large commu-nity sample. Pers. Individ. Dif. 26, 49–58. doi: 10.1016/S0191-8869(98)00143-143
Jubbin, J. J., and Rajesh, I. (2012). Behavioral therapy for management of obesity.Indian J. Endocrinol. Metab. 16, 28–32. doi: 10.4103/2230-8210.91180
Kaasinen, V., Någren, K., Hietala, J., Farde, L., and Rinne, J. O. (2001). Sex differencesin extrastriatal dopamine d2-like receptors in the human brain. Am. J. Psychiatry158, 308–311. doi: 10.1176/appi.ajp.158.2.308
Karlsson, J., Hallgren, P., Kral, J., Lindroos, A. K., Sjöström, L., and Sullivan, M.(1994). Predictors and effects of long-term dieting on mental well-being andweight loss in obese women. Appetite 23, 15–26. doi: 10.1006/appe.1994.1031
Keel, P. K., Baxter, M. G., Heatherton, T. F., and Joiner, T. E. (2007). A 20-yearlongitudinal study of body weight, dieting, and eating disorder symptoms. J.Abnorm. Psychol. 116, 422–432. doi: 10.1037/0021-843X.116.2.422
www.frontiersin.org October 2014 | Volume 5 | Article 1073 | 11

Dietrich et al. Relationship BMI, TFEQ, BIS/BAS, and gender
Klok, M. D., Jakobsdottir, S., and Drent, M. L. (2007). The role of leptin and ghrelinin the regulation of food intake and body weight in humans: a review. Obes. Rev.8, 21–34. doi: 10.1111/j.1467-789X.2006.00270.x
Koritzky, G., Yechiam, E., Bukay, I., and Milman, U. (2012). Obesity and risk taking.a male phenomenon. Appetite 59, 289–297. doi: 10.1016/j.appet.2012.05.020
Lafay, L., Thomas, F., Mennen, L., Charles, M. A., Eschwege, E., Borys, J. M., et al.(2001). Gender differences in the relation between food cravings and mood inan adult community: results from the fleurbaix laventie ville santé study. Int.J. Eat. Disord. 29, 195–204. doi: 10.1002/1098-108X(200103)29:2<195::AID-EAT1009>3.0.CO;2-N
Le, D. S. N., Pannacciulli, N., Chen, K., Salbe, A. D., Del Parigi, A., Hill, J. O., et al.(2007). Less activation in the left dorsolateral prefrontal cortex in the reanalysisof the response to a meal in obese than in lean women and its association withsuccessful weight loss. Am. J. Clin. Nutr. 86, 573–579.
Le, D. S. N. T., Pannacciulli, N., Chen, K., Del Parigi, A., Salbe, A. D., Reiman,E. M., et al. (2006). Less activation of the left dorsolateral prefrontal cortex inresponse to a meal: a feature of obesity. Am. J. Clin. Nutr. 84, 725–731. doi:10.1016/j.appet.2012.05.027
Leitch, M. A., Morgan, M. J., and Yeomans, M. R. (2013). Different subtypes ofimpulsivity differentiate uncontrolled eating and dietary restraint. Appetite 69,54–63. doi: 10.1016/j.appet.2013.05.007
Lesdéma, A., Fromentin, G., Daudin, J.-J., Arlotti, A., Vinoy, S., Tome, D.,et al. (2012). Characterization of the Three-Factor Eating Questionnaire scoresof a young French cohort. Appetite 59, 385–390. doi: 10.1016/j.appet.2012.05.027
Li, K.-K., Concepcion, R. Y., Lee, H., Cardinal, B. J., Ebbeck, V., Woekel, E., et al.(2012). An examination of sex differences in relation to the eating habits andnutrient intakes of university students. J. Nutr. Educ. Behav. 44, 246–250. doi:10.1016/j.jneb.2010.10.002
Lluch, A., Herbeth, B., Mejean, L., and Siest, G. (2000). Dietary intakes, eating styleand overweight in the Stanislas Family Study. Int. J. Obes. Relat. Metab. Disord.24, 1493–1499. doi: 10.1038/sj.ijo.0801425
Loxton, N. J., and Dawe, S. (2006). Reward and punishment sensitivity in dys-functional eating and hazardous drinking women: associations with family risk.Appetite 47, 361–371. doi: 10.1016/j.appet.2006.05.014
Lynch, W. J., Roth, M. E., and Carroll, M. E. (2002). Biological basis of sex differencesin drug abuse: preclinical and clinical studies. Psychopharmacology (Berl.) 164,121–137. doi: 10.1007/s00213-002-1183-1182
Macht, M., Roth, S., and Ellgring, H. (2002). Chocolate eating in healthy menduring experimentally induced sadness and joy. Appetite 39, 147–158. doi:10.1006/appe.2002.0499
Mask, L., and Blanchard, C. M. (2011). The effects of “thin ideal” media onwomen’s body image concerns and eating-related intentions: the beneficial roleof an autonomous regulation of eating behaviors. Body Image 8, 357–365. doi:10.1016/j.bodyim.2011.06.003
Matton, A., Goossens, L., Braet, C., and Vervaet, M. (2013). Punishment andreward sensitivity: are naturally occurring clusters in these traits related to eatingand weight problems in adolescents? Eur. Eat. Disord. Rev. 21, 184–194. doi:10.1002/erv.2226
Meule, A. (2013). Impulsivity and overeating: a closer look at the subscales ofthe Barratt Impulsiveness Scale. Front. Psychol. 4:177. doi: 10.3389/fpsyg.2013.00177
Meule, A., Lutz, A., Vögele, C., and Kübler, A. (2012). Food cravings discriminatedifferentially between successful and unsuccessful dieters and non-dieters. Vali-dation of the Food Cravings Questionnaires in German. Appetite 58, 88–97. doi:10.1016/j.appet.2011.09.010
Mobbs, O., Crépin, C., Thiéry, C., Golay, A., and Van der Linden, M. (2010).Obesity and the four facets of impulsivity. Patient Educ. Couns. 79, 372–377. doi:10.1016/j.pec.2010.03.003
Moeller, F. G., Barratt, E. S., Dougherty, D. M., Schmitz, J. M., and Swann, A. C.(2001). Psychiatric aspects of impulsivity. Am. J. Psychiatry 158, 1783–1793. doi:10.1176/appi.ajp.158.11.1783
Nederkoorn, C., Braet, C., Van Eijs, Y., Tanghe, A., and Jansen, A. (2006a). Whyobese children cannot resist food: the role of impulsivity. Eat. Behav. 7, 315–322.doi: 10.1016/j.eatbeh.2005.11.005
Nederkoorn, C., Smulders, F. T. Y., Havermans, R. C., Roefs, A., andJansen, A. (2006b). Impulsivity in obese women. Appetite 47, 253–256. doi:10.1016/j.appet.2006.05.008
Nolan, J. (2012). Association between impulsiveness and pleasantness ratings forfood and drugs. Appetite 59, e43. doi: 10.1016/j.appet.2012.05.003
NSDUH. (2012). National Survey on Drug Use & Health: Results from the 2012. Avail-able at: http://www.samhsa.gov/data/NSDUH/2k12MH_FindingsandDetTables/2K12MHF/NSDUHmhfr2012.htm
Page, K. A., Seo, D., Belfort-DeAguiar, R., Lacadie, C., Dzuira, J., Naik, S., et al.(2011). Circulating glucose levels modulate neural control of desire for high-calorie foods in humans. J. Clin. Invest. 121, 4161–4169. doi: 10.1172/JCI57873
Papies, E. K., Stroebe, W., and Aarts, H. (2009). Who likes it more?Restrained eaters’ implicit attitudes towards food. Appetite 53, 279–287. doi:10.1016/j.appet.2009.07.001
Patchev, V. K., Hayashi, S., Orikasa, C., and Almeida, O. F. (1995). Implications ofestrogen-dependent brain organization for gender differences in hypothalamo-pituitary-adrenal regulation. FASEB J. 9, 419–423.
Patton, J. H., Stanford, M. S., and Barratt, E. S. (1995). Factor structure of theBarratt impulsiveness scale. J. Clin. Psychol. 51, 768–774. doi: 10.1002/1097-4679(199511)51:6<768::AID-JCLP2270510607>3.0.CO;2-1
Pekkarinen, T., Takala, I., and Mustajoki, P. (1996). Two year maintenance of weightloss after a VLCD and behavioural therapy for obesity: correlation to the scoresof questionnaires measuring eating behaviour. Int. J. Obes. Relat. Metab. Disord.20, 332–337.
Pierce, E. F., Rohaly, K. A., and Fritchley, B. (1997). Sex differences on exercisedependence for men and women in a marathon road race. Percept. Mot. Skills 84,991–994. doi: 10.2466/pms.1997.84.3.991
Pignatti, R., Bertella, L., Albani, G., Mauro, A., Molinari, E., and Semenza, C. (2006).Decision-making in obesity: a study using the Gambling task. Eat. Weight Disord.11, 126–132. doi: 10.1007/BF03327557
Polivy, J., and Herman, C. P. (2004). Sociocultural idealization of thin female bodyshapes: an introduction to the special issue on body image and eating disorders.J. Soc. Clin. Psychol. 23, 1–6. doi: 10.1521/jscp.23.1.1.26986
Preuss, U. W., Rujescu, D., Giegling, I., Watzke, S., Koller, G., Zetzsche, T.,et al. (2008). Psychometric evaluation of the German version of the Bar-ratt Impulsiveness Scale. Nervenarzt 79, 305–319. doi: 10.1007/s00115-007-2360-2367
Provencher, V., Drapeau, V., Tremblay, A., Després, J.-P., Bouchard, C., and Lemieux,S. (2004). Eating behaviours, dietary profile and body composition according todieting history in men and women of the Québec Family Study. Br. J. Nutr. 91,997–1004. doi: 10.1079/BJN20041115
Pudel, V., and Westenhoefer, J. (1989). Fragebogen Zum Essverhalten (FEV).Göttingen: Hogrefe.
Rasmussen, E. B., Lawyer, S. R., and Reilly, W. (2010). Percent body fat is related todelay and probability discounting for food in humans. Behav. Processes 83, 23–30.doi: 10.1016/j.beproc.2009.09.001
Rosenbaum, M., Sy, M., Pavlovich, K., Leibel, R. L., and Hirsch, J. (2008). Leptinreverses weight loss-induced changes in regional neural activity responses to visualfood stimuli. J. Clin. Invest. 118, 2583–2591. doi: 10.1172/JCI35055
Rothman, K. J. (2008). BMI-related errors in the measurement of obesity. Int. J.Obes. (Lond.) 32, 56–59. doi: 10.1038/ijo.2008.87
Rydén, A., Sullivan, M., Torgerson, J. S., Karlsson, J., Lindroos, A.-K., and Taft,C. (2003). Severe obesity and personality: a comparative controlled study ofpersonality traits. Int. J. Obes. Relat. Metab. Disord. 27, 1534–1540. doi:10.1038/sj.ijo.0802460
Savage, J. S., Hoffman, L., and Birch, L. L. (2009). Dieting, restraint, and disinhibi-tion predict women’s weight change over 6 y. Am. J. Clin. Nutr. 90, 33–40. doi:10.3945/ajcn.2008.26558
Sofuoglu, M., Dudish-Poulsen, S., Nelson, D., Pentel, P. R., and Hatsukami, D. K.(1999). Sex and menstrual cycle differences in the subjective effects from smokedcocaine in humans. Exp. Clin. Psychopharmacol. 7, 274–283. doi: 10.1037/1064-1297.7.3.274
Strobel, A., Beauducel, A., Debener, S., and Brocke, B. (2001). Eine deutschsprachigeVersion des BIS/BAS-Fragebogens von Carver und White. Z. Differ. Diagn.Psychol. 22, 216–227. doi: 10.1024//0170-1789.22.3.216
Stunkard, A. J., and Messick, S. (1985). The three-factor eating questionnaire tomeasure dietary restraint, disinhibition and hunger. J. Psychosom. Res. 29, 71–83.doi: 10.1016/0022-3999(85)90010-90018
Tucker, L. A., and Bates, L. (2009). Restrained eating and risk of gaining weight andbody fat in middle-aged women: a 3-year prospective study. Am. J. Health Promot.23, 187–194. doi: 10.4278/ajhp.07061456
Frontiers in Psychology | Eating Behavior October 2014 | Volume 5 | Article 1073 | 12
Dietrich et al. Relationship BMI, TFEQ, BIS/BAS, and gender
van den Bos, R., Davies, W., Dellu-Hagedorn, F., Goudriaan, A. E., Gra-non, S., Homberg, J., et al. (2013a). Cross-species approaches to pathologicalgambling: a review targeting sex differences, adolescent vulnerability and eco-logical validity of research tools. Neurosci. Biobehav. Rev. 37, 2454–2471. doi:10.1016/j.neubiorev.2013.07.005
van den Bos, R., Homberg, J., and de Visser, L. (2013b). A critical review of sexdifferences in decision-making tasks: focus on the Iowa Gambling Task. Behav.Brain Res. 238, 95–108. doi: 10.1016/j.bbr.2012.10.002
van Koningsbruggen, G. M., Stroebe, W., and Aarts, H. (2013). Success-ful restrained eating and trait impulsiveness. Appetite 60, 81–84. doi:10.1016/j.appet.2012.09.016
van Strien, T., Cebolla, A., Etchemendy, E., Gutiérrez-Maldonado, J.,Ferrer-García, M., Botella, C., et al. (2013). Emotional eating and foodintake after sadness and joy. Appetite 66, 20–25. doi: 10.1016/j.appet.2013.02.016
van Strien, T., Frijters, J. E. R., Bergers, G. P. A., and Defares, P. B. (1986). The DutchEating Behavior Questionnaire (DEBQ) for assessment of restrained, emotional,and external eating behavior. Int. J. Eat. Disord. 5, 295–315. doi: 10.1002/1098-108X(198602)5:2<295::AID-EAT2260050209>3.0.CO;2-T
Volkow, N. D., Wang, G.-J., Fowler, J. S., and Telang, F. (2008). Overlapping neuronalcircuits in addiction and obesity: evidence of systems pathology. Philos. Trans. R.Soc. Lond. B Biol. Sci. 363, 3191–3200. doi: 10.1098/rstb.2008.0107
Volkow, N. D., Wang, G.-J., Tomasi, D., and Baler, R. D. (2013). Obesity andaddiction: neurobiological overlaps. Obes. Rev. 14, 2–18. doi: 10.1111/j.1467-789X.2012.01031.x
Wagner, F. A., and Anthony, J. C. (2007). Male-female differences in the riskof progression from first use to dependence upon cannabis, cocaine, andalcohol. Drug Alcohol Depend. 86, 191–198. doi: 10.1016/j.drugalcdep.2006.06.003
Wang, G. J., Volkow, N. D., Logan, J., Pappas, N. R., Wong, C. T., Zhu, W., et al.(2001). Brain dopamine and obesity. Lancet 357, 354–357. doi: 10.1016/S0140-6736(00)03643-6
Weik, M., and Hale, B. D. (2009). Contrasting gender differences on twomeasures of exercise dependence. Br. J. Sports Med. 43, 204–207. doi:10.1136/bjsm.2007.045138
Weller, R. E., Cook, E. W., Avsar, K. B., and Cox, J. E. (2008). Obese women showgreater delay discounting than healthy-weight women. Appetite 51, 563–569. doi:10.1016/j.appet.2008.04.010
Westenhoefer, J. (1991). Dietary restraint and disinhibition: is restraint ahomogeneous construct? Appetite 16, 45–55. doi: 10.1016/0195-6663(91)90110-E
Westenhoefer, J., Pudel, V., and Maus, N. (1990). Some restrictions on dietaryrestraint. Appetite 14, 137–141. doi: 10.1016/0195-6663(90)90014-Y
Westenhoefer, J., Stunkard, A. J., and Pudel, V. (1999). Validation of the flexible andrigid control dimensions of dietary restraint. Int. J. Eat. Disord. 26, 53–64. doi:10.1002/(SICI)1098-108X(199907)26
Westerterp-Plantenga, M. S., Kempen, K. P. G., and Saris, W. H. M. (1998). Deter-minants of weight maintenance in women after diet-induced weight reduction.Int. J. Obes. Relat. Metab. Disord. 22, 1–6. doi: 10.1038/sj.ijo.0800536
Weygandt, M., Mai, K., Dommes, E., Leupelt, V., Hackmack, K., Kahnt, T., et al.(2013). The role of neural impulse control mechanisms for dietary success inobesity. Neuroimage 83C, 669–678. doi: 10.1016/j.neuroimage.2013.07.028
Whiteside, S. P., and Lynam, D. R. (2001). The Five Factor Model and impulsivity:using a structural model of personality to understand impulsivity. Pers. Individ.Dif. 30, 669–689. doi: 10.1016/S0191-8869(00)00064-67
Wilksch, S. M., and Wade, T. D. (2009). An investigation of temperament endophe-notype candidates for early emergence of the core cognitive component of eatingdisorders. Psychol. Med. 39, 811–821. doi: 10.1017/S0033291708004261
Williamson, D. A., Lawson, O. J., Brooks, E. R., Wozniak, P. J., Ryan, D. H., Bray, G.A., et al. (1995). Association of body mass with dietary restraint and disinhibition.Appetite 25, 31–41. doi: 10.1006/appe.1995.0039
Yean, C., Benau, E. M., Dakanalis, A., Hormes, J. M., Perone, J., and Timko, C.A. (2013). The relationship of sex and sexual orientation to self-esteem, bodyshape satisfaction, and eating disorder symptomatology. Front. Psychol. 4:887.doi: 10.3389/fpsyg.2013.00887
Young, E. A. (1995). The role of gonadal steroids in hypothalamic-pituitary-adrenalaxis regulation. Crit. Rev. Neurobiol. 9, 371–381.
Conflict of Interest Statement: The authors declare that the research was conductedin the absence of any commercial or financial relationships that could be construedas a potential conflict of interest.
Received: 27 May 2014; accepted: 06 September 2014; published online: 20 October2014.Citation: Dietrich A, Federbusch M, Grellmann C, Villringer A and HorstmannA (2014) Body weight status, eating behavior, sensitivity to reward/punishment,and gender: relationships and interdependencies. Front. Psychol. 5:1073. doi:10.3389/fpsyg.2014.01073This article was submitted to Eating Behavior, a section of the journal Frontiers inPsychology.Copyright © 2014 Dietrich, Federbusch, Grellmann, Villringer and Horstmann. This isan open-access article distributed under the terms of the Creative Commons AttributionLicense (CC BY). The use, distribution or reproduction in other forums is permitted,provided the original author(s) or licensor are credited and that the original publica-tion in this journal is cited, in accordance with accepted academic practice. No use,distribution or reproduction is permitted which does not comply with these terms.
www.frontiersin.org October 2014 | Volume 5 | Article 1073 | 13