board of education meeting district pk-12 data summary
TRANSCRIPT

Board of Education MeetingDistrict PK-12 Data Summary Slides
(2020-21 OUTCOME METRICS)September 28, 2021
Continuous Improvement

Enrollment
2
What do we want to learn (affirm,
confirm, or explore) from inspecting
these data?
2
Which focal groups were most impacted in their attendance rates?
To what extent has enrollment changed in the transition grades?
Attendance
Well-Being
Engagement
Academics
What needs surfaced for different stakeholder groups?
Given the apps we prioritized, how much were they used?
What were the learning strengths and needs from last year? How many and who are the students that
would most benefit from learning acceleration?
Guiding Questions for Continuous
Improvement

Domains Multiple Measures
Enrollment ● Enrollment Trends● Transfer Patterns
Attendance ● Attendance Trends● Attendance Change
Students, Family, & Staff Well-Being
● Social-Emotional Learning (SEL) Skills● School Culture-Climate● Family Wellness Checks● QTEA and Staff Well-Being Survey
Engagement ● Student Online Activity & Top Learning Apps● Families with Activated ParentVUE Accounts
Academics ● ELA: DRDP Language & Literacy Development(PreK)● ELA: F&P Foundational Skills (K)● ELA and Math Grades (TK-5)● Students with 1 or More D/Fs
in Core Subjects (Gr 6-12)● HS Readiness (Gr 8)● ELA: Reading Inventory● ELA: Learning Change● ELA Acceleration
2020-21Outcome Metrics
3
● Math: Milestone Task● Math Learning Change● Math Acceleration● EL Redesignation● On/Off-Track
Key:
Overall Results
Pandemic-Specific Trends and Patterns*Pursuant to the Data Access Resolution, data for ethnic groups is detailed in all Data Disk reports

Enrollment Enrollment Trends (TK-12)
4
DATA CONCLUSION:
Enrollment declines of over 1,000 students from beginning of year 2019-20 to 2020-21 were pronounced at transition grades and among EL students; further, during the school year transfers-outs were higher than transfers-ins by an additional 659 students

Attendance Attendance Trends (K-12)
5
DATA CONCLUSION:
Absenteeism significantly increased for African American and Pacific Islander students as compared to previous years’ trends

Well-being School Culture-Climate (K-12)
6
DATA CONCLUSION:
School Culture-Climate increased significantly overall, for staff, and across all student groups. Deeper dives in the data surfaced a pronounced increase in Safety.

Well-being Family Wellness Check-ins: Summary (PK-12)
7
DATA CONCLUSION:
Approximately 80% of families reached were doing well, and 85-90% indicated that they have what they need.
Source: SFUSD Family Wellness Check-ins data submitted by SFUSD site staff via Google Forms. Date: Forms were submitted during three distinct windows between 8/17/2020 and 4/16/2021. Definition: Response items for Q1 included “Great”, “Pretty Good”, “Ok, could be better”, “Not well”, and “I’m not sure” (only one could be selected). Multiple response items could be selected for Q2 and Q3. Response items were included on the form for staff but not read aloud to respondents.
Follow‐ups / Crisis: Of 47,097 students, 4,329 requested a follow‐up during one or more windows; 210 were determined to have a crisis.

Well-being Family Wellness Check-ins: No Contact Made (K-12)
8
DATA CONCLUSIONS:
Unheard voices: Over 5,500 families of students were not reached in any of the Family Wellness Checks in K-12 and 303 students in PK
➢ One-third of these families had “No ParentVUE Account”
➢ Highest % of not reached were families of African American and Pacific Islander students
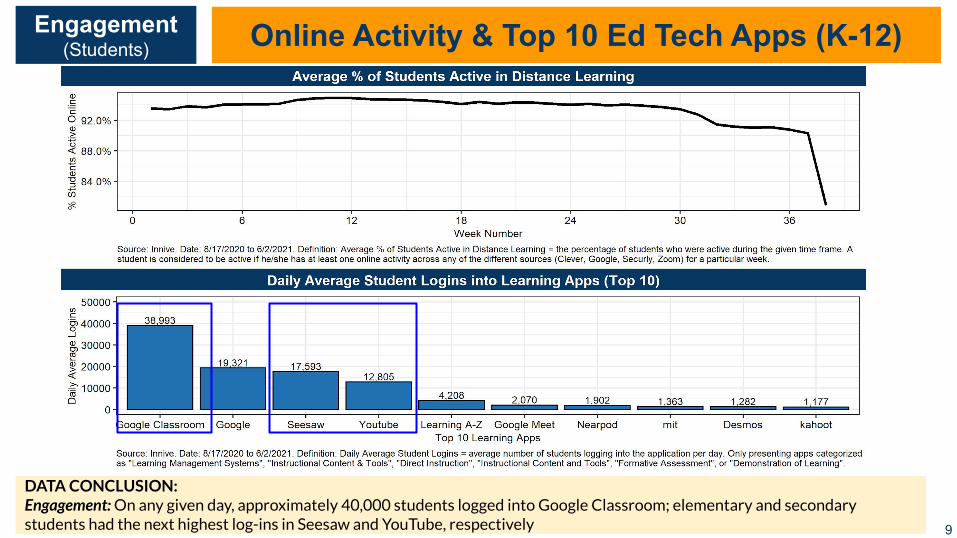
Engagement(Students) Online Activity & Top 10 Ed Tech Apps (K-12)
9
DATA CONCLUSION:Engagement: On any given day, approximately 40,000 students logged into Google Classroom; elementary and secondary students had the next highest log-ins in Seesaw and YouTube, respectively

Academics ELA: Reading Inventory (Gr 3-10)
10
DATA CONCLUSION:Overall, Spring 2021 Reading Inventory participation remained consistent at over 80% for grades 3-10 students; however, participation decreased for African American, American Indian, Latinx, Pacific Islander, English Learner, and SpEd students. Given this caveat, overall proficiency rates increased to 62%, with increases seen across all student groups.

Academics ELA: Learning Acceleration for 2021-22 (Gr 4-11)
11
DATA CONCLUSION:Need ELA Assessment: Over 7,700 students in grades 4-11 do not have an ELA assessment result for Spring 2021. ELA Learning Acceleration needed: Of those students tested, over 12,000 have experienced learning change below predicted growth and/or are at the lowest performance level
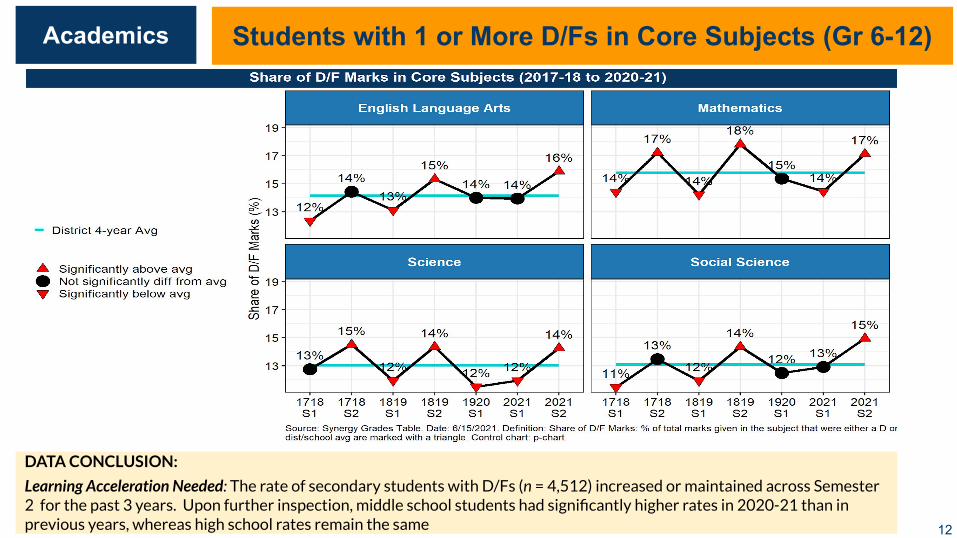
Academics Students with 1 or More D/Fs in Core Subjects (Gr 6-12)
12
DATA CONCLUSION:
Learning Acceleration Needed: The rate of secondary students with D/Fs (n = 4,512) increased or maintained across Semester 2 for the past 3 years. Upon further inspection, middle school students had significantly higher rates in 2020-21 than in previous years, whereas high school rates remain the same

Theme from Student Led Conferences: Students identify strategies for success.
Theme from Summer School: Families appreciate socializing opportunities for children and asked for more.
Theme from Teacher Reflections: Teachers valued relationships with families and strategies adopted during distance learning.
Source: Middle Grades Student Led Conference Post-Survey; Family Survey on Summer 2021 Programs; QTEA Teacher Survey. Date: Spring 2021; 9/1/21, Summer 2021. Definition: A student post-survey was administered after the student-led conference during ‘20-’21 to understand students’ experiences and their perceptions of their abilities to identify goals, successes, and challenges. 1,507 students responded to the post-survey during the 20-21 school year. Links to the family survey were sent out via School Messenger on 8/20/21 to families of students who were in grades TK-5 during the 2020-2021 school year. As of 9/1/2021, 2,058 families responded to the survey, and 1,706 (or 83%) could be linked to student IDs. The quotes above are from the open-ended question: “[OPTIONAL] You may provide any other feedback about the summer program here.” The QTEA Teacher Survey is administered yearly at the close of each school year, with 1,746 teachers responding during the summer 2021 survey administration. The teacher quotes above come from the following question: “Based on your experiences during school closures and distance education, what did you learn about what benefits students and families that you would like to adopt as we start the new school year?”
“I always look at google classroom to see if I have gotten something wrong and I wrote it down in a google slide.”
Stakeholder Voices collected during
Spring/Summer 2021
“Practice makes perfect, if you keep practicing, you are basically making it better, for now I may not be successful but sooner or later if I keeping putting effort, I will become successful student.”
“great way for my child to socialize with others and participate in outdoor activities in a safe environment.
“Como padres nos preocupa que estuvieran mentalmente sanos .,definitivamente nos ayudo mucho el programa.”
As parents, we are concerned about their mental health. The program definitely helped us a lot.
Themes and quotes we have heard from teachers.students, families, and
“Relationships are still very important. Students learn best with a strong and supportive community.”
“Constant communication and check ins with the family is important to determine the health and well-being of all families. “
“I realized I need to read more often, be more organized, and be more active.”
“假如高年级孩子也可以拿到学习包就更好.”
It would be great if upper grade students were given learning backpacks too.
“I've spent countless hours recording videos of my lessons. Students have mentioned that they have found them extremely helpful.”
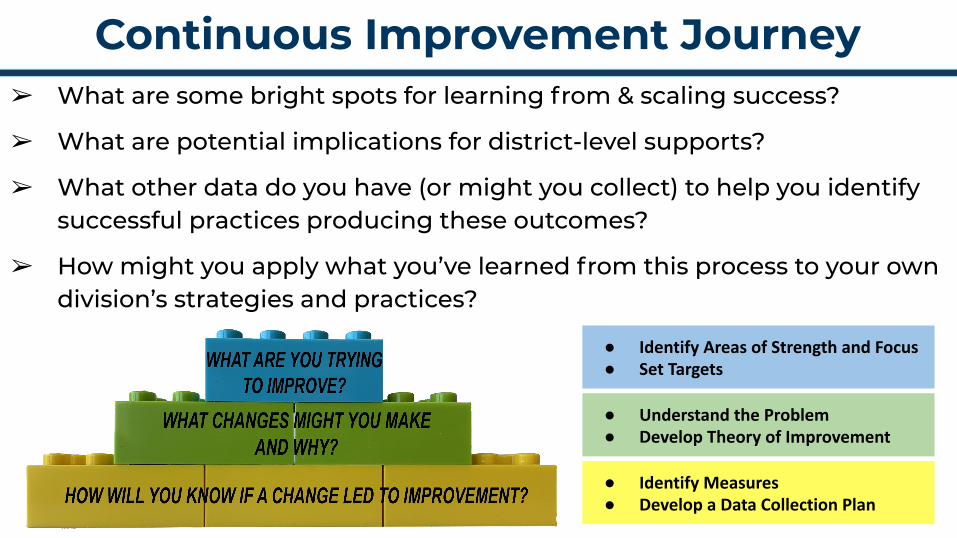
➢ What are some bright spots for learning from & scaling success?
➢ What are potential implications for district-level supports?
➢ What other data do you have (or might you collect) to help you identify successful practices producing these outcomes?
➢ How might you apply what you’ve learned from this process to your own division’s strategies and practices?
Continuous Improvement Journey
● Identify Measures● Develop a Data Collection Plan
● Understand the Problem● Develop Theory of Improvement
● Identify Areas of Strength and Focus● Set Targets

SAN FRANCISCO UNIFIED SCHOOL DISTRICT
APPENDIX

Communication & Engagement
Stakeholder Group Structure By...
LEAD LEAD Data Session July 21-23
School Leaders* Admin Institute Cohort Mtgs July 28
SLT SLT Meeting Aug 19
Board of Education Regular Board Mtg Sept 14
General Public RPA public-facing website End of September
*School Leaders have received detailed reports (overall, group, and student level) to share with staff and stakeholders, which include: Data Summary slides, Newsletters, Custom & Illuminate Reports for each Domain

Well-being Social-Emotional Learning (SEL) Skills (K-12)
17
DATA CONCLUSION:
SEL skills remained consistent overall and across all student groups. The gaps between program groups in Self-Efficacy skills remain.
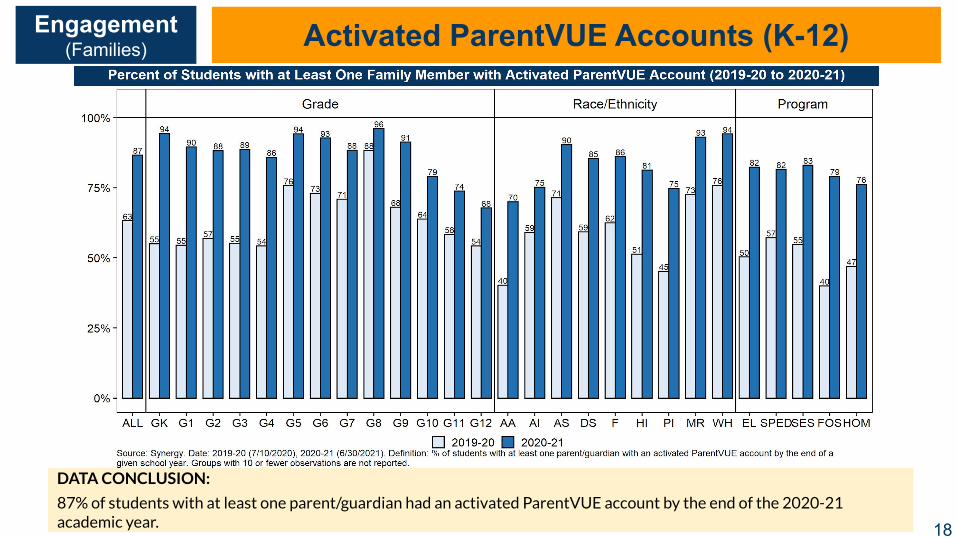
Engagement(Families) Activated ParentVUE Accounts (K-12)
18
DATA CONCLUSION:
87% of students with at least one parent/guardian had an activated ParentVUE account by the end of the 2020-21 academic year.

Academics Language and Literacy Development (Pre-K)
19
Data Conclusion: Overall, 47% of Pre-K students showed K-Readiness in DRDP Language and Literacy Development for Spring 2021. However, 71% or 938 of 1, 323 students were assessed.
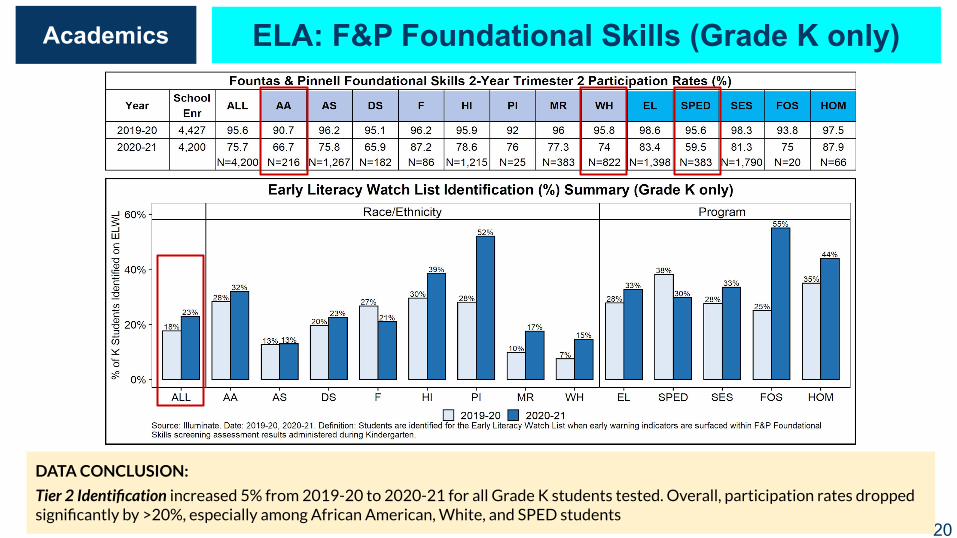
Academics ELA: F&P Foundational Skills (Grade K only)
20
DATA CONCLUSION:
Tier 2 Identification increased 5% from 2019-20 to 2020-21 for all Grade K students tested. Overall, participation rates dropped significantly by >20%, especially among African American, White, and SPED students

ELA MTSS/ RTI Implementation
21Tier 1 Tier 2 Tier 3
Assessments● Universal Screeners● District Literacy Assessments
(3 times a year)
Assessments:● Universal Screeners● Screeners for phonological processing ● Progress Monitoring
Instructional Resources Instructional Resources **based on Reading Profile and In addition to Tier 1
● Designated ELD: Wonders● Foundational Skills: F&P
Phonics, Spelling and Word Study & Benchmark Taller (Phonics, Spanish)
● Foundational Skill Routines ● Comprehensive Approach &
Culturally and Historically responsive: ELA Planning Portal
● Comprehensive Approach to Literacy: F&P Classroom (13 sites)
Leveled Literacy Intervention
Fundations
Spanish Literacy Intervention
Spanish Phonological Routines
Leveled Literacy Intervention
Reading Recovery
Structured Literacy: Fundations, Wilson, SPIRE, ISPIRE

Academics Math: Milestone Task (Gr K-HS)
22
DATA CONCLUSION:Overall, Spring 2021 Math Task was the highest it has ever been overall and almost all student groups (leading to the 3-year proficiency rate trend not being comparable). Among the students tested, two-thirds of all students were marked as being proficient.

Academics HS Readiness (Gr 8)
23
DATA CONCLUSION:
HS Readiness rates remained consistent overall, with variability observed across all student groups. The gaps in the rates are maintained.

Academics On/Off-Track (Gr 9-12)
24
DATA CONCLUSION:Overall, the rate of students On-Track has been consistent with previous years; however, a persistent gap remains for focal groups.
SFUSD (Gr 9-12) On/Off-Track to High School Graduation (includes summer school completion rates)
Source: SY2020-21 On/Off-Track data as of July 2021. Note: Only subgroups with at least 21 students are included.