bnsf railway companybnsf railway company leased lines and wholly-owned subsidiaries class i railroad...
TRANSCRIPT

BNSF Railway CompanyLeased Lines and Wholly-Owned Subsidiaries
Class I Railroad Annual ReportTo the Surface Transportation BoardFor the Year Ending December 31, 2016
ACAA-R1BNSF Railway Company 2650 Lou Menk Drive Fort Worth, Texas 76131
Name, official title, telephone number, and office address of officer in charge ofcorrespondence with the Board regarding this report.
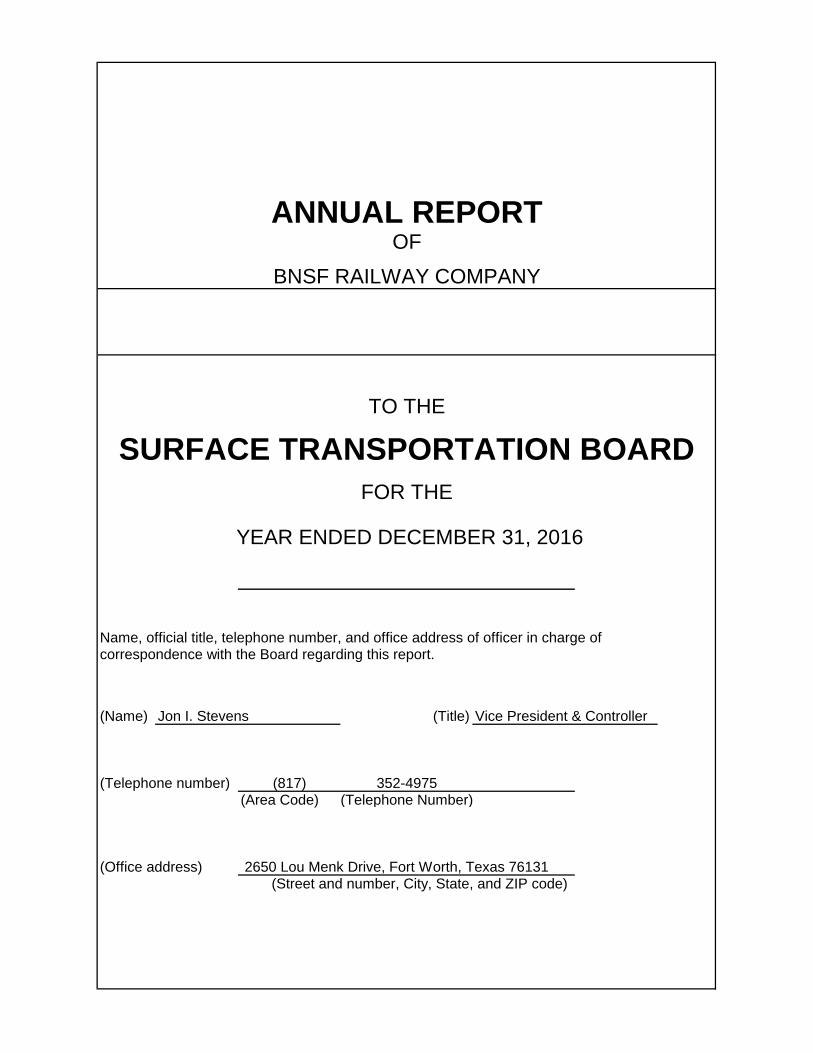
(Name) Jon I. Stevens (Title) Vice President & Controller
(Telephone number) (817) 352-4975(Area Code) (Telephone Number)
(Office address) 2650 Lou Menk Drive, Fort Worth, Texas 76131(Street and number, City, State, and ZIP code)
SURFACE TRANSPORTATION BOARD FOR THE
YEAR ENDED DECEMBER 31, 2016
ANNUAL REPORTOF
BNSF RAILWAY COMPANY
TO THE
NOTICE
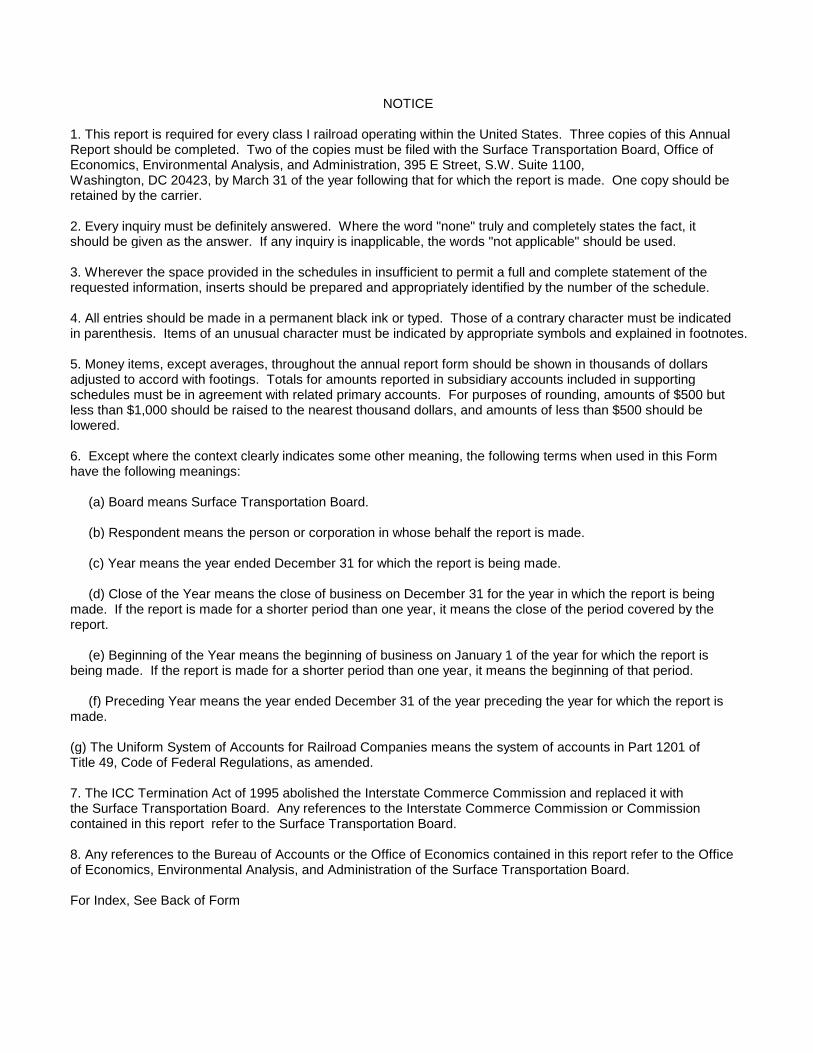
1. This report is required for every class I railroad operating within the United States. Three copies of this AnnualReport should be completed. Two of the copies must be filed with the Surface Transportation Board, Office ofEconomics, Environmental Analysis, and Administration, 395 E Street, S.W. Suite 1100,Washington, DC 20423, by March 31 of the year following that for which the report is made. One copy should beretained by the carrier.
2. Every inquiry must be definitely answered. Where the word "none" truly and completely states the fact, itshould be given as the answer. If any inquiry is inapplicable, the words "not applicable" should be used.
3. Wherever the space provided in the schedules in insufficient to permit a full and complete statement of therequested information, inserts should be prepared and appropriately identified by the number of the schedule.
4. All entries should be made in a permanent black ink or typed. Those of a contrary character must be indicatedin parenthesis. Items of an unusual character must be indicated by appropriate symbols and explained in footnotes.
5. Money items, except averages, throughout the annual report form should be shown in thousands of dollarsadjusted to accord with footings. Totals for amounts reported in subsidiary accounts included in supportingschedules must be in agreement with related primary accounts. For purposes of rounding, amounts of $500 butless than $1,000 should be raised to the nearest thousand dollars, and amounts of less than $500 should belowered.
6. Except where the context clearly indicates some other meaning, the following terms when used in this Formhave the following meanings:
(a) Board means Surface Transportation Board.
(b) Respondent means the person or corporation in whose behalf the report is made.
(c) Year means the year ended December 31 for which the report is being made.
(d) Close of the Year means the close of business on December 31 for the year in which the report is beingmade. If the report is made for a shorter period than one year, it means the close of the period covered by thereport.
(e) Beginning of the Year means the beginning of business on January 1 of the year for which the report isbeing made. If the report is made for a shorter period than one year, it means the beginning of that period.
(f) Preceding Year means the year ended December 31 of the year preceding the year for which the report ismade.
(g) The Uniform System of Accounts for Railroad Companies means the system of accounts in Part 1201 ofTitle 49, Code of Federal Regulations, as amended.
7. The ICC Termination Act of 1995 abolished the Interstate Commerce Commission and replaced it withthe Surface Transportation Board. Any references to the Interstate Commerce Commission or Commissioncontained in this report refer to the Surface Transportation Board.
8. Any references to the Bureau of Accounts or the Office of Economics contained in this report refer to the Officeof Economics, Environmental Analysis, and Administration of the Surface Transportation Board.
For Index, See Back of Form
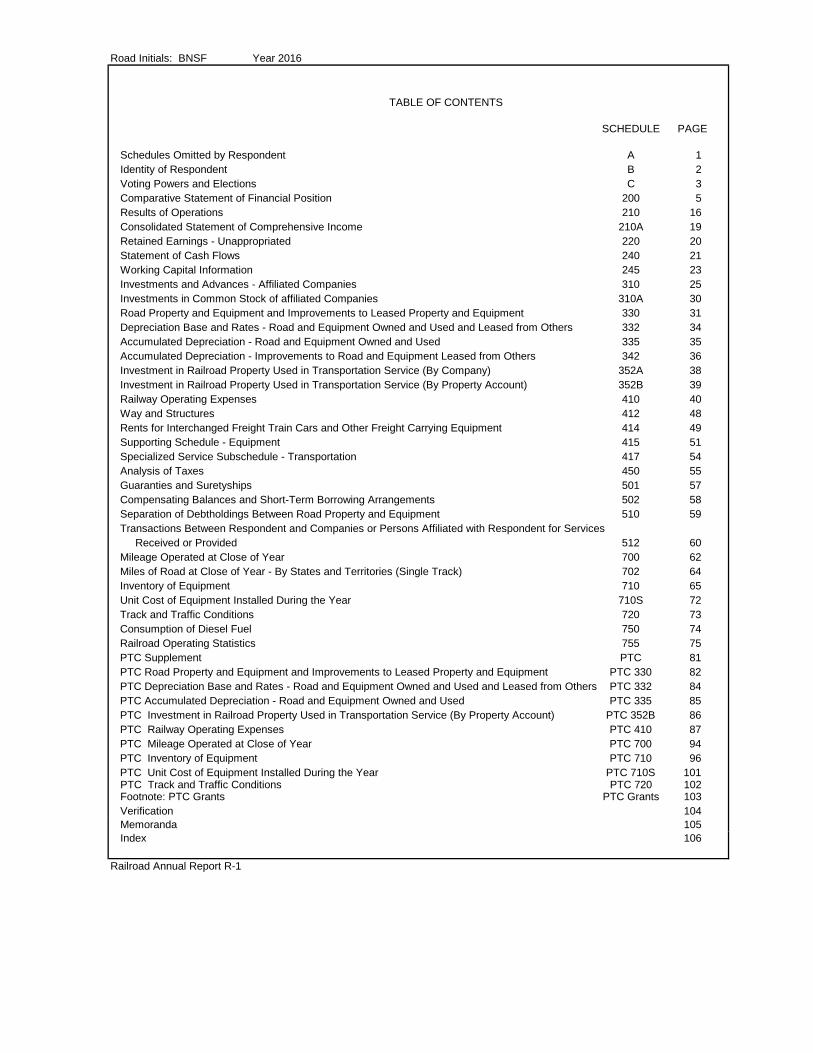
Road Initials: BNSF Year 2016
TABLE OF CONTENTS
SCHEDULE PAGE
Schedules Omitted by Respondent A 1Identity of Respondent B 2Voting Powers and Elections C 3Comparative Statement of Financial Position 200 5Results of Operations 210 16Consolidated Statement of Comprehensive Income 210A 19Retained Earnings - Unappropriated 220 20Statement of Cash Flows 240 21Working Capital Information 245 23Investments and Advances - Affiliated Companies 310 25Investments in Common Stock of affiliated Companies 310A 30Road Property and Equipment and Improvements to Leased Property and Equipment 330 31Depreciation Base and Rates - Road and Equipment Owned and Used and Leased from Others 332 34Accumulated Depreciation - Road and Equipment Owned and Used 335 35Accumulated Depreciation - Improvements to Road and Equipment Leased from Others 342 36Investment in Railroad Property Used in Transportation Service (By Company) 352A 38Investment in Railroad Property Used in Transportation Service (By Property Account) 352B 39Railway Operating Expenses 410 40Way and Structures 412 48Rents for Interchanged Freight Train Cars and Other Freight Carrying Equipment 414 49Supporting Schedule - Equipment 415 51Specialized Service Subschedule - Transportation 417 54Analysis of Taxes 450 55Guaranties and Suretyships 501 57Compensating Balances and Short-Term Borrowing Arrangements 502 58Separation of Debtholdings Between Road Property and Equipment 510 59Transactions Between Respondent and Companies or Persons Affiliated with Respondent for Services
Received or Provided 512 60Mileage Operated at Close of Year 700 62Miles of Road at Close of Year - By States and Territories (Single Track) 702 64Inventory of Equipment 710 65Unit Cost of Equipment Installed During the Year 710S 72Track and Traffic Conditions 720 73Consumption of Diesel Fuel 750 74Railroad Operating Statistics 755 75PTC Supplement PTC 81PTC Road Property and Equipment and Improvements to Leased Property and Equipment PTC 330 82PTC Depreciation Base and Rates - Road and Equipment Owned and Used and Leased from Others PTC 332 84PTC Accumulated Depreciation - Road and Equipment Owned and Used PTC 335 85PTC Investment in Railroad Property Used in Transportation Service (By Property Account) PTC 352B 86PTC Railway Operating Expenses PTC 410 87PTC Mileage Operated at Close of Year PTC 700 94PTC Inventory of Equipment PTC 710 96PTC Unit Cost of Equipment Installed During the Year PTC 710S 101PTC Track and Traffic Conditions PTC 720 102Footnote: PTC Grants PTC Grants 103Verification 104Memoranda 105Index 106
Railroad Annual Report R-1

The dark borders on the schedules represents data that are captured by the Board.
Railroad Annual Report R-1
Road Initials: BNSF Year 2016
SPECIAL NOTICE
The following information is provided in Compliance with OMB requirements and pursuant to the Paperwork Reduction Act of 1995, 44 U.S.C. §§ 3501-3519 (PRA):
Supplemental Information about the Annual Report (R-1)
This information collection is mandatory pursuant to 49 U.S.C. § 11145. The estimated hour burden for filing this report is estimated at no more than 800 hours. Information in the Annual Reports is used to monitor and assess railroad industry growth, financial stability, traffic, and operations and to identify industry changes that may affect national transportation policy. In addition, the Board uses data from these reports to more effectively carry out its regulatory responsibilities, such as acting on railroad requests for authority to engage in Board regulated financial transactions (for example, mergers, acquisitions of control, consolidations and abandonments); developing the Uniform Rail Costing System (URCS); conducting rail revenue adequacy proceedings; developing rail cost adjustment factors; and conducting investigations and rulemakings. The information in this report is ordinarily maintained by the agency in hard copy for 10 years, after which it is transferred to the National Archives, where it is maintained as a permanent record. In addition, some of this information is posted on the Board’s website, where it may remain indefinitely. All information collected through this report is available to the public. Under the PRA, a federal agency may not conduct or sponsor, and a person is not required to respond to, nor shall a person be subject to a penalty for failure to comply with, a collection of information unless it displays a currently valid OMB control number. Comments and
Docket No. 38559 Railroad Classification Index, (ICC served January 20, 1983), modified the reporting requirements for Class II, Class III and Switching and Terminal Companies. These carriers will notify the Board only if the calculation results in a different revenue level than its

Road Initials: BNSF Year 2016 1
A. SCHEDULES OMITTED BY RESPONDENT
1. The respondent, at its option, may omit pages from this report provided there is nothing to report or theschedules are not applicable.
2. Show below the pages excluded, as well as the schedule number and title, in the space provided below.3. If no schedules were omitted indicate "NONE."
Page Schedule No. Title
NONE
Railroad Annual Report R-1

2 Road Initials: BNSF Year 2016
Answers to the questions asked should be made in full, without reference to data returned on the corresponding page of previous reports. In case any changes of the nature referred to under Inquiry 4 on this page have taken place during the year covered by this report, they should be explained in full detail.
1. Give the exact name of the respondent in full. Use the words, "The" and "Company" only when they are parts of the corporate name. Be carefulto distinguish between railroad and railway. The corporate name should be given uniformly throughout the report, notably on the cover, on the title page, and in the "Verification." If the report is made by receivers, trustees, a committee of bondholders, or individuals otherwise in possession of the property, state names and facts with precision. If the report is for a consolidated group, pursuant to Special Permission from the Board, indicate such fact on line 1 below and list the consolidated group on page 4.
2. If incorporated under a special charter, give date of passage of the act; if under a general law, give date of filing certificate of organization; if a reorganization has been effected, give date of reorganization. If a receivership or other trust, also give date when such receivership or other possession began. If a partnership, give date of formation and also names in full of present partners.
3. State the occasion for the reorganization, whether by reason of foreclosure of mortgage or otherwise, according to the fact. Give date of organization of original corporation and refer to laws under which organized.
1. Exact Name of common carrier making this report:BNSF Railway Company
2. Date of incorporation:January 13, 1961
3. Under laws of what Government, State or Territory organized? If more than one, name all. If in bankruptcy, give court of jurisdiction and dates of beginning of receivership and of appointment of receivers or trustees:
Organized under the provisions of the General Corporation Law of the State of Delaware.
4. If the respondent was reorganized during the year, involved in a consolidation or merger, or conducted its business under a different name, givefull particulars:
5. The respondent is required to send the Office of Economic and Environmental Analysis, immediately upon preparation, two copies of its latest annual report to stockholders.
Check appropriate box:
( ) Two copies are attached to this report.
( ) Two copies will be submitted on: _________________________________________________
(X) No annual report to stockholders is prepared.
A copy of BNSF Railway Company SEC Form 10-K is attached.
Railroad Annual Report R-1
STOCKHOLDERS' REPORTS
B. IDENTITY OF RESPONDENT
(date)

Road Initials: BNSF Year 2016 3
C. VOTING POWERS AND ELECTIONS1. State the par value of each share of stock: Common $1.00 per share; first preferred, $ N/A per share; second preferred,
$ N/A per share; debenture stock, $ N/A per share.
2. State whether or not each share of stock has the right to one vote; if not, give full particulars in a footnote. [X] Yes [ ] No
3. Are voting rights proportional to holdings? [X] Yes [ ] No. If not, state in a footnote the relation between holdings and corresponding voting rights.
4. Are voting rights attached to any securities other than stock? [ ] Yes [X] No. If yes, name in a footnote each security, other than stock, to which voting
rights are attached (as of the close of the year), and state in detail the relation between holdings and corresponding voting rights, indicating whether voting rights
are actual or contingent and, if contingent, showing the contingency.
5. Has any class or issue of securities any special privileges in the election of directors, trustees, or managers, or in the determination of corporate action by any
method? [ ] Yes [X] No. If yes, describe fully in a footnote each such class or issue and give a succinct statement showing clearly the character and extent of
such privileges.
6. Give the date of the latest closing of the stock book prior to the actual filing of this report, and state the purpose of such closing.
Stock books not closed and not required to be closed.
7. State the total voting power of all security holders of the respondent at the date of such closing, if within one year of the date of such filing; if not, state as
of the close of the year. 1,000 votes, as of December 31, 2016
8. State the total number of stockholders of record, as of the date shown in answer to Inquiry 7. One (1) stockholder.
9. Give the names of 30 security holders of the respondent who, at the date of the latest closing of the stock book or compilation of the list of stockholders of
the respondent (if within 1 year prior to the actual filing of this report), had the highest voting powers in the respondent, showing for each his or her address, the
number of votes he or she would have had a right to cast on that date had a meeting then been in order, and the classification of the number of votes to which he
or she was entitled, with respect to securities held by him or her, such securities being classified as common stock, second preferred stock, first preferred stock,
and other securities (stating in a footnote the names of such other securities, if any). If any such holder held in trust, give (in a footnote) the particulars of the trust.
In the case of voting trust agreements, give as supplemental information and the names and addresses of the 30 largest holders of the voting trust certificates
and the amount of their individual holdings. If the stock book was not closed or the list of stockholders compiled within such year, show such 30 security holders
as of the close of the year.
Number of Votes, Classified WithNumber of Votes Respect to Securities on Which Based
Line to Which StockNo. Security Holder Preferred Line
Address of Security Holder Was Entitled Common Second First No.(b) (c) (d) (e) (f)
1 2650 Lou Menk Drive 1,000 1,000 12 Fort Worth, TX 76131 23 34 45 56 67 78 89 910 1011 1112 1213 1314 1415 1516 1617 1718 1819 1920 2021 2122 2223 2324 2425 2526 2627 2728 2829 2930 30
Railroad Annual Report R-1
(a)Name of Security Holder
Burlington Northern Santa Fe, LLC

4 Road Initials: BNSF Year 2016
C. VOTING POWERS AND ELECTIONS - Continued
10. State the total number of votes cast at the latest general meeting for the election of directors of the respondent: "Not Applicable"Refer to note shown under inquiry 9.
11. Give the date of such meeting: "Not Applicable" - Refer to note shown under inquiry 9.12. Give the place of such meeting: "Not Applicable" - Refer to note shown under inquiry 9.
NOTES AND REMARKS
Consolidated Subsidiaries:BNSF Railway CompanyBayport Systems, Inc.BayRail, LLCBN Leasing CorporationBNSF Communications, Inc.BNSF Equipment Acquisition Company, LLCBurlington Northern Santa Fe Properties, LLCBNSF Railway International Services, Inc.BNSF Spectrum, Inc.Burlington Northern (Manitoba) Limited Burlington Northern Railroad Holdings, Inc.Los Angeles Junction Railway CompanyMidwest/Northwest Properties Inc.Pine Canyon Land CompanySan Jacinto Rail LimitedSanta Fe Pacific Insurance CompanySanta Fe Pacific Pipelines, Inc.Santa Fe Pacific Railroad CompanySFP Pipeline Holdings, Inc.Slover Development Company LLCStar Lake Railroad CompanyThe Burlington Northern and Santa Fe Railway Company de Mexico, S.A. de C.V.The Zia CompanyWestern Fruit Express Company
Inactive Subsidiaries:Northern Radio Limited
Railroad Annual Report R-1

Road Initials: BNSF Year 2016 5200. COMPARATIVE STATEMENT OF FINANCIAL POSITION - ASSETS
(Dollars in Thousands)
Line Cross Account Title Balance at close Balance at begin- LineNo. Check of year ning of year No.
(a) (b) (c)
Current Assets1 701 Cash 570,348 564,856 12 702 Temporary cash investments 23 703 Special deposits 3
Accounts receivable 4 704 - Loan and notes 45 705 - Interline and other balances 90,639 66,772 56 706 - Customers 847,346 804,438 67 707 - Other 135,011 143,745 78 709, 708 - Accrued accounts receivables 196,041 167,076 89 708.5 - Receivables from affiliated companies 326,042 120,992 910 709.5 - Less: Allowance for uncollectible accounts (87,053) (73,097) 1011 710, 711, 714 Working funds prepayments deferred income tax debits 212,965 326,136 1112 712 Materials and supplies 825,018 829,358 12
13713, 713.5, 713.6 Other current assets 64,562 174,687 13
14 TOTAL CURRENT ASSETS 3,180,919 3,124,963 14
Other Assets15 715, 716, 717 Special funds 64,579 79,102 1516 721, 721.5 Investments and advances affiliated companies 16
(Schs. 310 and 310A) 552,839 553,70017 722, 723 Other investments and advances 1718 737, 738 Property used in other than carrier operation 985,776 980,281 18
(Less depreciation) $19 739, 741 Other assets 15,228,719 15,252,459 1920 743 Other deferred debits 1,230,951 1,110,320 2021 744 Accumulated deferred income tax debits 2122 TOTAL OTHER ASSETS 18,062,863 17,975,862 22
Road and Equipment23 731, 732 Road (Sch. 330) L-30 Col h & b 53,834,268 51,506,762 2324 731, 732 Equipment (Sch 330) L-39 Col h & b 12,033,951 11,285,383 2425 731, 732 Unallocated items 964,906 1,031,035 2526 733, 735 Accumulated depreciation and amortization 26
(Schs. 335, 342) (6,396,433) (5,124,186)27 Net Road and Equipment 60,436,693 58,698,994 27
28 * Total Assets 81,680,475 79,799,819 28
NOTES AND REMARKS
Railroad Annual Report R-1

6 Road Initials: BNSF Year 2016200. COMPARATIVE STATEMENT OF FINANCIAL POSITION - LIABILITIES AND SHAREHOLDERS' EQUITY
(Dollars in Thousands)
Line Cross Account Title Balance at close Balance at begin- LineNo. Check of year ning of year No.
(a) (b) (c)
Current Liabilities29 751 Loans and notes payable 2930 752 Accounts payable: interline and other balances 120,090 12,464 3031 753 Audited accounts and wages 235,507 251,199 3132 754 Other accounts payable 326,612 292,024 3233 755, 756 Interest and dividends payable 24,740 23,238 3334 757 Payables to affiliated companies 50,945 15,440 3435 759 Accrued accounts payable 1,623,890 1,741,482 3536 760, 761, 761.5 Taxes accrued 950,919 467,649 36
762
37763, 763.5, 763.6 Other current liabilities 159,321 151,968 37
38 764Equipment obligations and other long-term debt due within one year 84,831 214,079 38
39 TOTAL CURRENT LIABILITIES 3,576,855 3,169,543 39
Non-Current Liabilities40 765, 767 Funded debt unmatured 491,281 514,994 4041 766 Equipment obligations 497,344 520,701 4142 766.5 Capitalized lease obligations 480,942 536,041 4243 768 Debt in default 4344 769 Accounts payable: affiliated companies 4445 770.1, 770.2 Unamortized debt premium 4546 781 Interest in default 4647 783 Deferred revenues - transfers from govt. authorities 4748 786 Accumulated deferred income tax credits 19,963,817 19,181,491 4849 771, 772, 774, Other long-term liabilities and deferred credits 2,591,924 2,607,369 49
775, 782, 78450 TOTAL NON-CURRENT LIABILITIES 24,025,308 23,360,596 50
Shareholders' Equity51 791, 792 Total capital stock 1 1 5152 Common stock 1 1 5253 Preferred stock 5354 793 Discount on capital stock 5455 794, 795 Additional capital 42,919,547 42,919,547 55
Retained earnings:56 797 Appropriated 5657 798 Unappropriated 11,039,547 10,302,433 5758 798.5 Less treasury stock 5859 799 Accumulated Other Comprehensive Income or (loss) 119,217 47,699 5960 Total stockholders equity 54,078,312 53,269,680 6061 Noncontrolling interest 6162 Total equity (Lines 60 + 61) 54,078,312 53,269,680 62
63 Total Liabilities & Shareholders' Equity 81,680,475 79,799,819 63NOTES AND REMARKS
Railroad Annual Report R-1

Road Initials: BNSF Year 2016 7200. COMPARATIVE STATEMENT OF FINANCIAL POSITION - EXPLANATORY NOTES
(Dollars in Thousands)
The notes listed below are provided to disclose supplementary information on matters which have an important effect on the financialcondition of the carrier. The carrier shall give the particulars called for herein and where there is nothing to report, insert the word "none"; andin addition thereto shall enter in separate notes with suitable particulars other matters involving material amounts of the character commonlydisclosed in financial statements under generally accepted accounting principles, except as shown in other schedules. This includes statementsexplaining (1) service interruption insurance policies and indicating the amount of indemnity to which respondent will be entitled for workstoppage losses and the maximum amount of additional premium respondent may be obligated to pay in the event such losses are sustained byother railroads; (2) particulars concerning obligations for stock purchase options granted to officers and employees; and (3) what entrieshave been made for net income or retained income restricted under provisions of mortgages and other arrangements.
1. Amount (estimated, if necessary) of net income or retained income which has to be provided for capital expenditures, and for sinking funds, pursuant to provisions of reorganization plans, mortgages, deeds of trust, or other contracts. $ None
2. Estimated amount of future earnings which can be realized before paying Federal income taxes because of unused and available netoperating loss carryover on January 1 of the year following that for which the report is made. $ None
3. (a) Explain the procedure in accounting for pension funds and recording in the accounts the current and past service pension costs,indicating whether or not consistent with the prior year.
See Note 2 on page 9 - 15
(b) State amount, if any, representing the excess of the actuarially computed value of vested benefits over the total of the pension fund. See Note 2 on page 9 - 15
(c) Is any part of the pension plan funded? Specify. Yes X No
If funding is by insurance, give name of insuring company None
If funding is by trust agreement, list trustee(s) Northern Trust CompanyDate of trust agreement or latest amendment September 24, 2012If respondent is affiliated in any way with the trustee(s), explain affiliation: Not Affiliated
(d) List affiliated companies which are included in the pension plan funding agreement and describe basis for allocating charges under theagreement.
See Note 2 on page 9 - 15
(e) Is any part of the pension plan fund invested in stock or other securities of the respondent or its affiliates? Specify Yes No XIf yes, give number of the shares for each class of stock or other security.
Are voting rights attached to any securities held by the pension plan? Specify Yes No X If yes, who determines how stock is voted?
4. State whether a segregated political fund has been established as provided by the Federal Election Campaign Act of 1971 (18 U.S.C. 610).Yes X No
5. (a) The amount of employer's contribution to employee stock ownership plans for the current year was $ None
(b) The amount of investment tax credit used to reduce current income tax expense resulting from contributions to qualified employeestock ownership plans for the current year was $ None
6. In reference to Docket 37465, specify the total amount of business entertainment expenditures charged to the non-operating expenseaccount. $ None
Continued on following pageRailroad Annual Report R-1

8 Road Initials: BNSF Year 2016200. COMPARATIVE STATEMENT OF FINANCIAL POSITION - EXPLANATORY NOTES - Continued
7. Give particulars with respect to contingent assets and liabilities at the close of the year, in accordance with instruction 5-6 in the UniformSystem of Accounts for Railroad Companies, that are not reflected in the amounts of the respondent.
Disclose the nature and amount of contingency that is material.
Examples of contingent liabilities are items which may become obligations as a result of pending or threatened litigation, assessments or possible assessments of additional taxes, and agreements or obligations to repurchase securities or property. Additional pages may beadded if more space is needed. (Explain and/or reference to the following pages.)
See Note 3 on pages 15A -15H
(a) Changes in valuation accounts.
8. Marketable equity securities.
See Note 4 on page 15H for the information required below
Dr. (Cr.) Dr. (Cr.) toCost Market to Income Stockholder's Equity
(Current Yr.) Current Portfolioas of / / Noncurrent Portfolio
(Previous Yr.) Current Portfolioas of / / Noncurrent Portfolio
At 12/31/16, gross unrealized gains and losses pertaining to marketable equity securities were as follows:
Gains Losses
CurrentNoncurrent
A net unrealized gain (loss) of $ on the sale of marketable equity securities was included in net income for 2016.The cost of securities was based on the (method) cost of all the shares of each security held at time of sale.
Significant net realized and net unrealized gains and losses arising after date of the financial statements but prior to the filing, applicable tomarketable equity securities owned at balance sheet date shall be disclosed below:
NOTE: 12 / 31 / 16 Balance sheet date of reported year unless specified as previous year.
Railroad Annual Report R-1

Road Initials: BNSF Year 2016 9
Railroad Annual Report R-1
200. COMPARATIVE STATEMENT OF FINANCIAL POSITION-EXPLANATORY NOTES-Continued
NOTES TO FINANCIAL STATEMENTS
Note 1
The Company
BNSF Railway Company and its majority-owned subsidiaries, (collectively, BNSF Railway or Company) is a wholly-owned
subsidiary of Burlington Northern Santa Fe, LLC (BNSF). BNSF Railway operates one of the largest railroad networks in North
America. BNSF Railway operates approximately 32,500 route miles of track (excluding multiple main tracks, yard tracks and
sidings) in 28 states and also operates in three Canadian provinces. Through one operating transportation services segment, BNSF
Railway transports a wide range of products and commodities including the transportation of Consumer Products, Industrial
Products, Agricultural Products, and Coal, derived from manufacturing, agricultural and natural resource industries, which
constituted 34 percent, 26 percent, 22 percent, and 18 percent, respectively, of total freight revenues for the year ended December
31, 2016.
On February 12, 2010, Berkshire Hathaway Inc., a Delaware corporation (Berkshire), acquired 100% of the outstanding shares of
Burlington Northern Santa Fe Corporation common stock that it did not already own. The acquisition was completed through the
merger (Merger) of a Berkshire wholly-owned merger subsidiary and Burlington Northern Santa Fe Corporation with the surviving
entity renamed Burlington Northern Santa Fe, LLC. Berkshire’s cost of acquiring BNSF was pushed-down to establish a new
accounting basis for BNSF beginning as of February 13, 2010.
The Merger was accounted for using the acquisition method under Accounting Standards Codification (ASC) Topic 805, Business
Combinations. However, pursuant to Surface Transportation Board Docket No. FD 35506 effective August 23, 2013, this annual
R-1 report reflects the phase-in of purchase accounting adjustments. As a result, certain beginning balances will not agree to the
prior year’s ending balances
Note 2
Employment Benefit Plans
BNSF provides a funded, noncontributory qualified pension plan, the BNSF Retirement Plan, which covers most non-union
employees, and an unfunded non-tax-qualified pension plan, the BNSF Supplemental Retirement Plan, which covers certain officers
and other employees. The benefits under these pension plans are based on years of credited service and the highest consecutive
sixty months of compensation for the last ten years of salaried employment with the Company. BNSF Railway provides two funded,
noncontributory qualified pension plans which cover certain union employees of the former The Atchison, Topeka and Santa Fe
Railway Company. The benefits under these pension plans are based on elections made at the time the plans were implemented.
BNSF's funding policy is to contribute annually not less than the regulatory minimum and not more than the maximum amount
deductible for income tax purposes with respect to the funded plans.
Certain salaried employees of BNSF Railway who have met age and years of service requirements are eligible for medical benefits,
including prescription drug coverage, during retirement. The postretirement medical and prescription drug benefit is contributory and
provides benefits to retirees, and their covered dependents. Retiree contributions are adjusted annually. The plan also contains
fixed deductibles, coinsurance and out-of-pocket limitations. In addition, a basic life insurance plan is noncontributory and covers
retirees only. Optional life insurance coverage is available for some retirees; however, the retiree is responsible for the full cost.
BNSF’s policy is to fund the life insurance premiums and medical benefits as they come due. Generally, employees beginning
salaried employment with BNSF Railway subsequent to September 22, 1995, are not eligible for medical benefits during retirement.
These benefits are collectively referred to as retiree health and welfare benefits.

10 Road Initials: BNSF Year 2016
Railroad Annual Report R-1
200. COMPARATIVE STATEMENT OF FINANCIAL POSITION-EXPLANATORY NOTES-Continued
NOTES TO FINANCIAL STATEMENTS
Components of the net (benefit) cost for certain employee benefit plans were as follows (in millions):
Pension Benefits
Year Ended December 31,
2016
Year Ended December 31,
2015
Year Ended December 31,
2014
Service cost $ 46 $ 48 $ 38Interest cost 95 90 95Expected return on plan assets (142) (138) (134) Amortization of prior service credits (1) (1) (1) Amortization of net loss 1 14 25Settlements (1) (1) (1) Net (benefit) cost recognized $ (2) $ 12 $ 22
Retiree Health and Welfare Benefits
Year Ended December 31,
2016
Year Ended December 31,
2015
Year Ended December 31,
2014
Service cost $ 1 $ 1 $ 1Interest cost 10 10 11Amortization of prior service credits (2) (2) (2)Amortization of net loss 1 2 1 Net cost recognized $ 10 $ 11 $ 11
The projected benefit obligation is the present value of benefits earned to date by plan participants, including the effect of assumed
future salary increases and expected healthcare cost trend rate increases. The following table shows the change in projected benefit
obligation (in millions):
Pension Benefits
Change in Benefit Obligation December 31,
2016
December 31, 2015
Projected benefit obligation at beginning of period $ 2,320 $ 2,452Service cost 46 48Interest cost 95 90Actuarial gain (55) (111)Benefits paid (143) (145)Administrative expenses - (1) Settlements (16) (13)
Projected benefit obligation at end of period 2,247 2,320 Component representing future salary increases (102) (146)
Accumulated benefit obligation at end of period $ 2,145 $ 2,174
Retiree Health and Welfare Benefits
Change in Benefit Obligation December 31,
2016 December 31,
2015
Projected benefit obligation at beginning of period $ 258 $ 280Service cost 1 1Interest cost 10 10Plan participants’ contributions 5 5Actuarial gain (13) (13)Benefits paid (24) (25)
Projected benefit obligation at end of period 237 258
At December 31, 2016, BNSF’s pension plans had plan assets in excess of accumulated and projected benefit obligations. At
December 31, 2015, BNSF's pension plans had plan assets in excess of accumulated benefit obligations and projected benefit
obligations in excess of plan assets.

Road Initials: BNSF Year 2016 11
Railroad Annual Report R-1
200. COMPARATIVE STATEMENT OF FINANCIAL POSITION-EXPLANATORY NOTES-Continued
NOTES TO FINANCIAL STATEMENTS
The following table shows the change in plan assets of the plans (in millions):
Pension Benefits
Change in Plan Assets December 31,
2016 December 31,
2015
Fair value of plan assets at beginning of period $ 2,289 $ 2,342Actual return on plan assets 193 95Employer contributionsa 10 11Benefits paid (143) (145)Administrative expenses - (1) Settlements (16) (13)
Fair value of plan assets at measurement date $ 2,333 $ 2,289 a Employer contributions were classified as Other, Net under Operating Activities in the Company’s Consolidated Statements of Cash Flows.
Retiree Health and Welfare Benefits
Change in Plan Assets December 31,
2016 December 31,
2015
Fair value of plan assets at beginning of period $ – $ –Employer contributionsa 19 20Plan participants’ contributions 5 5Benefits paid (24) (25)
Fair value of plan assets at measurement date $ – $ – a Employer contributions were classified as Other, Net under Operating Activities in the Company’s Consolidated Statements of Cash Flows.
The following table shows the funded status, defined as plan assets less the projected benefit obligation (in millions):
Pension Benefits
Retiree Health and Welfare Benefits
December 31,
2016 December 31, 2015
December 31, 2016
December 31, 2015
Funded status (plan assets less projected benefit obligations) $ 86 $ (31) $ (237) $ (258)
Of the combined pension and retiree health and welfare benefits liability of $151 million and $289 million recognized as of December
31, 2016 and 2015, respectively, $30 million was included in other current liabilities in both December 31, 2016 and 2015, and $200
million and $93 million were included in other assets at December 31, 2016 and 2015, respectively.
Actuarial gains and losses and prior service credits are recognized in the Consolidated Balance Sheets through an adjustment to
accumulated other comprehensive income / (loss) (AOCI). The following table shows the pre-tax change in AOCI attributable to the
components of the net cost and the change in benefit obligation (in millions):
Pension Benefits
Change in AOCI
Year Ended December 31,
2016
Year Ended December 31,
2015
Year Ended December 31,
2014
Beginning balance $ 102 $ (136)
$ 63Amortization of net loss 1 14 25Amortization of prior service credits (1) (1) (1)Actuarial gain (loss) 106 68 (392)Settlements (1) (1) (1)
Ending balance $ 207 $ (56) $ (306)

12 Road Initials: BNSF Year 2016
Railroad Annual Report R-1
200. COMPARATIVE STATEMENT OF FINANCIAL POSITION-EXPLANATORY NOTES-Continued
NOTES TO FINANCIAL STATEMENTS
Retiree Health and Welfare Benefits
Change in AOCI
Year Ended December 31,
2016
Year Ended December 31,
2015
Year Ended December 31,
2014
Beginning balance $ (21) $ (39) $ (31) Amortization of net loss 1 2 1 Amortization of prior service credits (2) (2) (2) Actuarial gain (loss) 13 13 (13)
Ending balance $ (9) $ (26) $ (45)
Less than $1 million, net of tax, of the actuarial losses and prior service credits from defined benefit pension plans in AOCI are
required to be amortized into net periodic benefit cost over the next fiscal year. Approximately $1 million, net of tax, of the prior
service credits and less than $1 million, net of tax, of the actuarial losses from retiree health and welfare benefit plans in AOCI are
required to be amortized into net periodic benefit cost over the next fiscal year. Pre-tax amounts currently recognized in AOCI
consist of the following (in millions):
Pension Benefits
Retiree Health and Welfare Benefits
2016 2015 2016 2015
Net gain (loss) $ 206 $ (59) $ (14) $ (34)Prior service credits 4 5 5 8 Settlements (3) (2) − − Pre-tax amount recognized in AOCI at December 31, 207 (56) (9) (26)
After-tax amount recognized in AOCI at December 31, $ 128 $ (34) $ (6) $ (16)
The assumptions used in accounting for the BNSF plans were as follows:
Pension Benefits
Assumptions Used to Determine Net Cost
Year Ended December 31,
2016
Year Ended December 31,
2015
Year Ended December 31,
2014
Discount rate 4.2 % 3.8 % 4.5 % Expected long-term rate of return on plan assets 6.6 % 6.6 % 6.8 % Rate of compensation increase 3.8 % 3.8 % 3.8 %
Retiree Health and Welfare Benefits
Assumptions Used to Determine Net Cost
Year Ended December 31,
2016
Year Ended December 31,
2015
Year Ended December 31,
2014
Discount rate 4.1 % 3.7 % 4.5 % Rate of compensation increase 3.8 % 3.8 % 3.8 %
Pension Benefits
Retiree Health and Welfare Benefits
Assumptions Used to Determine Benefit Obligations December 31, 2016
December 31, 2015
December 31, 2016
December 31, 2015
Discount rate 4.1 % 4.2 % 3.9 % 4.1 %Rate of compensation increase 3.3 % 3.8 % 3.3 % 3.8 %

Road Initials: BNSF Year 2016 13
Railroad Annual Report R-1
200. COMPARATIVE STATEMENT OF FINANCIAL POSITION-EXPLANATORY NOTES-Continued
NOTES TO FINANCIAL STATEMENTS
BNSF determined the discount rate based on a yield curve that utilized year-end market yields of high-quality corporate bonds to
develop spot rates that are matched against the plans' expected benefit payments. The discount rate used for the 2017 calculation
of net benefit cost decreased to 4.1 percent for pension and 3.9 percent for retiree health and welfare benefits, which reflects market
conditions at the December 31, 2016 measurement date.
Various other assumptions including retirement and withdrawal rates, compensation increases, payment form and benefit
commencement age are based upon a five-year experience study. In 2016, BNSF obtained an updated study which had an
immaterial impact on its pension and retiree health and welfare projected benefit obligations.
In 2015, BNSF utilized the Society of Actuaries (SOA) RP-2014 mortality tables with a modified improvement scale in the calculation
of its year-end benefit obligations. In 2016, BNSF adopted actuary-produced mortality tables and an improvement scale derived
from the updated tables in the calculation of its December 31, 2016 liabilities, as they represent a better estimate of mortality for
plan participants. The change in mortality table assumption had an immaterial impact on the Company's pension and retiree health
and welfare projected benefit obligations.
Pension plan assets are generally invested with the long-term objective of earning sufficient amounts to cover expected benefit
obligations, while assuming a prudent level of risk. Allocations may change as a result of changing market conditions and
investment opportunities. The expected rates of return on plan assets reflect subjective assessments of expected invested asset
returns over a period of several years. Actual experience will differ from the assumed rates. The expected rate of return on plan
assets was 6.6 percent for 2016 and will be 6.6 percent for 2017.
The following table is an estimate of the impact on future net benefit cost that could result from hypothetical changes to the most
sensitive assumptions, the discount rate and rate of return on plan assets:
Sensitivity Analysis
Change in Net Benefit Cost
Hypothetical Discount Rate Change Pension Retiree Health and Welfare 50 basis point decrease $1 million increase $ —million decrease50 basis point increase $7 million decrease $ —million increase
Hypothetical Rate of Return on Plan Assets Change Pension 50 basis point decrease $11 million increase50 basis point increase $11 million decrease
The following table presents assumed health care cost trend rates:
Year Ended December 31,
2016
Year Ended December 31,
2015
Year Ended December 31,
2014
Assumed health care cost trend rate for next year (participants over 65) 3.0 % 3.0 %
3.0 % Assumed health care cost trend rate for next year
(participants under 65) 7.4 % 7.7 %
7.9 % Rate to which health care cost trend rate for participants
under 65 is expected to decline and remain 4.4 % 4.5 %
4.5 % Year that the rate reaches the ultimate trend rate 2039 2038 2028
Assumed health care cost trend rates have a significant effect on the amounts reported for the health care plans. A one percentage
point change in assumed health care cost trend rates would have the following effects (in millions):
One Percentage-
Point Increase
One Percentage-
Point Decrease
Effect on total service and interest cost $ 1 $ (1) Effect on postretirement benefit obligation $ 17 $ (15)

14 Road Initials: BNSF Year 2016
Railroad Annual Report R-1
200. COMPARATIVE STATEMENT OF FINANCIAL POSITION-EXPLANATORY NOTES-Continued
NOTES TO FINANCIAL STATEMENTS
Investments are stated at fair value. The various types of investments are valued as follows:
(i) Equity securities are valued at the last trade price at primary exchange close time on the last business day of the year (Level 1
input). If the last trade price is not available, values are based on bid, ask/offer quotes from contracted pricing vendors, brokers, or
investment managers (Level 3 input or Level 2 if corroborated).
(ii) Other fixed maturity securities and government obligations are valued based on institutional bid evaluations from contracted
vendors. Where available, vendors use observable market-based data to evaluate prices (Level 2 input). This also applies to U.S.
Treasury securities included in cash and cash equivalents. If observable market-based data is not available, unobservable inputs
such as extrapolated data, proprietary models, and indicative quotes are used to arrive at estimated prices representing the price a
dealer would pay for the security (Level 3 input).
(iii) Investment funds are valued at the daily net asset value of shares held at year end. Net asset value is considered a Level 1
input if net asset value is computed daily and redemptions at this value are available to all shareholders without restriction. Net
asset value is considered a Level 2 input if the fund may restrict share redemptions under limited circumstances or if net asset value
is not computed daily. Net asset value is considered a Level 3 input if shares could not be redeemed on the reporting date and net
asset value cannot be corroborated by trading activity.
The following table summarizes the investments of BNSF’s funded pension plans as of December 31, 2016, based on the inputs
used to value them (in millions):
Asset Category
Total as of December 31,
2016
Level 1
Inputs
Level 2
Inputs
Level 3
Inputs
Cash and equivalents $ 1 $ 1 $ − $ −
Equity securities a 2,139 2,139 − −
Government obligations 164 − 164 −
Other fixed maturity securities 21 − 21 −
Investment funds and other 8 8 − −
Total b $ 2,333 $ 2,148 $ 185 $ −
a As of December 31, 2016, four equity securities each exceeded 10 percent of total plan assets. These investments
represent approximately 56 percent of total plan assets.
b Excludes less than $1 million accrued for dividend and interest receivable.

Road Initials: BNSF Year 2016 15
Railroad Annual Report R-1
200. COMPARATIVE STATEMENT OF FINANCIAL POSITION-EXPLANATORY NOTES-Continued
NOTES TO FINANCIAL STATEMENTS
Comparative Prior Year Information
The following table summarizes the investments of BNSF’s funded pension plans as of December 31, 2015, based on the inputs
used to value them (in millions):
Asset Category
Total as of December 31,
2015
Level 1
Inputs
Level 2
Inputs
Level 3
Inputs
Cash and equivalents $ 167 $ 3 $ 164 $ −
Equity securitiesa 2,060 2,060 −
Government obligations 12 − 12 −
Other fixed maturity securities 31 − 31 −
Investment funds and other 19 19 − −
Total b $ 2,289 $ 2,082 $ 207 $ −
a As of December 31, 2015, three equity securities each exceeded 10 percent of total plan assets. These investments represented approximately 47 percent of total plan assets. b Excludes less than $1 million accrued for dividend and interest receivable.
The Company is not required to make contributions to its funded pension plans in 2017. The Company expects to make benefit
payments in 2017 of $11 million from its unfunded non-qualified pension plan.
The following table shows expected benefit payments from its defined benefit pension plans and expected claim payments for
the retiree health and welfare plan for the next five fiscal years and the aggregate five years thereafter (in millions):
Fiscal year
Expected
Pension
Plan Benefit Paymentsa
Expected
Retiree Health
and Welfare Payments
2017 $ 166 $ 192018 $ 153 $ 182019 $ 152 $ 182020 $ 151 $ 172021 $ 145 $ 162022-2026 $ 661 $ 73a Primarily consists of the BNSF Retirement Plan payments, which are made from the plan trust and do not represent an immediate cash outflow to the Company.
Defined Contribution Plans
BNSF and BNSF Railway sponsor qualified 401(k) plans that cover substantially all employees and a non-qualified defined
contribution plan that covers certain officers and other employees. The Company matched 75 percent of the first six percent of non-
union employees’ contributions and matched 25 percent on the first four percent of a limited number of union employees’
contributions, which are subject to certain percentage limits of the employees’ earnings, at each pay period. Employer contributions
are subject to a five-year length of service vesting schedule. The Company’s 401(k) matching expense was $33 million during the
years ended December 31, 2016 and 2015 and $35 million during the year ended December 31, 2014.
Other
Under collective bargaining agreements, BNSF Railway participates in multi-employer benefit plans that provide certain
postretirement health care and life insurance benefits for eligible union employees. Insurance premiums paid attributable to retirees,
which are generally expensed as incurred, were $61 million, $58 million and $65 million during the years ended December 31, 2016,
2015 and 2014, respectively. The average number of employees covered under these plans were 36 thousand during the year
ended December 31, 2016, and 40 thousand during the years ended December 31, 2015 and 2014.

15A Road Initials: BNSF Year 2016
Railroad Annual Report R-1
200. COMPARATIVE STATEMENT OF FINANCIAL POSITION-EXPLANATORY NOTES-Continued
NOTES TO FINANCIAL STATEMENTS
Note 3 Commitments and Contingencies
Lease Commitments BNSF Railway has substantial lease commitments for locomotives, freight cars, office buildings, operating facilities and other property, and many of these leases provide the option to purchase the leased item at fair market value at the end of the lease. However, some provide fixed price purchase options. Future minimum lease payments as of December 31, 2016, are summarized as follows (in millions): December 31,
Capital Leases Operating
Leasesa
2017 $ 77 $ 519 2018 74 475 2019 71 446 2020 69 449 2021 200 374 Thereafter 164 1,154 Total 655 $ 3,417 Less amount representing interest (143) Present value of minimum lease payments $ 512 a Excludes leases having non-cancelable lease terms of less than one year and per diem leases. Lease rental expense for all operating leases, excluding per diem leases, was $595 million, $623 million and $626 million for the years ended December 31, 2016, 2015 and 2014, respectively. When rental payments are not made on a straight-line basis, the Company recognizes rental expense on a straight-line basis over the lease term. Contingent rentals and sublease rentals were not significant. Other Commitments
In the normal course of business, the Company enters into long-term contractual requirements for future goods and services needed for the operations of the business. Such commitments are not in excess of expected requirements and are not reasonably likely to result in performance penalties or payments that would have a material adverse effect on the Company’s liquidity. Guarantees As of December 31, 2016, BNSF Railway has not been called upon to perform under the guarantees specifically disclosed in this footnote and does not anticipate a significant performance risk in the foreseeable future. Debt and other obligations of non-consolidated entities guaranteed by the Company as of December 31, 2016, were as follows (dollars in millions):
Guarantees
BNSF Railway
Ownership Percentage
PrincipalAmount
Guaranteed
MaximumFuture
Payments
MaximumRecourseAmount a
Remaining Term
(in years ) Capitalized Obligations
Kinder Morgan Energy Partners, L.P. 0.5% $ 190 $ 190 $ – Termination of
Ownership $ 2b
Chevron Phillips Chemical Company, LP – N/Ad N/Ad N/Ad 11 $ 22c
a Reflects the maximum amount the Company could recover from a third party other than the counterparty. b Reflects capitalized obligations that are recorded on the Company’s Consolidated Balance Sheet. c Reflects the asset and corresponding liability for the fair value of these guarantees required by authoritative accounting guidance related to
guarantees. d There is no cap to the liability that can be sought from BNSF Railway for BNSF Railway’s negligence or the negligence of the indemnified party.
However, BNSF Railway could receive reimbursement from certain insurance policies if the liability exceeds a certain amount.

Road Initials: BNSF Year 2016 15B
Railroad Annual Report R-1
200. COMPARATIVE STATEMENT OF FINANCIAL POSITION-EXPLANATORY NOTES-Continued
NOTES TO FINANCIAL STATEMENTS
Kinder Morgan Energy Partners, L.P.
Santa Fe Pacific Pipelines, Inc., an indirect, wholly-owned subsidiary of BNSF Railway, has a guarantee in connection with its remaining special limited partnership interest in Santa Fe Pacific Pipeline Partners, L.P. (SFPP), a subsidiary of Kinder Morgan Energy Partners, L.P., to be paid only upon default by the partnership. All obligations with respect to the guarantee will cease upon termination of ownership rights, which would occur upon a put notice issued by BNSF Railway or the exercise of the call rights by the general partners of SFPP.
Chevron Phillips Chemical Company, LP
BNSF Railway has an indemnity agreement with Chevron Phillips Chemical Company LP (Chevron Phillips), granting certain rights of indemnity from BNSF Railway, in order to facilitate access to a storage facility. Under certain circumstances, payment under this obligation may be required in the event Chevron Phillips were to incur certain liabilities or other incremental costs resulting from trackage access. Indemnities
In the ordinary course of business, BNSF Railway enters into agreements with third parties that include indemnification clauses. The Company believes that these clauses are generally customary for the types of agreements in which they are included. At times, these clauses may involve indemnification for the acts of the Company, its employees and agents, indemnification for another party’s acts, indemnification for future events, indemnification based upon a certain standard of performance, indemnification for liabilities arising out of the Company’s use of leased equipment or other property, or other types of indemnification. Despite the uncertainty whether events which would trigger the indemnification obligations would ever occur, the Company does not believe that these indemnity agreements will have a material adverse effect on the Company’s results of operations, financial position or liquidity. Additionally, the Company believes that, due to lack of historical payment experience, the fair value of indemnities cannot be estimated with any amount of certainty and that the fair value of any such amount would be immaterial to the Consolidated Financial Statements. Agreements that reflect unique circumstances, particularly agreements that contain guarantees that indemnify for another party’s acts, are disclosed separately, if appropriate. Unless separately disclosed above, no fair value liability related to indemnities has been recorded in the Consolidated Financial Statements. Variable Interest Entities – Leases
BNSF Railway has entered into various lease transactions in which the structure of the lease contains VIEs. These leases are primarily for equipment. These VIEs were created solely for the lease transactions and have no other activities, assets or liabilities outside of the lease transactions. In some of the arrangements, BNSF Railway has the option to purchase some or all of the leased assets at a fixed-price, thereby creating variable interests for BNSF Railway in the VIEs. The future minimum lease payments associated with the VIE leases were approximately $2 billion as of December 31, 2016. The future minimum lease payments are included in future operating lease payments disclosed in Note 3. In the event the leased asset is destroyed, BNSF Railway is obligated to either replace the asset or pay a fixed loss amount. The inclusion of the fixed loss amount is a standard clause within the lease arrangements. Historically, BNSF Railway has not incurred significant losses related to this clause. As such, it is not anticipated that the maximum exposure to loss would materially differ from the future minimum lease payments. BNSF Railway does not provide financial support to the VIEs that it was not previously contractually obligated to provide. BNSF Railway maintains and operates the leased assets based on contractual obligations within the lease arrangements, which set specific guidelines consistent within the industry. As such, BNSF Railway has no control over activities that could materially impact the fair value of the leased assets. BNSF Railway does not hold the power to direct the activities of the VIEs and therefore does not control the ongoing activities that have a significant impact on the economic performance of the VIEs. Additionally, BNSF Railway does not have the obligation to absorb losses of the VIEs or the right to receive benefits of the VIEs that could potentially be significant to the VIEs. Depending on market conditions, the fixed-price purchase options could potentially provide benefit to the Company; however, any benefits potentially received from a fixed-price purchase option are expected to be minimal. Based on these factors, BNSF Railway is not the primary beneficiary of the VIEs. As BNSF Railway is not the primary beneficiary and the majority of the VIE leases are operating leases, the assets and liabilities related to the VIEs recorded in the Company's Consolidated Balance Sheet are immaterial.

15C Road Initials: BNSF Year 2016
Railroad Annual Report R-1
200. COMPARATIVE STATEMENT OF FINANCIAL POSITION-EXPLANATORY NOTES-Continued
NOTES TO FINANCIAL STATEMENTS
Personal Injury and Environmental Costs Personal Injury
Personal injury claims, including asbestos claims and employee work-related injuries and third-party injuries (collectively, other personal injury), are a significant expense for the railroad industry. Personal injury claims by BNSF Railway employees are subject to the provisions of the Federal Employers’ Liability Act (FELA) rather than state workers’ compensation laws. FELA’s system of requiring the finding of fault, coupled with unscheduled awards and reliance on the jury system, contributed to increased expenses in past years. Other proceedings include claims by non-employees for punitive as well as compensatory damages. A few proceedings purport to be class actions. The variability present in settling these claims, including non-employee personal injury and matters in which punitive damages are alleged, could result in increased expenses in future years. BNSF Railway has implemented a number of safety programs designed to reduce the number of personal injuries as well as the associated claims and personal injury expense. BNSF Railway records an undiscounted liability for personal injury claims when the expected loss is both probable and reasonably estimable. The liability and ultimate expense projections are estimated using standard actuarial methodologies. Liabilities recorded for unasserted personal injury claims are based on information currently available. Due to the inherent uncertainty involved in projecting future events such as the number of claims filed each year, developments in judicial and legislative standards and the average costs to settle projected claims, actual costs may differ from amounts recorded. BNSF Railway has obtained insurance coverage for certain claims, as discussed under the heading “BNSF Insurance Company.” Expense accruals and any required adjustments are classified as materials and other in the Consolidated Statements of Income. Asbestos
The Company is party to a number of personal injury claims by employees and non-employees who may have been exposed to asbestos. The heaviest exposure for certain BNSF Railway employees was due to work conducted in and around the use of steam locomotive engines that were phased out between the years of 1950 and 1967. However, other types of exposures, including exposure from locomotive component parts and building materials, continued after 1967 until they were substantially eliminated at BNSF Railway by 1985. BNSF Railway assesses its unasserted asbestos liability exposure on an annual basis during the third quarter. BNSF Railway determines its asbestos liability by estimating its exposed population, the number of claims likely to be filed, the number of claims that will likely require payment and the estimated cost per claim. Estimated filing and dismissal rates and average cost per claim are determined utilizing recent claim data and trends.
Key elements of the assessment include:
• Because BNSF Railway did not have detailed employment records in order to compute the population of
potentially exposed employees, it computed an estimate using Company employee data from 1970 forward and estimated the BNSF Railway employee base from 1938-1969 using railroad industry historical census data and estimating BNSF Railway’s representation in the total railroad population.
• The projected incidence of disease was estimated based on epidemiological studies using employees’ age,
duration and intensity of exposure while employed. • An estimate of the future anticipated claims filing rate by type of disease (non-malignant, cancer and
mesothelioma) was computed using the Company’s average historical claim filing rates observed in 2012-2015. • An estimate of the future anticipated dismissal rate by type of claim was computed using the Company’s
historical average dismissal rates observed in 2011-2015. • An estimate of the future anticipated settlement by type of disease was computed using the Company’s
historical average of dollars paid per claim for pending and future claims using the average settlement by type of incidence observed during 2011-2015.

Road Initials: BNSF Year 2016 15D
Railroad Annual Report R-1
200. COMPARATIVE STATEMENT OF FINANCIAL POSITION-EXPLANATORY NOTES-Continued
NOTES TO FINANCIAL STATEMENTS
From these assumptions, BNSF Railway projected the incidence of each type of disease to the estimated population to arrive at an estimate of the total number of employees that could potentially assert a claim. Historical claim filing rates were applied for each type of disease to the total number of employees that could potentially assert a claim to determine the total number of anticipated claim filings by disease type. Historical dismissal rates, which represent claims that are closed without payment, were then applied to calculate the number of future claims by disease type that would likely require payment by the Company. Finally, the number of such claims was multiplied by the average settlement value to estimate BNSF Railway’s future liability for unasserted asbestos claims.
The most sensitive assumptions for this accrual are the estimated future filing rates and estimated average claim values. Asbestos claim filings are typically sporadic and may include large batches of claims solicited by law firms. To reflect these factors, BNSF Railway used a multi-year calibration period (i.e., average historical filing rates observed in 2012-2015) because it believed it would be most representative of its future claim experience. In addition, for non-malignant claims, the number of future claims to be filed against BNSF Railway declines at a rate consistent with both mortality and age as there is a decreasing propensity to file a claim as the population ages. BNSF Railway believes the average claim values by type of disease from the historical period 2011-2015 are most representative of future claim values. Non-malignant claims, which represent approximately 80 percent of the total number and 45 percent of the cost of estimated future asbestos claims, were priced by age of the projected claimants. Historically, the ultimate settlement value of these types of claims is most sensitive to the age of the claimant.
During the third quarters of 2016, 2015 and 2014, the Company analyzed recent filing and payment trends to ensure the assumptions used by BNSF Railway to estimate its future asbestos liability were reasonable. In 2016, management determined that the liability remained appropriate and no change was recorded. In 2015, management recorded an increase in expense of $5 million. In 2014, management recorded a decrease in expense of $2 million. The Company plans to update its study again in the third quarter of 2017.
Throughout the year, BNSF Railway monitors actual experience against the number of forecasted claims and expected claim payments and will record adjustments to the Company’s estimates as necessary. Based on BNSF Railway’s estimate of the potentially exposed employees and related mortality assumptions, it is anticipated that unasserted asbestos claims will continue to be filed through the year 2050. The Company recorded an amount for the full estimated filing period through 2050 because it had a relatively finite exposed population (former and current employees hired prior to 1985), which it was able to identify and reasonably estimate and about which it had obtained reliable demographic data (including age, hire date and occupation) derived from industry or BNSF Railway specific data that was the basis for the study. BNSF Railway projects that approximately 65, 80 and 95 percent of the future unasserted asbestos claims will be filed within the next 10, 15 and 25 years, respectively. Other Personal Injury
BNSF Railway estimates its other personal injury liability claims and expense quarterly based on the covered population, activity levels and trends in frequency and the costs of covered injuries. Estimates include unasserted claims except for certain repetitive stress and other occupational trauma claims that allegedly result from prolonged repeated events or exposure. Such claims are estimated on an as-reported basis because the Company cannot estimate the range of reasonably possible loss due to other non-work related contributing causes of such injuries and the fact that continued exposure is required for the potential injury to manifest itself as a claim. BNSF Railway has not experienced any significant adverse trends related to these types of claims in recent years.

15E Road Initials: BNSF Year 2016
Railroad Annual Report R-1
200. COMPARATIVE STATEMENT OF FINANCIAL POSITION-EXPLANATORY NOTES-Continued
NOTES TO FINANCIAL STATEMENTS
Key elements of the actuarial assessment include: • Size and demographics (employee age and craft) of the workforce. • Activity levels (manhours by employee craft and carloadings). • Expected claim frequency rates by type of claim (employee FELA or third-party liability) based on historical claim
frequency trends. • Expected dismissal rates by type of claim based on historical dismissal rates. • Expected average paid amounts by type of claim for open and incurred but not reported claims that eventually close with
payment. From these assumptions, BNSF Railway estimates the number of open claims by accident year that will likely require payment by the Company. The projected number of open claims by accident year that will require payment is multiplied by the expected average cost per claim by accident year and type to determine BNSF Railway’s estimated liability for all asserted claims. Additionally, BNSF Railway estimates the number of its incurred but not reported claims that will likely result in payment based upon historical emergence patterns by type of claim. The estimated number of projected claims by accident year requiring payment is multiplied by the expected average cost per claim by accident year and type to determine BNSF Railway’s estimated liability for incurred but not reported claims. BNSF Railway monitors quarterly actual experience against the number of forecasted claims to be received, the forecasted number of claims closing with payment and expected claim payments. Adjustments to the Company’s estimates are recorded quarterly as necessary or more frequently as new events or revised estimates develop. The following table summarizes the activity in the Company’s accrued obligations for asbestos and other personal injury matters (in millions):
Year Ended December 31,
2016
Year Ended December 31,
2015
Year Ended December 31,
2014 Beginning balance $ 375 $ 371 $ 379Accruals 80 81 62Payments (88) (81) (73) Ending balance $ 367 $ 371 $ 368
At December 31, 2016 and 2015, $85 million was included in current liabilities for both periods. Defense and processing costs, which are recorded on an as-reported basis, were not included in the recorded liability. The Company is primarily self-insured for personal injury claims. Because of the uncertainty surrounding the ultimate outcome of personal injury claims, it is reasonably possible that future costs to settle personal injury claims may range from approximately $325 million to $435 million. However, BNSF Railway believes that the $367 million recorded at December 31, 2016, is the best estimate of the Company’s future obligation for the settlement of personal injury claims. The amounts recorded by BNSF Railway for personal injury liabilities were based upon currently known facts. Future events, such as the number of new claims to be filed each year, the average cost of disposing of claims, as well as the numerous uncertainties surrounding personal injury litigation in the United States, could cause the actual costs to be higher or lower than projected.

Road Initials: BNSF Year 2016 15F
Railroad Annual Report R-1
200. COMPARATIVE STATEMENT OF FINANCIAL POSITION-EXPLANATORY NOTES-Continued
NOTES TO FINANCIAL STATEMENTS
Although the final outcome of personal injury matters cannot be predicted with certainty, considering among other things the meritorious legal defenses available and liabilities that have been recorded, it is the opinion of BNSF Railway that none of these items, when finally resolved, will have a material adverse effect on the Company’s financial position or liquidity. However, the occurrence of a number of these items in the same period could have a material adverse effect on the results of operations in a particular quarter or fiscal year.
BNSF Insurance Company
Burlington Northern Santa Fe Insurance Company, Ltd. (BNSFIC), a wholly-owned subsidiary of BNSF, provides insurance coverage for certain risks, FELA claims, railroad protective and force account insurance claims and certain excess general liability and property coverage, and certain other claims which are subject to reinsurance. During the years ended December 31, 2016, 2015 and 2014, BNSFIC wrote insurance coverage with premiums totaling $70 million, $73 million and $79 million, respectively, for BNSF Railway, net of reimbursements from third parties. During this same time, BNSF Railway recognized $70 million, $75 million and $79 million, respectively, in expense related to those premiums, which is classified as purchased services in the Consolidated Statements of Income. At December 31, 2016 and 2015, unamortized premiums remaining on the Consolidated Balance Sheet were $5 million for both periods. During the years ended December 31, 2016, 2015 and 2014, BNSFIC made claim payments totaling $69 million, $214 million and $98 million, respectively, for settlement of covered claims. At December 31, 2016 and 2015, claims receivables from BNSFIC were $3 million and $15 million, respectively. Environmental
The Company’s operations, as well as those of its competitors, are subject to extensive federal, state and local environmental regulation. BNSF Railway’s operating procedures include practices to protect the environment from the risks inherent in railroad operations, which frequently involve transporting chemicals and other hazardous materials. Additionally, many of BNSF Railway’s land holdings are and have been used for industrial or transportation-related purposes or leased to commercial or industrial companies whose activities may have resulted in discharges onto the property. As a result, BNSF Railway is subject to environmental cleanup and enforcement actions. In particular, the federal Comprehensive Environmental Response, Compensation and Liability Act of 1980 (CERCLA), also known as the Superfund law, as well as similar state laws, generally impose joint and several liability for cleanup and enforcement costs on current and former owners and operators of a site without regard to fault or the legality of the original conduct. BNSF Railway has been notified that it is a potentially responsible party (PRP) for study and cleanup costs at Superfund sites for which investigation and remediation payments are or will be made or are yet to be determined (the Superfund sites) and, in many instances, is one of several PRPs. In addition, BNSF Railway may be considered a PRP under certain other laws. Accordingly, under CERCLA and other federal and state statutes, BNSF Railway may be held jointly and severally liable for all environmental costs associated with a particular site. If there are other PRPs, BNSF Railway generally participates in the cleanup of these sites through cost-sharing agreements with terms that vary from site to site. Costs are typically allocated based on such factors as relative volumetric contribution of material, the amount of time the site was owned or operated and/or the portion of the total site owned or operated by each PRP. BNSF Railway is involved in a number of administrative and judicial proceedings and other mandatory cleanup efforts for 220 sites, including 18 Superfund sites, at which it is participating in the study or cleanup, or both, of alleged environmental contamination. Liabilities for environmental cleanup costs are recorded when BNSF Railway’s liability for environmental cleanup is probable and reasonably estimable. Subsequent adjustments to initial estimates are recorded as necessary based upon additional information developed in subsequent periods. Environmental costs include initial site surveys and environmental studies as well as costs for remediation of sites determined to be contaminated.
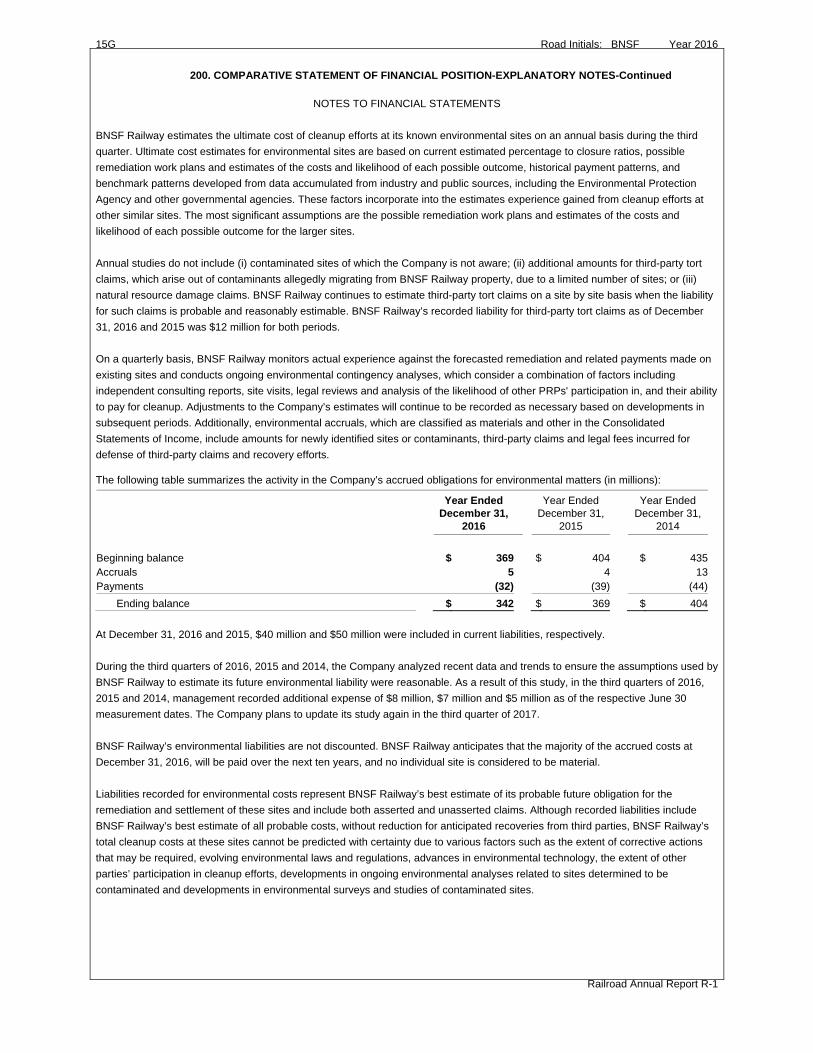
15G Road Initials: BNSF Year 2016
Railroad Annual Report R-1
200. COMPARATIVE STATEMENT OF FINANCIAL POSITION-EXPLANATORY NOTES-Continued
NOTES TO FINANCIAL STATEMENTS
BNSF Railway estimates the ultimate cost of cleanup efforts at its known environmental sites on an annual basis during the third quarter. Ultimate cost estimates for environmental sites are based on current estimated percentage to closure ratios, possible remediation work plans and estimates of the costs and likelihood of each possible outcome, historical payment patterns, and benchmark patterns developed from data accumulated from industry and public sources, including the Environmental Protection Agency and other governmental agencies. These factors incorporate into the estimates experience gained from cleanup efforts at other similar sites. The most significant assumptions are the possible remediation work plans and estimates of the costs and likelihood of each possible outcome for the larger sites. Annual studies do not include (i) contaminated sites of which the Company is not aware; (ii) additional amounts for third-party tort claims, which arise out of contaminants allegedly migrating from BNSF Railway property, due to a limited number of sites; or (iii) natural resource damage claims. BNSF Railway continues to estimate third-party tort claims on a site by site basis when the liability for such claims is probable and reasonably estimable. BNSF Railway’s recorded liability for third-party tort claims as of December 31, 2016 and 2015 was $12 million for both periods. On a quarterly basis, BNSF Railway monitors actual experience against the forecasted remediation and related payments made on existing sites and conducts ongoing environmental contingency analyses, which consider a combination of factors including independent consulting reports, site visits, legal reviews and analysis of the likelihood of other PRPs' participation in, and their ability to pay for cleanup. Adjustments to the Company’s estimates will continue to be recorded as necessary based on developments in subsequent periods. Additionally, environmental accruals, which are classified as materials and other in the Consolidated Statements of Income, include amounts for newly identified sites or contaminants, third-party claims and legal fees incurred for defense of third-party claims and recovery efforts. The following table summarizes the activity in the Company’s accrued obligations for environmental matters (in millions):
Year Ended December 31,
2016
Year Ended December 31,
2015
Year Ended December 31,
2014
Beginning balance $ 369 $ 404 $ 435Accruals 5 4 13Payments (32) (39) (44) Ending balance $ 342 $ 369 $ 404 At December 31, 2016 and 2015, $40 million and $50 million were included in current liabilities, respectively. During the third quarters of 2016, 2015 and 2014, the Company analyzed recent data and trends to ensure the assumptions used by BNSF Railway to estimate its future environmental liability were reasonable. As a result of this study, in the third quarters of 2016, 2015 and 2014, management recorded additional expense of $8 million, $7 million and $5 million as of the respective June 30 measurement dates. The Company plans to update its study again in the third quarter of 2017. BNSF Railway’s environmental liabilities are not discounted. BNSF Railway anticipates that the majority of the accrued costs at December 31, 2016, will be paid over the next ten years, and no individual site is considered to be material. Liabilities recorded for environmental costs represent BNSF Railway’s best estimate of its probable future obligation for the remediation and settlement of these sites and include both asserted and unasserted claims. Although recorded liabilities include BNSF Railway’s best estimate of all probable costs, without reduction for anticipated recoveries from third parties, BNSF Railway’s total cleanup costs at these sites cannot be predicted with certainty due to various factors such as the extent of corrective actions that may be required, evolving environmental laws and regulations, advances in environmental technology, the extent of other parties’ participation in cleanup efforts, developments in ongoing environmental analyses related to sites determined to be contaminated and developments in environmental surveys and studies of contaminated sites.
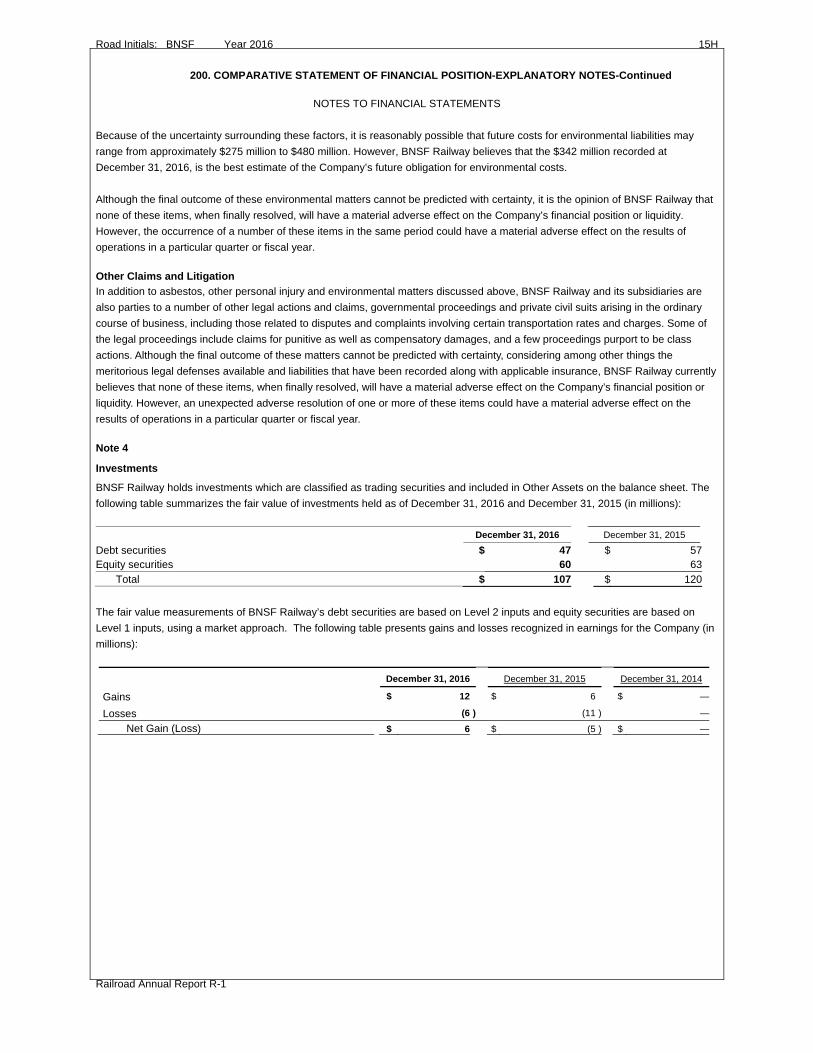
Road Initials: BNSF Year 2016 15H
Railroad Annual Report R-1
200. COMPARATIVE STATEMENT OF FINANCIAL POSITION-EXPLANATORY NOTES-Continued
NOTES TO FINANCIAL STATEMENTS
Because of the uncertainty surrounding these factors, it is reasonably possible that future costs for environmental liabilities may range from approximately $275 million to $480 million. However, BNSF Railway believes that the $342 million recorded at December 31, 2016, is the best estimate of the Company’s future obligation for environmental costs. Although the final outcome of these environmental matters cannot be predicted with certainty, it is the opinion of BNSF Railway that none of these items, when finally resolved, will have a material adverse effect on the Company’s financial position or liquidity. However, the occurrence of a number of these items in the same period could have a material adverse effect on the results of operations in a particular quarter or fiscal year.
Other Claims and Litigation In addition to asbestos, other personal injury and environmental matters discussed above, BNSF Railway and its subsidiaries are also parties to a number of other legal actions and claims, governmental proceedings and private civil suits arising in the ordinary course of business, including those related to disputes and complaints involving certain transportation rates and charges. Some of the legal proceedings include claims for punitive as well as compensatory damages, and a few proceedings purport to be class actions. Although the final outcome of these matters cannot be predicted with certainty, considering among other things the meritorious legal defenses available and liabilities that have been recorded along with applicable insurance, BNSF Railway currently believes that none of these items, when finally resolved, will have a material adverse effect on the Company’s financial position or liquidity. However, an unexpected adverse resolution of one or more of these items could have a material adverse effect on the results of operations in a particular quarter or fiscal year. Note 4
Investments
BNSF Railway holds investments which are classified as trading securities and included in Other Assets on the balance sheet. The following table summarizes the fair value of investments held as of December 31, 2016 and December 31, 2015 (in millions): December 31, 2016 December 31, 2015
Debt securities $ 47 $ 57Equity securities 60 63 Total $ 107 $ 120 The fair value measurements of BNSF Railway’s debt securities are based on Level 2 inputs and equity securities are based on Level 1 inputs, using a market approach. The following table presents gains and losses recognized in earnings for the Company (in millions):
December 31, 2016 December 31, 2015 December 31, 2014
Gains $ 12 $ 6 $ —
Losses (6 ) (11 ) —
Net Gain (Loss) $ 6 $ (5 ) $ —
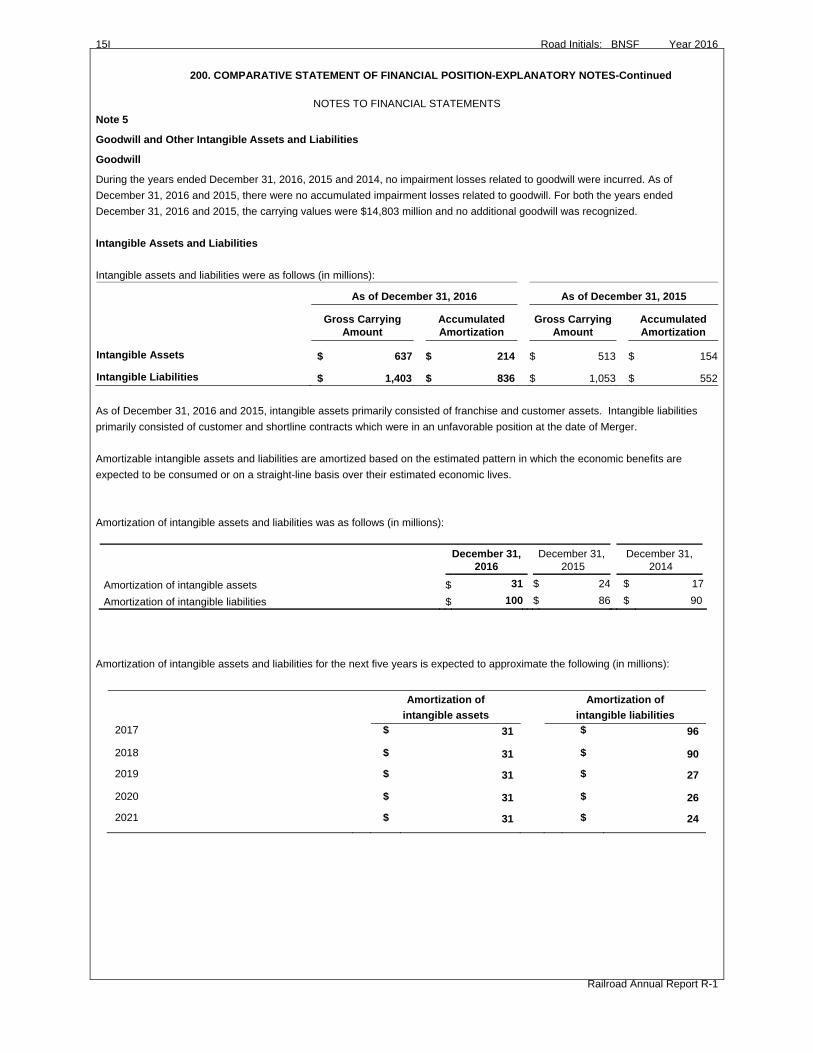
15I Road Initials: BNSF Year 2016
Railroad Annual Report R-1
200. COMPARATIVE STATEMENT OF FINANCIAL POSITION-EXPLANATORY NOTES-Continued
NOTES TO FINANCIAL STATEMENTS
Note 5
Goodwill and Other Intangible Assets and Liabilities
Goodwill
During the years ended December 31, 2016, 2015 and 2014, no impairment losses related to goodwill were incurred. As of December 31, 2016 and 2015, there were no accumulated impairment losses related to goodwill. For both the years ended December 31, 2016 and 2015, the carrying values were $14,803 million and no additional goodwill was recognized. Intangible Assets and Liabilities Intangible assets and liabilities were as follows (in millions):
As of December 31, 2016 As of December 31, 2015
Gross Carrying
Amount Accumulated Amortization
Gross Carrying Amount
Accumulated Amortization
Intangible Assets $ 637 $ 214 $ 513 $ 154
Intangible Liabilities $ 1,403 $ 836 $ 1,053 $ 552 As of December 31, 2016 and 2015, intangible assets primarily consisted of franchise and customer assets. Intangible liabilities primarily consisted of customer and shortline contracts which were in an unfavorable position at the date of Merger. Amortizable intangible assets and liabilities are amortized based on the estimated pattern in which the economic benefits are expected to be consumed or on a straight-line basis over their estimated economic lives.
Amortization of intangible assets and liabilities was as follows (in millions):
December 31,
2016 December 31,
2015 December 31,
2014
Amortization of intangible assets $ 31 $ 24 $ 17
Amortization of intangible liabilities $ 100 $ 86 $ 90
Amortization of intangible assets and liabilities for the next five years is expected to approximate the following (in millions):
Amortization of intangible assets
Amortization of intangible liabilities
2017 $ 31 $ 96
2018 $ 31 $ 90
2019 $ 31 $ 27
2020 $ 31 $ 26
2021 $ 31 $ 24

Road Initials: BNSF Year 2016 15J
Railroad Annual Report R-1
200. COMPARATIVE STATEMENT OF FINANCIAL POSITION-EXPLANATORY NOTES-Continued
NOTES TO FINANCIAL STATEMENTS
Note 6 Other Assets In July 2010, the Company entered into a low-income housing partnership (the Partnership) as the limited partner, holding a 99.9% interest in the Partnership. The Partnership is a VIE, with the purpose of developing and operating low-income housing rental properties. Recovery of the Company’s investment is accomplished through the utilization of low-income housing tax credits and the tax benefits of Partnership losses. The general partner, who holds a 0.1% interest in the Partnership, is an unrelated third party and is responsible for controlling and managing the business and financial operation of the Partnership. As the Company does not have the power to direct the activities that most significantly impact the Partnership’s economic performance, the Company is not the primary beneficiary and therefore, does not consolidate the Partnership. The Company does not provide financial support to the Partnership that it was not previously contractually obligated to provide. The Company has accounted for its investment in the Partnership using the effective yield method. The risk of loss of the Company's investment in the Partnership is considered low as an affiliate of the general partner has provided certain guarantees of tax credits and minimum annual returns. For the years ended December 31, 2016, 2015, and 2014, the Company recognized a reduction to income tax expense of $39 million, $29 million, and $35 million, respectively. The Company’s maximum exposure to loss related to the Partnership is the unamortized investment balance. The following table provides information related to this Partnership (in millions):
Year Ended December 31,
2016
Year Ended December 31,
2015
Unamortized investment balance classified as Other Assets $ 196 $ 265 Maximum exposure to loss $ 196 $ 265 Included within Other Assets are capitalized right to use fixed assets of $895 million and $838 million, and related accumulated amortization of $265 million and $245 million, for the years ended December 31, 2016 and 2015, respectively.

16 Road Initials: BNSF Year 2016210. RESULTS OF OPERATIONS
(Dollars in Thousands)1. Disclose requested information for respondent pertaining to results Cross-Checksof operations for the year. Schedule 210 Schedule 210
Line 15, col b = Line 66, col b2. Report total operating expenses from Sched. 410. Any differences Lines 47,48,49 col b = Line 67, col bbetween this schedule and Sched. 410 must be explained on page 18. Line 50, col b = Line 68, col b
3. List dividends from investments accounted for under the cost methodon line 19, and list dividends accounted for under the equity method Schedule 410on line 25. Line 14, col b = Line 620, col h
Line 14, col d = Line 620, col f4. All contra entries should be shown in parenthesis. Line 14, col e = Line 620, col g
Line Cross Item Amount for Amount for Freight-related Passenger-related LineNo. Check current year preceding year revenue & revenue & No.
expenses expenses(a) (b) (c) (d) (e)
ORDINARY ITEMSOPERATING INCOME
Railway Operating Income1 (101) Freight 19,304,902 21,366,873 19,304,902 12 (102) Passenger 23 (103) Passenger-related 34 (104) Switching 46,796 50,083 46,796 45 (105) Water transfers 56 (106) Demurrage 192,739 196,526 192,739 67 (110) Incidental 109,323 144,041 109,323 78 (121) Joint facility - credit 8,003 8,056 8,003 89 (122) Joint facility - debit 910 (501) Railway operating revenues (Exclusive of transfers 10
from government authorities-lines 1-9) 19,661,763 21,765,579 19,661,76311 (502) Railway operating revenues - transfers from 11
government authorities12 (503) Railway operating revenues - amortization of 12
deferred transfers from government authorities13 TOTAL RAILWAY OPERATING REVENUES (lines 10-12) 19,661,763 21,765,579 19,661,763 1314 * (531) Railway operating expenses 13,061,812 14,112,377 13,061,812 1415 * Net revenue from railway operations 6,599,951 7,653,202 6,599,951 15
OTHER INCOME16 (506) Revenue from property used in other than carrier 16
operations17 (510) Miscellaneous rent income 1718 (512) Separately operated properties - profit 1819 (513) Dividend income (cost method) 400 400 1920 (514) Interest income 205,311 137,028 2021 (516) Income from sinking and other funds 2122 (517) Release of premiums on funded debt 2223 (518) Reimbursements received under contracts and 23
agreements24 (519) Miscellaneous income 21,763 41,039 24
Income from affiliated companies: 51925 a. Dividends (equity method) 5,683 14,000 2526 b. Equity in undistributed earnings (losses) 10,154 2,151 2627 TOTAL OTHER INCOME (lines 16-26) 243,311 194,618 2728 TOTAL INCOME (lines 15, 27) 6,843,262 7,847,820 28
MISCELLANEOUS DEDUCTIONS FROM INCOME29 (534) Expenses of property used in other than carrier 29
operations30 (544) Miscellaneous taxes 3031 (545) Separately operated properties-Loss 3132 (549) Maintenance of investment organization 3233 (550) Income transferred under contracts and agreements 3334 (551) Miscellaneous income charges 16,166 26,694 3435 (553) Uncollectible accounts 3536 TOTAL MISCELLANEOUS DEDUCTIONS 16,166 26,694 3637 Income available for fixed charges 6,827,096 7,821,126 37
Railroad Annual Report R-1

Road Initials: BNSF Year 2016 17210. RESULTS OF OPERATIONS - Continued
(Dollars in Thousands)
Line Cross Item Amount for Amount for LineNo. Check (a) current year preceding year No.
(b) (c)FIXED CHARGES
(546) Interest on funded debt:38 (a) Fixed interest not in default 39,891 37,407 3839 (b) Interest in default 3940 (547) Interest on unfunded debt 7,494 1,520 4041 (548) Amortization of discount on funded debt 2,172 2,192 4142 TOTAL FIXED CHARGES (lines 38 through 41) 49,557 41,119 4243 Income after fixed charges (line 37 minus line 42) 6,777,539 7,780,007 43
OTHER DEDUCTIONS(546) Interest on funded debt:
44 (c) Contingent interest 44UNUSUAL OR INFREQUENT ITEMS
45 (555) Unusual or infrequent items (debit) credit 4546 Income (Loss) from continuing operations (before inc. taxes) 6,777,539 7,780,007 46
PROVISIONS FOR INCOME TAXES(556) Income taxes on ordinary income:
47 * (a) Federal income taxes 1,360,221 1,578,619 4748 * (b) State income taxes 171,921 210,215 4849 * (c) Other income taxes 567 4950 * (557) Provision for deferred taxes 985,717 1,115,003 5051 TOTAL PROVISION FOR INCOME TAXES (lines 47 through 52) 2,518,426 2,903,837 5152 Income from continuing operations (line 46 minus line 51) 4,259,113 4,876,170 52
DISCONTINUED OPERATIONS53 (560) Income or loss from operations of discontinued segments (less applicable income 53
taxes of $ )54 (562) Gain or loss on disposal of discontinued segments (less applicable income taxes 54
of $ )55 Income before extraordinary items (lines 52 through 54) 4,259,113 4,876,170 55
EXTRAORDINARY ITEMS AND ACCOUNTING CHANGES56 (570) Extraordinary items (Net) 5657 (590) Income taxes on extraordinary items 5758 (591) Provision for deferred taxes - Extraordinary items 5859 TOTAL EXTRAORDINARY ITEMS (lines 56 through 58) 5960 (592) Cumulative effect of changes in accounting principles (less applicable income 60
taxes of $ )61 * Net income (Loss) (lines 55 + 59 + 60) 4,259,113 4,876,170 6162 Less: Net Income attributable to noncontrolling interest 6263 Net Income attributable to reporting railroad 6364 Basic Earnings per Share 6465 Diluted Earnings per Share 65
RECONCILIATION OF NET RAILWAY OPERATING INCOME (NROI)66 * Net revenues from railway operations 6,599,951 7,653,202 6667 * (556) Income taxes on ordinary income (-) 1,532,709 1,788,834 6768 * (557) Provision for deferred income taxes (-) 985,717 1,115,003 6869 Income from lease of road and equipment (-) 12,848 12,848 6970 Rent for leased roads and equipment (+) 7071 Net railway operating income (loss) 4,068,677 4,736,517 71
Railroad Annual Report R-1
18 Road Initials: BNSF Year 2016
Railroad Annual Report R-1
NOTES AND REMARKS FOR SCHEDULE 210 AND 220
THIS PAGE INTENTIONALLY LEFT BLANK
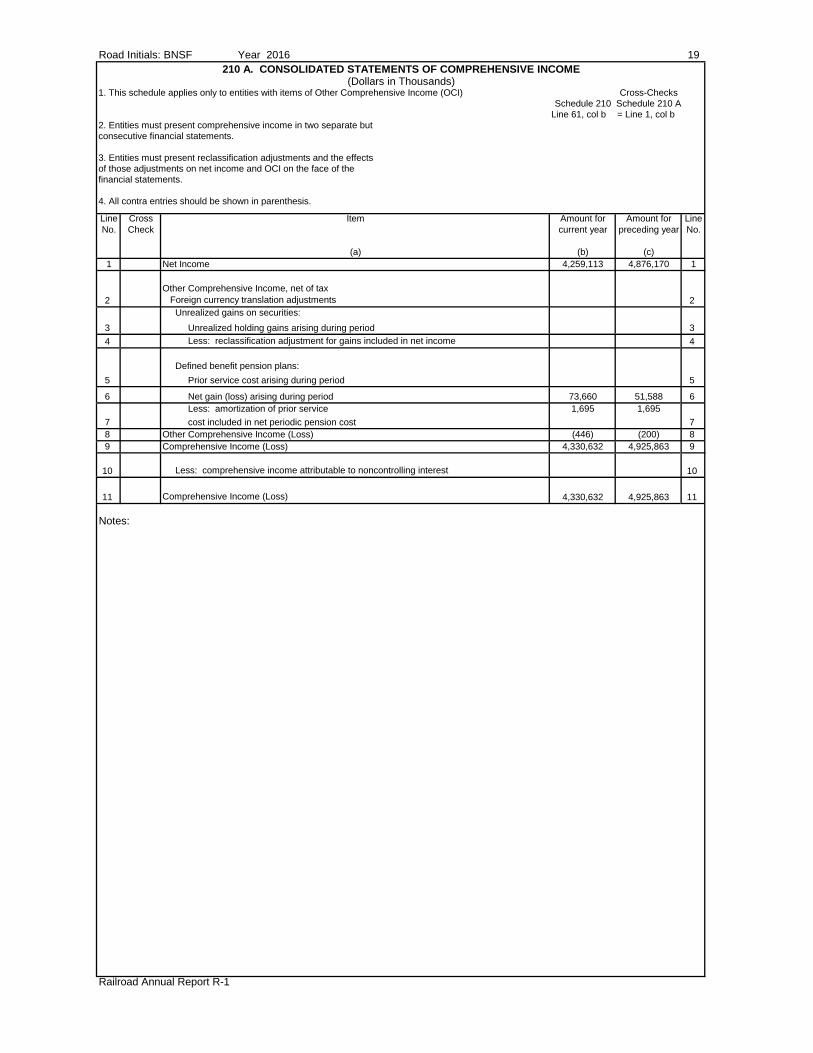
Road Initials: BNSF Year 2016 19210 A. CONSOLIDATED STATEMENTS OF COMPREHENSIVE INCOME
(Dollars in Thousands)1. This schedule applies only to entities with items of Other Comprehensive Income (OCI) Cross-Checks
Schedule 210 Schedule 210 ALine 61, col b = Line 1, col b
2. Entities must present comprehensive income in two separate but consecutive financial statements.
3. Entities must present reclassification adjustments and the effectsof those adjustments on net income and OCI on the face of thefinancial statements.
4. All contra entries should be shown in parenthesis.
Line Cross Item Amount for Amount for LineNo. Check current year preceding year No.
(a) (b) (c)1 Net Income 4,259,113 4,876,170 1
Other Comprehensive Income, net of tax2 Foreign currency translation adjustments 2
Unrealized gains on securities:3 Unrealized holding gains arising during period 34 Less: reclassification adjustment for gains included in net income 4
Defined benefit pension plans:5 Prior service cost arising during period 5
6 Net gain (loss) arising during period 73,660 51,588 6 Less: amortization of prior service 1,695 1,695
7 cost included in net periodic pension cost 78 Other Comprehensive Income (Loss) (446) (200) 89 Comprehensive Income (Loss) 4,330,632 4,925,863 9
10 Less: comprehensive income attributable to noncontrolling interest 10
11 Comprehensive Income (Loss) 4,330,632 4,925,863 11
Notes:
Railroad Annual Report R-1
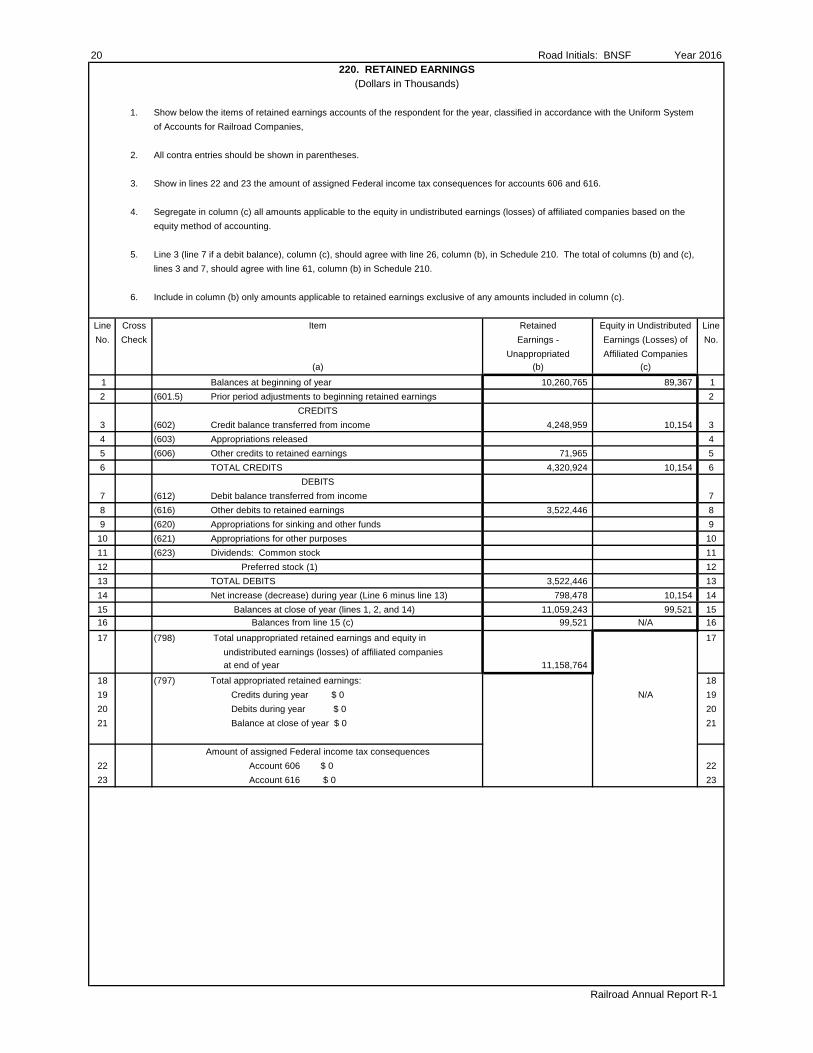
20 Road Initials: BNSF Year 2016220. RETAINED EARNINGS
(Dollars in Thousands)
1. Show below the items of retained earnings accounts of the respondent for the year, classified in accordance with the Uniform Systemof Accounts for Railroad Companies,
2. All contra entries should be shown in parentheses.
3. Show in lines 22 and 23 the amount of assigned Federal income tax consequences for accounts 606 and 616.
4. Segregate in column (c) all amounts applicable to the equity in undistributed earnings (losses) of affiliated companies based on theequity method of accounting.
5. Line 3 (line 7 if a debit balance), column (c), should agree with line 26, column (b), in Schedule 210. The total of columns (b) and (c),lines 3 and 7, should agree with line 61, column (b) in Schedule 210.
6. Include in column (b) only amounts applicable to retained earnings exclusive of any amounts included in column (c).
Line Cross Item Retained Equity in Undistributed LineNo. Check Earnings - Earnings (Losses) of No.
Unappropriated Affiliated Companies(a) (b) (c)
1 Balances at beginning of year 10,260,765 89,367 12 (601.5) Prior period adjustments to beginning retained earnings 2
CREDITS3 (602) Credit balance transferred from income 4,248,959 10,154 34 (603) Appropriations released 45 (606) Other credits to retained earnings 71,965 56 TOTAL CREDITS 4,320,924 10,154 6
DEBITS7 (612) Debit balance transferred from income 78 (616) Other debits to retained earnings 3,522,446 89 (620) Appropriations for sinking and other funds 9
10 (621) Appropriations for other purposes 1011 (623) Dividends: Common stock 1112 Preferred stock (1) 1213 TOTAL DEBITS 3,522,446 1314 Net increase (decrease) during year (Line 6 minus line 13) 798,478 10,154 1415 Balances at close of year (lines 1, 2, and 14) 11,059,243 99,521 1516 Balances from line 15 (c) 99,521 N/A 16
17 (798) Total unappropriated retained earnings and equity in 17 undistributed earnings (losses) of affiliated companies at end of year 11,158,764
18 (797) Total appropriated retained earnings: 1819 Credits during year $ 0 N/A 1920 Debits during year $ 0 2021 Balance at close of year $ 0 21
Amount of assigned Federal income tax consequences22 Account 606 $ 0 2223 Account 616 $ 0 23
Railroad Annual Report R-1

Road Initials: BNSF Year 2016 21240. STATEMENT OF CASH FLOWS
(Dollars in Thousands)
Give the information as requested concerning the cash flows during the year. Either the direct or indirect method can be used. The directmethod shows as its principal components operating cash receipts and payments, such as cash received from customers and cash paid tosuppliers and employees, the sum of which is net cash flow from operating activities. The indirect method starts with net income and adjusts it for revenues and expense items that were not the result of operating cash transactions in the current period to reconcile it to net cash flow fromoperating activities If the direct method is used, complete lines 1 through 41. If the indirect method is used complete lines 10 through 41. Cash, for the purpose of this schedule, shall include cash and cash equivalents which are short-term, highly liquid investments readily convertible toknown amounts of cash and so near their maturity that they present insignificant risk of changes in value because of changes in interest rates. Information about all investing and finance activities which do not directly affect cash shall be separately disclosed in footnotes to this schedule. They shall clearly relate the cash (if any) and noncash aspects of transactions. Examples of noncash investing and transactions includeconverting debt to equity, acquiring assets by assuming directly related liabilities, such as purchasing a building by incurring a mortgage to the seller; obtaining an asset by entering into a capital lease; and exchanging noncash assets or liabilities for other noncash assets or liabilities. Some transactions are part cash and part noncash; only the cash portion shall be reported directly in the statement of cash flows. Refer to FAS Statement No. 95, Statement of Cash Flows, for further details.
CASH FLOWS FROM OPERATING ACTIVITIESLine Cross Description Current Year Previous Year LineNo. Check (a) (b) (c) No.1 Cash received from operating revenues 12 Dividends received from affiliates 23 Interest received 34 Other income 45 Cash paid for operating expenses 56 Interest paid (net of amounts capitalized) 67 Income taxes paid 78 Other - net 89 NET CASH PROVIDED BY OPERATING ACTIVITIES (lines 1 through 8) 0 0 9
RECONCILIATION OF NET INCOME TO NET CASH PROVIDED BY OPERATING ACTIVITIES
Line Cross Description Current Year Previous Year LineNo. Check (a) (b) (c) No.10 Income from continuing operations 4,259,113 4,876,170 10
ADJUSTMENTS TO RECONCILE INCOME FROM CONTINUING OPERATIONS TO NET CASH PROVIDED BY OPERATING ACTIVITIES
Line Cross Description Current Year Previous Year LineNo. Check (a) (b) (c) No.11 Loss (gain) on sale or disposal of tangible property and investments (19,743) (53,207) 1112 Depreciation and amortization expenses 2,042,286 1,921,974 1213 Net increase (decrease) in provision for Deferred Income Taxes 985,717 1,115,003 1314 Net decrease (increase) in undistributed earnings (losses) of affiliates (10,154) (2,151) 1415 Decrease (increase) in accounts receivable (200,818) 120,696 1516 Decrease (increase) in material and supplies and other current assets (124,028) (35,556) 1617 Increase (decrease) in current liabilities other than debt 573,663 (89,179) 1718 Increase (decrease) in other - net 52,699 20,249 1819 Net cash provided from continuing operations (lines 10 through 18) 7,558,735 7,873,999 1920 Add (Subtract) cash generated (paid) by reason of discontinued 20
operations and extraordinary items21 NET CASH PROVIDED FROM OPERATING ACTIVITIES (lines 19 and 20) 7,558,735 7,873,999 21
CASH FLOWS FROM INVESTING ACTIVITIES
Line Cross Description Current Year Previous Year LineNo. Check (a) (b) (c) No.22 Proceeds from sale of property 20,846 58,163 2223 Capital expenditures (3,758,199) (5,512,473) 2324 Net change in temporary cash investments not qualifying as cash 24
equivalents25 Proceeds from sale/repayment of investment and advances 26,744 26,568 2526 Purchase price of long-term investment and advances (7,830) (150,504) 2627 Net decrease (increase) in sinking and other special funds 2728 Other - net (195,672) (58,599) 2829 NET CASH USED IN INVESTING ACTIVITIES (lines 22 through 28) (3,914,111) (5,636,845) 29
Railroad Annual Report R-1
(Continued on next page)

22 Road Initials: BNSF Year 2016240. STATEMENT OF CASH FLOWS (Concluded)
(Dollars in Thousands)
CASH FLOWS FROM FINANCING ACTIVITIES
Line Cross Description Current Year Previous Year LineNo. Check (a) (b) (c) No.30 Proceeds from issuance of long-term debt 0 500,207 3031 Principal payments of long-term debt (117,132) (120,922) 3132 Proceeds from issuance of capital stock 3233 Purchase price of acquiring treasury stock 3334 Cash dividends paid 3435 Other - net (3,522,000) (2,636,349) 3536 NET CASH FROM FINANCING ACTIVITIES (lines 30 through 35) (3,639,132) (2,257,064) 3637 NET INCREASE (DECREASE) IN CASH AND CASH EQUIVALENTS 37
(lines 21, 29, and 36) 5,492 (19,910)38 Cash and cash equivalents at beginning of the year 564,856 584,766 3839 CASH AND CASH EQUIVALENTS AT END OF THE YEAR (lines 37 & 38) 570,348 564,856 39
Footnotes to ScheduleCash paid during the year for:
40 Interest (net of amount capitalized) * 60,370 52,216 4041 Income taxes (net) * 1,020,289 1,447,083 41
* Only applies if indirect method is adopted
NOTES AND REMARKS
Railroad Annual Report R-1

Road Initials: BNSF Year 2016 23245. WORKING CAPITAL
(Dollars in Thousands)
1 This schedule should include only data pertaining to railway transportation services.
2 Carry out calculations of lines 9, 10, 20, and 21 to the nearest whole number.
Line Item Source Amount LineNo. (a) (b) No.
CURRENT OPERATING ASSETS1 Interline and other balances (705) Sched. 200, line 5, col. b 90,639 12 Customers (706) Sched. 200, line 6, col. b 847,346 23 Other (707) Note A 111,355 34 TOTAL CURRENT OPERATING ASSETS Lines 1 + 2 + 3 1,049,340 4
OPERATING REVENUE5 Railway operating revenue Sched. 210, line 13, col. b 19,661,763 56 Rent income Note B 192,186 67 TOTAL OPERATING REVENUES Lines 5 + 6 19,853,949 78 Average daily operating revenues Line 7 ÷ 360 days 55,150 89 Days of operating revenue in current 9
operating assets Line 4 ÷ line 8 1910 Revenue delay days plus buffer Line 9 + 15 days 34 10
CURRENT OPERATING LIABILITIES11 Interline and other balances (752) Sched. 200, line 30, col. b 120,090 1112 Audited accounts and wages payable (753) Note A 235,507 1213 Accounts payable - other (754) Note A 326,612 1314 Other taxes accrued (761.5) Note A 353,468 1415 TOTAL CURRENT OPERATING LIABILITIES Sum of lines 11 through 14 1,035,677 15
OPERATING EXPENSES16 Railway operating expenses Sched. 210, line 14, col. b 13,061,812 1617 Depreciation Sched 410, lines 136, 137, 138, 213, 232, 317 col h 2,042,286 1718 Cash related operating expenses Line 16 + line 6 - line 17 11,211,712 1819 Average daily expenditures Line 18 ÷ 360 days 31,144 1920 Days of operating expenses in current 20
operating liabilities Line 15 ÷ line 19 3321 Days of working capital required Line 10 - line 20 (Note C) 1 2122 Cash working capital required Line 21 x line 19 31,144 2223 Cash and temporary cash balance Sched. 200, line 1 + line 2, col. b 570,348 2324 Cash working capital allowed Lesser of line 22 or line 23 31,144 24
MATERIALS AND SUPPLIES25 Total materials and supplies (712) Note A 825,018 2526 Scrap and obsolete material included in account 712 Note A 2627 Materials and supplies held for common carrier 27
purposes Line 25 - line 26 825,01828 TOTAL WORKING CAPITAL Line 24 + line 27 856,162 28
NOTES:
(A) Use common carrier portion only. Common carrier refers to railway transportation service
(B) Rent income is the sum of Schedule 410, column h, lines 121, 122, 123, 127, 128, 129, 133, 134, 135, 208, 210, 212, 227, 229, 231, 312, 314, and 316. Rent income is added to railway operating revenues to produce total revenues. Rent income is also added to total operatingexpenses to exclude the rent revenue items from operating expense.
(C) If result is negative, use zero.
Railroad Annual Report R-1

24 Road Initials: BNSF Year: 2016
NOTES AND REMARKS
Railroad Annual Report R-1
THIS PAGE INTENTIONALLY LEFT BLANK
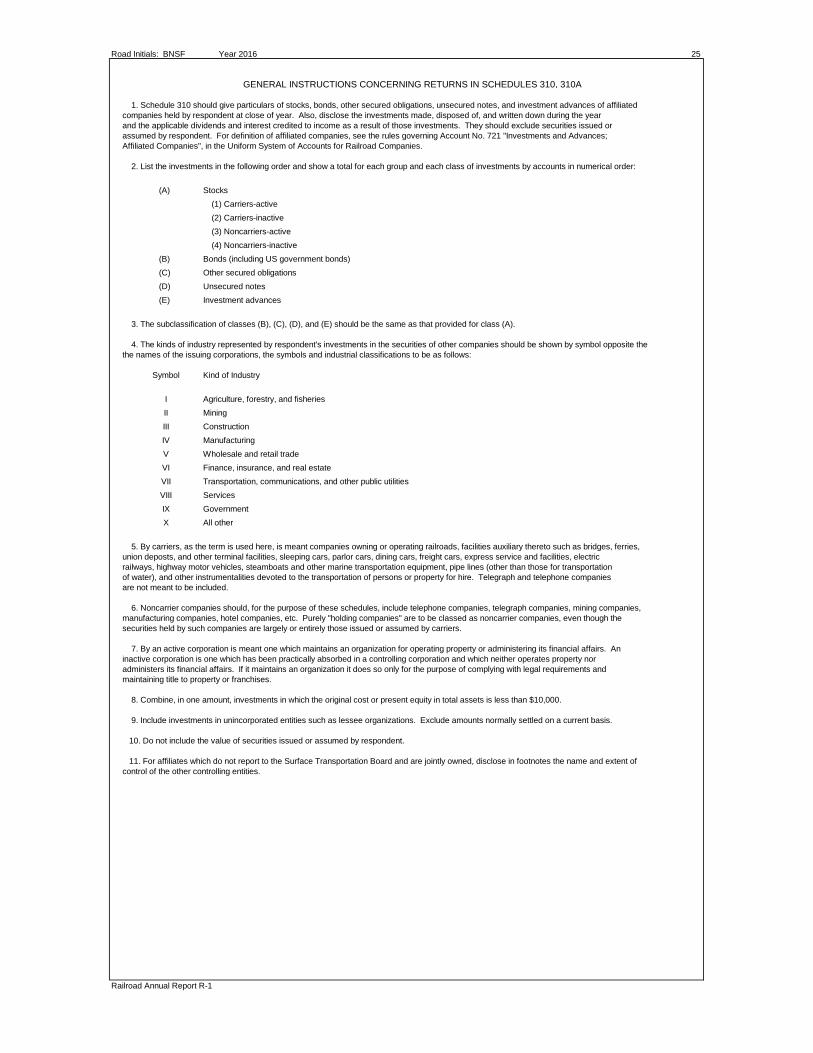
Road Initials: BNSF Year 2016 25
GENERAL INSTRUCTIONS CONCERNING RETURNS IN SCHEDULES 310, 310A
1. Schedule 310 should give particulars of stocks, bonds, other secured obligations, unsecured notes, and investment advances of affiliatedcompanies held by respondent at close of year. Also, disclose the investments made, disposed of, and written down during the year and the applicable dividends and interest credited to income as a result of those investments. They should exclude securities issued or assumed by respondent. For definition of affiliated companies, see the rules governing Account No. 721 "Investments and Advances;Affiliated Companies", in the Uniform System of Accounts for Railroad Companies.
2. List the investments in the following order and show a total for each group and each class of investments by accounts in numerical order:
(A) Stocks(1) Carriers-active(2) Carriers-inactive(3) Noncarriers-active(4) Noncarriers-inactive
(B) Bonds (including US government bonds)(C) Other secured obligations(D) Unsecured notes(E) Investment advances
3. The subclassification of classes (B), (C), (D), and (E) should be the same as that provided for class (A).
4. The kinds of industry represented by respondent's investments in the securities of other companies should be shown by symbol opposite the the names of the issuing corporations, the symbols and industrial classifications to be as follows:
Symbol Kind of Industry
I Agriculture, forestry, and fisheriesII MiningIII ConstructionIV ManufacturingV Wholesale and retail tradeVI Finance, insurance, and real estateVII Transportation, communications, and other public utilitiesVIII ServicesIX GovernmentX All other
5. By carriers, as the term is used here, is meant companies owning or operating railroads, facilities auxiliary thereto such as bridges, ferries, union deposts, and other terminal facilities, sleeping cars, parlor cars, dining cars, freight cars, express service and facilities, electric railways, highway motor vehicles, steamboats and other marine transportation equipment, pipe lines (other than those for transportation of water), and other instrumentalities devoted to the transportation of persons or property for hire. Telegraph and telephone companies are not meant to be included.
6. Noncarrier companies should, for the purpose of these schedules, include telephone companies, telegraph companies, mining companies,manufacturing companies, hotel companies, etc. Purely "holding companies" are to be classed as noncarrier companies, even though the securities held by such companies are largely or entirely those issued or assumed by carriers.
7. By an active corporation is meant one which maintains an organization for operating property or administering its financial affairs. An inactive corporation is one which has been practically absorbed in a controlling corporation and which neither operates property nor administers its financial affairs. If it maintains an organization it does so only for the purpose of complying with legal requirements and maintaining title to property or franchises.
8. Combine, in one amount, investments in which the original cost or present equity in total assets is less than $10,000.
9. Include investments in unincorporated entities such as lessee organizations. Exclude amounts normally settled on a current basis.
10. Do not include the value of securities issued or assumed by respondent.
11. For affiliates which do not report to the Surface Transportation Board and are jointly owned, disclose in footnotes the name and extent ofcontrol of the other controlling entities.
Railroad Annual Report R-1
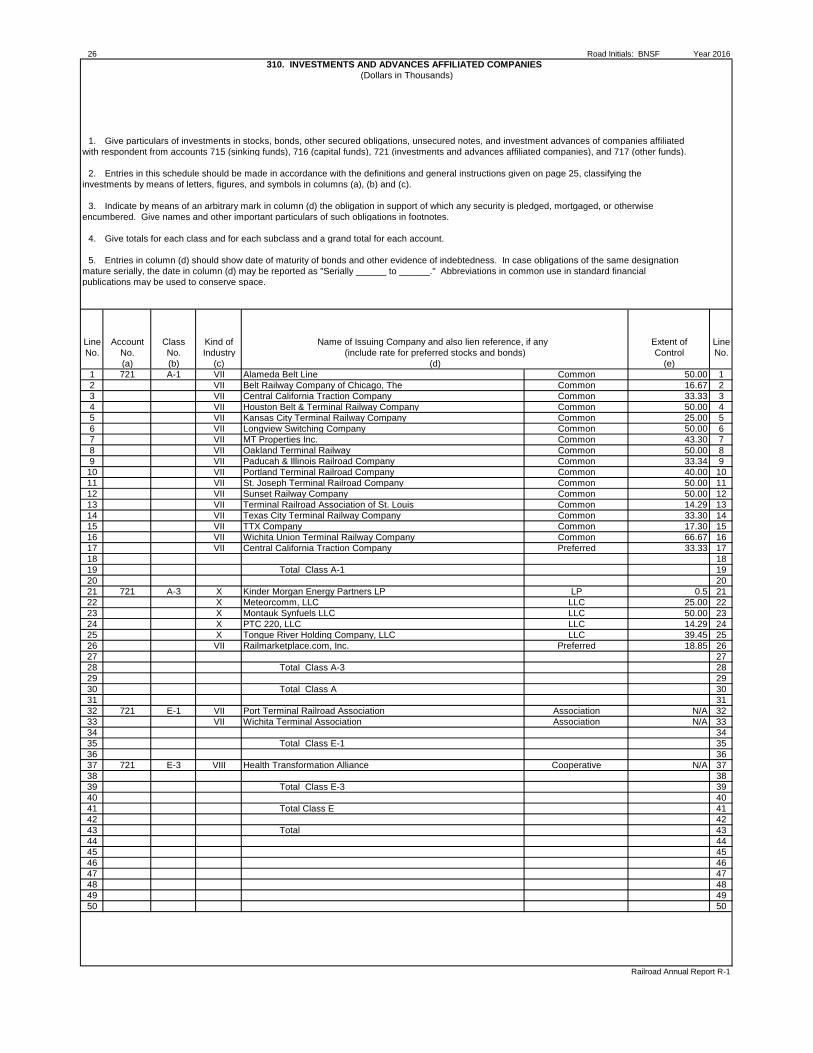
26 Road Initials: BNSF Year 2016310. INVESTMENTS AND ADVANCES AFFILIATED COMPANIES
(Dollars in Thousands)
1. Give particulars of investments in stocks, bonds, other secured obligations, unsecured notes, and investment advances of companies affiliatedwith respondent from accounts 715 (sinking funds), 716 (capital funds), 721 (investments and advances affiliated companies), and 717 (other funds).
2. Entries in this schedule should be made in accordance with the definitions and general instructions given on page 25, classifying theinvestments by means of letters, figures, and symbols in columns (a), (b) and (c).
3. Indicate by means of an arbitrary mark in column (d) the obligation in support of which any security is pledged, mortgaged, or otherwiseencumbered. Give names and other important particulars of such obligations in footnotes.
4. Give totals for each class and for each subclass and a grand total for each account.
5. Entries in column (d) should show date of maturity of bonds and other evidence of indebtedness. In case obligations of the same designationmature serially, the date in column (d) may be reported as "Serially ______ to ______." Abbreviations in common use in standard financial publications may be used to conserve space.
Line Account Class Kind of Extent of LineNo. No. No. Industry Control No.
(a) (b) (c) (e)1 721 A-1 VII Alameda Belt Line Common 50.00 12 VII Belt Railway Company of Chicago, The Common 16.67 23 VII Central California Traction Company Common 33.33 34 VII Houston Belt & Terminal Railway Company Common 50.00 45 VII Kansas City Terminal Railway Company Common 25.00 56 VII Longview Switching Company Common 50.00 67 VII MT Properties Inc. Common 43.30 78 VII Oakland Terminal Railway Common 50.00 89 VII Paducah & Illinois Railroad Company Common 33.34 9
10 VII Portland Terminal Railroad Company Common 40.00 1011 VII St. Joseph Terminal Railroad Company Common 50.00 1112 VII Sunset Railway Company Common 50.00 1213 VII Terminal Railroad Association of St. Louis Common 14.29 1314 VII Texas City Terminal Railway Company Common 33.30 1415 VII TTX Company Common 17.30 1516 VII Wichita Union Terminal Railway Company Common 66.67 1617 VII Central California Traction Company Preferred 33.33 1718 1819 Total Class A-1 1920 2021 721 A-3 X Kinder Morgan Energy Partners LP LP 0.5 2122 X Meteorcomm, LLC LLC 25.00 2223 X Montauk Synfuels LLC LLC 50.00 2324 X PTC 220, LLC LLC 14.29 2425 X Tongue River Holding Company, LLC LLC 39.45 2526 VII Railmarketplace.com, Inc. Preferred 18.85 2627 2728 Total Class A-3 2829 2930 Total Class A 3031 3132 721 E-1 VII Port Terminal Railroad Association Association N/A 3233 VII Wichita Terminal Association Association N/A 3334 3435 Total Class E-1 3536 3637 721 E-3 VIII Health Transformation Alliance Cooperative N/A 3738 3839 Total Class E-3 3940 4041 Total Class E 4142 4243 Total 4344 4445 4546 4647 4748 4849 4950 50
Railroad Annual Report R-1
Name of Issuing Company and also lien reference, if any (include rate for preferred stocks and bonds)
(d)
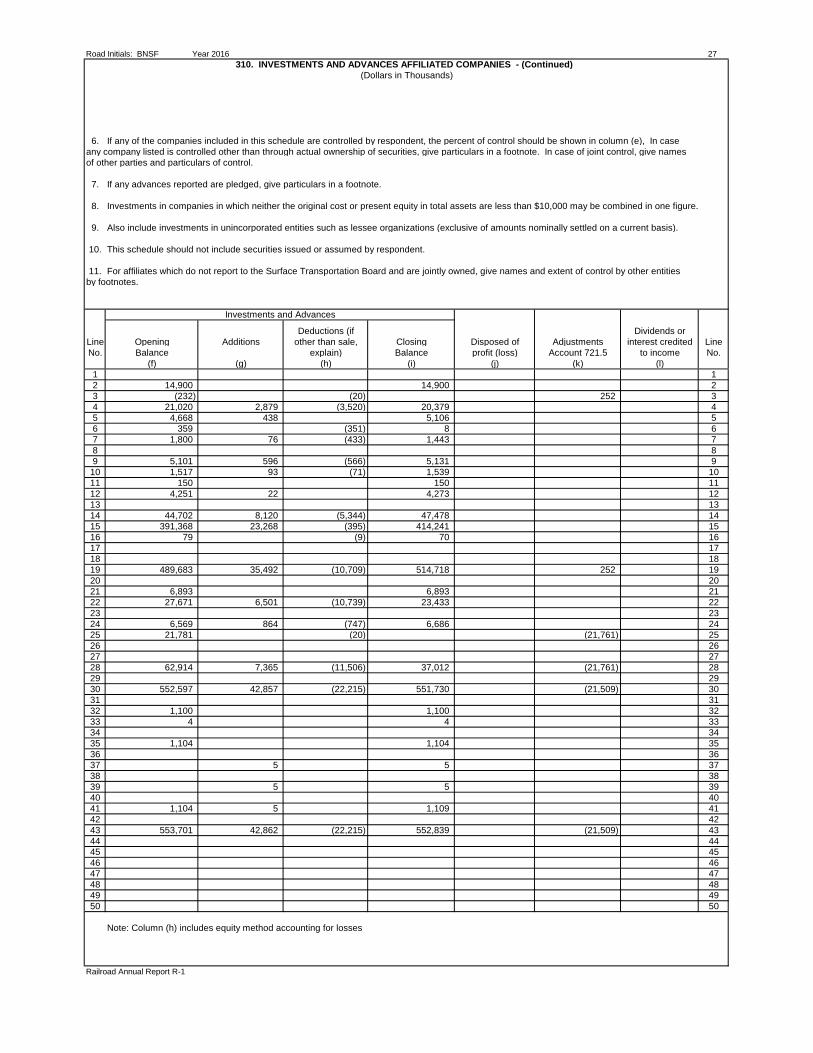
Road Initials: BNSF Year 2016 27310. INVESTMENTS AND ADVANCES AFFILIATED COMPANIES - (Continued)
(Dollars in Thousands)
6. If any of the companies included in this schedule are controlled by respondent, the percent of control should be shown in column (e), In caseany company listed is controlled other than through actual ownership of securities, give particulars in a footnote. In case of joint control, give names of other parties and particulars of control.
7. If any advances reported are pledged, give particulars in a footnote.
8. Investments in companies in which neither the original cost or present equity in total assets are less than $10,000 may be combined in one figure.
9. Also include investments in unincorporated entities such as lessee organizations (exclusive of amounts nominally settled on a current basis).
10. This schedule should not include securities issued or assumed by respondent.
11. For affiliates which do not report to the Surface Transportation Board and are jointly owned, give names and extent of control by other entitiesby footnotes.
Investments and Advances
Deductions (if Dividends orLine Opening Additions other than sale, Closing Disposed of Adjustments interest credited LineNo. Balance explain) Balance profit (loss) Account 721.5 to income No.
(f) (g) (h) (i) (j) (k) (l)1 12 14,900 14,900 23 (232) (20) 252 34 21,020 2,879 (3,520) 20,379 45 4,668 438 5,106 56 359 (351) 8 67 1,800 76 (433) 1,443 78 89 5,101 596 (566) 5,131 9
10 1,517 93 (71) 1,539 1011 150 150 1112 4,251 22 4,273 1213 1314 44,702 8,120 (5,344) 47,478 1415 391,368 23,268 (395) 414,241 1516 79 (9) 70 1617 1718 1819 489,683 35,492 (10,709) 514,718 252 1920 2021 6,893 6,893 2122 27,671 6,501 (10,739) 23,433 2223 2324 6,569 864 (747) 6,686 2425 21,781 (20) (21,761) 2526 2627 2728 62,914 7,365 (11,506) 37,012 (21,761) 2829 2930 552,597 42,857 (22,215) 551,730 (21,509) 3031 3132 1,100 1,100 3233 4 4 3334 3435 1,104 1,104 3536 3637 5 5 3738 3839 5 5 3940 4041 1,104 5 1,109 4142 4243 553,701 42,862 (22,215) 552,839 (21,509) 4344 4445 4546 4647 4748 4849 4950 50
Railroad Annual Report R-1
Note: Column (h) includes equity method accounting for losses

28 Road Initials: BNSF Year 2016
310. NOTES AND REMARKS
% Ownership
1 ALAMEDA BELT LINE BNSF Railway Company 50.00 Union Pacific Railroad Company 50.00
100.00
2 BELT RAILWAY COMPANY OF CHICAGO, THE CSX Transportation, Inc. 25.00 Norfolk Southern Company 25.00 BNSF Railway Company 16.67 Grand Trunk Western Railroad Illinois Central Railroad Company 16.67 Soo Line Railroad Company 8.33 Union Pacific Railroad Company 8.33
100.005,198 shares are held by U.S. Bank, N.A., Trustee, as collateral under the BNI ConsolidatedMortgage.
3 & 17 CENTRAL CALIFORNIA TRACTION COMPANY Union Pacific Railroad Company 66.67 BNSF Railway Company 33.33
100.00
4 HOUSTON BELT & TERMINAL RAILWAY COMPANY BNSF Railway Company 50.00 Union Pacific Railroad Company 50.00
100.00121 shares are held by U.S. Bank, N.A., Trustee, as collateral under the BNI ConsolidatedMortgage.
5 KANSAS CITY TERMINAL RAILWAY COMPANY Union Pacific Railroad Company 41.67 BNSF Railway Company 25.00 Kansas City Southern Railway Company 16.67 Dakota, Minnesota and Eastern Railroad 8.33 Norfolk Southern Railway Company 8.33
100.005,485 shares are held by UMB of Kansas City, Missouri, Trustee, under Stock Trust Agreement datedJune 12, 1909, and 5 shares are held by U.S. Bank, N.A., Trustee, as collateral under the BNIConsolidated Mortgage.
6 LONGVIEW SWITCHING COMPANY BNSF Railway Company 50.00 Union Pacific Railroad Company 50.00
100.00
7 MT PROPERTIES INC. BNSF Railway Company 43.30 Union Pacific Railroad Company 42.09 Soo Line Railroad Company 14.61
100.0030,498 shares are subject to the liens of the BNI Consolidated Mortgage and the NP General Lien Mortgage and held as collateral by U.S. Bank, N.A., Trustee.
8 OAKLAND TERMINAL RAILWAY BNSF Railway Company 50.00 Union Pacific Railroad Company 50.00
100.00
9 PADUCAH & ILLINOIS RAILROAD COMPANY BNSF Railway Company 33.34 Paducah & Louisville Railroad Company 33.33 Canadian National Railroad Company 33.33
100.0033 1/3 shares are held by U.S. Bank, N.A., Trustee, as collateral under the BNI ConsolidatedMortgage.
Railroad Annual Report R-1

Road Initials: BNSF Year 2016 29
310. NOTES AND REMARKS
% Ownership10 PORTLAND TERMINAL RAILROAD COMPANY
Union Pacific Railroad Company 60.00 BNSF Railway Company 40.00
100.00
11 ST JOSEPH TERMINAL RAILROAD COMPANY BNSF Railway Company 50.00 Union Pacific Railroad Company 50.00
100.00
12 SUNSET RAILWAY COMPANY BNSF Railway Company 50.00 Union Pacific Railroad Company 50.00
100.00
13 TERMINAL RAILROAD ASSOCIATION OF ST. LOUIS Union Pacific Railroad Company 42.84 CSX Transportation, Inc. 14.29 Illinois Central Railroad Company 14.29 BNSF Railway Company 14.29 Norfolk Southern Railway Company 14.29
100.002,058 shares are held by U.S. Bank, N.A., Trustee, as collateral under the BNI ConsolidatedMortgage.
14 TEXAS CITY TERMINAL RAILWAY COMPANY Union Pacific Railroad Company 66.60 BNSF Railway Company 33.30 Texas City Terminal Railway Company 0.10
100.00
15 TTX COMPANY Union Pacific Railroad Company 36.79 CSX Transportation, Inc. 19.65 Norfolk Southern Railway Company 19.65 BNSF Railway Company 17.30 Canadian National Railway Company 3.15 Canadian Pacific Limited 1.57 Pan Am Railways 0.63 Kansas City Southern Railway Company 0.63 FXE Railroad 0.63
100.00250 voting shares are held by TTX Company
16 WICHITA UNION TERMINAL RAILWAY COMPANY BNSF Railway Company 66.67 Union Pacific Railroad Company 33.33
100.0021 KINDER MORGAN ENERGY PARTNERS L.P.
BNSF Railway Company 0.50 Various 99.50
100.00
22 Meteorcomm, LLC BNSF Communications, Inc. (BNSF Railway Company) 25.00 Ekanet, Inc. (Union Pacific Railroad Company) 25.00 CSX Transportation, Inc. 25.00 NS Spectrum Corporation (Norfolk Southern Company) 25.00
100.00
23 MONTAUK SYNFUELS, LLC BNSF Railway Company 50.00 Montauk Energy Capital, Inc. 50.00
100.00
Railroad Annual Report R-1

29A Road Initials: BNSF Year 2016
310. NOTES AND REMARKS
% Ownership
24 PTC 220, LLC BNSF Spectrum, Inc. (BNSF Railway Company) 14.29 Ekanet, Inc. (Union Pacific Railroad Company) 14.28 CSX Intellectual Properties Corp. (CSX Transportation, Inc.) 14.29 NS Spectrum Corporation (Norfolk Southern Company) 14.28 GTC Spectrum(Canadian National Railway Company) 14.29 Canadian Pacific Railway Company 14.28 KSC Spectrum (Kansas City Southern Railway Company) 14.29
100.00
25 TONGUE RIVER HOLDING COMPANY, LLC BNSF Railway Company 39.45 Arch Coal, Inc. 38.17 TRR Financing, LLC 22.38
100.00
26 RAILMARKETPLACE.COM, INC. BNSF Railway Company 18.85 Canadian National Railway Company 18.85 Canadian Pacific Railway Company 18.85 CSX Transportation, Inc. 18.85 Union Pacific Railroad Company 18.85 GE Information Services, Inc. 5.75
100.00
Railroad Annual Report R-1
Road Initials: BNSF Year 2016 29B
THIS PAGE INTENTIONALLY LEFT BLANK
Railroad Annual Report R-1
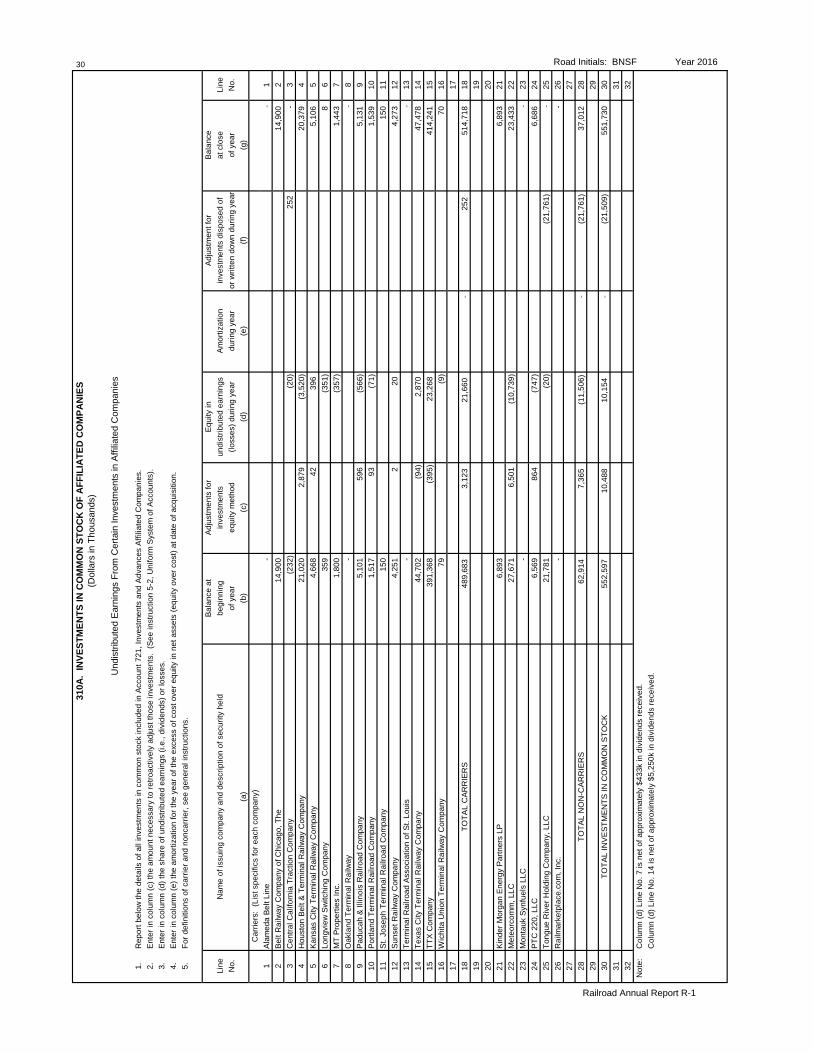
310A
. IN
VEST
MEN
TS IN
CO
MM
ON
STO
CK
OF
AFF
ILIA
TED
CO
MPA
NIE
S30
(Dol
lars
in T
hous
ands
)
Und
istri
bute
d E
arni
ngs
From
Cer
tain
Inve
stm
ents
in A
ffilia
ted
Com
pani
es
1.R
epor
t bel
ow th
e de
tails
of a
ll in
vest
men
ts in
com
mon
sto
ck in
clud
ed in
Acc
ount
721
, Inv
estm
ents
and
Adv
ance
s Af
filia
ted
Com
pani
es.
2.En
ter i
n co
lum
n (c
) the
am
ount
nec
essa
ry to
retro
activ
ely
adju
st th
ose
inve
stm
ents
. (S
ee in
stru
ctio
n 5-
2, U
nifo
rm S
yste
m o
f Acc
ount
s).
3.En
ter i
n co
lum
n (d
) the
sha
re o
f und
istri
bute
d ea
rnin
gs (i
.e.,
divi
dend
s) o
r los
ses.
4.En
ter i
n co
lum
n (e
) the
am
ortiz
atio
n fo
r the
yea
r of t
he e
xces
s of
cos
t ove
r equ
ity in
net
ass
ets
(equ
ity o
ver c
ost)
at d
ate
of a
cqui
sitio
n.5.
For d
efin
ition
s of
car
rier a
nd n
onca
rrie
r, se
e ge
nera
l ins
truct
ions
.
Bala
nce
atAd
just
men
ts fo
rEq
uity
inAd
just
men
t for
Bala
nce
Line
Nam
e of
issu
ing
com
pany
and
des
crip
tion
of s
ecur
ity h
eld
begi
nnin
gin
vest
men
tsun
dist
ribut
ed e
arni
ngs
Amor
tizat
ion
inve
stm
ents
dis
pose
d of
at c
lose
Line
No.
of y
ear
equi
ty m
etho
d(lo
sses
) dur
ing
year
durin
g ye
aror
writ
ten
dow
n du
ring
year
of y
ear
No.
(a)
(b)
(c)
(d)
(e)
(f)(g
)
Car
riers
: (L
ist s
peci
fics
for e
ach
com
pany
)1
Alam
eda
Belt
Line
- -
12
Belt
Rai
lway
Com
pany
of C
hica
go, T
he14
,900
14,9
002
3C
entra
l Cal
iforn
ia T
ract
ion
Com
pany
(232
)(2
0)25
2-
34
Hou
ston
Bel
t & T
erm
inal
Rai
lway
Com
pany
21,0
202,
879
(3,5
20)
20,3
794
5Ka
nsas
City
Ter
min
al R
ailw
ay C
ompa
ny4,
668
4239
65,
106
56
Long
view
Sw
itchi
ng C
ompa
ny35
9(3
51)
86
7M
T Pr
oper
ties
Inc.
1,80
0(3
57)
1,44
37
8O
akla
nd T
erm
inal
Rai
lway
- -
89
Padu
cah
& Ill
inoi
s R
ailro
ad C
ompa
ny5,
101
596
(566
)5,
131
910
Portl
and
Term
inal
Rai
lroad
Com
pany
1,51
793
(71)
1,53
910
11St
. Jos
eph
Term
inal
Rai
lroad
Com
pany
150
150
1112
Suns
et R
ailw
ay C
ompa
ny4,
251
2 20
4,27
312
13Te
rmin
al R
ailro
ad A
ssoc
iatio
n of
St.
Loui
s-
- 13
14Te
xas
City
Ter
min
al R
ailw
ay C
ompa
ny44
,702
(94)
2,87
047
,478
1415
TTX
Com
pany
391,
368
(395
)23
,268
414,
241
1516
Wic
hita
Uni
on T
erm
inal
Rai
lway
Com
pany
79(9
)70
1617
1718
TOTA
L C
ARR
IER
S48
9,68
33,
123
21,6
60-
252
514,
718
1819
1920
2021
Kind
er M
orga
n En
ergy
Par
tner
s LP
6,89
36,
893
2122
Met
eorc
omm
, LLC
27,6
716,
501
(10,
739)
23,4
3322
23M
onta
uk S
ynfu
els
LLC
- -
2324
PTC
220
, LLC
6,56
986
4(7
47)
6,68
624
25To
ngue
Riv
er H
oldi
ng C
ompa
ny, L
LC21
,781
(20)
(21,
761)
-25
26R
ailm
arke
tpla
ce.c
om, I
nc.
- -
2627
2728
TOTA
L N
ON
-CAR
RIE
RS
62,9
147,
365
(11,
506)
-(2
1,76
1)37
,012
2829
2930
TOTA
L IN
VEST
MEN
TS IN
CO
MM
ON
STO
CK
552,
597
10,4
8810
,154
-(2
1,50
9)55
1,73
030
3131
3232
Not
e:
Col
umn
(d) L
ine
No.
7 is
net
of a
ppro
xim
atel
y $4
33k
in d
ivid
ends
rece
ived
.C
olum
n (d
) Lin
e N
o. 1
4 is
net
of a
ppro
xim
atel
y $5
,250
k in
div
iden
ds re
ceiv
ed.
Road Initials: BNSF Year 2016
Railroad Annual Report R-1

Road Initials: BNSF Year 2016 31INSTRUCTIONS CONCERNING RETURNS TO BE MADE IN SCHEDULE 330
1. Give particulars of balances at the beginning and close of the year and of all changes during the year in Account No. 731, Road and Equipment Property" and Account No. 732, "Improvements on Leased Property" classified by primary accounts in accordance with theUniform System of Accounts for Railroad Companies. The balances, by primary accounts, should, insofar as known, be stated in column(b) and all changes made during the year should be analyzed in columns (c) to (f), inclusive. Column (g) should be the net of the amounts incolumns (c) through (f). Column (h) is the aggregate of columns (b) through (f), inclusive. Grand totals of columns (b) and (h) shouldequal the sum of Accounts 731 and 732 for the respective periods; if not, a full explanation should be made in a footnote.
2. In column (c), show disbursements made for the specific purpose of purchasing, constructing, and equipping new lines, and for theextension of old lines, as provided for in Instruction 2-1, :Items to be charged" in the Uniform System of Accounts for Railroad Companiesfor such items.
3. In column (d), show the cost of a railway or portion thereof, acquired as an operating entity or system by purchase, merger, consolidation,reorganization, receivership sale or transfer, or otherwise.
4. Columns (c) and (e) should include all entries covering expenditures for additions and betterments, as defined, whether or not replacingother property.
5. All credits representing property sold, abandoned, or otherwise retires should be shown in column (f).
6. Both the debit and credit involved in each transfer, adjustment, or clearance, between road and equipment accounts, should be included inthe column in which the item was initially included. Also, the transfer of prior years' debits or credits from investment in road and equipmentto operating expenses or other accounts, or vice versa, should be included in the column applicable to current items of like nature. Each such transfer, adjustment, or clearance should be fully explained when in excess of $100,000.
7. If during the year an individual charge of $100,000 or more was made to Account No. 2, "Land for Transportation Purposes," state thecost, location, area, and other details which will identify the property in a footnote.
8. Report on line 29, amounts not included in the primary road accounts. The items reported should be briefly identified and explained underNotes and Remarks," below. Amounts should be reported on this line only under special circumstances, usually after permission isobtained from the Board for exceptions to prescribed accounting. Reference to such authority should be made when explaining theamounts reported. Respondents must not make arbitrary changes to the printed stub or column headings without specific authority fromthe Board.
9. If during the year a segment of transportation property was acquired, state in a footnote the name of the vendor, the mileage acquired, andthe date of acquisition, giving location and cost of the property to the respondent. Also furnish a statement of the amount included ineach primary account representing such property acquired, referring to the column or columns in which the entries appear.
10. If an amount of less than $5,000 is used as the minimum for additions and betterments to property investment accounts as provided for inInstruction 2-2 of the Uniform System of Accounts for Railroad Companies, state the amount used in a footnote.
NOTES AND REMARKS
Railroad Annual Report R-1
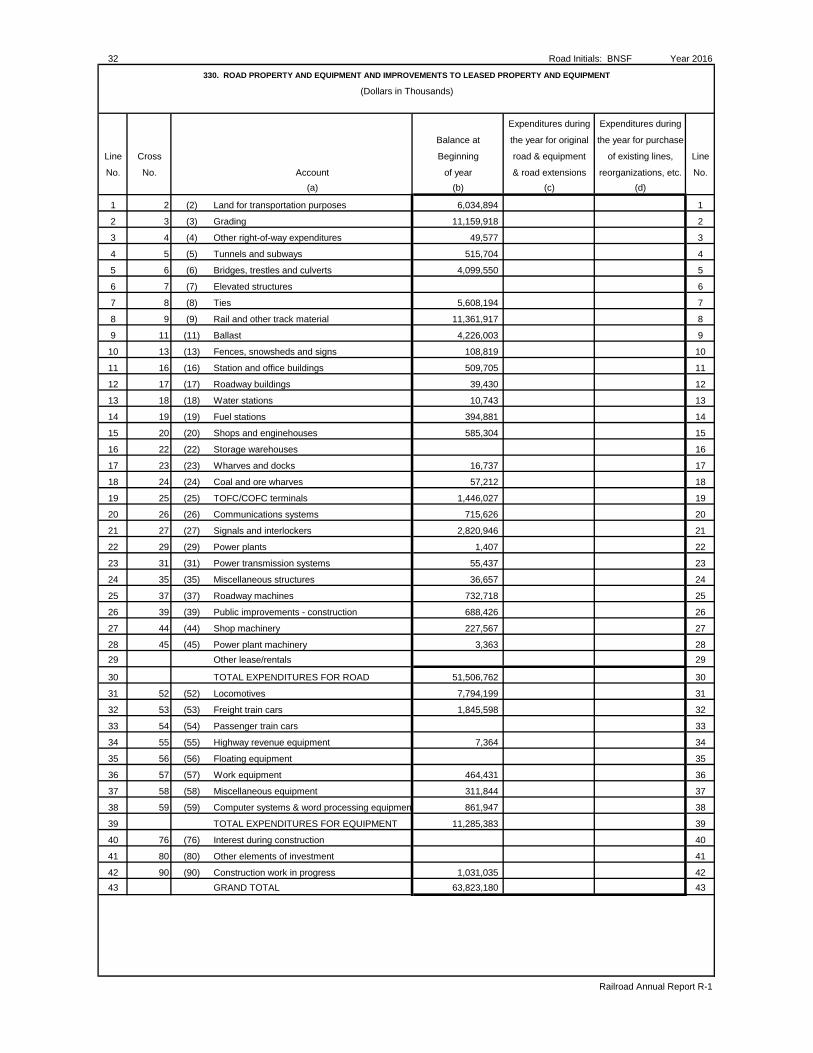
32 Road Initials: BNSF Year 2016
330. ROAD PROPERTY AND EQUIPMENT AND IMPROVEMENTS TO LEASED PROPERTY AND EQUIPMENT
(Dollars in Thousands)
Expenditures during Expenditures during
Balance at the year for original the year for purchase
Line Cross Beginning road & equipment of existing lines, Line
No. No. Account of year & road extensions reorganizations, etc. No.(a) (b) (c) (d)
1 2 (2) Land for transportation purposes 6,034,894 1
2 3 (3) Grading 11,159,918 2
3 4 (4) Other right-of-way expenditures 49,577 3
4 5 (5) Tunnels and subways 515,704 4
5 6 (6) Bridges, trestles and culverts 4,099,550 5
6 7 (7) Elevated structures 6
7 8 (8) Ties 5,608,194 7
8 9 (9) Rail and other track material 11,361,917 8
9 11 (11) Ballast 4,226,003 9
10 13 (13) Fences, snowsheds and signs 108,819 10
11 16 (16) Station and office buildings 509,705 11
12 17 (17) Roadway buildings 39,430 12
13 18 (18) Water stations 10,743 13
14 19 (19) Fuel stations 394,881 14
15 20 (20) Shops and enginehouses 585,304 15
16 22 (22) Storage warehouses 16
17 23 (23) Wharves and docks 16,737 17
18 24 (24) Coal and ore wharves 57,212 18
19 25 (25) TOFC/COFC terminals 1,446,027 19
20 26 (26) Communications systems 715,626 20
21 27 (27) Signals and interlockers 2,820,946 21
22 29 (29) Power plants 1,407 22
23 31 (31) Power transmission systems 55,437 23
24 35 (35) Miscellaneous structures 36,657 24
25 37 (37) Roadway machines 732,718 25
26 39 (39) Public improvements - construction 688,426 26
27 44 (44) Shop machinery 227,567 27
28 45 (45) Power plant machinery 3,363 2829 Other lease/rentals 29
30 TOTAL EXPENDITURES FOR ROAD 51,506,762 30
31 52 (52) Locomotives 7,794,199 31
32 53 (53) Freight train cars 1,845,598 32
33 54 (54) Passenger train cars 33
34 55 (55) Highway revenue equipment 7,364 34
35 56 (56) Floating equipment 35
36 57 (57) Work equipment 464,431 36
37 58 (58) Miscellaneous equipment 311,844 37
38 59 (59) Computer systems & word processing equipmen 861,947 38
39 TOTAL EXPENDITURES FOR EQUIPMENT 11,285,383 39
40 76 (76) Interest during construction 40
41 80 (80) Other elements of investment 41
42 90 (90) Construction work in progress 1,031,035 4243 GRAND TOTAL 63,823,180 43
Railroad Annual Report R-1

Road Initials: BNSF Year 2016 33
330. ROAD PROPERTY AND EQUIPMENT AND IMPROVEMENTS TO LEASED PROPERTY AND EQUIPMENT - (Continued)
(Dollars in Thousands)
Line Cross Expenditures for additions Credits for property retired Net changes Balance at Line
No. No. during the year during the year during the year close of year No.(e) (f) (g) (h)
1 2 34,632 9,038 25,594 6,060,488 1
2 3 145,357 3,693 141,664 11,301,582 2
3 4 1,852 333 1,519 51,096 3
4 5 4,022 (3) 4,025 519,729 4
5 6 160,457 1,884 158,573 4,258,123 5
6 7 6
7 8 434,483 133,292 301,191 5,909,385 7
8 9 673,188 155,104 518,084 11,880,001 8
9 11 539,584 272,563 267,021 4,493,024 9
10 13 4,817 350 4,467 113,286 10
11 16 44,391 6,297 38,094 547,799 11
12 17 8,760 2 8,758 48,188 12
13 18 7 7 10,750 13
14 19 15,023 1,143 13,880 408,761 14
15 20 30,499 705 29,794 615,098 15
16 22 16
17 23 16,737 17
18 24 14,197 14,197 71,409 18
19 25 135,853 11,538 124,315 1,570,342 19
20 26 63,455 8,589 54,866 770,492 20
21 27 381,603 (114,343) 495,946 3,316,892 21
22 29 1,407 22
23 31 5,382 (28) 5,410 60,847 23
24 35 3,167 (2) 3,169 39,826 24
25 37 70,948 6,099 64,849 797,567 25
26 39 44,256 4,307 39,949 728,375 26
27 44 13,876 1,742 12,134 239,701 27
28 45 3,363 2829 29
30 2,829,809 502,303 2,327,506 53,834,268 30
31 52 747,703 203,728 543,975 8,338,174 31
32 53 37,774 30,706 7,068 1,852,666 32
33 54 33
34 55 7,364 34
35 56 35
36 57 45,865 156 45,709 510,140 36
37 58 67,072 (5,794) 72,866 384,710 37
38 59 150,947 71,997 78,950 940,897 38
39 1,049,361 300,793 748,568 12,033,951 39
40 76 40
41 80 41
42 90 (66,129) (66,129) 964,906 4243 3,813,041 803,096 3,009,945 66,833,125 43
Railroad Annual Report R-1

34 Road Initials: BNSF Year 2016332. DEPRECIATION BASE AND RATES - ROAD AND EQUIPMENT OWNED AND LEASED FROM OTHERS
(Dollars in Thousands)
1. Show in columns (b) and (e), for each primary account, the depreciation base used to compute depreciation charges for the month of January,and in columns (c) and (f), the depreciation charges for the month of December. In columns (d) and (g) show the composite rates used in computing depreciation charges for December, and on lines 30 and 39 of these columns show the composite percentage for all road and equipment accounts, respectively, ascertained by applying the primary account composite rates to the depreciation base used in computing the charges for December, and dividing that total by the total depreciation base for the same month. The depreciation base should not include cost of equipment used, but not owned, when the rents are included in rent for equipment and account nos. 31-22-00, 31-23-00, 31-25-00, 31-21-00, 35-21-00, 35-23-00, 35-22-00, and 35-25-00. It should include cost of equipment owned and leased to others when the rents therefrom are included in the rent for equipment, accounts nos. 32-21-00, 32-22-00, 32-23-00, 32-25-00, 36-21-00, 36-22-00, 36-23-00, and 36-25-00., inclusive. Composite rates used should be those prescribed or authorized by the Board, except that where the use of component rates has been authorized, the composite rates to be shown for the respective primary accounts should be recomputed from the December charges developed by the use of the authorized rates. If any changes in rates were effective during the year, give particulars in a footnote.
2. All leased property may be combined and one composite rate computed for each primary account, or a separate schedule may be included foreach such property.
3. Show in columns (e), (f), and (g) data applicable to lessor property, when the rent therefore is included in accounts nos. 31-11-00, 31-12-00,31-13-00, 31-21-00, 31-22-00, and 31-23-00, inclusive.
4. If depreciation accruals have been discontinued for any account, the depreciation base should be reported, nevertheless, in support ofdepreciation reserves. Authority for discontinuance of accruals should be shown in a footnote, indicating the effected account(s).
5. Disclosures in the respective sections of this schedule may be omitted if either total road leased from others or total equipment leased fromothers represents less than 5% of total road owned or total equipment owned, respectively.
OWNED AND USED LEASED FROM OTHERS
Depreciation Base Annual Depreciation Base Annual
composite composite
Line Account At beginning At close rate At beginning At close rate Line
No. of year of year % of year of year % No.
(a) (b) (c) (d) (e) (f) (g)ROAD
1 (3) Grading 11,159,918 11,301,582 1.05% 1
2 (4) Other right-of-way expenditures 49,577 51,096 2.86% 2
3 (5) Tunnels and subways 515,704 519,729 1.05% 3
4 (6) Bridges, trestles and culverts 4,099,550 4,258,123 1.39% 4
5 (7) Elevated structures 5
6 (8) Ties 5,608,194 5,909,385 3.69% 6
7 (9) Rail and other track material 11,361,917 11,880,001 3.03% 7
8 (11) Ballast 4,226,003 4,493,024 3.86% 8
9 (13) Fences, snowsheds and signs 108,819 113,286 1.43% 9
10 (16) Station and office buildings 509,705 547,799 2.82% 10
11 (17) Roadway buildings 39,430 48,188 4.17% 11
12 (18) Water stations 10,743 10,750 2.56% 12
13 (19) Fuel stations 394,881 408,761 3.45% 13
14 (20) Shops and enginehouses 585,304 615,098 2.17% 14
15 (22) Storage warehouses 15
16 (23) Wharves and docks 16,737 16,737 2.50% 16
17 (24) Coal and ore wharves 57,212 71,409 2.00% 17
18 (25) TOFC/COFC terminals 1,446,027 1,570,342 3.12% 18
19 (26) Communications systems 715,626 770,492 5.37% 19
20 (27) Signals and interlockers 2,820,946 3,316,892 3.86% 20
21 (29) Power plants 1,407 1,407 2.94% 21
22 (31) Power transmission systems 55,437 60,847 2.25% 22
23 (35) Miscellaneous structures 36,657 39,826 2.56% 23
24 (37) Roadway machines 732,718 797,567 5.82% 24
25 (39) Public improvements - construction 688,426 728,375 2.22% 25
26 (44) Shop machinery 227,567 239,701 3.20% 26
27 (45) Power plant machinery 3,363 3,363 4.76% 27
28 All other road accounts 28
29 Amortization (other than def. projects) 2930 TOTAL ROAD 45,471,868 47,773,780 3.17% 30
EQUIPMENT
31 (52) Locomotives 7,794,199 8,338,174 5.39% 31
32 (53) Freight train cars 1,845,598 1,852,666 3.26% 32
33 (54) Passenger train cars 33
34 (55) Highway revenue equipment 7,364 7,364 9.00% 34
35 (56) Floating equipment 35
36 (57) Work equipment 464,431 510,140 2.43% 36
37 (58) Miscellaneous equipment 311,844 384,710 7.87% 37
38 (59) Computer systems & WP equipment 861,947 940,897 11.66% 3839 TOTAL EQUIPMENT 11,285,383 12,033,951 5.43% 39
40 GRAND TOTAL 56,757,251 59,807,731 N/A NA 40
Railroad Annual Report R-1
TOTAL ROAD AND
EQUIPMENT LEASED FROM
OTHERS IS LESS THAN 5%
OF TOTAL OWNED

Road Initials: BNSF Year 2016 35335. ACCUMULATED DEPRECIATION - ROAD AND EQUIPMENT OWNED AND USED
(Dollars in Thousands)
1. Disclose the required information regarding credits and debits to Account No. 735, "Accumulated Depreciation: Road and Equipment Property." during the year relating to owned and used road and equipment. Include entries for depreciation of equipment owned but not used when the resulting rents are included in the "Lease Rentals - Credit - Equipment" accounts and "Other Rents - Credit - Equipment" accounts. Exclude any entries for depreciation of equipment that is used but not owned when the resulting rents are included in "Lease Rental - Debit - Equipment" accounts and "Other Rents - Debit - Equipment" accounts. (See Schedule 351 for accumulated depreciation to road and equipment owned and leased to others.)
2. If any data are included in columns (d) or (f), explain the entries in detail.
3. A debit balance in columns (b) or (g) for any primary account should be designated "Dr."
4. If there is any inconsistency between credits to reserves as shown in column (c) and charges to operating expenses, a full explanation should be given.
5. Include authorized amortization amounts in column (c) on the lines for the affected accounts.
Balance BalanceLine Cross at Charges to at close LineNo. Check Account beginning operating Other Retirements Other of No.
of year expenses credits debits year(a) (b) (c) (d) (e) (f) (g)
ROAD1 3 (3) Grading 608,306 119,042 3,384 723,964 12 4 (4) Other right-of-way expenditures 5,545 1,730 342 6,933 23 5 (5) Tunnels and subways 53,040 9,049 (3) 62,092 34 6 (6) Bridges, trestles and culverts 374,047 74,557 2,112 446,492 45 7 (7) Elevated structures 56 8 (8) Ties 42,985 273,254 1,771 172,321 145,689 67 9 (9) Rail and other track material 944,510 432,433 3,114 177,001 1,203,056 78 11 (11) Ballast (243,663) 200,743 1,516 274,296 (315,700) 89 13 (13) Fences, snowsheds and signs 9,080 1,863 - 351 10,592 910 16 (16) Station and office buildings 91,634 13,809 3,627 6,309 102,761 1011 17 (17) Roadway buildings 13,156 2,050 537 1 15,742 1112 18 (18) Water stations 2,554 473 - - 3,027 1213 19 (19) Fuel stations 74,778 15,914 - 1,235 89,457 1314 20 (20) Shops and enginehouses 87,315 15,416 1,256 705 103,282 1415 22 (22) Storage warehouses 1516 23 (23) Wharves and docks 2,707 432 3,139 1617 24 (24) Coal and ore wharves 5,364 1,643 7,007 1718 25 (25) TOFC/COFC terminals 266,836 51,687 11,435 307,088 1819 26 (26) Communications systems 193,251 28,454 7,475 8,713 220,467 1920 27 (27) Signals and interlockers (224,574) 6,037 (113,933) (104,604) 2021 29 (29) Power plants 978 100 1,078 2122 31 (31) Power transmission systems 7,012 1,695 (28) 8,735 2223 35 (35) Miscellaneous structures 15,122 2,447 (4) 17,573 2324 37 (37) Roadway machines 173,438 39,214 10,300 6,304 216,648 2425 39 (39) Public improvements - const. 55,149 18,753 - 4,413 69,489 2526 44 (44) Shop machinery 64,224 9,845 799 1,740 73,128 2627 45 (45) Power plant machinery 1,059 160 7 1,212 2728 All other road accounts 2829 Amortization (adjustments) 2930 TOTAL ROAD 2,623,853 1,320,800 30,395 556,701 3,418,347 30
EQUIPMENT31 52 (52) Locomotives 1,790,210 561,669 2,209 202,043 2,152,045 3132 53 (53) Freight train cars 211,528 70,627 46,085 236,070 3233 54 (54) Passenger train cars - 3334 55 (55) Highway revenue equipment (3,131) 432 (2,699) 3435 56 (56) Floating equipment - 3536 57 (57) Work equipment 55,769 9,265 4,829 (15,840) 85,703 3637 58 (58) Miscellaneous equipment (25,204) 16,458 8,579 (5,770) 5,603 3738 59 (59) Computer systems & WP equip. 471,161 65,532 34,172 69,501 501,364 3839 Amortization (adjustments) 3940 TOTAL EQUIPMENT 2,500,333 723,983 49,789 296,019 2,978,086 40
41 GRAND TOTAL 5,124,186 2,044,783 80,184 852,720 6,396,433 41
NOTE: Credits in Column (d) represent transfers from depreciation expense to inventory and capital accounts to recognize allocated overhead costs.
Railroad Annual Report R-1
Notes and Remarks
CREDITS TO RESERVE DEBITS TO RESERVEDuring the year During the year

36 Road Initials: BNSF Year 2016
342. ACCUMULATED DEPRECIATION - IMPROVEMENTS TO ROAD AND EQUIPMENT LEASED FROM OTHERS
(Dollars in Thousands)
1. Enter the required information concerning debits and credits to Account 733, "Accumulated Depreciation - Improvements on Leased Property,"
during the year relating to improvements made to road and equipment property leased from others, the depreciation charges for which are included
in operating expenses of the respondent.
2. If any entries are made for column (d) "Other credits" or column (f) "Other debits," state the facts occasioning such entries on in the Notes and Remarks section. A
debit balance in columns (b) or (g) for any primary account should be shown in parenthesis or designated "Dr."
3. Any inconsistency between credits to the reserve as shown in column (c) and charges to operating expenses should be fully explained in the Notes and Remarks section.
4. Show in column (e) the debits to the reserve arising from retirements. These debits should not exceed investment, etc.
5. Disclosures in the respective sections of this schedule may be omitted if either total road leased from others or total equipment leased from
others represents less than 5% of total road owned or total equipment owned, respectively. However, line 39, Grand Total, should be completed.
CREDITS TO RESERVE DEBITS TO RESERVE
Balance During the year During the year Balance
Line Cross at Charges to at close Line
No. Check Account beginning operating Other Retirements Other of No.
of year expenses credits debits year
(a) (b) (c) (d) (e) (f) (g)
ROAD
1 (3) Grading 1
2 (4) Other right-of-way expenditures 2
3 (5) Tunnels and subways TOTAL IMPROVEMENTS TO ROAD LEASED FROM OTHERS IS LESS THAN 5% 3
4 (6) Bridges, trestles and culverts OF TOTAL ROAD OWNED 4
5 (7) Elevated structures 5
6 (8) Ties 6
7 (9) Rail and other track material 7
8 (11) Ballast 8
9 (13) Fences, snowsheds and signs 9
10 (16) Station and office buildings 10
11 (17) Roadway buildings 11
12 (18) Water stations 12
13 (19) Fuel stations 13
14 (20) Shops and enginehouses 14
15 (22) Storage warehouses 15
16 (23) Wharves and docks 16
17 (24) Coal and ore wharves 17
18 (25) TOFC/COFC terminals 18
19 (26) Communications systems 19
20 (27) Signals and interlockers 20
21 (29) Power plants 21
22 (31) Power transmission systems 22
23 (35) Miscellaneous structures 23
24 (37) Roadway machines 24
25 (39) Public improvements - const. 25
26 (44) Shop machinery * 26
27 (45) Power plant machinery 27
28 All other road accounts 28
29 TOTAL ROAD 29
EQUIPMENT
30 (52) Locomotives 30
31 (53) Freight train cars TOTAL IMPROVEMENTS TO EQUIPMENT LEASED FROM OTHERS IS LESS THAN 31
32 (54) Passenger train cars 5% OF TOTAL EQUIPMENT OWNED 32
33 (55) Highway revenue equipment 33
34 (56) Floating equipment 34
35 (57) Work equipment 35
36 (58) Miscellaneous equipment 36
37 (59) Computer systems & WP equip. 37
38 TOTAL EQUIPMENT 38
39 GRAND TOTAL 20,030 7,420 (116) 17,932 9,402 39
* To be reported with equipment expenses rather than W&S expenses.
Railroad Annual Report R-1

Road Initials: BNSF Year 2016 37
Railroad Annual Report R-1
THIS PAGE INTENTIONALLY LEFT BLANK
NOTES AND REMARKS FOR SCHEDULE 342

38 Road Initials: BNSF Year 2016352A. INVESTMENT IN RAILROAD PROPERTY USED IN TRANSPORTATION SERVICE (By Company)
(Dollars in Thousands)
1. Disclose the investment in railway property used in transportation service at the close of the year. This investment represents the aggregate of property ownedor leased by respondent and used in respondent's transportation service. Such property includes (a) investment reported in Accounts 731, "Road and EquipmentProperty" and 732, "improvements on Leased Property" of respondent, less any 731 or 732 property leased to others for their exclusive use of road, track, or bridges (including equipment or other railway property covered by the contract). Equipment leased to others under separate distinct contracts shall not be deducted fromrespondent's 731 or 732 property, and (b) the investment of other companies' 731 or 732 property (including operating and lessor railroads) used by respondent whenthe lease is for exclusive use or control of roads, tracks, or bridges (including equipment or other railway property covered by the contract). This excludes leaseequipment from operating railroads under separate distinct contracts and the investment of other carriers in property jointly used by respondent.
2. In column (a), classify each company in this schedule as: "R" for respondent, "L" for lessor railroad, "P" for inactive or proprietary company or "O" for otherleased properties.
3. In columns (a) to (e), inclusive, first show the data requested for respondent (R); next show data for companies whose entire properties are used in transportationservice of the respondent, divided between lessor (L) and proprietary (P) companies; followed by data for carriers and others (O), portions of whose property are usedin transportation service of respondent. Show a total for each class of company in columns (d) and (e). Then show, as deductions. data for transportationproperty leased to carriers and others.
4. In column (c), line-haul carriers report the miles of road used in line-haul service. Report miles in whole numbers.
5. In column (d), show the amount applicable to Accounts 731 and 732 on the books of companies whose names appear in column (b). Values of propertyof other carriers segregated by estimate or otherwise should correspond in amount to deductions made by the owners in their reports. If separate value is notavailable, an explanation should be provided. Differences between amounts shown in column (d) of this schedule and column (c), line 24, on the asset side ofthe general balance sheet of each individual railway should be explained in a footnote. Book values included in Accounts 731 and 732 of the owner should bereported in column (d) in reference to the investment of respondent in securities of the owner unless a good reason can be given for the contrary. Methods ofestimating (by capitalizing rentals at 6% or otherwise) value of property of private owners, or portions of property of other carriers, should be explained.
6. In column (e), show the amount of depreciation and amortization accrued as of the close of the year in Accounts 733, 734, 735, 736, and 772, that is applicableto the property of the carriers whose names are listed in column (b), regardless of where reserves therefor are recorded.
DepreciationClass Miles of road Investments & amortization of
Line (See Name of company used (See Ins. 4) in property defense projects LineNo. (Ins. 2) (whole number) (See Ins. 5) (See Ins. 6) No.
(a) (b) (c) (d) (e)1 R BNSF Railway Company 24,014 66,833,125 6,396,433 12 23 Add Leased from Others: 34 L Norfolk Southern Railroad (NS) 26 *** **** 45 L Dayton, TX ** *** **** 56 Total Leased from Others 26 - - 67 78 Deduct Leased to or Operated by Others: 89 O Alabama & Gulf Coast Railway (AGR)* 27 1,275 384 910 O Blue Mountain Railroad (BLMR) 4 405 41 1011 O Burlington Junction Railway (BJRY) 7 4,045 2,226 1112 O 15 43,363 4,545 1213 O Central Washington Railroad * 40 17,247 1,563 1314 O Dakota Northern Railroad (DNR) 62 1,614 586 1415 O Industry (INDY)* 10 2,587 1,119 1516 O Kaw River Railroad (KAW) 16 4,265 242 1617 O Kettle Falls International Railway (KFR) 87 30,047 2,752 1718 O Minnesota Commercial Railway (MNNR) 13 27 683 1819 O Minnesota National Guard (MNG) 8 92 105 1920 O Mission Mountain Railroad (MMT) 16 603 556 2021 O Nebraska, Kansas & Colorado Railway (NKCR) 48 144 1,401 2122 O Northern Lines Railway (NLR) 18 2,355 700 2223 O Portland & Western Railroad (PNWR) * 77 13,730 3,264 2324 O R.J. Corman Railroad Group ** 6,728 418 2425 O Red River Valley & Western Railway (RRVW) 443 1,312 6,077 2526 O Richmond Pacific Railroad (RPRC) ** 988 161 2627 O San Joaquin Valley Railway (SJVR) 2 47 2728 O South Kansas & Oklahoma Railroad (SKOL) 6 776 15 2829 O Southwestern Railroad (SW) * 53 4,203 1,144 2930 O Stillwater Central Railroad (SLWC) 12 644 247 3031 O Tacoma Rail (TRMW) * 6 235 4632 O Union Pacific Railroad (UPRR) 5 233 101 3233 Total Leased to or Operated by Others 975 136,965 28,376 3334 Net Deductions (949) (136,965) (28,376) 3435 TOTAL 23,065 66,696,160 6,368,057 35
* Lease lines were consolidated to present one line per lessor.** Miles of road used not available to respondent.
*** Investment not available to respondent.**** Depreciation not available to respondent.
Railroad Annual Report R-1
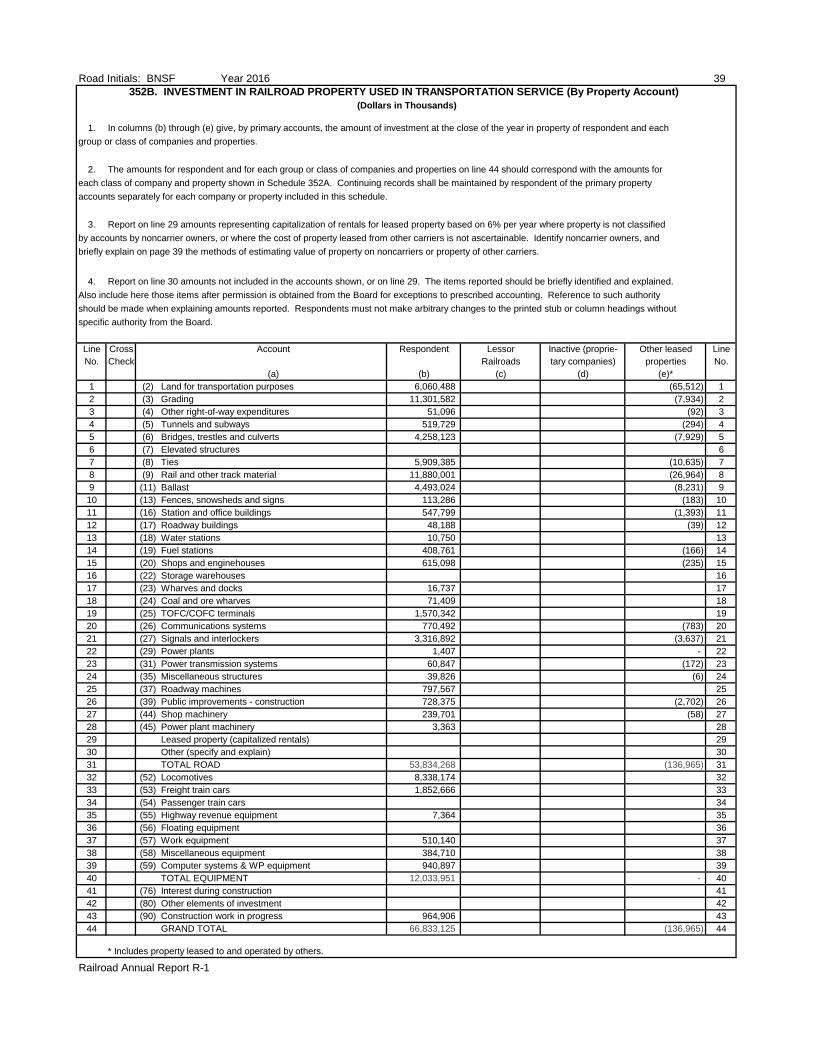
Road Initials: BNSF Year 2016 39352B. INVESTMENT IN RAILROAD PROPERTY USED IN TRANSPORTATION SERVICE (By Property Account)
(Dollars in Thousands)
1. In columns (b) through (e) give, by primary accounts, the amount of investment at the close of the year in property of respondent and eachgroup or class of companies and properties.
2. The amounts for respondent and for each group or class of companies and properties on line 44 should correspond with the amounts for each class of company and property shown in Schedule 352A. Continuing records shall be maintained by respondent of the primary propertyaccounts separately for each company or property included in this schedule.
3. Report on line 29 amounts representing capitalization of rentals for leased property based on 6% per year where property is not classifiedby accounts by noncarrier owners, or where the cost of property leased from other carriers is not ascertainable. Identify noncarrier owners, andbriefly explain on page 39 the methods of estimating value of property on noncarriers or property of other carriers.
4. Report on line 30 amounts not included in the accounts shown, or on line 29. The items reported should be briefly identified and explained.Also include here those items after permission is obtained from the Board for exceptions to prescribed accounting. Reference to such authorityshould be made when explaining amounts reported. Respondents must not make arbitrary changes to the printed stub or column headings withoutspecific authority from the Board.
Line Cross Account Respondent Lessor Inactive (proprie- Other leased LineNo. Check Railroads tary companies) properties No.
(a) (b) (c) (d) (e)*1 (2) Land for transportation purposes 6,060,488 (65,512) 12 (3) Grading 11,301,582 (7,934) 23 (4) Other right-of-way expenditures 51,096 (92) 34 (5) Tunnels and subways 519,729 (294) 45 (6) Bridges, trestles and culverts 4,258,123 (7,929) 56 (7) Elevated structures 67 (8) Ties 5,909,385 (10,635) 78 (9) Rail and other track material 11,880,001 (26,964) 89 (11) Ballast 4,493,024 (8,231) 910 (13) Fences, snowsheds and signs 113,286 (183) 1011 (16) Station and office buildings 547,799 (1,393) 1112 (17) Roadway buildings 48,188 (39) 1213 (18) Water stations 10,750 1314 (19) Fuel stations 408,761 (166) 1415 (20) Shops and enginehouses 615,098 (235) 1516 (22) Storage warehouses 1617 (23) Wharves and docks 16,737 1718 (24) Coal and ore wharves 71,409 1819 (25) TOFC/COFC terminals 1,570,342 1920 (26) Communications systems 770,492 (783) 2021 (27) Signals and interlockers 3,316,892 (3,637) 2122 (29) Power plants 1,407 - 2223 (31) Power transmission systems 60,847 (172) 2324 (35) Miscellaneous structures 39,826 (6) 2425 (37) Roadway machines 797,567 2526 (39) Public improvements - construction 728,375 (2,702) 2627 (44) Shop machinery 239,701 (58) 2728 (45) Power plant machinery 3,363 2829 Leased property (capitalized rentals) 2930 Other (specify and explain) 3031 TOTAL ROAD 53,834,268 (136,965) 3132 (52) Locomotives 8,338,174 3233 (53) Freight train cars 1,852,666 3334 (54) Passenger train cars 3435 (55) Highway revenue equipment 7,364 3536 (56) Floating equipment 3637 (57) Work equipment 510,140 3738 (58) Miscellaneous equipment 384,710 3839 (59) Computer systems & WP equipment 940,897 3940 TOTAL EQUIPMENT 12,033,951 - 4041 (76) Interest during construction 4142 (80) Other elements of investment 4243 (90) Construction work in progress 964,906 4344 GRAND TOTAL 66,833,125 (136,965) 44
* Includes property leased to and operated by others.
Railroad Annual Report R-1
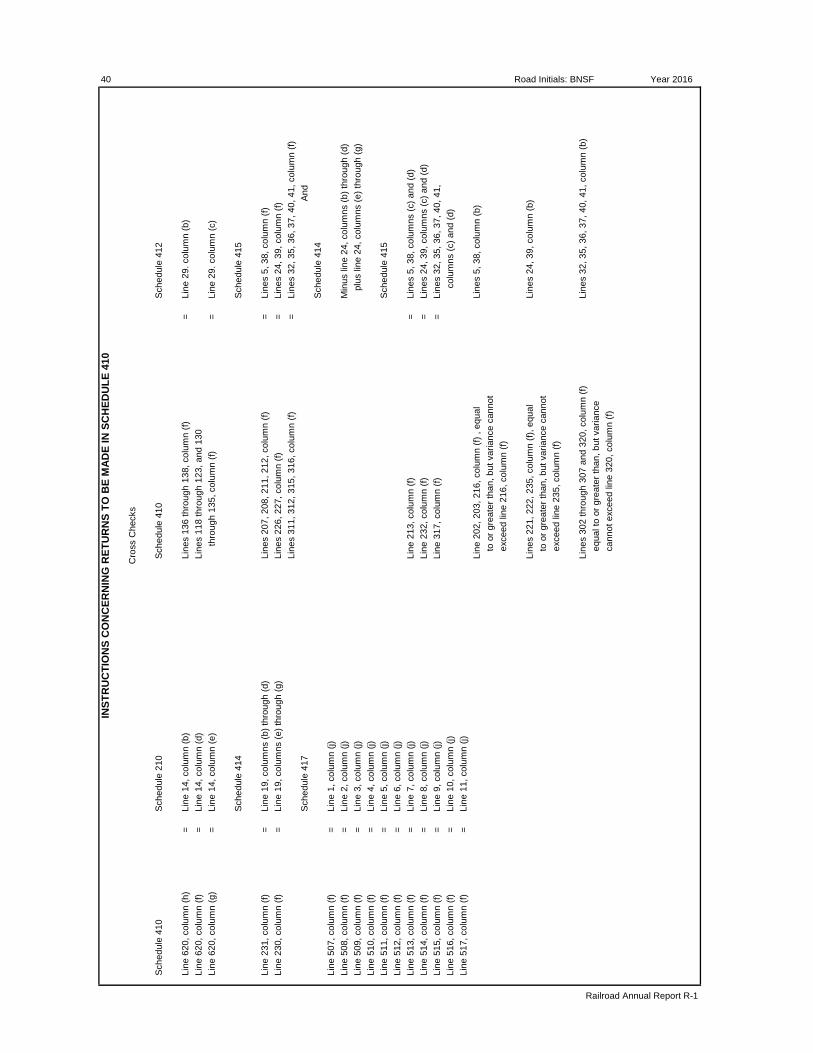
INST
RU
CTI
ON
S C
ON
CER
NIN
G R
ETU
RN
S TO
BE
MAD
E IN
SC
HED
ULE
410
Cro
ss C
heck
s
Sch
edul
e 41
0S
ched
ule
210
Sch
edul
e 41
0S
ched
ule
412
Line
620
, col
umn
(h)
=Li
ne 1
4, c
olum
n (b
)Li
nes
136
thro
ugh
138,
col
umn
(f)=
Line
29.
col
umn
(b)
Line
620
, col
umn
(f)=
Line
14,
col
umn
(d)
Line
s 11
8 th
roug
h 12
3, a
nd 1
30Li
ne 6
20, c
olum
n (g
)=
Line
14,
col
umn
(e)
t
hrou
gh 1
35, c
olum
n (f)
=Li
ne 2
9. c
olum
n (c
)
Sch
edul
e 41
4S
ched
ule
415
Line
231
, col
umn
(f)=
Line
19,
col
umns
(b) t
hrou
gh (d
)Li
nes
207,
208
, 211
, 212
, col
umn
(f)=
Line
s 5,
38,
col
umn
(f)Li
ne 2
30, c
olum
n (f)
=Li
ne 1
9, c
olum
ns (e
) thr
ough
(g)
Line
s 22
6, 2
27, c
olum
n (f)
=Li
nes
24, 3
9, c
olum
n (f)
Line
s 31
1, 3
12, 3
15, 3
16, c
olum
n (f)
=Li
nes
32, 3
5, 3
6, 3
7, 4
0, 4
1, c
olum
n (f)
Sch
edul
e 41
7A
ndS
ched
ule
414
Line
507
, col
umn
(f)=
Line
1, c
olum
n (j)
Line
508
, col
umn
(f)=
Line
2, c
olum
n (j)
Min
us li
ne 2
4, c
olum
ns (b
) thr
ough
(d)
Line
509
, col
umn
(f)=
Line
3, c
olum
n (j)
pl
us li
ne 2
4, c
olum
ns (e
) thr
ough
(g)
Line
510
, col
umn
(f)=
Line
4, c
olum
n (j)
Line
511
, col
umn
(f)=
Line
5, c
olum
n (j)
Sch
edul
e 41
5Li
ne 5
12, c
olum
n (f)
=Li
ne 6
, col
umn
(j)Li
ne 5
13, c
olum
n (f)
=Li
ne 7
, col
umn
(j)Li
ne 2
13, c
olum
n (f)
=Li
nes
5, 3
8, c
olum
ns (c
) and
(d)
Line
514
, col
umn
(f)=
Line
8, c
olum
n (j)
Line
232
, col
umn
(f)=
Line
s 24
, 39,
col
umns
(c) a
nd (d
)Li
ne 5
15, c
olum
n (f)
=Li
ne 9
, col
umn
(j)Li
ne 3
17, c
olum
n (f)
=Li
nes
32, 3
5, 3
6, 3
7, 4
0, 4
1,Li
ne 5
16, c
olum
n (f)
=Li
ne 1
0, c
olum
n (j)
c
olum
ns (c
) and
(d)
Line
517
, col
umn
(f)=
Line
11,
col
umn
(j)Li
ne 2
02, 2
03, 2
16, c
olum
n (f)
, eq
ual
Line
s 5,
38,
col
umn
(b)
to
or g
reat
er th
an, b
ut v
aria
nce
cann
ot
exce
ed li
ne 2
16, c
olum
n (f)
Line
s 22
1, 2
22, 2
35, c
olum
n (f)
, equ
alLi
nes
24, 3
9, c
olum
n (b
)
to o
r gre
ater
than
, but
var
ianc
e ca
nnot
ex
ceed
line
235
, col
umn
(f)
Line
s 30
2 th
roug
h 30
7 an
d 32
0, c
olum
n (f)
Line
s 32
, 35,
36,
37,
40,
41,
col
umn
(b)
eq
ual t
o or
gre
ater
than
, but
var
ianc
e
cann
ot e
xcee
d lin
e 32
0, c
olum
n (f)
Railroad Annual Report R-1
Road Initials: BNSF Year 201640

410.
RAI
LWAY
OPE
RAT
ING
EXP
ENSE
S(D
olla
rs in
Tho
usan
ds)
Sta
te th
e ra
ilway
ope
ratin
g ex
pens
es o
n re
spon
dent
's ro
ad fo
r the
yea
r, cl
assi
fyin
g th
em in
acc
orda
nce
with
the
Uni
form
Sys
tem
of A
ccou
nts
for R
ailro
ad C
ompa
nies
, and
allo
cate
the
com
mon
oper
atin
g ex
pens
es in
acc
orda
nce
with
the
Boa
rd's
rule
s go
vern
ing
the
sepa
ratio
n of
suc
h ex
pens
es b
etw
een
freig
ht a
nd p
asse
nger
ser
vice
s.
Mat
eria
l, to
ols,
Tota
lLi
neC
ross
Nam
e of
railw
ay o
pera
ting
expe
nse
acco
unt
Sal
arie
ssu
pplie
s, fu
els,
Pur
chas
edG
ener
alfre
ight
Pas
seng
erTo
tal
Line
No.
Che
ck&
Wag
es&
lubr
ican
tsse
rvic
esex
pens
eN
o.(a
)(b
)(c
)(d
)(e
)(f)
(g)
(h)
WA
YS &
STR
UC
TUR
ES
AD
MIN
ISTR
ATI
ON
1Tr
ack
107,
735
10,1
4115
,639
22,8
3015
6,34
515
6,34
51
2B
ridge
& b
uild
ing
26,4
922,
495
3,84
75,
613
38,4
4738
,447
23
Sig
nal
24,7
272,
327
3,59
15,
240
35,8
8535
,885
34
Com
mun
icat
ion
7,06
566
51,
025
1,50
010
,255
10,2
554
5O
ther
10,5
9899
71,
539
2,24
615
,380
15,3
805
RE
PA
IRS
AN
D M
AIN
TEN
AN
CE
6R
oadw
ay -
runn
ing
51,0
442,
662
25,9
6364
580
,314
80,3
146
7R
oadw
ay -
switc
hing
13,5
6270
86,
901
171
21,3
4221
,342
78
Tunn
els
& s
ubw
ays
- ru
nnin
g92
9292
89
Tunn
els
& s
ubw
ays
- sw
itchi
ng24
2424
910
Brid
ges
& c
ulve
rts -
runn
ing
19,2
782,
074
13,8
576,
301
41,5
1041
,510
1011
Brid
ges
& c
ulve
rts -
switc
hing
5,11
855
03,
684
1,67
611
,028
11,0
2811
12Ti
es -
runn
ing
5,96
187
791
333
18,
082
8,08
212
13Ti
es -
switc
hing
1,58
023
223
888
2,13
82,
138
1314
Rai
l & o
ther
trac
k m
ater
ial -
runn
ing
113,
689
24,1
0263
,060
11,3
2221
2,17
321
2,17
314
15R
ail &
oth
er tr
ack
mat
eria
l - s
witc
hing
30,2
206,
408
16,7
683,
009
56,4
0556
,405
1516
Bal
last
- ru
nnin
g5,
106
518
11,4
9897
118
,093
18,0
9316
17B
alla
st -
switc
hing
1,36
313
73,
056
258
4,81
44,
814
1718
Roa
d pr
oper
ty d
amag
ed -
runn
ing
1819
Roa
d pr
oper
ty d
amag
ed -
switc
hing
1920
Roa
d pr
oper
ty d
amag
ed -
othe
r20
21S
igna
ls &
inte
rlock
ers
- run
ning
54,1
1417
,772
16,7
574,
835
93,4
7893
,478
2122
Sig
nals
& in
terlo
cker
s - s
witc
hing
14,3
854,
888
4,43
21,
161
24,8
6624
,866
2223
Com
mun
icat
ions
sys
tem
s23
,221
9,42
7(3
,569
)8
29,0
8729
,087
2324
Pow
er s
yste
ms
7541
675
791
791
2425
Hig
hway
gra
de c
ross
ings
- ru
nnin
g1,
224
171,
383
2,62
42,
624
2526
Hig
hway
gra
de c
ross
ings
- sw
itchi
ng32
53
368
696
696
2627
Sta
tion
& o
ffice
bui
ldin
gs40
520
830
,482
1131
,106
31,1
0627
28S
hop
build
ings
- lo
com
otiv
es2,
669
1,95
79,
846
14,4
7214
,472
2829
Sho
p bu
ildin
gs -
freig
ht c
ars
616
452
2,27
33,
341
N/A
3,34
129
30S
hop
build
ings
- ot
her e
quip
men
t3,
559
2,60
913
,129
19,2
9719
,297
30
Railroad Annual Report R-1
Road Initials: BNSF Year 2016 41

410.
RAI
LWAY
OPE
RAT
ING
EXP
ENSE
S - (
Con
tinue
d)(D
olla
rs in
Tho
usan
ds)
Mat
eria
l, to
ols,
Tota
lLi
neC
ross
Nam
e of
railw
ay o
pera
ting
expe
nse
acco
unt
Sal
arie
ssu
pplie
s, fu
els,
Pur
chas
edG
ener
alfre
ight
Pas
seng
erTo
tal
Line
No.
Che
ck&
Wag
es&
lubr
ican
tsse
rvic
esex
pens
eN
o.(a
)(b
)(c
)(d
)(e
)(f)
(g)
(h)
RE
PA
IRS
AN
D M
AIN
TEN
AN
CE
- (C
ontin
ued)
101
Loco
mot
ive
serv
icin
g fa
cilit
ies
1,05
022
38,
939
10,2
1210
,212
101
102
Mis
cella
neou
s bu
ildin
gs &
stru
ctur
es7,
751
123,
802
11,5
6511
,565
102
103
Coa
l ter
min
als
N/A
103
104
Ore
term
inal
s31
416
1,29
71,
627
N/A
1,62
710
410
5O
ther
mar
ine
term
inal
s4,
792
2,98
57,
777
N/A
7,77
710
510
6TO
FC/C
OFC
term
inal
s38
21,
370
1,75
2N
/A1,
752
106
107
Mot
or v
ehic
le lo
adin
g &
dis
tribu
tion
faci
litie
sN
/A10
710
8Fa
cilit
ies
for o
ther
spe
cial
ized
ser
vice
ope
ratio
nsN
/A10
810
9R
oadw
ay m
achi
nes
5,84
333
,479
8,45
347
,775
47,7
7510
911
0S
mal
l too
ls &
sup
plie
s21
,791
4,39
64,
061
30,2
4830
,248
110
111
Sno
w re
mov
al6,
985
560
730
906
9,18
19,
181
111
112
Frin
ge b
enef
its -
runn
ing
N/A
N/A
N/A
157,
924
157,
924
157,
924
112
113
Frin
ge b
enef
its -
switc
hing
N/A
N/A
N/A
42,2
6042
,260
42,2
6011
311
4Fr
inge
ben
efits
- ot
her
N/A
N/A
N/A
22,2
4322
,243
22,2
4311
411
5C
asua
lties
& in
sura
nce
- run
ning
N/A
N/A
N/A
11,8
0311
,803
11,8
0311
511
6C
asua
lties
& in
sura
nce
- sw
itchi
ngN
/AN
/AN
/A3,
039
3,03
93,
039
116
117
Cas
ualti
es &
insu
ranc
e - o
ther
N/A
N/A
N/A
3,03
93,
039
3,03
911
711
8*
Leas
e re
ntal
s - d
ebit
-runn
ing
N/A
N/A
1,51
1N
/A1,
511
1,51
111
811
9*
Leas
e re
ntal
s - d
ebit
-sw
itchi
ngN
/AN
/A40
2N
/A40
240
211
912
0*
Leas
e re
ntal
s - d
ebit
-oth
erN
/AN
/AN
/A12
012
1*
Leas
e re
ntal
s - (
cred
it) -
runn
ing
N/A
N/A
N/A
121
122
*Le
ase
rent
als
- (cr
edit)
- sw
itchi
ngN
/AN
/AN
/A12
212
3*
Leas
e re
ntal
s - (
cred
it) -
othe
rN
/AN
/AN
/A12
312
4Jo
int f
acilit
y re
nt -
debi
t - ru
nnin
gN
/AN
/A15
,245
N/A
15,2
4515
,245
124
125
Join
t fac
ility
rent
- de
bit -
sw
itchi
ngN
/AN
/A1,
173
N/A
1,17
31,
173
125
126
Join
t fac
ility
rent
- de
bit -
oth
erN
/AN
/A33
5N
/A33
533
512
612
7Jo
int f
acilit
y re
nt -
(cre
dit)
- run
ning
N/A
N/A
(22,
509)
N/A
(22,
509)
(22,
509)
127
128
Join
t fac
ility
rent
- (c
redi
t) - s
witc
hing
N/A
N/A
(2,0
70)
N/A
(2,0
70)
(2,0
70)
128
129
Join
t fac
ility
rent
- (c
redi
t) - o
ther
N/A
N/A
(1,2
94)
N/A
(1,2
94)
(1,2
94)
129
130
*O
ther
rent
s - d
ebit
- run
ning
N/A
N/A
N/A
130
131
*O
ther
rent
s - d
ebit
- sw
itchi
ngN
/AN
/AN
/A13
113
2*
Oth
er re
nts
- deb
it - o
ther
N/A
N/A
N/A
132
133
*O
ther
rent
s - (
cred
it) -
runn
ing
N/A
N/A
N/A
133
Road Initials: BNSF Year 2016
Railroad Annual Report R-1
42

410.
RAI
LWAY
OPE
RAT
ING
EXP
ENSE
S - (
Con
tinue
d)(D
olla
rs in
Tho
usan
ds)
Mat
eria
l, to
ols,
Tota
lLi
neC
ross
Nam
e of
railw
ay o
pera
ting
expe
nse
acco
unt
Sal
arie
ssu
pplie
s, fu
els,
Pur
chas
edG
ener
alfre
ight
Pas
seng
erTo
tal
Line
No.
Che
ck&
Wag
es&
lubr
ican
tsse
rvic
esex
pens
eN
o.(a
)(b
)(c
)(d
)(e
)(f)
(g)
(h)
RE
PA
IRS
AN
D M
AIN
TEN
AN
CE
- (C
ontin
ued)
134
*O
ther
rent
s - (
cred
it) -
switc
hing
N/A
N/A
N/A
134
135
*O
ther
rent
s - (
cred
it) -
othe
rN
/AN
/AN
/A13
513
6*
Dep
reci
atio
n - r
unni
ngN
/AN
/AN
/A71
6,06
971
6,06
971
6,06
913
613
7*
Dep
reci
atio
n - s
witc
hing
N/A
N/A
N/A
190,
347
190,
347
190,
347
137
138
*D
epre
ciat
ion
- oth
erN
/AN
/AN
/A40
3,22
840
3,22
840
3,22
813
813
9Jo
int f
acilit
y - d
ebit
- run
ning
N/A
N/A
120,
632
N/A
120,
632
120,
632
139
140
Join
t fac
ility
- deb
it - s
witc
hing
N/A
N/A
46,1
34N
/A46
,134
46,1
3414
014
1Jo
int f
acilit
y - d
ebit
- oth
erN
/AN
/AN
/A14
114
2Jo
int f
acilit
y - (
cred
it) -
runn
ing
N/A
N/A
(68,
284)
N/A
(68,
284)
(68,
284)
142
143
Join
t fac
ility
- (cr
edit)
- sw
itchi
ngN
/AN
/A(9
,482
)N
/A(9
,482
)(9
,482
)14
314
4Jo
int f
acilit
y - (
cred
it) -
othe
rN
/AN
/AN
/A14
414
5D
ism
antli
ng re
tired
road
pro
perty
- ru
nnin
g14
514
6D
ism
antli
ng re
tired
road
pro
perty
- sw
itchi
ng14
614
7D
ism
antli
ng re
tired
road
pro
perty
- ot
her
147
148
Oth
er -
runn
ing
124
270
7,33
376
48,
491
8,49
114
814
9O
ther
- sw
itchi
ng39
721,
963
204
2,27
82,
278
149
150
Oth
er -
othe
r13
123
1,37
910
71,
622
1,62
215
015
1TO
TAL
WA
Y A
ND
STR
UC
TUR
ES
551,
042
152,
180
368,
926
1,62
4,21
02,
696,
358
2,69
6,35
815
1E
QU
IPM
EN
TLO
CO
MO
TIV
ES
201
Adm
inis
tratio
n13
,753
8,40
418
,824
9,92
150
,902
50,9
0220
120
2*
Rep
air &
mai
nten
ance
219,
853
166,
605
270,
734
1,75
265
8,94
465
8,94
420
220
3*
Mac
hine
ry re
pair
232
1,00
026
81,
500
1,50
020
320
4E
quip
men
t dam
aged
648
4269
069
020
420
5Fr
inge
ben
efits
N/A
N/A
N/A
92,5
7792
,577
92,5
7720
520
6O
ther
cas
ualti
es &
insu
ranc
eN
/AN
/AN
/A2,
629
2,62
92,
629
206
207
*Le
ase
rent
als
- deb
itN
/AN
/A26
0,28
5N
/A26
0,28
526
0,28
520
720
8*
Leas
e re
ntal
s - (
cred
it)N
/AN
/A(2
42)
N/A
(242
)(2
42)
208
209
Join
t fac
ility
rent
- de
bit
N/A
N/A
N/A
209
210
Join
t fac
ility
rent
- (c
redi
t)N
/AN
/AN
/A21
021
1*
Oth
er re
nts
- deb
itN
/AN
/AN
/A21
121
2*
Oth
er re
nts
- (cr
edit)
N/A
N/A
N/A
212
213
*D
epre
ciat
ion
N/A
N/A
N/A
567,
525
567,
525
567,
525
213
214
Join
t fac
ility
- deb
itN
/AN
/A5,
067
N/A
5,06
75,
067
214
215
Join
t fac
ility
- (cr
edit)
N/A
N/A
N/A
215
216
*R
epai
rs b
illed
to o
ther
s - (
cred
it)N
/AN
/A(2
3,51
8)N
/A(2
3,51
8)(2
3,51
8)21
6
Railroad Annual Report R-1
Road Initials: BNSF Year 2016 43

410.
RAI
LWAY
OPE
RAT
ING
EXP
ENSE
S - (
Con
tinue
d)(D
olla
rs in
Tho
usan
ds)
Mat
eria
l, to
ols,
Tota
lLi
neC
ross
Nam
e of
railw
ay o
pera
ting
expe
nse
acco
unt
Sal
arie
ssu
pplie
s, fu
els,
Pur
chas
edG
ener
alfre
ight
Pas
seng
erTo
tal
Line
No.
Che
ck&
Wag
es&
lubr
ican
tsse
rvic
esex
pens
eN
o.(a
)(b
)(c
)(d
)(e
)(f)
(g)
(h)
LOC
OM
OTI
VE
S -
(Con
tinue
d)21
7D
ism
antli
ng re
tired
pro
perty
217
218
Oth
er1,
648
2740
92,
084
2,08
421
821
9TO
TAL
LOC
OM
OTI
VE
S23
4,48
617
7,69
953
1,44
567
4,81
31,
618,
443
1,61
8,44
321
9FR
EIG
HT
CA
RS
220
Adm
inis
tratio
n9,
824
5,33
213
,321
7,08
635
,563
N/A
35,5
6322
022
1*
Rep
air &
mai
nten
ance
141,
548
195,
598
75,6
1342
,227
454,
986
N/A
454,
986
221
222
*M
achi
nery
repa
ir16
671
419
21,
072
N/A
1,07
222
222
3E
quip
men
t dam
aged
8022
,311
22,3
91N
/A22
,391
223
224
Frin
ge b
enef
itsN
/AN
/AN
/A61
,194
61,1
94N
/A61
,194
224
225
Oth
er c
asua
lties
& in
sura
nce
N/A
N/A
N/A
1,70
21,
702
N/A
1,70
222
522
6*
Leas
e re
ntal
s - d
ebit
N/A
N/A
258,
255
258,
255
N/A
258,
255
226
227
*Le
ase
rent
als
- (cr
edit)
N/A
N/A
(72,
499)
N/A
(72,
499)
N/A
(72,
499)
227
228
Join
t fac
ility
rent
- de
bit
N/A
N/A
N/A
N/A
228
229
Join
t fac
ility
rent
- (c
redi
t)N
/AN
/AN
/AN
/A22
923
0*
Oth
er re
nts
- deb
itN
/AN
/A40
6,62
9N
/A40
6,62
9N
/A40
6,62
923
023
1*
Oth
er re
nts
- (cr
edit)
N/A
N/A
(93,
572)
N/A
(93,
572)
N/A
(93,
572)
231
232
*D
epre
ciat
ion
N/A
N/A
N/A
73,3
0073
,300
N/A
73,3
0023
223
3Jo
int f
acilit
y - d
ebit
N/A
N/A
N/A
N/A
233
234
Join
t fac
ility
- (cr
edit)
N/A
N/A
N/A
N/A
234
235
*R
epai
rs b
illed
to o
ther
s - (
cred
it)N
/AN
/A(1
99,4
83)
N/A
(199
,483
)N
/A(1
99,4
83)
235
236
Dis
man
tling
retir
ed p
rope
rtyN
/A23
623
7O
ther
1,17
720
292
1,48
9N
/A1,
489
237
238
TOTA
L FR
EIG
HT
CA
RS
151,
618
202,
821
388,
476
208,
112
951,
027
N/A
951,
027
238
OTH
ER
EQ
UIP
ME
NT
301
Adm
inis
tratio
n98
253
41,
333
708
3,55
73,
557
301
Rep
air &
mai
nten
ance
:30
2*
Truc
ks, t
raile
rs, &
con
tain
ers
- rev
enue
ser
vice
5,79
95,
799
N/A
5,79
930
230
3*
Fl
oatin
g eq
uipm
ent -
reve
nue
serv
ice
N/A
303
304
*
Pas
seng
er &
oth
er re
venu
e eq
uipm
ent
5,49
81,
447
6,94
56,
945
304
305
*
Com
pute
rs a
nd d
ata
proc
essi
ng e
quip
men
t1
11
305
306
*
Mac
hine
ry17
7119
107
107
306
307
*
Wor
k &
oth
er n
on-re
venu
e eq
uipm
ent
23,1
542,
218
11,1
8633
36,5
9136
,591
307
308
E
quip
men
t dam
aged
14,4
106,
917
21,3
2721
,327
308
309
Frin
ge b
enef
itsN
/AN
/AN
/A19
,522
19,5
2219
,522
309
310
Oth
er c
asua
lties
& in
sura
nce
N/A
N/A
N/A
545
545
545
310
311
*Le
ase
rent
als
- deb
itN
/AN
/A1,
364
N/A
1,36
41,
364
311
312
*Le
ase
rent
als
- (cr
edit)
N/A
N/A
N/A
312
44
Railroad Annual Report R-1
Road Initials: BNSF Year 2016

410.
RAI
LWAY
OPE
RAT
ING
EXP
ENSE
S - (
Con
tinue
d)(D
olla
rs in
Tho
usan
ds)
Mat
eria
l, to
ols,
Tota
lLi
neC
ross
Nam
e of
railw
ay o
pera
ting
expe
nse
acco
unt
Sal
arie
ssu
pplie
s, fu
els,
Pur
chas
edG
ener
alfre
ight
Pas
seng
erTo
tal
Line
No.
Che
ck&
Wag
es&
lubr
ican
tsse
rvic
esex
pens
eN
o.(a
)(b
)(c
)(d
)(e
)(f)
(g)
(h)
OTH
ER
EQ
UIP
ME
NT
(Con
tinue
d)31
3Jo
int f
acilit
y re
nt -
debi
tN
/AN
/AN
/A31
331
4Jo
int f
acilit
y re
nt -
(cre
dit)
N/A
N/A
N/A
314
315
Oth
er re
nts
- deb
itN
/AN
/AN
/A31
531
6O
ther
rent
s - (
cred
it)N
/AN
/AN
/A31
631
7D
epre
ciat
ion
N/A
N/A
N/A
91,8
1791
,817
91,8
1731
731
8Jo
int f
acilit
y - d
ebit
N/A
N/A
77N
/A77
7731
831
9Jo
int f
acilit
y - (
cred
it)N
/AN
/AN
/A31
932
0R
epai
rs b
illed
to o
ther
s - (
cred
it)N
/AN
/AN
/A32
032
1D
ism
antli
ng re
tired
pro
perty
321
322
Oth
er11
82
2914
914
932
232
3TO
TAL
OTH
ER
EQ
UIP
ME
NT
29,6
514,
389
34,1
9011
9,57
118
7,80
118
7,80
132
332
4TO
TAL
EQ
UIP
ME
NT
415,
755
384,
909
954,
111
1,00
2,49
62,
757,
271
2,75
7,27
132
4TR
AN
SP
OR
TATI
ON
TR
AIN
OP
ER
ATI
ON
S40
1A
dmin
istra
tion
101,
508
7,18
640
,187
14,5
2716
3,40
816
3,40
840
140
2E
ngin
e cr
ews
711,
077
72,9
0978
3,98
678
3,98
640
240
3Tr
ain
crew
s62
0,68
977
,283
697,
972
697,
972
403
404
Dis
patc
hing
trai
ns57
,003
(426
)56
,577
56,5
7740
440
5O
pera
ting
sign
als
& in
terlo
cker
s5,
733
5,73
35,
733
405
406
Ope
ratin
g dr
awbr
idge
s4,
510
4,51
04,
510
406
407
Hig
hway
cro
ssin
g pr
otec
tion
7,87
37,
873
7,87
340
740
8Tr
ain
insp
ectio
n &
lubr
icat
ion
68,2
0468
,204
68,2
0440
840
9Lo
com
otiv
e fu
el1,
772,
759
1,77
2,75
91,
772,
759
409
410
Ele
ctric
pow
er p
rodu
ced
or
pur
chas
ed fo
r mot
ive
pow
er41
041
1S
ervi
cing
loco
mot
ives
57,8
1120
1(6
,746
)51
,266
51,2
6641
141
2Fr
eigh
t los
t or d
amag
ed -
sole
ly re
late
dN
/AN
/AN
/A41
241
3C
lear
ing
wre
cks
45,0
9145
,091
45,0
9141
341
4Fr
inge
ben
efits
N/A
N/A
N/A
607,
067
607,
067
607,
067
414
415
Oth
er c
asua
lties
& in
sura
nce
N/A
N/A
N/A
62,0
6462
,064
62,0
6441
541
6Jo
int f
acilit
y - d
ebit
N/A
N/A
1,74
5N
/A1,
745
1,74
541
641
7Jo
int f
acilit
y - (
cred
it)N
/AN
/A(2
,528
)N
/A(2
,528
)(2
,528
)41
741
8O
ther
2,43
91,
274
680,
208
230
684,
151
684,
151
418
419
TOTA
L TR
AIN
OP
ER
ATI
ON
S1,
623,
241
1,78
1,42
092
1,32
968
3,88
85,
009,
878
5,00
9,87
841
9YA
RD
OP
ER
ATI
ON
S42
0A
dmin
istra
tion
20,3
021,
393
7,89
82,
947
32,5
4032
,540
420
421
Sw
itch
crew
s30
7,95
759
41,2
1934
9,23
534
9,23
542
1
Road Initials: BNSF Year 2016 45
Railroad Annual Report R-1

410.
RAI
LWAY
OPE
RAT
ING
EXP
ENSE
S - (
Con
tinue
d)(D
olla
rs in
Tho
usan
ds)
Mat
eria
l, to
ols,
Tota
lLi
neC
ross
Nam
e of
railw
ay o
pera
ting
expe
nse
acco
unt
Sal
arie
ssu
pplie
s, fu
els,
Pur
chas
edG
ener
alfre
ight
Pas
seng
erTo
tal
Line
No.
Che
ck&
Wag
es&
lubr
ican
tsse
rvic
esex
pens
eN
o.(a
)(b
)(c
)(d
)(e
)(f)
(g)
(h)
YAR
D O
PE
RA
TIO
NS
(Con
tinue
d)42
2C
ontro
lling
ope
ratio
ns43
,958
633
44,5
9144
,591
422
423
Yard
and
term
inal
cle
rical
9980
899
1,07
81,
078
423
424
Ope
ratin
g sw
itche
s, s
igna
ls, r
etar
ders
, & h
umps
324
324
324
424
425
Loco
mot
ive
fuel
57,4
6757
,467
57,4
6742
5
426
Ele
ctric
pow
er e
lect
ric p
ower
pro
duce
d or
p
urch
ased
for m
otiv
e po
wer
426
427
Ser
vici
ng lo
com
otiv
es9,
728
9,72
89,
728
427
428
Frei
ght l
ost o
r dam
aged
- so
lely
rela
ted
N/A
N/A
N/A
428
429
Cle
arin
g w
reck
s42
943
0Fr
inge
ben
efits
N/A
N/A
N/A
146,
044
146,
044
146,
044
430
431
Oth
er c
asua
lties
& in
sura
nce
N/A
N/A
N/A
14,5
9214
,592
14,5
9243
143
2Jo
int f
acilit
y - d
ebit
N/A
N/A
14,9
59N
/A14
,959
14,9
5943
243
3Jo
int f
acilit
y - (
cred
it)N
/AN
/AN
/A43
343
4O
ther
3019
822
822
843
443
5TO
TAL
YAR
D O
PE
RA
TIO
NS
382,
044
59,0
2966
,130
163,
583
670,
786
670,
786
435
TRA
IN &
YA
RD
OP
ER
ATI
ON
S C
OM
MO
N:
501
Cle
anin
g ca
r int
erio
rs2,
513
3,44
8N
/A5,
961
5,96
150
150
2A
djus
ting
& tr
ansf
errin
g lo
ads
2,55
3N
/A2,
553
N/A
2,55
350
250
3C
ar lo
adin
g de
vice
s &
gra
in d
ocks
N/A
N/A
503
504
Frei
ght l
ost o
r dam
aged
- al
l oth
erN
/AN
/AN
/A20
,554
20,5
5420
,554
504
505
Frin
ge b
enef
itsN
/AN
/AN
/A95
395
395
350
550
6TO
TAL
TRA
IN &
YA
RD
OP
ER
ATI
ON
S C
OM
MO
N:
2,51
36,
001
21,5
0730
,021
30,0
2150
6S
PE
CIA
LIZE
D S
ER
VIC
E O
PE
RA
TIO
NS
507
*A
dmin
istra
tion
7,61
450
92,
962
1,09
512
,180
N/A
12,1
8050
750
8*
Pic
kup
& d
eliv
ery
and
mar
ine
line
haul
33,3
3518
133
,516
N/A
33,5
1650
850
9*
Load
ing
& u
nloa
ding
and
loca
l mar
ine
15,6
2729
1,87
945
530
7,96
1N
/A30
7,96
150
951
0*
Pro
tect
ive
serv
ices
339
4,72
036
267
5,36
2N
/A5,
362
510
511
*Fr
eigh
t los
t or d
amag
ed -
sole
ly re
late
dN
/AN
/AN
/AN
/A51
151
2*
Frin
ge b
enef
itsN
/AN
/AN
/A2,
491
2,49
1N
/A2,
491
512
513
*C
asua
lties
& in
sura
nce
N/A
N/A
N/A
421
421
N/A
421
513
514
*Jo
int f
acilit
y - d
ebit
N/A
N/A
N/A
N/A
514
515
*Jo
int f
acilit
y - (
cred
it)N
/AN
/AN
/AN
/A51
551
6*
Oth
erN
/A51
651
7*
TOTA
L S
PE
CIA
LIZE
D S
ER
VIC
E O
PE
RA
TIO
NS
7,95
320
,856
328,
212
4,91
036
1,93
1N
/A36
1,93
151
7
Road Initials: BNSF Year 2016
Railroad Annual Report R-1
46

410.
RAI
LWAY
OPE
RAT
ING
EXP
ENSE
S - (
Con
tinue
d)(D
olla
rs in
Tho
usan
ds)
Mat
eria
l, to
ols,
Tota
lLi
neC
ross
Nam
e of
railw
ay o
pera
ting
expe
nse
acco
unt
Sal
arie
ssu
pplie
s, fu
els,
Pur
chas
edG
ener
alfre
ight
Pas
seng
erTo
tal
Line
No.
Che
ck&
Wag
es&
lubr
ican
tsse
rvic
esex
pens
eN
o.(a
)(b
)(c
)(d
)(e
)(f)
(g)
(h)
AD
MIN
ISTR
ATI
VE
sup
port
OP
ER
ATI
ON
S:
518
Adm
inis
tratio
n12
4,34
98,
310
48,3
7322
,219
203,
251
203,
251
518
519
Em
ploy
ees
perfo
rmin
g cl
eric
al &
acc
ount
ing
func
tions
8,26
227
42,
418
116
11,0
7011
,070
519
520
Com
mun
icat
ion
syst
ems
oper
atio
ns82
011
16,2
6517
,096
17,0
9652
052
1Lo
ss &
dam
age
clai
ms
proc
essi
ng52
152
2Fr
inge
ben
efits
N/A
N/A
N/A
41,6
9041
,690
41,6
9052
252
3C
asua
lties
& in
sura
nce
N/A
N/A
N/A
5,45
15,
451
5,45
152
352
4Jo
int f
acilit
y - d
ebit
N/A
N/A
N/A
524
525
Join
t fac
ility
- (cr
edit)
N/A
N/A
N/A
525
526
Oth
er67
767
767
752
652
7 T
OTA
L A
DM
INIS
TRA
TIV
E s
uppo
rt O
PE
RA
TIO
NS
133,
431
9,27
267
,056
69,4
7627
9,23
527
9,23
552
752
8 T
OTA
L TR
AN
SP
OR
TATI
ON
2,14
9,18
21,
870,
577
1,38
8,72
894
3,36
46,
351,
851
6,35
1,85
152
8G
EN
ER
AL
AN
D A
DM
INIS
TRA
TIV
E60
1O
ffice
rs -
gene
ral a
dmin
istra
tion
18,0
644,
203
71,2
3137
,476
130,
974
130,
974
601
602
Acc
ount
ing,
aud
iting
, & fi
nanc
e45
,854
426
9,01
430
055
,594
55,5
9460
260
3M
anag
emen
t ser
vice
s &
dat
a pr
oces
sing
41,8
4214
,637
141,
509
1,94
519
9,93
319
9,93
360
360
4M
arke
ting
34,1
7034
58,
656
7,79
850
,969
50,9
6960
460
5S
ales
34,1
7034
58,
451
7,79
850
,764
50,7
6460
560
6In
dust
rial d
evel
opm
ent
2,80
613
2,25
186
85,
938
N/A
5,93
860
660
7P
erso
nnel
& la
bor r
elat
ions
22,7
211,
355
24,0
7624
,076
607
608
Lega
l & s
ecre
taria
l20
,240
351
78,8
405,
376
104,
807
104,
807
608
609
Pub
lic re
latio
ns &
adv
ertis
ing
2,39
41,
993
2,15
510
,701
17,2
4317
,243
609
610
Res
earc
h &
dev
elop
men
t61
061
1Fr
inge
ben
efits
N/A
N/A
N/A
93,7
2193
,721
93,7
2161
161
2C
asua
lties
& in
sura
nce
N/A
N/A
N/A
1,26
51,
265
1,26
561
261
3W
rited
own
of u
ncol
lect
ible
acc
ount
sN
/AN
/AN
/A35
,849
35,8
4935
,849
613
614
Pro
perty
taxe
sN
/AN
/AN
/A34
9,37
934
9,37
934
9,37
961
461
5O
ther
taxe
s ex
cept
on
corp
orat
e in
com
e or
pay
roll
N/A
N/A
N/A
2828
2861
561
6Jo
int f
acilit
y - d
ebit
N/A
N/A
2,43
8N
/A2,
438
2,43
861
661
7Jo
int f
acilit
y - (
cred
it)N
/AN
/A(9
89)
N/A
(989
)(9
89)
617
618
Oth
er72
,788
3,08
015
,594
42,8
8113
4,34
313
4,34
361
861
9 T
OTA
L G
EN
ER
AL
AN
D A
DM
INIS
TRA
TIV
E29
5,04
925
,393
340,
505
595,
385
1,25
6,33
21,
256,
332
619
620
*TO
TAL
CA
RR
IER
OP
ER
ATI
NG
EXP
EN
SE
3,41
1,02
82,
433,
059
3,05
2,27
04,
165,
455
13,0
61,8
1213
,061
,812
620
Road Initials: BNSF Year 2016
Railroad Annual Report R-1
47
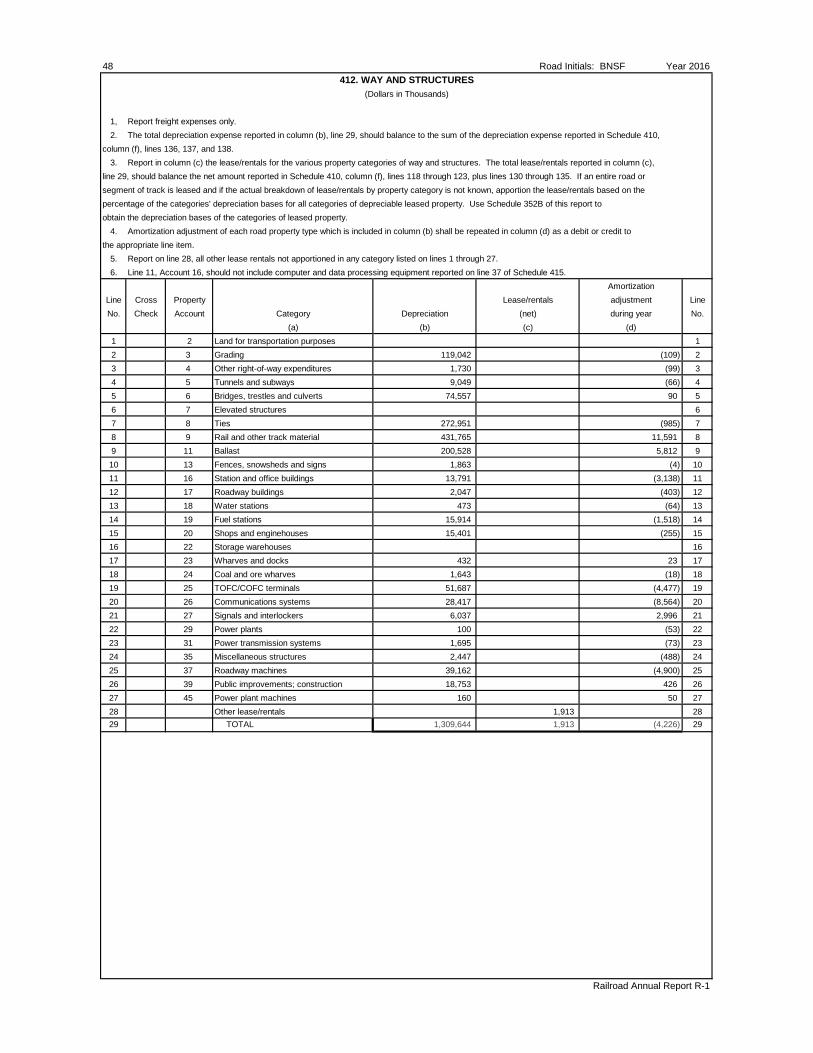
48 Road Initials: BNSF Year 2016412. WAY AND STRUCTURES
(Dollars in Thousands)
1, Report freight expenses only.2. The total depreciation expense reported in column (b), line 29, should balance to the sum of the depreciation expense reported in Schedule 410,
column (f), lines 136, 137, and 138.3. Report in column (c) the lease/rentals for the various property categories of way and structures. The total lease/rentals reported in column (c),
line 29, should balance the net amount reported in Schedule 410, column (f), lines 118 through 123, plus lines 130 through 135. If an entire road orsegment of track is leased and if the actual breakdown of lease/rentals by property category is not known, apportion the lease/rentals based on thepercentage of the categories' depreciation bases for all categories of depreciable leased property. Use Schedule 352B of this report toobtain the depreciation bases of the categories of leased property.
4. Amortization adjustment of each road property type which is included in column (b) shall be repeated in column (d) as a debit or credit tothe appropriate line item.
5. Report on line 28, all other lease rentals not apportioned in any category listed on lines 1 through 27.6. Line 11, Account 16, should not include computer and data processing equipment reported on line 37 of Schedule 415.
AmortizationLine Cross Property Lease/rentals adjustment LineNo. Check Account Category Depreciation (net) during year No.
(a) (b) (c) (d)1 2 Land for transportation purposes 12 3 Grading 119,042 (109) 23 4 Other right-of-way expenditures 1,730 (99) 34 5 Tunnels and subways 9,049 (66) 45 6 Bridges, trestles and culverts 74,557 90 56 7 Elevated structures 67 8 Ties 272,951 (985) 78 9 Rail and other track material 431,765 11,591 89 11 Ballast 200,528 5,812 910 13 Fences, snowsheds and signs 1,863 (4) 1011 16 Station and office buildings 13,791 (3,138) 1112 17 Roadway buildings 2,047 (403) 1213 18 Water stations 473 (64) 1314 19 Fuel stations 15,914 (1,518) 1415 20 Shops and enginehouses 15,401 (255) 1516 22 Storage warehouses 1617 23 Wharves and docks 432 23 1718 24 Coal and ore wharves 1,643 (18) 1819 25 TOFC/COFC terminals 51,687 (4,477) 1920 26 Communications systems 28,417 (8,564) 2021 27 Signals and interlockers 6,037 2,996 2122 29 Power plants 100 (53) 2223 31 Power transmission systems 1,695 (73) 2324 35 Miscellaneous structures 2,447 (488) 2425 37 Roadway machines 39,162 (4,900) 2526 39 Public improvements; construction 18,753 426 2627 45 Power plant machines 160 50 2728 Other lease/rentals 1,913 2829 TOTAL 1,309,644 1,913 (4,226) 29
Railroad Annual Report R-1
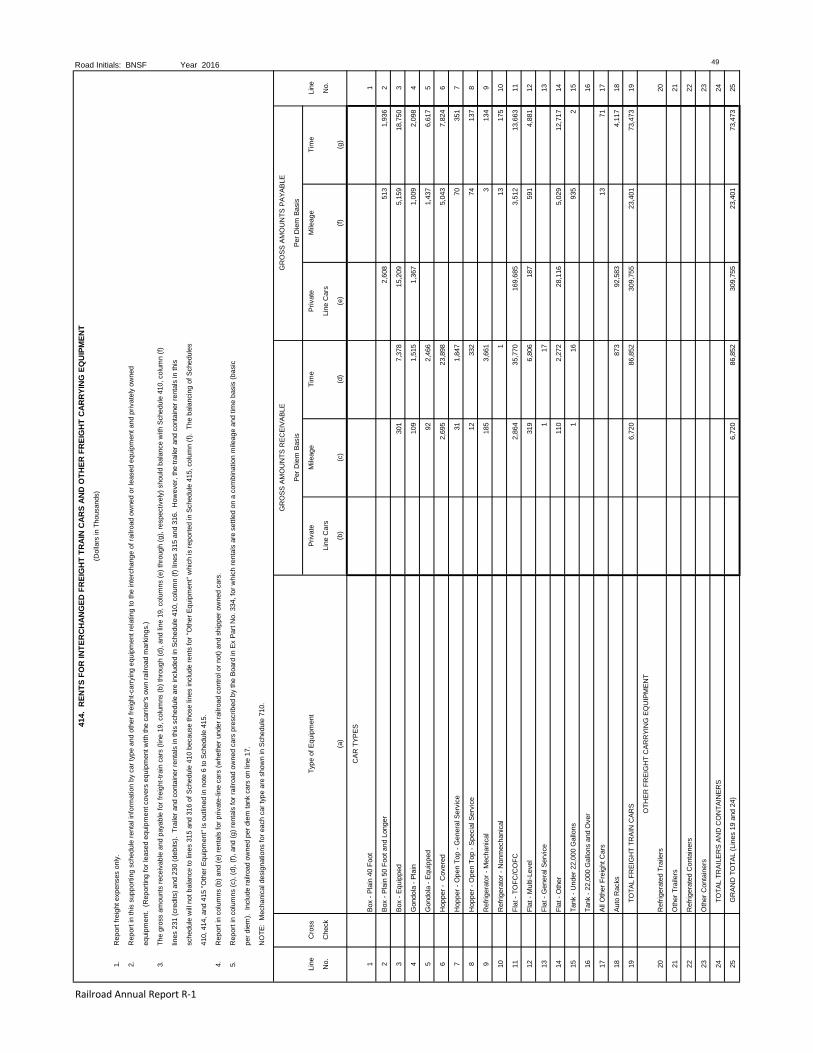
414.
REN
TS F
OR
INTE
RC
HA
NG
ED F
REI
GH
T TR
AIN
CA
RS
AN
D O
THER
FR
EIG
HT
CA
RR
YIN
G E
QU
IPM
ENT
(Dol
lars
in T
hous
ands
)
1.R
epor
t fre
ight
exp
ense
s on
ly.
2.R
epor
t in
this
sup
porti
ng s
ched
ule
rent
al in
form
atio
n by
car
type
and
oth
er fr
eigh
t-car
ryin
g eq
uipm
ent r
elat
ing
to th
e in
terc
hang
e of
railr
oad
owne
d or
leas
ed e
quip
men
t and
priv
atel
y ow
ned
equi
pmen
t. (R
epor
ting
for l
ease
d eq
uipm
ent c
over
s eq
uipm
ent w
ith th
e ca
rrie
r's o
wn
railr
oad
mar
king
s.)
3.Th
e gr
oss
amou
nts
rece
ivab
le a
nd p
ayab
le fo
r fre
ight
-trai
n ca
rs (l
ine
19, c
olum
ns (b
) thr
ough
(d),
and
line
19, c
olum
ns (e
) thr
ough
(g),
resp
ectiv
ely)
sho
uld
bala
nce
with
Sch
edul
e 41
0, c
olum
n (f)
lines
231
(cre
dits
) and
230
(deb
its).
Tra
iler a
nd c
onta
iner
rent
als
in th
is s
ched
ule
are
incl
uded
in S
ched
ule
410,
col
umn
(f) li
nes
315
and
316.
How
ever
, the
trai
ler a
nd c
onta
iner
rent
als
in th
is
sche
dule
will
not
bal
ance
to li
nes
315
and
316
of S
ched
ule
410
beca
use
thos
e lin
es in
clud
e re
nts
for "
Oth
er E
quip
men
t" w
hich
is re
porte
d in
Sch
edul
e 41
5, c
olum
n (f)
. Th
e ba
lanc
ing
of S
ched
ules
410,
414
, and
415
"Oth
er E
quip
men
t" is
out
lined
in n
ote
6 to
Sch
edul
e 41
5.
4.R
epor
t in
colu
mns
(b) a
nd (e
) ren
tals
for p
rivat
e-lin
e ca
rs (w
heth
er u
nder
railr
oad
cont
rol o
r not
) and
shi
pper
ow
ned
cars
.
5.R
epor
t in
colu
mns
(c),
(d),
(f), a
nd (g
) ren
tals
for r
ailro
ad o
wne
d ca
rs p
resc
ribed
by
the
Boar
d in
Ex
Part
No.
334
, for
whi
ch re
ntal
s ar
e se
ttled
on
a co
mbi
natio
n m
ileag
e an
d tim
e ba
sis
(bas
ic
per d
iem
). In
clud
e ra
ilroa
d ow
ned
per d
iem
tank
car
s on
line
17.
NO
TE:
Mec
hani
cal d
esig
natio
ns fo
r eac
h ca
r typ
e ar
e sh
own
in S
ched
ule
710.
GR
OSS
AM
OU
NTS
REC
EIVA
BLE
GR
OSS
AM
OU
NTS
PAY
ABLE
Per D
iem
Bas
isPe
r Die
m B
asis
Line
Cro
ssTy
pe o
f Equ
ipm
ent
Priv
ate
Mile
age
Tim
ePr
ivat
eM
ileag
eTi
me
Line
No.
Che
ckLi
ne C
ars
Line
Car
sN
o.
(a)
(b)
(c)
(d)
(e)
(f)(g
)
CAR
TYP
ES
1Bo
x - P
lain
40
Foot
1
2Bo
x - P
lain
50
Foot
and
Lon
ger
2,60
8
51
3
1,93
6
2
3Bo
x - E
quip
ped
301
7,
378
15,2
09
5,15
9
18
,750
3
4G
ondo
la -
Plai
n10
9
1,51
5
1,
367
1,00
9
2,
098
4
5G
ondo
la -
Equi
pped
92
2,46
6
1,
437
6,61
7
5
6H
oppe
r - C
over
ed2,
695
23,8
98
5,04
3
7,
824
6
7H
oppe
r - O
pen
Top
- Gen
eral
Ser
vice
31
1,84
7
70
35
1
7
8H
oppe
r - O
pen
Top
- Spe
cial
Ser
vice
12
332
74
13
7
8
9R
efrig
erat
or -
Mec
hani
cal
185
3,
661
3
13
4
9
10R
efrig
erat
or -
Non
mec
hani
cal
1
13
17
5
10
11Fl
at -
TOFC
/CO
FC2,
864
35,7
70
169,
685
3,51
2
13
,663
11
12Fl
at -
Mul
ti-Le
vel
319
6,
806
187
59
1
4,88
1
12
13Fl
at -
Gen
eral
Ser
vice
1
17
13
14Fl
at -
Oth
er11
0
2,27
2
28
,116
5,
029
12,7
17
14
15Ta
nk -
Und
er 2
2,00
0 G
allo
ns1
16
935
2
15
16Ta
nk -
22,0
00 G
allo
ns a
nd O
ver
16
17Al
l Oth
er F
reig
ht C
ars
13
71
17
18Au
to R
acks
873
92
,583
4,
117
18
19
TO
TAL
FREI
GH
T TR
AIN
CAR
S6,
720
86,8
52
309,
755
23,4
01
73,4
73
19
OTH
ER F
REI
GH
T C
ARR
YIN
G E
QU
IPM
ENT
20R
efrig
erat
ed T
raile
rs20
21O
ther
Tra
ilers
21
22R
efrig
erat
ed C
onta
iner
s22
23O
ther
Con
tain
ers
23
24
TO
TAL
TRAI
LER
S AN
D C
ON
TAIN
ERS
24
25
GR
AND
TO
TAL
(Lin
es 1
9 an
d 24
)6,
720
86,8
52
309,
755
23,4
01
73,4
73
25
Railroad Annual Report R‐1
Road Initials: BNSF Year 2016 49
50 Road Initials: BNSF Year 2016
Railroad Annual Report R-1
THIS PAGE INTENTIONALLY LEFT BLANK
NOTES AND REMARKS FOR SCHEDULE 414

Road Initials: BNSF Year 2016 51
GENERAL INSTRUCTIONS CONCERNING RETURNS TO BE MADE TO SCHEDULE 415
1. Report freight expenses only.
2. Report by type of equipment all natural expenses relating to equipment functions (salaries and wages, materials, tools, supplies, fuels and
lubricants, purchased services, and general).
3. Report in column (b) net repair expense, excluding the cost to repair damaged equipment.
Schedule 415, column (b) will balance to Schedule 410, column (f) as follows:
(a) Locomotives, line 5 plus line 38, compared to the sum of Schedule 410, lines 202, 203, and 216 (excluding wreck repairs). Do not
report in Schedule 415, Equipment Damaged from Schedule 410, line 204.
(b) Freight cars, line 24 plus line 39, compared to the sum of Schedule 410, lines 221, 222, and 235 (excluding wreck repairs). Do not
report in Schedule 415, Equipment Damaged from Schedule 410, line 223.
(c) Sum of highway equipment (line 32), floating equipment (line 35), passenger and other revenue equipment (line 36), computer and data
processing equipment (line 37), machinery-other equipment (line 40), and work and other non-revenue equipment (line 41), compared
to Schedule 410, the sum of lines 302 through 307, plus line 320 (excluding wreck repairs). Do not report in Schedule 415, equipment
damaged from Schedule 410, line 308.
Note: Lines 216, 235, and 320 of Schedule 410 are credit amounts.
The allocation of freight car repair expenses reportable on Schedule 415 by car types shall be in accordance with Instruction 2-21, Freight
train repair costing, 49 CFR 1201.
4. Depreciation expense for each class of equipment by car type shall be reported in columns (c) and (d). For improvements on leased
property, Accounts 732 and 733, use a supplementary Schedule 415, which will relate to Schedules 342.
Depreciation charges reported in columns (c) and (d) will balance to Schedule 410, column (f) as follows:
(a) Locomotives, lines 5 and 38, compared to Schedule 410, line 213.
(b) Freight cars, lines 24 and 39, compared to Schedule 410, line 232.
(c) Sum of highway equipment (line 32), floating equipment (line 35), passenger and other revenue equipment (line 36), computer and data
processing equipment (line 37), machinery-other equipment (line 40), and work and other non-revenue equipment (line 41), compared
to Schedule 410, line 317.
5. Amortization adjustment of each equipment type which is included in column (c) shall be reported in column (e) as a debit or credit to the
appropriate line item. The net adjustment on line 43 shall equal the equipment amortization adjustment applicable to equipment used in
freight service included in line 39, column (c), of Schedule 335.
6. Lease/rentals reported in column (f) should balance to column (f) of Schedule 410 as follows:
(a) Locomotives, lines 5 and 38, compared to Schedule 410, lines 207, 208, 211, and 212.
(b) Freight cars, lines 24 and 39, compared to Schedule 410, lines 226 and 227 (note that Schedule 410, lines 230 and 231, are reported in
Schedule 415, and are not included in Schedule 415).
(c) Sum of lease/rentals for all other equipment, lines 32, 35, 36, 37, 40, and 41, will balance to Schedule 410, lines 311, 312, 315, and 316,
except for the interchange rental on trailers and containers which is reported in Schedule 414. Therefore, both Schedules 414 and 415
should be used when balancing lease/rentals other equipment to Schedule 410. Do not report in Schedule 415, the trailer and
container rentals reported in Schedule 414.
7. Investment base by types of equipment shall be reported in columns (g) and (h) and should not include the cost of equipment used but not
owned when rents therefore are included in the rent for equipment and Account Nos. 31-21-00, 31-22-00, 31-23-00, 35-21-00, 35-22-00,
and 35-23-00. It should include the cost of equipment owned and leased to others when the rents are included in the rent for Equipment
Account Nos. 32-21-00, 32-22-00, 32-23-00, 36-21-00, 36-22-00, and 36-23-00.
Property used but not owned should also be included when the rent is included in Account Nos. 31-12-00, 31-13-00, 31-21-00, 31-22-00,
and 31-23-00, inclusive.
The grand total of each equipment account in column (h) of Schedule 330 should equal the totals of line items constituting the
equipment account totals of columns (g) and (h) of Schedule 415.
8. Accumulated depreciation for each class of equipment shall be reported in columns (i) and (j). The grand total of each equipment reserve
account in column (g), Schedule 335, shall equal the combined aggregate total accumulated depreciation for line items constituting the
corresponding equipment accounts reported in columns (i) and (j), on Schedule 415.
Railroad Annual Report R-1

52 Road Initials: BNSF Year 2016
415. SUPPORTING SCHEDULE - EQUIPMENT
(Dollars in Thousands)
Depreciation Amortization
Line Cross Types of equipment Repairs Owned Capitalized Adjustment net Line
No. Check (net expense) lease during year No.
(a) (b) (c) (d) (e)
LOCOMOTIVES
1 Diesel Locomotives - Yard 1
2 Diesel Locomotives - Road 635,426 527,994 34,018 (41,244) 2
3 Other Locomotives - Yard 3
4 Other Locomotives - Road 4
5 * TOTAL LOCOMOTIVES 635,426 527,994 34,018 (41,244) 5
FREIGHT TRAIN CARS
6 Box - Plain 40 foot 2 (215) (264) 6
7 Box - Plain 50 foot and longer 144 156 190 7
8 Box - Equipped 20,938 4,785 1,395 8
9 Gondola - Plain 36,708 2,546 (283) 9
10 Gondola - Equipped 13,382 1,989 (927) 10
11 Hopper - Covered 79,821 12,652 3,172 (237) 11
12 Hopper - Open Top - General Service 3,050 1,598 (673) 12
13 Hopper - Open Top - Special Service 15,183 2,400 207 (35) 13
14 Refrigerator - Mechanical 1,904 14
15 Refrigerator - Nonmechanical 1,693 3,051 1,192 15
16 Flat - TOFC/COFC 23,088 5,069 3,026 (47) 16
17 Flat - Multi-level 9,497 807 1,670 (327) 17
18 Flat - General Service 104 (35) (88) 18
19 Flat - Other 13,426 1,542 926 19
20 All Other Freight Cars 35,637 839 (86) 20
21 Cabooses 96 (245) (335) 21
22 Auto Racks 7,902 524 22
23 Miscellaneous Accessories 830 16,446 860 23
24 * TOTAL FREIGHT TRAIN CARS 255,503 61,287 8,075 1,785 24
OTHER EQUIPMENT - REVENUE FREIGHT
HIGHWAY EQUIPMENT
25 Refrigerated Trailers 25
26 Other Trailers 4,703 26
27 Refrigerated Containers 27
28 Other Containers 23 28
29 Bogies 29
30 Chassis 1,073 432 (232) 30
31 Other Highway Equipment (Freight) 31
32 * TOTAL HIGHWAY EQUIPMENT 5,799 432 - (232) 32
FLOATING EQUIPMENT - REVENUE SERVICE
33 Marine Line-Haul 33
34 Local Marine 34
35 * TOTAL FLOATING EQUIPMENT 35
OTHER EQUIPMENT
36 Passenger & Other Revenue Equipment 36
* (Freight Portion) 6,945
37 * Computer Systems & Word Processing Equip. 1 65,065 280 684 37
38 * Machinery - Locomotives (1) 1,500 5,513 (1,064) 38
39 * Machinery - Freight Cars (2) 1,072 3,938 (760) 39
40 * Machinery - Other Equipment (3) 107 394 (76) 40
41 * Work and Other Nonrevenue Equipment 36,591 24,955 691 (1,716) 41
42 TOTAL OTHER EQUIPMENT 46,216 99,865 971 (2,932) 42
43 TOTAL ALL EQUIPMENT (FREIGHT PORTION) 942,944 689,578 43,064 (42,623) 43
(1) Data reported on line 38, column (b) is the amount reported in Sched. 410, column (f), line 203, reduced by the allocable portion of line 216.
(2) Data reported on line 39, column (b) is the amount reported in Sched. 410, column (f), line 222, reduced by the allocable portion of line 235.
(3) Data reported on line 40, column (b) is the amount reported in Sched. 410, column (f), line 306, reduced by the allocable portion of line 320.
Railroad Annual Report R-1

Road Initials: BNSF Year 2016 53
415. SUPPORTING SCHEDULE - EQUIPMENT - (Continued)
Line Cross Lease & rentals Owned Capitalized Owned Capitalized Line
No. Check (net) lease lease No.
(f) (g) (h) (i) (j)
1 1
2 260,043 7,878,920 459,254 1,994,624 157,421 2
3 3
4 4
5 * 260,043 7,878,920 459,254 1,994,624 157,421 5
6 13 (11) 6
7 7
8 8,578 93,136 7,723 8
9 103,046 12,187 9
10 28,231 78,104 15,221 10
11 60,972 494,814 132,958 45,551 24,179 11
12 69,071 16,194 12
13 21,391 98,131 9,065 7,596 1,769 13
14 14
15 8,358 51,298 8,309 15
16 25,335 156,827 93,675 10,592 21,819 16
17 36,279 66,479 3,274 11,204 17
18 1,133 287 18
19 11,038 19,758 4,453 19
20 2,025 9,678 2,134 20
21 7,972 2,756 21
22 19,828 142,196 10,931 22
23 189,033 29,902 23
24 * 185,756 1,550,489 302,177 177,099 58,971 24
25 25
26 26
27 27
28 28
29 29
30 1,364 7,364 (2,699) 30
31 31
32 * 1,364 7,364 (2,699) 32
33 33
34 34
35 * 35
36 36
*
37 * 939,688 1,209 500,640 724 37
38 * 134,233 40,952 38
39 * 95,880 29,251 39
40 * 9,588 2,925 40
41 * 887,020 7,830 90,615 691 41
42 2,066,409 9,039 664,383 1,415 42
43 447,163 11,503,182 770,470 2,833,407 217,807 43
(1) Data reported on lines 38, 39, and 40 in columns (g) and (h) are investment recorded in property account 44, allocated to
locomotives, freight cars, and other equipment.
(2) Depreciation reported on lines 38, 39, and 40 in column (c) is calculated by multiplying the investment in each element by the
effective composite rate for property account 44, and then adding or subtracting the adjustment reported in column (e).
This calculation should equal the amount shown in column (c), Schedule 335.
Railroad Annual Report R-1
Accumulated depreciation as of 12/31Investment base as of 12/31

417.
SPE
CIA
LIZE
D S
ERVI
CE
SUB
SCH
EDU
LE -
TRAN
SPO
RTA
TIO
N
54
(Dol
lars
in T
hous
ands
)1.
Rep
ort f
reig
ht e
xpen
ses
only
.2.
Rep
ort i
n lin
es 1
, 2, 3
, 4, a
nd 1
0 th
e to
tal o
f tho
se n
atur
al e
xpen
ses
(sal
arie
s an
d w
ages
, mat
eria
l, to
ols,
sup
plie
s, fu
els
and
lubr
ican
ts, p
urch
ased
ser
vice
s, a
nd g
ener
al) i
ncur
red
in th
e op
erat
ion
of e
ach
type
of s
peci
aliz
ed s
ervi
ce fa
cilit
y. T
his
sche
dule
doe
s no
t inc
lude
sw
itchi
ng s
ervi
ces
perfo
rmed
by
train
and
yar
d cr
ews
in c
onne
ctio
n w
ith o
r with
in s
peci
aliz
ed s
ervi
ce fa
cilit
ies.
3.W
hen
it is
nec
essa
ry to
app
ortio
n ex
pens
es, s
uch
as a
dmin
istra
tive
expe
nses
to tw
o or
mor
e se
rvic
es, t
hey
shal
l be
appo
rtion
ed o
n th
e m
ost e
quita
ble
basi
s av
aila
ble
to th
e re
spon
dent
and
onl
y to
the
ser
vice
s th
ey s
uppo
rt. T
he to
tal e
xpen
ses
in c
olum
n (j)
sho
uld
bala
nce
with
the
resp
ectiv
e lin
e ite
ms
in S
ched
ule
410,
Rai
lway
Ope
ratin
g E
xpen
ses.
4.R
epor
t in
colu
mn
(b),
line
2, th
e ex
pens
es in
curre
d in
hig
hway
mov
emen
ts o
f tra
ilers
and
con
tain
ers
perfo
rmed
at t
he e
xpen
se o
f the
repo
rting
railr
oad
with
in a
term
inal
are
a fo
r the
pur
pose
of p
ick-
up,
del
iver
y, o
r hig
hway
inte
rcha
nge
serv
ice.
Rep
ort i
n co
lum
n (b
), lin
e 3,
the
expe
nses
incu
rred
in o
pera
ting
faci
litie
s fo
r han
dlin
g tra
ilers
and
/or c
onta
iner
s, in
clud
ing
stor
age
expe
nses
. S
ee S
ched
ule
755,
not
e R
.5.
The
oper
atio
n of
floa
ting
equi
pmen
t in
line-
haul
ser
vice
(bet
wee
n di
stin
ct te
rmin
als)
sho
uld
be re
porte
d in
col
umn
(c) o
n lin
e 2.
. Fl
oatin
g op
erat
ions
con
duct
ed w
ithin
a g
ener
al te
rmin
al o
r har
bor a
rea
sho
uld
be re
porte
d in
col
umn
(c),
line
3.6.
Rep
ort i
n co
lum
n (g
), lin
e 3,
the
expe
nses
incu
rred
by th
e ra
ilroa
d in
load
ing
and
unlo
adin
g au
tom
obile
s, tr
ucks
, etc
., to
and
from
bi-l
evel
and
tri-l
evel
aut
o ra
ck c
ars.
Rep
ort o
n lin
e 2,
col
umn
(g),
the
expe
nse
incu
rred
by th
e ra
ilroa
d in
mov
ing
auto
mob
iles,
etc
., be
twee
n bi
-leve
l and
tri-l
evel
load
ing
and
unlo
adin
g fa
cilit
ies
over
the
high
way
to s
hipp
ers,
rece
iver
s, o
r con
nect
ing
carri
ers.
Rep
ort i
n c
olum
n (f)
ope
ratin
g ex
pens
es fo
r lan
d fa
cilit
ies
in s
uppo
rt of
floa
ting
oper
atio
ns, i
nclu
ding
the
oper
atio
n of
doc
ks a
nd w
harv
es.
7.R
epor
t on
line
4, c
olum
n (b
), th
e ex
pens
es re
latin
g to
hea
ting
and
refri
gera
tion
of T
OFC
/CO
FC tr
aile
rs a
nd c
onta
iner
s (to
tal d
ebits
and
cre
dits
). T
he e
xpen
ses
on li
ne 4
, col
umn
(h) r
elat
e to
refri
gera
tor
car
s on
ly.
8.R
epor
t in
colu
mn
(i) to
tal e
xpen
ses
incu
rred
in p
erfo
rmin
g ra
il su
bstit
ute
serv
ice,
oth
er h
ighw
ay re
venu
e se
rvic
e, L
CL
term
inal
ope
ratio
ns, w
areh
ouse
ope
ratio
ns, f
reig
ht c
ar tr
ansl
oadi
ng, g
rain
ele
vato
r ter
min
al o
pera
tions
, and
live
stoc
k fe
edin
g op
erat
ions
onl
y.
Coa
lO
reO
ther
Mot
or v
ehic
leP
rote
ctiv
eO
ther
Tota
lLi
neC
ross
Item
sTO
FC/C
OFC
Floa
ting
mar
ine
mar
ine
mar
ine
load
&se
rvic
essp
ecia
lco
lum
nsLi
neN
o.C
heck
term
inal
equi
pmen
tte
rmin
alte
rmin
alte
rmin
aldi
strib
utio
nre
frige
rato
r car
serv
ices
(b) -
(i)
No.
(a)
(b)
(c)
(d)
(e)
(f)(g
)(h
)(i)
(j)1
*A
dmin
istra
tion
10,7
7216
1,21
717
512
,180
12
*P
ick
up a
nd d
eliv
ery,
mar
ine
line
haul
33,3
3518
1N
/A33
,516
23
*Lo
adin
g an
d un
load
ing
and
loca
l mar
ine
273,
554
467
33,9
40N
/A30
7,96
13
4*
Pro
tect
ive
serv
ices
- to
tal d
ebits
and
cre
dits
4257
54,
745
5,36
24
5*
Frei
ght l
ost o
r dam
aged
- so
lely
rela
ted
56
*Fr
inge
ben
efits
2,16
929
230
2,49
16
7*
Cas
ualty
and
insu
ranc
e42
142
17
8*
Join
t fac
ility
- de
bit
89
*Jo
int f
acilit
y - c
redi
t(
)(
)(
)(
)(
)(
)(
)(
)(
)9
10*
Oth
er10
11*
T
OTA
L32
0,29
377
535
,913
4,95
036
1,93
111
Road Initials: BNSF Year 2016
Railroad Annual Report R-1

Road Initials: BNSF Year 2016 55
450. ANALYSIS OF TAXES
(Dollars in Thousands)
A. Railway Taxes
Line Cross Line
No. Check Kind of Tax Amount No.
1 Other than U.S. Government Taxes 565,672 1
U.S. Government Taxes
Income Taxes
2 Normal Tax and Surtax 1,360,221 2
3 Excess Profits 3
4 * Total - Income Taxes (Lines 2 and 3) 1,360,221 4
5 Railroad Retirement 666,599 5
6 Hospital Insurance 57,298 6
7 Supplemental Annuities 7
8 Unemployment Insurance 16,183 8
9 All Other United States Taxes 9
10 Total - U.S. Government Taxes 2,100,301 10
11 Total - Railway Taxes 2,665,973 11
B. Adjustments to Federal Income Taxes
1. In column (a) are listed the particulars which most often cause a differential between taxable income and pretax accounting income. Other
particulars which cause such a differential should be listed under the caption "Other (Specify)," including state and other taxes deferred if
computed separately. Minor items, each less than $100,000, may be combined in a single entry under "Other (Specify)."
2. Indicate in column (b) the beginning of year totals of Accounts 714, 744, 762, and 786 applicable to each particular item in column (a).
3. Indicate in column (c) the net changes in Accounts 714, 744, 762, and 786 for the net tax effect of timing differences originating and
reversing in the current accounting period.
4. Indicate in column (d) any adjustments, as appropriate, including adjustments to eliminate or reinstate deferred tax effects (credits or debits)
due to applying or recognizing a loss carry-forward or a loss carry-back.
5. The total of line 19 in columns (c) and (d) should agree with the total of the contra charges (credits) to Account 557, Provision for Deferred
Taxes, and Account 591, Provision for Deferred Taxes - Extraordinary Items, for the current year.
6. Indicate in column (e) the cumulative total of columns (b), (c), and (d). The total of column (e) must agree with the total of Accounts 714,
744, 762, and 786.
Net credits
Line Particulars Beginning of (charges) for Adjustments End of Line
No. year balance current year year balance No.
(a) (b) (c) (d) (e)
1 Deferred debits: 1
2 Accrued liabilities not deductible until paid: 2
3 Casualty and Environmental Costs (287,728) 50,256 - (237,472) 3
4 Postretirement Benefits (125,715) (8,170) 44,710 (89,175) 4
5 Compensation and Benefits (326,605) (5,449) - (332,054) 5
6 Intangible Liabilities (99,662) 27,376 - (72,286) 6
7 Long-term debt fair value adjustment under acquisition accounting (16,679) 9,142 - (7,537) 7
8 Other (219,862) (70,752) 533 (290,081) 8
9 Subtotal (1,076,251) 2,403 45,243 (1,028,605) 9
10 Deferred tax credits: 10
11 Depreciation and Amortization 19,646,247 981,269 (3,817) 20,623,699 11
12 Other 366,694 2,045 (16) 368,723 12
13 Subtotal 20,012,941 983,314 (3,833) 20,992,422 13
14 14
15 15
16 16
17 17
18 18
19 TOTALS 18,936,690 985,717 41,410 19,963,817 19
Railroad Annual Report R-1

56 Road Initials: BNSF Year 2016
450. ANALYSIS OF TAXES
(Dollars in Thousands)
* Footnotes:
1. If the flow-through method was elected, indicate the net decrease (or increase) in tax accrual because of
investment tax credit. 0
If the deferral method for investment tax credit was elected:
(1) Indicate amount of credit utilized as a reduction of tax liability for current year N/A
(2) Deduct the amount of the current year's credit applied to reduction of tax liability but deferred for
accounting purposes N/A
(3) Balance of current year's credit used to reduce current year's tax accrual N/A
(4) Add amount of prior year's deferred credits being amortized to reduce current year's tax accrual N/A
(5) Total decrease in current year's tax accrual resulting from use of investment tax credits N/A
2. Estimated amount of future earnings which can be realized before paying Federal income taxes because of unused
and available net operating loss carryover on January 1 of the year following that for which the report is made 0
Notes and Remarks:
Adjustment is to reflect income taxes on balance sheet adjustment which, in accordance with
generally accepted accounting principles, are not reflected in Railway income tax expense.
Minimum pension liability 58,091$
Postretirement benefits (13,381)
FIN 48 (3,284)
Other (16)
Total 41,410$
Railroad Annual Report R-1

57
501. GUARANTIES AND SURETYSHIPS (Dollars in Thousands)
1. If the respondent was under obligation as guarantor or surety for the performance by any other corporation or association of any agreement or obligation, show the particulars of each contract of guarantee or suretyship in effect at the close of the year or entered into and expired during the year. This inquiry does not cover the case of ordinary commercial paper maturing on demand or not later than two years after the date of issue. Items of less than $50,000 may be shown as one total.
Line Names of all parties principally Description Amount of Sole or joint LineNo. and primarily liable contingent liability contingent liability No.
(a) (b) (c) (d)1 Terminal Railroad Association of St Louis 12 BNSF Railway Company Sinking Fund and Interest 7,014 Joint (Note 1) 23 CSX Transportation, Inc. on Refunding and Improvement 34 Canadian National Railway Company Mortgage Bonds Series C 45 Norfolk and Southern Railway Company due 7/1/2019 56 Union Pacific Railroad Company 67 78 89 Kinder Morgan Energy Partners, L.P. 190,000 Sole (Note 2) 910 BNSF Railway Company 1011 1112 1213 Tate & Lyle Ingredients Americas, LLC Bridge Funding 601 Sole (Note 3) 1314 1415 1516 Chevron Phillips Chemical Company LP Trackage Access Indemnity N/A Sole (Note 4) 1617 1718 1819 1920 Note 1: Terminal Railroad Association of St. Louis Mortgage Bonds are fully funded by TRRA through a sinking fund with a balance 2021 of approximately $22 million as of December 31, 2016. BNSF is jointly and severally liable with CSX, CN, NS, and UP for the Sinking Fund. 2122 This fund covers future interest and principal payments through the remainder of the bonds' term. 2223 Note 2: Santa Fe Pacific Pipelines, Inc (SFPP) , an indirect, wholly-owned subsidiary of BNSF Railway Company, has a guarantee in 2324 connection with its remaining special limited partnership interest in SFPP, L.P. All obligations with respect to the guarantee will cease upon 2425 termination of ownership rights which would occur upon a put notice issued by BNSF Railway Company or the exercise of the call rights by 2526 the general partners of SFPP, L.P. The company has recorded a $2 million liability for the fair value of the guarantee as of December 31, 2627 2016 2728 Note 3: This guarantee expires in 2023. It is secured by a letter of credit established in January 2014 and issued on behalf of Tate & Lyle 2829 for $700 thousand, the maximum amount of the loan. 2930 Note 4: BNSF has an indemnity agreement with Chevron Phillips Chemical Company LP (Chevron Phillips), granting certain rights of 3031 indemnity from BNSF, in order to facilitate access to a storage facility. Under certain circumstances, payment under this obligation may 3132 be required in the event Chevron Phillips were to incur certain liabilities or other incremental costs resulting from trackage access. 3233 The company has recorded a $22 million asset and corresponding liability for the fair value of these guarantees as required by 3334 authoritative accounting guidance related to guarantees. 34
2. If any corporation or other association was under obligation as guarantor or surety for the performance by the respondent of any agreement or obligation, show the particulars called for hereunder for each such contract of guaranty or suretyship in effect at the close of the year or entered into and expired during the year. This inquiry does not cover the case of ordinary commercial paper maturing on demand or not later than two years after the date of issue, nor does it include ordinary surety bonds or undertakings on appeals in court proceedings.
Finance docket number, titleLine maturity date and concise descrip- Names of all Amount of contingent Sole or joint LineNo. tion of agreement or obligation guarantors and sureties liability of guarantors contingent liability No.
(a) (b) (c) (d)1 12 23 None 34 45 56 67 78 89 9
Railroad Annual Report R-1
Road Initials: BNSF Year 2016
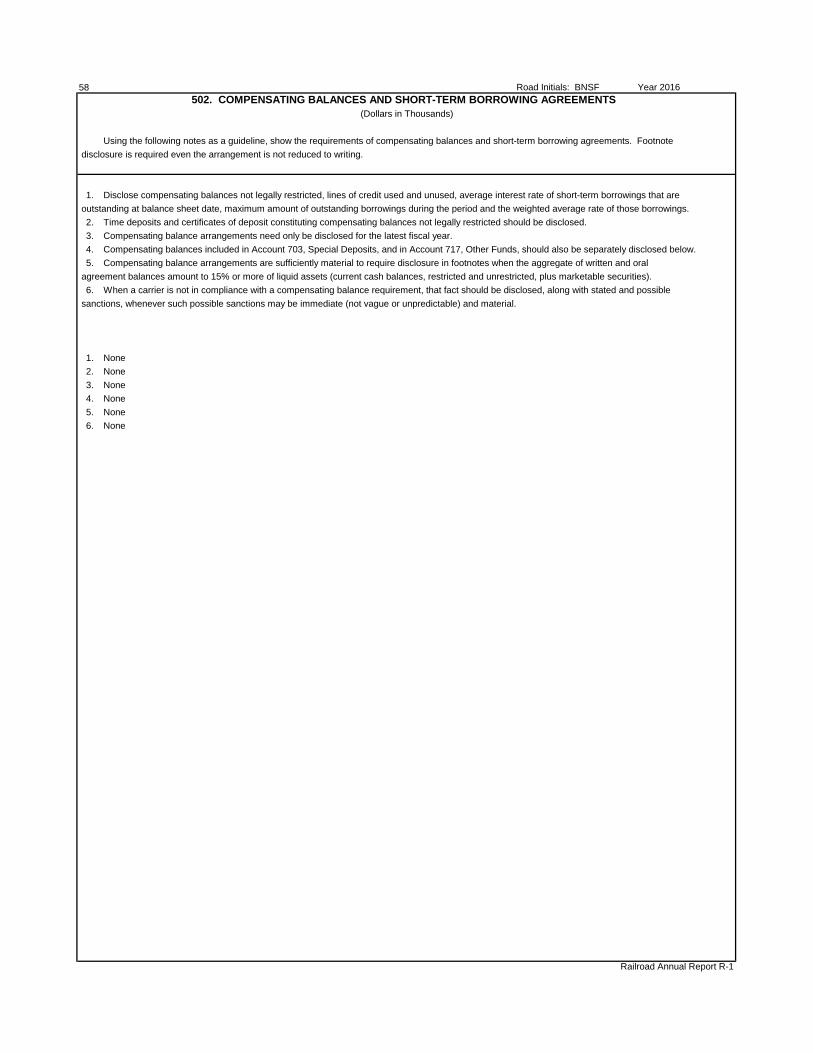
58502. COMPENSATING BALANCES AND SHORT-TERM BORROWING AGREEMENTS
(Dollars in Thousands)
Using the following notes as a guideline, show the requirements of compensating balances and short-term borrowing agreements. Footnote disclosure is required even the arrangement is not reduced to writing.
1. Disclose compensating balances not legally restricted, lines of credit used and unused, average interest rate of short-term borrowings that are outstanding at balance sheet date, maximum amount of outstanding borrowings during the period and the weighted average rate of those borrowings.
2. Time deposits and certificates of deposit constituting compensating balances not legally restricted should be disclosed.3. Compensating balance arrangements need only be disclosed for the latest fiscal year.4. Compensating balances included in Account 703, Special Deposits, and in Account 717, Other Funds, should also be separately disclosed below.5. Compensating balance arrangements are sufficiently material to require disclosure in footnotes when the aggregate of written and oral
agreement balances amount to 15% or more of liquid assets (current cash balances, restricted and unrestricted, plus marketable securities).6. When a carrier is not in compliance with a compensating balance requirement, that fact should be disclosed, along with stated and possible
sanctions, whenever such possible sanctions may be immediate (not vague or unpredictable) and material.
1. None2. None3. None4. None5. None6. None
Railroad Annual Report R-1
Road Initials: BNSF Year 2016

Road Initials: BNSF Year 2016510. SEPARATION OF DEBTHOLDINGS BETWEEN ROAD PROPERTY AND EQUIPMENT
(Dollars in Thousands)
The principal use of this schedule is to determine the average rate of debt capital.
I. Debt Outstanding at End of Year
Line Account Title Source BalanceNo. No. Close of Year
(a) (b) (c) (d)1 751 Loans and notes payable Sch 200, Line 292 764 Equipment obligations and other long-term debt due within one year Sch 200, Line 38 84,8313 765/767 Funded debt unmatured Sch 200, Line 40 491,2814 766 Equipment obligations Sch 200, Line 41 497,3445 766.5 Capitalized lease obligations Sch 200, Line 42 480,9426 768 Debt in default Sch 200, Line 437 769 Accounts payable - affiliated companies Sch 200, Line 448 770.1/770.2 Unamortized debt premium Sch 200, Line 459 Total debt Sum of Lines 1 through 8 1,554,39810 Debt directly related to road property Note 1 281,05511 Debt directly related to equipment Note 1 1,047,95712 Total debt related to road and equipment Lines 10 and 11 1,329,01213 Percent directly related to road Line 10 /Line 12
Whole % + 2 decimals 21.15%14 Percent directly related to equipment Line 11 /Line 12
Whole % + 2 decimals 78.85%15 Debt not directly related to road and equipment Line 9 - Line 12 225,38616 Road property debt (Note 2) (Line 13 x Line 15) + Line 10 328,724 17 Equipment debt (Note 2) (Line 14 x Line 15) + Line 11 1,225,674
II. Interest Accrued During the Year
Line Account Title Source BalanceNo. No. Close of Year
(a) (b) (c) (d)18 546-548 Total interest and amortization (fixed charges) Sch. 210, Line 42 49,55719 546 Contingent interest on funded debt Sch. 210, Line 4420 517 Release of premium on funded debt Sch. 210, Line 2221 Total interest (Note 3) (Line 18 + Line 19) - Line 20 49,55722 Interest directly related to road property debt Note 4 14,67223 Interest directly related to equipment debt Note 4 41,14324 Interest not directly related to road or equipment property debt Line 21 - (Lines 22 + 23) (6,258)25 Interest on road property debt (Note 5) Line 22 + (Line 24 x Line 13) 13,34826 Interest on equipment debt (Note 5) Line 23 + (Line 24 x Line 14) 36,20927 Embedded rate of debt capital - road property Line 25 / Line 16 4.06%28 Embedded rate of debt capital - equipment Line 26 / Line 17 2.95%
Note 1: Directly related means the purpose which the funds were used for when the debt was issued.Note 2: Line 16 plus Line 17 must equal Line 9.Note 3: Line 21 includes interest on debt in Account 769 - Accounts Payable; Affiliated Companies, if applicable.Note 4: This interest relates to debt reported on Lines 10 and 11, respectively.Note 5: Line 25 plus Line 26 must equal Line 21.Note 6: Line 24 includes capitalized interest.
Railroad Annual Report R-1
59

INST
RU
CTI
ON
S C
ON
CER
NIN
G R
ETU
RN
S TO
BE
MA
DE
IN S
CH
EDU
LE 5
12
1.Fu
rnis
h th
e in
form
atio
n ca
lled
for b
elow
bet
wee
n th
e re
spon
dent
and
the
affil
iate
d co
mpa
nies
3.In
col
umn
(b) i
ndic
ate
the
natu
re o
f the
rela
tions
hip
or c
ontro
l bet
wee
n th
e re
spon
dent
and
the
or p
erso
ns a
ffilia
ted
with
the
resp
onde
nt, i
nclu
ding
offi
cers
, dire
ctor
s, s
tock
hold
ers,
ow
ners
, c
ompa
ny o
r per
son
iden
tifie
d in
col
umn
(a) a
s fo
llow
s: p
artn
ers,
or t
heir
wiv
es a
nd o
ther
clo
se re
lativ
es, o
r the
ir ag
ents
. E
xam
ples
of t
rans
actio
ns a
re, b
ut a
re n
ot re
stric
ted
to, m
anag
emen
t, le
gal,
acco
untin
g, p
urch
asin
g, o
r oth
er ty
pes
of s
ervi
ce
(a)
If re
spon
dent
dire
ctly
con
trols
the
affil
iate
, ins
ert t
he w
ord
"dire
ct."
incl
udin
g th
e fu
rnis
hing
of m
ater
ials
, sup
plie
s, p
urch
ase
of e
quip
men
t, le
asin
g of
stru
ctur
es, l
and
and
equ
ipm
ent,
and
agre
emen
ts re
latin
g to
allo
catio
n of
offi
cers
' sal
arie
s an
d ot
her c
omm
on c
osts
(b)
If re
spon
dent
con
trols
thro
ugh
anot
her c
ompa
ny, i
nser
t the
wor
d "in
dire
ct."
bet
wee
n af
filia
ted
com
pani
es.
(c)
If re
spon
dent
is u
nder
com
mon
con
trol w
ith a
ffilia
te, i
nser
t the
wor
d "c
omm
on."
To b
e ex
clud
ed a
re p
aym
ents
for t
he fo
llow
ing
type
s of
ser
vice
s:(d
) If
resp
onde
nt is
con
trolle
d di
rect
ly o
r ind
irect
ly b
y th
e co
mpa
ny li
sted
in c
olum
n (a
),
(a)
Law
ful t
ariff
cha
rges
for t
rans
porta
tion
serv
ices
.in
sert
the
wor
d "c
ontro
lled.
"
(
b) P
aym
ents
to o
r fro
m o
ther
car
riers
for i
nter
line
serv
ices
and
inte
rcha
nge
of e
quip
men
t.(e
) If
cont
rol i
s ex
erci
sed
by o
ther
mea
ns, s
uch
as a
man
agem
ent c
ontra
ct o
r oth
erar
rang
emen
t of w
hate
ver k
ind,
inse
rt th
e w
ord
"oth
er" a
nd p
rovi
de a
foot
note
to d
escr
ibe
(
c) P
aym
ent t
o or
from
oth
er c
arrie
rs w
hich
may
reas
onab
ly b
e re
gard
ed a
s or
dina
rily
such
arra
ngem
ents
.co
nnec
ted
with
rout
ine
oper
atio
n or
mai
nten
ance
, but
any
spe
cial
or u
nusu
al tr
ansa
ctio
ns
shou
ld b
e re
porte
d.4.
In c
olum
n (c
), fu
lly d
escr
ibe
the
trans
actio
ns in
volv
ed s
uch
as m
anag
emen
t fee
s, le
ase
of b
uild
ing,
pur
chas
e of
mat
eria
l, et
c. W
hen
the
affil
iate
list
ed in
col
umn
(a) p
rovi
des
mor
e th
an o
ne
(d)
Pay
men
ts to
pub
lic u
tility
com
pani
es fo
r rat
es o
r cha
rges
fixe
d in
con
form
ity w
ith ty
pe o
f ser
vice
in c
olum
n (c
), lis
t eac
h ty
pe o
f ser
vice
sep
arat
ely
and
show
the
tota
l for
the
gove
rnm
ent a
utho
rity.
affi
liate
. W
hen
serv
ices
are
bot
h pr
ovid
ed a
nd re
ceiv
ed b
etw
een
resp
onde
nt a
nd a
n af
filia
te th
ey s
houl
d be
list
ed s
epar
atel
y an
d th
e am
ount
s sh
own
sepa
rate
ly in
col
umn
(e).
2.In
col
umn
(a) e
nter
the
nam
e of
the
affil
iate
d co
mpa
ny, p
erso
n, o
r age
nt w
ith w
hich
resp
onde
nt re
ceiv
ed o
r pro
vide
d se
rvic
es a
ggre
gatin
g $5
0,00
0 or
mor
e du
ring
the
year
. If
an a
ffilia
ted
5.In
col
umn
(d),
repo
rt th
e do
llar a
mou
nts
of tr
ansa
ctio
ns s
how
n an
d th
e ef
fect
of a
ny c
hang
e c
ompa
ny p
rovi
des
serv
ices
to m
ore
than
one
affi
liate
, and
the
aggr
egat
e co
mpe
nsat
ion
amou
nts
in th
e m
etho
d of
est
ablis
hing
the
term
s fro
m th
at u
sed
in th
e pr
eced
ing
perio
d. to
$50
,000
or m
ore
for t
he y
ear,
list a
ll th
e af
filia
tes
incl
uded
in th
e ag
reem
ent a
nd d
escr
ibe
the
allo
catio
n of
cha
rges
. If
the
resp
onde
nt p
rovi
des
serv
ices
to m
ore
than
one
affi
liate
, and
the
6.In
col
umn
(e),
repo
rt th
e do
llar a
mou
nts
due
from
or t
o re
late
d pa
rties
and
, if n
ot o
ther
wis
e a
ggre
gate
com
pens
atio
n am
ount
s to
$50
,000
or m
ore
for t
he y
ear,
refe
renc
e to
this
fact
sho
uld
app
aren
t, th
e te
rms
and
man
ner o
f set
tlem
ent.
Inse
rt (P
) for
pai
d or
(R) f
or re
ceiv
ed b
y th
e b
e m
ade
and
the
deta
il as
to th
e al
loca
tion
of c
harg
es s
houl
d be
sta
ted.
For
thos
e af
filia
tes
am
ount
in c
olum
n (e
). p
rovi
ding
ser
vice
s to
the
resp
onde
nt, a
lso
ente
r in
colu
mn
(a) t
he p
erce
nt o
f affi
liate
's g
ross
inco
me
deriv
ed fr
om tr
ansa
ctio
ns w
ith re
spon
dent
.
The
resp
onde
nt m
ay b
e re
quire
d to
furn
ish
as a
n at
tach
men
t to
Sch
edul
e 51
2 a
bala
nce
shee
t a
nd in
com
e st
atem
ent f
or e
ach
affil
iate
with
whi
ch re
spon
dent
car
rier h
ad re
porta
ble
tran
sact
ions
dur
ing
the
year
, or a
ltern
ativ
ely,
atta
ch a
"Pro
For
ma"
bal
ance
she
et a
nd in
com
e s
tate
men
t for
that
por
tion
or e
ntity
of e
ach
affil
iate
whi
ch fu
rnis
hed
the
agre
ed to
ser
vice
s, e
quip
men
t, or
oth
er re
porta
ble
trans
actio
n. T
he s
tate
men
ts, i
f req
uire
d, s
houl
d be
pre
pare
d o
n a
cale
ndar
yea
r bas
is in
con
form
ity w
ith th
e pr
escr
ibed
sch
edul
es fo
r the
bal
ance
she
et a
nd in
com
e st
atem
ent i
n th
is A
nnua
l Rep
ort F
orm
R-1
, and
sho
uld
be n
oted
(1) t
o in
dica
te th
e m
etho
d u
sed
for d
epre
ciat
ing
equi
pmen
t or o
ther
pro
perty
furn
ishe
d to
the
carri
er, a
nd (2
) whe
ther
the
affi
liate
's F
eder
al in
com
e ta
x re
turn
for t
he y
ear w
as fi
led
on a
con
solid
ated
bas
is w
ith th
e re
spon
dent
car
rier.
60
Railroad Annual Report R-1
Road Initials: BNSF Year 2016

(Dol
lars
in T
hous
ands
)
Nam
e of
com
pany
or r
elat
edA
mou
nt d
ue fr
omLi
nepa
rty w
ith p
erce
nt%
Nat
ure
of re
latio
nshi
pD
escr
iptio
n of
Dol
lar a
mou
nts
or to
rela
ted
Line
No.
of g
ross
inco
me
trans
actio
nsof
tran
sact
ions
parti
esN
o.(a
)(b
)(c
)(d
)(e
)1
Bur
lingt
on N
orth
ern
San
ta F
e, L
LCC
ontro
lled
Ser
vice
s R
ende
red
9,01
8
30
8,41
9
1
22
3Fr
eigh
twis
e, In
cC
omm
on-
(6
39)
34
45
BN
SF
Insu
ranc
e C
o, L
td87
%C
omm
onIn
sura
nce
Pre
miu
ms
69,8
92
2,68
0
5
6C
laim
s P
aid
68,6
97
See
abo
ve6
77
8B
NS
F Lo
gist
ics,
LLC
Com
mon
Ser
vice
s R
ende
red
217
78
7
89
910
BN
SF
Logi
stic
s In
tern
atio
nal,
Inc
Com
mon
Ser
vice
s R
ende
red
153
(7
95)
1011
1112
Ber
kshi
re H
atha
way
Inc.
Con
trolle
dS
tock
Opt
ion
Exe
rcis
es-
(3
8,96
2)
1213
1314
1415
1516
1617
1718
1819
1920
2021
2122
2223
2324
2425
25
61
512.
TR
AN
SAC
TIO
NS
BET
WEE
N R
ESPO
ND
ENT
AN
D C
OM
PAN
IES
OR
PER
SON
S A
FFIL
IATE
D W
ITH
RES
PON
DEN
T FO
R S
ERVI
CES
REC
EIVE
D O
R P
RO
VID
ED
Railroad Annual Report R-1
Railroad Initials: BNSF Year 2016

62 Road Initials: BNSF Year 2016
INSTRUCTIONS CONCERNING RETURNS TO BE MADE IN SCHEDULE 700
State particulars of all tracks operated by the respondent at the close of the year, according to the following classifications:
(1) Line owned by respondent.
(2) Line owned by proprietary companies.
(3) Line operated under lease for a specified sum, lessor being (A) an affiliated corporation, or (B) independent or not affiliated with the
respondent.
(4) Line operated under contract or agreement for contingent rent, owner being (A) an affiliated corporation, or (B) independent or not
affiliated with the respondent.
(5) Line operated under trackage rights.
Give subtotals for each of the several numbered classes, in the order listed above, as well as the total for all classes.
Lengths of track should be reported to the nearest WHOLE mile adjusted to accord with footings; i.e., counting one-half mile or over as a whole
mile and disregarding any fraction less than one-half mile.
In Column (a) insert the figure (and letter, if any) indicating its class in accordance with the above list of classifications.
In Column (b) give the various proportions of each class owned or leased by respondent, listing each proportion once in any grouping.
Canadian mileage should be segregated and identified on separate lines in the various groupings. For each listing, in Column (d) give its entire
length (the distances between terminals of single or first main track), and in the following columns the lengths of second main track, all other main
tracks, passing tracks, cross-overs and turn-outs, way switching tracks, and yard switching tracks. These classes of tracks are defined as follows:
RUNNING TRACKS - Running tracks, passing tracks, cross-overs, etc., including turn-outs from those tracks to clearance points.
WAY SWITCHING TRACKS - Station, team, industry, and other switching tracks for which no separate service is maintained.
YARD SWITCHING TRACKS - Yard where separate switching services are maintained, including classification, house, team, industry, and other
tracks switched by yard locomotives.
The returns in Columns (h) and (i) should include tracks serving industries, such as mines, mills, smelters, factories, etc. Tracks belonging to an
industry for which no rent is payable should not be included.
Tracks leading to and in gravel and sand pits and quarries, the cost of which is chargeable to a clearing account and which are used in getting
out material for the respondent's use, should not be included,
Class (1) includes all lines operated by the respondent at the close of the year to which it has title in perpetuity.
Class (2) includes each line, full title to which is in an inactive proprietary corporation of the respondent (i.e., one all of whose outstanding
stocks or obligations are held by or for the respondent, and which is operated by the respondent or an affiliated system corporation without any
accounting to the said proprietary corporation). It may also include such line when the actual title to all of the outstanding stocks or obligations
rests in a corporation controlled by or controlling the respondent. But in the case of any such inclusion, the facts of the relationship to the
respondent of the corporation holding the securities should be fully set forth in a footnote. An inactive corporation is one which has been
practically absorbed in a controlling corporation, and which neither operates property nor administers its financial affairs. If it maintains an
organization, it does so only for the purpose of complying with legal requirements and maintaining title to property or franchises.
Class (3) includes all tracks operated under a lease or formal conveyance of less than the grantor's interest in the property, with a specific
and unconditional rent reserved. The fact that the lessor does or does not maintain an independent organization for financial purposes is
immaterial in this connection.
Class (4) is the same as Class (3), except that the rent reserved is conditional upon earnings or some other fact.
Class (5) includes all tracks operated and maintained by others, but over which the respondent has the right to operate some or all of its
trains. In the road of this class, the respondent has no proprietary rights, but only the rights of a licensee. Include in this class, also, on main
tracks, industrial tracks and sidings owned by noncarrier companies and individuals when the respondent operates over them but does not have
exclusive possession of them.
Road held by respondent as a joint or common owner or a joint lessee or under any joint arrangement should be shown in its appropriate class
and the entry of length should be the entire length of the portion jointly held. The class symbol should have the letter (J) attached.
Road operated by the respondent as an agent for another carrier should not be included in this schedule.
Railroad Annual Report R-1

Road Initials: BNSF Year 2016 63
700. MILEAGE OPERATED AT CLOSE OF YEAR
Running tracks, passing tracks, cross-overs, etc.
Proportion Miles of
owned or Miles Miles of Miles of passing tracks, Miles of Miles of
Line Class leased by of second all other cross-overs, way switching yard switching TOTAL Line
No. respondent road main track main tracks and turnouts tracks tracks No.
(a) (b) (c) (d) (e) (f) (g) (h) (i)
1 1 100% 22,559 4,819 311 2,171 4,827 4,327 39,014 1
2 1J 75% 0 0 0 0 0 1 1 2
3 1J 66.70% 0 0 0 0 2 15 17 3
4 1J 50% 474 106 102 23 106 42 853 4
5 1J 33.30% 0 0 0 0 1 4 5 5
6 1J 25% 6 10 35 2 12 0 65 6
7 1J 20% 0 0 0 0 0 0 0 7
8 1J 16.7% 0 0 0 0 0 0 0 8
9 Total 1J 480 116 137 25 121 62 941 9
10 10
11 Total 1 and 1J 23,039 4,935 448 2,196 4,948 4,389 39,955 11
12 12
13 2 4 0 0 0 5 0 9 13
14 3 26 0 0 3 2 111 142 14
15 4 32 0 0 0 2 0 34 15
16 5 9,274 415 77 76 2,880 253 12,975 16
17 17
57 Grand Total 32,375 5,350 525 2,275 7,837 4,753 53,115 57
58 Miles of electrified road 58
or track included in the NONE NONE NONE NONE NONE NONE NONE
preceding grand total
Running tracks, passing tracks, cross-overs, etc.
Proportion Miles of
owned or Miles Miles of Miles of passing tracks, Miles of Miles of
Line Class leased by of second all other cross-overs, way switching yard switching TOTAL Line
No. respondent road main track main tracks and turnouts tracks tracks No.
(a) (b) (c) (d) (e) (f) (g) (h) (i)
1 1 100% 23 0 0 5 12 7 47 1
2 1J 50% 0 0 0 0 6 0 6 2
3 Total 1 and 1J 23 0 0 5 18 7 53 3
4 2 4 0 0 0 5 0 9 4
5 5 87 4 0 3 42 0 136 557 114 4 0 8 65 7 198 57
Railroad Annual Report R-1
700. CANADIAN MILEAGE OPERATED AT THE CLOSE OF YEAR (INCLUDED IN SCHEDULE 700 ABOVE)
Grand Total Canadian Miles
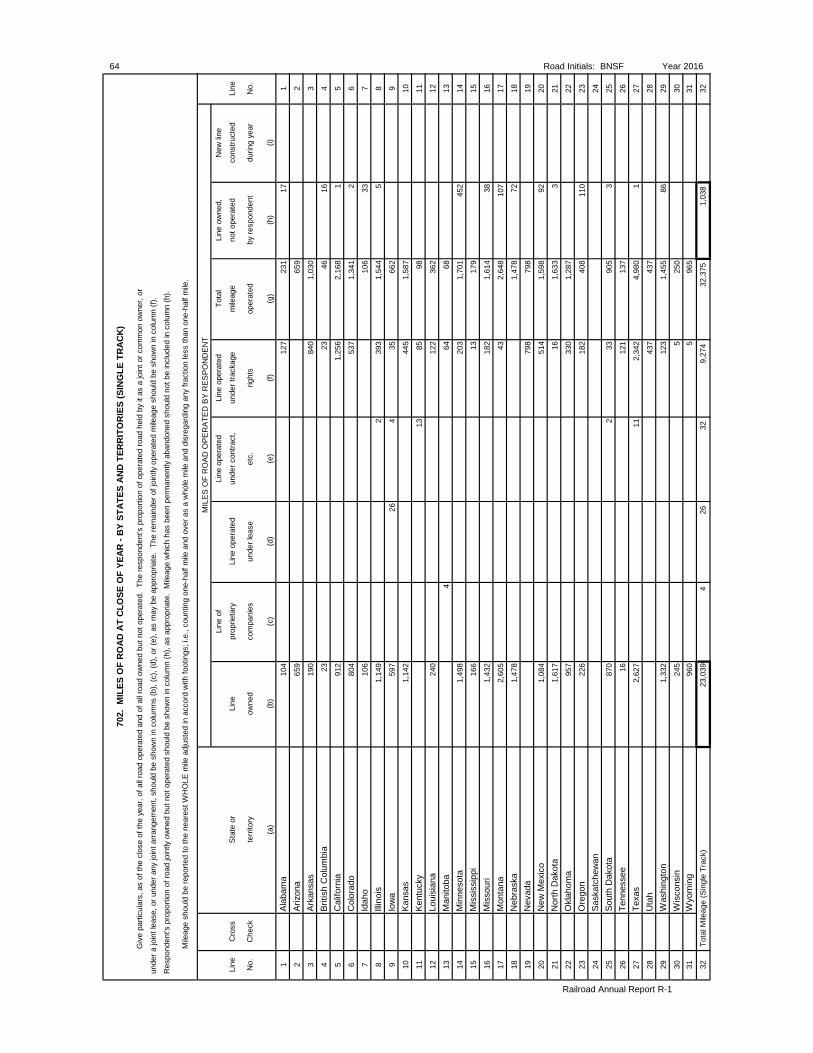
Giv
e pa
rticu
lars
, as
of th
e cl
ose
of th
e ye
ar, o
f all
road
ope
rate
d an
d of
all
road
ow
ned
but n
ot o
pera
ted.
The
resp
onde
nt's
pro
porti
on o
f ope
rate
d ro
ad h
eld
by it
as
a jo
int o
r com
mon
ow
ner,
or
und
er a
join
t lea
se, o
r und
er a
ny jo
int a
rrang
emen
t, sh
ould
be
show
n in
col
umns
(b),
(c),
(d),
or (e
), as
may
be
appr
opria
te.
The
rem
aind
er o
f joi
ntly
ope
rate
d m
ileag
e sh
ould
be
show
n in
col
umn
(f).
Res
pond
ent's
pro
porti
on o
f roa
d jo
intly
ow
ned
but n
ot o
pera
ted
shou
ld b
e sh
own
in c
olum
n (h
), as
app
ropr
iate
. M
ileag
e w
hich
has
bee
n pe
rman
ently
aba
ndon
ed s
houl
d no
t be
incl
uded
in c
olum
n (h
).
Mile
age
shou
ld b
e re
porte
d to
the
near
est W
HO
LE m
ile a
djus
ted
in a
ccor
d w
ith fo
otin
gs; i
.e.,
coun
ting
one-
half
mile
and
ove
r as
a w
hole
mile
and
dis
rega
rdin
g an
y fra
ctio
n le
ss th
an o
ne-h
alf m
ile.
MIL
ES
OF
RO
AD
OP
ER
ATE
D B
Y R
ES
PO
ND
EN
T
Line
of
Line
ope
rate
dLi
ne o
pera
ted
Tota
lLi
ne o
wne
d,N
ew li
ne
Line
Cro
ssS
tate
or
Line
prop
rieta
ryLi
ne o
pera
ted
unde
r con
tract
,un
der t
rack
age
mile
age
not o
pera
ted
cons
truct
edLi
ne
No.
Che
ckte
rrito
ryow
ned
com
pani
esun
der l
ease
etc.
right
sop
erat
edby
resp
onde
ntdu
ring
year
No.
(a)
(b)
(c)
(d)
(e)
(f)(g
)(h
)(i)
1Al
abam
a10
412
723
117
1
2Ar
izon
a65
965
92
3Ar
kans
as19
084
01,
030
3
4Br
itish
Col
umbi
a23
2346
164
5C
alifo
rnia
912
1,25
62,
168
15
6C
olor
ado
804
537
1,34
12
6
7Id
aho
106
106
337
8Illi
nois
1,14
92
393
1,54
45
8
9Io
wa
597
264
3566
29
10Ka
nsas
1,14
244
51,
587
10
11Ke
ntuc
ky13
8598
11
12Lo
uisi
ana
240
122
362
12
13M
anito
ba4
6468
13
14M
inne
sota
1,49
820
31,
701
452
14
15M
issi
ssip
pi16
613
179
15
16M
isso
uri
1,43
218
21,
614
3816
17M
onta
na2,
605
432,
648
107
17
18N
ebra
ska
1,47
81,
478
7218
19N
evad
a79
879
819
20N
ew M
exic
o1,
084
514
1,59
892
20
21N
orth
Dak
ota
1,61
716
1,63
33
21
22O
klah
oma
957
330
1,28
722
23O
rego
n22
618
240
811
023
24Sa
skat
chew
an24
25So
uth
Dak
ota
870
233
905
325
26Te
nnes
see
1612
113
726
27Te
xas
2,62
711
2,34
24,
980
127
28U
tah
437
437
28
29W
ashi
ngto
n1,
332
123
1,45
586
29
30W
isco
nsin
245
525
030
31W
yom
ing
960
596
531
32 T
otal
Mile
age
(Sin
gle
Trac
k)23
,039
426
329,
274
32,3
751,
038
32
702.
MIL
ES O
F R
OAD
AT
CLO
SE O
F YE
AR -
BY
STAT
ES A
ND
TER
RIT
OR
IES
(SIN
GLE
TR
ACK
)
64 Road Initials: BNSF Year 2016
Railroad Annual Report R-1
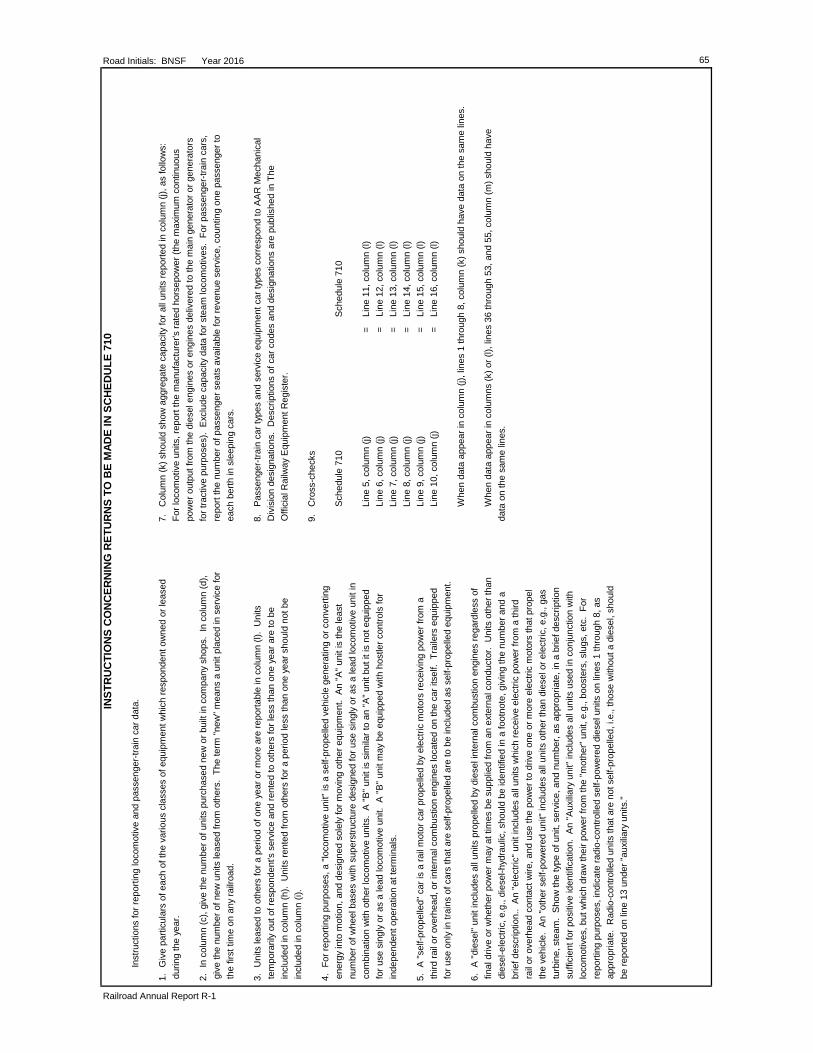
INST
RU
CTI
ON
S C
ON
CER
NIN
G R
ETU
RN
S TO
BE
MAD
E IN
SC
HED
ULE
710
Inst
ruct
ions
for r
epor
ting
loco
mot
ive
and
pass
enge
r-tra
in c
ar d
ata.
1.G
ive
parti
cula
rs o
f eac
h of
the
vario
us c
lass
es o
f equ
ipm
ent w
hich
resp
onde
nt o
wne
d or
leas
ed7.
Col
umn
(k) s
houl
d sh
ow a
ggre
gate
cap
acity
for a
ll un
its re
porte
d in
col
umn
(j), a
s fo
llow
s: d
urin
g th
e ye
ar.
For
loco
mot
ive
units
, rep
ort t
he m
anuf
actu
rer's
rate
d ho
rsep
ower
(the
max
imum
con
tinuo
us p
ower
out
put f
rom
the
dies
el e
ngin
es o
r eng
ines
del
iver
ed to
the
mai
n ge
nera
tor o
r gen
erat
ors
2.In
col
umn
(c),
give
the
num
ber o
f uni
ts p
urch
ased
new
or b
uilt
in c
ompa
ny s
hops
. In
col
umn
(d),
for
trac
tive
purp
oses
). E
xclu
de c
apac
ity d
ata
for s
team
loco
mot
ives
. Fo
r pas
seng
er-tr
ain
cars
, g
ive
the
num
ber o
f new
uni
ts le
ased
from
oth
ers.
The
term
"new
" mea
ns a
uni
t pla
ced
in s
ervi
ce fo
r r
epor
t the
num
ber o
f pas
seng
er s
eats
ava
ilabl
e fo
r rev
enue
ser
vice
, cou
ntin
g on
e pa
ssen
ger t
o t
he fi
rst t
ime
on a
ny ra
ilroa
d. e
ach
berth
in s
leep
ing
cars
.
3.U
nits
leas
ed to
oth
ers
for a
per
iod
of o
ne y
ear o
r mor
e ar
e re
porta
ble
in c
olum
n (l)
. U
nits
8.P
asse
nger
-trai
n ca
r typ
es a
nd s
ervi
ce e
quip
men
t car
type
s co
rresp
ond
to A
AR
Mec
hani
cal
tem
pora
rily
out o
f res
pond
ent's
ser
vice
and
rent
ed to
oth
ers
for l
ess
than
one
yea
r are
to b
e D
ivis
ion
desi
gnat
ions
. D
escr
iptio
ns o
f car
cod
es a
nd d
esig
natio
ns a
re p
ublis
hed
in T
he i
nclu
ded
in c
olum
n (h
). U
nits
rent
ed fr
om o
ther
s fo
r a p
erio
d le
ss th
an o
ne y
ear s
houl
d no
t be
Offi
cial
Rai
lway
Equ
ipm
ent R
egis
ter.
inc
lude
d in
col
umn
(i).
9.C
ross
-che
cks
4.Fo
r rep
ortin
g pu
rpos
es, a
"loc
omot
ive
unit"
is a
sel
f-pro
pelle
d ve
hicl
e ge
nera
ting
or c
onve
rting
ene
rgy
into
mot
ion,
and
des
igne
d so
lely
for m
ovin
g ot
her e
quip
men
t. A
n "A
" uni
t is
the
leas
tS
ched
ule
710
Sch
edul
e 71
0 n
umbe
r of w
heel
bas
es w
ith s
uper
stru
ctur
e de
sign
ed fo
r use
sin
gly
or a
s a
lead
loco
mot
ive
unit
in c
ombi
natio
n w
ith o
ther
loco
mot
ive
units
. A
"B" u
nit i
s si
mila
r to
an "A
" uni
t but
it is
not
equ
ippe
dLi
ne 5
, col
umn
(j)=
Li
ne 1
1, c
olum
n (l)
for
use
sin
gly
or a
s a
lead
loco
mot
ive
unit.
A "B
" uni
t may
be
equi
pped
with
hos
tler c
ontro
ls fo
rLi
ne 6
, col
umn
(j)=
Li
ne 1
2, c
olum
n (l)
ind
epen
dent
ope
ratio
n at
term
inal
s.Li
ne 7
, col
umn
(j)=
Li
ne 1
3, c
olum
n (l)
Line
8, c
olum
n (j)
=
Line
14,
col
umn
(l)5.
A "s
elf-p
rope
lled"
car
is a
rail
mot
or c
ar p
rope
lled
by e
lect
ric m
otor
s re
ceiv
ing
pow
er fr
om a
Li
ne 9
, col
umn
(j)=
Li
ne 1
5, c
olum
n (l)
thi
rd ra
il or
ove
rhea
d, o
r int
erna
l com
bust
ion
engi
nes
loca
ted
on th
e ca
r its
elf.
Tra
ilers
equ
ippe
d Li
ne 1
0, c
olum
n (j)
=
Line
16,
col
umn
(l) f
or u
se o
nly
in tr
ains
of c
ars
that
are
sel
f-pro
pelle
d ar
e to
be
incl
uded
as
self-
prop
elle
d eq
uipm
ent.
Whe
n da
ta a
ppea
r in
colu
mn
(j), l
ines
1 th
roug
h 8,
col
umn
(k) s
houl
d ha
ve d
ata
on th
e sa
me
lines
.6.
A "d
iese
l" un
it in
clud
es a
ll un
its p
rope
lled
by d
iese
l int
erna
l com
bust
ion
engi
nes
rega
rdle
ss o
f f
inal
driv
e or
whe
ther
pow
er m
ay a
t tim
es b
e su
pplie
d fro
m a
n ex
tern
al c
ondu
ctor
. U
nits
oth
er th
anW
hen
data
app
ear i
n co
lum
ns (k
) or (
l), li
nes
36 th
roug
h 53
, and
55,
col
umn
(m) s
houl
d ha
ve d
iese
l-ele
ctric
, e.g
., di
esel
-hyd
raul
ic, s
houl
d be
iden
tifie
d in
a fo
otno
te, g
ivin
g th
e nu
mbe
r and
a d
ata
on th
e sa
me
lines
. b
rief d
escr
iptio
n..
An
"ele
ctric
" uni
t inc
lude
s al
l uni
ts w
hich
rece
ive
elec
tric
pow
er fr
om a
third
rai
l or o
verh
ead
cont
act w
ire, a
nd u
se th
e po
wer
to d
rive
one
or m
ore
elec
tric
mot
ors
that
pro
pel
the
veh
icle
. A
n "o
ther
sel
f-pow
ered
uni
t" in
clud
es a
ll un
its o
ther
than
die
sel o
r ele
ctric
, e.g
., ga
s t
urbi
ne, s
team
. S
how
the
type
of u
nit,
serv
ice,
and
num
ber,
as a
ppro
pria
te, i
n a
brie
f des
crip
tion
suf
ficie
nt fo
r pos
itive
iden
tific
atio
n. A
n "A
uxili
ary
unit"
incl
udes
all
units
use
d in
con
junc
tion
with
loc
omot
ives
, but
whi
ch d
raw
thei
r pow
er fr
om th
e "m
othe
r" u
nit,
e.g.
, boo
ster
s, s
lugs
, etc
. Fo
r r
epor
ting
purp
oses
, ind
icat
e ra
dio-
cont
rolle
d se
lf-po
wer
ed d
iese
l uni
ts o
n lin
es 1
thro
ugh
8, a
s a
ppro
pria
te.
Rad
io-c
ontro
lled
units
that
are
not
sel
f-pro
pelle
d, i.
e., t
hose
with
out a
die
sel,
shou
ld b
e re
porte
d on
line
13
unde
r "au
xilia
ry u
nits
."
65
Railroad Annual Report R-1
Road Initials: BNSF Year 2016

710.
INVE
NTO
RY
OF
EQU
IPM
ENT
UN
ITS
OW
NED
, IN
CLU
DED
IN IN
VEST
MEN
T AC
CO
UN
T, A
ND
LEA
SED
FR
OM
OTH
ERS
Cha
nges
Dur
ing
the
Year
Uni
ts a
t Clo
se o
f Yea
rU
nits
Inst
alle
dA
ll ot
her u
nits
Uni
ts re
tired
incl
udin
g
from
ser
vice
Reb
uilt
units
recl
assi
ficat
ion
of re
spon
dent
Agg
rega
teU
nits
inac
quire
d an
dan
d se
cond
whe
ther
capa
city
of
serv
ice
ofN
ew u
nits
rebu
ilt u
nits
hand
uni
tsow
ned
orTo
tal i
nun
itsre
spon
dent
New
uni
tsle
ased
rew
ritte
npu
rcha
sed
leas
ed,
Ow
ned
Leas
edse
rvic
e of
repo
rted
Line
C
ross
at b
egin
ning
purc
hase
dfro
min
to p
rope
rtyor
leas
ed fr
omin
clud
ing
and
from
resp
onde
ntin
col
(j)
Leas
edLi
ne
No.
Che
ckTy
pe o
r des
ign
of u
nits
of y
ear
or b
uilt
othe
rsac
coun
tsot
hers
recl
assi
ficat
ion
used
othe
rs[c
ol (h
) & (i
)](S
ee In
s. 7
)to
oth
ers
No.
(a)
(b)
(c)
(d)
(e)
(f)(g
)(h
)(i)
(j)(k
)(l)
Loco
mot
ive
Uni
ts(H
P)
1D
iese
l-fre
ight
un
its6,
290
155
353
4,11
32,
364
6,47
728
,085
,316
12
Die
sel-p
asse
nger
units
23
Die
sel-m
ultip
le p
urpo
se
units
1,80
7(1
2)11
1,78
41,
784
4,69
0,59
93
4D
iese
l-sw
itchi
ng
units
45
*TO
TAL
(line
s 1
to 4
)
un
its8,
097
155
2314
5,89
72,
364
8,26
132
,775
,915
56
*E
lect
ric lo
com
otiv
es6
7*
Oth
er s
elf-p
ower
ed u
nits
78
*TO
TAL
(line
s 5,
6, a
nd 7
)8,
097
155
2314
5,89
72,
364
8,26
132
,775
,915
89
*A
uxili
ary
units
3535
359
TOTA
L LO
CO
MO
TIV
E U
NIT
S10
*
(line
s 8
and
9)10
DIS
TRIB
UTI
ON
OF
LOC
OM
OTI
VE U
NIT
S IN
SER
VIC
E O
F R
ESPO
ND
ENT
AT C
LOSE
OF
YEAR
BU
ILT,
DIS
REG
ARD
ING
YEA
R O
F R
EBU
ILD
ING
Dur
ing
Cal
enda
r Yea
rB
etw
een
Bet
wee
nB
etw
een
Bet
wee
nJa
n 1,
199
5Ja
n 1,
200
0Ja
n 1,
200
5Ja
n 1,
201
0Li
neC
ross
Bef
ore
and
and
and
and
Line
N
o.C
heck
Type
or d
esig
n of
uni
tsJa
n 1,
199
5D
ec 3
1, 1
999
Dec
31,
200
4D
ec 3
1, 2
009
Dec
31,
201
420
1520
1620
1720
1820
19TO
TAL
No.
(a)
(b)
(c)
(d)
(e)
(f)(g
)(h
)(i)
(j)(k
)(l)
11*
Die
sel
1,99
61,
535
1,00
31,
607
1,64
032
515
58,
261
1112
*E
lect
ric12
13*
Oth
er s
elf-p
ower
ed u
nits
1314
* T
OTA
L (li
nes
11 to
13)
1,99
61,
535
1,00
31,
607
1,64
032
515
58,
261
1415
*A
uxili
ary
units
3535
15TO
TAL
LOC
OM
OTI
VE
UN
ITS
16*
(lin
es 1
4 an
d 15
)2,
031
1,53
51,
003
1,60
71,
640
325
155
8,29
616
66
8,13
2
Railroad Annual Report R-1
Road Initials: BNSF Year 2016
8,29
632
,775
,915
2314
5,93
22,
364
155

710.
INVE
NTO
RY
OF
EQU
IPM
ENT
(Con
tinue
d)U
NIT
S O
WN
ED, I
NC
LUD
ED IN
INVE
STM
ENT
ACC
OU
NT,
AN
D L
EASE
D F
RO
M O
THER
S
Cha
nges
Dur
ing
the
Year
Uni
ts a
t Clo
se o
f Yea
rU
nits
Inst
alle
dA
ll ot
her u
nits
Uni
ts re
tired
incl
udin
g
from
ser
vice
Reb
uilt
units
recl
assi
ficat
ion
of re
spon
dent
Agg
rega
teU
nits
inac
quire
d an
dan
d se
cond
whe
ther
capa
city
of
serv
ice
ofN
ew u
nits
rebu
ilt u
nits
hand
uni
tsow
ned
orTo
tal i
nun
itsre
spon
dent
New
uni
tsle
ased
rew
ritte
npu
rcha
sed
leas
ed,
Ow
ned
Leas
edse
rvic
e of
repo
rted
Line
C
ross
at b
egin
ning
purc
hase
dfro
min
to p
rope
rtyor
leas
ed fr
omin
clud
ing
and
from
resp
onde
ntin
col
(j)
Leas
edLi
ne
No.
Che
ckTy
pe o
r des
ign
of u
nits
of y
ear
or b
uilt
othe
rsac
coun
tsot
hers
recl
assi
ficat
ion
used
othe
rs[c
ol (h
) & (i
)](S
ee In
s. 7
)to
oth
ers
No.
(a)
(b)
(c)
(d)
(e)
(f)(g
)(h
)(i)
(j)(k
)(l)
Pas
seng
er-T
rain
Car
sN
on-S
elf-P
rope
lled
17C
oach
es (P
A, P
B, P
BO
)17
18C
ombi
ned
cars
18(A
ll cl
ass
C, e
xcep
t CS
B)
19P
arlo
r car
s (P
BC
, PC
, PL,
PO
)19
20S
leep
ing
cars
(PS
, PT,
PA
S, P
DS
)20
21D
inin
g, g
rill,
& ta
vern
car
s21
(All
clas
s D
, PD
)22
Non
pass
enge
r car
ryin
g ca
rs22
(All
clas
s B
, CS
B, M
, PS
A, I
A)
23TO
TAL
(Lin
es 1
7 to
22)
23S
elf-P
rope
lled
24E
lect
ric p
asse
nger
car
s24
(EP
, ET)
25E
lect
ric c
ombi
ned
cars
(EC
)25
26In
tern
al c
ombu
stio
n ra
il 26
mot
orca
rs (E
D, E
G)
27O
ther
sel
f-pro
pelle
d ca
rs27
(Spe
cify
type
s)28
TOTA
L (L
ines
24
to 2
7)28
29TO
TAL
(Lin
es 2
3 an
d 28
)29
Com
pany
Ser
vice
Car
s30
Bus
ines
s ca
rs (P
V)
371
(1)
3939
817
3031
Boa
rd o
utfit
car
s (M
WX)
3132
Der
rick
& s
now
rem
oval
car
s32
(MW
U, M
WV
, MW
W, M
WK
)57
(1)
5858
1,98
733
Dum
p an
d ba
llast
car
s33
(MW
B, M
WD
)1,
803
1030
(262
)1,
909
196
2,10
521
6,48
534
Oth
er m
aint
enan
ce a
nd s
ervi
ce34
equ
ipm
ent c
ars
3,79
311
47(1
,059
)4,
804
106
4,91
043
3,24
335
TOTA
L (L
ines
30
to 3
4)5,
690
2178
(1,3
23)
6,81
030
27,
112
652,
532
35
Railroad Annual Report R-1
Road Initials: BNSF Year 2016 67
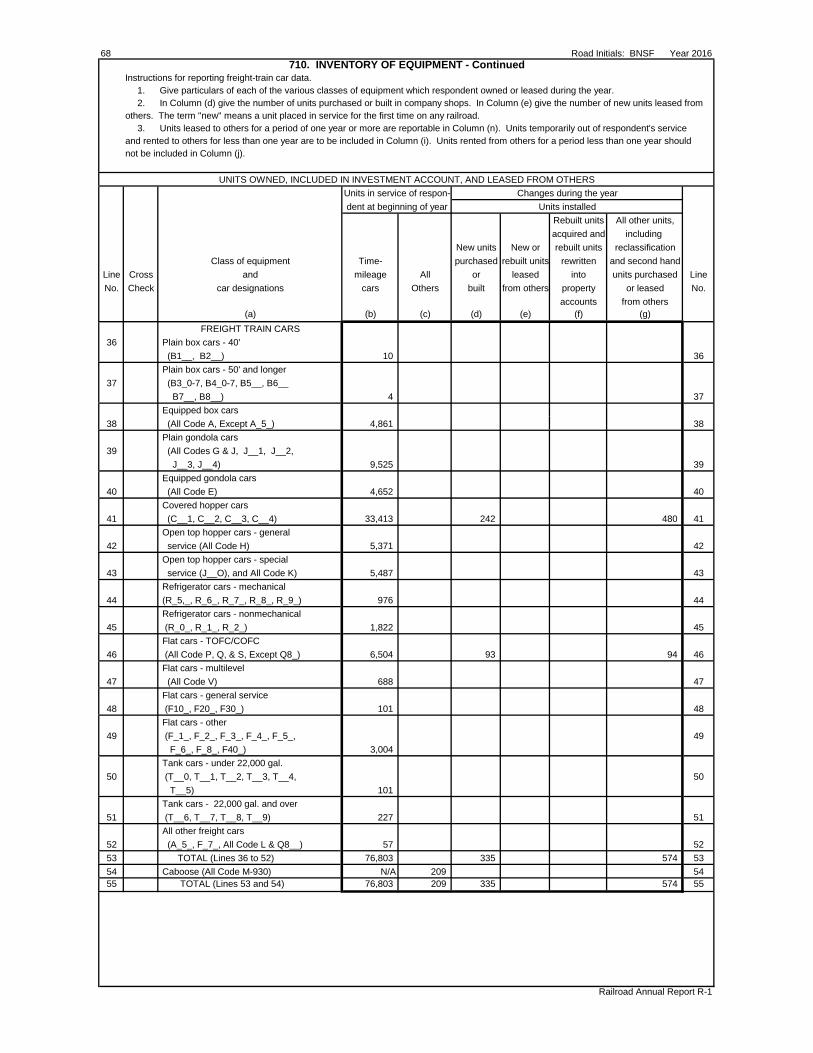
68 Road Initials: BNSF Year 2016710. INVENTORY OF EQUIPMENT - Continued
Instructions for reporting freight-train car data.1. Give particulars of each of the various classes of equipment which respondent owned or leased during the year.2. In Column (d) give the number of units purchased or built in company shops. In Column (e) give the number of new units leased from
others. The term "new" means a unit placed in service for the first time on any railroad.3. Units leased to others for a period of one year or more are reportable in Column (n). Units temporarily out of respondent's service
and rented to others for less than one year are to be included in Column (i). Units rented from others for a period less than one year should not be included in Column (j).
UNITS OWNED, INCLUDED IN INVESTMENT ACCOUNT, AND LEASED FROM OTHERSUnits in service of respon- Changes during the yeardent at beginning of year Units installed
Rebuilt units All other units,acquired and including
New units New or rebuilt units reclassificationClass of equipment Time- purchased rebuilt units rewritten and second hand
Line Cross and mileage All or leased into units purchased LineNo. Check car designations cars Others built from others property or leased No.
accounts from others(a) (b) (c) (d) (e) (f) (g)
FREIGHT TRAIN CARS36 Plain box cars - 40'
(B1__, B2__) 10 36 Plain box cars - 50' and longer
37 (B3_0-7, B4_0-7, B5__, B6__ B7__, B8__) 4 37 Equipped box cars
38 (All Code A, Except A_5_) 4,861 38 Plain gondola cars
39 (All Codes G & J, J__1, J__2, J__3, J__4) 9,525 39 Equipped gondola cars
40 (All Code E) 4,652 40 Covered hopper cars
41 (C__1, C__2, C__3, C__4) 33,413 242 480 41 Open top hopper cars - general
42 service (All Code H) 5,371 42 Open top hopper cars - special
43 service (J__O), and All Code K) 5,487 43 Refrigerator cars - mechanical
44 (R_5,_, R_6_, R_7_, R_8_, R_9_) 976 44 Refrigerator cars - nonmechanical
45 (R_0_, R_1_, R_2_) 1,822 45 Flat cars - TOFC/COFC
46 (All Code P, Q, & S, Except Q8_) 6,504 93 94 46 Flat cars - multilevel
47 (All Code V) 688 47 Flat cars - general service
48 (F10_, F20_, F30_) 101 48 Flat cars - other
49 (F_1_, F_2_, F_3_, F_4_, F_5_, 49 F_6_, F_8_, F40_) 3,004 Tank cars - under 22,000 gal.
50 (T__0, T__1, T__2, T__3, T__4, 50 T__5) 101 Tank cars - 22,000 gal. and over
51 (T__6, T__7, T__8, T__9) 227 51 All other freight cars
52 (A_5_, F_7_, All Code L & Q8__) 57 5253 TOTAL (Lines 36 to 52) 76,803 335 574 5354 Caboose (All Code M-930) N/A 209 5455 TOTAL (Lines 53 and 54) 76,803 209 335 574 55
Railroad Annual Report R-1

Road Initials: BNSF Year 2016 69710. INVENTORY OF EQUIPMENT - Continued
4. Column (m) should show aggregate capacity for all units reported in Columns (k) and (l), as follows. For freight-train cars,report the nominal capacity (in tons of 2,000 lbs) as provided for in Rule 86 of the AAR Code of Rules Governing Cars inInterchange. Convert the capacity of tank cars to capacity in tons of the commodity which the car is intended to customarily carry.
5. Time-mileage cars refers to freight cars, other than cabooses, owned or held under lease arrangement, whose interline rentalis settled on a per diem and line haul mileage basis under "Code of Car Hire Rules" or would be so settled if used by another railroad.
UNITS OWNED, INCLUDED IN INVESTMENT ACCOUNT, AND LEASED FROM OTHERSChanges during year Units at close of year
(concluded) Total in service of Units retired respondent Aggregatefrom service (col. (i) & (j)) capacity
of respondent of unitswhether owned Owned Leased Time- reported in Leased
Line Cross or leased and from mileage All col (k) & (l) to LineNo. Check including used others cars Others (see ins. 4) Others No.
reclassification(h) (i) (j) (k) (l) (m) (n)
3636 9 1 1 78
37 4 37
38 238 2,923 1,700 4,623 454,773 38
39 1,163 3,020 5,342 8,362 986,128 39
40 309 3,722 621 4,343 454,509 40
41 2,154 15,955 16,026 31,981 3,498,523 41
42 540 4,482 349 4,831 492,516 42
43 88 2,004 3,395 5,399 613,260 43
44 976 976 88,156 44
45 67 1,755 1,755 150,309 45
46 340 1,791 4,560 6,351 1,547,121 46
47 72 429 187 616 33,960 47
48 24 77 77 6,030 48
49 49473 1,097 1,434 2,531 256,376
50 5012 89 89 7,222
51 6 221 221 21,549 51
52 26 31 31 2,415 5253 5,525 37,597 34,590 72,187 8,612,925 5354 4 205 N/A 205 N/A 5455 5,529 37,802 34,590 72,187 205 8,612,925 55
Railroad Annual Report R-1

70 Road Initials: BNSF Year 2016710. INVENTORY OF EQUIPMENT - Continued
UNITS OWNED, INCLUDED IN INVESTMENT ACCOUNT, AND LEASED FROM OTHERSUnits in service of respon- Changes during the yeardent at beginning of year Units installed
Rebuilt units All other units,acquired and including
New units rebuilt units reclassificationClass of equipment purchased New units rewritten and second hand
Line Cross and Per All or leased into units purchased LineNo. Check car designations diem Others built from others property or leased No.
accounts from others(a) (b) (c) (d) (e) (f) (g)
FLOATING EQUIPMENT Self-propelled vessels
56 (tugboats, car ferries, etc.) 56 Non-self-propelled vessels
57 (car floats, lighters, etc.) 5758 TOTAL (Lines 56 and 57) 58
HIGHWAY REVENUEEQUIPMENT
59 Chassis (Z1_, Z67_, Z68_, Z_69_) 384 5960 Dry van (U2_, Z_, Z6_, I-6) 6061 Flat bed (U3__, Z3__) 6162 Open bed (U4__, Z4__) 6263 Mechanical refrigerator (U5_, Z5_) 6364 Bulk hopper (U0__, Z0__) 6465 Insulated (U7__, Z7__) 6566 Tank (Z0__, U6__) (See note) 66
Other trailer and container67 (Special equipped dry van U9__, 67
Z8__, Z9__)68 Tractor 6869 Truck 6970 TOTAL (Lines 59 to 69) 384 70
NOTES AND REMARKS
Note: Line 66 (Tank) must have fitting code "CN" to qualify as a tank, otherwise it is a bulk hopper.
Railroad Annual Report R-1

Road Initials: BNSF Year 2016 71710. INVENTORY OF EQUIPMENT - Concluded
UNITS OWNED, INCLUDED IN INVESTMENT ACCOUNT, AND LEASED FROM OTHERSChanges during year Units at close of year
(concluded) Total in service of Units retired respondent Aggregatefrom service (col. (i) & (j)) capacity
of respondent of unitswhether owned Owned Leased reported in Leased
Line Cross or leased and from Per All col (k) & (l) to LineNo. Check including used others diem Others (see ins. 4) Others No.
reclassification(h) (i) (j) (k) (l) (m) (n)
56 56
57 5758 58
59 384 384 11,136 5960 6061 6162 6263 6364 6465 6566 66
67 67
68 6869 6970 384 384 11,136 70
NOTES AND REMARKS
Railroad Annual Report R-1

72 Road Initials: BNSF Year 2016
710S. UNIT COST OF EQUIPMENT INSTALLED DURING THE YEAR(Dollars in Thousands)
1. Give particulars as requested, separately, for the various classes of new units and rebuilt units of equipment installed by respondent during theyear. If information regarding the cost of any units installed is not complete at time of filing of report, the units should be omitted, but reference tothe number of units omitted should be given in a footnote, the details as to cost to be given in the report of the following year. The cost of units under construction at the close of the year should not be reflected in this schedule even though part of the cost appears in the property account for the year. Indicate in column (e) whether an installation represents equipment purchased (P), built or rebuilt by contract in outside railroad shops (C), or built or rebuilt in company or system shops (S) including units acquired through capitalized leases (L). 2. In column (a) list each class or type of locomotive unit, car, or TOFC/COFC equipment on a separate line. By class is meant the standardclassification used to distinguish types of locomotive units, freight cars or other equipment adopted by the Association of American Railroads,and should include physical characteristics requested by Schedule 710. Locomotive units should be identified as to power source, wheel arrangement, and horsepower per unit, such as multiple-purpose diesel locomotive A units (B-B), 2,500 HP. Cars should be identified as to special construction or service characteristics, such as aluminum-covered hopper car (LO), steel boxcars-special service (XAP), etc. For TOFC/COFC show type of equipment as enumerated in Schedule 710. 3. In column (c) show the total weight in tons of 2,000 pounds. The weight of the equipment acquired should be the weight empty. 4. The cost should be the complete cost as entered on the ledger, including foreign line freight charges and handling charges. 5. Data for this schedule should be confined to the units reported in Schedule 710, columns (c) and (e) for locomotive units, passenger-train cars and company service cars and columns (d) and (f) for freight train cars, floating equipment and highway revenue equipment. Disclose new units inthe upper section of this schedule and in the lower section disclose rebuilt units acquired or rewritten into the respondent's accounts. The term"new" as used herein shall mean a unit or units placed in service for the first time on any railroad. 6. All unequipped boxcars acquired in whole or in part with incentive per diem funds should be reported on separate lines and appropriatelyidentified by footnote or sub-heading.
Line Total weight Total cost Method of Line
No. Class of equipment Number of units (tons) (000) acquisition No.
(see instructions)
(a) (b) (c) (d) (e)
1 Diesel-Freight Locomotives 155 33,131 360,366$ P 1
2 Freight-Train Cars 2
3 Covered Hoppers 242 7,538 19,380 P 3
4 Flat Cars - TOFC/COFC 93 6,064 18,073 P 4
5 Work Equipment Cars 5
6 Dump and Ballast Cars 10 396 2,250 P 6
7 Other MOW 11 387 1,846 P 7
8 8
9 9
10 10
11 11
12 TOTAL 511 47,516 401,915$ N/A 12
13 13
14 14
15 15
16 16
17 17
18 18
19 19
20 20
21 21
22 22
23 TOTAL - - -$ N/A 23
24 GRAND TOTAL (NEW AND REBUILT) 511 47,516 401,915$ N/A 24
Railroad Annual Report R-1
NEW UNITS
REBUILT UNITS

GE
NE
RA
L IN
STR
UC
TIO
NS
CO
NC
ER
NIN
G R
ETU
RN
S T
O B
E M
AD
E IN
SC
HE
DU
LE 7
20
1. F
or p
urpo
ses
of th
ese
sche
dule
s, th
e tra
ck c
ateg
orie
s ar
e de
fined
as
follo
ws:
T
rack
cat
egor
y 1
A
- Fr
eigh
t den
sity
of 2
0 m
illio
n or
mor
e gr
oss
ton
mile
s pe
r tra
ck m
ile p
er y
ear (
incl
ude
pass
ing
track
s, tu
rnou
ts a
nd c
ross
over
s)
B
- Fr
eigh
t den
sity
of l
ess
than
20
mill
ion
gros
s to
n m
iles
per t
rack
mile
per
yea
r, bu
t at l
east
5 m
illio
n (in
clud
e pa
ssin
g tra
cks,
turn
outs
and
cro
ssov
ers)
C
- Fr
eigh
t den
sity
of l
ess
than
5 m
illio
n gr
oss
ton
mile
s pe
r tra
ck m
ile p
er y
ear,
but a
t lea
st 1
mill
ion
(incl
ude
pass
ing
track
s, tu
rnou
ts a
nd c
ross
over
s)
D
- Fr
eigh
t den
sity
of l
ess
than
1 m
illio
n gr
oss
ton
mile
s pe
r tra
ck m
ile p
er y
ear(
incl
ude
pass
ing
track
s, tu
rnou
ts a
nd c
ross
over
s)
E
- W
ay a
nd y
ard
switc
hing
trac
ks (p
assi
ng tr
acks
, cro
ssov
ers
and
turn
outs
sha
ll be
incl
uded
in c
ateg
ory
A, B
, C, D
, F, a
nd P
oten
tial a
band
onm
ents
, as
appr
opria
te).
F
- Tr
ack
over
whi
ch a
ny p
asse
nger
ser
vice
is p
rovi
ded
(oth
er th
an p
oten
tial a
band
onm
ents
). M
ileag
e sh
ould
be
incl
uded
with
in tr
ack
cate
gorie
s A
thro
ugh
E u
nles
s
ther
e is
ded
icat
ed e
ntire
ly to
pas
seng
er s
ervi
ce F
.
P
oten
tial a
band
onm
ents
- R
oute
seg
men
ts id
entif
ied
by ra
ilroa
ds a
s po
tent
ially
sub
ject
to a
band
onm
ent a
s re
quire
d by
Sec
tion
1090
4 of
the
Inte
rsta
te C
omm
erce
Act
.
2.Th
is s
ched
ule
shou
ld in
clud
e al
l cla
ss 1
, 2, 3
, or 4
trac
k fro
m s
ched
ule
700
that
is m
aint
aine
d by
the
resp
onde
nt (c
lass
5 is
ass
umed
to b
e m
aint
aine
d by
oth
ers)
.
3. If
, for
two
cons
ecut
ive
year
s, a
line
seg
men
t cla
ssifi
ed in
one
trac
k ca
tego
ry m
aint
ains
a tr
affic
den
sity
whi
ch w
ould
pla
ce it
in a
noth
er, i
t sha
ll be
recl
assi
fied
into
that
cat
egor
y as
of t
he b
egin
ning
of t
he s
econ
d ye
ar.
4.Tr
affic
den
sity
rela
ted
to p
asse
nger
ser
vice
sha
ll no
t be
incl
uded
in th
e de
term
inat
ion
of th
e tra
ck c
ateg
ory
of a
line
seg
men
t.
1. D
iscl
ose
the
requ
este
d in
form
atio
n pe
rtain
ing
to tr
ack
and
traffi
c co
nditi
ons.
Line
Mile
age
of tr
acks
Ave
rage
ann
ual t
raffi
c de
nsity
inA
vera
ge ru
nnin
gTr
ack
mile
s un
der
Line
No.
Trac
k C
ateg
ory
at e
nd o
f per
iod
mill
ions
of g
ross
ton-
mile
s pe
r tra
ck-m
ile*
spee
d lim
itsl
ow o
rder
sN
o.(w
hole
num
bers
)(u
se tw
o de
cim
al p
lace
s)(u
se tw
o de
cim
al p
lace
s)at
end
of p
erio
d(a
)(b
)(c
)(d
)(e
)1
A18
,334
60.0
858
.84
510.
21
2B
8,08
612
.43
47.9
295
6.5
23
C2,
539
2.57
37.1
126
1.8
34
D1,
724
0.38
33.6
754
6.1
45
E9,
457
n/a
n/a
56
TOTA
L40
,140
39.4
152
.75
2274
.66
7F
11,9
91n/
an/
a7
8P
oten
tial a
band
onm
ents
8
*To
dete
rmin
e av
erag
e de
nsity
, tot
al tr
ack
mile
s (r
oute
mile
s tim
es n
umbe
r of t
rack
s), r
athe
r tha
n ro
ute-
mile
s, s
hall
be u
sed.
Railroad Annual Report R-1
Road Initials BNSF Year 2016 73
720.
TR
AC
K A
ND
TR
AFF
IC C
ON
DIT
ION
S

750.
CO
NSU
MPT
ION
OF
DIE
SEL
FUEL
(Dol
lars
in T
hous
ands
)
LOC
OM
OTI
VE
SLi
neK
ind
of lo
com
otiv
e se
rvic
eD
iese
l oil
(gal
lons
)Li
neN
o.(a
)(b
)N
o.
1Fr
eigh
t1,
242,
548,
424
12
Pas
seng
er2
3Y
ard
Sw
itchi
ng40
,279
,454
34
TO
TAL
1,28
2,82
7,87
84
5C
OS
T O
F FU
EL
$(00
0)*
1,83
0,22
6$
5
6W
ork
Trai
n81
7,83
16
*Sho
w c
ost o
f fue
l cha
rged
to tr
ain
and
yard
ser
vice
(fun
ctio
n 67
-Loc
o. F
uels
). T
he c
ost s
tate
d fo
r die
sel f
uel s
houl
d be
the
tota
l cha
rges
in th
e ac
coun
ts s
peci
fied,
incl
udin
gfre
ight
cha
rges
and
han
dlin
g ex
pens
es.
Fue
l con
sum
ed b
y m
ixed
and
spe
cial
trai
ns th
at a
re p
redo
min
antly
frei
ght s
houl
d be
incl
uded
in fr
eigh
t ser
vice
, but
whe
re th
e se
rvic
eof
mix
ed o
r spe
cial
trai
ns is
pre
dom
inan
tly p
asse
nger
, the
fuel
sho
uld
be in
clud
ed in
pas
seng
er s
ervi
ce.
74 Road Initials: BNSF Year 2016
Railroad Annual Report R-1
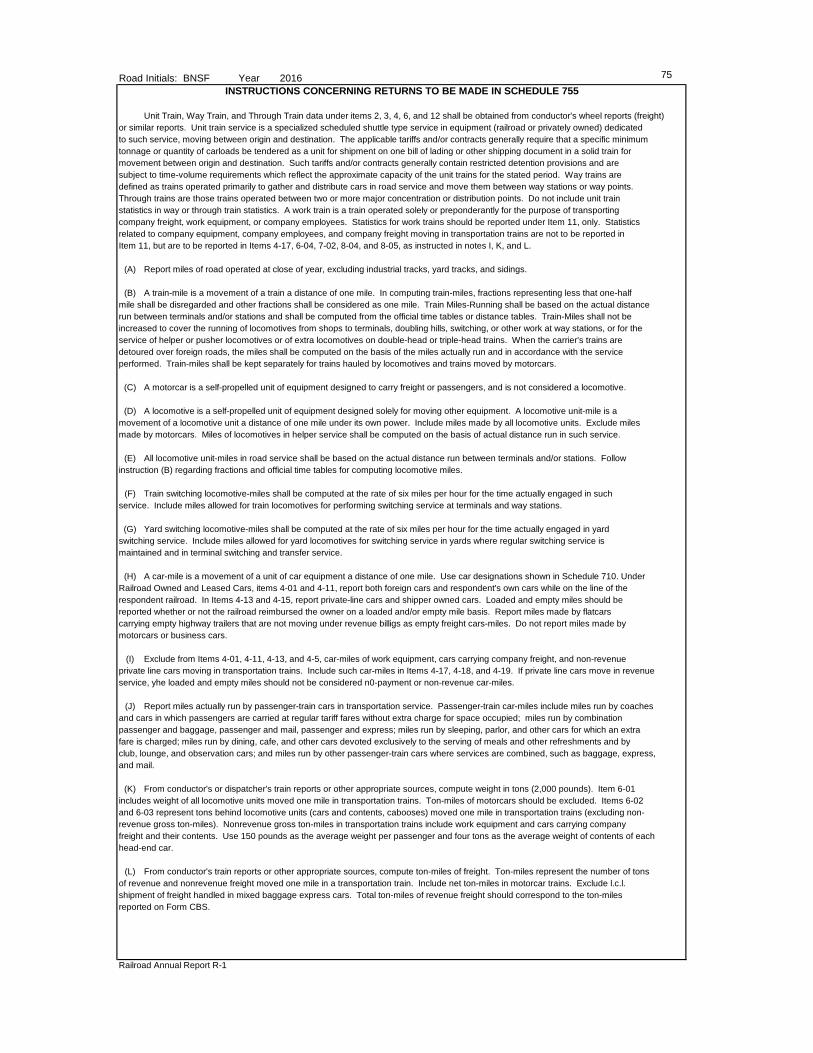
Road Initials: BNSF Year 2016 75INSTRUCTIONS CONCERNING RETURNS TO BE MADE IN SCHEDULE 755
Unit Train, Way Train, and Through Train data under items 2, 3, 4, 6, and 12 shall be obtained from conductor's wheel reports (freight)or similar reports. Unit train service is a specialized scheduled shuttle type service in equipment (railroad or privately owned) dedicatedto such service, moving between origin and destination. The applicable tariffs and/or contracts generally require that a specific minimumtonnage or quantity of carloads be tendered as a unit for shipment on one bill of lading or other shipping document in a solid train formovement between origin and destination. Such tariffs and/or contracts generally contain restricted detention provisions and aresubject to time-volume requirements which reflect the approximate capacity of the unit trains for the stated period. Way trains aredefined as trains operated primarily to gather and distribute cars in road service and move them between way stations or way points.Through trains are those trains operated between two or more major concentration or distribution points. Do not include unit trainstatistics in way or through train statistics. A work train is a train operated solely or preponderantly for the purpose of transportingcompany freight, work equipment, or company employees. Statistics for work trains should be reported under Item 11, only. Statisticsrelated to company equipment, company employees, and company freight moving in transportation trains are not to be reported inItem 11, but are to be reported in Items 4-17, 6-04, 7-02, 8-04, and 8-05, as instructed in notes I, K, and L.
(A) Report miles of road operated at close of year, excluding industrial tracks, yard tracks, and sidings.
(B) A train-mile is a movement of a train a distance of one mile. In computing train-miles, fractions representing less that one-halfmile shall be disregarded and other fractions shall be considered as one mile. Train Miles-Running shall be based on the actual distancerun between terminals and/or stations and shall be computed from the official time tables or distance tables. Train-Miles shall not beincreased to cover the running of locomotives from shops to terminals, doubling hills, switching, or other work at way stations, or for theservice of helper or pusher locomotives or of extra locomotives on double-head or triple-head trains. When the carrier's trains aredetoured over foreign roads, the miles shall be computed on the basis of the miles actually run and in accordance with the serviceperformed. Train-miles shall be kept separately for trains hauled by locomotives and trains moved by motorcars.
(C) A motorcar is a self-propelled unit of equipment designed to carry freight or passengers, and is not considered a locomotive.
(D) A locomotive is a self-propelled unit of equipment designed solely for moving other equipment. A locomotive unit-mile is a movement of a locomotive unit a distance of one mile under its own power. Include miles made by all locomotive units. Exclude milesmade by motorcars. Miles of locomotives in helper service shall be computed on the basis of actual distance run in such service.
(E) All locomotive unit-miles in road service shall be based on the actual distance run between terminals and/or stations. Followinstruction (B) regarding fractions and official time tables for computing locomotive miles.
(F) Train switching locomotive-miles shall be computed at the rate of six miles per hour for the time actually engaged in suchservice. Include miles allowed for train locomotives for performing switching service at terminals and way stations.
(G) Yard switching locomotive-miles shall be computed at the rate of six miles per hour for the time actually engaged in yardswitching service. Include miles allowed for yard locomotives for switching service in yards where regular switching service ismaintained and in terminal switching and transfer service.
(H) A car-mile is a movement of a unit of car equipment a distance of one mile. Use car designations shown in Schedule 710. UnderRailroad Owned and Leased Cars, items 4-01 and 4-11, report both foreign cars and respondent's own cars while on the line of therespondent railroad. In Items 4-13 and 4-15, report private-line cars and shipper owned cars. Loaded and empty miles should bereported whether or not the railroad reimbursed the owner on a loaded and/or empty mile basis. Report miles made by flatcarscarrying empty highway trailers that are not moving under revenue billigs as empty freight cars-miles. Do not report miles made bymotorcars or business cars.
(I) Exclude from Items 4-01, 4-11, 4-13, and 4-5, car-miles of work equipment, cars carrying company freight, and non-revenueprivate line cars moving in transportation trains. Include such car-miles in Items 4-17, 4-18, and 4-19. If private line cars move in revenueservice, yhe loaded and empty miles should not be considered n0-payment or non-revenue car-miles.
(J) Report miles actually run by passenger-train cars in transportation service. Passenger-train car-miles include miles run by coachesand cars in which passengers are carried at regular tariff fares without extra charge for space occupied; miles run by combinationpassenger and baggage, passenger and mail, passenger and express; miles run by sleeping, parlor, and other cars for which an extrafare is charged; miles run by dining, cafe, and other cars devoted exclusively to the serving of meals and other refreshments and by club, lounge, and observation cars; and miles run by other passenger-train cars where services are combined, such as baggage, express,and mail.
(K) From conductor's or dispatcher's train reports or other appropriate sources, compute weight in tons (2,000 pounds). Item 6-01includes weight of all locomotive units moved one mile in transportation trains. Ton-miles of motorcars should be excluded. Items 6-02and 6-03 represent tons behind locomotive units (cars and contents, cabooses) moved one mile in transportation trains (excluding non-revenue gross ton-miles). Nonrevenue gross ton-miles in transportation trains include work equipment and cars carrying companyfreight and their contents. Use 150 pounds as the average weight per passenger and four tons as the average weight of contents of each head-end car.
(L) From conductor's train reports or other appropriate sources, compute ton-miles of freight. Ton-miles represent the number of tonsof revenue and nonrevenue freight moved one mile in a transportation train. Include net ton-miles in motorcar trains. Exclude l.c.l.shipment of freight handled in mixed baggage express cars. Total ton-miles of revenue freight should correspond to the ton-milesreported on Form CBS.
Railroad Annual Report R-1
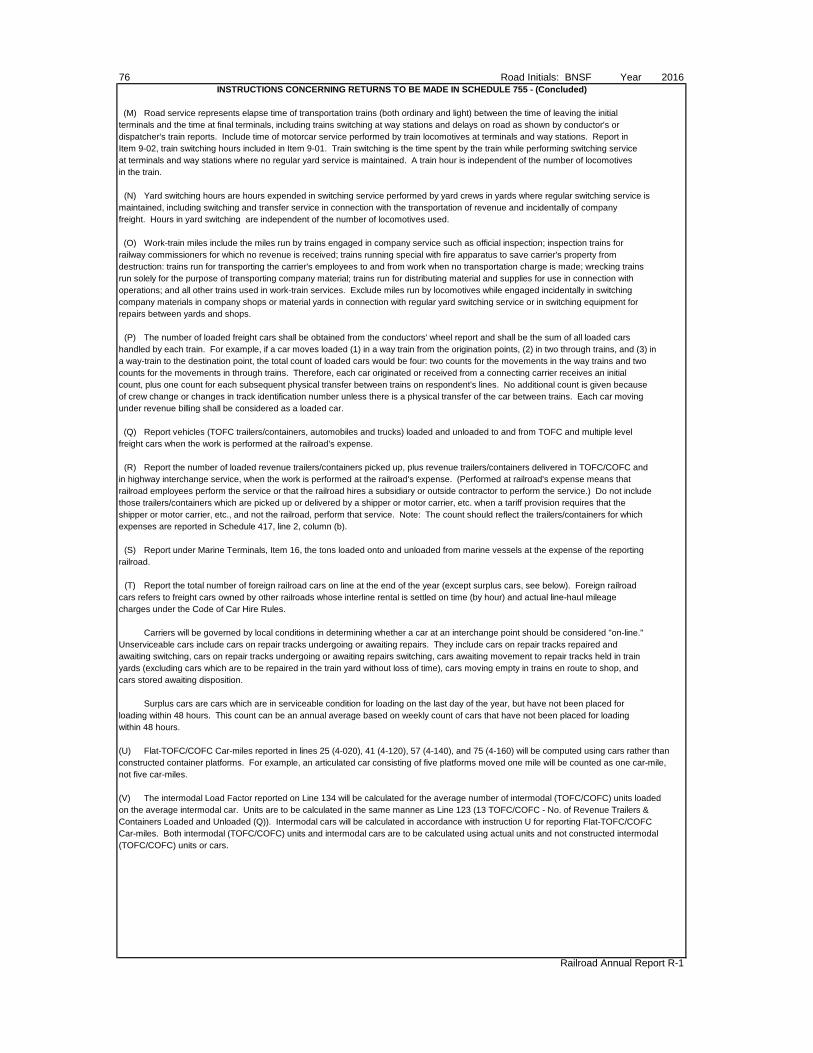
76 Road Initials: BNSF Year 2016INSTRUCTIONS CONCERNING RETURNS TO BE MADE IN SCHEDULE 755 - (Concluded)
(M) Road service represents elapse time of transportation trains (both ordinary and light) between the time of leaving the initialterminals and the time at final terminals, including trains switching at way stations and delays on road as shown by conductor's ordispatcher's train reports. Include time of motorcar service performed by train locomotives at terminals and way stations. Report inItem 9-02, train switching hours included in Item 9-01. Train switching is the time spent by the train while performing switching serviceat terminals and way stations where no regular yard service is maintained. A train hour is independent of the number of locomotivesin the train.
(N) Yard switching hours are hours expended in switching service performed by yard crews in yards where regular switching service ismaintained, including switching and transfer service in connection with the transportation of revenue and incidentally of company freight. Hours in yard switching are independent of the number of locomotives used.
(O) Work-train miles include the miles run by trains engaged in company service such as official inspection; inspection trains for railway commissioners for which no revenue is received; trains running special with fire apparatus to save carrier's property fromdestruction: trains run for transporting the carrier's employees to and from work when no transportation charge is made; wrecking trainsrun solely for the purpose of transporting company material; trains run for distributing material and supplies for use in connection withoperations; and all other trains used in work-train services. Exclude miles run by locomotives while engaged incidentally in switchingcompany materials in company shops or material yards in connection with regular yard switching service or in switching equipment forrepairs between yards and shops.
(P) The number of loaded freight cars shall be obtained from the conductors' wheel report and shall be the sum of all loaded carshandled by each train. For example, if a car moves loaded (1) in a way train from the origination points, (2) in two through trains, and (3) ina way-train to the destination point, the total count of loaded cars would be four: two counts for the movements in the way trains and twocounts for the movements in through trains. Therefore, each car originated or received from a connecting carrier receives an initialcount, plus one count for each subsequent physical transfer between trains on respondent's lines. No additional count is given becauseof crew change or changes in track identification number unless there is a physical transfer of the car between trains. Each car movingunder revenue billing shall be considered as a loaded car.
(Q) Report vehicles (TOFC trailers/containers, automobiles and trucks) loaded and unloaded to and from TOFC and multiple levelfreight cars when the work is performed at the railroad's expense.
(R) Report the number of loaded revenue trailers/containers picked up, plus revenue trailers/containers delivered in TOFC/COFC andin highway interchange service, when the work is performed at the railroad's expense. (Performed at railroad's expense means thatrailroad employees perform the service or that the railroad hires a subsidiary or outside contractor to perform the service.) Do not includethose trailers/containers which are picked up or delivered by a shipper or motor carrier, etc. when a tariff provision requires that theshipper or motor carrier, etc., and not the railroad, perform that service. Note: The count should reflect the trailers/containers for which expenses are reported in Schedule 417, line 2, column (b).
(S) Report under Marine Terminals, Item 16, the tons loaded onto and unloaded from marine vessels at the expense of the reportingrailroad.
(T) Report the total number of foreign railroad cars on line at the end of the year (except surplus cars, see below). Foreign railroadcars refers to freight cars owned by other railroads whose interline rental is settled on time (by hour) and actual line-haul mileagecharges under the Code of Car Hire Rules.
Carriers will be governed by local conditions in determining whether a car at an interchange point should be considered "on-line."Unserviceable cars include cars on repair tracks undergoing or awaiting repairs. They include cars on repair tracks repaired andawaiting switching, cars on repair tracks undergoing or awaiting repairs switching, cars awaiting movement to repair tracks held in trainyards (excluding cars which are to be repaired in the train yard without loss of time), cars moving empty in trains en route to shop, andcars stored awaiting disposition.
Surplus cars are cars which are in serviceable condition for loading on the last day of the year, but have not been placed forloading within 48 hours. This count can be an annual average based on weekly count of cars that have not been placed for loadingwithin 48 hours.
(U) Flat-TOFC/COFC Car-miles reported in lines 25 (4-020), 41 (4-120), 57 (4-140), and 75 (4-160) will be computed using cars rather thanconstructed container platforms. For example, an articulated car consisting of five platforms moved one mile will be counted as one car-mile,not five car-miles.
(V) The intermodal Load Factor reported on Line 134 will be calculated for the average number of intermodal (TOFC/COFC) units loadedon the average intermodal car. Units are to be calculated in the same manner as Line 123 (13 TOFC/COFC - No. of Revenue Trailers &Containers Loaded and Unloaded (Q)). Intermodal cars will be calculated in accordance with instruction U for reporting Flat-TOFC/COFCCar-miles. Both intermodal (TOFC/COFC) units and intermodal cars are to be calculated using actual units and not constructed intermodal(TOFC/COFC) units or cars.
Railroad Annual Report R-1

Road Initials: BNSF Year 2016 77
755. RAILROAD OPERATING STATISTICS2016
Line Cross Item Description Freight Passenger LineNo. Check Train Train No.
(a) (b) (c)1 1 Miles of Road Operated (A) 32,375 1
2 Train Miles - Running (B)2 2-01 Unit Trains 55,080,900 XXXXXX 23 2-02 Way Trains 6,072,976 XXXXXX 34 2-03 Through Trains 94,695,473 45 2-04 TOTAL TRAIN MILES (Lines 2-4) 155,849,349 56 2-05 Motorcars (C) 0 67 2-07 TOTAL ALL TRAINS (Lines 5 and 6) 155,849,349 7
3 Locomotive Unit Miles (D)Road Service (E)
8 3-01 Unit Trains 187,436,245 XXXXXX 89 3-02 Way Trains 13,564,656 XXXXXX 9
10 3-03 Through Trains 329,384,193 1011 3-04 TOTAL (Lines 8-10) 530,385,094 1112 3-11 Train Switching (F) 3,515,728 XXXXXX 1213 3-21 Yard Switching (G) 13,677,664 1314 3-31 TOTAL ALL SERVICES (Lines 11-13) 547,578,486 14
4 Freight Car-Miles (thousands) (H)4-01 RR Owned and Leased Cars - Loaded
15 4-010 Box-Plain 40-Foot 0 XXXXXX 1516 4-011 Box-Plain 50-Foot and Longer 8,929 XXXXXX 1617 4-012 Box-Equipped 124,539 XXXXXX 1718 4-013 Gondola-Plain 250,277 XXXXXX 1819 4-014 Gondola-Equipped 42,696 XXXXXX 1920 4-015 Hopper-Covered 783,889 XXXXXX 2021 4-016 Hopper-Open Top-General Service 17,233 XXXXXX 2122 4-017 Hopper-Open Top-Special Service 105,587 XXXXXX 2223 4-018 Refrigerator-Mechanical 12,039 XXXXXX 2324 4-019 Refrigerator-Non-Mechanical 27,415 XXXXXX 2425 4-020 Flat-TOFC/COFC 619,184 XXXXXX 2526 4-021 Flat-Multi-Level 49,477 XXXXXX 2627 4-022 Flat-General Service 245 XXXXXX 2728 4-023 Flat-All Other 85,101 XXXXXX 2829 4-024 All Other Car Types-Total 260 XXXXXX 2930 4-025 TOTAL (Lines 15-29) 2,126,871 XXXXXX 30
Railroad Annual Report R-1

78 Road Initials: BNSF Year 2016
755. RAILROAD OPERATING STATISTICS - (Continued)
Line Cross Item Description Freight Passenger LineNo. Check Train Train No.
(a) (b) (c)4-11 RR Owned and Leased Cars - Empty
31 4-110 Box-Plain 40-Foot 0 XXXXXX 3132 4-111 Box-Plain 50-Foot and Longer 7,477 XXXXXX 3233 4-112 Box-Equipped 101,161 XXXXXX 3334 4-113 Gondola-Plain 243,393 XXXXXX 3435 4-114 Gondola-Equipped 42,389 XXXXXX 3536 4-115 Hopper-Covered 766,179 XXXXXX 3637 4-116 Hopper-Open Top-General Service 23,709 XXXXXX 3738 4-117 Hopper-Open Top-Special Service 106,956 XXXXXX 3839 4-118 Refrigerator-Mechanical 6,943 XXXXXX 3940 4-119 Refrigerator-Non-Mechanical 20,470 XXXXXX 4041 4-120 Flat-TOFC/COFC 79,176 XXXXXX 4142 4-121 Flat-Multi-Level 16,106 XXXXXX 4243 4-122 Flat-General Service 601 XXXXXX 4344 4-123 Flat-All Other 78,256 XXXXXX 4445 4-124 All Other Car Types-Total 867 XXXXXX 4546 4-125 TOTAL (Lines 31-45) 1,493,683 XXXXXX 46
4-13 Private Line Cars - Loaded (H)47 4-130 Box-Plain 40-Foot 0 XXXXXX 4748 4-131 Box-Plain 50-Foot and Longer 5,270 XXXXXX 4849 4-132 Box-Equipped 36,317 XXXXXX 4950 4-133 Gondola-Plain 806,221 XXXXXX 5051 4-134 Gondola-Equipped 11,804 XXXXXX 5152 4-135 Hopper-Covered 486,600 XXXXXX 5253 4-136 Hopper-Open Top-General Service 58,472 XXXXXX 5354 4-137 Hopper-Open Top-Special Service 593,688 XXXXXX 5455 4-138 Refrigerator-Mechanical 5,128 XXXXXX 5556 4-139 Refrigerator-Non-Mechanical 452 XXXXXX 5657 4-140 Flat-TOFC/COFC 1,130,212 XXXXXX 5758 4-141 Flat-Multi-Level 322,878 XXXXXX 5859 4-142 Flat-General Service 400 XXXXXX 5960 4-143 Flat-All Other 58,867 XXXXXX 6061 4-144 Tank Under 22,000 Gallons 136,636 XXXXXX 6162 4-145 Tank - 22,000 Gallons and Over 629,538 XXXXXX 6263 4-146 All Other Car Types-Total 716 XXXXXX 6364 4-147 TOTAL (Lines 47-63) 4,283,199 XXXXXX 64
Railroad Annual Report R-1
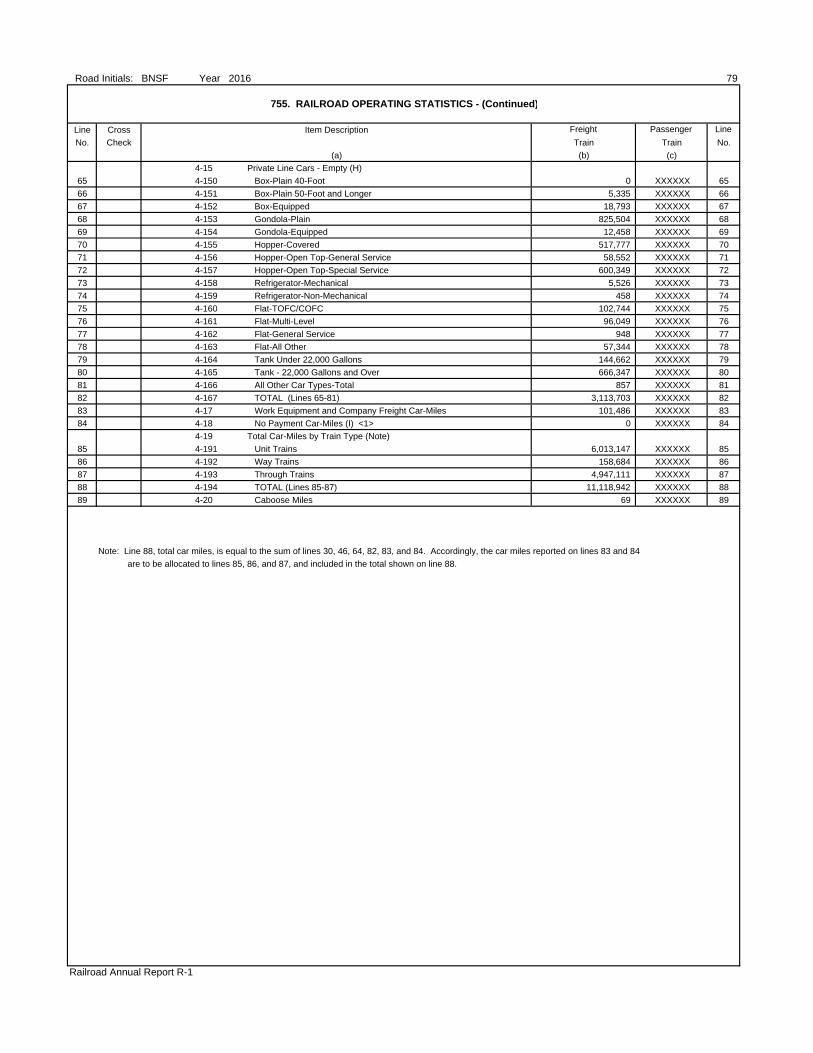
Road Initials: BNSF Year 2016 79
755. RAILROAD OPERATING STATISTICS - (Continued)
Line Cross Item Description Freight Passenger LineNo. Check Train Train No.
(a) (b) (c)4-15 Private Line Cars - Empty (H)
65 4-150 Box-Plain 40-Foot 0 XXXXXX 6566 4-151 Box-Plain 50-Foot and Longer 5,335 XXXXXX 6667 4-152 Box-Equipped 18,793 XXXXXX 6768 4-153 Gondola-Plain 825,504 XXXXXX 6869 4-154 Gondola-Equipped 12,458 XXXXXX 6970 4-155 Hopper-Covered 517,777 XXXXXX 7071 4-156 Hopper-Open Top-General Service 58,552 XXXXXX 7172 4-157 Hopper-Open Top-Special Service 600,349 XXXXXX 7273 4-158 Refrigerator-Mechanical 5,526 XXXXXX 7374 4-159 Refrigerator-Non-Mechanical 458 XXXXXX 7475 4-160 Flat-TOFC/COFC 102,744 XXXXXX 7576 4-161 Flat-Multi-Level 96,049 XXXXXX 7677 4-162 Flat-General Service 948 XXXXXX 7778 4-163 Flat-All Other 57,344 XXXXXX 7879 4-164 Tank Under 22,000 Gallons 144,662 XXXXXX 7980 4-165 Tank - 22,000 Gallons and Over 666,347 XXXXXX 8081 4-166 All Other Car Types-Total 857 XXXXXX 8182 4-167 TOTAL (Lines 65-81) 3,113,703 XXXXXX 8283 4-17 Work Equipment and Company Freight Car-Miles 101,486 XXXXXX 8384 4-18 No Payment Car-Miles (I) <1> 0 XXXXXX 84
4-19 Total Car-Miles by Train Type (Note)85 4-191 Unit Trains 6,013,147 XXXXXX 8586 4-192 Way Trains 158,684 XXXXXX 8687 4-193 Through Trains 4,947,111 XXXXXX 8788 4-194 TOTAL (Lines 85-87) 11,118,942 XXXXXX 8889 4-20 Caboose Miles 69 XXXXXX 89
Note: Line 88, total car miles, is equal to the sum of lines 30, 46, 64, 82, 83, and 84. Accordingly, the car miles reported on lines 83 and 84 are to be allocated to lines 85, 86, and 87, and included in the total shown on line 88.
Railroad Annual Report R-1

80 Road Initials: BNSF Year 2016
755. RAILROAD OPERATING STATISTICS - (Concluded)
Line Cross Item Description Freight Passenger LineNo. Check Train Train No.
(a) (b) (c)6 Gross Ton-Miles (thousands) (K)
98 6-01 Road Locomotives 109,806,131 986-02 Freight Trains, Crs., Cnts, & Caboose 0
99 6-020 Unit Trains 529,539,300 XXXXXX 99100 6-021 Way Trains 12,304,067 XXXXXX 100101 6-022 Through Trains 544,127,073 XXXXXX 101102 6-03 Passenger Trains, Crs, & Cnts. 0 102103 6-04 Non-Revenue 13,334,327 XXXXXX 103104 6-05 TOTAL (Lines 98 - 103) 1,209,110,898 104
7 Tons of Freight (thousands)105 7-01 Revenue 556,717 XXXXXX 105106 7-02 Non-Revenue 13,308 XXXXXX 106107 7-03 TOTAL (Lines 105 and 106) 570,025 XXXXXX 107
8 Ton-Miles of Freight (thousands) (L)108 8-01 Revenue - Road Service 629,392,423 XXXXXX 108109 8-02 Revenue - Lake Transfer Service 0 XXXXXX 109110 8-03 TOTAL (Lines 108 and 109) 629,392,423 XXXXXX 110111 8-04 Non-Revenue - Road Service 6,582,002 XXXXXX 111112 8-05 Non-Revenue - Lake Transfer Service 0 XXXXXX 112113 8-06 TOTAL (Lines 111 and 112) 6,582,002 XXXXXX 113114 8-07 TOTAL - REVENUE & NON-REVENUE (Lines 110 and 113) 635,974,425 XXXXXX 114
9 Train Hours (M)115 9-01 Road Service 7,686,571 XXXXXX 115116 9-0 Train Switching 212,225 XXXXXX 116117 10 TOTAL YARD-SWITCHING HOURS (N) 2,279,611 XXXXXX 117
11 Train-Miles Work Trains (O)118 11-01 Locomotives 2,209,304 XXXXXX 118119 11-02 Motorcars 0 XXXXXX 119
12 Number of Loaded Freight Cars (P)120 12-01 Unit Trains 3,604,664 XXXXXX 120121 12-02 Way Trains 2,308,603 XXXXXX 121122 12-03 Through Trains 5,076,066 XXXXXX 122123 13 TOFC/COFC- No. of Revenue Trailers & Containers Loaded and Unloaded (Q) 7,667,348 XXXXXX 123124 14 Multi-Level Cars - No. of Motor Vehicles Loaded & Unloaded (Q) 2,515,758 XXXXXX 124125 15 TOFC/COFC - No. of Revenue Trailers Picked Up & Delivered (R) 145,192 XXXXXX 125
16 Revenue-Tons Marine Terminal (S)126 16-01 Marine Terminals - Coal 0 XXXXXX 126127 16-02 Marine Terminals - Ore 8,768,340 XXXXXX 127128 16-03 Marine Terminals - Other 0 XXXXXX 128129 16-04 TOTAL (Lines 126 - 128) 8,768,340 XXXXXX 129
17 Number of Foreign Per-Diem Cars on Line (T)130 17-01 Serviceable 11,448 XXXXXX 130131 17-02 Unserviceable 275 XXXXXX 131132 17-03 Surplus 399 XXXXXX 132133 17-04 TOTAL (Lines 130 - 132) 12,122 XXXXXX 133134 TOFC/COFC - Average No. of Units Loaded Per Car 5.20 XXXXXX 134
Railroad Annual Report R-1

Road Initials: BNSF Year 2016 81
PTC Supplement
TO THE
SURFACE TRANSPORTATION BOARD
FOR THE
YEAR ENDED DECEMBER 31, 2016
Railroad Annual Report R-1
Schedules 330, 332, 335, 352B, 410, 700, 710, 710S, 720, and Footnote: PTC Grants

82 Road Initials: BNSF Year 2016
PTC 330. ROAD PROPERTY AND EQUIPMENT AND IMPROVEMENTS TO LEASED PROPERTY AND EQUIPMENT
(Dollars in Thousands)
Expenditures during Expenditures during
Balance at the year for original the year for purchase
Line Cross Beginning road & equipment of existing lines, Line
No. No. Account of year & road extensions reorganizations, etc. No.
(a) (b) (c) (d)
1 2 (2) Land for transportation purposes 123 1
2 3 (3) Grading 2
3 4 (4) Other right-of-way expenditures 3
4 5 (5) Tunnels and subways 4
5 6 (6) Bridges, trestles and culverts 5
6 7 (7) Elevated structures 6
7 8 (8) Ties 7
8 9 (9) Rail and other track material 42,033 8
9 11 (11) Ballast 9
10 13 (13) Fences, snowsheds and signs 10
11 16 (16) Station and office buildings 2,811 11
12 17 (17) Roadway buildings 12
13 18 (18) Water stations 13
14 19 (19) Fuel stations 14
15 20 (20) Shops and enginehouses 15
16 22 (22) Storage warehouses 16
17 23 (23) Wharves and docks 17
18 24 (24) Coal and ore wharves 18
19 25 (25) TOFC/COFC terminals 19
20 26 (26) Communications systems 59,288 20
21 27 (27) Signals and interlockers 821,592 21
22 29 (29) Power plants 22
23 31 (31) Power transmission systems 23
24 35 (35) Miscellaneous structures 24
25 37 (37) Roadway machines 25
26 39 (39) Public improvements - construction 26
27 44 (44) Shop machinery 27
28 45 (45) Power plant machinery 28
29 Other lease/rentals 29
30 TOTAL EXPENDITURES FOR ROAD 925,847 30
31 52 (52) Locomotives 259,339 31
32 53 (53) Freight train cars 32
33 54 (54) Passenger train cars 33
34 55 (55) Highway revenue equipment 34
35 56 (56) Floating equipment 35
36 57 (57) Work equipment 36
37 58 (58) Miscellaneous equipment 4,732 37
38 59 (59) Computer systems & word processing equipment 22,292 38
39 TOTAL EXPENDITURES FOR EQUIPMENT 286,363 39
40 76 (76) Interest during construction 40
41 80 (80) Other elements of investment 41
42 90 (90) Construction work in progress 220,811 42
43 GRAND TOTAL 1,433,021 43
* PTC-related expenditures from passenger-only service not otherwise captured in this schedule shall be stated in the aggregate here: None Noted.
** Excludes investments in equity method of $61,151 and $4,365 for MCC and PTC 220 companies, respectively
Railroad Annual Report R-1

Road Initials: BNSF Year 2016 83
PTC 330. ROAD PROPERTY AND EQUIPMENT AND IMPROVEMENTS TO LEASED PROPERTY AND EQUIPMENT - (Continued)
(Dollars in Thousands)
Line Cross Expenditures for additions Credits for property retired Net changes Balance at Line
No. No. during the year during the year during the year close of year No.
(e) (f) (g) (h)
1 2 (88) (88) 35 1
2 3 - - - 2
3 4 - - - 3
4 5 - - - 4
5 6 - - - 5
6 7 - - - 6
7 8 - - - 7
8 9 (12,549) (12,549) 29,484 8
9 11 - - - 9
10 13 - - - 10
11 16 - - 2,811 11
12 17 - - - 12
13 18 - - - 13
14 19 - - - 14
15 20 - - - 15
16 22 - - - 16
17 23 - - - 17
18 24 - - - 18
19 25 - - - 19
20 26 8,799 8,799 68,087 20
21 27 168,304 168,304 989,896 21
22 29 - - - 22
23 31 - - - 23
24 35 - - - 24
25 37 - - - 25
26 39 - - - 26
27 44 - - - 27
28 45 - - - 28
29 - - 29
30 164,466 164,466 1,090,313 30
31 52 34,363 34,363 293,702 31
32 53 - - - 32
33 54 - - - 33
34 55 - - - 34
35 56 - - - 35
36 57 - - - 36
37 58 - - 4,732 37
38 59 36,759 36,759 59,051 38
39 71,122 71,122 357,485 39
40 76 - - 40
41 80 - - 41
42 90 (73,952) (73,952) 146,859 42
43 161,636 161,636 1,594,657 43
Railroad Annual Report R-1

84 Road Initials: BNSF Year 2016
PTC 332. DEPRECIATION BASE AND RATES - ROAD AND EQUIPMENT OWNED AND LEASED FROM OTHERS (Dollars in Thousands)
1. Show in columns (b) and (e), for each primary account, the depreciation base used to compute depreciation charges for the month of January, and in columns (c) and (f), the depreciation charges for the month of December. In columns (d) and (g) show the composite rates used in computing depreciation charges for December, and on lines 30 and 39 of these columns show the composite percentage for all road and equipment accounts, respectively, ascertained by applying the primary account composite rates to the depreciation base used in computing the charges for December, and dividing that total by the total depreciation base for the same month. The depreciation base should not include cost of equipment used, but not owned, when the rents are included in rent for equipment and account nos. 31-22-00, 31-23-00, 31-25-00, 31-21-00, 35-21-00, 35-23-00, 35-22-00, and 35-25-00. It should include cost of equipment owned and leased to others when the rents therefrom are included in the rent for equipment, accounts nos. 32-21-00, 32-22-00, 32-23-00, 32-25-00, 36-21-00, 36-22-00, 36-23-00, and 36-25-00., inclusive. Composite rates used should be those prescribed or authorized by the Board, except that where the use of component rates has been authorized, the composite rates to be shown for the respective primary accounts should be recomputed from the December charges developed by the use of the authorized rates. If any changes in rates were effective during the year, give particulars in a footnote.
2. All leased property may be combined and one composite rate computed for each primary account, or a separate schedule may be included for each such property.
3. Show in columns (e), (f), and (g) data applicable to lessor property, when the rent therefore is included in accounts nos. 31-11-00, 31-12-00, 31-13-00, 31-21-00, 31-22-00, and 31-23-00, inclusive.
4. If depreciation accruals have been discontinued for any account, the depreciation base should be reported, nevertheless, in support of depreciation reserves. Authority for discontinuance of accruals should be shown in a footnote, indicating the effected account(s).
5. Disclosures in the respective sections of this schedule may be omitted if either total road leased from others or total equipment leased from others represents less than 5% of total road owned or total equipment owned, respectively.
OWNED AND USED LEASED FROM OTHERS
Depreciation Base Annual Depreciation Base Annual
composite composite
Line Account At beginning At close rate At beginning At close rate Line
No. of year of year % of year of year % No.
(a) (b) (c) (d) (e) (f) (g)
ROAD
1 (3) Grading 1
2 (4) Other right-of-way expenditures 2
3 (5) Tunnels and subways 3
4 (6) Bridges, trestles and culverts 4
5 (7) Elevated structures 5
6 (8) Ties 6
7 (9) Rail and other track material 42,033 29,484 3.05% 7
8 (11) Ballast 8
9 (13) Fences, snowsheds and signs 9
10 (16) Station and office buildings 2,811 2,811 2.80% 10
11 (17) Roadway buildings 11
12 (18) Water stations 12
13 (19) Fuel stations 13
14 (20) Shops and enginehouses 14
15 (22) Storage warehouses 15
16 (23) Wharves and docks 16
17 (24) Coal and ore wharves 17
18 (25) TOFC/COFC terminals 18
19 (26) Communications systems 59,288 68,087 7.43% 19
20 (27) Signals and interlockers 821,592 989,896 3.85% 20
21 (29) Power plants 21
22 (31) Power transmission systems 22
23 (35) Miscellaneous structures 23
24 (37) Roadway machines 24
25 (39) Public improvements - construction 25
26 (44) Shop machinery 26
27 (45) Power plant machinery 27
28 All other road accounts 28
29 Amortization (other than def. projects) 29
30 TOTAL ROAD 925,724 1,090,278 4.05% 30
EQUIPMENT
31 (52) Locomotives 259,339 293,702 14.29% 31
32 (53) Freight train cars 32
33 (54) Passenger train cars 33
34 (55) Highway revenue equipment 34
35 (56) Floating equipment 35
36 (57) Work equipment 36
37 (58) Miscellaneous equipment 4,732 4,732 9.21% 37
38 (59) Computer systems & WP equipment 22,292 59,051 11.28% 38
39 TOTAL EQUIPMENT 286,363 357,485 13.72% 39
40 GRAND TOTAL 1,212,087 1,447,763 NA NA 40
* The annual composite rates in column (d) are the prescribed rates for account 27 and 52. Accounts 9, 26, 58 and 59 contain multiple class
component rates and were recomputed in line with the instructions. As such, the PTC composite rates will differ from Federal Schedule 332 rates.
* PTC-related expenditures from passenger-only service not otherwise captured in this schedule shall be stated in the aggregate here: None Noted.
Railroad Annual Report R-1
TOTAL ROAD AND
EQUIPMENT LEASED FROM
OTHERS IS LESS THAN 5%
OF TOTAL OWNED

Road Initials: BNSF Year 2016 85
PTC 335. ACCUMULATED DEPRECIATION - ROAD AND EQUIPMENT OWNED AND USED
(Dollars in Thousands)
1. Disclose the required information regarding credits and debits to Account No. 735, "Accumulated Depreciation: Road and Equipment Property" during the year relating to owned and used road and equipment.
Include entries for depreciation of equipment owned but not used when the resulting rents are included in the "Lease Rentals - Credit - Equipment" accounts and "Other Rents - Credit - Equipment" accounts. Exclude any entries for
depreciation of equipment that is used but not owned when the resulting rents are included in "Lease Rental - Debit - Equipment" accounts and "Other Rents - Debit - Equipment" accounts. (See Schedule 351 for accumulated
depreciation to road and equipment owned and leased to others.)
2. If any data are included in columns (d) or (f), explain the entries in detail.
3. A debit balance in columns (b) or (g) for any primary account should be designated "Dr."
4. If there is any inconsistency between credits to reserves as shown in column (c) and charges to operating expenses, a full explanation should be gvien.
5. Include authorized amortization amounts in column (c) on the lines for the affected accounts.
CREDITS TO RESERVE DEBITS TO RESERVE
Balance During the year During the year Balance
Line Cross at Charges to at close Line
No. Check Account beginning operating Other Retirements Other of No.
of year expenses credits debits year
(a) (b) (c) (d) (e) (f) (g)
ROAD
1 (3) Grading 1
2 (4) Other right-of-way expenditures 2
3 (5) Tunnels and subways 3
4 (6) Bridges, trestles and culverts 4
5 (7) Elevated structures 5
6 (8) Ties 6
7 (9) Rail and other track material 3,229 278 3,507 7
8 (11) Ballast 8
9 (13) Fences, snowsheds and signs 9
10 (16) Station and office buildings 53 78 131 10
11 (17) Roadway buildings 11
12 (18) Water stations 12
13 (19) Fuel stations 13
14 (20) Shops and enginehouses 14
15 (22) Storage warehouses 15
16 (23) Wharves and docks 16
17 (24) Coal and ore wharves 17
18 (25) TOFC/COFC terminals 18
19 (26) Communications systems 9,401 4,873 14,274 19
20 (27) Signals and interlockers 77,276 35,060 112,336 20
21 (29) Power plants 21
22 (31) Power transmission systems 22
23 (35) Miscellaneous structures 23
24 (37) Roadway machines 24
25 (39) Public improvements - const. 25
26 (44) Shop machinery 26
27 (45) Power plant machinery 27
28 All other road accounts 28
29 Amortization (adjustments) 29
30 TOTAL ROAD 89,959 40,289 130,248 30
EQUIPMENT
31 (52) Locomotives 47,022 40,563 87,585 31
32 (53) Freight train cars 32
33 (54) Passenger train cars 33
34 (55) Highway revenue equipment 34
35 (56) Floating equipment 35
36 (57) Work equipment 36
37 (58) Miscellaneous equipment 2,140 427 2,567 37
38 (59) Computer systems & WP equip. 9,001 2,962 11,963 38
39 Amortization (adjustments) 39
40 TOTAL EQUIPMENT 58,163 43,952 102,115 40
41 GRAND TOTAL 148,122 84,241 232,363 41
* PTC-related expenditures from passenger-only service not otherwise captured in this schedule shall be stated in the aggregate here: None Noted.
Railroad Annual Report R-1
Notes and Remarks

86 Road Initials: BNSF Year 2016
PTC 352B. INVESTMENT IN RAILROAD PROPERTY USED IN TRANSPORTATION SERVICE (By Property Account)
(Dollars in Thousands)
1. In columns (b) through (e) give, by primary accounts, the amount of investment at the close of the year in property of respondent and each group or class of companies and properties.
2. The amounts for respondent and for each group or class of companies and properties on line 44 should correspond with the amounts for each class of company and property shown in
Schedule 352A. Continuing records shall be maintained by respondent of the primary property accounts separately for each company or property included in this schedule.
3. Report on line 29 amounts representing capitalization of rentals for leased property based on 6% per year where property is not classified by accounts by noncarrier owners, or where the cost
of property leased from other carriers is not ascertainable. Identify noncarrier owners, and briefly explain on page 39 the methods of estimating value of property on noncarriers or property of other carriers.
4. Report on line 30 amounts not included in the accounts shown, or on line 29. The items reported should be briefly identified and explained. Also include here those items after permission
is obtained from the Board for exceptions to prescribed accounting. Reference to such authority should be made when explaining amounts reported. Respondents must not make arbitrary changes
to the printed stub or column headings without specific authority from the Board.
Line Cross Account Respondent Lessor Inactive (proprie- Other leased Line
No. Check Railroads tary companies) properties No.
(a) (b) (c) (d) (e)*
1 (2) Land for transportation purposes 35 1
2 (3) Grading - 2
3 (4) Other right-of-way expenditures - 3
4 (5) Tunnels and subways - 4
5 (6) Bridges, trestles and culverts - 5
6 (7) Elevated structures - 6
7 (8) Ties - 7
8 (9) Rail and other track material 29,484 8
9 (11) Ballast - 9
10 (13) Fences, snowsheds and signs - 10
11 (16) Station and office buildings 2,811 11
12 (17) Roadway buildings - 12
13 (18) Water stations - 13
14 (19) Fuel stations - 14
15 (20) Shops and enginehouses - 15
16 (22) Storage warehouses - 16
17 (23) Wharves and docks - 17
18 (24) Coal and ore wharves - 18
19 (25) TOFC/COFC terminals - 19
20 (26) Communications systems 68,087 20
21 (27) Signals and interlockers 989,896 21
22 (29) Power plants - 22
23 (31) Power transmission systems - 23
24 (35) Miscellaneous structures - 24
25 (37) Roadway machines - 25
26 (39) Public improvements - construction - 26
27 (44) Shop machinery - 27
28 (45) Power plant machinery - 28
29 Leased property (capitalized rentals) - 29
30 Other (specify and explain) - 30
31 TOTAL ROAD 1,090,313 31
32 (52) Locomotives 293,702 32
33 (53) Freight train cars - 33
34 (54) Passenger train cars - 34
35 (55) Highway revenue equipment - 35
36 (56) Floating equipment - 36
37 (57) Work equipment - 37
38 (58) Miscellaneous equipment 4,732 38
39 (59) Computer systems & WP equipment 59,051 39
40 TOTAL EQUIPMENT 357,485 40
41 (76) Interest during construction - 41
42 (80) Other elements of investment - 42
43 (90) Construction work in progress 146,859 43
44 GRAND TOTAL 1,594,657 44
* No PTC investment on leased lines through 12/31/2016
** PTC-related expenditures from passenger-only service not otherwise captured in this schedule shall be stated in the aggregate here: None Noted.
Railroad Annual Report R-1

PTC
410
. R
AILW
AY O
PER
ATIN
G E
XPEN
SES
(Dol
lars
in T
hous
ands
)
Sta
te th
e ra
ilway
ope
ratin
g ex
pens
es o
n re
spon
dent
's ro
ad fo
r the
yea
r, cl
assi
fyin
g th
em in
acc
orda
nce
with
the
Uni
form
Sys
tem
of A
ccou
nts
for R
ailro
ad C
ompa
nies
, and
allo
cate
the
com
mon
oper
atin
g ex
pens
es in
acc
orda
nce
with
the
Boa
rd's
rule
s go
vern
ing
the
sepa
ratio
n of
suc
h ex
pens
es b
etw
een
freig
ht a
nd p
asse
nger
ser
vice
s.
Mat
eria
l, to
ols,
Tota
lLi
neC
ross
Nam
e of
railw
ay o
pera
ting
expe
nse
acco
unt
Sal
arie
ssu
pplie
s, fu
els,
Pur
chas
edG
ener
alfre
ight
Pas
seng
erTo
tal
Line
No.
Che
ck&
Wag
es&
lubr
ican
tsse
rvic
esex
pens
eN
o.(a
)(b
)(c
)(d
)(e
)(f)
(g)
(h)
WA
YS &
STR
UC
TUR
ES
AD
MIN
ISTR
ATI
ON
1Tr
ack
12
Brid
ge &
bui
ldin
g2
3S
igna
l45
910
715
268
786
786
34
Com
mun
icat
ion
240
240
240
45
Oth
er5
RE
PA
IRS
AN
D M
AIN
TEN
AN
CE
6R
oadw
ay -
runn
ing
41
55
67
Roa
dway
- sw
itchi
ng7
8Tu
nnel
s &
sub
way
s -
runn
ing
89
Tunn
els
& s
ubw
ays
- sw
itchi
ng9
10B
ridge
s &
cul
verts
- ru
nnin
g10
11B
ridge
s &
cul
verts
- sw
itchi
ng11
12Ti
es -
runn
ing
1213
Ties
- sw
itchi
ng13
14R
ail &
oth
er tr
ack
mat
eria
l - ru
nnin
g30
131
3114
15R
ail &
oth
er tr
ack
mat
eria
l - s
witc
hing
1516
Bal
last
- ru
nnin
g16
17B
alla
st -
switc
hing
1718
Roa
d pr
oper
ty d
amag
ed -
runn
ing
1819
Roa
d pr
oper
ty d
amag
ed -
switc
hing
1920
Roa
d pr
oper
ty d
amag
ed -
othe
r20
21S
igna
ls &
inte
rlock
ers
- run
ning
1,91
132
96,
043
168,
299
8,29
921
22S
igna
ls &
inte
rlock
ers
- sw
itchi
ng22
23C
omm
unic
atio
ns s
yste
ms
2,39
69
102,
415
2,41
523
24P
ower
sys
tem
s24
25H
ighw
ay g
rade
cro
ssin
gs -
runn
ing
2526
Hig
hway
gra
de c
ross
ings
- sw
itchi
ng26
27S
tatio
n &
offi
ce b
uild
ings
77
727
28S
hop
build
ings
- lo
com
otiv
es28
29S
hop
build
ings
- fre
ight
car
sN
/A29
30S
hop
build
ings
- ot
her e
quip
men
t30
Road Initials: BNSF Year 2016 87
Railroad Annual Report R-1

PTC
410
. R
AILW
AY O
PER
ATIN
G E
XPEN
SES
- (C
ontin
ued)
(Dol
lars
in T
hous
ands
)
Mat
eria
l, to
ols,
Tota
lLi
neC
ross
Nam
e of
railw
ay o
pera
ting
expe
nse
acco
unt
Sal
arie
ssu
pplie
s, fu
els,
Pur
chas
edG
ener
alfre
ight
Pas
seng
erTo
tal
Line
No.
Che
ck&
Wag
es&
lubr
ican
tsse
rvic
esex
pens
eN
o.(a
)(b
)(c
)(d
)(e
)(f)
(g)
(h)
RE
PA
IRS
AN
D M
AIN
TEN
AN
CE
- (C
ontin
ued)
101
Loco
mot
ive
serv
icin
g fa
cilit
ies
101
102
Mis
cella
neou
s bu
ildin
gs &
stru
ctur
es4
19
1414
102
103
Coa
l ter
min
als
N/A
103
104
Ore
term
inal
sN
/A10
410
5O
ther
mar
ine
term
inal
sN
/A10
510
6TO
FC/C
OFC
term
inal
sN
/A10
610
7M
otor
veh
icle
load
ing
& d
istri
butio
n fa
cilit
ies
N/A
107
108
Faci
litie
s fo
r oth
er s
peci
aliz
ed s
ervi
ce o
pera
tions
N/A
108
109
Roa
dway
mac
hine
s2
13
310
911
0S
mal
l too
ls &
sup
plie
s35
112
4848
110
111
Sno
w re
mov
al26
329
2911
111
2Fr
inge
ben
efits
- ru
nnin
gN
/AN
/AN
/A1,
982
1,98
21,
982
112
113
Frin
ge b
enef
its -
switc
hing
N/A
N/A
N/A
113
114
Frin
ge b
enef
its -
othe
rN
/AN
/AN
/A10
410
410
411
411
5C
asua
lties
& in
sura
nce
- run
ning
N/A
N/A
N/A
115
116
Cas
ualti
es &
insu
ranc
e - s
witc
hing
N/A
N/A
N/A
116
117
Cas
ualti
es &
insu
ranc
e - o
ther
N/A
N/A
N/A
117
118
*Le
ase
rent
als
- deb
it -ru
nnin
gN
/AN
/AN
/A11
811
9*
Leas
e re
ntal
s - d
ebit
-sw
itchi
ngN
/AN
/AN
/A11
912
0*
Leas
e re
ntal
s - d
ebit
-oth
erN
/AN
/AN
/A12
012
1*
Leas
e re
ntal
s - (
cred
it) -
runn
ing
N/A
N/A
N/A
121
122
*Le
ase
rent
als
- (cr
edit)
- sw
itchi
ngN
/AN
/AN
/A12
212
3*
Leas
e re
ntal
s - (
cred
it) -
othe
rN
/AN
/AN
/A12
312
4Jo
int f
acili
ty re
nt -
debi
t - ru
nnin
gN
/AN
/AN
/A12
412
5Jo
int f
acili
ty re
nt -
debi
t - s
witc
hing
N/A
N/A
N/A
125
126
Join
t fac
ility
rent
- de
bit -
oth
erN
/AN
/AN
/A12
612
7Jo
int f
acili
ty re
nt -
(cre
dit)
- run
ning
N/A
N/A
N/A
127
128
Join
t fac
ility
rent
- (c
redi
t) - s
witc
hing
N/A
N/A
N/A
128
129
Join
t fac
ility
rent
- (c
redi
t) - o
ther
N/A
N/A
N/A
129
130
*O
ther
rent
s - d
ebit
- run
ning
N/A
N/A
N/A
130
131
*O
ther
rent
s - d
ebit
- sw
itchi
ngN
/AN
/AN
/A13
113
2*
Oth
er re
nts
- deb
it - o
ther
N/A
N/A
N/A
132
133
*O
ther
rent
s - (
cred
it) -
runn
ing
N/A
N/A
N/A
133
Railroad Annual Report R-1
88 Road Initials: BNSF Year 2016

PTC
410
. R
AILW
AY O
PER
ATIN
G E
XPEN
SES
- (C
ontin
ued)
(Dol
lars
in T
hous
ands
)
Mat
eria
l, to
ols,
Tota
lLi
neC
ross
Nam
e of
railw
ay o
pera
ting
expe
nse
acco
unt
Sal
arie
ssu
pplie
s, fu
els,
Pur
chas
edG
ener
alfre
ight
Pas
seng
erTo
tal
Line
No.
Che
ck&
Wag
es&
lubr
ican
tsse
rvic
esex
pens
eN
o.(a
)(b
)(c
)(d
)(e
)(f)
(g)
(h)
RE
PA
IRS
AN
D M
AIN
TEN
AN
CE
- (C
ontin
ued)
134
*O
ther
rent
s - (
cred
it) -
switc
hing
N/A
N/A
N/A
134
135
*O
ther
rent
s - (
cred
it) -
othe
rN
/AN
/AN
/A13
513
6*
Dep
reci
atio
n - r
unni
ngN
/AN
/AN
/A27
827
827
813
613
7*
Dep
reci
atio
n - s
witc
hing
N/A
N/A
N/A
137
138
*D
epre
ciat
ion
- oth
erN
/AN
/AN
/A40
,011
40,0
1140
,011
138
139
Join
t fac
ility
- de
bit -
runn
ing
N/A
N/A
N/A
139
140
Join
t fac
ility
- de
bit -
sw
itchi
ngN
/AN
/AN
/A14
014
1Jo
int f
acili
ty -
debi
t - o
ther
N/A
N/A
N/A
141
142
Join
t fac
ility
- (c
redi
t) - r
unni
ngN
/AN
/AN
/A14
214
3Jo
int f
acili
ty -
(cre
dit)
- sw
itchi
ngN
/AN
/AN
/A14
314
4Jo
int f
acili
ty -
(cre
dit)
- oth
erN
/AN
/AN
/A14
414
5D
ism
antli
ng re
tired
road
pro
perty
- ru
nnin
g14
514
6D
ism
antli
ng re
tired
road
pro
perty
- sw
itchi
ng14
614
7D
ism
antli
ng re
tired
road
pro
perty
- ot
her
147
148
Oth
er -
runn
ing
148
149
Oth
er -
switc
hing
149
150
Oth
er -
othe
r15
015
1TO
TAL
WA
Y A
ND
STR
UC
TUR
ES
5,07
048
46,
226
42,4
7254
,252
54,2
5215
1E
QU
IPM
EN
TLO
CO
MO
TIV
ES
201
Adm
inis
tratio
n40
4282
8220
120
2*
Rep
air &
mai
nten
ance
1,77
81,
778
1,77
820
220
3*
Mac
hine
ry re
pair
203
204
Equ
ipm
ent d
amag
ed20
420
5Fr
inge
ben
efits
N/A
N/A
N/A
785
785
785
205
206
Oth
er c
asua
lties
& in
sura
nce
N/A
N/A
N/A
206
207
*Le
ase
rent
als
- deb
itN
/AN
/AN
/A20
720
8*
Leas
e re
ntal
s - (
cred
it)N
/AN
/AN
/A20
820
9Jo
int f
acili
ty re
nt -
debi
tN
/AN
/AN
/A20
921
0Jo
int f
acili
ty re
nt -
(cre
dit)
N/A
N/A
N/A
210
211
*O
ther
rent
s - d
ebit
N/A
N/A
N/A
211
212
*O
ther
rent
s - (
cred
it)N
/AN
/AN
/A21
221
3*
Dep
reci
atio
nN
/AN
/A40
,563
40,5
6340
,563
213
214
Join
t fac
ility
- de
bit
N/A
N/A
N/A
214
215
Join
t fac
ility
- (c
redi
t)N
/AN
/AN
/A21
521
6*
Rep
airs
bill
ed to
oth
ers
- (cr
edit)
N/A
N/A
216
Road Initials: BNSF Year 2016 89
Railroad Annual Report R-1
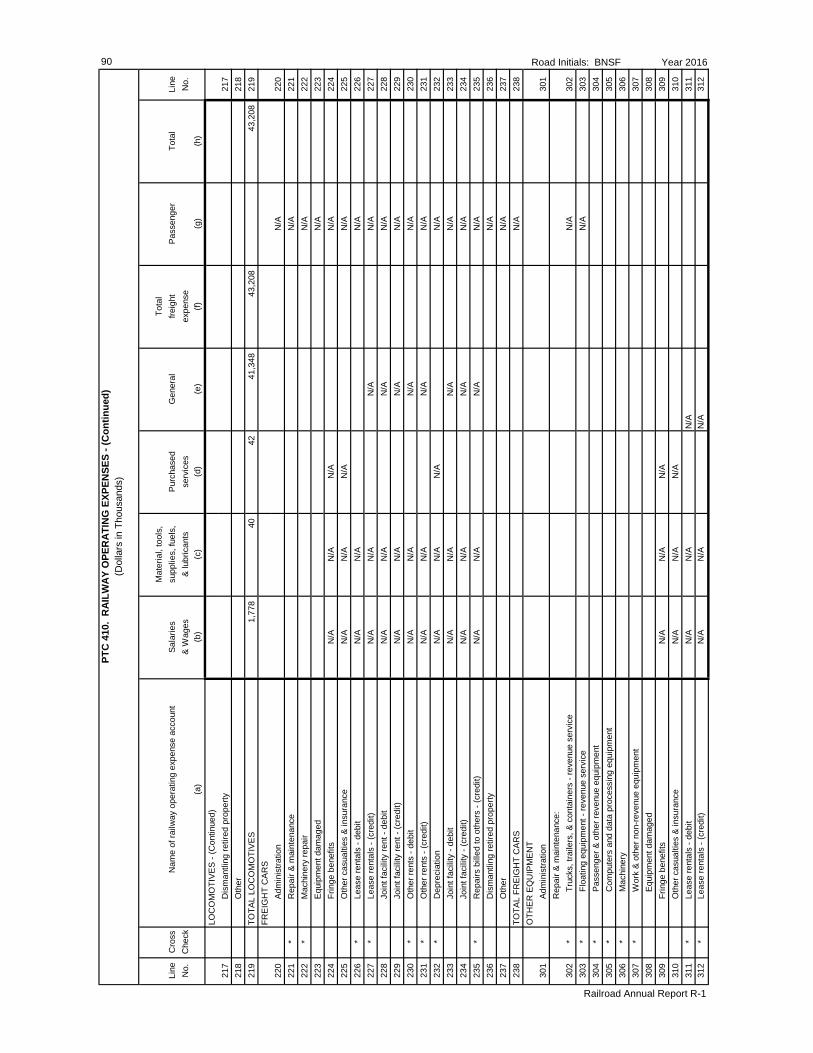
PTC
410
. R
AILW
AY O
PER
ATIN
G E
XPEN
SES
- (C
ontin
ued)
(Dol
lars
in T
hous
ands
)
Mat
eria
l, to
ols,
Tota
lLi
neC
ross
Nam
e of
railw
ay o
pera
ting
expe
nse
acco
unt
Sal
arie
ssu
pplie
s, fu
els,
Pur
chas
edG
ener
alfre
ight
Pas
seng
erTo
tal
Line
No.
Che
ck&
Wag
es&
lubr
ican
tsse
rvic
esex
pens
eN
o.(a
)(b
)(c
)(d
)(e
)(f)
(g)
(h)
LOC
OM
OTI
VE
S -
(Con
tinue
d)21
7D
ism
antli
ng re
tired
pro
perty
217
218
Oth
er21
821
9TO
TAL
LOC
OM
OTI
VE
S1,
778
4042
41,3
4843
,208
43,2
0821
9FR
EIG
HT
CA
RS
220
Adm
inis
tratio
nN
/A22
022
1*
Rep
air &
mai
nten
ance
N/A
221
222
*M
achi
nery
repa
irN
/A22
222
3E
quip
men
t dam
aged
N/A
223
224
Frin
ge b
enef
itsN
/AN
/AN
/AN
/A22
422
5O
ther
cas
ualti
es &
insu
ranc
eN
/AN
/AN
/AN
/A22
522
6*
Leas
e re
ntal
s - d
ebit
N/A
N/A
N/A
226
227
*Le
ase
rent
als
- (cr
edit)
N/A
N/A
N/A
N/A
227
228
Join
t fac
ility
rent
- de
bit
N/A
N/A
N/A
N/A
228
229
Join
t fac
ility
rent
- (c
redi
t)N
/AN
/AN
/AN
/A22
923
0*
Oth
er re
nts
- deb
itN
/AN
/AN
/AN
/A23
023
1*
Oth
er re
nts
- (cr
edit)
N/A
N/A
N/A
N/A
231
232
*D
epre
ciat
ion
N/A
N/A
N/A
N/A
232
233
Join
t fac
ility
- de
bit
N/A
N/A
N/A
N/A
233
234
Join
t fac
ility
- (c
redi
t)N
/AN
/AN
/AN
/A23
423
5*
Rep
airs
bill
ed to
oth
ers
- (cr
edit)
N/A
N/A
N/A
N/A
235
236
Dis
man
tling
retir
ed p
rope
rtyN
/A23
623
7O
ther
N/A
237
238
TOTA
L FR
EIG
HT
CA
RS
N/A
238
OTH
ER
EQ
UIP
ME
NT
301
Adm
inis
tratio
n30
1R
epai
r & m
aint
enan
ce:
302
*
Truc
ks, t
raile
rs, &
con
tain
ers
- rev
enue
ser
vice
N/A
302
303
*
Floa
ting
equi
pmen
t - re
venu
e se
rvic
eN
/A30
330
4*
P
asse
nger
& o
ther
reve
nue
equi
pmen
t30
430
5*
C
ompu
ters
and
dat
a pr
oces
sing
equ
ipm
ent
305
306
*
Mac
hine
ry30
630
7*
W
ork
& o
ther
non
-rev
enue
equ
ipm
ent
307
308
E
quip
men
t dam
aged
308
309
Frin
ge b
enef
itsN
/AN
/AN
/A30
931
0O
ther
cas
ualti
es &
insu
ranc
eN
/AN
/AN
/A31
031
1*
Leas
e re
ntal
s - d
ebit
N/A
N/A
N/A
311
312
*Le
ase
rent
als
- (cr
edit)
N/A
N/A
N/A
312
Railroad Annual Report R-1
90 Road Initials: BNSF Year 2016

PTC
410
. R
AILW
AY O
PER
ATIN
G E
XPEN
SES
- (C
ontin
ued)
(Dol
lars
in T
hous
ands
)
Mat
eria
l, to
ols,
Tota
lLi
neC
ross
Nam
e of
railw
ay o
pera
ting
expe
nse
acco
unt
Sal
arie
ssu
pplie
s, fu
els,
Pur
chas
edG
ener
alfre
ight
Pas
seng
erTo
tal
Line
No.
Che
ck&
Wag
es&
lubr
ican
tsse
rvic
esex
pens
eN
o.(a
)(b
)(c
)(d
)(e
)(f)
(g)
(h)
OTH
ER
EQ
UIP
ME
NT
(Con
tinue
d)31
3Jo
int f
acili
ty re
nt -
debi
tN
/AN
/AN
/A31
331
4Jo
int f
acili
ty re
nt -
(cre
dit)
N/A
N/A
N/A
314
315
Oth
er re
nts
- deb
itN
/AN
/AN
/A31
531
6O
ther
rent
s - (
cred
it)N
/AN
/AN
/A31
631
7D
epre
ciat
ion
N/A
N/A
N/A
3,38
93,
389
3,38
931
731
8Jo
int f
acili
ty -
debi
tN
/AN
/AN
/A31
831
9Jo
int f
acili
ty -
(cre
dit)
N/A
N/A
N/A
319
320
Rep
airs
bill
ed to
oth
ers
- (cr
edit)
N/A
N/A
N/A
320
321
Dis
man
tling
retir
ed p
rope
rty32
132
2O
ther
322
323
TOTA
L O
THE
R E
QU
IPM
EN
T3,
389
3,38
93,
389
323
324
TOTA
L E
QU
IPM
EN
T1,
778
4042
44,7
3746
,597
46,5
9732
4TR
AN
SP
OR
TATI
ON
TR
AIN
OP
ER
ATI
ON
S40
1A
dmin
istra
tion
401
402
Eng
ine
crew
s5,
194
45,
198
5,19
840
240
3Tr
ain
crew
s1,
551
11,
552
1,55
240
340
4D
ispa
tchi
ng tr
ains
404
405
Ope
ratin
g si
gnal
s &
inte
rlock
ers
405
406
Ope
ratin
g dr
awbr
idge
s40
640
7H
ighw
ay c
ross
ing
prot
ectio
n6
66
407
408
Trai
n in
spec
tion
& lu
bric
atio
n40
840
9Lo
com
otiv
e fu
el40
9
410
Ele
ctric
pow
er p
rodu
ced
or
pur
chas
ed fo
r mot
ive
pow
er41
041
1S
ervi
cing
loco
mot
ives
411
412
Frei
ght l
ost o
r dam
aged
- so
lely
rela
ted
N/A
N/A
N/A
412
413
Cle
arin
g w
reck
s41
341
4Fr
inge
ben
efits
N/A
N/A
N/A
2,69
42,
694
2,69
441
441
5O
ther
cas
ualti
es &
insu
ranc
eN
/AN
/AN
/A41
541
6Jo
int f
acili
ty -
debi
tN
/AN
/AN
/A41
641
7Jo
int f
acili
ty -
(cre
dit)
N/A
N/A
N/A
417
418
Oth
er41
841
9TO
TAL
TRA
IN O
PE
RA
TIO
NS
6,74
511
2,69
49,
450
9,45
041
9YA
RD
OP
ER
ATI
ON
S42
0A
dmin
istra
tion
420
421
Sw
itch
crew
s11
711
711
742
1
Road Initials: BNSF Year 2016 91
Railroad Annual Report R-1

PTC
410
. R
AILW
AY O
PER
ATIN
G E
XPEN
SES
- (C
ontin
ued)
(Dol
lars
in T
hous
ands
)
Mat
eria
l, to
ols,
Tota
lLi
neC
ross
Nam
e of
railw
ay o
pera
ting
expe
nse
acco
unt
Sal
arie
ssu
pplie
s, fu
els,
Pur
chas
edG
ener
alfre
ight
Pas
seng
erTo
tal
Line
No.
Che
ck&
Wag
es&
lubr
ican
tsse
rvic
esex
pens
eN
o.(a
)(b
)(c
)(d
)(e
)(f)
(g)
(h)
YAR
D O
PE
RA
TIO
NS
(Con
tinue
d)42
2C
ontro
lling
ope
ratio
ns42
242
3Ya
rd a
nd te
rmin
al c
leric
al1
11
423
424
Ope
ratin
g sw
itche
s, s
igna
ls, r
etar
ders
, & h
umps
424
425
Loco
mot
ive
fuel
425
426
Ele
ctric
pow
er e
lect
ric p
ower
pro
duce
d or
p
urch
ased
for m
otiv
e po
wer
426
427
Ser
vici
ng lo
com
otiv
es9
99
427
428
Frei
ght l
ost o
r dam
aged
- so
lely
rela
ted
N/A
N/A
N/A
428
429
Cle
arin
g w
reck
s42
943
0Fr
inge
ben
efits
N/A
N/A
N/A
5050
5043
043
1O
ther
cas
ualti
es &
insu
ranc
eN
/AN
/AN
/A43
143
2Jo
int f
acili
ty -
debi
tN
/AN
/AN
/A43
243
3Jo
int f
acili
ty -
(cre
dit)
N/A
N/A
N/A
433
434
Oth
er43
443
5TO
TAL
YAR
D O
PE
RA
TIO
NS
126
150
177
177
435
TRA
IN &
YA
RD
OP
ER
ATI
ON
S C
OM
MO
N:
501
Cle
anin
g ca
r int
erio
rsN
/A50
150
2A
djus
ting
& tr
ansf
errin
g lo
ads
N/A
N/A
502
503
Car
load
ing
devi
ces
& g
rain
doc
ksN
/AN
/A50
350
4Fr
eigh
t los
t or d
amag
ed -
all o
ther
N/A
N/A
N/A
504
505
Frin
ge b
enef
itsN
/AN
/AN
/A50
550
6TO
TAL
TRA
IN &
YA
RD
OP
ER
ATI
ON
S C
OM
MO
N:
506
SP
EC
IALI
ZED
SE
RV
ICE
OP
ER
ATI
ON
S50
7*
Adm
inis
tratio
nN
/A50
750
8*
Pic
kup
& d
eliv
ery
and
mar
ine
line
haul
N/A
508
509
*Lo
adin
g &
unl
oadi
ng a
nd lo
cal m
arin
eN
/A50
951
0*
Pro
tect
ive
serv
ices
N/A
510
511
*Fr
eigh
t los
t or d
amag
ed -
sole
ly re
late
dN
/AN
/AN
/AN
/A51
151
2*
Frin
ge b
enef
itsN
/AN
/AN
/AN
/A51
251
3*
Cas
ualti
es &
insu
ranc
eN
/AN
/AN
/AN
/A51
351
4*
Join
t fac
ility
- de
bit
N/A
N/A
N/A
N/A
514
515
*Jo
int f
acili
ty -
(cre
dit)
N/A
N/A
N/A
N/A
515
516
*O
ther
N/A
516
517
*TO
TAL
SP
EC
IALI
ZED
SE
RV
ICE
OP
ER
ATI
ON
SN
/A51
7
Railroad Annual Report R-1
92 Road Initials: BNSF Year 2016

PTC
410
. R
AILW
AY O
PER
ATIN
G E
XPEN
SES
- (C
ontin
ued)
(Dol
lars
in T
hous
ands
)
Mat
eria
l, to
ols,
Tota
lLi
neC
ross
Nam
e of
railw
ay o
pera
ting
expe
nse
acco
unt
Sal
arie
ssu
pplie
s, fu
els,
Pur
chas
edG
ener
alfre
ight
Pas
seng
erTo
tal
Line
No.
Che
ck&
Wag
es&
lubr
ican
tsse
rvic
esex
pens
eN
o.(a
)(b
)(c
)(d
)(e
)(f)
(g)
(h)
AD
MIN
ISTR
ATI
VE
sup
port
OP
ER
ATI
ON
S:
518
Adm
inis
tratio
n51
851
9E
mpl
oyee
s pe
rform
ing
cler
ical
& a
ccou
ntin
g fu
nctio
ns51
952
0C
omm
unic
atio
n sy
stem
s op
erat
ions
702
702
702
520
521
Loss
& d
amag
e cl
aim
s pr
oces
sing
521
522
Frin
ge b
enef
itsN
/AN
/AN
/A52
252
3C
asua
lties
& in
sura
nce
N/A
N/A
N/A
523
524
Join
t fac
ility
- de
bit
N/A
N/A
N/A
524
525
Join
t fac
ility
- (c
redi
t)N
/AN
/AN
/A52
552
6O
ther
526
527
TO
TAL
AD
MIN
ISTR
ATI
VE
sup
port
OP
ER
ATI
ON
S70
270
270
252
752
8 T
OTA
L TR
AN
SP
OR
TATI
ON
6,87
11
713
2,74
410
,329
10,3
2952
8G
EN
ER
AL
AN
D A
DM
INIS
TRA
TIV
E60
1O
ffice
rs -
gene
ral a
dmin
istra
tion
950
4910
810
860
160
2A
ccou
ntin
g, a
uditi
ng, &
fina
nce
602
603
Man
agem
ent s
ervi
ces
& d
ata
proc
essi
ng69
969
969
960
360
4M
arke
ting
604
605
Sal
es60
560
6In
dust
rial d
evel
opm
ent
N/A
606
607
Per
sonn
el &
labo
r rel
atio
ns60
760
8Le
gal &
sec
reta
rial
608
609
Pub
lic re
latio
ns &
adv
ertis
ing
609
610
Res
earc
h &
dev
elop
men
t61
061
1Fr
inge
ben
efits
N/A
N/A
N/A
611
612
Cas
ualti
es &
insu
ranc
eN
/AN
/AN
/A61
261
3W
rited
own
of u
ncol
lect
ible
acc
ount
sN
/AN
/AN
/A61
361
4P
rope
rty ta
xes
N/A
N/A
N/A
614
615
Oth
er ta
xes
exce
pt o
n co
rpor
ate
inco
me
or p
ayro
llN
/AN
/AN
/A61
561
6Jo
int f
acili
ty -
debi
tN
/AN
/AN
/A61
661
7Jo
int f
acili
ty -
(cre
dit)
N/A
N/A
N/A
617
618
Oth
er61
861
9 T
OTA
L G
EN
ER
AL
AN
D A
DM
INIS
TRA
TIV
E9
749
4980
780
761
962
0*
TOTA
L C
AR
RIE
R O
PE
RA
TIN
G E
XPE
NS
E13
,719
534
7,73
090
,002
111,
985
111,
985
620
*PTC
-rel
ated
exp
endi
ture
s fro
m p
asse
nger
-onl
y se
rvic
e no
t oth
erw
ise
capt
ured
in th
is s
ched
ule
shal
l be
stat
ed in
the
aggr
egat
e he
re: N
one
note
d.
Road Initials: BNSF Year 2016 93
Railroad Annual Report R-1

94 Road Initials: BNSF Year 2016
PTC 700. MILEAGE OPERATED AT CLOSE OF YEAR
Running tracks, passing tracks, cross-overs, etc.Proportion Miles ofowned or Miles Miles of Miles of passing tracks, Miles of Miles of
Line Class leased by of second all other cross-overs, way switching yard switching TOTAL LineNo. respondent road main track main tracks and turnouts tracks tracks No.
(a) (b) (c) (d) (e) (f) (g) (h) (i)1 1 100% 11,323 3,512 199 1,404 16,438 12 1J 75% 23 1J 66.70% 34 1J 50% 192 23 215 45 1J 33.30% 56 1J 25% 67 1J 20% 78 1J 16.7% 8
9 Total 1J 192 23 215 910 10
11 Total 1 and 1J 11,515 3,512 199 1,427 16,653 1112 1213 2 1314 3 1415 4 1516 5 1617 1757 Grand Total 11,515 3,512 199 1,427 16,653 5758 Miles of electrified road 58
or track included in the NONE NONE NONE NONE NONE NONE NONEpreceding grand total
Running tracks, passing tracks, cross-overs, etc.Proportion Miles ofowned or Miles Miles of Miles of passing tracks, Miles of Miles of
Line Class leased by of second all other cross-overs, way switching yard switching TOTAL LineNo. respondent road main track main tracks and turnouts tracks tracks No.
(a) (b) (c) (d) (e) (f) (g) (h) (i)1 1 100% 12 1J 50% 23 Total 1 and 1J 34 2 45 5 557 57
Railroad Annual Report R-1
700. CANADIAN MILEAGE OPERATED AT THE CLOSE OF YEAR (INCLUDED IN SCHEDULE 700 ABOVE)
Grand Total Canadian Miles
Road Initials: BNSF Year 2016 95
Railroad Annual Report R-1
THIS PAGE INTENTIONALLY LEFT BLANK
NOTES AND REMARKS FOR SCHEDULE PTC 700

PTC
710
. IN
VEN
TOR
Y O
F EQ
UIP
MEN
TU
NIT
S O
WN
ED, I
NC
LUD
ED IN
INVE
STM
ENT
ACC
OU
NT,
AN
D L
EASE
D F
RO
M O
THER
S
Cha
nges
Dur
ing
the
Year
Uni
ts a
t Clo
se o
f Yea
rU
nits
Inst
alle
dA
ll ot
her u
nits
Uni
ts re
tired
incl
udin
g
from
ser
vice
Reb
uilt
units
recl
assi
ficat
ion
of re
spon
dent
Agg
rega
teU
nits
inac
quire
d an
dan
d se
cond
whe
ther
capa
city
of
serv
ice
ofN
ew u
nits
rebu
ilt u
nits
hand
uni
tsow
ned
orTo
tal i
nun
itsre
spon
dent
New
uni
tsle
ased
rew
ritte
npu
rcha
sed
leas
ed,
Ow
ned
Leas
edse
rvic
e of
repo
rted
Line
C
ross
at b
egin
ning
purc
hase
dfro
min
to p
rope
rtyor
leas
ed fr
omin
clud
ing
and
from
resp
onde
ntin
col
(j)
Leas
edLi
ne
No.
Che
ckTy
pe o
r des
ign
of u
nits
of y
ear
or b
uilt
othe
rsac
coun
tsot
hers
recl
assi
ficat
ion
used
othe
rs[c
ol (h
) & (i
)](S
ee In
s. 7
)to
oth
ers
No.
(a)
(b)
(c)
(d)
(e)
(f)(g
)(h
)(i)
(j)(k
)(l)
Loco
mot
ive
Uni
ts(H
P)
1D
iese
l-fre
ight
units
4,09
215
02
2,64
31,
597
4,24
018
,594
,000
12
Die
sel-p
asse
nger
units
23
Die
sel-m
ultip
le p
urpo
se
units
213
213
213
653,
300
34
Die
sel-s
witc
hing
units
45
*TO
TAL
(line
s 1
to 4
)un
its4,
305
150
22,
856
1,59
74,
453
19,2
47,3
005
6*
Ele
ctric
loco
mot
ives
67
*O
ther
sel
f-pow
ered
uni
ts7
8*
TOTA
L (li
nes
5, 6
, and
7)
4,30
515
02
2,85
61,
597
4,45
319
,247
,300
89
*A
uxili
ary
units
9TO
TAL
LOC
OM
OTI
VE
UN
ITS
10*
(l ine
s 8
and
9)4,
305
150
22,
856
1,59
74,
453
19,2
47,3
0010
Beg
inni
ng b
alan
ce w
ill n
ot ti
e to
end
ing
bala
nce
of p
rior y
ear d
ue to
PTC
inst
alla
tion
on 4
36 e
xist
ing
loco
mot
ives
.
DIS
TRIB
UTI
ON
OF
LOC
OM
OTI
VE U
NIT
S IN
SER
VIC
E O
F R
ESPO
ND
ENT
AT C
LOSE
OF
YEAR
BU
ILT,
DIS
REG
ARD
ING
YEA
R O
F R
EBU
ILD
ING
Dur
ing
Cal
enda
r Yea
rB
etw
een
Bet
wee
nB
etw
een
Bet
wee
nJa
n 1,
199
5Ja
n 1,
200
0Ja
n 1,
200
5Ja
n 1,
201
0Li
neC
ross
Bef
ore
and
and
and
and
Line
N
o.C
heck
Type
or d
esig
n of
uni
tsJa
n 1,
199
5D
ec 3
1, 1
999
Dec
31,
200
4D
ec 3
1, 2
009
Dec
31,
201
420
1520
1620
1720
1820
19TO
TAL
No.
(a)
(b)
(c)
(d)
(e)
(f)(g
)(h
)(i)
(j)(k
)(l)
11*
Die
sel
215
288
886
1,22
81,
361
325
150
4,45
311
12*
Ele
ctric
1213
*O
ther
sel
f-pow
ered
uni
ts13
14*
TOTA
L (li
nes
11 to
13)
215
288
886
1,22
81,
361
325
150
4,45
314
15*
Aux
iliar
y un
its15
TOTA
L LO
CO
MO
TIV
E U
NIT
S16
*(li
nes
14 a
nd 1
5)21
528
888
61,
228
1,36
132
515
04,
453
16
Road Initials: BNSF Year 201696
Railroad Annual Report R-1

PTC
710
. IN
VEN
TOR
Y O
F EQ
UIP
MEN
T (C
ontin
ued)
UN
ITS
OW
NED
, IN
CLU
DED
IN IN
VEST
MEN
T AC
CO
UN
T, A
ND
LEA
SED
FR
OM
OTH
ERS
Cha
nges
Dur
ing
the
Year
Uni
ts a
t Clo
se o
f Yea
rU
nits
Inst
alle
dA
ll ot
her u
nits
Uni
ts re
tired
incl
udin
g
from
ser
vice
Reb
uilt
units
recl
assi
ficat
ion
of re
spon
dent
Agg
rega
teU
nits
inac
quire
d an
dan
d se
cond
whe
ther
capa
city
of
serv
ice
ofN
ew u
nits
rebu
ilt u
nits
hand
uni
tsow
ned
orTo
tal i
nun
itsre
spon
dent
New
uni
tsle
ased
rew
ritte
npu
rcha
sed
leas
ed,
Ow
ned
Leas
edse
rvic
e of
repo
rted
Line
C
ross
at b
egin
ning
purc
hase
dfro
min
to p
rope
rtyor
leas
ed fr
omin
clud
ing
and
from
resp
onde
ntin
col
(j)
Leas
edLi
ne
No.
Che
ckTy
pe o
r des
ign
of u
nits
of y
ear
or b
uilt
othe
rsac
coun
tsot
hers
recl
assi
ficat
ion
used
othe
rs[c
ol (h
) & (i
)](S
ee In
s. 7
)to
oth
ers
No.
(a)
(b)
(c)
(d)
(e)
(f)(g
)(h
)(i)
(j)(k
)(l)
Pas
seng
er-T
rain
Car
sN
on-S
elf-P
rope
lled
17C
oach
es (P
A, P
B, P
BO
)-
1718
Com
bine
d ca
rs18
(All
clas
s C
, exc
ept C
SB
)-
19P
arlo
r car
s (P
BC
, PC
, PL,
PO
)-
1920
Sle
epin
g ca
rs (P
S, P
T, P
AS
, PD
S)
-20
21D
inin
g, g
rill,
& ta
vern
car
s21
(All
clas
s D
, PD
)-
22N
onpa
ssen
ger c
arry
ing
cars
22(A
ll cl
ass
B, C
SB
, M, P
SA
, IA
)-
23TO
TAL
(Lin
es 1
7 to
22)
--
--
--
--
--
-23
Sel
f-Pro
pelle
d24
Ele
ctric
pas
seng
er c
ars
24(E
P, E
T)-
25E
lect
ric c
ombi
ned
cars
(EC
)-
2526
Inte
rnal
com
bust
ion
rail
26 m
otor
cars
(ED
, EG
)-
27O
ther
sel
f-pro
pelle
d ca
rs27
(Spe
cify
type
s)-
28TO
TAL
(Lin
es 2
4 to
27)
--
--
--
--
--
-28
29TO
TAL
(Lin
es 2
3 an
d 28
)-
--
--
--
--
--
29C
ompa
ny S
ervi
ce C
ars
30B
usin
ess
cars
(PV
)-
3031
Boa
rd o
utfit
car
s (M
WX)
-31
32D
erric
k &
sno
w re
mov
al c
ars
32(M
WU
, MW
V, M
WW
, MW
K)
-33
Dum
p an
d ba
llast
car
s33
(MW
B, M
WD
)-
34O
ther
mai
nten
ance
and
ser
vice
34 e
quip
men
t car
s-
35TO
TAL
(Lin
es 3
0 to
34)
--
--
--
--
--
-35
Road Initials: BNSF Year 2016 97
Railroad Annual Report R-1

98PTC 710. INVENTORY OF EQUIPMENT - Continued
Instructions for reporting freight-train car data.1. Give particulars of each of the various classes of equipment which respondent owned or leased during the year.2. In Column (d) give the number of units purchased or built in company shops. In Column (e) give the number of new units leased from
others. The term "new" means a unit placed in service for the first time on any railroad.3. Units leased to others for a period of one year or more are reportable in Column (n). Units temporarily out of respondent's service
and rented to others for less than one year are to be included in Column (i). Units rented from others for a period less than one year should not be included in Column (j).
UNITS OWNED, INCLUDED IN INVESTMENT ACCOUNT, AND LEASED FROM OTHERSUnits in service of respon- Changes during the yeardent at beginning of year Units installed
Rebuilt units All other units,acquired and including
New units New or rebuilt units reclassificationClass of equipment Time- purchased rebuilt units rewritten and second hand
Line Cross and mileage All or leased into units purchased LineNo. Check car designations cars Others built from others property or leased No.
accounts from others(a) (b) (c) (d) (e) (f) (g)
FREIGHT TRAIN CARS36 Plain box cars - 40'
(B1__, B2__) 36 Plain box cars - 50' and longer
37 (B3_0-7, B4_0-7, B5__, B6__ B7__, B8__) 37 Equipped box cars
38 (All Code A, Except A_5_) 38 Plain gondola cars
39 (All Codes G & J, J__1, J__2, J__3, J__4) 39 Equipped gondola cars
40 (All Code E) 40 Covered hopper cars
41 (C__1, C__2, C__3, C__4) 41 Open top hopper cars - general
42 service (All Code H) 42 Open top hopper cars - special
43 service (J__O), and All Code K) 43 Refrigerator cars - mechanical
44 (R_5,_, R_6_, R_7_, R_8_, R_9_) 44 Refrigerator cars - nonmechanical
45 (R_0_, R_1_, R_2_) 45 Flat cars - TOFC/COFC
46 (All Code P, Q, & S, Except Q8_) 46 Flat cars - multilevel
47 (All Code V) 47 Flat cars - general service
48 (F10_, F20_, F30_) 48 Flat cars - other
49 (F_1_, F_2_, F_3_, F_4_, F_5_, 49 F_6_, F_8_, F40_) Tank cars - under 22,000 gal.
50 (T__0, T__1, T__2, T__3, T__4, 50 T__5) Tank cars - 22,000 gal. and over
51 (T__6, T__7, T__8, T__9) 51 All other freight cars
52 (A_5_, F_7_, All Code L & Q8__) 5253 TOTAL (Lines 36 to 52) - - - - - 5354 Caboose (All Code M-930) N/A 5455 TOTAL (Lines 53 and 54) - - - - - - 55
Railroad Annual Report R-1
Road Initials: BNSF Year 2016
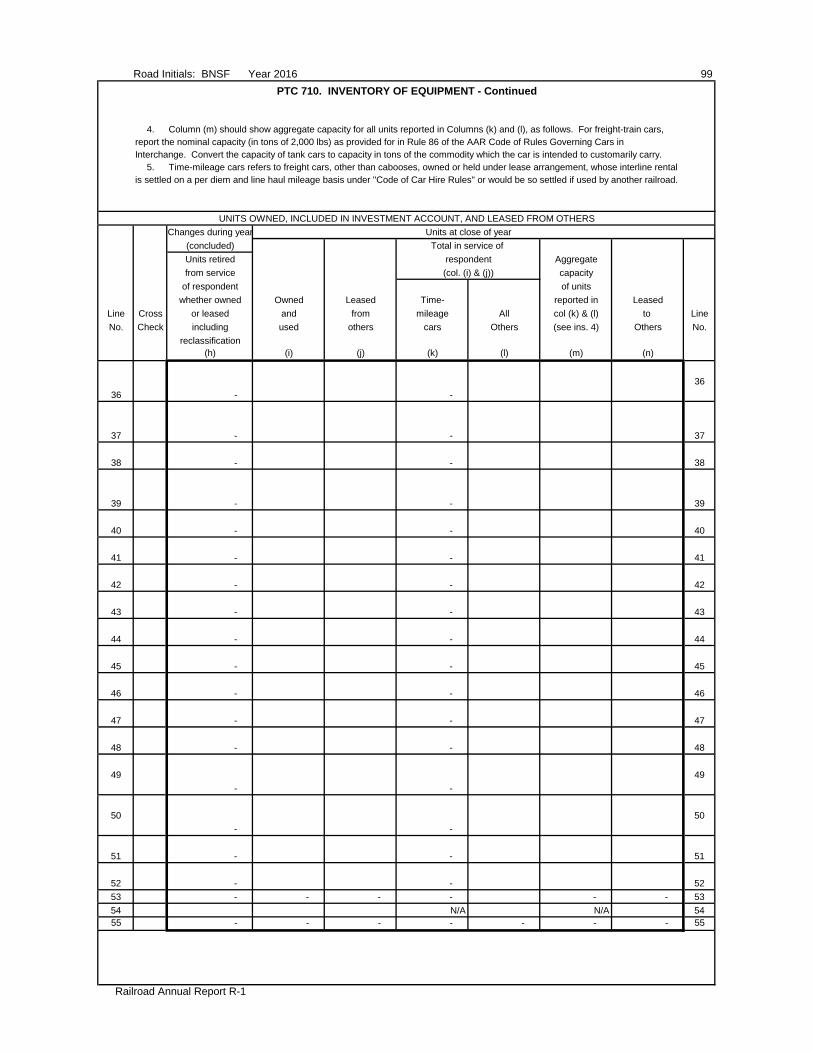
Road Initials: BNSF Year 2016 99PTC 710. INVENTORY OF EQUIPMENT - Continued
4. Column (m) should show aggregate capacity for all units reported in Columns (k) and (l), as follows. For freight-train cars,report the nominal capacity (in tons of 2,000 lbs) as provided for in Rule 86 of the AAR Code of Rules Governing Cars inInterchange. Convert the capacity of tank cars to capacity in tons of the commodity which the car is intended to customarily carry.
5. Time-mileage cars refers to freight cars, other than cabooses, owned or held under lease arrangement, whose interline rentalis settled on a per diem and line haul mileage basis under "Code of Car Hire Rules" or would be so settled if used by another railroad.
UNITS OWNED, INCLUDED IN INVESTMENT ACCOUNT, AND LEASED FROM OTHERSChanges during year Units at close of year
(concluded) Total in service of Units retired respondent Aggregatefrom service (col. (i) & (j)) capacity
of respondent of unitswhether owned Owned Leased Time- reported in Leased
Line Cross or leased and from mileage All col (k) & (l) to LineNo. Check including used others cars Others (see ins. 4) Others No.
reclassification(h) (i) (j) (k) (l) (m) (n)
3636 - -
37 - - 37
38 - - 38
39 - - 39
40 - - 40
41 - - 41
42 - - 42
43 - - 43
44 - - 44
45 - - 45
46 - - 46
47 - - 47
48 - - 48
49 49- -
50 50- -
51 - - 51
52 - - 5253 - - - - - - 5354 N/A N/A 5455 - - - - - - - 55
Railroad Annual Report R-1

100PTC 710. INVENTORY OF EQUIPMENT - Continued
UNITS OWNED, INCLUDED IN INVESTMENT ACCOUNT, AND LEASED FROM OTHERSUnits in service of respon- Changes during the yeardent at beginning of year Units installed
Rebuilt units All other units,acquired and including
New units rebuilt units reclassificationClass of equipment purchased New units rewritten and second hand
Line Cross and Per All or leased into units purchased LineNo. Check car designations diem Others built from others property or leased No.
accounts from others(a) (b) (c) (d) (e) (f) (g)
FLOATING EQUIPMENT Self-propelled vessels
56 (tugboats, car ferries, etc.) Non-self-propelled vessels
57 (car floats, lighters, etc.)58 TOTAL (Lines 56 and 57)
HIGHWAY REVENUEEQUIPMENT
59 Chassis (Z1_, Z67_, Z68_, Z_69_) 5960 Dry van (U2_, Z_, Z6_, I-6) 6061 Flat bed (U3__, Z3__) 6162 Open bed (U4__, Z4__) 6263 Mechanical refrigerator (U5_, Z5_) 6364 Bulk hopper (U0__, Z0__) 6465 Insulated (U7__, Z7__) 6566 Tank (Z0__, U6__) (See note) 66
Other trailer and container67 (Special equipped dry van U9__, 67
Z8__, Z9__)68 Tractor 6869 Truck 6970 TOTAL (Lines 59 to 69) - - - - 70
NOTES AND REMARKS
Note: Line 66 (Tank) must have fitting code "CN" to qualify as a tank, otherwise it is a bulk hopper.
Railroad Annual Report R-1
Road Initials: BNSF Year 2016
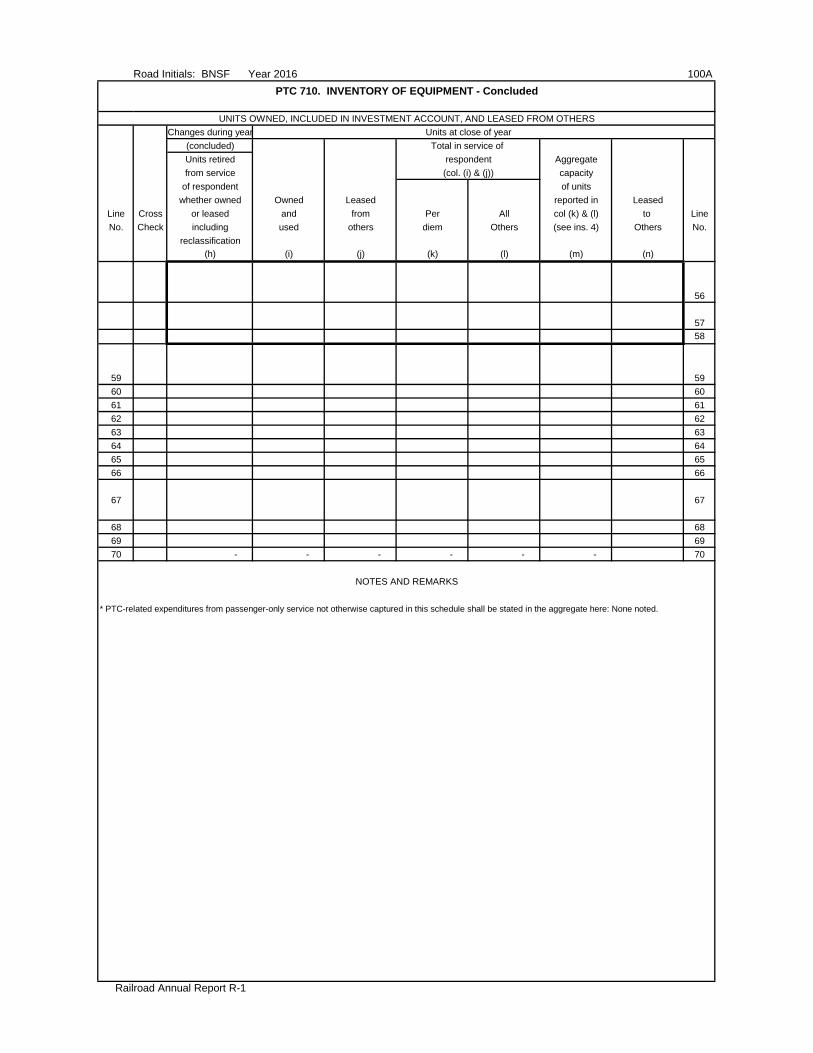
100APTC 710. INVENTORY OF EQUIPMENT - Concluded
UNITS OWNED, INCLUDED IN INVESTMENT ACCOUNT, AND LEASED FROM OTHERSChanges during year Units at close of year
(concluded) Total in service of Units retired respondent Aggregatefrom service (col. (i) & (j)) capacity
of respondent of unitswhether owned Owned Leased reported in Leased
Line Cross or leased and from Per All col (k) & (l) to LineNo. Check including used others diem Others (see ins. 4) Others No.
reclassification(h) (i) (j) (k) (l) (m) (n)
56
5758
59 5960 6061 6162 6263 6364 6465 6566 66
67 67
68 6869 6970 - - - - - - 70
NOTES AND REMARKS
* PTC-related expenditures from passenger-only service not otherwise captured in this schedule shall be stated in the aggregate here: None noted.
Railroad Annual Report R-1
Road Initials: BNSF Year 2016

100B
Railroad Annual Report R-1
Road Initials: BNSF Year 2016
THIS PAGE INTENTIONALLY LEFT BLANK

Road Initials: BNSF Year 2016 101
PTC 710S. UNIT COST OF EQUIPMENT INSTALLED DURING THE YEAR(Dollars in Thousands)
1. Give particulars as requested, separately, for the various classes of new units and rebuilt units of equipment installed by respondent during theyear. If information regarding the cost of any units installed is not complete at time of filing of report, the units should be omitted, but reference tothe number of units omitted should be given in a footnote, the details as to cost to be given in the report of the following year. The cost of units under construction at the close of the year should not be reflected in this schedule even though part of the cost appears in the property account for the year. Indicate in column (e) whether an installation represents equipment purchased (P), built or rebuilt by contract in outside railroad shops (C), or built or rebuilt in company or system shops (S) including units acquired through capitalized leases (L).
2. In column (a) list each class or type of locomotive unit, car, or TOFC/COFC equipment on a separate line. By class is meant the standardclassification used to distinguish types of locomotive units, freight cars or other equipment adopted by the Association of American Railroads,and should include physical characteristics requested by Schedule 710. Locomotive units should be identified as to power source, wheel arrangement, and horsepower per unit, such as multiple-purpose diesel locomotive A units (B-B), 2,500 HP. Cars should be identified as to special construction or service characteristics, such as aluminum-covered hopper car (LO), steel boxcars-special service (XAP), etc. For TOFC/COFC show type of equipment as enumerated in Schedule 710.
3. In column (c) show the total weight in tons of 2,000 pounds. The weight of the equipment acquired should be the weight empty.4. The cost should be the complete cost as entered on the ledger, including foreign line freight charges and handling charges.5. Data for this schedule should be confined to the units reported in Schedule 710, columns (c) and (e) for locomotive units, passenger-train cars
and company service cars and columns (d) and (f) for freight train cars, floating equipment and highway revenue equipment. Disclose new units inthe upper section of this schedule and in the lower section disclose rebuilt units acquired or rewritten into the respondent's accounts. The term"new" as used herein shall mean a unit or units placed in service for the first time on any railroad.
6. All unequipped boxcars acquired in whole or in part with incentive per diem funds should be reported on separate lines and appropriatelyidentified by footnote or sub-heading.
Line Total weight Total cost Method of LineNo. Class of equipment Number of units (tons) (000) acquisition No.
(see instructions)(a) (b) (c) (d) (e)
1 Diesel-Freight Locomotives 150 32,063 11,711$ P 1
2 2
3 3
4 4
5 5
6 6
7 7
8 8
9 9
10 10
11 11
12 TOTAL 150 32,063 11,711$ N/A 12
13 13
14 14
15 15
16 16
17 17
18 18
19 19
20 20
21 21
22 22
23 TOTAL - - -$ N/A 23
24 GRAND TOTAL (NEW AND REBUILT) 150 32,063 11,711$ N/A 24
* PTC-related expenditures from passenger-only service not otherwise captured in this schedule shall be stated in the aggregate here: None noted.
Railroad Annual Report R-1
NEW UNITS
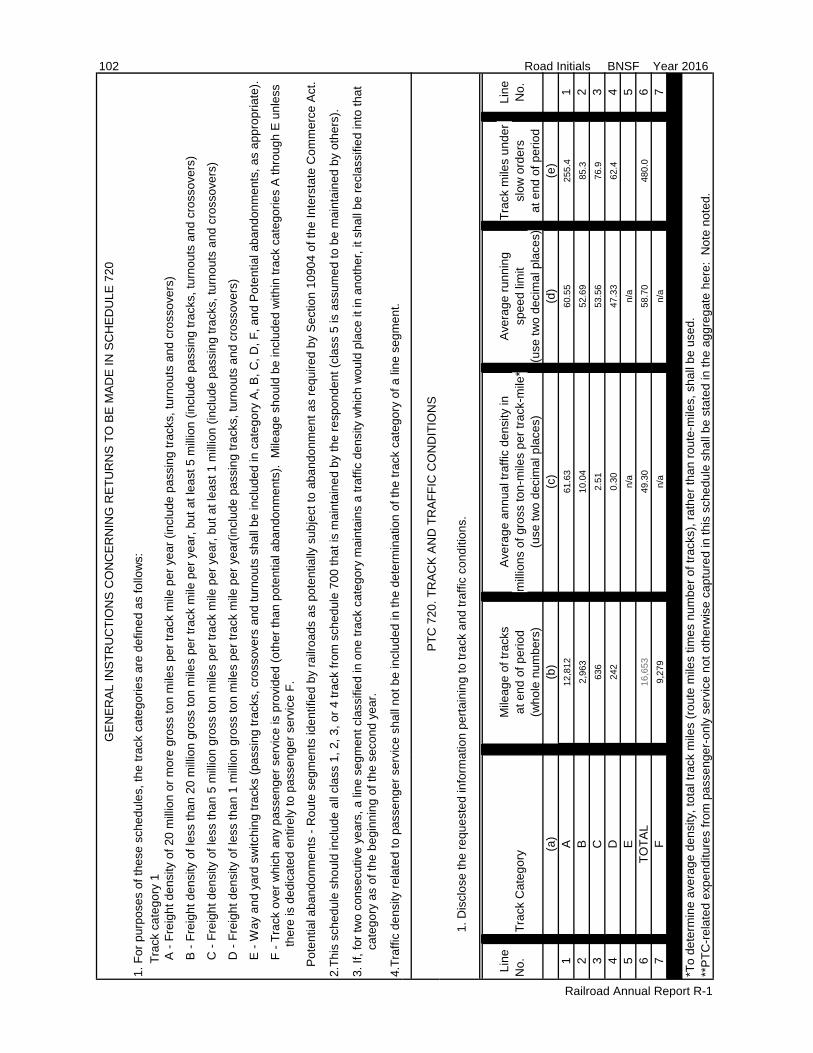
GE
NE
RA
L IN
STR
UC
TIO
NS
CO
NC
ER
NIN
G R
ETU
RN
S T
O B
E M
AD
E IN
SC
HE
DU
LE 7
20
1.Fo
r pur
pose
s of
thes
e sc
hedu
les,
the
track
cat
egor
ies
are
defin
ed a
s fo
llow
s:Tr
ack
cate
gory
1A
- Fr
eigh
t den
sity
of 2
0 m
illio
n or
mor
e gr
oss
ton
mile
s pe
r tra
ck m
ile p
er y
ear (
incl
ude
pass
ing
track
s, tu
rnou
ts a
nd c
ross
over
s)
B -
Frei
ght d
ensi
ty o
f les
s th
an 2
0 m
illio
n gr
oss
ton
mile
s pe
r tra
ck m
ile p
er y
ear,
but a
t lea
st 5
mill
ion
(incl
ude
pass
ing
track
s, tu
rnou
ts a
nd c
ross
over
s)
C -
Frei
ght d
ensi
ty o
f les
s th
an 5
mill
ion
gros
s to
n m
iles
per t
rack
mile
per
yea
r, bu
t at l
east
1 m
illio
n (in
clud
e pa
ssin
g tra
cks,
turn
outs
and
cro
ssov
ers)
D -
Frei
ght d
ensi
ty o
f les
s th
an 1
mill
ion
gros
s to
n m
iles
per t
rack
mile
per
yea
r(in
clud
e pa
ssin
g tra
cks,
turn
outs
and
cro
ssov
ers)
E -
Way
and
yar
d sw
itchi
ng tr
acks
(pas
sing
trac
ks, c
ross
over
s an
d tu
rnou
ts s
hall
be in
clud
ed in
cat
egor
y A
, B, C
, D, F
, and
Pot
entia
l aba
ndon
men
ts, a
s ap
prop
riate
).
F - T
rack
ove
r whi
ch a
ny p
asse
nger
ser
vice
is p
rovi
ded
(oth
er th
an p
oten
tial a
band
onm
ents
). M
ileag
e sh
ould
be
incl
uded
with
in tr
ack
cate
gorie
s A
thro
ugh
E u
nles
s
ther
e is
ded
icat
ed e
ntire
ly to
pas
seng
er s
ervi
ce F
.
P
oten
tial a
band
onm
ents
- R
oute
seg
men
ts id
entif
ied
by ra
ilroa
ds a
s po
tent
ially
sub
ject
to a
band
onm
ent a
s re
quire
d by
Sec
tion
1090
4 of
the
Inte
rsta
te C
omm
erce
Act
.
2.Th
is s
ched
ule
shou
ld in
clud
e al
l cla
ss 1
, 2, 3
, or 4
trac
k fro
m s
ched
ule
700
that
is m
aint
aine
d by
the
resp
onde
nt (c
lass
5 is
ass
umed
to b
e m
aint
aine
d by
oth
ers)
.
3.If,
for t
wo
cons
ecut
ive
year
s, a
line
seg
men
t cla
ssifi
ed in
one
trac
k ca
tego
ry m
aint
ains
a tr
affic
den
sity
whi
ch w
ould
pla
ce it
in a
noth
er, i
t sha
ll be
recl
assi
fied
into
that
cat
egor
y as
of t
he b
egin
ning
of t
he s
econ
d ye
ar.
4.Tr
affic
den
sity
rela
ted
to p
asse
nger
ser
vice
sha
ll no
t be
incl
uded
in th
e de
term
inat
ion
of th
e tra
ck c
ateg
ory
of a
line
seg
men
t.
1.D
iscl
ose
the
requ
este
d in
form
atio
n pe
rtain
ing
to tr
ack
and
traffi
c co
nditi
ons.
Line
Mile
age
of tr
acks
Ave
rage
ann
ual t
raffi
c de
nsity
inA
vera
ge ru
nnin
gTr
ack
mile
s un
der
Line
No.
Trac
k C
ateg
ory
at e
nd o
f per
iod
mill
ions
of g
ross
ton-
mile
s pe
r tra
ck-m
ile*
spee
d lim
itsl
ow o
rder
sN
o.(w
hole
num
bers
)(u
se tw
o de
cim
al p
lace
s)(u
se tw
o de
cim
al p
lace
s)at
end
of p
erio
d(a
)(b
)(c
)(d
)(e
)1
A12
,812
61.6
360
.55
255.
41
2B
2,96
310
.04
52.6
985
.32
3C
636
2.51
53.5
676
.93
4D
242
0.30
47.3
362
.44
5E
n/a
n/a
56
TOTA
L16
,653
49.3
058
.70
480.
06
7F
9,27
9n/
an/
a7
8Po
tent
ial a
band
onm
ents
8*T
o de
term
ine
aver
age
dens
ity, t
otal
trac
k m
iles
(rou
te m
iles
times
num
ber o
f tra
cks)
, rat
her t
han
rout
e-m
iles,
sha
ll be
use
d.**
PTC
-rel
ated
exp
endi
ture
s fro
m p
asse
nger
-onl
y se
rvic
e no
t oth
erw
ise
capt
ured
in th
is s
ched
ule
shal
l be
stat
ed in
the
aggr
egat
e he
re:
Not
e no
ted.
Railroad Annual Report R-1
102
PTC
720
. TR
AC
K A
ND
TR
AFF
IC C
ON
DIT
ION
S
Road Initials BNSF Year 2016

Road Initials: BNSF Year 2016 103Footnote: PTC Grants
LineNo. Entity Receiving Funds Name of Program Providing Funding Location(s) of the Project Funded Amount of Funding
ReceivedLineNo.
(a) (b) (c) (d)1 BNSF Railway Metra Chicago 1,035,675 12 23 34 45 56 67 78 89 910 1011 1112 1213 1314 1415 1516 1617 1718 1819 1920 2021 2122 2223 2324 24
BNSF received the following amounts of PTC Grant Funding in years prior to 2016:
2010 65,571
2011 2,487,728
2012 8,399,391
2013 10,413,863
2014 7,468,471
2015 5,787,652
34,622,676
2011 4,012,022
2012 1,250,478
5,262,500
Railroad Annual Report R-1
In addition to separating capital expenses and operating expenses incurred by the railroad for PTC, the respondententity should include by footnote disclosure here the value of funds received from government transfers to include grants, subsidies, and other
contributions or reimbursements that the respondent entity used to purchase or create PTC assets or to offset PTC costs. These amounts represent non-railroad monies that the respondent entity used for PTC and would provide for full disclosure of PTC costs on an annual basis. This disclosure
would identify the nature and location of the project by FRA identification, if applicable.
Meteorcomm LLC, of which BNSF has 25% ownership and accounts for as an equity method investment, received PTC grant funding in prior years. BNSF's portion is as follows:


Road Initials: BNSF Year 2016 105
MEMORANDA(FOR USE OF BOARD ONLY)
CORRESPONDENCE
Answer
Office Addressed Date of Letter, Fax, Subject Answer Date of Letter, Fax, or File Numberor Telegram Needed Telegram of Letter,
Fax, orName Title Month Day Year Page Month Day Year Telegram
CORRECTIONS
AuthorityDate Clerk Making
Correction Page Date of Letter, Fax, Officer Sending Letter, Fax, or Telegram Board Correctionor Telegram File Number
Month Day Year Month Day Year Name Title Name
EXPLANATORY REMARKS
Railroad Annual Report R-1
106 Road Initials: BNSF Year: 2016
INDEX
Page No.Accumulated depreciation
Road and equipment leasedFrom others 36Improvements to 36
Owned and used 35Accumulated Other Comprehensive Income 6Accruals - railway tax 54Analysis of taxes 54Application of funds - source 21Balance sheet 5-9Car, locomotive, and floating equipment - classification 67-73Statement of Cash Flows 21-22Company service equipment 69Compensating balances and short-term borrowing arrangements 58Consumption of fuel by motive power units 76Contingent assets and liabilities 8Crossties (see Ties)Debt holdings 59Depreciation base and rates
Road and equipment leasedFrom others 34Improvements to 32-33
Owned and used 34Electric locomotive equipment at close of year 68Equipment - classified 66-71
Company service 69Floating 72-73Freight-train cars 70-71Highway revenue equipment 72-73Passenger-train cars 66-67Inventory 66-71Owned-Not in service of respondent 67
Equipment leased, depreciation base and rateFrom others 34
Reserve 36Equipment owned, depreciation base rates 34
Reserve 35Expenses - railway operating 41-47Extraordinary items 17Federal income taxes 54Financial position - changes in 21-22Floating equipment 70-71Freight cars loaded 79Freight-train cars 68-69Freight car-miles 79Fuel consumed - diesel 76
Cost 76Funded debt (see Debt holdings)Guaranties and suretyships 57Identity of respondent 2Investments in common stock of affiliated companies 30Investments and advances of affiliated companies 26-29
Railway property used in transportation service 38-39Road and equipment 32-33
Changes during year 32-33Leased property - improvements made during the year 32-33
Locomotive equipment 66Electric and other 66Consumption of diesel fuel 66
Locomotive unit miles 77
Railroad Annual Report R-1

Road Initials: BNSF Year: 2016 107
INDEX - Continued
Page No.Mileage - Average of road operatedMotorcar car miles 73Motor rail cars owned or leased 75Net income 66Oath 17Operating expenses (see Expenses) 104
Revenues (see Revenues)Statistics (see Statistics)
Ordinary incomeOther Comprehensive Income 16Private line cars loaded 19Private line cars empty 80Rails 81
Charges to operating expensesRailway - Operating expenses 41Railway - Operating revenues 41-47Results of operations 16Retained income unappropriated 16-17
Miscellaneous items in accounts for year 20Revenues 11
FreightPassenger 16
Road and Equipment - Investment in 16Improvements to leased property 32-33
Reserve 32-33Owned - Depreciated base and rates 36Reserve 34
Used - Depreciated base and rates 35Reserve 34
Road - Mileage operated at close of year 35By states and territories 64
Securities (see Investments) 64Short-term borrowings arrangements - compensating balances andSinking funds 57Sources and application of working capital 7Specialized service subschedule 21-22Statement of changes in financial position 53Stock 21-22
Number of security holdersTotal voting power 3Value per share 3-4Voting rights 3
Suretyships - Guaranties and 3Tracks operated at close of year 56
Miles of, at close of year 64Track and traffic conditions 66Train hours, yard switching 75Train miles 77Tons of freight 77Ton-miles of freight 80TOFC/COFC number of revenue trailers and containers - loaded & unloaded 80Voting powers and elections 80Voting powers and elections 3
Railroad Annual Report R-1