bmo investments (ireland) plc › pyrford › pdf › financial...the portfolio is thus invested in...
TRANSCRIPT

BMO INVESTMENTS (IRELAND) PLC
(an investment company with variable capital incorporated with limited liability in Ireland with registered number 435779 and operating as an umbrella fund with segregated liability between
sub-funds pursuant to the European Communities (Undertakings for Collective Investment in Transferable Securities) Regulations 2011, as amended.)
Annual Report and Audited Financial Statements for the financial year ended 31 December 2016

BMO INVESTMENTS (IRELAND) PLC
Contents Page Directory 1 General Information 2 Investment Manager’s Reports 3 Directors’ Report 9 Report of the Depositary to the Shareholders of the Company 13 Independent Auditor’s Report 14 Financial Statements
Statement of Financial Position 16 Statement of Comprehensive Income 20 Statement of Changes in Net Assets Attributable to Holders of Redeemable Participating Shares 24 Statement of Cash Flows 28
Notes to the Financial Statements 32 Schedule of Investments BMO Global Low Volatility Alpha Equity Fund 72 Pyrford Asia Pacific ex-Japan Equity Fund 81 Pyrford Global Total Return (Sterling) Fund 83 Pyrford Global Equity (US$) Fund 87 Pyrford International (EAFE) Equity Fund 91 Pyrford Shariah Global Equity Fund 95 Pyrford Global Total Return (Euro) Fund 98 Pyrford Global Total Return (US$) Fund 102 Pyrford Global Equity (Sterling) Fund 106 Pyrford Global Equity (Euro) Fund 110 Supplemental Unaudited Information 114 Statements of Significant Changes on Composition of Portfolio (Unaudited) 120

BMO INVESTMENTS (IRELAND) PLC
1
Directory
DIRECTORS Anthony Cousins (British)* Eimear Cowhey (Irish)ǂ Barry McInerney (Canadian)**** Paul McNaughton (Irish)ǂ* Liam Miley (Irish)ǂ** Hugh Moir (British)*** Lars Nielsen (Danish)** Drew Newman (British) Diane Seymour-Williams (British)* ǂIndependent Directors *Resigned 1 April 2016 **Appointed 1 April 2016 ***Appointed 1 April 2016 and resigned 3 April 2017 ****Resigned 9 August 2016
ADMINISTRATOR State Street Fund Services (Ireland) Limited, 78 Sir John Rogerson’s Quay, Dublin 2, Ireland.
DEPOSITARY State Street Custodial Services (Ireland) Limited, 78 Sir John Rogerson’s Quay, Dublin 2, Ireland.
REGISTERED OFFICE 78 Sir John Rogerson’s Quay, Dublin 2, Ireland.
INDEPENDENT AUDITOR KPMG, 1 Harbourmaster Place, International Financial Services Centre, Dublin 1, Ireland.
INVESTMENT MANAGER Pyrford International Ltd., 95 Wigmore Street, London, W1U 1FD, United Kingdom.
LEGAL ADVISOR Arthur Cox, 10 Earlsfort Terrace, Dublin 2, Ireland.
SUB-INVESTMENT MANAGERS Monegy, Inc., 100 King Street West, 42nd Floor, First Canadian Place, Toronto, Ontario, M5X 1A1, Canada.
COMPANY SECRETARY Bradwell Limited, 10 Earlsfort Terrace, Dublin 2, Ireland.
BMO Asset Management, Corp 1209 Orange Street, Wilmington New Castle DE 19801 USA.
GOVERNANCE SERVICE PROVIDER KB Associates, 5 George’s Dock, IFSC, Dublin 1, Ireland. REGISTRATION NUMBER 435779

BMO INVESTMENTS (IRELAND) PLC
2
General Information The following information is derived from and should be read in conjunction with the full text and definitions section of the prospectus of BMO Investments (Ireland) plc dated 27 January 2016 (the “Prospectus”). Capitalised terms used but not defined herein shall have the meaning ascribed thereto in the Prospectus. BMO Investments (Ireland) plc (the “Company”), was incorporated on 5 March 2007 and operates in Ireland as a public limited company pursuant to the Companies Act 2014 and the European Communities (Undertakings for Collective Investment in Transferable Securities) Regulations 2011, as amended (the “UCITS Regulations”). The Company was initially authorised by the Central Bank of Ireland (the “Central Bank”) as a non-UCITS qualifying investor fund on 2 May 2007 and effective 30 June 2011 has been authorised by the Central Bank pursuant to the UCITS Regulations. The Company is organised in the form of an umbrella fund with segregated liability between sub-funds (each a “Sub-Fund”, collectively the “Sub-Funds”). The Company may offer separate classes of shares, each representing interests in a Sub-Fund. The Company may create additional Sub-Funds and issue multiple classes of shares in respect of each Sub-Fund provided they are effected in accordance with the requirements of the Central Bank. As at 31 December 2016 there were fourteen Sub-Funds available for investment namely: Pyrford Asia Pacific ex-Japan Equity Fund Pyrford Global Total Return (Sterling) Fund Pyrford Global Total Return (Euro) Fund Pyrford Global Total Return (US$) Fund Pyrford Global Equity (US$) Fund BMO Short Duration US Dollar Fund Pyrford International (EAFE) Equity Fund BMO Global Low Volatility Alpha Equity Fund Pyrford Pan-European Equity Fund Pyrford Global Equity (Sterling) Fund Pyrford Shariah Asia Pacific ex-Japan Equity Fund Pyrford Global Equity (Euro) Fund Pyrford Shariah Global Equity Fund Pyrford Shariah Pan-European Equity Fund
As at 31 December 2016 ten Sub-Funds had been launched and in operation namely: Sub-Funds Benchmark BMO Global Low Volatility Alpha Equity Fund MSCI All Country World Index Pyrford Asia Pacific ex-Japan Equity Fund MSCI All Country (AC) Asia Pacific Ex Japan IndexSM Pyrford Global Total Return (Sterling) Fund n/a Pyrford Global Equity (US$) Fund MSCI World IndexSM Pyrford International (EAFE) Equity Fund MSCI EAFE IndexSM Pyrford Shariah Global Equity Fund S&P Global BMI Shariah Index Pyrford Global Total Return (Euro) Fund n/a Pyrford Global Total Return (US$) Fund n/a Pyrford Global Equity (Sterling) Fund MSCI World IndexSM Pyrford Global Equity (Euro) Fund MSCI World IndexSM Reporting to investors – UK Reporting Fund Regime It is the intention of each Sub-Fund to continue to meet its annual obligations to be a “reporting fund”, as defined in the Offshore Funds (Tax) Regulations 2009 (SI 2009 No. 3001). The Sub-Fund will report income to investors via the Company’s website at www.bmo.com/pyrford and this is expected to be made available to investors by 30 June in each year.

BMO INVESTMENTS (IRELAND) PLC
3
Investment Manager’s Report Macro-Economic Backdrop Investors’ nervousness is symptomatic of concerns on capital market valuations which have been driven to excessive levels by the tsunami of liquidity that has been released over the last 8 years by the major central banks of the world. This quantitative easing or money printing has been very successful in inflating asset prices but has been unsuccessful at generating real economic growth. Output growth is fundamentally driven by labour force growth plus productivity and in much of the developed world this is not a rosy picture. No amount of money printing can change this. What it has achieved is the misallocation of funds as borrowers assume that the free ride of effectively zero interest rates will persist indefinitely. Low rates have encouraged an explosion in borrowing, much in US dollars, on the expectation of loose monetary conditions far into the future. Severe imbalances have developed in emerging markets, especially in Turkey, Eastern Europe, Brazil and South Africa. The rally in the US dollar has already increased the stress in this situation considerably; potential rises in the cost of credit through Federal Reserve tightening will only serve to make this worse. The global bond markets have provided exceptional performance as interest rates have been driven down – partly because of the liquidity being poured into the system and partly because of a lack of alternatives. Yields remain at artificially low levels and continue to offer extremely poor value relative to the outlook for inflation. Rises in inflation expectations towards the end of 2016 saw yields widen, nonetheless valuations remain expensive. The easing cycle now appears over – in fact the US Federal Reserve has increased interest rates twice over the last twelve months and has indicated there will be more increases in 2017. A continued increase in yields and associated capital destruction should be expected. Holding short duration securities will continue to protect capital. The ascendancy of Donald Trump in the United States adds additional uncertainty as we enter 2017. He has promised a significant increase in infrastructure spending but US government finances are already stretched and any additional burden will increasingly place pressure on interest rates. Equity markets performed strongly over 2016, recovering after the sell-off early in the year as concerns grew on the impact of Fed rate hikes, negative interest rate policy in both Japan and the Eurozone, and the devaluation of the Chinese Renminbi. Following the Trump election victory in the US, investors rotated out of more defensive sectors and into cyclical sectors as the expectation that deregulation and fiscal stimulus would drive reflation and support earnings in these sectors. Cyclical sectors rerated over the second half of 2016 but momentum waned towards the end of the year. Similar to bond markets, many equity markets represent poor long-term value as liquidity has caused valuations to expand without an improvement in fundamentals. In currency markets the US dollar remains strong. This is not really a reflection of US economic performance in absolute terms. The US economy is growing but this remains by far the weakest recovery from recession since the Second World War. In relative terms, though, US performance does look very good precisely because of the weakness in economic conditions in the other major developed countries. Following the UK’s decision to leave the EU, Sterling weakened rapidly and remains undervalued relative to other major currencies. The weakness in Sterling has benefitted UK companies with revenues denominated outside of the UK, helping push the equity market to all-time highs. Despite a slowing of the rate of Chinese growth, the one bright spot for the global economy remains the emerging markets of Asia (excluding Japan). These economies continue to exhibit healthy growth driven by good demographics, high savings ratios, strong productivity gains and soundly financed banking systems. Compared to unorthodox policies pursued by some Western governments, Asia (excluding Japan) has not had to embark on quantitative easing or negative interest rate policies boasting the luxury of positive real rates and lower debt levels. Countries such as Taiwan and Malaysia have large current account surpluses and are therefore less vulnerable to the removal of the liquidity prop. These superior fundamentals should be expected to continue. In Japan, “Abenomics” appears to have lost its gloss and the credibility of the Bank of Japan (BoJ) took another blow following the introduction of negative interest rates to weaken the Japanese Yen early in 2016 only for the currency to strengthen and domestic bank earnings weaken further. The BoJ has engaged in significant quantitative easing expanding the central bank balance sheet to astronomical levels. The sharp incline in BoJ liabilities will cause international markets to lose confidence in policy makers and may lead to a currency rout. For a government actually to have a goal of creating inflation appears bizarre in the context of post-WW2 economic doctrine; but inflation is clearly the friend of the debtor and Japan is certainly a debtor.

BMO INVESTMENTS (IRELAND) PLC
4
Investment Manager’s Report cont/d Macro-Economic Backdrop cont/d The Japanese public sector debt burden (in excess of 200% of GDP) dwarfs that of even the worst Eurozone nations and the country’s historic ability to borrow necessary funds from its own people must be brought into question given the sharp decline in the personal savings ratio seen in recent years. Japan continues to access the fixed income market at extremely low rates. However, should these rates begin to rise, the implications of compounding clearly become more scary. The key to the success of Abenomics remains meaningful structural reform but there has so far been precious little evidence of this. Portfolio Positioning Global Low Volatility Alpha Equity Fund The portfolio positioning is determined on an absolute basis without respect to benchmark weights, with the objective of investing in a highly diversified, low risk portfolio with a meaningful potential for excess returns. The portfolio is thus invested in a combination of low risk securities, low correlation securities, and high return potential securities. The ideal security for the portfolio represents all three attributes. Thematically, the portfolio positioning is best described by its sector allocation globally. While portfolio weights are determined irrespective of benchmark weight, the resulting portfolio is overweight in low volatility segments of the economy, including Health Care, Consumer Staples, Telecommunications, and Utilities sectors. The portfolio is underweight higher volatility segments of the economy, including Financials, Energy, Information Technology, Materials, and Consumer Discretionary. Geographically, the portfolio is diversified across 22 countries, including both Developed and Emerging Markets. The largest overweights are in Singapore, Canada, New Zealand, Israel, and Malaysia. The biggest underweights are in the United States, France, the United Kingdom, Switzerland, and the Netherlands. Neutral yet meaningful weights in absolute terms are in Japan and Germany. Looking forward, we expect volatility to be higher than in recent years due to macroeconomic uncertainty regarding geopolitical events and the global economy. We continue to focus on risk management and on owning companies with high-quality fundamentals that should well in a period of heightened volatility. Additionally, we are mindful of valuations and have identified certain groups of low risk stocks that are expensive. Finally, we continue to identify many attractive portfolio candidates with a combination of low risk, low correlation, and high return potential within our 7,000 stock universe. Performance in USD (Periods longer than one year ar e annualized):
1 Month 3 Month 6 Months 1 Year Since 1/1/2014 Fund (Gross) 1.29% -2.55% -0.13% 7.60% 25.07% MSCI ACWI 2.20% 1.30% 6.81% 8.48% 11.37%
Global Total Return (GBP) The fund returned 10.48% over 2016. The asset allocation of the portfolio remains defensive. The model allocation is: fixed income 67%, equities 30% and cash 3%. In fixed income markets real yields remain low despite the recent widening. Pyrford continues to adopt a defensive stance by owning short duration securities in order to protect the capital value of the portfolio from further rises in yields. The target modified duration of the fixed income portfolio is approximately 2 years. Currently, we own high quality UK, Australian and Canadian sovereign debt having sold our US Treasury holdings due to heightened currency risk. The equity portfolio remains defensively positioned with a greater exposure to consumer staples and health care sectors over consumer discretionary and materials. We retain our zero weighting in UK and European banks. In line with Pyrford’s purchasing power parity analysis, the Swiss Franc and Australian Dollar exposure within the portfolio remains fully hedged. These currencies are overvalued versus sterling and the hedging position insulates the portfolio against any fall in their value.

BMO INVESTMENTS (IRELAND) PLC
5
Investment Manager’s Report cont/d Global Total Return (USD) The fund returned 1.54% over 2016. The asset allocation of the portfolio remains defensive. The model allocation is: fixed income 72%, equities 25% and cash 3%. In fixed income markets real yields remain low despite the recent widening. Pyrford continues to adopt a defensive stance by owning short duration securities in order to protect the capital value of the portfolio from further rises in yields. The target modified duration of the fixed income portfolio is approximately 2 years. Currently, we own high quality US, Canadian and UK sovereign debt. The equity portfolio remains defensively positioned with a greater exposure to consumer staples and telecommunication sectors over consumer discretionary and materials. We retain our zero weighting in UK and European banks. Global Total Return (Euro) The fund returned 3.06% over 2016. The asset allocation of the portfolio remains defensive. The model allocation is: fixed income 62%, equities 35% and cash 3%. In fixed income markets real yields remain low despite the recent widening. Pyrford continues to adopt a defensive stance by owning short duration securities in order to protect the capital value of the portfolio from further rises in yields. The target modified duration of the fixed income portfolio is approximately 2 years. Currently, we own high quality German, Canadian, US and UK sovereign debt. The equity portfolio remains defensively positioned with a greater exposure to consumer staples and telecommunication sectors over consumer discretionary and financials. We retain our zero weighting in UK and European banks. In line with Pyrford’s purchasing power parity analysis, the Australian dollar exposure within the portfolio remains fully hedged. This currency is overvalued and the hedging position insulates the portfolio against any fall in the value of the currency. International (EAFE) Equity Fund The fund returned 3.64% over 2016, versus the MSCI EAFE Index return of 1.51%. The portfolio remains defensively positioned with an underweight to the QE fuelled markets and an overweight to the Southeast Asian markets. The European portfolio is concentrated in Switzerland and the relatively healthy economies of core Europe. Economies in Southeast Asia offer sustainable economic growth supported by increased labour output or productivity growth and trade at more reasonable valuations. We remain underweight to Japan as the potential economic growth rate remains low given the poor demographics and low productivity growth. In terms of sectors, we have limited exposure to more cyclical sectors such as financials and consumer discretionary. Overweight positions are held in defensive sectors such as utilities, energy and telecommunications. These sectors offer predictable revenue streams and attractive valuations. The focus of the portfolio is on balance sheet strength, profitability, earnings visibility and value. Global Equity Fund (USD) The fund returned 8.09% over 2016, versus the MSCI World Index return of 8.15%. The portfolio remains overweight the Asia ex-Japan region and underweight the QE-driven markets of Japan, the Eurozone and the US. We are underweight the US as we view the market as overvalued. The companies we do hold are defensive names, which we would expect to perform well during volatile periods. Within Europe there are no holdings in the peripheral Eurozone countries where sovereign debt concerns remain. The European portfolio is concentrated in Switzerland and the relatively healthy economies of core Europe. We remain underweight the UK due to concerns over the impact much needed deleveraging will have on the UK economy. In Asia, we have a preference for the Southeast Asian markets over Japan. The potential growth rate in Japan remains low given the poor demographics and low productivity growth. Economies in Southeast Asia offer sustainable economic growth supported by increased labour output or productivity growth and trade at more reasonable valuations.

BMO INVESTMENTS (IRELAND) PLC
6
Investment Manager’s Report cont/d Global Equity Fund (USD) cont/d In terms of sectors, the portfolio is very defensively positioned with underweight exposure to cyclical sectors. Overweight sectors include consumer staples and telecommunications which offer high dividend yields and visible earnings streams. Global Equity Fund (GBP) The fund returned 26.42% over 2016, versus the MSCI World Index return of 29.01%. The portfolio remains overweight the Asia ex-Japan region and underweight the QE-driven markets of Japan, the Eurozone and the US. We are underweight the US as we view the market as overvalued. The companies we do hold are defensive names, which we would expect to perform well during volatile periods. Within Europe there are no holdings in the peripheral Eurozone countries where sovereign debt concerns remain. The European portfolio is concentrated in Switzerland and the relatively healthy economies of core Europe. We remain underweight the UK due to concerns over the impact much needed deleveraging will have on the UK economy. In Asia, we have a preference for the Southeast Asian markets over Japan. The potential growth rate in Japan remains low given the poor demographics and low productivity growth. Economies in Southeast Asia offer sustainable economic growth supported by increased labour output or productivity growth and trade at more reasonable valuations. In terms of sectors, the portfolio is very defensively positioned with underweight exposure to cyclical sectors. Overweight sectors include consumer staples and telecommunications which offer high dividend yields and visible earnings streams. In line with Pyrford’s purchasing power parity analysis, the Swiss Franc and Australian Dollar exposure within the portfolio remains fully hedged. These currencies are overvalued versus sterling and the hedging position insulates the portfolio against any fall in their value. Global Equity Fund (EUR) The fund returned 10.08% over 2016, versus the MSCI World Index return of 11.39%. The portfolio remains overweight the Asia ex-Japan region and underweight the QE-driven markets of Japan, the Eurozone and the US. We are underweight the US as we view the market as overvalued. The companies we do hold are defensive names, which we would expect to perform well during volatile periods. Within Europe there are no holdings in the peripheral Eurozone countries where sovereign debt concerns remain. The European portfolio is concentrated in Switzerland and the relatively healthy economies of core Europe. We remain underweight the UK due to concerns over the impact much needed deleveraging will have on the UK economy. In Asia, we have a preference for the Southeast Asian markets over Japan. The potential growth rate in Japan remains low given the poor demographics and low productivity growth. Economies in Southeast Asia offer sustainable economic growth supported by increased labour output or productivity growth and trade at more reasonable valuations. In terms of sectors, the portfolio is very defensively positioned with underweight exposure to cyclical sectors. Overweight sectors include consumer staples and telecommunications which offer high dividend yields and visible earnings streams. In line with Pyrford’s purchasing power parity analysis, the Australian dollar exposure within the portfolio remains fully hedged. This currency is overvalued and the hedging position insulates the portfolio against any fall in the value of the currency. Asia Pacific ex-Japan Fund The fund returned 10.82% over 2016, versus the MSCI AC Asia Pacific ex Japan Index return of 7.06%. The portfolio is overweight in Australia, Malaysia, Singapore and Taiwan. It is correspondingly underweight in China, India and Korea. The equity portfolio is defensively positioned with underweight positions in banks and a zero weighting in real estate which remains overvalued throughout much of the region. The portfolio is also underweight the materials and consumer discretionary sectors. Overweight positions are held in industrials and telecommunications which offer more predictable revenue streams and attractive valuations. The focus of the portfolio is on balance sheet strength, profitability, earnings visibility and value.
BMO INVESTMENTS (IRELAND) PLC
7
Investment Manager’s Report cont/d Global Shariah Equity Fund The fund returned 10.46% over 2016, versus the S&P Global BMI Shariah Index return of 6.43%. The portfolio remains overweight the Asia ex-Japan region and underweight the QE-driven markets of Japan and the US. We are underweight the US as we view the market as overvalued. The companies we do hold are defensive names, which we would expect to perform well during volatile periods. Within Europe there are no holdings in the peripheral Eurozone countries where sovereign debt concerns remain. The European portfolio is concentrated in Switzerland and the relatively healthy economies of core Europe. In Asia, we have a preference for the Southeast Asian markets over Japan. The potential growth rate in Japan remains low given the poor demographics and low productivity growth. Economies in Southeast Asia offer sustainable economic growth supported by increased labour output or productivity growth and trade at more reasonable valuations. In terms of sectors, the portfolio is very defensively positioned with underweight exposure to cyclical sectors. Overweight sectors include telecommunications and industrials which offer high dividend yields and visible earnings streams. Investment Outlook Eight years on from the global financial crisis and it has been a distinctly sub-par performance in terms of real wages, consumption, employment, GDP, trade, capital investment and labour productivity. The easing cycle, propelled by extraordinary and unorthodox central bank actions, could normally be expected to stimulate global growth but this has not happened. It seems that the excessive levels of debt built up prior to the crisis, fragile banks and wounded confidence levels of corporates and consumers have been the main reasons. The excess liquidity created by central bank actions has clearly leaked into equity and bond markets, chasing asset prices higher. The 35 year-old bond bull market appears to be over. The forward-looking investment return from mid to long-dated securities is likely to be no greater than their market yield – which remains at an extremely low level despite the recent increase. At the same time all of our normal valuation metrics indicate that equities are expensive. The economic cycle is mature and the monetary tightening process has commenced. Return on equity in the corporate sector has been relatively high but profit margins have started to narrow. Significant risks exist in global capital markets through elevated global debt levels, a slowdown in Chinese growth and upcoming elections in Holland, France, Germany and possibly Italy. These have the potential to deliver serious shocks to market sentiment and the real economy. Investment caution and defensive positioning is essential in this economic climate. If valuations were not already stretched a more aggressive investment posture could be justified but circumstances dictate otherwise. Sub-Investment Manager’s Report Monegy Global High Yield Bond Fund Over the full year 2016, Broad US High Yield Indexi returned 17.49% with 273 bps of spread tightening while the Higher Quality sub-indexii was up 14.72% with 223 bps of spread tightening. The distressed end of the high yield market performed best at 37.7%, while Bs returned 16.66% and BBs 13.44%. Commodity price linked sectors, including Energy (38.4%), Metals/Mining (43.8%), and Steel (48.3%), were the primary drivers of the strong return. Fund flows have been volatile in 2016. But high yield bond ETFs and mutual funds have seen over 17 billion of net inflows over the years. Inflows were particularly strong after the US presidential election. Defaults have been increasing in 2016, highly concentrated in the distressed energy, coal and other commodity-linked sectors. The BAML trailing twelve month speculative grade issuer weighted default rate for U.S. high yield bonds rose to 6.99% in December, up from 3.38% last year.

BMO INVESTMENTS (IRELAND) PLC
8
Sub-Investment Manager’s Report cont/d Monegy Global High Yield Bond Fund cont/d As of November 30, 2016, the fund has been closed, with full liquidation and redemption completed in December. For the 11 month period, the fund returned 9.68%, underperforming the benchmark by 3.38%. The chief detractor was the Fund’s underweight in distressed commodity names, which rebounded sharply in 2016. Gross Performance:
as at November 31st, 2016 2 months 11 months
Monegy Global HY Bond Fund -0.03% 9.68% Benchmark -0.38% 13.06%
i. BAML U.S. High Yield Bond Index (H0A0) ii. BAML BB-B US High Yield Constrained Index (HUC4)

BMO INVESTMENTS (IRELAND) PLC
9
Directors’ Report for the financial year ended 31 D ecember 2016 The Directors the Company present herewith their report together with the audited financial statements for the financial year ended 31 December 2016. The financial statements of the Company have been prepared in accordance with International Financial Reporting Standards ("IFRS") as adopted by the European Union (“EU”), the Companies Act 2014, the European Communities (Undertakings for Collective Investment in Transferable Securities) Regulations 2011 as amended and the Central Bank (Supervision and Enforcement) Act 2013 (Section 48(1)) (Undertakings for Collective Investment in Transferable Securities) Regulations 2015 as amended (the “Central Bank Regulations”). Statement of Directors’ responsibilities The Directors are responsible for overseeing the preparation of the directors’ report and the financial statements in accordance with applicable Irish laws and regulations. Irish company law requires the Directors to oversee the preparation of the financial statements for each financial year. Under that law, the Directors have prepared the financial statements in accordance with IFRS as adopted by the EU and applicable law. Under Irish company law, the Directors must not approve the financial statements unless they are satisfied that they give a true and fair view of the Company’s assets, liabilities and financial position, as at the end of the financial year and of the profit or loss and change in net assets attributable to holders of redeemable participating shares of the Company for the financial year.
In preparing these financial statements, the Directors are required to:
• oversee the selection of suitable accounting policies and ensure that such policies are consistently
applied; • ensure that judgements and estimates applied are reasonable and prudent; • state whether the financial statements have been prepared in accordance with IFRS as adopted by
the EU and ensure that they contain the additional information required by the Companies Act 2014; and
• oversee the preparation of the financial statements on the going concern basis unless it is inappropriate to presume that the company will continue in business.
The Directors confirm that they have complied with the above requirements in preparing the financial statements. The Directors are responsible for ensuring that adequate accounting records are kept which disclose with reasonable accuracy at any time the assets, liabilities, financial position and profit or loss of the Company and enable them to ensure that its financial statements comply with the Companies Act 2014. They have general responsibility for taking such steps as are reasonably open to them to safeguard the assets of the Company. In this regard they have entrusted the assets of the Company to a depositary for safe-keeping. They have general responsibility for taking such steps as are reasonably open to them to prevent and detect fraud and other irregularities. The Directors are also responsible for preparing a directors’ report that complies with the requirements of the Companies Act 2014.
Statement of Compliance on Corporate Governance The Company has adopted in full the voluntary Corporate Governance Code for Collective Investment Schemes and Management Companies (the “IF Code”), as published by Irish Funds (formerly the Irish Funds Industry Association), the text of which is available from the Irish Funds website, www.irishfunds.ie. The Company has been fully complaint with the Code for the financial year ended 31 December 2016.

BMO INVESTMENTS (IRELAND) PLC
10
Directors’ Report for the financial year ended 31 D ecember 2016 cont/d Directors The name and nationality of persons who were Directors at any time during the financial year ended 31 December 2016 are set out below and all are non-executive: Anthony Cousins (British)* Eimear Cowhey (Irish)ǂ Barry McInerney (Canadian)**** Paul McNaughton (Irish)ǂ* Liam Miley (Irish)ǂ** Hugh Moir (British)*** Lars Nielsen (Danish)** Drew Newman (British) Diane Seymour-Williams (British)* ǂIndependent Directors *Resigned 1 April 2016 **Appointed 1 April 2016 ***Appointed 1 April 2016 and resigned 3 April 2017 ****Resigned 9 August 2016 The Directors are not required to retire by rotation under the Company’s constitution (the “Constitution”). Directors’ and Company Secretary’s interests in sha res and contracts The Irish resident directors have a service contract with the Company. The Directors and company secretary have no material interest in any contract of significance, subsisting during or at the end of the financial year, in relation to the business of the Company. Note 9 provides details of Directors’ shareholdings in the Company. Transactions Involving Directors The Directors are not aware of any contracts or arrangements of any significance in relation to the business of the Company in which the Directors had any interest as defined in the Companies Act 2014 at any time during the financial year ended 31 December 2016 (2015: None) other than those disclosed in note 9 of the audited financial statements. Directors’ Compliance Statement It is the policy of the Company to comply with its relevant obligations (as defined in the Companies Act 2014). As required by Section 225(2) of the Companies Act 2014, the Directors acknowledge that they are responsible for securing the Company’s compliance with the relevant obligations. The Directors have drawn up a compliance policy statement as defined in Section 225(3)(a) of the Companies Act 2014 and a compliance policy which refers to the arrangements and structures that are in place and which are, in the Directors’ opinion, designed to secure material compliance with the Company’s relevant obligations. These arrangements and structures were reviewed by the Company during the financial year. In discharging their responsibilities under Section 225, the Directors relied upon, among other things, the services provided, advice and/or representations from third parties whom the Directors believe have the requisite knowledge and experience in order to secure material compliance with the Company’s relevant obligations. Audit Committee The Company has not established an audit committee. Given the size and internal organisation of the Company, the nature, scope and complexity of the Company’s activities and the existing processes and procedures adopted by the Company, the Board does not consider that an audit committee is required for the purposes of Section 167 of the Companies Act 2014. Results, review of development of the business and future developments The results of operations are set out on pages 20 and 21. A detailed review of the development of the business and future developments is included in each launched Sub-Fund’s Investment Manager’s Report on pages 3 to 8. The Directors do not anticipate any significant change in the structure or investment objective of the Sub-Funds.

BMO INVESTMENTS (IRELAND) PLC
11
Directors’ Report for the financial year ended 31 D ecember 2016 cont/d Risk management objectives and policies Investments in certain securities markets involve a greater degree of risk than is usually associated with investment in the securities of other major securities markets. The information required by the Central Bank’s UCITS Regulation 78 and IFRS 7 as adopted by the EU in relation to the use, by the Company and its Sub-Funds, of financial instruments and the financial risk management policies and objectives of the Company to market risk, currency risk, interest rate risk, liquidity risk and credit risk are outlined in note 6 to these audited financial statements. Key Performance Indicators The Directors consider that the change in net asset value (“NAV”) per share is a key indicator of the performance of the Company. Key performance indicators (“KPI’s”) monitored by the Directors for each Sub-Fund include: the month to month movement in the NAV per share; the share capital movements; and performance of the relevant Sub-Fund against the benchmark it may use for performance comparison, where relevant. Distribution policy and distributions paid during t he financial year The Company may issue either or both distributing share classes and accumulating share classes. As at the date of this report, in the case of Sub-Funds with distributing share classes, except for Monegy Global High Yield Bond Fund, the Company intended to distribute net income and realised and unrealised gains net of realised and unrealised loss attributable to such classes annually, on 31 December of each year or such other intervals as the Directors may determine and notify in advance to shareholders. In the case of Monegy Global High Yield Bond Fund, the Company intends to distribute net income and realised and unrealised gains net of realised and unrealised losses attributable to distributing share classes quarterly, on 31 March, 30 June, 30 September and 31 December of each year or such other intervals as the Directors may determine and notify in advance to Shareholders. In the case of the accumulating share classes the Company will accumulate or retain net income and gains attributable to such classes as retained earnings. These will be included in the calculation of the relevant net asset value per share. No distributions will be declared in respect of the accumulating class of shares. Shareholders will be notified in advance of any change in distribution policy for the accumulating share classes and full details will be provided in an updated prospectus or supplemental prospectus. The following distributions were declared by the Sub-Funds during the financial years ended 31 December 2016 and 31 December 2015.
Pyrford Global Total Return (Sterling) Fund
Value Per
Share Ex-date
GBP GBP
Class A Distributing Shares 794,689 0.14 29 January 2016 Class C Distributing Shares 64,242 0.14 29 January 2016
Pyrford Global Total Return (Sterling) Fund
Value Per
Share Ex-date
GBP GBP
Class B Accumulating Shares 1,478,386 0.34 30 January 2015 No other distributions were declared in respect of the accumulating or distributing class of shares during the financial year ended 31 December 2016 or financial year ended 31 December 2015. Segregated Liability The Company is an umbrella fund with segregated liability between the sub-funds, and as such, as a matter of Irish law, the assets of a Sub-Fund will not be exposed to the liabilities of the Company’s other Sub-Funds. Segregated liability ensures that the liabilities incurred on behalf of a Sub-Fund will generally be discharged solely out of the assets of that Sub-Fund and there can generally be no recourse to the other Sub-Funds to satisfy those liabilities. Each Sub-Fund will be responsible for paying its fees and expenses regardless of the level of profitability. Notwithstanding the foregoing, there can be no guarantee or assurance that, should an action be brought against the Company in a court of another jurisdiction, that the segregated nature of the Sub-Funds would necessarily be upheld.

BMO INVESTMENTS (IRELAND) PLC
12
Directors’ Report for the financial year ended 31 D ecember 2016 cont/d Connected Party Transactions Regulation 41(1) of the Central Bank Regulations states that “a responsible person shall ensure that any transaction between a UCITS and a connected person is conducted: a) at arm’s length; and b) in the best interest of the unit-holders of the UCITS”. As required under Regulation 78(4) of the Central Bank Regulation, the Directors are satisfied that there are in place arrangements, evidenced by written procedures, to ensure that the obligations that are prescribed by Regulation 41(1) are applied to all transactions with connected parties; and all transactions with a connected parties that were entered into during the period to which the report relates complied with the obligations that are prescribed by Regulation 41(1). Share Capital The net assets under management amounted to USD 2,998,060,459 as at 31 December 2016 (2015: USD 3,296,248,473). Full Details of the Company’s share capital and charge during the financial year under review is disclosed in note 3 of these audited financial statements. Significant shareholders are disclosed in note 3 of these financial statements. The Company is not subject to the European Communities (Takeover Bids (Directive 2004/25/EC)) Regulations 2006. Employees There were no employees of the Company during the financial year under review or during prior financial year. Significant Events During the Financial Year See note 12 of the audited financial statements for details of significant events affecting the Company’s financial statements during the financial year. Significant Events Since the Financial Year End See note 13 of the audited financial statements for details of significant events affecting the Company since the financial year end. Irish Regulatory Management The Company has appointed KB Associates as the Governance Service Provider. KB Associates is a company that offers operational compliance and governance support services to Irish funds and management companies. KB Associates' oversight of the Company enables the Directors to receive additional assurance that operations are being conducted to a consistently high standard. Frank Connolly and Ross Allen of KB Associates have been appointed as designated individuals and have been approved by the Central Bank to act in this capacity. Adequate Accounting Records To ensure that adequate accounting records are kept in accordance with Section 281 of the Companies Act 2014, the Company has employed State Street Fund Services (Ireland) Limited (the “Administrator") as its administrator. The accounting records are maintained at the offices of the Administrator at 78 Sir John Rogerson’s Quay, Dublin 2, Ireland. Relevant Audit Information The Directors confirm that during the financial year ended 31 December 2016: a) so far as the Directors are aware, there is no relevant audit information of which the Company’s statutory auditors are unaware; and b) the Directors have taken all steps that ought to have been taken as directors in order to make themselves aware of any relevant audit information and to establish that the Company’s statutory auditors are aware of that information. Independent Auditors KPMG, Chartered Accountants, are the Company’s auditors and have indicated their willingness to continue in office in accordance with Section 383 (2) of the Companies Act 2014. On behalf of the board of Directors Eimear Cowhey Drew Newman Date: 25 April 2017

BMO INVESTMENTS (IRELAND) PLC
13
Report of the Depositary to the Shareholders of the Company We have enquired into the conduct of BMO Investments (Ireland) Plc (‘the Company’) for the financial year ended 31 December 2016, in our capacity as depositary to the Company. This report including the opinion has been prepared for and solely for the shareholders in the Company and for no other purpose. We do not, in giving this opinion, accept or assume responsibility for any other purpose or to any other person to whom this report is shown. Responsibilities of the Depositary Our duties and responsibilities are outlined in Part 5 of the UCITS Regulations and Part 12 of the Central Bank Regulations. One of those duties is to enquire into the conduct of the Company in each annual accounting period and report thereon to the shareholders. Our report shall state whether, in our opinion, the Company has been managed in that period in accordance with the provisions of the Company’s Constitution and the UCITS Regulations. It is the overall responsibility of the Company to comply with these provisions. If the Company has not so complied, we as depositary must state why this is the case and outline the steps which we have taken to rectify the situation. Basis of Depositary Opinion The Depositary conducts such reviews as it, in its reasonable opinion, considers necessary in order to comply with its duties as outlined in Part 5 of the UCITS Regulations and Part 12 of the Central Bank Regulations and to ensure that, in all material respects, the Company has been managed (i) in accordance with the limitations imposed on its investment and borrowing powers by the provisions of the Company’s Constitution and the UCITS Regulations and (ii) otherwise in accordance with the Company’s Constitution and the appropriate regulations. Opinion In our opinion, the Company has been managed during the year, in all material respects: (i) in accordance with the limitations imposed on the investment and borrowing powers of the Company by the Constitution, the UCITS Regulations and the Central Bank Regulations; and (ii) otherwise in accordance with the provisions of the Company’s Constitution, the UCITS Regulations and the Central Bank Regulations. State Street Custodial Services (Ireland) Limited 78 Sir John Rogerson’s Quay Dublin 2 Ireland Date: 25 April 2017

BMO INVESTMENTS (IRELAND) PLC
14
Independent Auditor’s Report to the Members of BMO Investments (Ireland) Plc
We have audited the financial statements of BMO Investments (Ireland) PLC (“the Company”) for the year ended 31 December 2016 which comprise the statement of financial position, statement of comprehensive income, statement of changes in net assets attributable to holders of redeemable participating shares, statement of cash flows and the related notes. The financial reporting framework that has been applied in their preparation is Irish law and International Financial Reporting Standards (IFRS) as adopted by the European Union. Our audit was conducted in accordance with International Standards on Auditing (UK and Ireland).
Opinions and conclusions arising from our audit 1 Our opinion on the financial statements is unmod ified In our opinion the financial statements:
• give a true and fair view of the assets, liabilities and financial position of the Company as at 31 December 2016 and of its change in net assets attributable to holders of redeemable participating shares for the year then ended;
• have been properly prepared in accordance with IFRS as adopted by the European Union; and
• have been properly prepared in accordance with the requirements of the Companies Act 2014, the European Communities (Undertakings for Collective Investment in Transferable Securities) Regulations 2011 as amended and the Central Bank (Supervision and Enforcement) Act 2013 (Section 48(1)) (Undertakings for Collective Investment in Transferable Securities) Regulations 2015 as amended.
2 Our conclusions on other matters on which we are required to report by the Companies Act 2014 are set out below We have obtained all the information and explanations which we consider necessary for the purposes of our audit. In our opinion the accounting records of the Company were sufficient to permit the financial statements to be readily and properly audited and the financial statements are in agreement with the accounting records. In our opinion the information given in the Directors’ Report is consistent with the financial statements.
3 We have nothing to report in respect of matters on which we are required to report by exception ISAs (UK & Ireland) require that we report to you if, based on the knowledge we acquired during our audit, we have identified information in the annual report that contains a material inconsistency with either that knowledge or the financial statements, a material misstatement of fact, or that is otherwise misleading. In addition, the Companies Act 2014 requires us to report to you if, in our opinion, the disclosures of directors’ remuneration and transactions required by sections 305 to 312 of the Companies Act 2014 are not made. Basis of our report, responsibilities and restricti ons on use As explained more fully in the Statement of Directors’ Responsibilities set out on page 8, the directors of the Company are responsible for the preparation of the financial statements and for being satisfied that they give a true and fair view of the state of affairs of the Company and of the profit or loss of the Company and otherwise comply with the Companies Act 2014. Our responsibility is to audit and express an opinion on the financial statements in accordance with Irish law and International Standards on Auditing (UK and Ireland). Those standards require us to comply with the Financial Reporting Council’s Ethical Standards for Auditors. An audit undertaken in accordance with ISAs (UK & Ireland) involves obtaining evidence about the amounts and disclosures in the financial statements sufficient to give reasonable assurance that the financial statements are free from material misstatement, whether caused by fraud or error. This includes an assessment of: whether the accounting policies are appropriate to the Company’s circumstances and have been consistently applied and adequately disclosed; the reasonableness of significant accounting estimates made by the directors of the Company; and the overall presentation of the financial statements.

BMO INVESTMENTS (IRELAND) PLC
15
Independent Auditor’s Report to the Members of BMO Investments (Ireland) Plc cont/d In addition, we read all the financial and non-financial information in the Annual Report to identify material inconsistencies with the audited financial statements and to identify any information that is apparently materially incorrect based on, or materially inconsistent with, the knowledge acquired by us in the course of performing the audit. If we become aware of any apparent material misstatements or inconsistencies we consider the implications for our report. Whilst an audit conducted in accordance with ISAs (UK & Ireland) is designed to provide reasonable assurance of identifying material misstatements or omissions it is not guaranteed to do so. Rather the auditor plans the audit to determine the extent of testing needed to reduce to an appropriately low level the probability that the aggregate of uncorrected and undetected misstatements does not exceed materiality for the financial statements as a whole. This testing requires us to conduct significant audit work on a broad range of assets, liabilities, income and expense as well as devoting significant time of the most experienced members of the audit team, in particular the engagement partner responsible for the audit, to subjective areas of the accounting and reporting. Our report is made solely to the Company’s members, as a body, in accordance with section 391 of the Companies Act 2014. Our audit work has been undertaken so that we might state to the Company’s members those matters we are required to state to them in an auditor’s report and for no other purpose. To the fullest extent permitted by law, we do not accept or assume responsibility to anyone other than the Company and the Company’s members as a body, for our audit work, for this report, or for the opinions we have formed. Darina Barrett for and on behalf of KPMG Chartered Accountants, Statutory Audit Firm 1 Harbourmaster Place IFSC Dublin 1 Ireland Date 25 April 2017

BMO INVESTMENTS (IRELAND) PLC
16
Statement of Financial Position As at 31 December 2016
Total
BMO Global Low Volatility Alpha Equity
Fund
Pyrford Asia Pacific ex-
Japan Equity Fund
Pyrford Global Total
Return (Sterling) Fund
Pyrford Global Equity (US$)
Fund
Pyrford International
(EAFE) Equity Fund
Note USD USD USD GBP USD USD Current Assets Financial assets at fair value through profit or loss: Transferable Securities 2,806,590,892 1,615,887 1,201,092 2,252,763,009 3,328,293 19,589,500 Financial derivative instruments 10,490,983 - - 8,523,676 63 - Deposits with credit institutions 7 120,344,239 45,786 56,642 96,665,100 102,400 833,301 Other receivables 30,802,771 32,419 1,211 24,037,193 1,010,876 50,519 Total Current Assets 2,968,228,885 1,694,092 1,258,945 2,381,988,978 4,441,632 20,473,320 Current Liabilities Financial liabilities at fair value through profit or loss: Financial derivative instruments (1,447,212) - - (1,173,013) (205) - Other payables (4,456,060) (51,149) (44,689) (2,492,990) (919,753) (66,555) Total Current Liabilities excluding net assets attributable to holders of redeemable participating shares
(5,903,272) (51,149) (44,689) (3,666,003) (919,958) (66,555) Net assets attributable to holders of Redeemable Participating Shares
2,962,325,613 1,642,943 1,214,256 2,378,322,975 3,521,674 20,406,765
On behalf of the board of Directors Eimear Cowhey Drew Newman 25 April 2017
The accompanying notes form an integral part of the audited financial statements.

BMO INVESTMENTS (IRELAND) PLC
17
Statement of Financial Position As at 31 December 2016 cont/d
Pyrford Shariah Global Equity
Fund
Pyrford Global Total Return (Euro) Fund
Pyrford Global Total Return
(US$) Fund
Monegy Global High Yield
Bond Fund*
Pyrford Global Equity (Sterling)
Fund
Pyrford Global Equity (Euro)
Fund Note USD EUR USD USD GBP EUR Current Assets Financial assets at fair value through profit or loss: Transferable Securities 1,901,001 2,626,356 2,961,210 - 797,736 842,995 Financial derivative instruments - - - - 4,141 - Deposits with credit institutions 7 42,070 109,869 98,376 65,951 31,944 25,563 Other receivables 7,776 56,411 33,268 11,168 10,514 11,815 Total Current Assets 1,950,847 2,792,636 3,092,854 77,119 844,335 880,373 Current Liabilities Financial liabilities at fair value through profit or loss: Financial derivative instruments - (242) - - (2,486) (618) Other payables (44,592) (54,021) (73,443) (77,119) (19,483) (29,233) Total Current Liabilities excluding net assets attributable to holders of redeemable participating shares (44,592) (54,263) (73,443) (77,119) (21,969) (29,851) Net assets attributable to holders of Redeemable Participating Shares 1,906,255 2,738,373 3,019,411 - 822,366 850,522
*The Sub-Fund was fully redeemed during the financial year ended 31 December 2016.
On behalf of the board of Directors Eimear Cowhey Drew Newman 25 April 2017
The accompanying notes form an integral part of the audited financial statements.

BMO INVESTMENTS (IRELAND) PLC
18
Statement of Financial Position As at 31 December 2015
Total
BMO Global Low Volatility Alpha Equity
Fund
Pyrford Asia Pacific ex-
Japan Equity Fund
Pyrford Global Total
Return (Sterling) Fund
Pyrford Global Equity (US$)
Fund
Pyrford International
(EAFE) Equity Fund
Note USD USD USD GBP USD USD Current Assets Financial assets at fair value through profit or loss: Transferable Securities 3,207,671,182 1,529,214 1,096,307 2,148,090,488 2,260,695 19,768,617 Financial derivative instruments - - - - - - Deposits with credit institutions 7 66,667,272 26,711 28,891 43,518,054 112,124 436,002 Other receivables 29,316,264 44,271 17,986 19,608,556 25,230 50,622 Total Current Assets 3,303,654,718 1,600,196 1,143,184 2,211,217,098 2,398,049 20,255,241 Current Liabilities Financial liabilities at fair value through profit or loss: Financial derivative instruments (518,152) - - (346,947) - - Other payables (6,888,092) (48,107) (34,277) (4,363,740) (38,726) (114,674) Total Current Liabilities excluding net assets attributable to holders of redeemable participating shares
(7,406,244) (48,107) (34,277) (4,710,687) (38,726) (114,674) Net assets attributable to holders of Redeemable Participating Shares
3,296,248,474 1,552,089 1,108,907 2,206,506,411 2,359,323 20,140,567
The accompanying notes form an integral part of the audited financial statements.

BMO INVESTMENTS (IRELAND) PLC
19
Statement of Financial Position As at 31 December 2015 cont/d
Pyrford Shariah Global Equity
Fund
Pyrford Global Total Return (Euro) Fund
Pyrford Global Total Return
(US$) Fund
Monegy Global High Yield
Bond Fund
Pyrford Global Equity (Sterling)
Fund*
Pyrford Global Equity (Euro) Fund*
Note USD EUR USD USD GBP EUR Current Assets Financial assets at fair value through profit or loss: Transferable Securities 1,705,112 2,582,685 2,892,152 7,832,157 593,254 769,596 Financial derivative instruments - - - - - - Deposits with credit institutions 7 57,798 95,256 146,974 1,551,234 27,428 20,591 Other receivables 17,427 54,891 39,430 138,138 7,488 10,532 Total Current Assets 1,780,337 2,732,832 3,078,556 9,521,529 628,170 800,719 Current Liabilities Financial liabilities at fair value through profit or loss: Financial derivative instruments - (1,533) - - (569) (3,943) Other payables (35,465) (37,873) (71,868) (38,314) (11,751) (15,173) Total Current Liabilities excluding net assets attributable to holders of redeemable participating shares (35,465) (39,406) (71,868) (38,314) (12,320) (19,116) Net assets attributable to holders of Redeemable Participating Shares 1,744,872 2,693,426 3,006,688 9,483,215 615,850 781,603 *These Sub-Funds commenced trading on 19 March 2015.
The accompanying notes form an integral part of the audited financial statements.

BMO INVESTMENTS (IRELAND) PLC
20
Statement of Comprehensive Income For the financial year ended 31 December 2016
Total
BMO Global Low Volatility Alpha
Equity Fund
Pyrford Asia Pacific ex-
Japan Equity Fund
Pyrford Global Total
Return (Sterling) Fund
Pyrford Global Equity
(US$) Fund
Pyrford International
(EAFE) Equity Fund
Note USD USD USD GBP USD USD Income Investment Income 44,972,167 51,810 41,069 32,526,461 79,388 709,114 Net gain/(loss) on investment activities 4 264,415,184 64,779 83,174 194,659,824 127,752 (60,270) Total investment income/(expense) 309,387,351 116,589 124,243 227,186,285 207,140 648,844 Operating expenses 5 (32,323,951) (100,999) (87,711) (23,071,710) (106,957) (333,715) Investment Management fee reimbursements 5 (iv) 556,228 83,976 71,399 - 72,648 - Net Income/(expense) 277,619,628 99,566 107,931 204,114,575 172,831 315,129 Finance cost Distributions 11 (1,159,644) - - (858,931) - - Net Increase/(decrease) in net assets attributable to holders of redeemable participating shares before tax 276,459,984 99,566 107,931 203,255,644 172,831 315,129 Withholding tax 2 (1,168,208) (8,712) (2,582) (796,389) (10,480) (48,931) Net increase/(decrease) in net assets attributable to holders of Redeemable Participating Shares resulting from operations 275,291,776 90,854 105,349 202,459,255 162,351 266,198
The accompanying notes form an integral part of the audited financial statements.

BMO INVESTMENTS (IRELAND) PLC
21
Statement of Comprehensive Income For the financial year ended 31 December 2016 cont/ d
*The Sub-Fund was fully redeemed during the financial year ended 31 December 2016.
The accompanying notes form an integral part of the audited financial statements.
Pyrford Shariah Global
Equity Fund
Pyrford Global Total Return (Euro) Fund
Pyrford Global Total Return
(US$) Fund
Monegy Global High Yield Bond
Fund*
Pyrford Global Equity
(Sterling) Fund
Pyrford Global Equity (Euro)
Fund Note USD EUR USD USD GBP EUR Income Investment Income 53,707 35,209 25,224 127 22,530 25,853 Net (loss)/gain on investment activities 4 141,586 45,433 26,308 899,795 153,916 57,824 Total investment (expense)/income 195,293 80,642 51,532 899,922 176,446 83,677 Operating expenses 5 (95,061) (113,185) (97,317) (150,291) (26,130) (38,778)
Investment Management fee reimbursements 5 (iv) 69,521 81,143 61,740 55,068
16,239
27,696 Net Expense/(income) 169,753 48,600 15,955 804,699 166,555 72,595 Finance cost Distributions 11 - - - - - - Net Increase/(decrease) in net assets attributable to holders of redeemable participating shares before tax 169,753 48,600 15,955 804,699 166,555 72,595 Withholding tax 2 (8,370) (2,252) (3,232) 173 (3,211) (3,676) Net (decrease)/increase in net assets attributable to holders of Redeemable Participating Shares resulting from operations 161,383 46,348 12,723 804,872 163,344 68,919

BMO INVESTMENTS (IRELAND) PLC
22
Statement of Comprehensive Income For the financial year ended 31 December 2015
Total
BMO Global Low Volatility Alpha Equity
Fund
Pyrford Asia Pacific ex-
Japan Equity Fund
Pyrford Global Total
Return (Sterling)
Fund
Pyrford Global Equity
(US$) Fund
Pyrford International
(EAFE) Equity Fund
Note USD USD USD GBP USD USD
Income Investment Income 43,588,590 47,882 48,435 27,826,642 92,128 724,131
Net gain/(loss) on investment activities 4 39,147,100 (7,389) (200,797) 26,998,908 (170,220) (1,191,499) Total investment income/(expense) 82,735,690 40,493 (152,362) 54,825,550 (78,092) (467,368) Operating expenses 5 (37,034,442) (90,223) (87,990) (23,484,698) (121,572) (343,948) Investment Management fee reimbursements 5 (iv) 530,739 73,733 70,684 - 83,484 Net Income/(expense) 46,231,987 24,003 (169,668) 31,340,852 (116,180) (811,316) Finance cost Distributions 11 (2,258,072) - - (1,478,386) - - Net Increase/(decrease) in net assets attributable to holders of redeemable participating shares before tax 43,973,915 24,003 (169,668) 29,862,466 (116,180) (811,316) Withholding tax 2 (1,565,099) (7,564) (2,762) (969,984) (11,568) (39,086) Net increase/(decrease) in net assets attributable to holders of Redeemable Participating Shares resulting from operations 42,408,816 16,439 (172,430) 28,892,482 (127,748) (850,402)
The accompanying notes form an integral part of the audited financial statements.

BMO INVESTMENTS (IRELAND) PLC
23
Statement of Comprehensive Income For the financial year ended 31 December 2015 cont/ d
*These Sub-Funds commenced trading on 19 March 2015.
The accompanying notes form an integral part of the audited financial statements.
Pyrford Shariah Global
Equity Fund
Pyrford Global Total Return (Euro) Fund
Pyrford Global Total Return
(US$) Fund
Monegy Global High Yield Bond
Fund
Pyrford Global Equity
(Sterling) Fund*
Pyrford Global Equity (Euro)
Fund* Note USD EUR USD USD GBP EUR Income Investment Income 55,873 31,967 27,755 5,937 16,292 21,530 Net (loss)/gain on investment activities 4 (117,112) 76,933 (94,550) (276,726) (34,712) (58,438) Total investment (expense)/income (61,239) 108,900 (66,795) (270,789) (18,420) (36,908) Operating expenses 5 (92,052) (104,254) (100,035) (143,630) (22,755) (30,729) Investment Management fee reimbursements 5 (iv) 66,832 74,638 64,678 39,453 16,047 22,018 Net Expense/(income) (86,459) 79,284 (102,152) (374,966) (25,128) (45,619) Finance cost Distributions 11 - - - - - - Net Increase/(decrease) in net assets attributable to holders of redeemable participating shares before tax (86,459) 79,284 (102,152) (374,966) (25,128) (45,619) Withholding tax 2 (7,724) (2,298) (4,140) (1,126) (2,368) (3,075) Net (decrease)/increase in net assets attributable to holders of Redeemable Participating Shares resulting from operations (94,183) 76,986 (106,292) (376,092) (27,496) (48,694)

BMO INVESTMENTS (IRELAND) PLC
24
Statement of Changes in Net Assets Attributable to Holders of Redeemable Participating Shares For the financial year ended 31 December 2016
BMO Global Low
Volatility Alpha Equity Fund
Pyrford Asia Pacific ex-Japan
Equity Fund
Pyrford Global Total
Return (Sterling) Fund
Pyrford Global Equity
(US$) Fund
Pyrford International
(EAFE) Equity Fund
Note USD USD GBP USD USD
Net assets attributable to holders of Redeemable Participating Shares at beginning of financial year
1,552,089 1,108,907 2,206,506,411 2,359,323 20,140,567
Net increase in net assets attributable to holders of Redeemable Participating Shares resulting from operations 90,854 105,349 202,459,255 162,351 266,198 Movement due to sales and repurchases of redeemable participating shares
Net increase/(decrease) in net assets resulting from redeemable participating share transactions 3 - - (30,642,691) 1,000,000 -
Net assets attributable to holders of Redeemable Participating Shares at end of financial year 1,642,943 1,214,256 2,378,322,975 3,521,674 20,406,765
The accompanying notes form an integral part of the audited financial statements.

BMO INVESTMENTS (IRELAND) PLC
25
Statement of Changes in Net Assets Attributable to Holders of Redeemable Participating Shares For the financial year ended 31 December 2016 cont/ d
Pyrford Shariah Global Equity
Fund
Pyrford Global Total Return (Euro) Fund
Pyrford Global Total Return
(US$) Fund
Monegy Global High Yield
Bond Fund*
Pyrford Global Equity
(Sterling) Fund
Pyrford Global Equity (Euro)
Fund Note USD EUR USD USD GBP EUR
Net assets attributable to holders of Redeemable Participating Shares at beginning of financial year
1,744,872 2,693,426 3,006,688 9,483,215 615,850 781,603
Net increase in net assets attributable to holders of Redeemable Participating Shares resulting from operations 161,383 46,348 12,723 804,872 163,344 68,919 Movement due to sales and repurchases of redeemable participating shares
Net increase/(decrease) in net assets resulting from redeemable participating share transactions 3 - (1,401) - (10,288,087) 43,172 -
Net assets attributable to holders of Redeemable Participating Shares at end of financial year 1,906,255 2,738,373 3,019,411 - 822,366 850,522
*The Sub-Fund was fully redeemed during the financial year ended 31 December 2016. The accompanying notes form an integral part of the financial statements.

BMO INVESTMENTS (IRELAND) PLC
26
Statement of Changes in Net Assets Attributable to Holders of Redeemable Participating Shares For the financial year ended 31 December 2015
BMO Global Low
Volatility Alpha Equity Fund
Pyrford Asia Pacific ex-Japan
Equity Fund
Pyrford Global Total
Return (Sterling) Fund
Pyrford Global Equity
(US$) Fund
Pyrford International
(EAFE) Equity Fund
Note USD USD GBP USD USD
Net assets attributable to holders of Redeemable Participating Shares at beginning of financial year
1,535,650 1,281,337 2,154,466,846 3,185,510 20,990,969
Net increase/(decrease) in net assets attributable to holders of Redeemable Participating Shares resulting from operations 16,439 (172,430) 28,892,482 (127,748) (850,402) Movement due to sales and repurchases of redeemable participating shares Net increase/(decrease) in net assets resulting from redeemable participating share transactions 3 - - 23,147,083 (698,439) -
Net assets attributable to holders of Redeemable Participating Shares at end of financial year 1,552,089 1,108,907 2,206,506,411 2,359,323 20,140,567
The accompanying notes form an integral part of the audited financial statements.

BMO INVESTMENTS (IRELAND) PLC
27
Statement of Changes in Net Assets Attributable to Holders of Redeemable Participating Shares For the financial year ended 31 December 2015 cont/ d
Pyrford Shariah Global Equity
Fund
Pyrford Global Total Return (Euro) Fund
Pyrford Global Total Return
(US$) Fund
Monegy Global High Yield
Bond Fund
Pyrford Global Equity
(Sterling) Fund*
Pyrford Global Equity (Euro)
Fund* Note USD EUR USD USD GBP EUR
Net assets attributable to holders of Redeemable Participating Shares at beginning of financial year
1,839,055 2,442,829 3,112,980 9,859,307 - -
Net increase/(decrease) in net assets attributable to holders of Redeemable Participating Shares resulting from operations (94,183) 76,986 (106,292) (376,092) (27,496) (48,694) Movement due to sales and repurchases of redeemable participating shares
Net increase/(decrease) in net assets resulting from redeemable participating share transactions 3 - 173,611 - - 643,346 830,297
Net assets attributable to holders of Redeemable Participating Shares at end of financial year 1,744,872 2,693,426 3,006,688 9,483,215 615,850 781,603
*These Sub-Funds commenced trading on 19 March 2015. The accompanying notes form an integral part of the financial statements.

BMO INVESTMENTS (IRELAND) PLC
28
Statement of Cash Flow
For the financial year ended 31 December 2016
Total
BMO Global Low Volatility Alpha Equity
Fund
Pyrford Asia Pacific ex-
Japan Equity Fund
Pyrford Global Total
Return (Sterling) Fund
Pyrford Global Equity
(US$) Fund
Pyrford International
(EAFE) Equity Fund
USD USD USD GBP USD USD Cash flows provided by/(used in) operating activities Net increase in net assets attributable to holders of redeemable participating shares 276,451,420 90,854 105,349 203,318,186 162,351 266,198 Adjustments for: Movement in financial assets at fair value through profit or loss (134,368,616) (86,673) (104,785) (104,672,521) (193,741) 179,117 Unrealised movement on derivative assets and liabilities (10,400,496) - - (7,697,608) 142 - Operating cash flows before movements in working capital 131,682,308 4,181 564 90,948,057 (31,248) 445,315 Movement in other receivables (4,804,933) 11,852 16,775 (3,691,298) 14,354 103 Movement in other payables (2,313,854) 3,042 10,412 (1,767,092) 7,170 (48,119)
Cash inflow/(outflow) from operations (7,118,787) 14,894 27,187 (5,458,390) 21,524 (48,016)
Net cash (outflow)/inflow from operating activities 124,563,521 19,075 27,751 85,489,667 (9,724) 397,299
Cash flows from financing activities Proceeds from subscriptions 484,898,050 - - 359,113,592 - - Payment of redemptions (537,635,563) - - (390,597,282) - - Distributions paid (1,159,644) - - (858,931) - - Net cash provided by financing activities (53,897,157) - - (32,342,621) - Net (decrease)/increase in cash and cash equivalents 70,666,364 19,075 27,751 53,147,046 (9,724) 397,299
Cash and cash equivalents at the start of the financial year 66,667,272 26,711 28,891 43,518,054 112,124 436,002 Foreign Currency Translation Adjustment (16,989,397) Cash and cash equivalents at the end of the financi al year 120,344,239 45,786 56,642 96,665,100 102,400
833,301
Cashflows from operating activities include: Taxation paid (1,179,188) (8,639) (2,582) (804,022) (10,285) (49,050) Interest received 80,279,483 37 - 58,855,839 362 6,774 Dividend received 45,681,783 52,133 41,445 32,581,510 78,693 706,799 The accompanying notes form an integral part of the audited financial statements.

BMO INVESTMENTS (IRELAND) PLC
29
Statement of Cash Flow
For the financial year ended 31 December 2016 cont/ d
Pyrford Shariah Global Equity
Fund
Pyrford Global
Total Return (Euro) Fund
Pyrford Global Total Return
(US$) Fund
Monegy Global High Yield
Bond Fund8
Pyrford Global Equity
(Sterling) Fund
Pyrford Global Equity (Euro)
Fund USD EUR USD USD GBP EUR
Cash flows (used in )/provided by operating activities Net (decrease)/increase in net assets attributable to holders of redeemable participating shares 161,383 46,348 12,723 804,872 163,344 68,919 Adjustments for: Movement in financial assets at fair value through profit or loss
(195,889) (43,671) (75,214) 7,832,157
(204,482) (73,399) Unrealised movement on derivative assets and liabilities - (1,291) - - (2,223) (3,325) Operating cash flows before movements in working capital (34,506) 1,386 (62,491) 8,637,029 (43,361) (7,805) Movement in other receivables 9,651 (1,520) 6,162 126,970 (3,026) (1,283) Movement in other payables 9,127 16,148 7,731 38,805 7,732 14,060 Cash inflow /(outflow) from operations 18,778 14,628 13,893 165,775 4,706 12,777
Net cash (outflow)/inflow from operating activities (15,728) 16,014 (48,598) 8,802,804 (38,655) 4,972
Cash flows from financing activities Proceeds from subscriptions - - - - 43,232 - Payment of redemptions - (1,401) - (10,288,087) (61) - Distributions paid - - - - - - Net cash provided by/(used in) financing activities - (1,401) - (10,288,087) 43,171 - Net (decrease)/increase in cash and cash equivalents (15,728) 14,613 (48,598) (1,485,283) 4,516 4,972 Cash and cash equivalents at the start of the financial year 57,798 95,256 146,974 1,551,234 27,428 20,591 Cash and cash equivalents at the end of the financi al year
42,070
109,869
98,376
65,951
31,944
25,563
Cashflows from operating activities include: Taxation paid (8,240) (2,265) (3,196) (544) (3,081) (3,564) Interest received 211 62,804 88,307 653,244 (1) (2) Dividend received 53,345 35,297 25,296 - 22,062 25,625 *The Sub-Fund was fully redeemed during the financial year ended 31 December 2016. The accompanying notes form an integral part of the audited financial statements.

BMO INVESTMENTS (IRELAND) PLC
30
Statement of Cash Flow For the financial year ended 31 December 2015
Total
BMO Global Low Volatility Alpha Equity
Fund
Pyrford Asia Pacific ex-
Japan Equity Fund
Pyrford Global Total
Return (Sterling) Fund
Pyrford Global Equity
(US$) Fund
Pyrford International
(EAFE) Equity Fund
USD USD USD GBP USD USD Cash flows provided by/(used in) operating activiti es Net increase/(decrease) in net assets attributable to holders of redeemable participating shares 42,408,816 16,439 (172,430) 28,892,482 (127,748) (850,402) Adjustments for: Movement in financial assets at fair value through profit or loss (134,814,267) (66,929) 126,911 (87,925,239) (1,131,687) 563,892 Unrealised movement on derivative assets and liabilities 5,678,348 - 31,330 3,544,209 9,460 213,323 Operating cash flows before movements in working capital (86,727,103) (50,490) (14,189) (55,488,548) (1,249,975) (73,187) Movement in other receivables 131,367 42,586 (2,501) 69,299 (4,203) (3,086) Movement in other payables 3,015,527 15,114 4,494 1,910,100 7,070 (2,117)
Cash inflow/(outflow) from operations 3,146,894 57,700 1,993 1,979,399 2,867 (5,203)
Net cash (outflow)/inflow from operating activities (83,580,209) 7,210 (12,196) (53,509,149) (1,247,108) (78,390)
Cash flows from financing activities Proceeds from subscriptions 456,467,410 - - 295,554,031 2,943,299 - Payment of redemptions (418,959,208) - - (273,222,563) (1,641,738) - Net cash provided by financing activities 37,508,202 - - 22,331,468 1,301,561 - Net (decrease)/increase in cash and cash equivalents (46,072,007) 7,210 (12,196) (31,177,681) 54,453 (78,390)
Cash and cash equivalents at the start of the financial year 117,458,405 19,501 41,087 74,695,735 57,671 514,392 Foreign Currency Translation Adjustment (4,719,126) Cash and cash equivalents at the end of the financi al year 66,667,272 26,711 28,891 43,518,054 112,124
436,002
Cashflows from operating activities include: Taxation paid (1,084,012) (8,343) (2,762) (1,000,202) (11,850) (39,739) Interest received 25,037 25,037 - - - - Dividend received 89,816,893 45,599 48,052 88,007,049 89,320 712,219 Dividend paid (1,478,386) - - (1,478,386) - - The accompanying notes form an integral part of the audited financial statements.

BMO INVESTMENTS (IRELAND) PLC
31
Statement of Cash Flow For the financial year ended 31 December 2015 cont/ d
Pyrford
Shariah Global Equity Fund
Pyrford Global
Total Return (Euro) Fund
Pyrford Global Total Return
(US$) Fund
Monegy Global High Yield
Bond Fund
Pyrford Global Equity
(Sterling) Fund*
Pyrford Global Equity (Euro) Fund*
USD EUR USD USD GBP EUR Cash flows (used in )/provided by operating activities Net (decrease)/increase in net assets attributable to holders of redeemable participating shares (94,183) 76,986 (106,292) (376,092) (27,496) (48,694) Adjustments for: Movement in financial assets at fair value through profit or loss 76,953 (228,560) 94,129 1,833,490 (593,254) (769,596) Unrealised movement on derivative assets and liabilities - 2,381 2,951 - 569 3,943 Operating cash flows before movements in working capital (17,230) (149,193) (9,212) 1,457,398 (620,181) (814,347) Movement in other receivables (999) (15,784) (785) 35,177 (7,488) (10,532) Movement in other payables 3,803 13,543 11,531 8,318 11,751 15,173 Cash inflow /(outflow) from operations 2,804 (2,241) 10,746 43,495 4,263 4,641
Net cash (outflow)/inflow from operating activities (14,426) (151,434) 1,534 1,500,893 (615,918) (809,706)
Cash flows from financing activities Proceeds from subscriptions - 173,611 - - 643,346 830,297 Net cash provided by/(used in) financing activities - 173,611 - - 643,346 830,297 Net (decrease)/increase in cash and cash equivalents (14,426) 22,177 1,534 1,500,893 27,428 20,591 Cash and cash equivalents at the start of the financial year 72,224 73,079 145,440 50,341 - - Cash and cash equivalents at the end of the financi al year
57,798
95,256
146,974
1,551,234
27,428
20,591
Cashflows from operating activities include: Taxation paid (7,827) (2,350) (4,371) (1,126) (2,368) (3,075) Interest received - - - - - - Dividend received 55,242 87,917 128,633 642,862 - - Dividend paid - - - - - - *These Sub-Funds commenced trading on 19 March 2015. The accompanying notes form an integral part of the financial statements.

BMO INVESTMENTS (IRELAND) PLC
32
Notes to the Financial Statements for the financial year ended 31 December 2016 1. Significant Accounting Policies
The significant accounting policies adopted by the Company for the financial year ended 31 December 2016 are set out below.
a) Basis of Preparation
The financial statements of the Company have been prepared in accordance with International Financial Reporting Standards ("IFRSs") as adopted by the European Union (“EU”).
b) Basis of Measurement The financial statements have been prepared under the historical cost basis except for financial instruments at fair value through profit or loss which are measured at fair value. The financial statements have been prepared on a going concern basis.
c) Functional and presentation currency
In accordance with IAS 21 “The Effects of Changes in Foreign Exchange Rates”, items included in the financial statements are measured using the currency of the primary economic environment in which it operates (“functional currency”). Transactions which occurred during the financial year, are translated into reporting currency at the rate prevailing on the transaction date. Assets and liabilities in foreign currencies are translated into the reporting currency at the rates prevailing at the financial year end date. The exchange differences on translation are reflected in the Statement of Comprehensive Income. The functional currency of the Company is USD. The financial statements of the Company are presented in USD. Items included in the financial statements are measured using the currency of the primary economic environment in which the respective Sub-Funds operate (“the functional currency”). If indicators of the primary economic environment are mixed then management uses its judgement to determine the functional currency that most faithfully represents the economic effects of the underlying transactions, events and conditions. The majority of each Sub-Funds’ investments and transactions are denominated in Euro, US Dollar or Pound Sterling. Investor subscriptions and redemptions are determined based on the net asset value, and received and paid in euro, US Dollar or Pound Sterling. The functional currency of the Sub-Funds (which is either the EUR, USD or GBP) is shown in the Statement of Financial Position of these Sub-Funds. The Company has also adopted these functional currencies as the presentation currency of each Sub-Fund. The functional currency of the Pyrford Global Total Return (Sterling) Fund and Pyrford Global Equity (Sterling) Fund is GBP. The functional currency of the Pyrford Global Total Return (Euro) Fund and Pyrford Global Equity (Euro) Fund is EUR. The functional currency of the other launched Sub-Funds is USD. The Company has also adopted these functional currencies as the presentation currency of each Sub-Fund. For the purpose of producing the combined Statement of Financial Position, financial year end exchange rates are used. For the purpose of producing the combined Statement of Comprehensive Income and Statement of Changes the average exchange rates for the financial year are used.
d) Investments at fair value through profit or loss
Classification Financial assets and liabilities at FVTPL (as defined below) are categorised as held for trading as they are acquired or incurred principally for the purpose of selling or repurchasing in the short-term. Equities and bonds (collectively "transferable securities") and forward foreign currency exchange contracts fall into this category. A financial instrument is classified as held for trading if:
• it is acquired or incurred principally for the purpose of selling or repurchasing it in the near term; • on initial recognition, it is part of a portfolio that is managed together and for which there is evidence
of a recent pattern of a short term profit taking; or • it is a derivative, other than a designated and effective hedging instrument.

BMO INVESTMENTS (IRELAND) PLC
33
Notes to the Financial Statements for the financial year ended 31 December 2016 cont/d
1. Significant Accounting Policies cont/d
d) Investments at fair value through profit or l oss cont/d Classification cont/d
Fair value measurement Fair value is the price that would be received to sell an asset or paid to transfer a liability in an orderly transaction between market participants at the measurement date in the principal or, in its absence, the most advantageous market to which the Sub-Fund has access at that date. The fair value of a liability reflects its non-performance risk.
When available, a Sub-Fund measures the fair value of an investment using the quoted price in an active market for that instrument. A market is regarded as ‘active’ if transactions for the asset or liability take place with sufficient frequency and volume to provide pricing information on an ongoing basis. A Sub-Fund measures instruments quoted in an active market at a last traded price, because this price provides a reasonable approximation of exit price. If there is no quoted price in an active market, then a Sub-Fund uses valuation techniques that maximise the use of relevant observable inputs and minimise the use of unobservable inputs. The chosen valuation technique incorporates all of the factors that market participants would take into account in pricing a transaction. A Sub-Fund recognises transfers between levels of the fair value hierarchy as at the end of the reporting period during which the change has occurred. Amortised Cost Financial assets and financial liabilities other than those held for trading are held at amortised cost. The amortised cost of the financial asset or financial liability is the amount at which the financial asset or financial liability is measured at initial recognition, minus principal repayments, plus or minus the accumulative amortisation using the effective interest method of any difference between the initial amount recognised and the maturity amount, minus any reduction for impairment. Right of offset Financial assets and liabilities are offset and the net amount presented in the Statement of Financial Position when, and only when, the Company has a legal right to set off the amounts and intends either to settle on a net basis or to realise the asset and settle the liability simultaneously. Income and expenses are presented on a net basis for gains and losses from financial instruments at fair value through profit and loss and foreign exchange gains and losses. The Company’s financial assets and liabilities are not subject to offsetting, enforceable master netting arrangements and similar agreements. Recognition and initial measurement Purchases and sales of investments are recognised as of the day the transaction takes place, i.e., the trade date – the date on which the Company commits to purchase or sell the asset. Other financial assets and liabilities are recognised on the date in which they originated. Investments are initially recognised at fair value, and costs for all financial assets and financial liabilities carried at fair value through profit or loss are expensed as incurred. Financial assets and liabilities not at Fair Value Through Profit or Loss (“FVTPL”) are initially recognised at fair value plus transaction costs that are directly attributable to their acquisition or issue. De-recognition Investments are de-recognised when the rights to receive cash flows from the investments have expired or the Company has transferred substantially all risks and rewards of ownership. On derecognition of a financial asset, the difference between the carrying amount of the asset and consideration received is recognised in the Statement of Comprehensive Income. Financial liabilities are derecognised when the contractual obligations are discharged, cancelled or expired.

BMO INVESTMENTS (IRELAND) PLC
34
Notes to the Financial Statements for the financial year ended 31 December 2016 cont/d 1. Significant Accounting Policies cont/d e) Dividend Income
Dividend income arising on the underlying equity investments of the Company is recognised as income of the Company on the ex-dividend date. Income is shown gross of any non-recoverable withholding taxes, which is disclosed separately in the Statement of Comprehensive Income, and net of any tax credits. Dividend income is included in the net gains/(losses) on investment activities in the Statement of Comprehensive Income.
f) Interest Income
Interest income on cash and cash equivalents are recognized in the Statement of Comprehensive Income using the effective interest method. The effective interest rate method is the rate that exactly discounts the estimated future cash payments and receipts through the expected life of the financial asset or liability (or where appropriate, a shorter period) to the carrying amount of the financial asset or financial liability. When calculating the effective interest rate, the Sub-Funds estimate future cash flows considering all contractual terms but not future credit losses. Interest received or receivable and interest paid or payable are recognised in the Statement of Comprehensive Income as interest income and interest expense, respectively.
g) Expenses All expenses are accrued on a daily basis as part of the net asset valuation each day.
h) Realised Gains and Losses Net realised gains and losses from financial instruments at fair value through profit or loss include all realised gains and losses and coupon interest earned from debt securities held by the Sub-Funds. Realised gains and losses on sales of investments are calculated based on the average book cost of the investment in local currency and are included in net gains/(losses) on investment activities at fair value in the Statement of Comprehensive Income. Realised gains and losses on investments include interest received on debt securities. Realised gains and losses on investments and derivatives are accounted for in the Statement of Comprehensive Income. Interest income earned from debt investments is included in the net gains/(losses) on investment activities in the Statement of Comprehensive Income.
i) Unrealised Gains and Losses Unrealised gains and losses on investments arising during the period are included in net gains/(losses) on investment activities in the Statement of Comprehensive Income. Unrealised gains and losses on investments and derivatives are accounted for in the Statement of Comprehensive Income.
j) Redeemable Participating Shares
The Company classifies financial instruments issued as financial liabilities or equity instruments in accordance with the substance of the contractual terms of the instruments. The Company provides its shareholders with the right to redeem their interest in a Sub-Fund at any dealing date for cash equal to their proportionate share of the net asset value of the relevant Sub-Fund. The redeemable shares are classified as financial liabilities and are measured at the present value of the redemption amounts.
k) Taxation Dividend and interest income and capital gains received by the Company may be subject to withholding tax imposed in the country of origin. Investment income is recorded gross of such taxes and the corresponding withholding tax is recognised as a tax expense. Withholding tax reclaims receivable are recorded as receivables in the Statement of Financial Position.
l) Transaction Costs Transaction costs are defined as the incremental costs that are directly attributable to the acquisition, issue or disposal of a financial asset or financial liability. An incremental cost is one that would not have been incurred if the entity had not acquired, issued or disposed of the financial instrument. When a financial asset or financial liability is recognised initially, an entity shall measure it at its fair value through profit or loss plus, transaction costs that are directly attributable to the acquisition or issue of the financial asset or financial liability. Transaction costs on the purchase and sale of bonds and forward contracts are included in the purchase and sale price of the investment. They cannot be practically or reliably gathered as they are embedded in the cost of the investment and cannot be separately verified or disclosed.

BMO INVESTMENTS (IRELAND) PLC
35
Notes to the Financial Statements for the financial year ended 31 December 2016 cont/d 1. Significant Accounting Policies cont/d
l) Transaction Costs cont/d
Transaction costs on purchases and sales of equities are included in net gains/(losses) on investment activities in the Statement of Comprehensive Income for each Sub-Fund. These costs are separately identifiable transaction costs and the total costs incurred by each Sub-Fund during the financial year are disclosed in note 5 of these audited financial statements.
m) Distributions
Distributions declared with an ex-date during the financial year are included as a finance cost in the Statement of Comprehensive Income.
n) Significant Accounting Estimates and Assumptions The preparation of financial statements in conformity with IFRS requires management to make judgments, estimates and assumptions that affect the application of policies and reported amounts of assets and liabilities, income and expenses. The estimates and associated assumptions are based on historical experience and various other factors that are believed to be reasonable under the circumstances, the results of which form the basis of the judgments about carrying values of assets and liabilities that are not readily apparent from other sources. Actual results may differ from these estimates. Critical accounting estimates are those which involve the most complex or subjective judgments or assessments. The areas of the Company’s business that typically require such estimates are the determination of the fair value of financial assets and liabilities. There were no estimates used in measuring the fair value of investments at year end, as there were no investments classified as Level 3. Fair value of derivative financial instruments The Sub-Funds may, from time to time, hold financial instruments that are not quoted in active markets, such as over-the counter derivatives. Fair values of such instruments are determined by using valuation techniques Fair value of securities not quoted in an active ma rket The fair value of such securities not quoted in an active market may be determined by the Sub-Fund using reputable pricing sources (such as pricing agencies) or indicative prices from bond/debt market makers. The Company would exercise judgement and estimates on the quantity and quality of pricing sources used. Where no market data is available, the Company may value positions using its own models, which are usually based on valuation methods and techniques generally recognised as standard within the industry.
o) Anti-Dilution Levy Where the Company deems there to be large net subscriptions or net redemptions and to prevent any adverse effect on the value of the assets of a Sub-Fund, the Company may charge an anti-dilution levy for retention as part of the assets of the relevant Sub-Fund. The anti-dilution levy will be calculated to cover the dealing costs that would be incurred in purchasing additional portfolio securities/selling portfolio securities to meet such redemption and thus to preserve the value of the underlying investments of the Sub-Fund as a result of net subscriptions/redemptions on any Dealing Day. Such costs will include any dealing spreads, commissions, transfer taxes and in the case of selling securities to meet breaking deposits at a penalty or realising investments at a discount in order to provide monies to meet such redemption requests or, in the event that a Sub-Fund borrows funds, to meet the costs of such borrowings. As the costs of dealing can vary with market conditions, the level of the Anti-Dilution Levy may also vary but shall not exceed 1% of the Net Asset Value per Share. Such Anti-Dilution Levy shall be added/deducted from the subscription amount and the redemption proceeds respectively.
p) Cash and cash equivalents Cash comprises current deposits with banks. Cash and cash equivalents are short-term highly liquid investments that are readily convertible to known amounts of cash, are subject to an insignificant risk of changes in value and are held for the purpose of meeting short-term cash commitments rather than for investment or other purposes. Cash and cash equivalents are carried at amortised cost which approximates its fair value.

BMO INVESTMENTS (IRELAND) PLC
36
Notes to the Financial Statements for the financial year ended 31 December 2016 cont/d 1. Significant Accounting Policies cont/d
q) New Accounting Standards
New standards, amendments and interpretations issue d but not effective for the financial year beginning 1 January 2016 and not early adopted IFRS 9 “Financial Instruments”, issued on 24 July 2014, is the IASB’s replacement of IAS 39 “Financial Instruments: Recognition and Measurement”. The Standard includes revised guidance on the classification and measurement of financial instruments, a new expected credit loss model for calculating impairment on financial assets carried at amortised cost, and new general hedge accounting requirements. It also carries forward the guidance on recognition and de-recognition of financial instruments from IAS 39. IFRS 9 is effective for annual reporting periods beginning on or after 1 January 2018, with early adoption permitted. Based on the initial assessment, this standard is not expected to have a material impact on the Company. This is because the financial instruments currently measured at fair value through profit or loss (FVTPL) will continue to be measured at FVTPL under IFRS 9 and those currently measured at amortised cost will continue to be measured at amortised cost under IFRS 9. The IASB have now tentatively decided to require entities to apply IFRS 9 for annual periods beginning on or after 1 January 2018. Entities are required to apply IFRS 9 (2013) retrospectively, in accordance with the requirements of IAS 8, with certain exceptions. IFRS 7 “Financial Instruments: Disclosures”, requires additional disclosures on transition from IAS 39 “Financial Instruments: Recognition and Measurement” to IFRS 9. There are no other standards, interpretations or amendments to existing standards that are not yet effective that would be expected to have a significant impact on the Company.
2. Taxation The Company is an investment undertaking as defined in Section 739B of the Taxes Consolidation Act, 1997. The Company will not generally be liable to Irish tax in respect of its income and gains, other than on the occurrence of a chargeable event. Generally a chargeable event arises on any distribution, redemption, repurchase, cancellation, transfer of shares or on the ending of a “Relevant Period”. A “Relevant Period” being an eight year period beginning with the acquisition of the shares by the Shareholder and each subsequent period of eight years beginning immediately after the preceding Relevant Period.
A gain on a chargeable event does not arise in respect of: (i) a shareholder who is not Irish resident and not ordinarily resident in Ireland at the time of the chargeable event, provided the necessary signed statutory declarations are held by the Company; or ii) certain exempted Irish resident investors who have provided the Company with the necessary signed statutory declarations; or (iii) any transactions in relation to shares held in a recognised clearing system as designated by the order of the Revenue Commissioners of Ireland; or (iv) an exchange of shares representing one Sub-Fund for another Sub-Fund of the Company; or (v) an exchange of shares arising on a qualifying amalgamation or reconstruction of the Company with another company; or (vi) certain exchanges of shares between spouses and former spouses. In the absence of an appropriate declaration, the Company will be liable to Irish tax on the occurrence of a chargeable event. There were no chargeable events during the financial year under review. Capital gains, dividends and interest received may be subject to withholding taxes imposed by the country of origin and such taxes may not be recoverable by the Company or its shareholders.

BMO INVESTMENTS (IRELAND) PLC
37
Notes to the Financial Statements for the financial year ended 31 December 2016 cont/d
3. Share Capital
Authorised The issued share capital of the Company shall not be less than EUR2 represented by two subscriber shares of no par value and the maximum issued share capital shall be not more than EUR500 billion divided into an unspecified number of participating shares of no par value. Subscriber shares do not form part of the net asset value of the Sub-Funds and the holders of the subscriber shares are not entitled to participate in the dividends or net assets of the Company. They are disclosed in the audited financial statements by way of this note only. Redeemable Participating Shares Each of the shares (other than subscriber shares) entitles the holder to participate equally on a pro rata basis in the dividends (save in the case of dividends declared prior to becoming a shareholder) and net assets of the Company attributable to such shares. Each of the shares entitles the holder to attend and vote at meetings of the Company and of the Sub-Fund represented by those shares. No class of shares confers on the holder thereof any preferential or pre-emptive rights or any rights to participate in the profits and dividends of any other class of shares or any voting rights in relation to matters relating solely to any other class of shares. The Company had initial capital of EUR 300,000 upon launch. The Company’s capital currently exceeds EUR 300,000, being the minimum capital required to establish a self-managed investment company under the UCITS Regulations.

BMO INVESTMENTS (IRELAND) PLC
38
Notes to the Financial Statements for the financial year ended 31 December 2016 cont/d
3. Share Capital cont/d Share transactions during financial year ended 31 D ecember 2016
BMO Global Low Volatility Alpha Equity
Fund
Pyrford Asia Pacific ex-
Japan Equity Fund
Pyrford Global Total Return
(Sterling) Fund
Pyrford Global Total Return
(Sterling) Fund
Pyrford Global Total Return
(Sterling) Fund
Pyrford Global Total Return
(Sterling) Fund
Pyrford Global Total Return
(Sterling) Fund Class A US$ Class A US$ Class A Stg£ Class A Stg£ Class B Stg£ Class B Stg£* Class C Stg£ Accumulating Accumulating Accumulating Distributing Accumulating Distributing Accumulating Shares Balance at beginning of financial year
100,000 100,000 151,456,565 5,395,950 259,274 - 2,690,804
Shares issued during financial year
99,756 - 5,664,838 1,211,660 1,141,775 86,207 3,748,484
Shares redeemed during financial year
(100,000) - (26,394,598) (15,608) (53,014) (1,684) (763,831)
Balance at end of financial year 99,756 100,000 130,726,805 6,592,002 1,348,035 84,523 5,675,457 2016 2016 2016 2016 2016 2016 2016 USD USD GBP GBP GBP GBP GBP Capital Subscriptions during the financial year
1,634,000
-
83,837,044
12,781,072
12,579,119
906,102
40,311,141
Redemptions during the financial year
(1,634,000)
-
(380,084,924)
(177,000)
(585,966)
(18,089)
(8,139,720)
- - (296,247,880) 12,604,072 11,993,153 888,013 32,171,421
*This Share Class launched on 26 April 2016.

BMO INVESTMENTS (IRELAND) PLC
39
Notes to the Financial Statements for the financial year ended 31 December 2016 cont/d
3. Share Capital cont/d Share transactions during financial year ended 31 D ecember 2016 cont/d
Pyrford Global
Total Return (Sterling) Fund
Pyrford Global
Total Return (Sterling) Fund
Pyrford Global
Equity (US$) Fund
Pyrford International
(EAFE) Equity Fund
Pyrford Shariah Global Equity
Fund
Pyrford Global Total Return (Euro) Fund
Class C Stg£ Class D Stg£* Class A USD Class A US$ Class A US$ Class A Euro € Distributing Distributing Distributing Accumulating Accumulating Accumulating Shares Balance at beginning of financial year
439,662
-
243,546
1,542,897
139,841
237,581
Shares issued during financial year
2,198,883
18,741,609
97,087
-
-
-
Shares redeemed during financial year
(100,109)
(39,804)
-
-
-
(124)
Balance at end of financial year 2,538,436 18,701,805 340,633 1,542,897 139,841 237,457 2016 2016 2016 2016 2016 2016 GBP GBP USD USD USD EUR Capital Subscriptions during the financial year
22,020,363
187,416,091
1,000,000
-
-
-
Redemptions during the financial year
(1,062,751)
(425,173)
-
-
-
(1,401)
20,957,612 186,990,918 1,000,000 - - (1,401)
*This Share Class launched on 16 June 2016.

BMO INVESTMENTS (IRELAND) PLC
40
Notes to the Financial Statements for the financial year ended 31 December 2016 cont/d
3. Share Capital cont/d Share transactions during financial year ended 31 D ecember 2016 cont/d
Pyrford Global Total Return
(US$) Fund
Monegy Global High Yield Bond
Fund
Pyrford Global Equity (Sterling)
Fund
Pyrford Global Equity (Euro)
Fund Class A US$ Class A US$ Class A Stg£ Class A Euro € Accumulating Accumulating * Accumulating Accumulating Shares Balance at beginning of financial year
300,000
1,000,000
64,335
83,030
Shares issued during financial year
-
-
3,981
-
Shares redeemed during financial year
-
(1,000,000)
(5)
-
Balance at end of financial year 300,000 - 68,311 83,030 2016 2016 2016 2016 USD USD GBP EUR Capital Subscriptions during the financial year
-
-
43,232
-
Redemptions during the financial year
-
(10,240,000)
(60)
-
- (10,240,000) 43,172 - *This Share Class was fully redeemed on 30 November 2016.
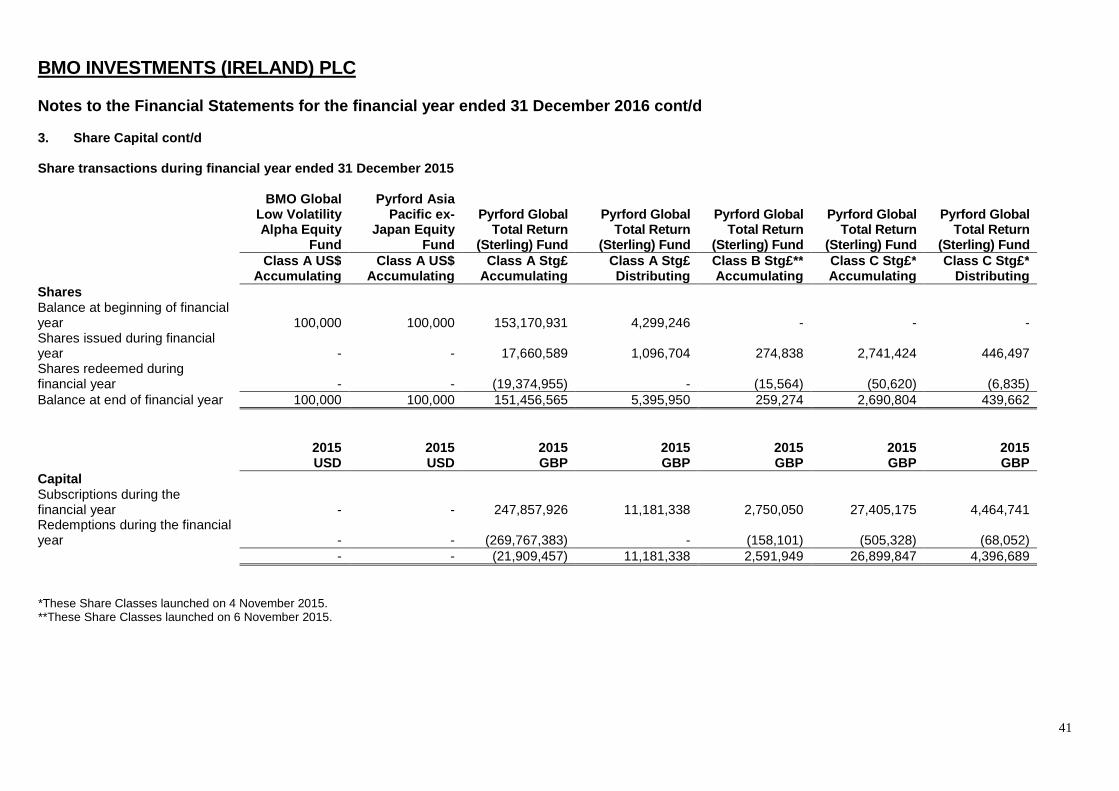
BMO INVESTMENTS (IRELAND) PLC
41
Notes to the Financial Statements for the financial year ended 31 December 2016 cont/d
3. Share Capital cont/d Share transactions during financial year ended 31 D ecember 2015
BMO Global Low Volatility Alpha Equity
Fund
Pyrford Asia Pacific ex-
Japan Equity Fund
Pyrford Global Total Return
(Sterling) Fund
Pyrford Global Total Return
(Sterling) Fund
Pyrford Global Total Return
(Sterling) Fund
Pyrford Global Total Return
(Sterling) Fund
Pyrford Global Total Return
(Sterling) Fund Class A US$ Class A US$ Class A Stg£ Class A Stg£ Class B Stg£* * Class C Stg£* Class C Stg£ * Accumulating Accumulating Accumulating Distributing Accumulating Accumulating Distributing Shares Balance at beginning of financial year 100,000 100,000 153,170,931 4,299,246 - - - Shares issued during financial year - - 17,660,589 1,096,704 274,838 2,741,424 446,497 Shares redeemed during financial year - - (19,374,955) - (15,564) (50,620) (6,835) Balance at end of financial year 100,000 100,000 151,456,565 5,395,950 259,274 2,690,804 439,662 2015 2015 2015 2015 2015 2015 2015 USD USD GBP GBP GBP GBP GBP Capital Subscriptions during the financial year - - 247,857,926 11,181,338 2,750,050 27,405,175 4,464,741 Redemptions during the financial year - - (269,767,383) - (158,101) (505,328) (68,052) - - (21,909,457) 11,181,338 2,591,949 26,899,847 4,396,689 *These Share Classes launched on 4 November 2015. **These Share Classes launched on 6 November 2015.

BMO INVESTMENTS (IRELAND) PLC
42
Notes to the Financial Statements for the financial year ended 31 December 2016 cont/d
3. Share Capital cont/d Share transactions during financial year ended 31 D ecember 2015 cont/d
Pyrford Global Equity (US$)
Fund
Pyrford Global Equity (US$)
Fund
Pyrford Global
Equity (US$) Fund
Pyrford International
(EAFE) Equity Fund
Pyrford Shariah Global
Equity Fund
Pyrford Global Total Return (Euro) Fund
Class A Stg£* Class A Euro €* Class A USD Class A US$ Class A US$ Class A Euro € Distributing Distributing Distributing Accumulating Accumulating Accumulating Shares Balance at beginning of financial year 30,000 32,852 200,000 1,542,897 139,841 222,717 Shares issued during financial year
91,075 - - 14,864
Shares redeemed during financial year (30,000) (32,852)
(47,529) - - -
Balance at end of financial year - - 243,546 1,542,897 139,841 237,581 2015 2015 2015 2015 2015 2015 GBP EUR USD USD USD EUR Capital Subscriptions during the financial year - - 943,299 - - 173,611 Redemptions during the financial year (602,742) (604,110) (1,641,738) - - - (602,742) (604,110) (698,439) - - 173,611 *These Share Classes were fully redeemed on 19 March 2015.
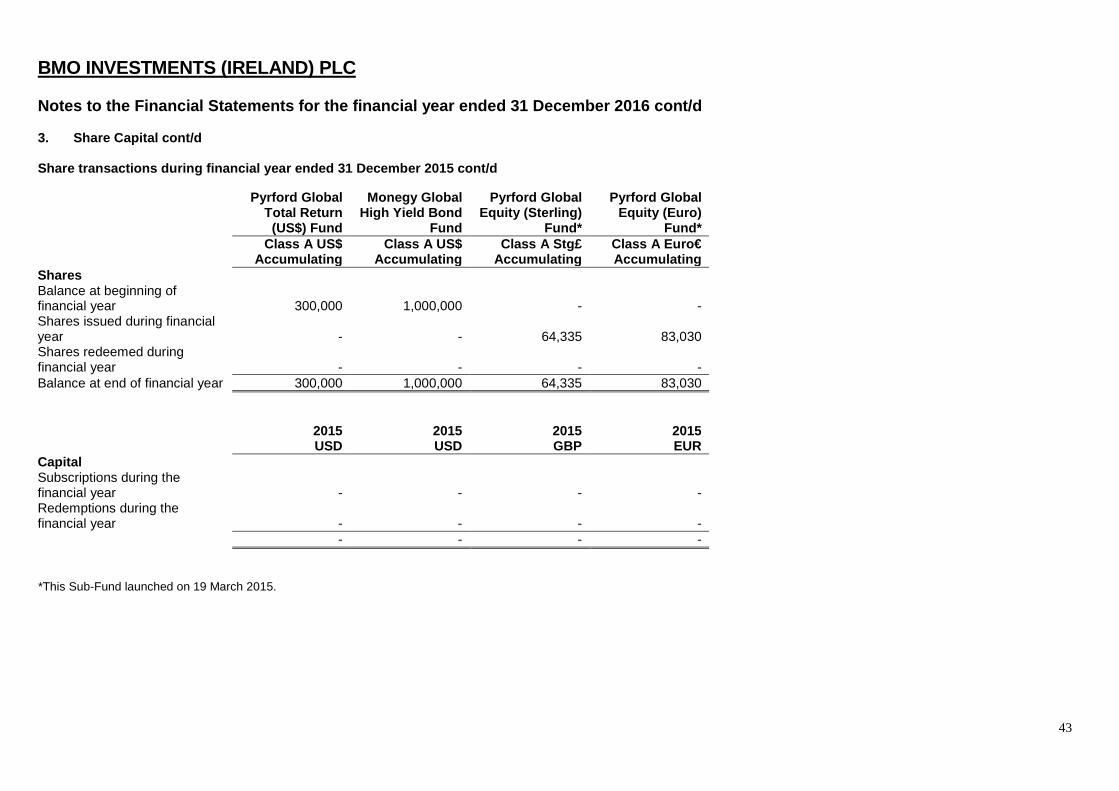
BMO INVESTMENTS (IRELAND) PLC
43
Notes to the Financial Statements for the financial year ended 31 December 2016 cont/d
3. Share Capital cont/d Share transactions during financial year ended 31 D ecember 2015 cont/d
Pyrford Global Total Return
(US$) Fund
Monegy Global High Yield Bond
Fund
Pyrford Global Equity (Sterling)
Fund*
Pyrford Global Equity (Euro)
Fund* Class A US$ Class A US$ Class A Stg£ Class A Euro € Accumulating Accumulating Accumulating Accumulating Shares Balance at beginning of financial year 300,000 1,000,000 - -
Shares issued during financial year - - 64,335 83,030 Shares redeemed during financial year - - - - Balance at end of financial year 300,000 1,000,000 64,335 83,030 2015 2015 2015 2015 USD USD GBP EUR Capital Subscriptions during the financial year - - - - Redemptions during the financial year - - - - - - - - *This Sub-Fund launched on 19 March 2015.

BMO INVESTMENTS (IRELAND) PLC
44
Notes to the Financial Statements for the financial year ended 31 December 2016 cont/d
3. Share Capital cont/d The following table details the number of shareholders with significant holdings of at least 20 per cent of the relevant Sub-Fund and the percentage of that holding as at 31 December 2016 and as at 31 December 2015.
Fund
Number of significant
shareholders
Total Holding as
at 31 Dec 2016
Aggregate Shareholding as a % of the Sub- Fund as
at 31 Dec 2016
Total Holding as
at 31 Dec 2015
Aggregate Shareholding as a % of the Sub- Fund as
at 31 Dec 2015
BMO Global Low Volatility Alpha Equity Fund 1
99,756 100.00% 100,000 100.00%
Pyrford Asia Pacific ex-Japan Equity Fund 1 100,000 100.00% 100,000 100.00%
Pyrford Global Equity (US$) Fund 1 297,087 87.22% 200,000 82.12% Pyrford International (EAFE) Equity Fund 1 1,542,897 100.00% 1,542,897 100.00% Pyrford Shariah Global Equity Fund 2 139,841 100.00% 139,841 100.00%
Pyrford Global Total Return (Euro) Fund 1 222,717 93.79% 222,717 93.74%
Pyrford Global Total Return (US$) Fund 1 300,000 100.00% 300,000 100.00% Monegy Global High Yield Bond Fund* - - - 1,000,000 100.00% Pyrford Global Equity (Sterling) Fund** 1 64,335 94.18% 64,335 100.00% Pyrford Global Equity (Euro) Fund** 1 83,030 100.00% 83,030 100.00%
*This Sub-fund was fully redeemed on 30 November 2016. **These Sub-funds commenced trading on 19 March 2015.
Anti-Dilution Levy Where the Company deems there to be large net subscriptions or net redemptions and to prevent any adverse effect on the value of the assets of a Sub-Fund, the Company may charge an anti-dilution levy for retention as part of the assets of the relevant Sub-Fund, as detailed in note 1(o) of these audited financial statements.

BMO INVESTMENTS (IRELAND) PLC
45
Notes to the Financial Statements for the financial year ended 31 December 2016 cont/d
4. Net Gain/(Loss) on Investment Activities during the financial year Financial year ended 31 December 2016
Total
BMO Global Low Volatility Alpha
Equity Fund
Pyrford Asia Pacific ex-
Japan Equity Fund
Pyrford Global Total Return
(Sterling) Fund
Pyrford Global Equity (US$)
Fund
Pyrford International
(EAFE) Equity Fund
2016 2016 2016 2016 2016 2016 USD USD USD GBP USD USD Gains/(losses) on: Investments 175,137,012 87,166 100,903 128,125,627 141,187 261,813 Foreign currency 89,278,172 (22,387) (17,729) 66,534,197 (13,435) (322,083) Net gain/(losses) on investment activities 264,415,184 64,779 83,174 194,659,824 127,752 (60,270)
Pyrford Shariah
Global Equity Fund
Pyrford Global Total Return (Euro) Fund
Pyrford Global Total Return
(US$) Fund
Monegy Global High Yield
Bond Fund*
Pyrford Global Equity
(Sterling) Fund
Pyrford Global Equity (Euro)
Fund 2016 2016 2016 2016 2016 2016 USD EUR USD USD GBP EUR Gains/(losses) on: Investments 176,904 57,642 85,568 966,492 148,695 63,640 Foreign currency (35,318) (12,209) (59,260) (66,697) 5,221 (5,816) Net gain/(losses) on investment activities 141,586 45,433 26,308 899,795 153,916 57,824 *This Sub-fund was fully redeemed on 30 November 2016.
Included in net gains and losses on investment activities for the financial year ended 31 December 2016 is interest income of: Pyrford Global Total Return (Sterling) Fund £63,026,965; Pyrford Global Total Return (Euro) Fund €64,142; Pyrford Global Total Return (US$) Fund $91,241; and Monegy Global High Yield Bond Fund $521,224.

BMO INVESTMENTS (IRELAND) PLC
46
Notes to the Financial Statements for the financial year ended 31 December 2016 cont/d 4. Net Gain/(Loss) on Investment Activities during the financial year
Financial year ended 31 December 2015
Total
BMO Global Low Volatility Alpha
Equity Fund
Pyrford Asia Pacific ex-
Japan Equity Fund
Pyrford Global Total Return
(Sterling) Fund
Pyrford Global Equity (US$)
Fund
Pyrford International
(EAFE) Equity Fund
2015 2015 2015 2015 2015 2015 USD USD USD GBP USD USD Gains/(losses) on: Investments 30,062,261 28,698 (192,051) 20,848,111 (115,717) (1,008,812) Foreign currency 9,084,839 (36,087) (8,746) 6,150,797 (54,503) (182,687) Net gain/(losses) on investment activities 39,147,100 (7,389) (200,797) 26,998,908 (170,220) (1,191,499)
Pyrford Shariah
Global Equity Fund
Pyrford Global Total Return (Euro) Fund
Pyrford Global Total Return
(US$) Fund
Monegy Global High Yield
Bond Fund
Pyrford Global Equity
(Sterling) Fund*
Pyrford Global Equity (Euro)
Fund* 2015 2015 2015 2015 2015 2015 USD EUR USD USD GBP EUR Gains/(losses) on: Investments (101,060) 74,216 (82,751) (276,421) (33,371) (57,881) Foreign currency (16,052) 2,717 (11,799) (305) (1,341) (557) Net gain/(losses) on investment activities (117,112) 76,933 (94,550) (276,726) (34,712) (58,438)
*These Sub-Funds commenced trading on 19 March 2015. Included in net gains and losses on investment activities for the financial year ended 31 December 2015 is interest income of: Pyrford Global Total Return (Sterling) Fund £62,297,958; Pyrford Global Total Return (Euro) Fund €60,008; Pyrford Global Total Return (US$) Fund $100,514; and Monegy Global High Yield Bond Fund $604,860.

BMO INVESTMENTS (IRELAND) PLC
47
Notes to the Financial Statements for the financial year ended 31 December 2016 cont/d
5. Fees
(i) Directors’ Fees The Company’s Articles of Association provide that the Directors shall be entitled to a fee by way of remuneration for their services at a rate to be determined from time to time by the Directors. The Prospectus provides that the aggregate amount of Directors’ remuneration in any one financial year shall not exceed EUR 50,000. In addition, the Directors shall be entitled to recover from the Company out-of-pocket expenses including, but not limited, to all travelling, hotel and other expenses properly incurred by them in relation to the performance of their obligations. Directors’ fees and expense reimbursements incurred by the Company during the financial year ended 31 December 2016 amounted to USD 66,549 (financial year ended 31 December 2015: USD 49,743). Directors’ fees payable by the Company at the financial year-end were USD 7,474 (as at 31 December 2015: USD 748). (ii) Administrator’s Fees The Administrator will be entitled to receive out of the assets of each Sub-Fund an annual fee that will not exceed 1.75% of the Net Asset Value of the Sub-Fund (together with value added tax, if any) together with transaction charges at normal commercial rates and reasonable out-of-pocket expenses incurred by the Administrator in the performance of its duties, as detailed in the fee schedule effective 18 March 2016. These fees accrue and are calculated on each Dealing Day and are payable monthly in arrears. Administrator’s fees incurred by the Company during the financial year ended 31 December 2016 amounted to USD 1,082,020 (financial year ended 31 December 2015: USD 1,136,101). Administrator’s fees payable by the Company at the financial year-end were USD 480,568 (as at 31 December 2015: USD 391,792). Each Sub-Fund is subject to a monthly minimum fee of EUR 4,500. However, the application of this fee has been waived by the Administrator for the first 12 months from each Sub-Fund’s launch date, and waived by 50% for the following 12 months and a 25% waiver for months 24 to 36 from each Sub-Fund’s launch date. (iii) Depositary’s Fees The Depositary is entitled to receive out of the assets of the Sub-Funds an annual fee that will not exceed 0.25% per annum of the net asset value of each Sub-Fund (together with value added tax, if any). This fee accrues daily and is calculated on each Dealing Day and is payable monthly in arrears. The Depositary is also entitled to receive out of the assets of the Sub-Funds all agreed sub-custodian fees and transaction charges (which will be charged at normal commercial rates). The Depositary is authorised to deduct its remuneration, reasonable and properly vouched expenses and disbursements on account of the Company. The minimum annual fee is subject to waivers for the first 24 months from each Sub-Fund’s launch date as detailed in the administration fee agreement. Depositary fees incurred by the Company during the financial year ended 31 December 2016 amounted to USD 586,133 (financial year ended 31 December 2015: USD 411,544). Depositary fees payable by the Company at the financial year-end were USD 371,260 (as at 31 December 2015: USD 208,978). (iv) Investment Management Fees The investment management fee in respect of Class A Shares shares is up to 2% per annum for each Class and such fee is borne by each Class based on the net asset value of each Class accrued daily and payable monthly. The investment management fee in respect of Class B Shares shall be up to 0.75% per annum for each Class and such fee shall be borne by each Class based on the Net Asset Value of each Class accrued daily and payable monthly. The investment management fee in respect of Class C Shares shall be up to 0.55% per annum for each Class and such fee shall be borne by each Class based on the Net Asset Value of each Class accrued daily and payable monthly. In addition, the Investment Manager is entitled to recover from each Sub-Fund reasonable out-of-pocket expenses incurred in the performance of its duties. The sub-investment management fees are paid out of the investment management fees.
The Investment Manager may from time to time, and at its sole discretion, and out of its own resources, decide to rebate to distributors and/or Shareholders part or all of the investment management fee. The Investment Manager may from time to time, and at its sole discretion, voluntarily decide to waive all or a portion of its investment management fee payable in respect of a Fund/Class so as to limit the total fees and expenses attributable to a Fund/Class. If applicable, the waived management fees are shown as Investment Management fee reimbursements on the Statement of Comprehensive Income.

BMO INVESTMENTS (IRELAND) PLC
48
Notes to the Financial Statements for the financial year ended 31 December 2016 cont/d 5. Fees cont/d
(v) Governance Service Provider Fees The fees charged by KB Associates for services provided since 1 January 2016 and charged to the Company during the financial year ended 31 December 2016 amounted to USD 30,417 (31 December 2015: USD 21,871). (vi) Auditors’ Remuneration The remuneration for all work carried out by the statutory audit firm in respect of the current and prior financial year is as follows: 2016 2015 EUR EUR
Statutory audit (including reimbursement of expenses)
54,780
56,048
Total 54,780 56,048 The fees for statutory audit of the accounts disclosed in the table above are exclusive of VAT and inclusive of out of pocket expenses. The audit fees recognised in the Statement of Comprehensive Income are inclusive of VAT. There were no fees charged for other assurance services or other non-audit services in respect of the current and prior financial year. (vii) Transaction Costs Transaction costs on the purchase and sale of transferable securities, exchange traded financial derivative instruments and over the counter (“OTC”) financial derivative instruments, are included in the purchase and sale price of the investment. As disclosed in note 1 of these audited financial statements, transaction costs on the purchase and sale of certain transferable securities and OTC financial derivative instruments cannot be practically or reliably gathered as they are embedded in the cost of the investment and cannot be separately verified or disclosed. Transaction costs on purchases and sales of equities are readily identifiable and for the financial year ended 31 December 2016 and 31 December 2015 are as follows:
Fund Name 31 December 201 6 31 December 201 5 USD USD BMO Global Low Volatility Alpha Equity Fund 12,255 12,428 Pyrford Asia Pacific ex-Japan Equity Fund 5,984 7,717 Pyrford Global Total Return (Sterling) Fund 1,116,348 766,182 Pyrford Global Equity (US$) Fund 8,341 27,907 Pyrford International (EAFE) Equity Fund 16,862 19,109 Pyrford Shariah Global Equity Fund 5,615 5,385 Pyrford Global Total Return (Euro) Fund 4,836 9,771 Pyrford Global Total Return (US$) Fund 3,639 5,847 Monegy Global High Yield Bond Fund* 21,879 13,581 Pyrford Global Equity (Sterling) Fund** 7,451 8,674 Pyrford Global Equity (Euro) Fund** 5,743 9,567 Total 1,208,953 886,168
*This Sub-fund was fully redeemed on 30 November 2016. **These Sub-funds commenced trading on 19 March 2015.

BMO INVESTMENTS (IRELAND) PLC
49
Notes to the Financial Statements for the financial year ended 31 December 2016 cont/d 5. Fees cont/d Operating expenses
For the financial year ended 31 December 2016 and 31 December 2015, the Sub-Funds incurred the following operating expenses: Financial year ended 31 December 2016:
Company Total USD
BMO Global
Low Volatility
Alpha Equity
Fund USD
Pyrford Asia
Pacific ex-Japan
Equity Fund USD
Pyrford Global Total
Return (Sterling)
Fund GBP
Pyrford Global Equity (US$) Fund
USD
Pyrford International
(EAFE) Equity
Fund USD Expenses
Investment Management fees (29,511,510) (14,591) (14,566) (21,487,170) (30,632) (254,350) Administration fees (1,082,020) (32,141) (32,139) (616,185) (32,134) (32,118) Depositary fees (586,133) (486) (740) (424,000) (735) (6,104) Compliance & Monitoring fee (384,809) (8,034) (8,033) (236,781) (8,033) (7,788) Transaction fees (64,688) (8,593) (3,942) (8,354) (4,569) (3,314) Other expenses (694,791) (37,154) (28,291) (299,220) (30,854) (30,041) Operating Expenses (32,323,951) (100,999) (87,711) (23,071,710) (106,957) (333,715)
Pyrford Shariah Global
Equity Fund
Pyrford Global
Total Return (Euro) Fund
Pyrford Global
Total Return
(US$) Fund
Monegy Global High Yield Bond
Fund*
Pyrford Global Equity
(Sterling) Fund
Pyrford Global Equity (Euro) Fund Expenses
Investment Management fees (22,803) (26,731) (30,394) (82,034) (8,829) (9,896) Administration fees (32,134) (28,800) (32,034) (23,321) (876) (1,056) Depositary fees (547) (803) (912) (2,734) (212) (237) Compliance & Monitoring fee (8,034) (7,200) (8,008) (5,829) (222) (2,846) Transaction fees (3,552) (3,195) (3,591) (13,386) (3,051) (4,375) Other expenses (27,991) (46,456) (22,378) (22,987) (12,940) (20,368) Operating Expenses (95,061) (113,185) (97,317) (150,291) (26,130) (38,778) *This Sub-fund was fully redeemed on 30 November 2016.

BMO INVESTMENTS (IRELAND) PLC
50
Notes to the Financial Statements for the financial year ended 31 December 2016 cont/d
5. Fees cont/d Operating expenses
Financial year ended 31 December 2015:
Company Total USD
BMO Global
Low Volatility
Alpha Equity
Fund USD
Pyrford Asia
Pacific ex-Japan Equity
Fund USD
Pyrford Global Total
Return (Sterling)
Fund GBP
Pyrford Global Equity (US$) Fund
USD
Pyrford International
(EAFE) Equity
Fund USD Expenses
Investment Management fees (34,423,523) (14,134) (15,452) (22,199,578) (34,014) (263,560) Administration fees (1,136,101) (32,003) (31,655) (587,187) (31,575) (31,575) Depositary fees (411,544) (487) (920) (260,550) (800) (6,365) Compliance & Monitoring fee (411,766) (8,000) (7,914) (230,295) (7,955) (7,865) Transaction fees (99,543) (10,559) (5,888) (9,457) (18,515) (9,626) Other expenses (551,965) (25,040) (26,161) (197,631) (28,713) (24,957) Operating Expenses (37,034,442) (90,223) (87,990) (23,484,698) (121,572) (343,948)
Pyrford Shariah Global
Equity Fund
Pyrford Global
Total Return (Euro) Fund
Pyrford Global
Total Return
(US$) Fund
Monegy Global
High Yield Bond Fund
Pyrford Global Equity
(Sterling) Fund*
Pyrford Global Equity (Euro) Fund* Expenses
Investment Management fees (22,528) (25,753) (30,730) (89,294) (5,989) (7,777) Administration fees (31,676) (27,645) (31,074) (17,977) (335) (435) Depositary fees (521) (693) (773) (2,519) (144) (187) Compliance & Monitoring fee (7,919) (6,912) (7,782) (4,617) (96) (125) Transaction fees (2,901) (3,980) (3,839) (16,422) (4,286) (5,745) Other expenses (26,507) (39,271) (25,837) (12,801) (11,905) (16,460) Operating Expenses (92,052) (104,254) (100,035) (143,630) (22,755) (30,729)
*These Sub-Funds commenced trading on 19 March 2015.
6. Risks Associated with Financial Instruments The activities of each Sub-Fund expose the Company to various financial risks such as market risk (including price risk, interest rate risk and currency risk), credit or default risk and liquidity risk. The Company’s overall risk management process seeks to minimise potential adverse effects on the Sub-Funds’ financial performance. The policies documented are standard operational practices and are reviewed on a continuous basis. Please refer to the Prospectus for a list of material risks affecting the Company. The Board and the governance service provider receives regular reporting on risk matters and reviews the risk management process on an annual basis. These policies have remained substantially unchanged during the financial year under review.

BMO INVESTMENTS (IRELAND) PLC
51
Notes to the Financial Statements for the financial year ended 31 December 2016 cont/d 6. Risks Associated with Financial Instruments con t/d
Investment Strategy The Company’s investment risk for the Sub-Funds is managed by the Investment Manager. The Investment Manager takes an absolute rather than a relative approach to risk where capital preservation is a critical factor and that principle flows through all investment decisions.
The allocation of investments is driven by value rather than index weight and the Investment Manager will not invest in markets which have substantial downside risk. Thus, the ability to move any markets or stocks to a zero weight is the principal risk control mechanism operated by the Investment Manager. The Investment Manager operates three types of control over the management of risk, namely country level, sector and returns based. At a country level, the Investment Manager has guidelines in terms of maximum allocation to each country / region.
These maxima are derived from a combination of absolute volatility and market capitalisation. At the stock level, the Investment Manager has maximum percentage weights allowed in any one security. At a sector level, the Investment Manager runs factor based analysis to check active sector positions. The sector weights can be a product of either the Investment Manager’s strong macro views or as a result of a series of micro level decisions. Factor based analysis helps the Investment Manager to ensure that both the size and direction of its sector positions are acceptable, intentional and adequately diversified. The third level of risk control is done on an ex-post basis using returns analysis. This is a high level check to ensure that the portfolio performance was as expected in terms of the factors driving the market during the preceding period. Derivatives Exposure The Investment Manager monitors the derivatives exposure of each Sub-Fund on a daily basis for any Sub- Fund that uses derivatives, to ensure it remains within the limits required by the UCITS Regulations. This exposure is calculated using the Commitment Approach which in general terms is calculated using the total gross value of the notional assets underlying each derivative. The Sub-Funds can use investment techniques and financial derivative instruments (“FDI”) for efficient portfolio management and investment purposes. The Sub-Funds only use a limited number of simple FDI for non-complex hedging or investment strategies. Taking into account the investment strategy and risk profile of the Sub-Fund, the types and complexities of the FDI used by the Sub-Fund and the proportion of the Sub-Fund’s portfolio which comprises FDI, the Investment Manager is satisfied that the commitment approach is an appropriate risk measurement methodology to calculate the global exposure of the Sub-Fund. The Company has delegated the investment management of the Sub-Funds to the Investment Manager. Under the terms of the investment management agreement, the Investment Manager is responsible for monitoring and measuring the risks associated with the use of FDI by the Sub-Fund in respect of which they have been appointed and their contribution to the overall risk profile of the relevant Sub-Fund. This risk management process (“RMP”) documents the Investment Managers’ systems of risk limitation using the management information systems. The Investment Manager use the RMP to manage, measure and monitor on an ongoing basis the risks involved in the use of FDI by the Sub-Funds. This RMP is designed to ensure that investors in the Sub-Funds are sufficiently protected from adverse events related to the use of FDI. To meet this overall objective controls and limits have been put in place in relation to global exposure and leverage limits, counterparty limits and issuer limits.
(a) Market/price volatility risk Market risk arises mainly from uncertainty about the future prices of financial instruments held. It represents the potential loss a Sub-Fund might suffer through holding market positions in the face of price movements caused by factors specific to the individual investment or factors affecting all instruments traded in the market. All investments in securities present a risk of loss of capital. The investment manager and sub-investment managers moderate the risk by ensuring careful selection of securities and other financial instruments within the specified limits as detailed in the Prospectus. The majority of the assets held by the Company and its Sub-Funds are equities, bonds and forward foreign currency exchange contracts.

BMO INVESTMENTS (IRELAND) PLC
52
Notes to the Financial Statements for the financial year ended 31 December 2016 cont/d 6. Risks Associated with Financial Instruments con t/d
(a) Market/price volatility risk cont/d
Price Sensitivity Analysis If the price of each equity security or collective investment scheme held by each Sub-Fund had increased by 1% at 31 December 2016 and 31 December 2015 respectively, with all other variables remaining constant, this would have increased the net assets of that Sub-Fund as disclosed in the table below. 31 December
2016 31 December
2015 31 December
2016 exposure 31 December
2015 exposure BMO Global Low Volatility Alpha Equity Fund USD 16,159 USD 15,292
USD 1,615,887
USD 1,529,214
Pyrford Asia Pacific ex-Japan Equity Fund USD 12,011 USD 10,963
USD 1,201,092
USD 1,096,307
Pyrford Global Total Return (Sterling) Fund GBP 7,117,403 GBP 6,902,361
GBP 711,740,27
GBP 690,236,133
Pyrford Global Equity (US$) Fund USD 33,283 USD 22,607
USD 3,328,293
USD 2,260,695
Pyrford International (EAFE) Equity Fund USD 195,895 USD 197,686
USD 19,589,500
USD 19,768,617
Pyrford Shariah Global Equity Fund USD 19,010 USD 17,051
USD 1,901,001
USD 1,705,112
Pyrford Global Total Return (Euro) Fund EUR 9,798 EUR 9,097
EUR 979,780
EUR 909,724
Pyrford Global Total Return (US$) Fund USD 7,887 USD 7,982
USD 788,707
USD 798,195
Pyrford Global Equity (Sterling) Fund GBP 7,977 GBP 5,933
GBP 797,736
GBP 593,254
Pyrford Global Equity (Euro) Fund EUR 8,430 EUR 7,696
EUR 842,995
EUR 769,596
ǂThis fund only invests in bonds.
*This Sub-fund was fully redeemed on 30 November 2016. All investments listed in debt securities are fixed-income instruments. The Sub-Funds expect price fluctuations for these securities to arise principally from interest rate risk or credit risk. As a result, the Sub-Funds are not subject to significant other price risk on these instruments. Forward foreign currency exchange contracts are not subject to prices risk, but are subject to foreign currency risk.
The Sub-Funds are subject to diversification requirements under UCITS Regulations with respect to investment in an individual security. As at 31 December 2016, no equity investment represented more than 6.11% (as at 31 December 2015: 6.11%) of the value of the Sub-Fund while no bond investment represented more than 15.38% of the value of the Sub-Fund (as at 31 December 2015: 16.47%).
(b) Foreign currency risk
The Sub-Funds may hold assets denominated in currencies other than the functional currency of the relevant Sub-Fund. These Sub-Funds are therefore exposed to currency risk, as the value of securities denominated in other currencies will fluctuate due to changes in exchange rates. The functional currency of the Pyrford Global Total Return (Sterling) Fund and Pyrford Global Equity (Sterling) Fund is GBP, the functional currency of Pyrford Global Total Return (Euro) Fund and Pyrford Global Equity (Euro) Fund is EUR and functional currency of the remainder of the launched Sub-Funds is USD. In addition, the Sub-Funds may utilise financial instruments such as forward foreign currency exchange contracts to hedge against fluctuations in the non-functional exposure of the underlying securities relative to their functional currency, as detailed hereunder.

BMO INVESTMENTS (IRELAND) PLC
53
Notes to the Financial Statements for the financial year ended 31 December 2016 cont/d 6. Risks Associated with Financial Instruments con t/d (b) Foreign currency risk cont/d
The currency exposure of the Sub-Funds as at 31 December 2016 and 31 December 2015 is shown below, together with the approximate increase or decrease (sensitivity) in net assets attributable to redeemable participating shareholders of each relevant Sub-Fund if the exchange rate of the base currency moved by 5% relative to the non-base exposure. The currency exposure and sensitivity analysis detailed hereunder relates to monetary assets and liabilities. As at 31 December 2016
Pyrford Global Total Return (Sterling) Fund
Monetary Assets Monetary Liabilities
Forward FX Contracts Total
Sensitivity
GBP GBP GBP GBP GBP Australian Dollar 121,443,007 - (146,989,288) (25,546,281) (1,216,490) Canadian Dollar 111,622,137 - - 111,622,137 5,315,340 Euro - (234) - (234) (11) Swiss Franc - - (39,294,106) (39,294,106) (1,871,148) US Dollar 31,587 - - 31,587 1,504
233,096,731 (234) (186,283,394) 46,813,103 2,229,195 Non-monetary assets of the Pyrford Global Total Return (Sterling) Fund denominated in Swiss Franc and Australian Dollar are insulated against fluctuations with Sterling through the use of forward foreign currency exchange contracts.
Pyrford Global Equity (US$) Fund
Monetary Assets Monetary Liabilities
Forward FX Contracts Total
Sensitivity
USD USD USD USD USD Australian Dollar - (91,626) - (91,626) (4,364) British Pound - (84,954) - (84,954) (4,045) Canadian Dollar - (37,598) - (37,598) (1,790) Hong Kong Dollar - (65,161) - (65,161) (3,103) Japanese Yen - (32,996) (33,201) (66,197) (3,101) Malaysian Ringgit - (37,006) - (37,006) (1,762) Singapore Dollar - (34,337) (34,275) (68,612) (3,276) Swiss Franc - (103,860) - (103,860) (4,946) Taiwan Dollar 52,940 - - 52,940 2,521 52,940 (487,538) (67,476) (502,074) (23,866)
Non-monetary assets of the Pyrford Global Equity (US$) Fund denominated in Japanese Yen and Singapore Dollar are insulated against fluctuations with USD through the use of forward foreign currency exchange contracts.

BMO INVESTMENTS (IRELAND) PLC
54
Notes to the Financial Statements for the financial year ended 31 December 2016 cont/d 6. Risks Associated with Financial Instruments con t/d
(b) Foreign currency risk cont/d As at 31 December 2016 cont/d
Pyrford Global Total Return (Euro) Fund
Monetary Assets Monetary Liabilities
Forward FX Contracts Total
Sensitivity
EUR EUR EUR EUR EUR Australian Dollar - - (25,864) (25,864) (1,232) British Pound 209,550 - - 209,550 9,979 Canadian Dollar 261,292 - - 261,292 12,443 Malaysian Ringgit 5 - - 5 - Taiwan Dollar 1,189 - - 1,189 57 US Dollar 222,694 - - 222,694 10,604
694,730 - (25,864) 668,866 31,851
Non-monetary assets of the Pyrford Global Total Return (Euro) Fund denominated in Australian Dollar are insulated against fluctuations with Euro through the use of forward foreign currency exchange contracts.
Pyrford Global Total Return (US$) Fund
Monetary Assets Monetary Liabilities
Forward FX Contracts Total
Sensitivity
USD USD USD USD USD British Pound 282,463 - - 282,463 13,451 Canadian Dollar 452,374 - - 452,374 21,542
734,837 - - 734,837 34,993
Pyrford Global Equity (Sterling) Fund
Monetary Assets Monetary Liabilities
Forward FX Contracts Total
Sensitivity
GBP GBP GBP GBP GBP Australian Dollar - - (71,409) (71,409) (3,400) Swiss Frank - - (83,265) (83,265) (3,965)
- - (154,674) (154,674) (7,365)
Non-monetary assets of the Pyrford Global Equity (Sterling) Fund denominated in Swiss Franc and Australian Dollar are insulated against fluctuations with Sterling through the use of forward foreign currency exchange contracts.
Pyrford Global Equity (Euro) Fund
Monetary Assets Monetary Liabilities
Forward FX Contracts Total
Sensitivity
EUR EUR EUR EUR EUR Australian Dollar - - (66,021) (66,021) (3,144) Taiwan Dollar 3,338 - - 3,338 159 United States Dollar 208 - - 208 10
3,546 - (66,021) (62,475) (2,975)
Non-monetary assets of the Pyrford Global Equity (Euro) Fund denominated in Australian Dollar are insulated against fluctuations with Euro through the use of forward foreign currency exchange contracts.

BMO INVESTMENTS (IRELAND) PLC
55
Notes to the Financial Statements for the financial year ended 31 December 2016 cont/d 6. Risks Associated with Financial Instruments con t/d
(b) Foreign currency risk cont/d As at 31 December 2016 cont/d
The following Sub-Funds were not deemed to have significant exposure to foreign currency risk as at 31 December 2016. Listed below is the percentage of monetary net assets that were held by each of these Sub-Funds in their respective functional and presentation currency: BMO Global Low Volatility Alpha Equity Fund: 67.41% (2015: 89.13%) Pyrford Asia Pacific ex-Japan Equity Fund: 98.49% (2015: (37.61)%*) Pyrford International (EAFE) Equity Fund: 93.27% (2015: 99.10%) Pyrford Shariah Global Equity: 59.44% (2015: 97.70%)
*Monetary liabilities exceed monetary assets.
As at 31 December 2015
Pyrford Global Total Return (Sterling) Fund
Monetary Assets Monetary Liabilities
Forward FX Contracts Total
Sensitivity
GBP GBP GBP GBP GBP Canadian Dollar 134,269,062 - - 134,269,062 6,713,453 Euro 121,022 (134) - 120,888 6,044 Israeli Shekel 264 - - 264 13 Japanese Yen 113,522 - - 113,522 5,676 Malaysian Ringgit 3 - - 3 - Norwegian Krone 71,698 - - 71,698 3,585 Singapore Dollar 139,171 - - 139,171 6,959 Swiss Franc 19 - (346,947) (346,928) (17,346) Taiwan Dollar 515,272 - - 515,272 25,764 US Dollar 322,719,547 - - 322,719,547 16,135,977
457,949,580 (134) (346,947) 457,602,499 22,880,125
Pyrford Global Total Return (Euro) Fund
Monetary Assets Monetary Liabilities
Forward FX Contracts Total
Sensitivity
EUR EUR EUR EUR EUR Australian Dollar - - (23,319) (23,319) (1,110) British Pound 250,196 - - 250,196 12,482 Canadian Dollar 249,632 - - 249,632 12,510 Japanese Yen 171 - - 171 9 Singapore Dollar 130 - - 130 7 Taiwan Dollar 934 - - 934 47 US Dollar 221,271 - - 221,271 11,064
722,334 - (23,319) 699,015 35,009

BMO INVESTMENTS (IRELAND) PLC
56
Notes to the Financial Statements for the financial year ended 31 December 2016 cont/d 6. Risks Associated with Financial Instruments con t/d
(b) Foreign currency risk cont/d
As at 31 December 2015 cont/d
Pyrford Global Total Return (US$) Fund Monetary
Assets Monetary Liabilities
Forward FX Contracts Total
Sensitivity
USD USD USD USD USD British Pound 252,816 - - 252,816 12,641 Canadian Dollar 422,129 - - 422,129 20,106 Euro 114 - - 114 6 Hong Kong Dollar - (6,156) - (6,156) (308) Japanese Yen 147 - - 147 7 Malaysian Ringgit 4 - - 4 - Singapore Dollar 141 - - 141 7 Taiwan Dollar 3 - - 3 -
675,354 (6,156) - 669,198 32,459
Monegy Global High Yield Bond Fund Monetary
Assets Monetary Liabilities
Forward FX Contracts Total
Sensitivity
USD USD USD USD USD British Pound 156,541 - - 156,541 7,827 Euro 112,296 - - 112,296 5,615
268,837 - - 268,837 13,442
Pyrford Global Equity (Sterling) Fund Monetary
Assets Monetary Liabilities
Forward FX Contracts Total
Sensitivity
GBP GBP GBP GBP GBP Canadian Dollar 23 - - 23 1 Euro 63 - - 63 3 Japanese Yen 99 - - 99 5 Malaysian Ringgit 25 - - 25 1 Singapore Dollar 122 - - 122 6 Swiss Franc - - (61,856) (61,856) (2,946) Taiwan Dollar 280 - - 280 14 US Dollar 440 - - 440 2
1,052 - (61,856) (60,804) (2,914)
Pyrford Global Equity (Euro) Fund Monetary
Assets Monetary Liabilities
Forward FX Contracts Total
Sensitivity
EUR EUR EUR EUR EUR Australian Dollar - - (59,964) (59,964) (2,998) British Pound 308 - - 308 15 Canadian Dollar 28 - - 28 1 Japanese Yen 131 - - 131 7 Malaysian Ringgit 33 - - 33 2 Singapore Dollar 165 - - 165 8 Taiwan Dollar 380 - - 380 19 US Dollar 554 - - 554 37
1,599 - (59,964) (58,365) (2,909)

BMO INVESTMENTS (IRELAND) PLC
57
Notes to the Financial Statements for the financial year ended 31 December 2016 cont/d 6. Risks Associated with Financial Instruments con t/d
(c) Interest rate risk
This risk is defined as the risk that the value or future cash flows of a financial instrument will fluctuate because of changes in market interest rates. Sub-Funds which hold fixed interest rate debt securities are exposed to interest rate risk where the value of these securities may fluctuate as a result of a change in market interest rates. The Pyrford Global Total Return (Sterling) Fund’s, Pyrford Global Total Return (Euro) Fund’s, Pyrford Global Total Return (US$) Fund’s and Monegy Global High Yield Bond Fund’s interest bearing assets are subject to changes in the level of interest rates.
Generally, the value of fixed income securities will change inversely with changes in interest rates, the effect being greater the longer the maturity of the security. The tables below summarises the exposure to interest rate risk, including the assets and liabilities at fair value, for Pyrford Global Total Return (Sterling) Fund.
31 December 201 6 Up to 1 year 1-5 years
Over 5 years
Non- Interest Bearing Total Value
Assets GBP GBP GBP GBP GBP Deposits with credit institutions 96,665,100 - - - 96,665,100 Investments 496,663,813 1,044,358,926 - 711,740,270 2,252,763,009 Financial Derivative Instruments - - - 8,523,676 8,523,676 Other Assets - - - 24,037,193 24,037,193 Total Assets 593,328,913 1,044,358,926 - 744,301,139 2,381,988,978 Liabilities Financial Derivative Instruments - - - (1,173,013) (1,173,013) Other Liabilities - - - (2,492,990) (2,492,990) Total Liabilities - - - (3,666,003) (3,666,003) Total Net Assets 2,378,322,975

BMO INVESTMENTS (IRELAND) PLC
58
Notes to the Financial Statements for the financial year ended 31 December 2016 cont/d 6. Risks Associated with Financial Instruments con t/d (c) Interest rate risk cont/d
31 December 201 5 Up to 1 year 1-5 years
Over 5 years
Non- Interest Bearing Total Value
Assets GBP GBP GBP GBP GBP Deposits with credit institutions
43,518,054 - - -
43,518,054
Investments 426,731,245 956,767,028 74,356,082 690,236,133 2,148,090,488 Financial Derivative Instruments - - - - - Other Assets - - - 19,608,556 19,608,556
Total Assets 470,249,299 956,767,028 74,356,082 709,844,689
2,211,217,098 Liabilities Financial Derivative Instruments - - -
(346,947) (346,947)
Other Liabilities - - - (4,363,740) (4,363,740) Total Liabilities - - - (4,710,687) (4,710,687) Total Net Assets 2,206,506,411
The tables below summarises the exposure to interest rate risk, including the assets and liabilities at fair value, for Pyrford Global Total Return (Euro) Fund.
31 December 201 6 Up to 1 year 1-5 years Over 5 years
Non- Interest Bearing Total Value
Assets EUR EUR EUR EUR EUR Deposits with credit institutions 109,869 - - - 109,869 Investments 597,326 1,049,250 - 979,780 2,626,356 Financial Derivative Instruments - - - - - Other Assets - - - 56,411 56,411 Total Assets 707,195 1,049,250 - 1,036,191 2,792,636 Liabilities Financial Derivative Instruments - - - (242) (242) Other Liabilities - - - (54,021) (54,021) Total Liabilities - - - (54,263) (54,263)
Total Net Assets 2,738,373

BMO INVESTMENTS (IRELAND) PLC
59
Notes to the Financial Statements for the financial year ended 31 December 2016 cont/d 6. Risks Associated with Financial Instruments con t/d (c) Interest rate risk cont/d 31 December 201 5 Up to 1 year 1-5 years Over 5 years
Non- Interest Bearing Total Value
Assets EUR EUR EUR EUR EUR Deposits with credit institutions 95,256 - - - 95,256 Investments 290,874 1,382,087 - 909,724 2,582,685 Financial Derivative Instruments - - - - - Other Assets - - - 54,891 54,891 Total Assets 386,130 1,382,087 - 964,615 2,732,832 Liabilities Financial Derivative Instruments - - -
(1,533) (1,533)
Other Liabilities - - -
(37,873) (37,873) Total Liabilities - - - (39,406) (39,406)
Total Net Assets 2,693,426
The tables below summarises the exposure to interest rate risk, including the assets and liabilities at fair value, for Pyrford Global Total Return (US$) Fund.
31 December 201 6 Up to 1 year 1-5 years Over 5 years
Non- Interest Bearing Total Value
Assets USD USD USD USD USD Deposits with credit institutions 98,376 - - - 98,376 Investments 865,376 1,307,127 - 788,707 2,961,210 Financial Derivative Instruments - - - - - Other Assets - - - 33,268 33,268 Total Assets 963,752 1,307,127 - 821,975 3,092,854 Liabilities Other Liabilities - - - (73,443) (73,443) Total Liabilities - - - (73,443) (73,443) Total Net Assets 3,019,411

BMO INVESTMENTS (IRELAND) PLC
60
Notes to the Financial Statements for the financial year ended 31 December 2016 cont/d 6. Risks Associated with Financial Instruments con t/d (c) Interest rate risk cont/d
31 December 201 5 Up to 1 year 1-5 years Over 5 years
Non- Interest Bearing Total Value
Assets USD USD USD USD USD Deposits with credit institutions 146,974 - - - 146,974 Investments 792,270 1,301,688 - 798,194 2,892,152 Financial Derivative Instruments - - - - - Other Assets - - - 39,430 39,430 Total Assets 939,244 1,301,688 - 837,624 3,078,556 Liabilities Other Liabilities - - - (71,868) (71,868) Total Liabilities - - - (71,868) (71,868) Total Net Assets 3,006,688
The table below summarises the exposure to interest rate risk, including the assets and liabilities at fair value, for Monegy Global High Yield Bond Fund*.
31 December 2015 Up to 1 year 1-5 years Over 5 years
Non- Interest Bearing Total Value
Assets USD USD USD USD USD Deposits with credit institutions 1,551,234 - - - 1,551,234 Investments - 1,599,696 6,232,461 - 7,832,157 Other Assets - - - 138,138 138,138 Total Assets 1,551,234 1,599,696 6,232,461 138,138 9,521,529 Liabilities Other Liabilities - - - (38,314) (38,314) Total Liabilities - - - (38,314) (38,314) Total Net Assets 9,483,215
*The Sub-fund was fully redeemed during financial year ending 31 December 2016.
The Pyrford Global Total Return (Sterling) Fund had a modified duration of 1.7 as at 31 December 2016 (1.6 as at 31 December 2015) and consequently a change of 1% in yield would change the market value of the fixed income securities by +/- GBP 27 million (31 December 2015 GBP 24 million). The Pyrford Global Total Return (Euro) Fund had a modified duration of 1.4 as at 31 December 2016 (1.9 as at 31 December 2015) and consequently a change of 1% in yield would change the market value of the fixed income securities by +/- EUR 24 thousand (31 December 2015 EUR 32 thousand). The Pyrford Global Total Return (US$) Fund had a modified duration of 1.7 as at 31 December 2016 (1.4 as at 31 December 2015) and consequently a change of 1% in yield would change the market value of the fixed income securities by +/- USD 37 thousand (31 December 2015 USD 30 thousand). All bonds have fixed coupon rates.

BMO INVESTMENTS (IRELAND) PLC
61
Notes to the Financial Statements for the financial year ended 31 December 2016 cont/d 6. Risks Associated with Financial Instruments cont /d (d) Credit or default risk
Credit risk is the risk that an issuer or counterparty may be unable to meet a commitment that it has entered into with the Company. The Sub-Funds have exposure to counterparty risk on forward foreign exchange contracts and cash balances held with the Depositary. The Investment Manager may use forward foreign currency exchange contracts to hedge over-valued foreign currency exposure. These have a similar credit or default risk to a regular currency spot transaction. Forward foreign currency exchange contracts are ‘Over the Counter’ traded and therefore have counterparty risk which arises from the potential failure of counterparties to meet their obligations under the contract or arrangement. Forward contracts also carry roll risk, which is the risk that when a forward contract expires, a new forward to replace the expired one cannot be put into place at the same cost or on the same hedge basis. This may occur due to changes in market liquidity or interest rates, resulting in a potential slippage or loss in the hedge position due to the contract expiration and roll. The Company has entered into forward foreign currency exchange contracts during the financial year and prior financial year. As at 31 December 2016 and 31 December 2015, the Sub-Funds had open forward foreign exchange contracts with State Street Bank and Trust Company as the counterparty. The credit rating of State Street Bank and Trust Company is Aa1 as at 31 December 2016 and Aa1 as at 31 December 2015.
The forward foreign currency exchange contracts outstanding at the financial year-end are listed in the relevant Sub-Funds’ Schedule of Investments. As at 31 December 2016 and 31 December 2015, there was no cash collateral or any other security held or pledged as collateral by the Company.
The Company’s depositary is State Street Custodial Services (Ireland) Limited. All of the investments in equities and bonds and cash at bank balances of the Sub-Funds are held within the custodial network of the Depositary. Bankruptcy or insolvency of the Depositary or of its parent company, State Street Corporation, may cause the Sub-Funds’ rights with respect to its investments and cash held by the Depositary to be delayed or limited. The credit rating of State Street Corporation as of 31 December 2016 is A1 (31 December 2015: Aa1).
Pyrford Global Total Return (Sterling Fund) invested in debt securities with the following credit rating:
Rating
31 December 2016
31 December 2015
AAA 15.12% 31.15% AA+ 84.88% 68.85%
100.00% 100.00% Pyrford Global Total Return (Euro) invested in debt securities with the following credit rating:
Rating
31 December 2016
31 December 2015
AAA 87.27% 85.45% AA+ 12.73% 14.55% 100.00% 100.00%
Pyrford Global Total Return (US$) invested in debt securities with the following credit rating:
Rating
31 December 2016
31 December 2015
AAA 87.00% 88.25% AA+ 13.00% 11.75% 100.00% 100.00%

BMO INVESTMENTS (IRELAND) PLC
62
Notes to the Financial Statements for the financial year ended 31 December 2016 cont/d 6. Risks Associated with Financial Instruments co nt/d (e) Liquidity risk
The Sub-Funds’ assets generally comprise of highly liquid debt and equity securities. Liquidity is a factor that the Investment Manager considers when investing in any financial instrument. The main financial liability of the relevant Sub-Fund is the redemption of redeemable participating shares. As the Sub-Funds are open ended, the relevant Sub-Fund is required to redeem shares on request by shareholders at a price equivalent to the net asset value per share, subject to settlement and dealing restrictions laid down in the Prospectus.
The Investment Manager manages each Sub-Fund's liquidity position on a daily basis. Also the Investment Manager is able, through the provisions in the Prospectus, to defer the processing of redemptions of significant size to facilitate an orderly disposition of securities in order to protect the interest of the remaining shareholders.
The maximum number of redeemable participating shares available for redemption on any given day can be restricted by the relevant Sub-Fund to 10% of the total number of shares in issue. The Sub-Funds’ financial liabilities as at 31 December 2016 and 31 December 2015 are payable within 1 month with the exception of derivative contracts which are due to settle within 3 months. The tables below analyse each Sub-Fund’s derivative exposures that will be settled on a gross basis into relevant maturity groupings based on the remaining period at the Statement of Financial Position date to the contractual maturity date.
As at 31 December 2016 Pyrford Global Total Return (Sterling) Fund Less than Currency 3 months Inflows…………………….. GBP 193,634,057 Outflows…………………... GBP 186,283,394
Pyrford Global Total Return (Euro) Fund Less than Currency 3 months Inflows…………………….. EUR 25,622 Outflows…………………... EUR 25,864
Pyrford Global Equity (Sterling) Fund Less than Currency 3 months Inflows…………………….. GBP 156,329 Outflows…………………... GBP 154,674
Pyrford Global Equity (Euro) Fund Less than Currency 3 months Inflows…………………….. EUR 65,403 Outflows…………………... EUR 66,021
Pyrford Global Equity (US$) Fund Less than Currency 3 months Inflows…………………….. USD 67,191 Outflows…………………... USD 67,333

BMO INVESTMENTS (IRELAND) PLC
63
Notes to the Financial Statements for the financial year ended 31 December 2016 cont/d 6. Risks Associated with Financial Instruments co nt/d
(e) Liquidity risk cont/d
As at 31 December 2015
Pyrford Global Total Return (Sterling) Fund Less than Currency 3 months Inflows…………………….. GBP 37,396,956 Outflows…………………... GBP 37,743,903 Pyrford Global Total Return (Euro) Fund Less than Currency 3 months Inflows…………………….. EUR 21,825 Outflows…………………... EUR 23,358
Pyrford Global Equity (Sterling) Fund Less than Currency 3 months Inflows…………………….. GBP 61,463 Outflows…………………... GBP 62,032
Pyrford Global Equity (Euro) Fund Less than Currency 3 months Inflows…………………….. EUR 56,224 Outflows…………………... EUR 60,167

BMO INVESTMENTS (IRELAND) PLC
64
Notes to the Financial Statements for the financial year ended 31 December 2016 cont/d 6. Risks Associated with Financial Instruments co nt/d
(f) Fair valuation hierarchy
IFRS 13 ‘Fair Value Measurement’, requires the Company to classify fair value measurements using a fair value hierarchy that reflects the significance of the inputs used in making the measurements.
The fair value hierarchy is as follows:
• Level 1: quoted prices (unadjusted) in active markets for identical assets or liabilities. • Level 2: inputs other than quoted prices included in Level 1 that are observable for the asset or
liability, either directly (i.e., as prices) or indirectly (i.e., derived from prices). • Level 3: inputs for the asset or liability that are not based on observable market data (unobservable
inputs).
Investments, the values of which are based on quoted market prices in active markets, and therefore classified within level 1, include active listed equities and bonds. The Company does not adjust the quoted price for these instruments. With the exception of the tables on pages 65to 67, as at 31 December 2016 and 31 December 2015 all investments in equity securities are classified as level 1 and bonds are classified as Level 2. Forward foreign currency exchange contracts which are not traded on a market are therefore classified as level 2.
Cash and cash equivalents include deposits held with banks and other short-term investments in an active market and they are categorised as Level 2.
Receivable for investments sold and other receivables include the contractual amounts for settlement of trades and other obligations due to the Company. Payable for investments sold and other payables represent the contractual amounts and obligations due by the Company for settlement of trades and expenses. All receivable and payable balances are categorised as Level 2. The puttable value of redeemable shares is calculated based on the net difference between total assets and all other liabilities of each Sub-Fund within the Company in accordance with the Prospectus. A demand feature is attached to these shares, as they are redeemable at the holders’ option and can be put back to the Sub-Funds at any dealing date for cash equal to a proportionate share of the Sub-Fund’s net asset value attributable to the share class. The fair value is based on the amount payable on demand. As such, Level 2 is deemed to be the most appropriate categorisation for net assets attributable to holders of redeemable shares.
Transfers between levels of the fair value hierarchy are deemed to have occurred at the end of the period and are deemed to have occurred when the pricing source or methodology used to price an investment has changed which triggers a change in level as defined under IFRS 13.There were no movements of financial instruments between levels 1 and 2 during the financial year ended 31 December 2016 or prior financial year. There were no investments classified as level 3 as at 31 December 2016 or as at 31 December 2015.

BMO INVESTMENTS (IRELAND) PLC
65
Notes to the Financial Statements for the financial year ended 31 December 2016 cont/d 6. Risks Associated with Financial Instruments co nt/d
(f) Fair valuation hierarchy cont/d
Pyrford Global Total Return (Sterling) Fund 31 December 2016
Level 1
Level 2
Level 3
Total
GBP
GBP
GBP
GBP
Assets: Financial assets at fair value through profit or loss: Investments at fair value: Transferable securities 2,019,719,023 233,043,986 - 2,252,763,009
Unrealised gain on forward foreign currency exchange contracts - 8,523,676 - 8,523,676
Total assets 2,019,719,023 241,567,662 - 2,261,286,685
Liabilities:
Financial liabilities at fair value through profit or loss: Unrealised loss on forward foreign currency exchange contracts - (1,173,013) - (1,173,013)
Total liabilities - (1,173,013) - (1,173,013)
Pyrford Global Total Return (Sterling) Fund 31 December 2015
Level 1
Level 2
Level 3
Total
GBP
GBP
GBP
GBP
Assets: Financial assets at fair value through profit or loss: Investments at fair value: Transferable securities 690,236,133 1,457,854,355 - 2,148,090,488
Total assets 690,236,133 1,457,854,355 - 2,148,090,488
Liabilities:
Financial liabilities at fair value through profit or loss: Unrealised loss on forward foreign currency exchange contracts - (346,947) - (346,947)
Total liabilities - (346,947) - (346,947)

BMO INVESTMENTS (IRELAND) PLC
66
Notes to the Financial Statements for the financial year ended 31 December 2016 cont/d 6. Risks Associated with Financial Instruments co nt/d (f) Fair valuation hierarchy cont/d Pyrford Global Total Return (EUR) Fund
31 December 2016
Level 1
Level 2
Level 3
Total
EUR
EUR
EUR
EUR
Assets: Financial assets at fair value through profit or loss: Investments at fair value: Transferable securities 1,189,330 1,437,026 - 2,626,356
Total assets 1,189,330 1,437,026 - 2,626,356
Liabilities:
Financial liabilities at fair value through profit or loss: Unrealised loss on forward foreign currency exchange contracts - (242) - (242)
Total liabilities - (242) - (242)
Pyrford Global Total Return (EUR) Fund
31 December 2015
Level 1
Level 2
Level 3
Total
EUR
EUR
EUR
EUR
Assets: Financial assets at fair value through profit or loss: Investments at fair value: Transferable securities 909,724 1,672,961 - 2,582,685
Total assets 909,724 1,672,961 - 2,582,685
Liabilities:
Financial liabilities at fair value through profit or loss: Unrealised loss on forward foreign currency exchange contracts - (1,533) - (1,533)
Total liabilities - (1,533) - (1,533)
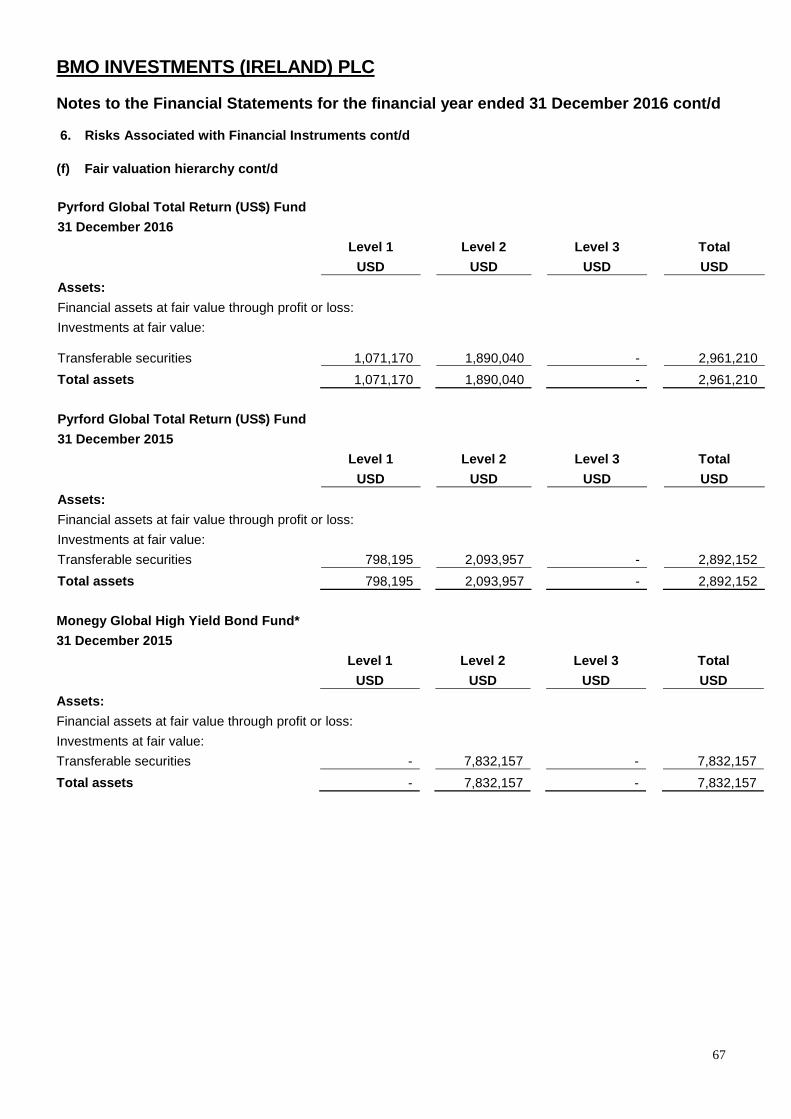
BMO INVESTMENTS (IRELAND) PLC
67
Notes to the Financial Statements for the financial year ended 31 December 2016 cont/d 6. Risks Associated with Financial Instruments co nt/d (f) Fair valuation hierarchy cont/d
Pyrford Global Total Return (US$) Fund
31 December 2016
Level 1
Level 2
Level 3
Total
USD
USD
USD
USD
Assets: Financial assets at fair value through profit or loss: Investments at fair value:
Transferable securities 1,071,170 1,890,040 -
2,961,210
Total assets 1,071,170 1,890,040 - 2,961,210
Pyrford Global Total Return (US$) Fund
31 December 2015
Level 1
Level 2
Level 3
Total
USD
USD
USD
USD
Assets: Financial assets at fair value through profit or loss: Investments at fair value: Transferable securities 798,195 2,093,957 - 2,892,152
Total assets 798,195 2,093,957 - 2,892,152
Monegy Global High Yield Bond Fund*
31 December 2015
Level 1
Level 2
Level 3
Total
USD
USD
USD
USD
Assets: Financial assets at fair value through profit or loss: Investments at fair value: Transferable securities - 7,832,157 - 7,832,157
Total assets - 7,832,157 - 7,832,157

BMO INVESTMENTS (IRELAND) PLC
68
Notes to the Financial Statements for the financial year ended 31 December 2016 cont/d 6. Risks Associated with Financial Instruments co nt/d (g) Leverage Risk
It is not the intention of the Company that the Sub-Funds be leveraged for investment or efficient portfolio management purposes. Any leverage resulting from the use of financial derivative instruments and efficient portfolio management techniques are in accordance with the requirements of the Central Bank and will not exceed 100% of the net asset value of the Sub-Fund.
(h) Concentration Risk
Concentrations of risk are disclosed in some detail in the Schedules of Investments of each Sub-Fund.
(i) Legal and Regulatory Risk
Legal and regulatory changes could occur during the duration of the Company which may adversely affect the Company.
(j) Risks associated with the UK leaving the Euro pean Union On 23 June 2016, the UK voted in a referendum to leave the European Union. The political, economic and legal consequences of the referendum vote are not yet known and the mechanics of the UK leaving the European Union are unclear. In the short term, it is likely there will be volatility in the financial markets, particularly those in the UK and Europe but possibly also in the United States and Asia. The UK may be less stable than it has been in recent years and investments in the UK may be difficult to value, to assess for suitability or risk, harder to buy or sell or subject to greater or more frequent rises and falls in value. Changes in currency exchange rates may make it more expensive for a Fund to buy investments that are not denominated in Sterling. Funds may see higher levels of redemption. In the event that the Investment Manager is unable to accurately value the assets of a Fund, or in the event of high levels of redemption, the Investment Manager may use certain liquidity management tools permitted by the Central Bank, including deferred redemptions, the implementation of fair value pricing or temporarily suspension of a Fund. In the longer term, there is likely to be a period of significant political, regulatory and commercial uncertainty as the UK seeks to negotiate its exit from the European Union. The UK’s laws and regulations concerning funds may in the future diverge from those of the European Union. Depending on the terms of the agreement reached with the European Union, it may or may not be possible for Irish funds to be sold to investors in the UK in the future.
7. Deposits with credit institutions
All deposits are held by State Street Bank and Trust Company, a bank rated Aa1 by Moody’s Investor Services as of 31 December 2016 (31 December 2015: Aa2)
8. Offsetting and Master Netting Agreements
The Company’s financial assets and liabilities are not subject to offsetting, enforceable master netting arrangements and similar agreements.

BMO INVESTMENTS (IRELAND) PLC
69
Notes to the Financial Statements for the financial year ended 31 December 2016 cont/d
9. Related Party Transactions Transactions with entities with significant infl uence
Pyrford International Ltd is the investment manager of the Company. Investment management fees incurred by the Company during the financial year ended 31 December 2016 amounted to USD 29,511,510 (financial year ended 31 December 2015: USD 34,423,523). Investment management fees payable by the Company at the financial year-end were USD 2,234,303 (as at 31 December 2015: USD 5,585,124). Investment management fees reimbursed to the Company during the financial year ended 31 December 2016 amounted to USD 556,228 (financial year ended 31 December 2015: USD 530,739) of which USD 94,249 remains outstanding at financial year end (2015: USD 161,341). As at 31 December 2016, the Investment Manager held: 71.51% of the Class A US$ Accumulating shares in the Pyrford Shariah Global Equity Fund, 12.78% of Class A Stg£ Distributing shares of the Pyrford Global Equity (US$) Fund, 93.79% of Class A Euro Accumulating shares of the Pyrford Global Total Return (Euro) Fund, 94.18% Class A Euro Accumulating shares Pyrford Global Equity (Sterling) Fund and all of the Class A US$ Accumulating shares of the BMO Global Low Volatility Alpha Equity Fund, Class A US$ Accumulating shares of the Pyrford Asia Pacific ex- Japan Equity Fund, Class A US$ Accumulating shares of the Pyrford Global Total Return (US$) Fund, Class A Euro Accumulating shares of the Pyrford Global Equity (Euro) Fund. As at 31 December 2015, the Investment Manager held: 71.51% of the Class A US$ Accumulating shares in the Pyrford Shariah Global Equity Fund, 17.88% of Class A Stg£ Distributing shares of the Pyrford Global Equity (US$) Fund, 93.74% of Class A Euro Accumulating shares of the Pyrford Global Total Return (Euro) Fund and all of the Class A US$ Accumulating shares of the BMO Global Low Volatility Alpha Equity Fund, Class A US$ Accumulating shares of the Pyrford Asia Pacific ex- Japan Equity Fund, Class A US$ Accumulating shares of the Pyrford Global Total Return (US$) Fund, Class A Stg£ Accumulating shares of the Pyrford Global Equity (Euro) Fund, Class A Euro Accumulating shares of the Pyrford Global Equity (Sterling) Fund, Class A Stg£ Accumulating shares Pyrford Global Equity (Euro) Fund and Class A Euro Accumulating shares Pyrford Global Equity (Sterling) Fund. Transactions with key management personnel
Drew Newman, a director of the Company, is also a director of the Investment Manager and also holds shares in the Pyrford Global Total Return (Sterling) Fund. With effect from 1 April 2016, Anthony Cousins resigned as a director of the Company. Mr. Cousins is also a director of the Investment Manager. Barry McInerney, a director of the Company until his resignation on 9 August 2016 was also a director of the Investment Manager and BMO Asset Management Corp. and Monegy, Inc., both of which act as Sub-Investment Manager’s to the Company. Lars Nielsen, a director of the Company, is a director of the Investment Manager and also holds shares in Pyrford Global Total Return (Sterling) Fund and Pyrford Global Equity (Sterling) Fund, each sub-funds of the Company. Hugh Moir, a director of the Company, is also a director of affiliated BMO entities. Directors who are also employees of the Investment Manager are not entitled to directors’ fees.
Transactions with Directors Directors’ fees and out-of-pocket expenses paid by the Company during the financial years ended 31 December 2016 and 31 December 2015 are detailed in note 5.

BMO INVESTMENTS (IRELAND) PLC
70
Notes to the Financial Statements for the financial year ended 31 December 2016 cont/d
10. Efficient Portfolio Management The Company may, on behalf of each Sub-Fund, engage in techniques and instruments such as in financial derivative instruments, repurchase/reverse repurchase and stock lending agreements and when issued/delayed delivery securities for the purposes of efficient portfolio management including as part of a cash management strategy and reduction of risk or cost or the generation of additional capital or income for each Sub-Fund with an appropriate level of risk, taking into account the risk profile of each Sub-Fund and the general provisions of the UCITS Directive. Such transactions may include foreign exchange transactions which alter the currency characteristics of transferable securities held by each Sub-Fund.
11. Distributions
The following distributions were declared by the Sub-Funds during the financial years ended 31 December 2016 and 31 December 2015.
Pyrford Global Total Return (Sterling) Fund
Value
Per Share Ex-date
GBP GBP
Class A Distributing Shares 794,689 0.14 29 January 2016 Class C Distributing Shares 64,242 0.14 29 January 2016
Pyrford Global Total Return (Sterling) Fund
Value
Per Share Ex-date
GBP GBP
Class B Accumulating Shares 1,478,386 0.34 30 January 2015
No other distributions were declared in respect of the accumulating or distributing class of shares during the financial year ended 31 December 2016 or financial year ended 31 December 2015.
12. Significant events during the financial year A revised prospectus was noted by the Central Bank on 27 January 2016 which included the following: - change in the deadline for receipt of subscription and redemption requests; - change in the time at which the net asset value is determined;
- inclusion of disclosure with respect to applications being made through clearing systems. Effective 1 April 2016, the following Directors resigned as directors of the Company: Anthony Cousins, Paul McNaughton and Diane Seymour-Williams. Effective the same date, the following appointments were made as directors of the Company: Liam Miley, Hugh Moir and Lars Nielsen.
The European Union (Undertakings for collective Investment and Transferable Securities) (Amendment) Regulations 2016 (“UCITS V”) became effective on 18 March 2016. A revised Depositary Agreement was entered into on 7 October 2016 to inter alia, reflect the Depositary’s responsibilities under UCITS V regulations. Class B Stg£ Distributing of the Pyrford Global Return (Sterling) Fund launched on 26 April 2016. Class D Stg£ Distributing of the Pyrford Global Return (Sterling) Fund launched on 16 June 2016. At the annual general meeting of the Company held on 8 August 2016 it was resolved to amend the Company’s memorandum of association and articles of association to reflect legislative changes arising from the implementation of the provisions of the Companies Act 2014 and also to reflect other amendments detailed in the letter to shareholders accompanying the AGM materials. Effective 9 August 2016, Barry McInerney resigned as director of the Company. Monegy Global High Yield Bond Fund was fully redeemed on 30 November 2016. There were no other significant events affecting the Company during the financial year.

BMO INVESTMENTS (IRELAND) PLC
71
Notes to the Financial Statements for the financial year ended 31 December 2016 cont/d
13. Significant events since the financial year en d
Class A US$ Accumulating of the Pyrford Global Total Return (US$) Fund fully redeemed on 19th January 2017. Hugh Moir resigned as a director of the Company with effect from 3 April 2017, and Stuart Woodyatt was appointed as a director of the Company with effect from 3 April 2017. Class D Stg£ Accumulating of the Pyrford Global Total Return (Sterling) Fund launched on 3 April 2017. There were no other significant events since the financial year end.
14. Comparative Figures
The comparative figures are for the financial period from 1 January 2015 to 31 December 2015.
15. Approval of the financial statements
The audited financial statements were approved by the Board on 25 April 2017.

BMO GLOBAL LOW VOLATILITY ALPHA EQUITY FUND Schedule of Investments as at 31 December 2016
72
Shares Fair Value
USD Fund %
Transferable Securities (98.35%) (2015: 98.53%)
Equities (98.35%) (2015: 98.53%)
400 Flughafen Wien AG 10,159 0.62 _____________________ _________________________
_____________________ _________________________
10,159 0.62 _____________________ _________________________
219 bpost SA 5,200 0.32 _____________________ _________________________
800 VTech Holdings Limited 10,698 0.65 _____________________ _________________________
Insurance (3.13%) (2015: 2.23%) 108 Argo Group International Holdings Limited 7,144 0.43 52 Enstar Group Limited 10,309 0.63 157 Everest Re Group Limited 33,931 2.07 _____________________ _________________________
51,384 3.13 _____________________ _________________________
Retail (0.19%) (2015: 0.18%) 6,000 Giordano International Limited 3,242 0.19 _____________________ _________________________
65,324 3.97 _____________________ _________________________
Banks (0.57%) (2015: 0.66%) 218 Laurentian Bank of Canada 9,375 0.57 _____________________ _________________________
448 BCE Inc 19,399 1.18 _____________________ _________________________
Electric Utilities Nil (2015: 0.18%)
56 George Weston Limited 4,740 0.29 258 Loblaw Cos Limited 13,644 0.83 99 Metro Inc 2,957 0.18 _____________________ _________________________
21,341 1.30 _____________________ _________________________
779 First Capital Realty Inc 11,940 0.73 _____________________ _________________________
1,028 Pure Industrial Real Estate Trust 4,257 0.26 _____________________ _________________________
_____________________ _________________________
66,312 4.04 _____________________ _________________________
657 CEZ 10,990 0.67 _____________________ _________________________
Austria (0.62%) (2015: 0.95%) Engineering & Construction (0.62%) (2015: 0.61%)
Transportation Nil (2015: 0.34%)
Belgium (0.32%) (2015: 0.96%) Insurance Nil (2015: 0.26%) Transportation (0.32%) (2015: 0.70%)
Bermuda (3.97%) (2015: 2.79%) Agriculture Nil (2015: 0.38%) Diversified Telecommunications (0.65%) (2015: Nil)
Canada (4.04%) (2015: 7.21%)
Diversified Telecommunications (1.18%) (2015: 1.11% )
Food products (1.30%) (2015: 2.44%)
Health Care Providers & Services Nil (2015: 0.10%)
Media Nil (2015: 0.11%) Real Estate (0.73%) (2015: 0.62%)
Real Estate Investment Trusts (0.26%) (2015: 0.18%)
Retail Nil (2015: 1.81%)
Czech Republic (0.67%) (2015: 1.36%) Electric Utilities (0.67%) (2015: 1.36%)

BMO GLOBAL LOW VOLATILITY ALPHA EQUITY FUND Schedule of Investments as at 31 December 2016 cont /d
73
Shares Fair Value
USD
Fund %
Transferable Securities (98.35%) (2015: 98.53%) co nt/d
Equities (98.35%) (2015: 98.53%) cont/d
131 DFDS 5,984 0.36 _____________________ _________________________
36 Boiron SA 3,212 0.19 _____________________ _________________________
352 Rhoen-Klinikum AG 9,538 0.58 _____________________ _________________________
_____________________ _________________________
9,538 0.58 _____________________ _________________________
2,000 China Unicom Hong Kong Limited 2,329 0.14 29,000 PCCW Limited 15,707 0.96 _____________________ _________________________
18,036 1.10 _____________________ _________________________
3,500 CLP Holdings Limited 32,159 1.96
29,000 HK Electric Investments & HK Electric Investments Limited 23,934 1.45
_____________________ _________________________
56,093 3.41 _____________________ _________________________
600 Dairy Farm International Holdings Limited 4,314 0.26 _____________________ _________________________
12,000 Yuexiu Real Estate Investment Trust 6,329 0.39 _____________________ _________________________
84,772 5.16 _____________________ _________________________
3,803 Magyar Telekom Telecommunications Plc 6,456 0.39 _____________________ _________________________
168 Richter Gedeon Nyrt 3,545 0.22 _____________________ _________________________
10,001 0.61 _____________________ _________________________
41 ICON Plc 3,078 0.19 _____________________ _________________________
115 Elbit Systems Limited 11,677 0.71 _____________________ _________________________
1,809 Bank Hapoalim BM 10,790 0.65
Denmark (0.36%) (2015: 0.30%) Retail Nil (2015: 0.30%) Transportation (0.36%) (2015: Nil)
France (0.19%) (2015: 0.19%) Pharmaceuticals (0.19%)
Germany (0.58%) (2015: 3.44%) Health Care Providers & Services (0.58%) (2015: 2.8 7%)
Toys Nil (2015: 0.57%)
Hong Kong (5.16%) (2015: 4.39%) Diversified Telecommunications (1.10%) (2015: 0.68% )
Electric Utilities (3.41%) (2015: 3.43%)
Food Products (0.26%) (2015: Nil)
Real Estate Investment Trust (0.39%) (2015: 0.28%)
Hungary (0.61%) (0.41%) Diversified Telecommunications (0.39%) (2015: 0.20% )
Pharmaceuticals (0.22%) (2015: 0.21%)
Ireland (0.19%) (2015: 0.21%) Health Care Providers & Services (0.19%) (2015: 0.2 1%)
Israel (4.48%) (2015: 4.46%) Aerospace & Defense (0.71%) (2015: 0.65%)
Banks (2.47%) (2015: 2.22%)

BMO GLOBAL LOW VOLATILITY ALPHA EQUITY FUND Schedule of Investments as at 31 December 2016 cont /d
74
Shares Fair Value
USD Fund %
Transferable Securities (98.35%) (2015: 98.53%) co nt/d
Equities (98.35%) (2015: 98.53%) cont/d
7,243 Bank Leumi Le-Israel BM 29,907 1.82 _____________________ _________________________
40,697 2.47 _____________________ _________________________
11,193 Bezeq The Israeli Telecommunication Corporation Limited 21,331 1.30
_____________________ _________________________
73,705 4.48 _____________________ _________________________
200 Recordati SpA 5,690 0.35 _____________________ _________________________
1,032 Amplifon SpA 9,857 0.60 _____________________ _________________________
15,547 0.95 _____________________ _________________________
300 Benesse Holdings Inc 8,260 0.50 600 Duskin Co Limited 12,329 0.75 _____________________ _________________________
20,589 1.25 _____________________ _________________________
200 Noevir Holdings Co Limited 6,259 0.38 _____________________ _________________________
400 Nippon Telegraph & Telephone Corporation 16,801 1.02 _____________________ _________________________
200 Mitsui Sugar Co Limited 4,288 0.26 1,000 Morinaga Milk Industry Co Limited 7,200 0.44 2,000 Nisshin Oillio Group Limited 9,201 0.56 _____________________ _________________________
20,689 1.26 _____________________ _________________________
100 Hogy Medical Limited 6,165 0.38 _____________________ _________________________
100 Kissei Pharmaceutical Co Limited 2,491 0.15 600 KYORIN Holdings Inc 12,863 0.78 300 Tsumura & Co 8,260 0.50 400 Vital KSK Holdings Inc 3,386 0.21 _____________________ _________________________
27,000 1.64 _____________________ _________________________
97,503 5.93 _____________________ _________________________
5,600 Public Bank BHD 24,617 1.50 _____________________ _________________________
Israel (4.48%) (2015: 4.46%) cont/d Banks (2.47%) (2015: 2.22%) cont/d
Diversified Telecommunications (1.30%) (2015: 1.59% )
Italy (0.95%) (2015: 1.66%) Electric Utilities Nil (2015: 0.37%) Internet Nil (2015: 0.71%) Pharmaceuticals (0.35%) (2015: Nil)
Retail (0.60%) (2015: 0.58%)
Japan (5.93%) (2015: 5.04%) Commercial Services (1.25%) (2015: 1.27%)
Cosmetics & Personal Care (0.38%) (2015: 0.99%)
Diversified Telecommunications (1.02%) (2015: 1.03% )
Food Products (1.26%) (2015: 1.75%)
Healthcare Products (0.38%) (2015: Nil)
Pharmaceuticals (1.64%) (2015: Nil)
Malaysia (2.86%) (2015: 1.66%) Banks (1.50%) (2015: 1.14%)

BMO GLOBAL LOW VOLATILITY ALPHA EQUITY FUND Schedule of Investments as at 31 December 2016 cont /d
75
7,200 Tenaga Nasional BHD 22,310 1.36 _____________________ _________________________
46,927 2.86 _____________________ _________________________
65 Sligro Food Group NV 2,270 0.14 _____________________ _________________________
1,415 Chorus Limited 3,912 0.24 _____________________ _________________________
3,155 Infratil Limited 6,041 0.37 _____________________ _________________________
1,449 Metlifecare Limited 5,600 0.34 1,658 Ryman Healthcare Limited 9,363 0.57 2,197 Summerset Group Holdings Limited 7,159 0.44 _____________________ _________________________
22,122 1.35 _____________________ _________________________
1,491 Fisher & Paykel Healthcare Corporation Limited 8,845 0.54 _____________________ _________________________
7,152 Argosy Property Limited 5,030 0.30 _____________________ _________________________
45,950 2.80 _____________________ _________________________
7,000 China Minsheng Banking Corporation Limited 7,484 0.45 8,000 Industrial & Commercial Bank of China Limited 4,797 0.29 _____________________ _________________________
12,281 0.74 _____________________ _________________________
6,000 China Telecom Corporation Limited 2,770 0.17 _____________________ _________________________
3,000 Uni-President China Holdings Limited 2,116 0.13 _____________________ _________________________
17,167 1.04 _____________________ _________________________
2,420 First Philippine Holdings Corporation 3,305 0.20
Shares Fair Value
USD Fund %
Transferable Securities (98.35%) (2015: 98.53%) co nt/d
Equities (98.35%) (2015: 98.53%) cont/d Malaysia (2.86%) (2015: 1.66%) cont/d Electric Utilities (1.36%) (2015: 0.52%)
Netherlands (0.14%) (2015: 0.15%) Food Products (0.14%) (2015: 0.15%)
New Zealand (2.80%) (2015: 7.16%) Airlines Nil (2015: 0.47%) Diversified Telecommunications (0.24%) (2015: 0.24% )
Electric Utilities (0.37%) (2015: 1.63%)
Health Care Providers & Services (1.35%) (2015: 1.2 6%)
Healthcare Products (0.54%) (2015: 2.91%)
Oil & Gas Nil (2015: 0.29%) Real Estate (0.30%) (2015: 0.36%)
People's Republic of China (1.04%) (2015: Nil) Banks (0.74%) (2015: Nil)
Diversified Telecommunications (0.17%) (2015: Nil)
Food products (0.13%) (2015: Nil)
Philippines (0.95%) (2015: 1.71%) Diversified Telecommunications Nil (2015: 0.48%) Electric Utilities (0.95%) (2015: 1.23%)

BMO GLOBAL LOW VOLATILITY ALPHA EQUITY FUND Schedule of Investments as at 31 December 2016 cont /d
76
Shares Fair Value
USD Fund %
Transferable Securities (98.35%) (2015: 98.53%) co nt/d
Equities (98.35%) (2015: 98.53%) cont/d
2,310 Manila Electric Co 12,314 0.75 _____________________ _________________________
15,619 0.95 _____________________ _________________________
329 Asseco Poland SA 4,279 0.26 _____________________ _________________________
220 Kia Motors Corporation 7,149 0.43 _____________________ _________________________
32 GS Home Shopping Inc 4,557 0.28 _____________________ _________________________
11,706 0.71 _____________________ _________________________
1,000 Singapore Airlines Limited 6,692 0.41 _____________________ _________________________
5,800 StarHub Limited 11,280 0.69 _____________________ _________________________
2,000 Venture Corporation Limited 13,676 0.83 _____________________ _________________________
4,600 SATS Limited 15,441 0.94 _____________________ _________________________
7,200 Raffles Medical Group Limited 7,126 0.43 _____________________ _________________________
8,100 Religare Health Trust 5,129 0.31 _____________________ _________________________
3,300 Ascott Residence Trust 2,581 0.16 6,900 Cache Logistics Trust 3,868 0.23 3,000 CDL Hospitality Trusts 2,782 0.17 6,800 Frasers Centrepoint Trust 8,942 0.54 2,700 Mapletree Industrial Trust 3,074 0.19 17,600 Mapletree Logistics Trust 12,424 0.76 _____________________ _________________________
33,671 2.05 _____________________ _________________________
Philippines (0.95%) (2015: 1.71%) cont/d Electric Utilities (0.95%) (2015: 1.23%) cont/d
Poland (0.26%) (2015: Nil) Computers & Peripherals (0.26%) (2015: Nil)
Portugal Nil (2015: 0.21%) Electric Utilities Nil (2015:0.21%) Republic of South Korea (0.71%) (2015: 1.15%) Auto Manufacturers (0.43%) (2015: 0.86%)
Retail (0.28%) (2015: 0.29%)
Singapore (5.90%) (2015: 7.96%) Airlines (0.41%) (2015: 0.51%)
Commercial Services Nil (2015: 0.34%) Diversified Telecommunications (0.69%) (2015: 1.72%)
Electronics (0.83%) (2015: 0.74%)
Engineering & Construction (0.94%) (2015: 0.80%)
Health Care Providers & Services (0.43%) (2015: 0.4 5%)
Real Estate (0.31%) (2015: 0.37%)
Real Estate Investment Trusts (2.05%) (2015: 1.91%)

BMO GLOBAL LOW VOLATILITY ALPHA EQUITY FUND Schedule of Investments as at 31 December 2016 cont /d
77
Shares Fair Value
USD Fund %
Transferable Securities (98.35%) (2015: 98.53%) co nt/d
Equities (98.35%) (2015: 98.53%) cont/d
6,000 Sheng Siong Group Limited 3,924 0.24
_____________________ _________________________
96,939 5.90 _____________________ _________________________
228 Cembra Money Bank AG 16,608 1.01 _____________________ _________________________
61 ALSO Holding AG 5,384 0.33 _____________________ _________________________
53 Bachem Holding AG 4,728 0.29 58 Sonova Holding AG 7,031 0.43 _____________________ _________________________
11,759 0.72 _____________________ _________________________
223 Novartis AG 16,244 0.99 11 Roche Holding AG 2,512 0.15 _____________________ _________________________
18,756 1.14 _____________________ _________________________
7 Intershop Holding AG 3,445 0.21 _____________________ _________________________
35 Valora Holding AG 9,911 0.60 _____________________ _________________________
65,863 4.01 _____________________ _________________________
19,472 Taichung Commercial Bank Co Limited 5,546 0.34 _____________________ _________________________
2,030 Taiwan Secom Co Limited 5,581 0.34
10,000 Chunghwa Telecom Co Limited 31,493 1.92 11,000 Far EasTone Telecommunications Co Limited 24,745 1.50 _____________________ _________________________
56,238 3.42 _____________________ _________________________
67,365 4.10 _____________________ _________________________
29,500 Thai Beverage 17,354 1.06 _____________________ _________________________
_____________________ _________________________
17,354 1.06 _____________________ _________________________
Singapore (5.90%) (2015: 7.96%) cont/d Retail (0.24%) (2015: 0.23%)
Transportation Nil (2015: 0.89%)
Switzerland (4.01%) (2015: 1.62%) Banks (1.01%) (2015: Nil)
Distribution & Wholesale (0.33%) (2015: Nil)
Health Care Providers & Services (0.72%) (2015: Nil )
Pharmaceuticals (1.14%) (2015: 1.44%)
Real Estate (0.21%) (2015: 0.18%)
Retail (0.60%) (2015: Nil)
Taiwan (4.10%) (2015: 3.48%) Banks (0.34%) (2015: 0.35%)
Commercial Services (0.34%) (2015: 0.39%)
_____________________ _________________________
Diversified Telecommunications (3.42%) (2015: 2. 74%)
Thailand (1.06%) (2015: 1.29%) Beverages (1.06%) (2015: 0.63%)
Diversified Telecommunications Nil (2015: 0.66%)

BMO GLOBAL LOW VOLATILITY ALPHA EQUITY FUND Schedule of Investments as at 31 December 2016 cont /d
78
Shares Fair Value
USD Fund %
Transferable Securities (98.35%) (2015: 98.53%) co nt/d
Equities (98.35%) (2015: 98.53%) cont/d
108 Spirit AeroSystems Holdings Inc 6,330 0.39 _____________________ _________________________
158 Bryn Mawr Bank Corporation 6,636 0.40 214 TCF Financial Corporation 4,186 0.25 137 United Community Banks Inc 4,043 0.25 _____________________ _________________________
14,865 0.90 _____________________ _________________________
371 Dr Pepper Snapple Group Inc 33,746 2.05 228 PepsiCo Inc 23,938 1.46 _____________________ _________________________
57,684 3.51 _____________________ _________________________
110 Cintas Corporation 12,795 0.78 87 Forrester Research Inc 3,754 0.23 _____________________ _________________________
16,549 1.01 _____________________ _________________________
466 Amdocs Limited 27,172 1.65 _____________________ _________________________
32 Carter's Inc 2,819 0.17 _____________________ _________________________
66 American Express Co 4,879 0.30 449 Discover Financial Services 32,260 1.96 _____________________ _________________________
37,139 2.26 _____________________ _________________________
289 AT&T Inc 12,329 0.75 663 Verizon Communications Inc 35,629 2.17 _____________________ _________________________
47,958 2.92 _____________________ _________________________
95 Allete Inc 6,110 0.37 101 Avista Corporation 4,058 0.25 401 Consolidated Edison Inc 29,702 1.81 101 Edison International 7,300 0.44 71 Indacorp Inc 5,735 0.35
United Kingdom Nil (2015: 5.83%) Commercial Services Nil (2015:0.71%) Food Products Nil (2015: 1.55%) Pharmaceuticals Nil (2015: 0.74%) Real Estate Investment Trusts Nil (2015: 0.33%) Retail Nil (2015: 1.81%) Software Nil (2015: 0.69%) United States (46.45%) (2015: 32.94%) Aerospace & Defense (0.39%) (2015: Nil)
Banks (0.90%) (2015: Nil)
Beverages (3.51%) (2015: 4.38%)
Commercial Services (1.01%) (2015: 1.97%)
Computers & Peripherals (1.65%) (2015: 1.64%)
Consumer Durables & Apparels (0.17%) (2015: 0.18%)
Diversified Financial Services (2.26%) (2015: Nil)
Diversified Telecommunications (2.92%) (2015: 1.83%)
Electric Utilities (4.93%) (2015: 4.02%)

BMO GLOBAL LOW VOLATILITY ALPHA EQUITY FUND Schedule of Investments as at 31 December 2016 cont /d
79
Shares Fair Value
USD Fund %
Transferable Securities (98.35%) (2015: 98.53%) co nt/d
Equities (98.35%) (2015: 98.53%) cont/d
44 Pinnacle West Capital Corporation 3,443 0.21 567 Portland General Electric Co 24,665 1.50 _____________________ _________________________
81,013 4.93 _____________________ _________________________
281 Fresh Del Monte Produce Inc 17,099 1.04 316 General Mills Inc 19,706 1.20 334 Kroger Co 11,553 0.70 540 Sysco Corporation 30,197 1.84 233 Tyson Foods Inc 14,481 0.88 _____________________ _________________________
93,036 5.66 _____________________ _________________________
196 Chemed Corporation 31,466 1.91 115 US Physical Therapy Inc 8,148 0.50 36 WellCare Health Plans Inc 4,935 0.30 _____________________ _________________________
44,549 2.71 _____________________ _________________________
183 Abaxis Inc 9,669 0.59 15 Atrion Corporation 7,621 0.46 49 ICU Medical Inc 7,110 0.43 200 Quidel Corporation 4,220 0.26 _____________________ _________________________
28,620 1.74 _____________________ _________________________
220 Allstate Corporation 16,342 0.99 92 Navigators Group Inc 10,874 0.66 128 Safety Insurance Group Inc 9,453 0.58 146 Unum Group 6,396 0.39 _____________________ _________________________
43,065 2.62 _____________________ _________________________
250 Kaiser Aluminum Corporation 19,747 1.20 _____________________ _________________________
467 Wal-Mart Stores Inc 32,344 1.97 _____________________ _________________________
281 Johnson & Johnson 32,453 1.97 39 McKesson Corporation 5,529 0.34 523 Merck & Co Inc 30,878 1.88 769 Owens & Minor Inc 27,369 1.67 978 Pfizer Inc 31,775 1.93 _____________________ _________________________
128,004 7.79 _____________________ _________________________
143 Equity Commonwealth 4,310 0.26
United States (46.45%) (2015: 32.94%) cont/d Electric Utilities (4.93%) (2015: 4.02%) cont/d
Food Products (5.66%) (2015: 1.66%)
Health Care Providers & Services (2.71%) (2015: 1.5 0%)
Healthcare Products (1.74%) (2015: 1.45%)
Household Products Nil (2015: 0.27%) Insurance (2.62%) (2015: 0.75%)
Mining (1.20%) (2015: 1.51%)
Multiline Retail (1.97%) (2015: 1.29%)
Pharmaceuticals (7.79%) (2015: 8.93%)
Real Estate Investment Trusts (0.86%) (2015: Nil)

BMO GLOBAL LOW VOLATILITY ALPHA EQUITY FUND Schedule of Investments as at 31 December 2016 cont /d
80
Shares Fair Value
USD Fund %
Transferable Securities (98.35%) (2015: 98.53%) co nt/d
Equities (98.35%) (2015: 98.53%) cont/d
389 Getty Realty Corporation 9,741 0.60 _____________________ _________________________
14,051 0.86 _____________________ _________________________
98 Buckle Inc 2,230 0.14 98 Children's Place Inc 9,888 0.60 157 Darden Restaurants Inc 11,583 0.71 68 Foot Locker Inc 4,821 0.29 _____________________ _________________________
28,522 1.74 _____________________ _________________________
1,488 Meridian BanCorporation Inc 28,346 1.73 _____________________ _________________________
40 Huntington Ingalls Industries Inc 7,386 0.45 _____________________ _________________________
96 Bed Bath & Beyond Inc 3,924 0.24 _____________________ _________________________
763,123 46.45 _____________________ _________________________
Total Equities 1,615,887 98.35 _____________________ _________________________
Portfolio of Investments 1,615,887 98.35 Other Net Assets 27,056 1.65 _____________________ _________________________
Net Assets 1,642,943 100.00 _____________________ _________________________
Total assets comprised as follows:
% oftotal
assetsTransferable securities admitted to an official stock exchange listing 95.39 Deposits with credit institutions 2.70 Other current assets 1.91 100.00
United States (46.45%) (2015: 32.94%) cont/d Real Estate Investment Trusts (0.86%) (2015: Nil) c ont/d
Retail (1.74%) (2015: 0.21%)
Savings & Loans (1.73%) (2015: 1.35%)
Shipping (0.45%) (2015: Nil)
Specialty retail (0.24%) (2015: Nil)

PYRFORD ASIA PACIFIC EX-JAPAN EQUITY FUND Schedule of Investments as at 31 December 2016
81
Shares Fair Value
USD Fund %
Transferable Securities (98.92%) (2015: 98.86%)
Equities (98.92%) (2015: 98.86%)
7,294 Brambles Limited 65,347 5.38 5,946 Computershare Limited 53,528 4.41 1,693 Newcrest Mining Limited 24,770 2.04 3,796 QBE Insurance Group Limited 34,063 2.80 681 Rio Tinto Limited 29,472 2.43 4,540 Telstra Corporation Limited 16,729 1.38 2,488 Woodside Petroleum Limited 56,012 4.61 3,257 Woolworths Limited 56,712 4.67 _____________________ _________________________
336,633 27.72 _____________________ _________________________
4,500 VTech Holdings Limited 60,178 4.96 _____________________ _________________________
6,400 ASM Pacific Technology Limited 67,800 5.59 19,000 Haitian International Holdings Limited 37,292 3.07 _____________________ _________________________
105,092 8.66 _____________________ _________________________
7,000 China Mobile Limited 74,202 6.11 40,000 Cnooc Limited 50,035 4.12 2,300 Hang Seng Bank Limited 42,799 3.52 6,000 Power Assets Holdings Limited 52,885 4.36 _____________________ _________________________
219,921 18.11 _____________________ _________________________
13,000 Bank Rakyat Indonesia Persero Tbk PT 11,266 0.93 22,900 Semen Indonesia Persero Tbk PT 15,595 1.28 _____________________ _________________________
26,861 2.21 _____________________ _________________________
1,917 Huchems Fine Chemical Corporation 34,442 2.84 393 KEPCO Plant Service & Engineering Co Limited 17,636 1.45 382 Woongjin Coway Co Limited 27,927 2.30 _____________________ _________________________
80,005 6.59 _____________________ _________________________
26,448 Axiata Group BHD 27,827 2.29 9,700 Magnum BHD 4,692 0.39 13,692 Malayan Banking BHD 25,028 2.06 _____________________ _________________________
57,547 4.74 _____________________ _________________________
10,000 Comfortdelgro Corporation Limited 17,094 1.41 8,216 SembCorp Industries Limited 16,206 1.33 17,000 Singapore Technologies Engineering Limited 38,003 3.13 2,000 United Overseas Bank Limited 28,237 2.32
Australia (27.72%) (2015: 26.38%)
Bermuda (4.96%) (2015: 4.76%)
Cayman Islands (8.66%) (2015: 8.77%)
Hong Kong (18.11%) (2015: 18.41%)
Indonesia (2.21%) (2015: 2.34%)
Korea, Republic of (6.59%) (2015: 6.30%)
Malaysia (4.74%) (2015: 7.09%)
Singapore (9.32%) (2015: 9.88%)

PYRFORD ASIA PACIFIC EX-JAPAN EQUITY FUND Schedule of Investments as at 31 December 2015 cont /d
82
Shares Fair Value
USD Fund %
Transferable Securities (98.92%) (2015: 98.86%) co nt/d
Equities (98.92%) (2015: 98.86%) cont/d
2,000 Venture Corporation Limited 13,676 1.13 _____________________ _________________________
113,216 9.32 _____________________ _________________________
4,696 Advantech Co Limited 37,083 3.05 12,000 Chunghwa Telecom Co Limited 37,792 3.11 8,000 Mediatek Inc 53,740 4.43 5,000 Merida Industry Co Limited 22,340 1.84 9,000 Taiwan Semiconductor Manufacturing Co Limited 50,684 4.18 _____________________ _________________________
201,639 16.61 _____________________ _________________________
Total Equities 1,201,092 98.92 _____________________ _________________________
Total Transferable Securities 1,201,092 98.92 _____________________ _________________________
Portfolio of Investments 1,201,092 98.92Other Net Assets 13,164 1.08 _____________________ _________________________
Net Assets 1,214,256 100.00 _____________________ _________________________
Total assets comprised as follows:
% oftotal
assetsTransferable securities admitted to an official stock exchange listing 95.40Deposits with credit institutions 4.50Other current assets 0.10 100.00
Singapore (9.32%) (2015: 9.88%) cont/d
Taiwan (16.61%) (2015: 14.93%)

PYRFORD GLOBAL TOTAL RETURN (STERLING) FUND Schedule of Investments as at 31 December 2016
83
Shares Fair Value
GBP Fund %
Transferable Securities (94.72%) (2015: 97.35%)
Equities (29.93%) (2015: 31.28%)
1,320,308 Brambles Limited 9,615,217 0.40 739,838 Computershare Limited 5,413,983 0.23 571,974 Woodside Petroleum Limited 10,467,330 0.44 383,194 Woolworths Limited 5,423,728 0.23 _____________________ _________________________
30,920,258 1.30 _____________________ _________________________
1,303,500 VTech Holdings Limited 14,169,597 0.60 _____________________ _________________________
124,684 Canadian National Railway Co 6,908,799 0.29 175,085 Imperial Oil Limited 4,983,872 0.21 295,461 Metro Inc 7,173,286 0.30 119,911 Saputo Inc 3,438,641 0.15 _____________________ _________________________
22,504,598 0.95 _____________________ _________________________
1,781,237 ASM Pacific Technology Limited 15,338,997 0.65 _____________________ _________________________
59,437 Air Liquide SA 5,326,543 0.22 79,521 Sanofi SA 5,198,725 0.22 96,493 Total SA* 4,005,210 0.17 _____________________ _________________________
14,530,478 0.61 _____________________ _________________________
127,125 Fuchs Petrolub SE 4,355,672 0.18 56,906 SAP SE 4,041,678 0.17 _____________________ _________________________
8,397,350 0.35 _____________________ _________________________
1,952,500 China Mobile Limited 16,824,050 0.71 _____________________ _________________________
2,823,273 Bezeq The Israeli Telecommunication Corporation Limited 4,373,649 0.18
155,076 Teva Pharmaceutical Industries Limited 4,538,860 0.19 _____________________ _________________________
8,912,509 0.37 _____________________ _________________________
76,700 ABC-Mart Inc 3,529,361 0.15 122,985 Japan Tobacco Inc 3,286,080 0.14 172,600 KDDI Corporation 3,550,600 0.15 394,000 Mitsubishi Electric Corporation 4,462,654 0.19 317,800 Sumitomo Rubber Industries Limited 4,099,912 0.17 _____________________ _________________________
18,928,607 0.80 _____________________ _________________________
11,759,132 Axiata Group BHD 10,057,321 0.42 *Rights attached to the Total SA equity, with expiry date of 16 January 2017 and zero valuation as at 31 December 2016.
Australia (1.30%) (2015: 1.36%)
Belgium Nil (2015: 0.18%) Bermuda (0.60%) (2015: 0.50%)
Canada (0.95%) (2015: 0.95%)
Cayman Islands (0.65%) (2015: 0.64%)
France (0.61%) (2015: 0.47%)
Germany (0.35%) (2015: 0.30%)
Hong Kong (0.71%) (2015: 0.82%)
Israel (0.37%) (2015: 0.60%)
Japan (0.80%) (2015: 0.85%)
Malaysia (0.75%) (2015: 1.07%)

PYRFORD GLOBAL TOTAL RETURN (STERLING) FUND Schedule of Investments as at 31 December 2016 cont /d
84
Shares Fair Value
GBP Fund %
Transferable Securities (94.72%) (2015: 97.35%) co nt/d
Equities (29.93%) (2015: 31.28%) cont/d
5,270,014 Malayan Banking BHD 7,830,521 0.33 _____________________ _________________________
17,887,842 0.75 _____________________ _________________________
129,270 Unilever NV 4,314,872 0.18 _____________________ _________________________
1,166,794 Telenor ASA 14,253,836 0.60 _____________________ _________________________
6,997,500 Comfortdelgro Corporation Limited 9,723,584 0.41 8,310,900 Singapore Technologies Engineering Limited 15,102,091 0.63 1,193,000 United Overseas Bank Limited 13,691,692 0.58 _____________________ _________________________
38,517,367 1.62 _____________________ _________________________
359,784 Assa Abloy AB 5,471,878 0.23 562,115 Atlas Copco AB 13,981,162 0.59 512,795 Svenska Cellulosa AB SCA 11,783,606 0.49 _____________________ _________________________
31,236,646 1.31 _____________________ _________________________
194,118 Nestle SA 11,323,583 0.48 154,497 Novartis AG 9,148,061 0.38 57,043 Roche Holding AG 10,590,664 0.44 11,753 Syngenta AG 3,801,033 0.16 21,860 Zurich Insurance Group AG 4,885,971 0.21 _____________________ _________________________
39,749,312 1.67 _____________________ _________________________
1,026,257 Advantech Co Limited 6,587,511 0.28 5,235,040 Chunghwa Telecom Co Limited 13,401,812 0.56 _____________________ _________________________
19,989,323 0.84 _____________________ _________________________
5,151,291 BP Plc 26,065,533 1.10 1,055,239 British American Tobacco Plc 48,530,442 2.04 3,235,361 Glaxosmithkline Plc 50,326,040 2.11 19,958,867 Legal & General Group Plc 48,899,224 2.06 4,845,150 National Grid Plc 45,835,119 1.93 166,476 Royal Dutch Shell Plc 3,711,891 0.16 3,823,002 Sky Plc 37,637,455 1.58 2,484,191 SSE Plc 38,554,644 1.62 3,765,936 United Utilities Group Plc 33,836,935 1.42
Malaysia (0.75%) (2015: 1.07%) cont/d
Netherlands (0.18%) (2015: 0.15%)
Norway (0.60%) (2015: 0.55%)
Singapore (1.62%) (2015: 1.77%)
Sweden (1.31%) (2015: 1.18%)
Switzerland (1.67%) (2015: 1.74%)
Taiwan (0.84%) (2015: 0.91%)
United Kingdom (15.73%) (2015: 16.32%)

PYRFORD GLOBAL TOTAL RETURN (STERLING) FUND Schedule of Investments as at 31 December 2016 cont /d
85
Shares Fair Value
GBP Fund %
Transferable Securities (94.72%) (2015: 97.35%) co nt/d
Equities (29.93%) (2015: 31.28%) cont/d
20,518,107 Vodafone Group Plc 40,769,479 1.71 _____________________ _________________________
374,166,762 15.73 _____________________ _________________________
44,709 Exxon Mobil Corporation 3,283,578 0.14 39,455 McDonald's Corporation 3,938,124 0.16 102,754 Microsoft Corporation 5,253,802 0.22 56,376 Philip Morris International Inc 4,203,683 0.18 71,960 T Rowe Price Group Inc 4,418,679 0.19 _____________________ _________________________
21,097,866 0.89 _____________________ _________________________
Total Equities 711,740,270 29.93 _____________________ _________________________
Principal Amount
Fair Value GBP
Fund %
Bonds (64.79%) (2015: 66.07%)
AUD 140,425,000 Australia Government Bond 3.250% due 21/10/2018 84,494,805 3.55
58,749,000 Australia Government Bond 5.250% due 15/03/2019 36,948,202 1.56
_____________________ _________________________
121,443,007 5.11 _____________________ _________________________
CAD
60,500,000
Canadian Government Bond 1.250% due 01/09/2018 36,796,826 1.55
59,062,000
Canadian Government Bond 4.250% due 01/06/2018 37,388,925 1.57
57,972,000
Canadian Government Bond 3.750% due 01/06/2019 37,415,228 1.57
_____________________ _________________________
111,600,979 4.69 _____________________ _________________________
GBP 130,787,300 United Kingdom Gilt 1.750% due 22/01/2017 130,944,245 5.51 345,638,000 United Kingdom Gilt 8.750% due 25/08/2017 365,719,568 15.38 126,107,000 United Kingdom Gilt 5.000% due 07/03/2018 133,496,870 5.61 153,927,000 United Kingdom Gilt 1.250% due 22/07/2018 156,805,435 6.59 87,924,000 United Kingdom Gilt 4.500% due 07/03/2019 96,540,552 4.06 150,406,000 United Kingdom Gilt 1.750% due 22/07/2019 156,738,092 6.59 160,409,000 United Kingdom Gilt 2.000% due 22/07/2020 169,921,254 7.14 73,311,900 United Kingdom Gilt 8.000% due 07/06/2021 97,812,737 4.11 _____________________ _________________________
1,307,978,753 54.99 _____________________ _________________________
United States Nil (2015: 14.52%)
_____________________ _________________________
Total Bonds 1,541,022,739 64.79 _____________________ _________________________
Total Transferable Securities 2,252,763,009 94.72 _____________________ _________________________
United Kingdom (15.73%) (2015: 16.32%) cont/d
United States (0.89%) (2015: 0.92%)
Australia (5.11%) (2015: Nil)
Canada (4.69%) (2015: 6.06%)
United Kingdom (54.99%) (2015: 45.49%)

PYRFORD GLOBAL TOTAL RETURN (STERLING) FUND Schedule of Investments as at 31 December 2016 cont /d
86
Settlement Date
Currency Bought
Amount Bought
Currency Sold
Amount Sold
Unrealised Gain/(Loss)
GBP Fund % _____________________ ____________________________________________ _____________________________________________ _____________________ _________________________
Financial Derivative Instruments (0.31%) (2015: (0. 01)%)
Forward Foreign Currency Exchange Contracts (2015: (0.01)%)
14/03/2017 GBP 155,512,964 AUD 251,127,000 8,523,676 0.3614/03/2017 GBP 38,121,092 CHF 49,079,000 (1,173,013) (0.05)
_____________________ _________________________
Unrealised gain on forward foreign currency exchang e contracts 8,523,676 0.36 _____________________ _________________________
Unrealised loss on forward foreign currency exchang e contracts (1,173,013) (0.05) _____________________ _________________________
Net unrealised gain on forward foreign currency exc hange contracts 7,350,663 0.31 _____________________ _________________________
Fair Value
GBP Fund % Portfolio of Investments 2,260,113,672 95.03Other Net Assets 118,209,303 4.97 _____________________ _________________________
Net Assets 2,378,322,975 100.00 _____________________ _________________________
The counterparty for the open forward foreign currency exchange contracts is State Street Bank and Trust Company, London.
Total assets comprised as follows:
% oftotal
assetsTransferable securities admitted to an official stock exchange listing 89.46Transferable securities dealt in on another regulated market 3.55Recently issued transferable securities of the type referred to in Regulation 68(1)(d) 1.57Over the counter financial derivative instruments 0.36Deposits with credit institutions 4.06Other current assets 1.00 100.00

PYRFORD GLOBAL EQUITY (US$) FUND Schedule of Investments as at 31 December 2016
87
Shares Fair Value
USD Fund %
Transferable Securities (94.51%) (2015: 95.82%)
Equities (94.51%) (2015: 95.82%)
6,645 Brambles Limited 59,533 1.69 5,265 Computershare Limited 47,397 1.35 1,812 Newcrest Mining Limited 26,511 0.75 3,546 QBE Insurance Group Limited 31,820 0.90 574 Rio Tinto Limited 24,841 0.71 4,136 Telstra Corporation Limited 15,240 0.43 2,198 Woodside Petroleum Limited 49,484 1.41 2,915 Woolworths Limited 50,757 1.44 _____________________ _________________________
305,583 8.68
Belgium Nil (2015: 1.04%) _____________________ _________________________
3,450 VTech Holdings Limited 46,136 1.31 _____________________ _________________________
593 Canadian National Railway Co 40,422 1.15 767 Imperial Oil Limited 26,859 0.76 1,591 Metro Inc 47,519 1.35 577 Saputo Inc 20,355 0.58 _____________________ _________________________
135,155 3.84 _____________________ _________________________
4,562 ASM Pacific Technology Limited 48,329 1.37 _____________________ _________________________
408 Air Liquide SA 44,981 1.28 676 Sanofi SA 54,367 1.55 706 Total SA* 36,050 1.02 _____________________ _________________________
135,398 3.85 _____________________ _________________________
1,004 Fuchs Petrolub SE 42,319 1.20 451 SAP SE 39,405 1.12 _____________________ _________________________
81,724 2.32 _____________________ _________________________
5,644 China Mobile Limited 59,828 1.70 32,640 Cnooc Limited 40,828 1.16 4,414 Power Assets Holdings Limited 38,906 1.10 _____________________ _________________________
139,562 3.96 _____________________ _________________________
200 ABC-Mart Inc 11,322 0.32 660 Japan Tobacco Inc 21,694 0.62 1,000 KDDI Corporation 25,307 0.72 728 Mitsubishi Electric Corporation 10,144 0.29 800 Nihon Kohden Corporation 17,697 0.50 1,166 Sumitomo Rubber Industries Limited 18,505 0.53 *Rights attached to the Total SA equity, with expiry date of 16 January 2017 and zero valuation as at 31 December 2016.
Australia (8.68%) (2015: 8.72%)
Bermuda (1.31%) (2015: 1.16%)
Canada (3.84%) (2015: 3.82%)
Cayman Islands (1.37%) (2015: 1.42%)
France (3.85%) (2015: 3.18%)
Germany (2.32%) (2015: 2.01%)
Hong Kong (3.96%) (2015: 3.97%)
Japan (3.48%) (2015: 3.80%)

PYRFORD GLOBAL EQUITY (US$) FUND Schedule of Investments as at 31 December 2016 cont /d
88
Shares Fair Value
USD Fund %
Transferable Securities (94.51%) (2015: 95.82%) co nt/d
Equities (94.51%) (2015: 95.82%) cont/d Japan (3.48%) (2015: 3.80%) cont/d 682 Toyota Tsusho Corporation 17,758 0.50 _____________________ _________________________
122,427 3.48 _____________________ _________________________
67,813 Axiata Group BHD 71,350 2.03 17,000 Magnum BHD 8,223 0.23 31,549 Malayan Banking BHD 57,669 1.64 _____________________ _________________________
137,242 3.90 _____________________ _________________________
1,166 Unilever NV 47,879 1.36 _____________________ _________________________
3,052 Telenor ASA 45,867 1.30 _____________________ _________________________
13,386 Comfortdelgro Corporation Limited 22,883 0.65 10,776 SembCorp Industries Limited 21,255 0.60 23,728 Singapore Technologies Engineering Limited 53,043 1.51 2,458 United Overseas Bank Limited 34,704 0.98 2,914 Venture Corporation Limited 19,925 0.57 _____________________ _________________________
151,810 4.31 _____________________ _________________________
1,185 Assa Abloy AB 22,171 0.63 1,445 Atlas Copco AB 44,214 1.26 1,587 Svenska Cellulosa AB SCA 44,863 1.27 _____________________ _________________________
111,248 3.16 _____________________ _________________________
10 Givaudan SA 18,292 0.52 1,337 Nestle SA 95,946 2.72 1,077 Novartis AG 78,451 2.23 183 Panalpina Welttransport Holding AG 22,849 0.65 385 Roche Holding AG 87,934 2.50 109 Schindler Holding AG 19,188 0.55 34 Syngenta AG 13,527 0.38 146 Zurich Insurance Group AG 40,145 1.14 _____________________ _________________________
376,332 10.69 _____________________ _________________________
2,539 Advantech Co Limited 20,050 0.57 13,036 Chunghwa Telecom Co Limited 41,055 1.17 6,000 Mediatek Inc 40,305 1.14 2,000 Merida Industry Co Limited 8,936 0.25 _____________________ _________________________
110,346 3.13
Malaysia (3.90%) (2015: 5.04%)
Netherlands (1.36%) (2015: 1.06%)
Norway (1.30%) (2015: 1.03%)
Singapore (4.31%) (2015: 4.12%)
Sweden (3.16%) (2015: 2.41%)
Switzerland (10.69%) (2015: 10.54%)
Taiwan (3.13%) (2015: 4.43%)

PYRFORD GLOBAL EQUITY (US$) FUND Schedule of Investments as at 31 December 2016 cont /d
89
Shares Fair Value
USD Fund %
Transferable Securities (94.51%) (2015: 95.82%) co nt/d
Equities (94.51%) (2015: 95.82%) cont/d
4,895 BP Plc 30,471 0.86 884 British American Tobacco Plc 50,014 1.42 2,741 Glaxosmithkline Plc 52,451 1.49 12,454 Legal & General Group Plc 37,536 1.07 1,311 Royal Dutch Shell Plc 35,960 1.02 1,982 SSE Plc 37,842 1.07 14,959 Vodafone Group Plc 36,566 1.04 _____________________ _________________________
280,840 7.97 _____________________ _________________________
1,013 Altria Group Inc 68,732 1.95 424 American Express Co 31,342 0.89 510 Automatic Data Processing Inc 52,759 1.50 1,217 CH Robinson Worldwide Inc 89,729 2.55 2,095 Coach Inc 73,346 2.08 932 Exxon Mobil Corporation 84,206 2.39 486 General Dynamics Corporation 84,180 2.39 389 Home Depot Inc 52,554 1.49 686 McDonald's Corporation 84,234 2.39 1,837 Microsoft Corporation 115,547 3.28 1,272 Philip Morris International Inc 116,681 3.31 390 Rockwell Automation Inc 52,592 1.49 1,383 T Rowe Price Group Inc 104,472 2.97 607 Wal-Mart Stores Inc 42,041 1.20 _____________________ _________________________
1,052,415 29.88 _____________________ _________________________
Total Equities 3,328,293 94.51 _____________________ _________________________
Total Transferable Securities 3,328,293 94.51 _____________________ _________________________
United Kingdom (7.97%) (2015: 7.53%)
United States (29.88%) (2015: 30.54%)
Financial Derivative Instruments ((0.01)%) (2015: N il)
Forward Foreign Currency Exchange Contracts ((0.01) %) (2015: Nil)
Settlement Date
Currency Bought
Amount Bought
Currency Sold
Amount Sold
Unrealised Gain (Loss)
USD Fund % _____________________ ____________________________________________ _____________________________________________ _____________________ _________________________
05/01/2017 JPY 1,197,231 USD 10,302 (64) (0.01)05/01/2017 JPY 769,104 USD 6,618 (41) 0.0005/01/2017 JPY 662,124 USD 5,697 (35) 0.0005/01/2017 JPY 519,080 USD 4,466 (28) 0.0005/01/2017 JPY 376,638 USD 3,241 (20) 0.0005/01/2017 JPY 310,527 USD 2,672 (17) 0.0004/01/2017 SGD 11,473 USD 7,926 15 0.0004/01/2017 SGD 12,375 USD 8,549 16 0.0004/01/2017 SGD 25,858 USD 17,863 32 0.00
Unrealised gain on forward foreign currency exchange contracts 63 0.00 __________ ____________ Unrealised loss on forward foreign currency exchange contracts (205) (0.01) ____________ _______________ Net unrealised gain on forward foreign currency exc hange contracts (142) (0.01) _________________ ____________________

PYRFORD GLOBAL EQUITY (US$) FUND Schedule of Investments as at 31 December 2016 cont /d
90
Fair Value
USD Fund % Portfolio of Investments 3,328,151 94.50Other Net Assets 193,523 5.50
Net Assets 3,521,674 100.00
The counterparty for the open forward currency exchange contracts is State Street Bank and Trust Company, London.
Total assets comprised as follows:
% oftotal
assetsTransferable securities admitted to an official stock exchange listing 74.93Deposits with credit institutions 2.31Other current assets 22.76 100.00

PYRFORD INTERNATIONAL (EAFE) EQUITY FUND Schedule of Investments as at 31 December 2016
91
Shares Fair Value
USD Fund %
Transferable Securities (96.00%) (2015:98.15%)
Equities (96.00%) (2015:98.15%)
42,881 Brambles Limited 384,171 1.88 36,803 Computershare Limited 331,313 1.62 8,927 Newcrest Mining Limited 130,608 0.64 23,392 QBE Insurance Group Limited 209,907 1.03 3,599 Rio Tinto Limited 155,757 0.76 22,488 Telstra Corporation Limited 82,863 0.41 15,189 Woodside Petroleum Limited 341,951 1.68 20,146 Woolworths Limited 350,787 1.72 _____________________ _________________________
1,987,357 9.74 _____________________ _________________________
6,836 Belgacom SA 196,857 0.97 _____________________ _________________________
20,500 VTech Holdings Limited 274,142 1.34 _____________________ _________________________
28,200 ASM Pacific Technology Limited 298,745 1.46 _____________________ _________________________
3,872 Kone OYJ 173,489 0.85 4,139 Sampo OYJ 185,715 0.91 _____________________ _________________________
359,204 1.76 _____________________ _________________________
3,384 Air Liquide SA 373,074 1.83 4,385 Legrand SA 249,680 1.22 3,138 Rubis SA 260,161 1.27 5,430 Sanofi SA 436,707 2.14 5,777 Total SA* 294,990 1.45 _____________________ _________________________
1,614,612 7.91 _____________________ _________________________
5,415 Brenntag AG 300,894 1.47 10,841 Deutsche Post AG 355,463 1.74 8,310 Fuchs Petrolub SE 350,268 1.72 3,651 GEA Group AG 147,105 0.72 3,363 SAP SE 293,837 1.44 _____________________ _________________________
1,447,567 7.09 _____________________ _________________________
30,000 China Mobile Limited 318,007 1.56 177,000 Cnooc Limited 221,405 1.08 25,000 Power Assets Holdings Limited 220,355 1.08 _____________________ _________________________
759,767 3.72 _____________________ _________________________
*Rights attached to the Total SA equity, with expiry date of 16 January 2017 and zero valuation as at 31 December 2016.
Australia (9.74%) (2015: 10.31%)
Belgium (0.97%) (2015: 2.78%)
Bermuda (1.34%) (2015: 1.36%)
Cayman Islands (1.46%) (2015: 1.38%)
Finland (1.76%) (2015: 1.01%)
France (7.91%) (2015: 7.12%)
Germany (7.09%) (2015: 7.11%)
Hong Kong (3.72%) (2015: 3.74%)

PYRFORD INTERNATIONAL (EAFE) EQUITY FUND Schedule of Investments as at 31 December 2016 cont /d
92
Shares Fair Value
USD Fund %
Transferable Securities (96.00%) (2015:98.15%) con t/d
Equities (96.00%) (2015:98.15%) cont/d
71,987 Bezeq The Israeli Telecommunication Corporation Limited 137,189 0.67
4,106 Teva Pharmaceutical Industries Limited 147,842 0.73 _____________________ _________________________
285,031 1.40 _____________________ _________________________
2,300 ABC-Mart Inc 130,198 0.64 7,596 Japan Tobacco Inc 249,682 1.22 12,000 KDDI Corporation 303,681 1.49 20,000 Mitsubishi Electric Corporation 278,678 1.37 9,300 Nihon Kohden Corporation 205,730 1.01 16,100 Sumitomo Rubber Industries Limited 255,519 1.25 10,700 Toyota Tsusho Corporation 278,605 1.36 _____________________ _________________________
1,702,093 8.34 _____________________ _________________________
248,985 Axiata Group BHD 261,973 1.29 104,800 Magnum BHD 50,695 0.25 121,922 Malayan Banking BHD 222,862 1.09 _____________________ _________________________
535,530 2.63 _____________________ _________________________
5,666 Koninklijke Vopak NV 269,278 1.32 15,572 Relx NV 261,296 1.28 8,476 Unilever NV 348,046 1.71 _____________________ _________________________
878,620 4.31 _____________________ _________________________
26,740 Telenor ASA 401,860 1.97 _____________________ _________________________
65,000 Comfortdelgro Corporation Limited 111,115 0.54 66,000 SembCorp Industries Limited 130,182 0.64 133,000 Singapore Technologies Engineering Limited 297,315 1.46 18,800 United Overseas Bank Limited 265,430 1.30 23,000 Venture Corporation Limited 157,270 0.77 _____________________ _________________________
961,312 4.71 _____________________ _________________________
8,737 Assa Abloy AB 163,468 0.80 11,925 Atlas Copco AB 364,882 1.79 11,338 Svenska Cellulosa AB SCA 320,513 1.57 _____________________ _________________________
848,863 4.16 _____________________ _________________________
Israel (1.40%) (2015: 1.96%)
Japan (8.34%) (2015: 9.40%)
Malaysia (2.63%) (2015: 3.93%)
Netherlands (4.31%) (2015: 4.49%)
Norway (1.97%) (2015: 1.59%)
Singapore (4.71%) (2015: 4.66%)
Sweden (4.16%) (2015: 3.44%)

PYRFORD INTERNATIONAL (EAFE) EQUITY FUND Schedule of Investments as at 31 December 2016 cont /d
93
Shares Fair Value
USD Fund %
Transferable Securities (96.00%) (2015:98.15%) con t/d
Equities (96.00%) (2015:98.15%) cont/d
91 Givaudan SA 166,454 0.81 9,706 Nestle SA 696,521 3.41 7,557 Novartis AG 550,471 2.70 1,491 Panalpina Welttransport Holding AG 186,164 0.91 2,775 Roche Holding AG 633,811 3.11 856 Schindler Holding AG 150,690 0.74 424 Syngenta AG 168,692 0.83 1,222 Zurich Insurance Group AG 336,006 1.65 _____________________ _________________________
2,888,809 14.16 _____________________ _________________________
Taiwan (3.55%) (2015: 3.84%) 24,124 Advantech Co Limited 190,498 0.93 78,000 Chunghwa Telecom Co Limited 245,648 1.21 35,005 Mediatek Inc 235,148 1.15 12,000 Merida Industry Co Limited 53,616 0.26 _____________________ _________________________
724,910 3.55 _____________________ _________________________
31,332 BP Plc 195,036 0.96 6,999 British American Tobacco Plc 395,982 1.94 16,749 Glaxosmithkline Plc 320,505 1.57 129,236 Legal & General Group Plc 389,516 1.91 34,347 National Grid Plc 399,720 1.96 11,230 Royal Dutch Shell Plc Class A Shares 308,034 1.51 9,985 Royal Dutch Shell Plc Class B Shares 287,742 1.41 23,785 Sky Plc 288,068 1.41 14,321 SSE Plc 273,426 1.34 23,516 United Utilities Group Plc 259,930 1.27 125,291 Vodafone Group Plc 306,262 1.50 _____________________ _________________________
3,424,221 16.78 _____________________ _________________________
Total Equities 19,589,500 96.00 _____________________ _________________________
Total Transferable Securities 19,589,500 96.00 _____________________ _________________________
Switzerland (14.16%) (2015: 13.89%)
United Kingdom (16.78%) (2015: 16.14%)

PYRFORD INTERNATIONAL (EAFE) EQUITY FUND Schedule of Investments as at 31 December 2016 cont /d
94
Fair Value
USD Fund % Portfolio of Investments 19,589,500 96.00Other Net Assets 817,265 4.00
Net Assets 20,406,765 100.00
Total assets comprised as follows:
% oftotal
assetsTransferable securities admitted to an official stock exchange listing 95.68Deposits with credit institutions 4.07Other current assets 0.25 100.00

PYRFORD SHARIAH GLOBAL EQUITY FUND Schedule of Investments as at 31 December 2016
95
Shares Fair Value
USD Fund %
Transferable Securities (99.72%) (2015: 97.72%)
Equities (99.72%) (2015: 97.72%)
6,115 Brambles Limited 54,784 2.87 626 Rio Tinto Limited 27,092 1.42 4,579 Telstra Corporation Limited 16,873 0.89 2,444 Woodside Petroleum Limited 55,022 2.89 _____________________ _________________________
153,771 8.07 _____________________ _________________________
4,069 VTech Holdings Limited 54,414 2.85 _____________________ _________________________
441 Canadian National Railway Co 30,061 1.58 814 Imperial Oil Limited 28,505 1.50 585 Saputo Inc 20,637 1.08 _____________________ _________________________
79,203 4.16 _____________________ _________________________
5,264 ASM Pacific Technology Limited 55,766 2.92 21,430 Haitian International Holdings Limited 42,061 2.21 _____________________ _________________________
97,827 5.13 _____________________ _________________________
373 Kone OYJ 16,713 0.88 _____________________ _________________________
301 Legrand SA 17,139 0.90 352 Sanofi SA 28,309 1.48 _____________________ _________________________
45,448 2.38 _____________________ _________________________
411 Brenntag AG 22,838 1.20 798 Deutsche Post AG 26,166 1.37 628 Fuchs Petrolub SE 24,474 1.28 250 SAP SE 21,843 1.15 _____________________ _________________________
95,321 5.00 _____________________ _________________________
325 ABC-Mart Inc 18,397 0.96 1,623 Mitsubishi Electric Corporation 22,615 1.19 697 Nihon Kohden Corporation 15,419 0.81 250 Shin Etsu Chemical Co Limited 19,383 1.02 _____________________ _________________________
75,814 3.98 _____________________ _________________________
54,557 Axiata Group BHD 57,403 3.01 _____________________ _________________________
8,344 Comfortdelgro Corporation Limited 14,264 0.75 16,938 Singapore Technologies Engineering Limited 37,864 1.99
Australia (8.07%) (2015: 8.27%)
Bermuda (2.85%) (2015: 1.40%)
Canada (4.16%) (2015: 3.38%)
Cayman Islands (5.13%) (2015: 3.28%)
Finland (0.88%) (2015: 0.77%)
France (2.38%) (2015: 3.16%)
Germany (5.00%) (2015: 4.24%)
Hong Kong Nil (2015: 1.93%)
Japan (3.98%) (2015: 4.00%)
Malaysia (3.01%) (2015: 4.80%)
Singapore (4.53%) (2015: 4.80%)

PYRFORD SHARIAH GLOBAL EQUITY FUND Schedule of Investments as at 31 December 2016 cont /d
96
Shares Fair Value
USD Fund %
Transferable Securities (99.72%) (2015: 97.72%) co nt/d
Equities (99.72%) (2015: 97.72%)cont/d
5,007 Venture Corporation Limited 34,237 1.79 _____________________ _________________________
86,365 4.53 _____________________ _________________________
2,195 Assa Abloy AB 41,068 2.15 1,476 Atlas Copco AB 45,163 2.37 _____________________ _________________________
86,231 4.52 _____________________ _________________________
9 Givaudan SA 16,462 0.86 786 Nestle SA 56,405 2.96 706 Novartis AG 51,427 2.70 140 Panalpina Welttransport Holding AG 17,480 0.92 237 Roche Holding AG 54,131 2.84 38 Syngenta AG 15,119 0.79 _____________________ _________________________
211,024 11.07 _____________________ _________________________
3,569 Advantech Co Limited 28,183 1.48 7,858 Chunghwa Telecom Co Limited 24,747 1.30 2,962 Merida Industry Co Limited 13,234 0.69 5,896 Taiwan Semiconductor Manufacturing Co Limited 33,204 1.74 _____________________ _________________________
99,368 5.21 _____________________ _________________________
2,079 Glaxosmithkline Plc 39,783 2.08 1,427 Relx Plc 25,314 1.33 566 Unilever Plc 22,856 1.20 _____________________ _________________________
87,953 4.61 _____________________ _________________________
425 Automatic Data Processing Inc 43,966 2.31 790 CH Robinson Worldwide Inc 58,247 3.05 1,365 Coach Inc 47,789 2.51 1,228 Colgate-Palmolive Co 80,913 4.24 1,086 Exxon Mobil Corporation 98,120 5.15 406 General Dynamics Corporation 70,323 3.69 385 Home Depot Inc 52,014 2.73 537 McDonald's Corporation 65,938 3.46 1,215 Microsoft Corporation 76,423 4.01 448 Rockwell Automation Inc 60,413 3.17 _____________________ _________________________
654,146 34.32 _____________________ _________________________
Total Equities 1,901,001 99.72 _____________________ _________________________
Total Transferable Securities 1,901,001 99.72 _____________________ _________________________
Singapore (4.53%) (2015: 4.80%) cont/d
Sweden (4.52%) (2015: 3.22%)
Switzerland (11.07%) (2015: 10.81%)
Taiwan (5.21%) (2015: 5.08%)
United Kingdom (4.61%) (2015: 6.74%)
United States (34.32%) (2015: 31.84%)

PYRFORD SHARIAH GLOBAL EQUITY FUND Schedule of Investments as at 31 December 2016 cont /d
97
Shares Fair Value
USD Fund % Portfolio of Investments 1,901,001 99.72Other Net Assets 5,254 0.28 _____________________ _________________________
Net Assets 1,906,255 100.00 _____________________ _________________________
Total assets comprised as follows:
% oftotal
assetsTransferable securities admitted to an official stock exchange listing 97.44Deposits with credit institutions 2.16Other current assets 0.40 100.00

PYRFORD GLOBAL TOTAL RETURN (EURO) FUND Schedule of Investments as at 31 December 2016
98
Shares Fair Value
EUR Fund %
Transferable Securities (95.91%) (2015: 95.89%)
Equities (35.78%) (2015: 33.78%)
1,046 Brambles Limited 8,874 0.32 612 Computershare Limited 5,217 0.19 490 Woodside Petroleum Limited 10,447 0.38 227 Woolworths Limited 3,743 0.14 _____________________ _________________________
28,281 1.03
Belgium Nil (2015: 2.24%) _____________________ _________________________
1,800 VTech Holdings Limited 22,794 0.83 _____________________ _________________________
230 Canadian National Railway Co 14,847 0.54 337 Imperial Oil Limited 11,175 0.41 570 Metro Inc 16,121 0.59 275 Saputo Inc 9,187 0.33 _____________________ _________________________
51,330 1.87 _____________________ _________________________
2,500 ASM Pacific Technology Limited 25,080 0.92 _____________________ _________________________
775 Air Liquide SA 80,910 2.95 1,186 Sanofi SA 90,326 3.30 1,419 Total SA* 68,615 2.51 _____________________ _________________________
239,851 8.76 _____________________ _________________________
1,627 Fuchs Petrolub SE 64,942 2.37 785 SAP SE 64,951 2.37 _____________________ _________________________
129,893 4.74 _____________________ _________________________
2,500 China Mobile Limited 25,095 0.92 _____________________ _________________________
4,188 Bezeq The Israeli Telecommunication Corporation Limited 7,558 0.28
204 Teva Pharmaceutical Industries Limited 6,956 0.25 _____________________ _________________________
14,514 0.53 _____________________ _________________________
100 ABC-Mart Inc 5,360 0.20 115 Japan Tobacco Inc 3,580 0.13 200 KDDI Corporation 4,793 0.17 1,000 Mitsubishi Electric Corporation 13,195 0.48 400 Sumitomo Rubber Industries Limited 6,012 0.22 _____________________ _________________________
32,940 1.20 _____________________ _________________________
*Rights attached to the Total SA equity, with expiry date of 16 January 2017 and zero valuation as at 31 December 2016.
Australia (1.03%) (2015: 0.96%)
Bermuda (0.83%) (2015: 0.60%)
Canada (1.87%) (2015: 1.66%)
Cayman Islands (0.92%) (2015: 0.86%)
France (8.76%) (2015: 6.83%)
Germany (4.74%) (2015: 3.87%)
Hong Kong (0.92%) (2015: 0.96%)
Israel (0.53%) (2015: 0.77%)
Japan (1.20%) (2015: 0.77%)

PYRFORD GLOBAL TOTAL RETURN (EURO) FUND Schedule of Investments as at 31 December 2016 cont /d
99
Shares Fair Value
EUR Fund %
Transferable Securities (95.91%) (2015: 95.89%) co nt/d
Equities (35.78%) (2015: 33.78%) cont/d Malaysia (0.97%) (2015: 1.34%) 15,603 Axiata Group BHD 15,546 0.57 6,321 Malayan Banking BHD 10,942 0.40 _____________________ _________________________
26,488 0.97 _____________________ _________________________
1,851 Unilever NV 71,976 2.63 _____________________ _________________________
872 Telenor ASA 12,410 0.45 _____________________ _________________________
7,000 Comfortdelgro Corporation Limited 11,332 0.41 7,000 Singapore Technologies Engineering Limited 14,818 0.54 1,000 United Overseas Bank Limited 13,370 0.49 _____________________ _________________________
39,520 1.44 _____________________ _________________________
429 Assa Abloy AB 7,601 0.28 687 Atlas Copco AB 19,906 0.73 557 Svenska Cellulosa AB SCA 14,911 0.54 _____________________ _________________________
42,418 1.55 _____________________ _________________________
260 Nestle SA 17,669 0.65 147 Novartis AG 10,140 0.37 51 Roche Holding AG 11,031 0.40 10 Syngenta AG 3,767 0.14 20 Zurich Insurance Group AG 5,208 0.19 _____________________ _________________________
47,815 1.75 _____________________ _________________________
1,099 Advantech Co Limited 8,218 0.30 8,000 Chunghwa Telecom Co Limited 23,859 0.87 _____________________ _________________________
32,077 1.17 _____________________ _________________________
1,296 BP Plc 7,640 0.28 156 British American Tobacco Plc 8,358 0.31 507 Glaxosmithkline Plc 9,187 0.34 1,830 Legal & General Group Plc 5,223 0.19 2,459 Royal Dutch Shell Plc 63,872 2.33 345 SSE Plc 6,238 0.23 1,939 Vodafone Group Plc 4,488 0.16 _____________________ _________________________
105,006 3.84 _____________________ _________________________
52 Exxon Mobil Corporation 4,449 0.16 47 McDonald's Corporation 5,465 0.20 165 Microsoft Corporation 9,828 0.36
Netherlands (2.63%) (2015: 2.03%)
Norway (0.45%) (2015: 0.50%)
Singapore (1.44%) (2015: 1.49%)
Sweden (1.55%) (2015: 1.30%)
Switzerland (1.75%) (2015: 1.89%)
Taiwan (1.17%) (2015: 1.17%)
United Kingdom (3.84%) (2015: 3.53%)
United States (1.18%) (2015: 1.01%)

PYRFORD GLOBAL TOTAL RETURN (EURO) FUND Schedule of Investments as at 31 December 2016 cont /d
100
Shares Fair Value
EUR Fund %
Transferable Securities (95.91%) (2015: 95.89%) co nt/d
Equities (35.78%) (2015: 33.78%) cont/d United States (1.18%) (2015: 1.01%) cont/d 72 Philip Morris International Inc 6,255 0.23 88 T Rowe Price Group Inc 6,295 0.23 _____________________ _________________________
32,292 1.18 _____________________ _________________________
Total Equities 979,780 35.78 _____________________ _________________________
Bonds (60.13%) (2015: 62.11%)
Principal Amount
Fair Value EUR Fund %
189,000 Canadian Government Bond 1.250 due 01/09/2018 133,915 4.89 85,000 Canadian Government Bond 3.750 due 01/06/2019 63,909 2.33 _____________________ _________________________
261,247 9.54 _____________________ _________________________
EUR 161,000 Bundesrepublik Deutschland 4.250 due 04/07/2017 165,141 6.03 202,000 Bundesrepublik Deutschland 4.000 due 04/01/2018 211,764 7.74 154,000 Bundesrepublik Deutschland 4.250 due 04/07/2018 165,674 6.05 103,600 Bundesrepublik Deutschland 3.750 due 04/01/2019 113,123 4.13 147,000 Bundesrepublik Deutschland 3.500 due 04/07/2019 162,921 5.95 121,200 Bundesrepublik Deutschland 2.250 due 04/09/2020 134,521 4.91 _____________________ _________________________
953,144 34.81 _____________________ _________________________
GBP 170,000 United Kingdom Gilt 8.750 due 25/08/2017 209,550 7.65 _____________________ _________________________
USD 116,000 United States Treasury Note 2.750 due 31/05/2017 110,810 4.05 117,000 United States Treasury Note 2.500 due 30/06/2017 111,825 4.08 _____________________ _________________________
222,635 8.13 _____________________ _________________________
Total Bonds 1,646,576 60.13 _____________________ _________________________
Total Transferable Securities 2,626,356 95.91 _____________________ _________________________
Financial Derivative Instruments ((0.01)%) (2015: ( 0.06)%)
Forward Foreign Currency Exchange Contracts ((0.01) %) (2015: (0.06)%)
Settlement Date
Currency Bought
Amount Bought
Currency Sold
Amount Sold
Unrealised Gain/(Loss)
EUR Fund
% _____________________ ____________________________________________ _____________________________________________ _____________________ _________________________
14/03/2017 EUR 25,622 AUD 38,000 (242) (0.01) _____________________ _________________________
Unrealised loss on forward foreign currency exchang e contracts (242) (0.01) _____________________ _________________________
Canada (9.54%) (2015: 9.24%) CAD 86,000 Canadian Government Bond 4.250 due 01/06/2018 63,423 2.32
Germany (34.81%) (2015: 35.68%)
United Kingdom (7.65%) (2015: 9.04%)
United States (8.13%) (2015: 8.15%)

PYRFORD GLOBAL TOTAL RETURN (EURO) FUND Schedule of Investments as at 31 December 2016 cont /d
101
Fair Value
EUR Fund % Portfolio of Investments 2,626,114 95.90Other Net Assets 112,259 4.10Net Assets 2,738,373 100.00
The counterparty for the open forward currency exchange contracts is State Street Bank and Trust Company, London.
Total assets comprised as follows:
% oftotal
assetsTransferable securities admitted to an official stock exchange listing 91.76Recently issued transferable securities of the type referred to in Regulation 68(1)(d) 2.29Deposits with credit institutions 3.93Other current assets 2.02 100.00

PYRFORD GLOBAL TOTAL RETURN (US$) FUND Schedule of Investments as at 31 December 2016
102
Shares Fair Value
USD Fund %
Transferable Securities (98.07%) (2015: 96.19%)
Equities (26.12%) (2015: 26.55%)
1,175 Brambles Limited 10,527 0.35 640 Computershare Limited 5,761 0.19 414 Woodside Petroleum Limited 9,320 0.31 237 Woolworths Limited 4,127 0.13 _____________________ _________________________
29,735 0.98 _____________________ _________________________
1,700 VTech Holdings Limited 22,734 0.75 _____________________ _________________________
127 Canadian National Railway Co 8,657 0.29 178 Imperial Oil Limited 6,233 0.21 301 Metro Inc 8,990 0.30 150 Saputo Inc 5,292 0.17 _____________________ _________________________
29,172 0.97 _____________________ _________________________
2,300 ASM Pacific Technology Limited 24,366 0.81 _____________________ _________________________
61 Air Liquide SA 6,725 0.22 105 Sanofi SA 8,444 0.28 123 Total SA* 6,281 0.21 _____________________ _________________________
21,450 0.71 _____________________ _________________________
161 Fuchs Petrolub SE 6,786 0.22 85 SAP SE 7,427 0.25 _____________________ _________________________
14,213 0.47 _____________________ _________________________
2,500 China Mobile Limited 26,501 0.88 _____________________ _________________________
3,760 Bezeq The Israeli Telecommunication Corporation Limited 7,166 0.24
184 Teva Pharmaceutical Industries Limited 6,625 0.22 _____________________ _________________________
13,791 0.46 _____________________ _________________________
100 ABC-Mart Inc 5,661 0.19 107 Japan Tobacco Inc 3,517 0.12 200 KDDI Corporation 5,061 0.17 1,000 Mitsubishi Electric Corporation 13,934 0.46 200 Sumitomo Rubber Industries Limited 3,174 0.10 _____________________ _________________________
31,347 1.04 _____________________ _________________________
*Rights attached to the Total SA equity, with expiry date of 16 January 2017 and zero valuation as at 31 December 2016.
Australia (0.98%) (2015: 0.98%)
Belgium Nil (2015: 0.22%)
Bermuda (0.75%) (2015: 0.76%)
Canada (0.97%) (2015: 0.95%)
Cayman Islands (0.81%) (2015: 0.76%)
France (0.71%) (2015: 0.58%)
Germany (0.47%) (2015: 0.40%)
Hong Kong (0.88%) (2015: 0.94%)
Israel (0.46%) (2015: 0.68%)
Japan (1.04%) (2015: 0.56%)

PYRFORD GLOBAL TOTAL RETURN (US$) FUND Schedule of Investments as at 31 December 2016 cont /d
103
Shares Fair Value
USD Fund %
Transferable Securities (98.07%) (2015: 96.19%) co nt/d
Equities (26.12%) (2015: 26.55%) cont/d
17,074 Axiata Group BHD 17,964 0.59 5,946 Malayan Banking BHD 10,869 0.36 _____________________ _________________________
28,833 0.95 _____________________ _________________________
165 Unilever NV 6,775 0.22 _____________________ _________________________
709 Telenor ASA 10,655 0.35 _____________________ _________________________
6,000 Comfortdelgro Corporation Limited 10,257 0.34 7,000 Singapore Technologies Engineering Limited 15,648 0.52 1,000 United Overseas Bank Limited 14,119 0.47 _____________________ _________________________
40,024 1.33 _____________________ _________________________
369 Assa Abloy AB 6,904 0.23 591 Atlas Copco AB 18,083 0.60 479 Svenska Cellulosa AB SCA 13,541 0.45 _____________________ _________________________
38,528 1.28 _____________________ _________________________
230 Nestle SA 16,505 0.55 121 Novartis AG 8,814 0.29 70 Roche Holding AG 15,988 0.53 10 Syngenta AG 3,979 0.13 20 Zurich Insurance Group AG 5,499 0.18 _____________________ _________________________
50,785 1.68 _____________________ _________________________
1,099 Advantech Co Limited 8,679 0.29 7,000 Chunghwa Telecom Co Limited 22,045 0.73 _____________________ _________________________
30,724 1.02 _____________________ _________________________
1,046 BP Plc 6,511 0.21 100 British American Tobacco Plc 5,658 0.19 360 Glaxosmithkline Plc 6,889 0.23 1,500 Legal & General Group Plc 4,521 0.15 217 Royal Dutch Shell Plc 5,952 0.20 240 SSE Plc 4,582 0.15 1,036 Vodafone Group Plc 2,533 0.08 _____________________ _________________________
36,646 1.21 _____________________ _________________________
325 Altria Group Inc 22,051 0.73 137 American Express Co 10,127 0.33 179 Automatic Data Processing Inc 18,518 0.61
Malaysia (0.95%) (2015: 1.26%)
Netherlands (0.22%) (2015: 0.20%)
Norway (0.35%) (2015: 0.39%)
Singapore (1.33%) (2015: 1.31%)
Sweden (1.28%) (2015: 1.17%)
Switzerland (1.68%) (2015: 1.86%)
Taiwan (1.02%) (2015: 1.04%)
United Kingdom (1.21%) (2015: 1.26%)
United States (11.01%) (2015: 11.23%)

PYRFORD GLOBAL TOTAL RETURN (US$) FUND Schedule of Investments as at 31 December 2016 cont /d
104
Shares Fair Value
USD Fund %
Transferable Securities (98.07%) (2015: 96.19%) co nt/d
Equities (26.12%) (2015: 26.55%) cont/d United States (11.01%) (2015: 11.23%) cont/d 384 CH Robinson Worldwide Inc 28,312 0.94 592 Coach Inc 20,726 0.69 296 Exxon Mobil Corporation 26,744 0.89 176 General Dynamics Corporation 30,485 1.01 123 Home Depot Inc 16,617 0.55 207 McDonald's Corporation 25,417 0.84 619 Microsoft Corporation 38,935 1.29 364 Philip Morris International Inc 33,390 1.11 132 Rockwell Automation Inc 17,800 0.59 444 T Rowe Price Group Inc 33,540 1.11 141 Wal-Mart Stores Inc 9,766 0.32 _____________________ _________________________
332,428 11.01 _____________________ _________________________
Total Equities 788,707 26.12 _____________________ _________________________
Bonds (71.95%) (2015: 61.13%)
Principal Amount
Fair Value USD Fund %
CAD 144,000 Canadian Government Bond 4.250 due 01/06/2018 112,143 3.72 304,000 Canadian Government Bond 1.250 due 01/09/2018 227,460 7.53 142,000 Canadian Government Bond 3.750 due 01/06/2019 112,744 3.73 _____________________ _________________________
452,347 14.98 _____________________ _________________________
GBP 217,000 United Kingdom Gilt 8.750 due 25/08/2017 282,463 9.35 _____________________ _________________________
USD 308,000 United States Treasury Bond 8.875 due 15/08/2017 323,593 10.72 128,000 United States Treasury Note 2.750 due 31/05/2017 129,120 4.28 129,000 United States Treasury Note 2.500 due 30/06/2017 130,199 4.31 268,000 United States Treasury Note 1.375 due 30/09/2018 268,953 8.91 265,000 United States Treasury Note 1.000 due 15/10/2019 262,019 8.68 172,000 United States Treasury Note 2.000 due 30/09/2020 173,767 5.75 149,000 United States Treasury Note 2.125 due 30/09/2021 150,042 4.97 _____________________ _________________________
1,437,693 47.62 _____________________ _________________________
Total Bonds 2,172,503 71.95 _____________________ _________________________
Total Transferable Securities 2,961,210 98.07 _____________________ _________________________
Fair Value
USD Fund % Portfolio of Investments 2,961,210 98.07Other Net Assets 58,201 1.93
Net Assets 3,019,411 100.00
Canada (14.98%) (2015: 14.00%)
United Kingdom (9.35%) (2015: 8.18%)
United States (47.62%) (2015: 47.46%)

PYRFORD GLOBAL TOTAL RETURN (US$) FUND Schedule of Investments as at 31 December 2016 cont /d
105
Total assets comprised as follows:
% oftotal
assetsTransferable securities admitted to an official stock exchange listing 86.48Transferable securities other than those admitted to an official stock exchange or dealt with in another regulated market 9.26Deposits with credit institutions 3.18Other current assets 1.08 100.00

PYRFORD GLOBAL EQUITY (STERLING) FUND Schedule of Investments as at 31 December 2016
106
Shares Fair Value
GBP Fund %
Transferable Securities (97.00%) (2015: 96.33%)
Equities (97.00%) (2015: 96.33%)
1,935 Brambles Limited 14,092 1.71 1,535 Computershare Limited 11,233 1.37 436 Newcrest Mining Limited 5,185 0.63 978 QBE Insurance Group Limited 7,134 0.87 163 Rio Tinto Limited 5,734 0.70 1,084 Telstra Corporation Limited 3,247 0.39 673 Woodside Petroleum Limited 12,316 1.50 865 Woolworths Limited 12,243 1.49 _____________________ _________________________
71,184 8.66 _____________________ _________________________
1,175 VTech Holdings Limited 12,773 1.55 _____________________ _________________________
174 Canadian National Railway Co 9,641 1.17 244 Imperial Oil Limited 6,946 0.84 412 Metro Inc 10,003 1.22 195 Saputo Inc 5,592 0.68 _____________________ _________________________
32,182 3.91 _____________________ _________________________
1,319 ASM Pacific Technology Limited 11,358 1.38 _____________________ _________________________
136 Air Liquide SA 12,188 1.48 199 Sanofi SA 13,010 1.58 214 Total SA* 8,882 1.08 _____________________ _________________________
34,080 4.14 _____________________ _________________________
258 Fuchs Petrolub SE 8,840 1.08 114 SAP SE 8,097 0.98 _____________________ _________________________
16,937 2.06 _____________________ _________________________
1,678 China Mobile Limited 14,458 1.76 9,030 Cnooc Limited 9,182 1.11 1,043 Power Assets Holdings Limited 7,473 0.91 _____________________ _________________________
31,113 3.78 _____________________ _________________________
1,856 Bezeq The Israeli Telecommunication Corporation Limited 2,875 0.35
83 Teva Pharmaceutical Industries Limited 2,429 0.29 _____________________ _________________________
5,304 0.64 _____________________ _________________________
100 ABC-Mart Inc 4,602 0.56 200 Japan Tobacco Inc 5,344 0.65 300 KDDI Corporation 6,171 0.75 *Rights attached to the Total SA equity, with expiry date of 16 January 2017 and zero valuation as at 31 December 2016.
Australia (8.66%) (2015: 8.74%)
Belgium Nil (2015: 1.07%) Bermuda (1.55%) (2015: 1.34%)
Canada (3.91%) (2015: 3.91%)
Cayman Islands (1.38%) (2015: 1.32%)
France (4.14%) (2015: 2.75%)
Germany (2.06%) (2015: 1.87%)
Hong Kong (3.78%) (2015: 3.56%)
Israel (0.64%) (2015: 1.05%)
Japan (3.62%) (2015: 4.27%)

PYRFORD GLOBAL EQUITY (STERLING) FUND Schedule of Investments as at 31 December 2016 cont /d
107
Shares Fair Value
GBP Fund %
Transferable Securities (97.00%) (2015: 96.33%) co nt/d
Equities (97.00%) (2015: 96.33%) cont/d
136 Mitsubishi Electric Corporation 1,540 0.19 200 Nihon Kohden Corporation 3,596 0.44 317 Sumitomo Rubber Industries Limited 4,090 0.49 209 Toyota Tsusho Corporation 4,424 0.54 _____________________ _________________________
29,767 3.62 _____________________ _________________________
19,220 Axiata Group BHD 16,438 2.00 6,600 Magnum BHD 2,595 0.32 8,922 Malayan Banking BHD 13,257 1.61 _____________________ _________________________
32,290 3.93 _____________________ _________________________
300 Unilever NV 10,014 1.22 _____________________ _________________________
709 Telenor ASA 8,661 1.05 _____________________ _________________________
3,307 Comfortdelgro Corporation Limited 4,595 0.56 2,820 SembCorp Industries Limited 4,522 0.55 6,486 Singapore Technologies Engineering Limited 11,786 1.43 1,271 United Overseas Bank Limited 14,587 1.77 1,000 Venture Corporation Limited 5,558 0.68 _____________________ _________________________
41,048 4.99 _____________________ _________________________
292 Assa Abloy AB 4,441 0.54 468 Atlas Copco AB 11,640 1.42 412 Svenska Cellulosa AB SCA 9,468 1.15 _____________________ _________________________
25,549 3.11 _____________________ _________________________
2 Givaudan SA 2,974 0.36 334 Nestle SA 19,483 2.37 281 Novartis AG 16,639 2.02 41 Panalpina Welttransport Holding AG 4,161 0.51 102 Roche Holding AG 18,937 2.30 30 Schindler Holding AG 4,293 0.52 14 Syngenta AG 4,528 0.55 44 Zurich Insurance Group AG 9,835 1.20 _____________________ _________________________
80,850 9.83 _____________________ _________________________
1,000 Advantech Co Limited 6,419 0.78 5,000 Chunghwa Telecom Co Limited 12,800 1.56 2,000 Mediatek Inc 10,921 1.33
Japan (3.62%) (2015: 4.27%) cont/d
Malaysia (3.93%) (2015: 5.06%)
Netherlands (1.22%) (2015: 0.93%)
Norway (1.05%) (2015: 1.05%)
Singapore (4.99%) (2015: 5.07%)
Sweden (3.11%) (2015: 2.26%)
Switzerland (9.83%) (2015: 10.26%)
Taiwan (4.11%) (2015: 4.64%)

PYRFORD GLOBAL EQUITY (STERLING) FUND Schedule of Investments as at 31 December 2016 cont /d
108
Shares Fair Value
GBP Fund %
Transferable Securities (97.00%) (2015: 96.33%) co nt/d
Equities (97.00%) (2015: 96.33%) cont/d
1,000 Merida Industry Co Limited 3,632 0.44 _____________________ _________________________
33,772 4.11 _____________________ _________________________
1,487 BP Plc 7,524 0.92 219 British American Tobacco Plc 10,072 1.22 704 Glaxosmithkline Plc 10,951 1.33 3,824 Legal & General Group Plc 9,369 1.14 392 Royal Dutch Shell Plc 8,740 1.06 519 SSE Plc 8,055 0.98 3,545 Vodafone Group Plc 7,044 0.86 _____________________ _________________________
61,755 7.51 _____________________ _________________________
320 Altria Group Inc 17,649 2.15 131 American Express Co 7,872 0.96 166 Automatic Data Processing Inc 13,959 1.70 363 CH Robinson Worldwide Inc 21,756 2.65 573 Coach Inc 16,307 1.98 269 Exxon Mobil Corporation 19,756 2.40 160 General Dynamics Corporation 22,528 2.74 117 Home Depot Inc 12,849 1.56 208 McDonald's Corporation 20,761 2.52 587 Microsoft Corporation 30,013 3.65 330 Philip Morris International Inc 24,607 2.99 132 Rockwell Automation Inc 14,469 1.76 448 T Rowe Price Group Inc 27,509 3.35 161 Wal-Mart Stores Inc 9,064 1.10 _____________________ _________________________
259,099 31.51 _____________________ _________________________
Total Equities 797,736 97.00 _____________________ _________________________
Total Transferable Securities 797,736 97.00 _____________________ _________________________
Financial Derivative Instruments (0.20%) (2015: (0. 09)%)
Forward Foreign Currency Exchange Contracts (0.20%) (2015: (0.09)%)
Settlement Date
Currency Bought
Amount Bought
Currency Sold
Amount Sold
Unrealised Gain (Loss)
GBP Fund
% _____________________ ____________________________________________ _____________________________________________ _____________________ _________________________
14/03/2017 GBP 75,550 AUD 122,000 4,141 0.5014/03/2017 GBP 80,780 CHF 104,000 (2,486) (0.30)
_____________________ _________________________
1,655 0.20 _____________________ _________________________
Unrealised gain on forward foreign currency exchange contracts 4,141 0.50 _____________________ _________________________
Unrealised loss on forward foreign currency exchange contracts (2,486) (0.30) _____________________ _________________________
Net unrealised gain on forward foreign currency exc hange contracts 1,655 0.20 _____________________ _________________________
Taiwan (4.11%) (2015: 4.64%) cont/d
United Kingdom (7.51%) (2015: 7.17%)
United States (31.51%) (2015: 30.01%)

PYRFORD GLOBAL EQUITY (STERLING) FUND Schedule of Investments as at 31 December 2016 cont /d
109
Fair Value
GBP Fund % Portfolio of Investments 799,391 97.20Other Net Assets 22,975 2.80 _____________________ _________________________
Net Assets 822,366 100.00 _____________________ _________________________
The counterparty for the open forward currency exchange contracts is State Street Bank and Trust Company, London
Total assets comprised as follows:
% oftotal
assetsTransferable securities admitted to an official stock exchange listing 94.48Over the counter financial derivative instruments 0.49Deposits with credit institutions 3.78Other current assets 1.25 100.00

PYRFORD GLOBAL EQUITY (EURO) FUND Schedule of Investments as at 31 December 2016
110
Shares Fair Value
EUR Fund
%
Transferable Securities (99.11%) (2015: 98.46%)
Equities (99.11%) (2015: 98.46%)
1,616 Brambles Limited 13,710 1.61 1,488 Computershare Limited 12,685 1.49 317 Newcrest Mining Limited 4,392 0.52 878 QBE Insurance Group Limited 7,461 0.88 163 Rio Tinto Limited 6,680 0.78 995 Telstra Corporation Limited 3,472 0.41 602 Woodside Petroleum Limited 12,834 1.51 734 Woolworths Limited 12,103 1.42 _____________________ _________________________
73,337 8.62 _____________________ _________________________
875 VTech Holdings Limited 11,081 1.30 _____________________ _________________________
158 Canadian National Railway Co 10,199 1.20 221 Imperial Oil Limited 7,328 0.86 374 Metro Inc 10,578 1.25 181 Saputo Inc 6,047 0.71 _____________________ _________________________
34,152 4.02 _____________________ _________________________
1,219 ASM Pacific Technology Limited 12,229 1.44 _____________________ _________________________
106 Air Liquide SA 11,066 1.30 169 Sanofi SA 12,871 1.51 173 Total SA 8,366 0.99 _____________________ _________________________
32,303 3.80 _____________________ _________________________
259 Fuchs Petrolub SE 10,338 1.22 128 SAP SE 10,591 1.24 _____________________ _________________________
20,929 2.46 _____________________ _________________________
1,678 China Mobile Limited 16,844 1.98 8,030 Cnooc Limited 9,512 1.12 1,043 Power Assets Holdings Limited 8,705 1.02 _____________________ _________________________
35,061 4.12 _____________________ _________________________
1,723 Bezeq The Israeli Telecommunication Corporation Limited 3,110 0.36
77 Teva Pharmaceutical Industries Limited 2,625 0.31 _____________________ _________________________
5,735 0.67 _____________________ _________________________
100 ABC-Mart Inc 5,361 0.63 191 Japan Tobacco Inc 5,945 0.70 200 KDDI Corporation 4,793 0.56 *Rights attached to the Total SA equity, with expiry date of 16 January 2017 and zero valuation as at 31 December 2016.
Australia (8.62%) (2015: 8.29%)
Belgium Nil (2015: 1.16%)
Bermuda (1.30%) (2015: 1.07%)
Canada (4.02%) (2015: 3.86%)
Cayman Islands (1.44%) (2015: 1.31%)
France (3.80%) (2015: 3.11%)
Germany (2.46%) (2015: 2.19%)
Hong Kong (4.12%) (2015: 3.68%)
Israel (0.67%) (2015: 1.04%)
Japan (3.76%) (2015: 4.53%)

PYRFORD GLOBAL EQUITY (EURO) FUND Schedule of Investments as at 31 December 2016 cont /d
111
Shares Fair Value
EUR Fund
%
Transferable Securities (99.11%) (2015: 98.46%) co nt/d
Equities (99.11%) (2015: 98.46%) cont/d
136 Mitsubishi Electric Corporation 1,794 0.21 200 Nihon Kohden Corporation 4,190 0.49 317 Sumitomo Rubber Industries Limited 4,764 0.56 209 Toyota Tsusho Corporation 5,153 0.61 _____________________ _________________________
32,000 3.76 _____________________ _________________________
18,474 Axiata Group BHD 18,407 2.16 6,000 Magnum BHD 2,749 0.32 7,797 Malayan Banking BHD 13,496 1.59 _____________________ _________________________
34,652 4.07 _____________________ _________________________
264 Unilever NV 10,266 1.21 _____________________ _________________________
662 Telenor ASA 9,421 1.11 _____________________ _________________________
3,307 Comfortdelgro Corporation Limited 5,353 0.63 2,977 SembCorp Industries Limited 5,561 0.65 6,086 Singapore Technologies Engineering Limited 12,884 1.52 1,271 United Overseas Bank Limited 16,993 2.00 543 Venture Corporation Limited 3,516 0.41 _____________________ _________________________
44,307 5.21 _____________________ _________________________
268 Assa Abloy AB 4,748 0.56 430 Atlas Copco AB 12,460 1.46 348 Svenska Cellulosa AB SCA 9,316 1.10 _____________________ _________________________
26,524 3.12 _____________________ _________________________
2 Givaudan SA 3,464 0.41 308 Nestle SA 20,931 2.46 257 Novartis AG 17,728 2.08 40 Panalpina Welttransport Holding AG 4,729 0.55 96 Roche Holding AG 20,764 2.44 29 Schindler Holding AG 4,834 0.57 14 Syngenta AG 5,275 0.62 43 Zurich Insurance Group AG 11,196 1.32 _____________________ _________________________
88,921 10.45 _____________________ _________________________
1,000 Advantech Co Limited 7,478 0.88 4,000 Chunghwa Telecom Co Limited 11,929 1.40 2,000 Mediatek Inc 12,723 1.50
Japan (3.76%) (2015: 4.53%) cont/d
Malaysia (4.07%) (2015: 4.96%)
Netherlands (1.21%) (2015: 1.06%)
Norway (1.11%) (2015: 1.04%)
Singapore (5.21%) (2015: 5.98%)
Sweden (3.12%) (2015: 2.06%)
Switzerland (10.45%) (2015: 10.29%)
Taiwan (4.28%) (2015: 4.61%)

PYRFORD GLOBAL EQUITY (EURO) FUND Schedule of Investments as at 31 December 2016 cont /d
112
Shares Fair Value
EUR Fund
%
Transferable Securities (99.11%) (2015: 98.46%) co nt/d
Equities (99.11%) (2015: 98.46%)
1,000 Merida Industry Co Limited 4,231 0.50 _____________________ _________________________
36,361 4.28 _____________________ _________________________
1,218 BP Plc 7,180 0.85 234 British American Tobacco Plc 12,537 1.47 698 Glaxosmithkline Plc 12,648 1.49 2,677 Legal & General Group Plc 7,641 0.90 307 Royal Dutch Shell Plc 7,974 0.94 401 SSE Plc 7,250 0.85 3,059 Vodafone Group Plc 7,081 0.83 _____________________ _________________________
62,311 7.33 _____________________ _________________________
294 Altria Group Inc 18,890 2.22 119 American Express Co 8,330 0.98 154 Automatic Data Processing Inc 15,086 1.77 342 CH Robinson Worldwide Inc 23,879 2.81 485 Coach Inc 16,079 1.89 261 Exxon Mobil Corporation 22,331 2.63 147 General Dynamics Corporation 24,112 2.84 101 Home Depot Inc 12,922 1.52 188 McDonald's Corporation 21,860 2.57 486 Microsoft Corporation 28,948 3.40 311 Philip Morris International Inc 27,015 3.18 117 Rockwell Automation Inc 14,941 1.76 406 T Rowe Price Group Inc 29,043 3.40 152 Wal-Mart Stores Inc 9,969 1.17 _____________________ _________________________
273,405 32.14 _____________________ _________________________
Total Equities 842,995 99.11 _____________________ _________________________
Total Transferable Securities 842,995 99.11 _____________________ _________________________
Financial Derivative Instruments ((0.07)%) (2015 (0 .50)%)
Forward Foreign Currency Exchange Contracts ((0.07) %) (2015 (0.50)%)
Settlement Date
Currency Bought
Amount Bought
Currency Sold
Amount Sold
Unrealised Gain/(Loss)
EUR Fund % _____________________ ____________________________________________ _____________________________________________ _____________________ _________________________
14/03/2017 EUR 65,404 AUD 97,000 (618) (0.07) _____________________ _________________________
Net unrealised (loss) on forward foreign currency e xchange contracts (618) (0.07) _____________________ _________________________
Fair Value
EUR Fund % Portfolio of Investments 842,377 99.04Other Net Assets 8,145 0.96 _____________________ _________________________
Net Assets 850,522 100.00 _____________________ _________________________
The counterparty for the open forward currency exchange contracts is State Street Bank and Trust Company, London.
Taiwan (4.28%) (2015: 4.61%) cont/d
United Kingdom (7.33%) (2015: 8.29%)
United States (32.14 %) (2015: 29.93%)

PYRFORD GLOBAL EQUITY (EURO) FUND Schedule of Investments as at 31 December 2016 cont /d
113
Total assets comprised as follows:
% oftotal
assetsTransferable securities admitted to an official stock exchange listing a 95.76Deposits with credit institutions 2.90Other current assets 1.34 100.00

BMO INVESTMENTS (IRELAND) PLC Supplemental Unaudited Information
114
1. Exchange Rates
The exchange rates as at 31 December 2016 were:
Currency Vs. USD
Rate Vs. GBP
Rate Vs. EUR
Rate Australian Dollar 1.3841 1.7027 1.4616
British Pound 0.8129 1.0000 0.8584
Canadian Dollar 1.3473 1.6574 1.4227
Czech Koruna 25.5876 31.4779 27.0205
Danish Krone 7.0402 8.6609 7.4344
Euro 0.9470 1.1650 1.0000
Hong Kong Dollar 7.7546 9.5396 8.1888
Hungarian Forint 293.3618 360.8936 309.7899
Indonesian Rupiah 13,472.5000 16,573.8686 14,226.9554
Israeli Shekel 3.8410 4.7252 4.0561
Japanese Yen 116.9450 143.8657 123.4939
Malaysian Ringgit 4.4860 5.5187 4.7372
New Zealand Dollar 1.4362 1.7668 1.5166
Norwegian Krone 8.6037 10.5843 9.0855
Philippine Peso 49.7125 61.1563 52.4964
Singapore Dollar 1.4449 1.7775 1.5258
South Korean Won 1,207.8000 1,485.8355 1,275.4364
Swedish Krona 9.0594 11.1449 9.5667
Swiss Franc 1.0180 1.2523 1.0750
Taiwan Dollar 32.2290 39.6481 34.0338
Thai Baht 35.8105 44.0541 37.8159
United States Dollar 1.0000 1.2302 1.0560
The Administrator used average exchange rates of GBP 0.7407 (financial year ended 31 December 2015: 0.6547) and EUR 0.9074 (financial year ended 31 December 2015: 0.9003) to translate the Pyrford Global Total Return (Sterling) Fund’s, Pyrford Global Total Return (Euro) Fund’s, Pyrford Global Equity (Sterling) Fund’s and Pyrford Global Equity (Euro) Fund’s Statement of Comprehensive Income into USD and EUR respectively, for the purpose of preparing the Statement of Comprehensive Income.
The exchange rates as at 31 December 2015 were:
Currency Vs. USD
Rate Vs. GBP
Rate Vs. EUR
Rate Australian Dollar 1.3745 2.0258 1.4931 British Pound 0.6785 1.0000 0.7370 Canadian Dollar 1.3891 2.0474 1.5090 Czech Koruna 24.8753 36.6637 27.0220 Danish Krone 6.8698 10.1254 7.4627 Euro 0.9206 1.3568 1.0000 Hong Kong Dollar 7.7502 11.4229 8.4190 Hungarian Forint 290.9004 428.7580 316.0050 Indonesian Rupiah 13,785.0000 20,317.7139 14,974.6458 Israeli Shekel 3.8911 5.7350 4.2268 Japanese Yen 120.2950 177.3028 130.6765 Malaysian Ringgit 4.2935 6.3282 4.6640 New Zealand Dollar 1.4607 2.1529 1.5868 Norwegian Krone 8.8514 13.0460 9.6152 Philippine Peso 47.0550 69.3544 51.1158 Singapore Dollar 1.4187 2.0909 1.5411 South Korean Won 1,172.5500 1,728.2217 1,273.7411

BMO INVESTMENTS (IRELAND) PLC Supplemental Unaudited Information
115
1. Exchange Rates cont/d
Swedish Krona 8.4306 12.4259 9.1582 Swiss Franc 1.0010 1.4754 1.0874 Taiwan Dollar 32.8470 48.4132 35.6817 Thai Baht 35.9850 53.0382 39.0905 United States Dollar 1.0000 1.4739 1.0863
2. Soft Commission
Neither the Investment Manager nor the Sub-Investment Managers entered into any soft commission arrangements during the financial year ended 31 December 2016 or the financial year ended 31 December 2015.
3. Securities lending
No securities lending took place during the financial year ended 31 December 2016 (2015: Nil).
4. Direct brokerage There was no direct brokerage services utilised for the financial year ended 31 December 2016 (2015: Nil).
5. Off balance sheet transactions
There were no off balance sheet transactions, other than those disclosed in the financial statements, for the Company at 31 December 2016 (2015: Nil).
6. Contingent liabilities
As at 31 December 2016 and 31 December 2015 the Company did not have any contingent liabilities. 7. Remuneration Policy
In line with the requirements of the UCITS Regulations, the Company has adopted a remuneration policy which is consistent with the principles outlined in the ESMA guidelines on sound remuneration policies under the UCITS Directive (the “Remuneration Guidelines”). The remuneration policy is appropriate to the Company’s size, internal organisation and the nature, scope and complexity of its activities. The Company’s remuneration policy applies to certain identified staff whose professional activities have a material impact on the risk profile of the Company. As at 31 December 2016, the Company did not have any employees and the Company’s remuneration policy applies only to members of the Company’s management body (i.e., the board of directors). The Directors not affiliated with the Investment Manager receive a fixed annual fee which is in line with the fees paid by other Irish funds and compensates these Directors for their tasks, expertise and responsibilities. Directors that are employees of the Investment Manager (or an affiliate) are not paid any fees for their services as Directors. The Company also pays to KB Associates a fixed fee for the provision of the designated persons to the Company. Quantitative remuneration disclosures as required by paragraphs (a) and (b) of Regulation 89(3A) of the UCITS Regulations will be included in the financial statements for the year ending 31 December 2017. The disclosures required by paragraphs (c) and (d) of Regulation 24(B) of the UCITS Regulations will also be made at this time following the first annual review of the remuneration policy. The remuneration policy was amended to take account of the issue of Remuneration Guidelines in October 2016, and in particular the requirements in relation to delegated management functions, but no other material changes have been made to the remuneration policy since its adoption.
8. Securities Financing Transactions Regulation The Securities Financing Transactions Regulation (Regulation (EU) 2015/2365) (“SFTR”) came into force on 12 January 2016 and, amongst other requirements, introduces new disclosure requirements in annual and interim financial statements published after 13 January 2017, detailing the use of securities financing transactions. The Sub-Funds were not invested in any securities financing transactions pursuant to Regulation (EU) 2015/2365 during the financial year ended 31 December 2016, and no additional disclosures have been included in the financial statements.

BMO INVESTMENTS (IRELAND) PLC Supplemental Unaudited Information cont/d
116
9. Net asset value per redeemable participating sh are As at 31 December 2016
BMO Global Low Volatility Alpha Equity
Fund
Pyrford Asia Pacific ex-
Japan Equity Fund
Pyrford Global Total Return
(Sterling) Fund
Pyrford Global Total Return
(Sterling) Fund
Pyrford Global Total Return
(Sterling) Fund
Pyrford Global Total Return
(Sterling) Fund
Pyrford Global Total Return
(Sterling) Fund Class A US$ Class A US$ Class A Stg£ Class A Stg£ Class B Stg£ Class B Stg£* Class C Stg£ Accumulating Accumulating Accumulating Distributing Accumulating Distributing Accumulating
Net asset value per dealing prices $16.47 $12.14 £15.27 £11.26 £11.18 £10.69 £11.06 Net asset value per redeemable participating share, based on dealing prices $1,642,943 $1,214,256 £1,996,360,837 £74,216,864 £15,073,916 £903,590 £62,759,831
Pyrford Global
Total Return (Sterling) Fund
Pyrford Global
Total Return (Sterling) Fund
Pyrford Global
Equity (US$) Fund
Pyrford International
(EAFE) Equity Fund
Pyrford Shariah Global Equity
Fund
Pyrford Global Total Return (Euro) Fund
Pyrford Global Total Return
(US$) Fund Class C Stg£ Class D Stg£** Class A US $ Class A US$ Class A US$ Class A Euro € Class A US$ Distributing Distributing Distributing Accumulating Accumulating Accumulating Accumulating Net asset value per dealing prices £10.91 £10.76 $10.34 $13.23 $13.63 €11.53 $10.06 Net asset value per redeemable participating share, based on dealing prices £27,684,710 £201,323,227 $3,521,674 $20,406,765 $1,906,255 €2,738,373 $3,019,411 *This Share Class launched on 26 April 2016. **This Share Class launched on 16 June 2016.

BMO INVESTMENTS (IRELAND) PLC Supplemental Unaudited Information cont/d
117
9. Net asset value per redeemable participating sh are cont/d As at 31 December 2016 cont/d
Monegy Global High Yield Bond
Fund*
Pyrford Global Equity
(Sterling) Fund
Pyrford Global Equity (Euro)
Fund Class A US$ Class A Stg£ Class A Euro € Accumulating Accumulating Accumulating Net asset value per dealing prices - £12.04 €10.24 Net asset value per redeemable participating share, based on dealing prices - £822,366 €850,522
*This Sub-Fund was fully redeemed on 30 November 2016.
As at 31 December 2015
BMO Global Low Volatility Alpha Equity
Fund
Pyrford Asia Pacific ex-
Japan Equity Fund
Pyrford Global Total Return
(Sterling) Fund
Pyrford Global Total Return
(Sterling) Fund
Pyrford Global Total Return
(Sterling) Fund
Pyrford Global Total Return
(Sterling) Fund
Pyrford Global Total Return
(Sterling) Fund Class A US$ Class A US$ Class A Stg£ Class A Stg£ Class B Stg£ Class C Stg£ Class C Stg£ Accumulating Accumulating Accumulating Distributing Accumulating Accumulating Distributing
Net asset value per dealing prices $1,552,089 $1,108,907 £2,115,971,805 £56,363,288 £2,645,755 £27,097,958 £4,427,604 Net asset value per redeemable participating share, based on dealing prices
$15.52 $11.09 £13.97
£10.45
£10.20
£10.07
£10.07

BMO INVESTMENTS (IRELAND) PLC Supplemental Unaudited Information cont/d
118
9. Net asset value per redeemable participating sh are cont/d
As at 31 December 2015 cont/d
Pyrford Global Equity (US$)
Fund
Pyrford International
(EAFE) Equity Fund
Pyrford Shariah Global
Equity Fund
Pyrford Global Total Return (Euro) Fund
Pyrford Global Total Return
(US$) Fund
Monegy Global High Yield Bond
Fund
Pyrfor d Global Equity
(Sterling) Fund*
Class A US$ Class A US$ Class A US$ Class A Euro € Class A US$ Class A US$ Class A Stg£ Distributing Accumulating Accumulating Accumulating Accumulating Accumulating Accumulating
Net asset value per dealing prices
$2,359,328 $20,140,567 $1,744,872 €2,693,426 $3,006,688
$9,483,215
£615,850 Net asset value per redeemable participating share, based on dealing prices
$9.69 $13.05 $12.48 €11.34 $10.02 $9.48
£9.57
Pyrford Global Equity (Euro)
Fund* Class A Euro € Accumulating
Net asset value per dealing prices
€781,603 Net asset value per redeemable participating share, based on dealing prices
€9.41
*These Sub-Funds commenced trading on 19 March 2015.

BMO INVESTMENTS (IRELAND) PLC Supplemental Unaudited Information cont/d
119
9. Net asset value per redeemable participating sh are cont/d Reconciliation to Dealing Net Asset Value as at 31 December 2014
BMO Global Low Volatility Alpha Equity
Fund
Pyrford Asia Pacific ex-
Japan Equity Fund
Pyrford Global Total Return
(Sterling) Fund
Pyrford Global Total Return
(Sterling) Fund
Pyrford Global Equity (US$)
Fund
Pyrford Global Equity (US$)
Fund
Pyrford Global
Equity (US$) Fund*
Class A US$ Class A US$ Class A Stg£ Class A Stg£ Class A Stg£ Class A Euro € Class A USD Accumulating Accumulating Accumulating Distributing Distributing Distributing Distributing Net asset value per financial statements $1,535,650 $1,281,337 £2,108,765,675 £45,701,171 £379,723 €490,415 $2,000,000
Adjustment to dealing valuation* - - - - - - ($2,000,000)
Net asset value per dealing prices $1,535,650 $1,281,337 £2,108,765,675 £45,701,171 £379,723 €490,415 - Net asset value per redeemable participating share, based on dealing prices
$15.36 $12.81 £13.77
£10.63
£12.66
€14.93
$10.00 *Adjustment to dealing valuation for fund shares sold on 31 December 2014, settlement date 07 January 2015.
Pyrford International
(EAFE) Equity Fund
Pyrford Shariah Global Equity
Fund
BMO Global Commodities
Fund**
Pyrford Global Total Return (Euro) Fund
Pyrford Global Total Return
(US$) Fund
Monegy Global High Yield Bond
Fund Class A US$ Class A US$ Class A US$ Class A Euro € Class A US$ Class A US$ Accumulating Accumulating Accumulating Accumulating Accumulating Accumulating Net asset value per financial statements $20,990,969 $1,839,055 - €2,442,829 $3,112,980
$9,859,307
Adjustment to dealing valuation - - - - - -
Net asset value per dealing prices $20,990,969 $1,839,055 - €2,442,829 $3,112,980 $9,859,307 Net asset value per redeemable participating share, based on dealing prices $13.60 $13.15 - €10.97 $10.38 $9.86 **The Sub-Fund was fully redeemed during the financial year ended 31 December 2014.

BMO INVESTMENTS (IRELAND) PLC Statement of Significant Changes on Composition of Portfolio (unaudited)
120
BMO Global Low Volatility Alpha Equity Fund
Acquisition
Disposal
Cost
Proceeds
Portfolio Securities USD
Portfolio Securities USD Discover Financial Services 32,217
Fisher & Paykel Healthcare Corporation Limited
(34,227) Chemed Corporation 27,882 Owens & Minor Inc 27,371 Fresenius Medical Care AG & Co
KGaA (28,279) Sysco Corporation 24,746
Tyson Foods Inc 20,945
Dollarama Inc (27,871) Fresh Del Monte Produce Inc 16,790 AmerisourceBergen Corporation (27,625) Allstate Corporation 15,602
Singapore Telecommunications Limited
(22,863) Cembra Money Bank AG 14,977 Tenaga Nasional BHD 14,657 McKesson Corporation (22,448) KYORIN Holdings Inc 12,636
Cintas Corporporation (22,269)
AT&T Inc 12,548
Laboratory Corporation of America Holdings
(20,932) Entergy Corporation 12,361 Darden Restaurants Inc 12,353 Exelon Corporation (19,475) China Vanke Co Limited 12,127 Fresenius SE & Co KGaA (18,823) Far EasTone Telecommunications Co Limited
11,580 Greggs Plc (18,302) Loblaw Cos Limited (16,907)
Kroger Co 11,436
Entergy Corporation (15,926) Portland General Electric Co 11,291 Next Plc (13,798) American Express Co 11,289
CEZ (13,497)
Pfizer Inc 10,462 Meridian Energy Limited (12,993) Rhoen-Klinikum AG 10,444 Singapore Post Limited (12,671) Wal-Mart Stores Inc 9,850
China Vanke Corporation Limited (12,459)
Valora Holding AG 9,553 Advanced Info Service (11,669) Getty Realty Corporation 9,193
Morinaga Milk Industry Co (11,381)
Children's Place Inc 9,008 Lion Corporation (10,492) VTech Holdings Limited 8,933 DMG Mori AG (10,139) Safety Insurance Group Inc 8,868 AstraZeneca Plc (9,624) Abaxis Inc 8,386 Redde Plc (9,476) China Minsheng Banking Corporation Limited
8,132 EMIS Group Plc
(8,529) Mercury NZ Limited (7,795)
Tsumura & Co 7,861 General Mills Inc (7,731) StarHub Limited 7,419 Dr Pepper Snapple Group Inc (7,641) Huntington Ingalls Industries Inc 7,229 TDC (7,488) PCCW Limited 7,187
PepsiCo Inc
(7,035)
Sonova Holding AG 7,059 American Express Co (6,826) US Physical Therapy Inc 7,009
Reply SpA (6,519)
McKesson Corporation 6,959 Canadian Tire Corporation (6,492) Public Bank BHD 6,798 Significant portfolio changes are defined as the aggregate purchases of a security exceeding one per cent of the total value of purchases for the financial year and aggregate sales of a security exceeding one per cent of the total value of sales for the financial year. At a minimum, the 20 largest purchases and 20 largest sales are to be disclosed.

BMO INVESTMENTS (IRELAND) PLC Statement of Significant Changes on Composition of Portfolio (unaudited)
121
Pyrford Asia Pacific ex-Japan Equity Fund
Acquisition
Disposal
Cost
Proceeds
Portfolio Securities USD
Portfolio Securities USD* Mediatek Inc 20,678 Newcrest Mining Limited (23,103) Woolworths Limited 15,082 ASM Pacific Technology Limited (18,700) United Overseas Bank Limited
13,236
United Overseas Bank Limited (14,692) Computershare Limited 12,342 Taiwan Semiconductor
Manufacturing Co Limited
China Mobile Limited 11,351 (14,537) KEPCO Plant Service & Engineering Co Limited
10,761 VTech Holdings Limited (13,233) Lafarge Malaysia BHD (10,506)
Brambles Limited
10,338 Huchems Fine Chemical Corporation
(9,612) QBE Insurance Group Limited 9,572
Singapore Technologies Comfortdelgro Corporation
Engineering Limited
9,397 Limited (8,512) Merida Industry Co Limited 8,190 Computershare Limited (8,417) Newcrest Mining Limited 7,951 Brambles Limited (8,277) Advantech Co Limited
7,607 Advantech Co Limited
(8,119) Woongjin Coway Co Limited 7,501 Woongjin Coway Co Limited (7,677) SembCorp Industries Limited
6,039 QBE Insurance Group Limited
(7,041) VTech Holdings Limited 5,621 Venture Corporation Limited (6,885) Woodside Petroleum Limited 5,143 Malayan Banking BHD
(6,142) Axiata Group BHD 5,128 Woolworths Limited (4,573) Taiwan Semiconductor Haitian International Holdings
Manufacturing Co Limited 5,025 Limited (4,049) Power Assets Holdings Limited 4,564 Magnum BHD
(1,294) Malayan Banking BHD 4,555 Axiata Group BHD (1,036) Huchems Fine Chemical
Corporation 3,786 Comfortdelgro Corporation 3,411 Chunghwa Telecom Co Limited 3,383 Semen Indonesia Persero Tbk 2,892 Telstra Corporation Limited 2,708 Significant portfolio changes are defined as the aggregate purchases of a security exceeding one per cent of the total value of purchases for the financial year and aggregate sales of a security exceeding one per cent of the total value of sales for the financial year. At a minimum, the 20 largest purchases and 20 largest sales are to be disclosed. * All sales for the financial year ended 31 December 2016 are included.

BMO INVESTMENTS (IRELAND) PLC Statement of Significant Changes on Composition of Portfolio (unaudited)
122
Pyrford Global Total Return (Sterling) Fund
Portfolio Securities
Acquisition Cost GBP Portfolio Securities
Disposal Proceeds
GBP United Kingdom Gilt 2.000% due 22/07/2020 174,385,541
United States Treasury Note 2.750% due 31/05/2017 (184,433,106)
United Kingdom Gilt 1.250% due 22/07/2018 161,120,930
United States Treasury Note 2.500% due 30/06/2017 (174,939,306)
United Kingdom Gilt 1.750% due 22/07/2019 161,075,945
United Kingdom Gilt 4.000 due 07/09/2016 (34,529,976)
United Kingdom Gilt 4.000% due 07/09/2016 159,392,701
United Kingdom Gilt 8.750% due 25/08/2017 (28,174,539)
United Kingdom Gilt 8.750% due 25/08/2017 129,950,835
British American Tobacco Plc
(18,014,702) United Kingdom Gilt
Australia Government Bond 3.250% due 21/10/2018 85,072,835
1.750% due 22/01/2017
(16,223,335) BP Plc (15,832,720)
United Kingdom Gilt 5.000% due 07/03/2018
48,010,343
Glaxosmithkline Plc
(15,464,090) National Grid Plc (12,368,791)
United Kingdom Gilt 1.750% due 22/01/2017 44,146,470
Australia Government Bond 3.250% due 21/10/2018 (12,206,539)
Australia Government Bond 5.250% due 15/03/2019 37,260,385
United Kingdom Gilt 5.000% due 07/03/2018 (12,061,433)
Canadian Government Bond 1.250% due 01/09/2018 36,710,207
SSE Plc
(11,652,347) Vodafone Group Plc (10,012,143)
United Kingdom Gilt 8.000% due 07/06/2021
34,623,517
United Kingdom Gilt
8.000% due 07/06/2021 (9,972,583)
United Kingdom Gilt 4.500% due 07/03/2019 33,686,090
United Kingdom Gilt
4.500% due 07/03/2019 (9,559,531)
Vodafone Group Plc
14,700,525
Canadian Government Bond
Legal & General Group Plc 13,070,217 3.750% due 01/06/2019 (9,523,165) National Grid Plc
12,299,520
Canadian Government Bond
British American Tobacco Plc 10,687,667 4.250% due 01/06/2018 (9,300,776) Glaxosmithkline Plc
9,794,358
ASM Pacific Technology
United Utilities Group Plc 8,976,241 Limited (7,597,665) Sky Plc 8,311,424 United Utilities Group Plc (7,425,464) SSE Plc 7,485,880 VTech Holdings Limited (6,682,445)
Significant portfolio changes are defined as the aggregate purchases of a security exceeding one per cent of the total value of purchases for the financial year and aggregate sales of a security exceeding one per cent of the total value of sales for the financial year. At a minimum, the 20 largest purchases and 20 largest sales are to be disclosed.

BMO INVESTMENTS (IRELAND) PLC Statement of Significant Changes on Composition of Portfolio (unaudited)
123
Pyrford Global Equity (US$) Fund
Portfolio Securities
Acquisition Cost USD Portfolio Securities
Disposal Proceeds
USD* Rockwell Automation Inc 46,847 Linear Technology Corporation (73,619) Roche Holding AG 42,242 Northrop Grumman Corporation (26,591) Wal-Mart Stores Inc 41,442 Colruyt SA (26,257) Philip Morris Home Depot Inc (22,839) International Inc 40,396 Imperial Oil Limited (19,634) CH Robinson Worldwide Inc
40,024
Newcrest Mining Limited
(14,841)
Canadian National Railway Co 39,841 Metro Inc (13,930) Nestle SA 37,057 Microsoft Corporation (12,390) Microsoft Corporation
36,429
Comfortdelgro Corporation Limited (10,666) Novartis AG 35,931
T Rowe Price Group Inc 30,941 Mitsubishi Electric Corporation (10,453) Sanofi SA 29,948 Philip Morris International Inc (10,241) Axiata Group BHD 29,464 Lafarge Malaysia BHD (10,198) American Express Corporation 29,129 Coach Inc (9,716) Singapore Technologies Engineering Limited 27,068
ASM Pacific Technology Limited (7,722)
Coach Inc 25,851 MediaTek Inc (7,612) Svenska Cellulosa AB SCA 25,738 Advantech Co Limited (7,422) Unilever NV 25,215 Exxon Mobil Corporation (7,409) Telenor ASA 24,385 Brambles Limited (6,521) Fuchs Petrolub SE 23,528 Saputo Inc (6,353) McDonald's Corporation 23,305 Rio Tinto Limited (5,468) Exxon Mobil Corporation 23,110 VTech Holdings Limited (4,499) Vodafone Group Plc 22,526 Malayan Banking BHD (3,765) China Mobile Limited 21,036 Malayan Banking BHD 20,956 GlaxoSmithKline Plc 20,634 Brambles Limited 20,403 British American Tobacco Plc 19,089 Legal & General Group Plc 18,531 General Dynamics Corporation 17,940 SSE Plc 17,304 Woolworths Limited 16,392
Metro Inc 16,370 Woodside Petroleum Limited 15,977 Air Liquide SA 15,576 VTech Holdings Ltd 14,529 Home Depot Inc 14,395 Atlas Copco AB 14,294
United Overseas Bank Limited 14,045 QBE Insurance Group Limited 13,622 Zurich Insurance Group AG 13,400
MediaTek Inc 13,327 Computershare Limited 13,309 Power Assets Holdings Limited 13,169
Significant portfolio changes are defined as the aggregate purchases of a security exceeding one per cent of the total value of purchases for the financial year and aggregate sales of a security exceeding one per cent of the total value of sales for the financial year. At a minimum, the 20 largest purchases and 20 largest sales are to be disclosed. * All sales for the financial year ended 31 December 2016 are included.

BMO INVESTMENTS (IRELAND) PLC Statement of Significant Changes on Composition of Portfolio (unaudited)
124
Pyrford International (EAFE) Equity Fund
Portfolio Securities
Acquisition Cost USD Portfolio Securities
Disposal Proceeds
USD Sampo OYJ
189,771
Colruyt SA (331,828)
ABC-Mart Inc 134,630 Newcrest Mining Limited (153,623) Atlas Copco AB
126,874
Mitsubishi Electric Corporation (121,517) Novartis AG 125,512
Legal & General Group Plc 120,842 Nihon Kohden Corporation (103,541) Telenor ASA 118,789 Comfortdelgro Corp Limited (87,430) National Grid Plc 116,529 Brambles Limited (76,347) Vodafone Group Plc 104,815 GEA Group AG (72,288) Roche Holding AG 76,354 VTech Holdings Limited (69,276) Royal Dutch Shell Plc Class A Shares
Lafarge Malaysia BHD
(69,218) 70,773 ASM Pacific Technology
Teva Pharmaceutical Industries Limited (69,206) Limited 66,186 KDDI Corporation
(65,800)
Sky Plc 63,219 Makita Corporation (64,591) Sanofi SA
59,200
Teva Pharmaceutical Industries Limited (64,515) SSE Plc 57,742
Zurich Insurance Group AG
56,396
Chunghwa Telecom Co Limited (62,107) Nestle SA 55,591
Fuchs Petrolub SE 54,641 Atlas Copco AB (61,881) Assa Abloy AB 51,712 Deutsche Post AG (55,628) Deutsche Post AG
51,551
Sumitomo Rubber Industries Limited (54,244) United Utilities Group Plc 51,152
Woodside Petroleum Limited 47,172 Japan Tobacco Inc (53,260) Singapore Technologies Engineering Limited
Rio Tinto Limited
(53,120) 45,681 National Grid Plc (52,573)
Svenska Cellulosa AB SCA 42,969 BP Plc (51,247) Legrand SA 40,222 Computershare Limited (50,985) Japan Tobacco Inc 38,971 SAP SE (50,285) KDDI Corporation 36,888 Koninklijke Vopak NV (50,260) Computershare Limited
35,350
Woodside Petroleum Limited (49,604) Sembcorp Industries Limited 34,005
QBE Insurance Group Limited 33,853 Assa Abloy AB (49,598) United Overseas Bank Limited 28,090 Nestle SA (47,380) Royal Dutch Shell Plc (47,203) Kone OYJ (46,294) Malayan Banking BHD (42,799) Toyota Tsusho Corporation (31,957) QBE Insurance Group Limited (31,938) Axiata Group BHD (26,296)
Significant portfolio changes are defined as the aggregate purchases of a security exceeding one per cent of the total value of purchases for the financial year and aggregate sales of a security exceeding one per cent of the total value of sales for the financial year. At a minimum, the 20 largest purchases and 20 largest sales are to be disclosed.

BMO INVESTMENTS (IRELAND) PLC Statement of Significant Changes on Composition of Portfolio (unaudited)
125
Pyrford Shariah Global Equity Fund
Portfolio Securities
Acquisition Cost USD Portfolio Securities
Disposal Proceeds
USD Exxon Mobil Corporation
65,233
Linear Technology Corporation (73,253) Rockwell Automation Inc 52,945
Canadian National Railway Co
29,502
Cnooc Limited
(40,228) VTech Holdings Limited 26,114 Royal Dutch Shell Plc
Class B Shares (31,217) Axiata Group BHD 21,532 ASM Pacific Technology 21,353 Northrop Grumman
Corporation (29,733) ABC-Mart Inc 21,293 Singapore Technologies Imperial Oil Limited (28,881) Engineering Limited 19,760 Lafarge Malaysia BHD (25,984) General Dynamics Corporation CH Robinson Worldwide Inc
19,516 18,884
Makita Corporation
(25,073) ASM Pacific Technology
Mitsubishi Electric Corporation 17,165 Limited (25,024) Novartis AG 17,064 Air Liquide SA (22,857) Haitian International Holdings
Comfortdelgro Coproration Limited (22,288) Limited 16,408
Assa Abloy AB
14,760
Royal Dutch Shell Plc Class A Shares
(19,860) Atlas Copco AB 12,940
Imperial Oil Limited 10,917 Coach Inc (14,160) Roche Holding AG 10,531 McDonald's Corporation (12,988) McDonald's Corporation 8,276 Exxon Mobil Corporation (12,342) Woodside Petroleum Limited 7,658 Brambles Limited (12,050) Coach Inc 7,564 Microsoft Corporation (11,384) Brenntag AG 6,810 Rio Tinto Limited (8,908) Givaudan SA 6,112 VTech Holdings Limited (8,873) Rio Tinto Limited
6,070
Shin-Etsu Chemical Co Limited
(8,343)
GlaxoSmithKline Plc 5,509 Nihon Kohden Corporation (7,600) Fuchs Petrolub SE 5,450
Taiwan Semiconductor
Sanofi SA
5,246 Manufacturing Co Limited (6,837)
Unilever Plc 5,029 Significant portfolio changes are defined as the aggregate purchases of a security exceeding one per cent of the total value of purchases for the financial year and aggregate sales of a security exceeding one per cent of the total value of sales for the financial year. At a minimum, the 20 largest purchases and 20 largest sales are to be disclosed.

BMO INVESTMENTS (IRELAND) PLC Statement of Significant Changes on Composition of Portfolio (unaudited)
126
Pyrford Global Total Return (Euro) Fund
Portfolio Securities
Acquisition Cost EUR Portfolio Securities
Disposal Proceeds
EUR* Bundesrepublik Deutschland 3.500% due 04/07/2019
165,512
Colruyt SA
(62,805) Royal Dutch Shell Plc (11,885)
Canadian Government Bond 1.250% due 01/09/2018
131,434
Imperial Oil Limited
(8,953) Air Liquide SA (7,895)
Fuchs Petrolub SE 26,672 Fuchs Petrolub SE (7,680) Unilever NV 19,943 VTech Holdings Limited (6,719) Sanofi SA 19,262 Metro Inc (6,606) Air Liquide SA 17,169 ASM Pacific Technology Limited (6,424) United Kingdom Gilt 8.750% due 25/08/2017
15,038
ABC-Mart Inc
(5,931) China Mobile Limited (5,102)
Canadian National Railway Co 14,485 Japan Tobacco Inc (3,341) Mitsubishi Electric Corporation 11,253 Chunghwa Telecom Co Limited (3,006) ABC-Mart Inc 10,992 Malayan Banking BHD (2,843) Royal Dutch Shell Plc 9,811 Axiata Group BHD (2,776) Bundesrepublik Deutschland 4.000% due 04/01/2018
7,375
KDDI Corporation (2,191) Brambles Limited (1,709)
Total SA 6,684 Svenska Cellulosa AB SCA (1,062) VTech Holdings Limited
6,655
Sumitomo Rubber Industries Limited
(1,002) Bundesrepublik Deutschland
4.250% due 04/07/2017 6,181 China Mobile Limited 5,614 Bundesrepublik Deutschland 4.250% due 04/07/2018
5,405
Atlas Copco AB 4,495 Woodside Petroleum Limited 1,718 T Rowe Price Group Inc 1,643
Significant portfolio changes are defined as the aggregate purchases of a security exceeding one per cent of the total value of purchases for the financial year and aggregate sales of a security exceeding one per cent of the total value of sales for the financial year. At a minimum, the 20 largest purchases and 20 largest sales are to be disclosed. * All sales for the financial year ended 31 December 2016 are included.

BMO INVESTMENTS (IRELAND) PLC Statement of Significant Changes on Composition of Portfolio (unaudited)
127
Pyrford Global Total Return (US$) Fund
Portfolio Securities
Acquisition Cost USD Portfolio Securities
Disposal Proceeds
USD United States Treasury Note 1.000% due 15/10/2019 265,032
Linear Technology Corporation
(36,942) Home Depot Inc (12,647)
Canadian Government Bond 1.250% due 01/09/20181 235,888
Northrop Grumman Corporation (12,008)
United States Treasury Note 2.000% due 30/09/2020 178,215
Philip Morris International Inc
(7,657) Colruyt SA (7,076)
United States Treasury Note 2.125% due 30/09/2021 155,356
ABC-Mart Inc
(6,618) Metro Inc (6,040)
United Kingdom Gilt 8.750% due 25/08/2017 101,592
McDonald's Corporation
(5,988) ASM Pacific Technology Ltd (5,951)
United States Treasury Bond 8.875% due 15/08/2017 35,109
VTech Holdings Limited
(5,909) Coach Inc (5,671)
Canadian Government Bond 4.000% due 01/06/2016
Imperial Oil Limited
(5,225) 19,366 Altria Group Inc (4,756)
Rockwell Automation Inc 15,420 Exxon Mobil Corporation (4,692) Mitsubishi Electric Corporation 12,674 Japan Tobacco Inc (3,757) ABC-Mart Inc 12,478
Malayan Banking BHD (3,368) Wal-Mart Stores Inc
9,312 Chunghwa Telecom Corporation
Limited
(3,354) American Express Corporation 9,217 Canadian National Railway Co
8,496
Sumitomo Rubber Industries Limited
(3,322) Canadian Government Bond
4.250% due 01/06/2018 7,201 Axiata Group BHD (2,979) Canadian Government Bond 6,518 Svenska Cellulosa AB SCA (1,728) 3.750% due 01/06/2019
CH Robinson Worldwide Inc 5,443 Axiata Group BHD 3,226 Sanofi SA 2,992 Atlas Copco AB 2,701 Singapore Technologies 2,304
Significant portfolio changes are defined as the aggregate purchases of a security exceeding one per cent of the total value of purchases for the financial year and aggregate sales of a security exceeding one per cent of the total value of sales for the financial year. At a minimum, the 20 largest purchases and 20 largest sales are to be disclosed.

BMO INVESTMENTS (IRELAND) PLC Statement of Significant Changes on Composition of Portfolio (unaudited)
128
Monegy Global High Yield Bond Fund
Portfolio Securities
Acquisition
Cost USD Portfolio Securities
Disposal Proceeds
USD Cheniere Corpus Christi Holdings LLC 7.000% due 30/06/2024
207,750
Cheniere Corpus Christi Holdings LLC 7.000% due 30/06/2024
(211,000)
Fly Leasing Limited Fly Leasing Limited 6.375% due 15/10/2021
204,500
6.375% due 15/10/2021
(203,000)
Calpine Corporation Fiat Chrysler Automobiles NV 5.750% due 15/01/2025
115,750
5.250% due 15/04/2023
(199,056)
Aircastle Limited United Continental Holdings Inc 5.000% due 01/04/2023
107,876
6.375% due 01/06/2018
(183,575)
WPX Energy Inc Vector Group Limited 7.500% due 01/08/2020
78,650
7.750% due 15/02/2021
(182,656) Tribune Media Corporation 5.875% due 15/07/2022 76,125
AMC Entertainment Holdings Inc 5.875% due 15/02/2022 (182,438)
Sprint Communications AerCap Ireland Capital Limited 6.000% due 01/12/2016
74,500
4.625% due 01/07/2022
(157,688)
Northern Tier Energy LLC T-Mobile USA Inc 7.125% due 15/11/2020
72,665
6.633% due 28/04/2021
(156,750)
Sprint Corporation Virgin Media Finance Plc 7.875% due 15/09/2023
70,725
7.000% due 15/04/2023
(152,637)
Live Nation Entertainment Inc Tribune Media Corporation 7.000% due 01/09/2020
69,680
5.875% due 15/07/2022
(144,530)
Diamondback Energy Inc Hughes Satellite Systems 4.750% due 01/11/2024
67,383
Corporation
Freeport-McMoRan Inc due 3.550% 01/03/2022 66,264
7.625% due 15/06/2021 (134,688) SFR Group SA
JC Penney Corporation Inc 5.650% due 01/06/2020 64,890
5.625% due 15/05/2024
(119,136) Community Health Systems Inc
Cenovus Energy Inc 6.750% due 15/11/2039
64,711
8.000% due 15/11/2019
(114,844) Aircastle Limited
Micron Technology Inc 5.250% due 01/08/2023 62,693
7.625% due 15/04/2020 (113,578) Calpine Corporation
Murphy Oil Corporation 4.700% due 01/12/2022
58,618
5.750% due 15/01/2025
(109,825) Sabine Pass Liquefaction LLC
Iron Mountain Inc 5.750% due 15/08/2024 56,744
6.250% due 15/03/2022
(107,750) Aircastle Limited
QEP Resources Inc 5.250% due 01/05/2023 54,963
5.000% due 01/04/2023
(105,788) Regal Entertainment Group
Revlon Consumer Products Corporation 6.250% due 01/08/2024 54,814
5.750% due 15/03/2022
(104,875) Sirius XM Radio Inc 6.000% due 15/07/2024 (104,625)
Frontier Communications Corporation 6.875% due 15/01/2025 54,675
ACCO Brands Corporation
6.750% due 30/04/2020 (104,375)
Builders FirstSource Inc 5.625% due 01/09/2024 53,308
Significant portfolio changes are defined as the aggregate purchases of a security exceeding one per cent of the total value of purchases for the financial year and aggregate sales of a security exceeding one per cent of the total value of sales for the financial year. At a minimum, the 20 largest purchases and 20 largest sales are to be disclosed.

BMO INVESTMENTS (IRELAND) PLC Statement of Significant Changes on Composition of Portfolio (unaudited)
129
Pyrford Global Equity (Sterling) Fund
Portfolio Securities
Acquisition
Cost GBP Portfolio Securities
Disposal Proceeds
GBP ABC-Mart Inc 18,113 Linear Technology Corporation (22,255) Rockwell Automation Inc 11,326 Mitsubishi Electric Corporation (17,370) Mitsubishi Electric Corporation 9,416 ABC-Mart Inc (13,863) Canadian National Railway Co 9,147 Northrop Grumman Corporation (7,875) China Mobile Limited 8,524 Colruyt SA (7,534) Wal-Mart Stores Inc 7,896 Imperial Oil Limited (6,394) American Express Co 7,084 Japan Tobacco Inc (5,890) Japan Tobacco Inc 5,975 Chunghwa Telecom Co Limited (4,952) CH Robinson Worldwide Inc 5,643 Metro Inc (4,800) T Rowe Price Group Inc
5,232
China Mobile Limited (4,732)
Sanofi SA 5,180 Home Depot Inc (4,698) Chunghwa Telecom Co Limited 5,049
Newcrest Mining Limited
(4,103)
Novartis AG 3,898 ASM Pacific Technology Limited (3,855) Axiata Group BHD
3,754
Rio Tinto Limited (3,458)
Air Liquide SA 3,675 Merida Industry Co Limited (3,193) Atlas Copco AB 3,569 Lafarge Malaysia BHD (2,843) Svenska Cellulosa AB SCA 3,480 Coach Inc (2,815) Unilever NV 3,461 Philip Morris International Inc (2,811) Merida Industry Co Limited
3,353
Microsoft Corporation
(2,256) Singapore Technologies Engineering Limited 3,282
Svenska Cellulosa AB SCA (1,946) Brambles Limited (1,926)
Roche Holding AG 3,239 Nihon Kohden Corporation (1,788) Microsoft Corporation 3,003 Computershare Limited (1,692) Legal & General Group Plc 2,851 QBE Insurance Group Limited (1,687) Vodafone Group Plc 2,713 VTech Holdings Limited (1,630) Fuchs Petrolub SE 2,599 Comfortdelgro Corporation Rio Tinto Limited 2,369 Limited (1,496) SSE Plc 2,196 Woolworths Limited 2,134 KDDI Corporation 2,116 Nihon Kohden Corporation 2,095 Zurich Insurance Group AG 2,009 QBE Insurance Group Limited 1,939
Significant portfolio changes are defined as the aggregate purchases of a security exceeding one per cent of the total value of purchases for the financial year and aggregate sales of a security exceeding one per cent of the total value of sales for the financial year. At a minimum, the 20 largest purchases and 20 largest sales are to be disclosed.

BMO INVESTMENTS (IRELAND) PLC Statement of Significant Changes on Composition of Portfolio (unaudited)
130
Pyrford Global Equity (Euro) Fund
Portfolio Securities
Acquisition
Cost EUR Portfolio Securities
Disposal ProceedsE
UR Rockwell Automation Inc 12,176 Linear Technology Corporation (25,351) United Overseas Bank Limited 12,004 United Overseas Bank Limited (12,260) ABC-Mart Inc 11,074 Mitsubishi Electric Corporation (9,603) China Mobile Limited 10,459 Colruyt SA (9,423) Canadian National Railway Co 9,416 Northrop Grumman Corporation (9,171) Wal-Mart Stores Inc 9,282 Venture Corporation Limited (6,117) American Express Co 7,230 Chunghwa Telecom Co Limited (6,088) Chunghwa Telecom Co Limited 6,120 ABC-Mart Inc (5,931) CH Robinson Worldwide Inc 5,507 China Mobile Limited (5,554) T Rowe Price Group Inc
5,336
Home Depot Inc (5,341)
Novartis AG 4,830 Imperial Oil Limited (5,168) Atlas Copco AB
4,402
Metro Inc
(4,957)
Merida Industry Co Limited 4,309 Newcrest Mining Limited (4,412) Roche Holding AG
4,145
Microsoft Corporation (4,140)
Axiata Group BHD 4,125 Merida Industry Co Limited (4,135) Sanofi SA 3,913 Japan Tobacco Inc (3,764) Japan Tobacco Inc 3,448 VTech Holdings Limited (3,410) Fuchs Petrolub SE 2,955 Lafarge Malaysia BHD (3,110) VTech Holdings Limited
2,901
Coach Inc
(3,077)
Svenska Cellulosa AB SCA 2,707 Philip Morris International Inc (2,926) Unilever NV 2,356 Nihon Kohden Corporation (2,308) Microsoft Corporation 2,342 BP Plc (2,023) Nihon Kohden Corporation 2,173 QBE Insurance Group Limited (2,019) Zurich Insurance Group AG 2,158 Toyota Tsusho Corporation (2,019) Singapore Technologies Engineering Limited 2,111
Comfortdelgro Corporation Limited (1,894)
QBE Insurance Group Limited 2,064 ASM Pacific Technology Limited (1,760) SembCorp Industries Limited 1,987 Telenor ASA 1,984 Toyota Tsusho Corporation 1,982 Woodside Petroleum Limited 1,663
Significant portfolio changes are defined as the aggregate purchases of a security exceeding one per cent of the total value of purchases for the financial year and aggregate sales of a security exceeding one per cent of the total value of sales for the financial year. At a minimum, the 20 largest purchases and 20 largest sales are to be disclosed.