bmc genomics · marie-laure martin-magniette ... florence batellier1, isabelle couty1, sandrine...
TRANSCRIPT

This Provisional PDF corresponds to the article as it appeared upon acceptance. Fully formattedPDF and full text (HTML) versions will be made available soon.
Search for the genes involved in oocyte maturation and early embryodevelopment in the hen
BMC Genomics 2008, 9:110 doi:10.1186/1471-2164-9-110
Sebastien Elis ([email protected])Florence Batellier ([email protected])
Isabelle Couty ([email protected])Sandrine Balzergue ([email protected])
Marie-Laure Martin-Magniette ([email protected])Philippe Monget ([email protected])
Elisabeth Blesbois ([email protected])Marina S Govoroun ([email protected])
ISSN 1471-2164
Article type Research article
Submission date 12 September 2007
Acceptance date 29 February 2008
Publication date 29 February 2008
Article URL http://www.biomedcentral.com/1471-2164/9/110
Like all articles in BMC journals, this peer-reviewed article was published immediately uponacceptance. It can be downloaded, printed and distributed freely for any purposes (see copyright
notice below).
Articles in BMC journals are listed in PubMed and archived at PubMed Central.
For information about publishing your research in BMC journals or any BioMed Central journal, go to
http://www.biomedcentral.com/info/authors/
BMC Genomics
© 2008 Elis et al., licensee BioMed Central Ltd.This is an open access article distributed under the terms of the Creative Commons Attribution License (http://creativecommons.org/licenses/by/2.0),
which permits unrestricted use, distribution, and reproduction in any medium, provided the original work is properly cited.

1
Search for the genes involved in oocyte maturation and early embryo development in the hen
Sebastien Elis
1, Florence Batellier
1, Isabelle Couty
1, Sandrine Balzergue
2, Marie-Laure
Martin-Magniette2, Philippe Monget
1, Elisabeth Blesbois
1, Marina S Govoroun
1§,
1Physiologie de la Reproduction et des Comportements, UMR 6175 INRA-CNRS-Université
F. Rabelais de Tours, Haras Nationaux, 37380 Nouzilly, France.
2Unité de Recherche en Génomique Végétale UMR INRA 1165 - CNRS 8114 - UEVE 2 Rue
Gaston Crémieux CP 5708 91057 EVRY CEDEX France
§Corresponding author
Email addresses:
SB : [email protected]
MLMM : [email protected]
PM : [email protected]
EB : [email protected]
MSG: [email protected]

2
Abstract
Background
The initial stages of development depend on mRNA and proteins accumulated in the oocyte,
and during these stages, certain genes are essential for fertilization, first cleavage and
embryonic genome activation. The aim of this study was first to search for avian oocyte-
specific genes using an in silico and a microarray approaches, then to investigate the temporal
and spatial dynamics of the expression of some of these genes during follicular maturation
and early embryogenesis.
Results
The in silico approach allowed us to identify 18 chicken homologs of mouse potential oocyte
genes found by digital differential display. Using the chicken Affymetrix microarray, we
identified 461 genes overexpressed in granulosa cells (GCs) and 250 genes overexpressed in
the germinal disc (GD) of the hen oocyte. Six genes were identified using both in silico and
microarray approaches. Based on GO annotations, GC and GD genes were differentially
involved in biological processes, reflecting different physiological destinations of these two
cell layers. Finally we studied the spatial and temporal dynamics of the expression of 21
chicken genes. According to their expression patterns all these genes are involved in different
stages of final follicular maturation and/or early embryogenesis in the chicken. Among them,
8 genes (btg4, chkmos, wee, zpA, dazL, cvh, zar1 and ktfn) were preferentially expressed in
the maturing occyte and cvh, zar1 and ktfn were also highly expressed in the early embryo.
Conclusions
We showed that in silico and Affymetrix microarray approaches were relevant and
complementary in order to find new avian genes potentially involved in oocyte maturation
and/or early embryo development, and allowed the discovery of new potential chicken mature
3
oocyte and chicken granulosa cell markers for future studies. Moreover, detailed study of the
expression of some of these genes revealed promising candidates for maternal effect genes in
the chicken. Finally, the finding concerning the different state of rRNA compared to that of
mRNA during the postovulatory period shed light on some mechanisms through which oocyte
to embryo transition occurs in the hen.
4
Background
The activation of molecular pathways underlying oocyte to embryo transition (OET) depends
exclusively on maternal RNAs and proteins accumulated during growth of the oocyte [1].
During OET and preimplantation development in mice, the embryo becomes almost
autonomous, and may gradually eliminate maternal components. Indeed, by the two cell
stage, the major pathways regulated by maternal mRNA are targeted protein degradation,
translational control and chromatin remodelling [2]. The recruitment of maternal mRNA for
translation has long been recognized as a widespread mechanism to generate newly
synthesized proteins in maturing oocytes and fertilized eggs [3]. Conversely, RNA that is no
longer needed is actively degraded in the early embryo [4]. Moreover, careful regulation of
proteolysis during the same period is likely to be important in oocytes, which are
predominantly transcriptionally inactive and must often wait for long periods before
fertilization in different species such as Drosophila, Xenopus, Caenorhabditis and Zebrafish
[5]. Maternal transcripts that are present in the early pre-implantation embryo can be
subdivided into two classes according to whether they are re-synthesized soon after
embryonic genome activation or not. The first is common to the oocyte and early embryo and
is replenished after activation of the zygotic genome. The second consists of oocyte-specific
mRNA that is not subsequently transcribed from zygotic genes in the embryo. This class of
mRNA may be detrimental to early post-fertilization development [6].
Maternal effect genes have been found in several species ranging from invertebrates to
mammals. Wide screening of mutants has been performed in invertebrates as Drosophila
melanogaster [7] and Caenorhabditis elegans [8] where several mutations lead to arrest of
early embryo development. Although females bearing this type of mutation are viable and
appear to be normal, the development and survival of their embryos are compromised [9].

5
Maternal effect mutations have also been described in other vertebrates such as Danio rerio
for the nebel gene [10], and Xenopus laevis for the af gene [11]. Despite the fact that maternal
effect mutations are well known in lower organisms, only a few examples have been reported
in mammals. All of them are based on knock-out experiments and concern three murine
genes, i.e. Dnmt1, Hsf1 and Mater [9]. Mater (Maternal antigen that embryos require) is a
single-copy gene that is transcribed in growing oocytes. Although its transcripts are degraded
during meiotic maturation, MATER protein persists into the blastocyst. Female mice lacking
this 125 kDa cytoplasmic protein produce no offspring because of an embryonic block at the
early cleavage stage. Thus, Mater is one of few documented genes for maternal effect in
mammalian development [12]. Mater has been found in bovine models but there is no report
in the literature on maternal effect genes conserved between species.
No information has been available to date on maternal effect genes in birds. However, birds
represent a good model to observe progressive accumulation of mRNA in the oocyte before
ovulation. The embryonic genome of a model bird, i.e. the chicken, is activated when the
embryo contains 30,000-50,000 cells [13] 24 h after fertilization. Proteins and mRNA,
accumulated as the chicken oocyte matures, are essential not only for fertilization and first
cleavage but also for supporting a high number of embryonic cell divisions before genome
activation. By comparison, the embryonic genome is activated at the 8-cell stage in bovines
[14] and at the 2-cell stage in the mouse [15].The avian oocyte consists of a large amount of
yolk and a structure called the germinal disc (GD) [16]. The GD is a white plaque of about 3-
4 mm diameter on the top of the oocyte. It contains the nucleus and 99% of oocyte organelles
although it occupies less than 1% of the cell volume [17]. Structurally, and therefore
functionally, the GD is mostly equivalent to the mammalian oocyte. The ovary of the
reproductively active hen consists of small pre-hierarchical follicles and maturing
preovulatory follicles showing a hierarchy according to size (F6 to F1) [18].

6
Only a few studies have reported on gene expression in the oocyte and during early embryo
development in the chicken. The dynamics of the overall RNA profile of the chicken oocyte
through different maturation stages has been described by Olzanska et al. [13, 19-22].
Chicken vasa homolog protein (CVH) was hypothesized to be maternally inherited in the
chicken embryo, since it has been localized in chicken oocytes and during first cleavage [23].
Another protein, Epidermal Growth Factor, was found in F2 GD and its potential role in
follicular development has also been investigated [24].
Since oocyte-specific genes expressed during follicular maturation and after ovulation are
potentially involved in the fertilization process and in early embryo development, and almost
no information is available on these genes in birds, the aim of this study was to identify avian
oocyte-specific genes and then to investigate the temporal and spatial dynamics of their
expression during follicular maturation and early embryogenesis. We chose initially to focus
on oocyte-specific genes because the accumulation of their transcripts in the oocyte should
have greater consequences on fertilization and OET. Two different strategies were used to
identify avian genes potentially involved in oocyte developmental competence. The first was
based on a candidate gene approach and consisted of a search for avian homologs of murine
oocyte genes, previously identified by digital differential display [25]. The second strategy
involved a global transcriptomic approach based on chicken Affymetrix microarray. We
report here several novel chicken genes with potential maternal effect identified using these
two strategies. We also describe the spatial and temporal dynamics of the expression of some
of these genes as well as some potential mechanisms in which they could be involved. We
also compare chicken and murine orthologs in terms of their tissue specificity and their
potential involvement in oocyte developmental competence and/or early embryogenesis.
7
Results
In silico search for chicken homologs of murine oocyte genes
Differential digital display analysis performed on murine tissues provided a list of 101
potentially oocyte-specific murine genes [25-27]. Bioinformatic analyses were performed on
this list of genes in order to find potentially oocyte-specific chicken orthologs. Genes with a
blast score higher than 100 were localized using mapview [28] and blatsearch [29] tools. The
syntenic regions were checked: chromosome localization of murine genes and chicken
homologs were compared, in order to obtain the correct chicken ortholog of mice genes. Only
genes with sufficient homology or whose localization was in accordance with syntenic
regions were selected. Forty-one chicken genes were eliminated because of their poor
homology with murine genes and 32 other genes were eliminated because they were localized
outside the syntenic regions. Among the remaining 28 chicken genes the transcript of only 18
genes could be correctly amplified using real time or classic RT-PCR, of which the detailed
study of two genes bmp15 and gdf9 has previously been reported [30]. Thus 16 avian genes
were finally retained (Table 1). The homology with murine genes was strong for 11 of these
genes (blast score between 288 and 2149) and was weak for 5 (blast score between 104 and
132). The last five chicken genes were nevertheless considered as potential orthologs of
murine genes and kept as candidate genes because of their correct localizations with respect to
the syntenic region. Eleven of the selected genes were localized in the expected syntenic
region (btg4, chkmos, msh4, mtprd, mcmip, znfingerRIZ, discs5, trans fact 20, wee, zar1 and
ktfn). Three other genes were localized in the vicinity of the expected syntenic region (dazL,
fbox and mark3). Two genes were localized in the unexpected syntenic region, but they were
identified with the same name as murine genes (zpA and zpC).

8
Comparing oocyte and granulosa cells transcription profiles at final maturation steps
using chicken Affymetrix microarrays
The samples studied were: F1 GCs, corresponding to granulosa cells (GCs) of the largest
follicles before ovulation (F1); F1 GDR, corresponding to the germinal disc region (GDR) of
F1 follicles, and Ov GDR, corresponding to the germinal disc region of ovulated oocytes (Ov)
(Fig. 1). Apart from the stage of maturation the main difference between these samples
involved the presence of granulosa cells. They were not present in GDR from ovulated
oocytes, they were slightly present in F1 GDR, and they constituted a major component of F1
GCs (see Materials and Methods). Statistical analysis of data obtained after Affymetrix
microarray hybridization provided lists of genes differentially expressed in three comparisons:
F1 GDR and Ov GDR, F1 GDR and F1 GCs, and Ov GDR and F1 GCs (accession number
GSE7805). There were only a few differentially expressed genes in each comparison (fewer
than 500 out of 28000 genes on the Chip) (Table 2). Indeed, the first comparison, between the
F1 GDR and Ov GDR, showed 92 genes over-expressed at the F1 stage, including one of our
in silico identified genes (zpC). In the second comparison, between F1 GDR and F1 GCs, 342
differentially expressed genes were identified. These genes involved 104 genes over-
expressed in F1 GCs and 238 genes over-expressed in F1 GDR. Five of our in silico identified
genes btg4, chkmos, dazL, zpA and ktfn were found among the latter genes over-expressed in
F1 GDR (Table 2). The third analysis compared the expression of genes between F1 GCs and
Ov GDR. We obtained a set of 448 genes that were differentially expressed between F1 GCs
and Ov GDR, of which 392 genes were over-expressed in F1 GCs and 56 genes were over-
expressed in Ov GDR. We found 1 of our in silico identified genes among these genes, (btg4)
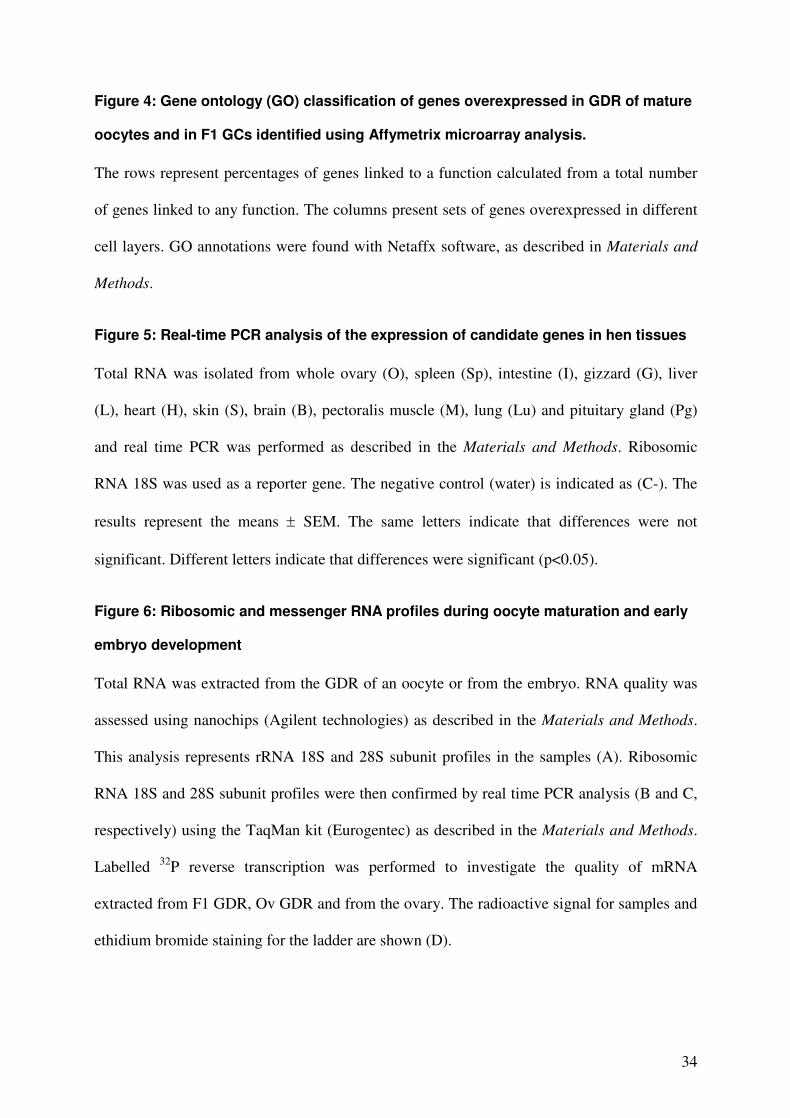
(Table 2). The Venn diagram (Fig. 2) shows overlapping differentially expressed genes
between different dataset comparisons. Eighty-five differentially expressed genes were
common for two comparisons (F1 GCs and Ov GDR, and F1 GCs and F1 GDR). Only one

9
gene was common for the comparisons between F1 GDR and F1 GCs, and F1 GDR and Ov
GDR and 1 gene was common for all three comparisons. F1 GDR samples contained a
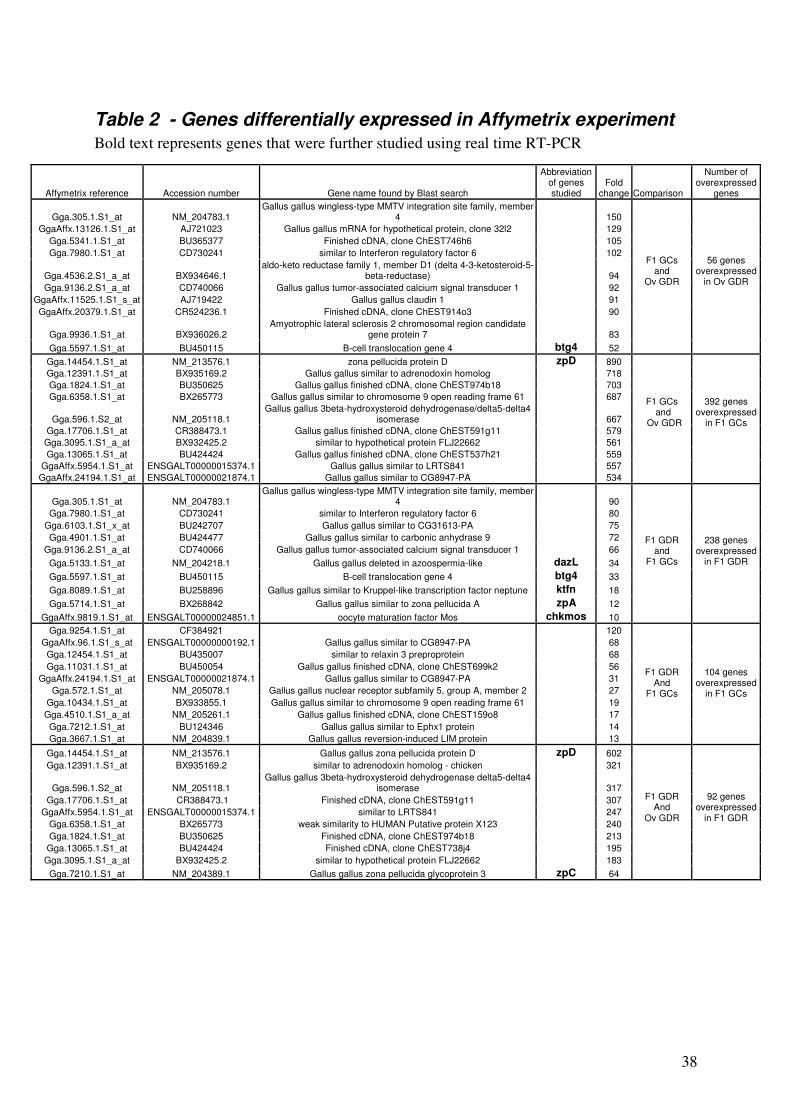
quantity of granulosa cells in contrast to Ov GDR samples which were free of granulosa cells.
Analysis of the redundancy of over-expressed genes between different comparisons was
therefore performed in order to distinguish between genes found over-expressed in F1 GDR
samples due to granulosa cell contamination and those really over-expressed in the oocyte
(Fig. 3). This analysis revealed that 85 of 92 genes over-expressed in F1 GDR were also over-
expressed in F1 GCs, both compared to Ov GDR, indicating that these genes characterized
granulosa cell expression rather than variation in the expression between F1 GD and Ov GD.
Thus only 7 genes should be considered as overexpressed in F1 GD compared to Ov GD.
Moreover, of the 104 genes overexpressed in F1 GCs compared to F1 GDR, 36 were also
overexpressed in F1 GCs compared to Ov GDR. Consequently, taking into account the latter
redundancy, a total of 460 genes was overexpressed in granulosa cells compared to oocytes.
On the other hand 49 genes were redundant among genes overexpressed in the Ov GDR and
F1 GCs, and F1 GDR and F1 GCs comparisons.
Based on GO annotation the genes upregulated in GCs were mostly related to metabolic
processes, transport, proteolysis, regulation of transcription, immune response and cell
adhesion, whereas genes preferentially expressed in GDR were preferentially involved in cell
cycle, chromosome organization, phosphorylation of proteins, regulation of transcription,
multicellular organism development and DNA metabolic processes (Fig. 4).
Tissular pattern of gene expression
On the basis of the in silico and microarray approaches, 17 genes were retained for further
study. Among these, 16 genes were found using the in silico approach as described above
(Table 1), of which 6 genes (chkmos, dazL, btg4, zpA, ktfn and zpC) were also found using the
microarray approache (Table 2) and 1 gene (zpD) was found only in the microarray approach.

10
The latter gene was chosen because of its strong involvement in the fertilization process [31].
In contrast to zpA and zpC, the zpD gene was not found in the mouse [32], explaining why it
was absent from the list of murine potentially oocyte-specific genes. Four other genes already
known for their involvement in final follicular maturation or early embryo development in the
chicken or in other vertebrates were added (foxL2 [33], igf2 [34, 35], hsf1 [36], and cvh [23])
(Table 3). Finally 21 chicken genes were further studied. Real time RT-PCR performed on 11
adult tissue samples (total ovary, spleen, intestine, gizzard, liver, heart, skin, brain, pectoralis
muscle, lung and pituitary gland) revealed differences in the specificity of their tissular
expression patterns. Tissular expression profiles of some of these genes are presented on Fig.
4. Seven of these genes (dazL, wee, zar1, zpA, btg4, zpC and chkmos) were specifically
expressed in the ovary (Fig 5A). The specificity of zpC and chkmos has previously been
described and our results concerning these genes (data are not shown) were in accordance
with the literature ([37] and [38], respectively). Eight genes were preferentially and strongly
expressed in the ovary (Fig. 5B). Three genes from last group were slightly expressed in
another tissue: fbox and zpD in the pituitary gland and ktfn in the muscle. We also confirmed
preferential ovarian expression of cvh [23] and foxL2 [33], as well as a low expression of the
latter in the pituitary gland (data not shown). Three other genes from this group (igf2, mark3
and znfingerRIZ) were slightly expressed in other tissues, in addition to the ovary. The last 6
genes (trans fact 20, msh4, mtprd, mcmip, discs5 and hsf1) were expressed as highly in the
ovary as in other tissues (data not shown).
RNA state during follicular maturation and early embryo development
Analysis of total RNA, assessed with Agilent RNA nano chips (Fig. 6A), showed an atypical
state of RNA from GDR between ovulation and oviposition. In our conditions, rRNA seemed
degraded from ovulation until oviposition. With three different RNA extraction methods (tri
reagent (Euromedex), RNeasy kit (QIAGEN) and MasterPureTM
RNA Purification Kit
11
(Epicentre Biotechnologies)), the RNA profile of GDR from the ovulation stage and from the
following embryonic stages remained degraded (data not shown). Moreover, we assessed
rRNA 18S and 28S by real time PCR in order to confirm this atypical RNA state (Fig. 6B and
C). These results confirmed our previous observations; 18S and 28S rRNA expression
showed a huge decrease from ovulation untill the oviposition. We then performed labelled
reverse transcription to investigate whether mRNA was also degraded. We compared three
samples, i.e. the RNA from GDR of F1 stage, from a whole adult ovary that had a normal
rRNA profile and GDR of ovulation stage with had degraded rRNA. Electrophoresis profiles
of labelled cDNA in denaturing agarose gel were almost identical for the three samples
investigated and the smear corresponding to the reverse transcribed mRNA was still present
in all these samples (Fig. 6D).
Gene expression during follicular maturation and early embryo development
A detailed study of the expression profiles during follicular maturation and early embryo
development using real time RT-PCR was performed for 21 genes, for which tissue
specificity of the expression was characterized. First unsupervised hierarchical clustering of
our data was performed in order to confirm the biological appropriateness of the selected
genes and samples (Fig 7). Two other previously studied genes (gdf9 and bmp15) were added
to this analysis in order to facilitate the clustering process because of their already known
oocyte-preferential localization [30]. This analysis discriminated two major groups of
samples. The first included all granulosa samples from F6 to F1 (correlation threshold 0.58).
The second group corresponded to GDR from F6 to the ovulation stage and to all embryo
stages (correlation threshold 0.60). Several subgroups could be distinguished within each
group (correlation threshold 0.69-0.94). Each subgroup corresponded to a different
physiological state, indicated on Fig 6A, suggesting that the genes selected were pertinent.
Moreover, unsupervised clustering arranged samples in the perfect chronological order.
12
In order to group genes with similar expression patterns supervised clustering was performed
with samples arranged first according to the nature of the sample (GCs or GDRs) and then
according to chronological order (Fig. 8). Five clusters (threshold > 0.64) were identified (C1
to C5). A representative example of the expression profile characterizing each cluster is
shown on Fig. 9. The graphical representation of expression profiles of all other genes with
the corresponding statistical analysis of variation of their expression is supplied in additional
files (see Additional file 1, 2, 3 and 4). The chkmos, btg4, wee, zpA, dazL, hsf1, fbox and
bmp15 genes, forming cluster C1, were preferentially expressed in GDR. These genes showed
a significant increase in mRNA expression in GDR during follicular maturation and a steady
decrease after ovulation, becoming nearly undetectable at 36 h after fertilization. The cvh, ktfn
and zar1 genes included in Cluster C2 were also preferentially expressed in GDR but, in
contrast to genes from cluster C1, they were constantly expressed in the early embryo.
Moreover, ktfn and zar1 genes displayed a significant increase in expression from 24 to 48
hours after fertilization. The genes from cluster C3 were expressed in GCs, in GDRs and in
the embryo. Moreover, mark3, igf2, gdf9 and transfact20 genes showed a significant decrease
in expression during the last stages of follicular maturation in both GDR and GCs. Cluster C4,
including discs5, znfingerRIZ, foxL2 and mtprd genes, was characterized by expression that
was fairly similar to that of cluster C3. The difference consisted of less pronounced variations
in gene expression in GCs and more pronounced variations in gene expression in GDR for
cluster C4 compared to genes in cluster C3 through the stages investigated. Genes belonging
to cluster C5 were expressed in GCs and GDR but, in contrast to the clusters C3 and C4, their
expression dropped dramatically at ovulation, especially for zpC and zpD whose transcripts
showed increasing expression in GCs during the last stages of follicular maturation and a less
marked increase in the expression in GDR. In contrast, the levels of mcmip decreased
progressively during the same period. The last gene (msh4) was not clustered. Its expression
13
profile was fairly similar to that of genes belonging to cluster C3, but its expression increased
significantly 36h after fertilization.
Localization of gene expression in the ovary by in situ hybridization
We performed in situ hybridization on mature and immature ovarian sections. All the probes
were assessed on the two stages, but only the most significant results are shown on Fig. 10.
For all the genes studied we detected homogeneous signals of mRNA expression in oocytes
similar to those we have previously described for bmp15 and gdf9 [30]. The mRNA of four of
eight genes localized by in situ hybridization (btg4, dazL, cvh and fbox) were detected with a
high intensity signal in the oocytes from follicles of 300µm – 600µm from both immature
(Fig. 10 A, B, C and D) and mature (data not shown) ovaries. No significant expression was
detected in somatic cells. For four other genes (chkmos, zpA, zpC and zpD) a signal was found
in oocytes from the largest follicles of 500µm-6 mm of mature ovaries (Fig. 10 E, F, G and
H). The signal was particularly high for chkmos and zpA (Fig. 10 E and F), whereas zpC and
especially zpD had weaker signals in both oocyte and somatic cells (Fig. 10 G and H). No
significant signal was detected with the corresponding sense probes.
14
Discussion
In the present study we identified and characterized for the first time several genes expressed
in the chicken oocyte during follicular maturation and/or in early embryo. Moreover, we
showed that our candidate gene approach and microarray approach were complementary in
finding new avian genes potentially involved in follicular maturation and/or early embryo
development. Five genes preferentially and highly expressed in the oocyte (btg4, chkmos,
dazL, zpA and ktfn) were identified using both microarray analysis and digital differential
display on murine genes. Moreover, 2 genes (zpC and zpD), identified as overexpressed in
GCs by microarray analysis, were also confirmed by real time PCR analysis to be highly
preferentially expressed in chicken GCs compared to GDR. Microarray analysis identified a
total of 245 genes upregulated in the hen F1 and ovulated oocytes both compared to F1 GCs.
Among these, 49 overexpressed genes were common to Ov GDR and and F1 GDR, both
compared to F1 GCs, and therefore represent particular interesting candidate oocyte genes for
further exploration of their potential role in oocyte maturation, fertilization and OET. The fact
that we found almost five times fewer genes overexpressed in the oocyte at the ovulation
stage (comparison between Ov GDR and F1 GCs) than in the oocyte at F1 stage (comparison
between F1 GDR and F1 GCs), compared to granulosa cells from F1 follicles, means that for
some genes mRNA expression in the oocyte decreased between F1 and ovulation stages. This
change in the mRNA expression levels between F1 and ovulated oocytes is probably
insufficient to be detected in the comparison between Ov GDR and F1 GDR by microarray
hybridization, since only 7 differentially expressed genes were identified in this comparison.
On the other hand microarray analysis enabled us to detect the presence of GCs in F1 GDR
samples, revealed by the redundant overexpressed genes in F1 GDR and in F1 GCs compared
to Ov GDR. The functions of overexpressed genes in the various comparisons according to

15
GO categories revealed clear differences between GCs and mature oocytes. For GCs
overexpressed genes these functions were mostly related to metabolic processes, transport,
proteolysis, regulation of transcription, immune response and cell adhesion, whilst for the
mature oocyte they were mostly related to cell cycle, chromosome organization,
phosphorylation and dephosphorylation of proteins, multicellular organism development and
DNA metabolic process. These presumed functions of genes overexpressed in the oocyte are
consistent with the physiological processes that it must undergo: i.e. fertilization, cleavage,
chromatin remodeling, and supporting early embryo development.
The use of both bioinformatics and microarray approaches provided information on the
molecular mechanisms through which OET is driven in the hen. The expression of several
oocyte-specific genes increased during final follicular maturation, suggesting that
transcription was still effective. After ovulation, despite the fact that 18S and 28S ribosomal
RNA subunits were degraded, we showed by both labelled reverse transcription and
microarray analysis that the integrity of mRNA was almost unaffected. In fact, mRNA levels
were nearly the same for many genes because only 92 of 28000 genes were differentially
expressed between GDRs before and after ovulation, of which only 7 really corresponded to
the oocyte genes. The high number of replicates performed and the different extraction
methods used strongly indicate that the difference in quality between oocyte rRNA and
mRNA after ovulation is not the artifact of the experiment but reflects a real physiological
feature of chicken OET, consisting probably of the arrest and degradation of the oocyte
translational machinery. It could thus be hypothesized that the maternal translational system
has to be replaced by the embryonic translational system. Indeed, the maternal ribosome in
the embryo must be degraded before activation of the genome, in other words, before the
beginning of transcription, and translation, when new embryonic ribosomes are required. This
suggests that, because there are no maternal ribosomes at the stage between ovulation and
16
oviposition, there is probably no translation or only translation of a few specific genes. If this
is the case, maternal proteins should be the major essential components that support early
embryo development after fertilization. This is supported by the fact that, based on GO
annotation, a considerable number of the genes overexpressed in the mature oocyte are related
to protein phosphorylation. Further investigation is required onto whether accumulated
proteins have such an important role during these early stages of development in birds or if de
novo protein synthesis still occurs and is dependent on the oocyte pool of ribosomes as in
mammals [39].
On the basis of in silico and microarray approaches and analysis of the literature, 21 chicken
genes were chosen in this study for further investigation of their expression using real time
PCR and in situ hybridization. All these genes showed state-specific and/or cell type-specific
expression patterns throughout the period, beginning from the first stages of final follicular
maturation until embryonic genome activation. This suggests that these genes have different
functions and have a role at the different physiological stages investigated. The observed
decrease in the mRNA expression of almost all genes studied between ovulation and
oviposition, which corresponds to late genome activation in chicken embryo [13], is
consistent with a potential arrest of transcription and progressive maternal mRNA degradation
occurring during meiotic maturation [40]. However, the rate of maternal mRNA degradation
in the chicken seems to be considerably lower than that of rRNA, as demonstrated by the
present study. Five genes (chkmos, btg4, wee, dazL and zpA) belonging to cluster C1 (Fig. 6B)
were no longer expressed after activation of the embryonic genome, and thus transcripts of
these genes are only maternally inherited. Moreover, chkmos, btg4 and wee genes are known
to be involved in the cell cycle in other species. In our study these maternally inherited genes
were increasingly expressed during follicular maturation and thus are probably used during
the last stages of final follicular maturation and/or early embryo development. Chkmos is the
17
chicken homolog of mos [38], protein kinase required for meiotic maturation in vertebrates
[41, 42] and for mitosis in Xenopus laevis [43]. Meiotic maturation is brought about by
steroids using redundant pathways involving synthesis of Mos, which regulates the activity of
MPF (M-phase promoting factor). The Mos-MAPK pathway has long been implicated in the
arrest of mitosis in vertebrate eggs [43]. The B cell translocation gene 4 (btg4) belongs to a
family of cell-cycle inhibitors. In the mouse and bovine, btg4 is preferentially expressed in the
oocyte [44, 45] where it exerts a marked antiproliferative activity, [46]. Wee is a conserved
gene from invertebrates to mammals and regulates meiotic maturation during oocyte
development [38, 41-43]. The transcripts of dazL are also maternally inherited in the medaka
embryo [47], and in adult medaka fish the expression of dazL was detected exclusively in the
ovary and in the testis [48].
ZpA, zpC and zpD, that belong to the ZP (zona pellucida) gene family, are known to be
involved in oogenesis, fertilization and preimplantation development [49]. In our study the
expression pattern of zpA was different from that of zpD and zpC using both real time PCR
analysis, where they were distributed in different clusters (C1 for zpA and C5 for zpD and zpC
respectively), and in situ hybridization analysis. In contrast to chicken zpD and zpC, which
were expressed in oocytes and somatic cells, chicken zpA was found to be specific to the
oocyte, as is the case in the mouse [50, 51], and expressed earlier than zpD and zpC. In the
mouse the expression of zpA also precedes that of zpC [50, 51]. Indeed in our in situ
hybridization experiments zpA expression detected in small follicles of the mature ovary was
oocyte-specific, whereas that of zpC and zpD was weaker and found in oocytes and in the
somatic cells of the same follicles. Real time RT-PCR, showed increasing expression of zpC
and zpD in both GCs and GDR from F6 to F1. Our finding on the dynamics of zpC in GCs are
in accordance with a previously reported study [52]. Moreover at the F1 stage both zpC and
zpD were significantly more highly expressed in GCs than in GD and this was consistent with

18
our results for microarray hybridization, but expression decreased dramatically after
ovulation. In contrast to the cellular expression pattern found for chicken zpC, in several
mammals (murines, bovines and porcines) zpC (zp3) is specifically expressed in the oocyte.
However, in the equine species, ZPC protein synthesis is completely taken over by cumulus
cells [53]. These findings indicate species specificity of zpC distribution inside the follicle.
ZPC protein plays a crucial role in the fertilization process in mammals and birds, [31, 37,
49].
As zpA other genes (zar1, ktfn and cvh) were preferentially expressed in the oocyte and might
play role in fertility (zar1, ktfn) or in germ cell specification (cvh). Both zar1 and ktfn were
expressed at higher levels after activation of the embryonic genome. We could therefore
hypothesize that these genes might be involved not only in oocyte maturation, but also in
early embryo development, just after maternally inherited genes. Of these 2 genes, only zar1
has been studied in reproduction. It is one of the few known oocyte-specific maternal-effect
genes essential for OET in mice. In mammals and humans it is hypothesized to be involved in
the initiation of embryo development and fertility control [54, 55]. CVH protein has been
previously proposed to be a part of the mechanism for germ cell specification in birds [16,
23]. Our results concerning the spatio-temporal expression of cvh mRNA during follicular
maturation and early embryo development are consistent with previously reported studies on
the CVH protein.
The genes belonging to clusters C3 and C4 were all preferentially expressed in the ovary in
both GCs and GDR and had quite similar expression patterns. Except for foxL2, their
expression declined during follicular maturation in GCs and less in GDR and persisted at low
levels in the early embryo. This suggests that they are especially involved in the first stages of
final follicular maturation as well as in oocyte maturation. The chicken homolog of the mouse
par-1a-like gene, i.e. mark3, is required for oocyte differentiation and microtubule
19
organization in the Drosophila [56], and its role in cell polarity and Wnt signaling is
conserved from invertebrates to mammals [57, 58]. The expression of another gene (msh4),
which did not belong to any cluster, also decreased during follicular maturation in GCs and in
GD but, as for zar1 and ktfn, it showed a significant increase after embryonic genome
activation. Msh4 is known to be involved in mediating recombination of homologous
chromosomes and DNA mismatch repair in the mouse [59]. These events occur during the
meiotic prophase, the stage where oocytes are blocked for a long time before meiotic
maturation.
Conclusions
In conclusion, the findings of the present study on spatio-temporal expression of 8 chicken
oocyte specific genes (chkmos, btg4, wee, zpA, dazL, cvh, zar1 and ktfn) were consistent with
our hypothesis that oocyte-specific genes in the chicken should play a major role in oocyte
maturation, fertilization and early embryo development as in the mouse [12]. Other genes,
whose mRNA expression were found in our study to be more specific for GCs or detected in
both GCs and GDR depending on the stage, seem to be involved in follicular maturation
(foxl2, transfac 20, mark3, …) and fertilization (zpD and zpC) rather than in early embryo
development. Moreover, the microarray approach provided allowed the discovery of a set of
new potential chicken mature oocyte and chicken granulosa cell markers for future studies.
Interestingly, 40% of these genes had no homologs in the gene databases and some of them
probably correspond to specific chicken mechanisms such as hierarchical follicular
maturation or rapid yolk accumulation.
20
Methods
Animals
Laying breed hens aged 60-70 weeks (ISA Brown, egg layer type, Institut de Selection
Animale, Saint Brieuc, France) were housed individually in laying batteries with free access
to feed and water and were exposed to a 15L:9D photoperiod, with lights-on at 8.00pm.
Individual laying patterns were monitored daily. For in situ hybridization, these hens and
younger ones of (10 weeks old) were used to provide mature and immature ovaries, in order
to study follicles at each stage. Hens used to provide fertilized eggs were bred in the same
conditions and inseminated once a week.
Collection of tissues, oocytes and embryos
Hens aged 60 weeks were used. Tissue samples were collected from the ovary, spleen,
intestine, gizzard, liver, heart, skin, brain, pectoralis muscle, lung and pituitary gland.
Germinal disc regions (GDR) and granulosa cells (GCs) surrounding the GDR (Fig. 1) were
collected from different preovulatory follicles (F1 to F6), just ovulated oocytes and early
embryos at 6.5h, 12h, 24h, 36h and 48h post ovulation. The GDR and GCs surrounding the
GDR were carefully dissected in the same way under a binocular microscope using fine
forceps and scissors (World Precision Instruments) as previously described for quail oocytes
[60]. After washing in phosphate buffer saline (PBS, Gibco, Cergy Pontoise, France) GDR
and GCs were frozen in liquid nitrogen and then were stored at -80°C until use. For the last
two stages, eggs were incubated at 37.8°C for 12 and 24h, respectively. The 6.5h, 12h, and
24h stages of embryo development correspond to stages I, V and X of the Eyal-Giladi and
Kochav classification, respectively [61]. The 36h and 48h stages correspond to stages 3 and 6
of the Hamburger-Hamilton classification, respectively [62]. During follicular maturation the
germinal disc is closely associated with its overlying granulosa cells (GCs) and forms a
21
structure called the germinal disc region (GDR) (Figure 1). The GDR from F6-F1 follicles
used for these studies consisted not only of the germinal disc but also of the overlying layer of
GCs, because GD and overlying GCs cannot be completely separated [60, 63, 64] and the
number of GCs in GDR preparations could not be counted.
Bioinformatic analysis
A differential digital display analysis has already been performed with mouse ESTs [25-27],
providing a list of murine oocyte-specific genes. Using this murine gene list, we
systematically searched for chicken orthologs of these genes in international public databases
pubmed [65]. Blast bit scores higher than 100 were retained. Moreover, the physical
localization of genes identified on chicken chromosomes was retrieved from both mapviewh
[28] and from blat search [29]. We also verified that chicken homologs were localized in the
syntenic genomic regions conserved with that of mouse species to have a better chance that
true orthologs were studied with ensembl [66].
RNA isolation and Microarray Analysis
Total RNA was extracted from GDR of F1 and ovulated oocytes, and from GCs of F1
follicles as described above. We thus had 3 samples with a biological replicate of each
sample. The RNeasy Mini Kit (QIAGEN, Hilden, Germany) was used according to the
manufacturer’s instructions. The tissues (GDR or GC) from 25 hens were pooled for each
stage investigated to obtain enough RNA for probe synthesis. Two such a pools were
constituted for each sample in order to achieve two biological replicates of microarray
hybridization. All RNA samples were checked for their integrity on the Agilent 2100
bioanalyzer according to Agilent Technologies guidelines (Waldbroon, Germany). Two
micrograms of total RNA were reverse transcribed with the One-cycle cDNA synthesis kit
(Affymetrix, Santa Clara, CA), according to the manufacturer’s procedure. Clean up of the
22
double-stranded cDNA was performed with Sample Cleanup Module (Affymetrix, Santa
Clara, CA) followed by in vitro transcription (IVT) in the presence of biotin-labelled UTP
using GeneChip® IVT labelling Kit (Affymetrix). The quantity of the cRNA labelled with
RiboGreen®
RNA Quantification Reagent (Turner Biosystems, Sunnyvale, CA) was
determined after cleanup by the Sample Cleanup Module (Affymetrix). Fragmentation of
15µg of labelled-cRNA was carried out for 35minutes at 94°C, followed by hybridization for
16 hours at 45°C to Affymetrix GeneChip® Chicken Genome Array, representing
approximately 32,773 transcripts, corresponding to over different 28,000 Gallus gallus genes.
After hybridization, the arrays were washed with 2 different buffers (stringent: 6X SSPE,
0.01% Tween-20 and non-stringent: 100mM MES, 0.1M [Na+], 0.01% Tween-20) and
stained with a complex solution including Streptavidin R-Phycoerythrin conjugate
(Invitrogen/molecular probes, Carlsbad, CA) and anti Streptavidin biotinylated antibody
(Vectors laboratories, Burlingame, CA). The washing and staining steps were performed in a
GeneChip® Fluidics Station 450 (Affymetrix). The Affymetrix GeneChip® Chicken Genome
Arrays were finally scanned with the GeneChip® Scanner 3000 7G piloted by the
GeneChip® Operating Software (GCOS).
All these steps were performed on Affymetrix equipement at INRA-URGV, Evry, France.
The .raw CEL files were imported in R software for data analysis. All raw and normalized
data are available from the Gene Expression Omnibus (GEO) repository at the National
Center for Biotechnology Information (NCBI) [67], accession number GSE7805. Gene
Ontology annotations were performed with NetAffx.
RNA extraction and reverse transcription.
Total RNA was extracted from whole adult tissues (ovary, spleen, intestine, gizzard, liver,
heart, skin, brain, pectoralis muscle, lung and pituitary gland) using Tri-reagent (Euromedex,
Mundolsheim, France) according to the manufacturer’s procedure. RNA quality and quantity

23
were then assessed by using RNA nano chips and Agilent RNA 6000 nano reagents (Agilent
Technologies, Waldbronn, Germany) according to the manufacturer’s instructions. Samples
were stored at -80°C until use. Reverse transcription (RT) was performed to test the
expression of candidate genes in different tissues and at different stages of follicular
maturation and embryo development using polymerase chain reactions (PCR). One
microgram of total RNA extracted from tissues or GDR was digested by RQ1 DNase
(Promega, Madison, WI, USA) and reverse transcribed to first-strand cDNA using Moloney
Murine Leukemia Virus reverse transcriptase I with an oligo dT-random primer mix
(Promega, Madison, WI, USA) according manufacturer’s instructions.
Labelled RT was performed in order to assess mRNA quality in GDR of F1 stage and just
ovulated oocytes. Ten µCi αP32 dCTP was added to the reverse transcription mix in order to
label cDNA. Labelled cDNA was then separated on 1.2% denaturing agarose gel (50mM
NAOH, 1mM EDTA) by electrophoresis. A storage phosphor screen (Amersham Biosciences,
Bucks, UK) was placed on the gel in an exposure cassette (Amersham Biosciences, Bucks,
UK). The signal was detected one hour later with a STORM 840 (Molecular Dynamics), a
phosphor screen imaging system.
Real time RT-PCR
Specific sets of primer pairs (Sigma Genosis), designed using Vecteur NTI software to
amplify fragments of 21 different transcripts, are shown in Table 4. Real time PCR reactions
were carried out in 25 µl containing primers at a final concentration of 150 nm of each, 5 µl of
the RT reaction diluted 1/30 and qPCR Mastermix Plus for Sybr Green I (Eurogentec)
according to the manufacturer’s instructions. Real time PCR was performed using an ABI
Prism 7000 (Applied Biosystems). After incubation at 50°C for 2 min, and 95°C for 10 min,
the thermal cycling protocol was as follows: 40 cycles at 95°C for 15 sec and 60°C for 1 min.
The amounts of 18S rRNA and 28S rRNA were measured in the RT reactions diluted 1/5000
24
using 28S rRNA and 18S rRNA control kits (Eurogentec), respectively, according to the
manufacturer’s instructions. PCR amplification without cDNA was performed systematically
as a negative control. 18S rRNA was used as a reporter gene in the study of the mRNA
tissular expression pattern, whereas β actin, gapdh and ef1α were used as reporter genes in
the mRNA expression study during follicular maturation and early embryo development, the
expression of these three genes being similar in GCs and in GDR (data not shown). In both
cases (tissular expression study or temporal dynamic study) the samples were analyzed in
duplicate on the same plate for a given gene. Real time RT-PCR was performed in the
temporal dynamic study with two biological replicates of each sample. Melting curve analysis
was systematically performed for all genes in order to verify the specificity of the PCR
product. Real time PCR efficiency (E) was measured in duplicate on serial dilutions of cDNA
(pool of reverse-transcribed RNA from GDR and GC samples at the same stages as used for
the temporal dynamic study) for each primer pair and was calculated using the following
equation: E=(101/slope
)−1
. In the tissular expression study the relative amounts of gene
transcripts (R) were calculated according to the equation:
Egene-Ct
R=gene
E18S rRNA-Ct 18S rRNA
Egene-Ct
R=gene
E18S rRNA-Ct 18S rRNA
where Ct is a cycle threshold. In the temporal dynamic study R was calculated using
following equation:
Egene-Ct
R=gene
Mean (Rcef1α, Rcβactin, Rcgapdh)
Egene-Ct
R=gene
Mean (Rcef1α, Rcβactin, Rcgapdh)
where Rc is corrected relative reporter gene expression calculated as explained below. In
order to take into account only fold changes in the expression levels of reporter genes
between samples but not the differences in the expression levels of reporter genes in the

25
sample, the expression levels of reporter genes in each sample (samplei) was adjusted against
the relative amount of ef1α in the F1GDR sample according to the equation:
Hierarchical clustering
The hierarchical classification of data obtained using real time RT-PCR was performed with
the Cluster 3.0 program using unsupervised single linkage or supervised complete linkage
clustering in order to classify biological samples or to group together genes with a similar
expression pattern, respectively [68].
In situ hybridization
Female chickens were sacrificed at different stages of sexual development. Two types of
tissue were used, i.e. mature ovaries, containing follicles of different sizes (50µm-7mm) from
60-week-old hens (most follicles being larger than 300 µm) and immature ovaries, containing
a majority of small follicles (25-500 µm) from 10-week-old hens (most follicles being smaller
than 100 µm). Mature and immature ovaries were then collected and included in Tissue-Tek
(Sakura Finetek Europe BV, Zoeterwoude, The Netherlands). Frozen ovaries were serially
sectioned with a cryostat (thickness 10µm) to perform in situ hybridization experiments using
35S-labeled chicken gene cRNA. The gene antisense and sense constructs used for in situ
hybridization were generated by inserting 700 - 800 bp fragments of chicken gene cDNA into
the pGEM-T vector (Promega, Madison, WI, USA), and selecting a clone with the
appropriate antisense or sense orientation. The gene cDNA fragments were generated by RT-
PCR from chicken ovary mRNA using forward and reverse primers (Table 4). The in situ
hybridization was performed as previously described [69]. Hybridization specificity was
where ∆Ctreporter=Ctreporter in F1GDR−Ctreporter in sample i
Rcreporter= Eef1α-Ct
ef1α in F1GDR x Ereporter∆Ct
reporter

26
assessed by comparing signals obtained with the cRNA antisense probe and the corresponding
cRNA sense probe.
Statistical analysis
Data obtained after Affymetrix microarray hybridization analysis were normalized with the
gcrma algorithm [70], available in the Bioconductor package [71]. Differential analysis was
performed with the varmixt package of R [72]. A double-sided, unpaired t-test was computed
for each gene between the two conditions. Variance of the difference in gene expression was
split between subgroups of genes with homogeneous variance [72]. The raw P values were
adjusted by the Bonferroni method, which controls the Family Wise Error Rate (FWER) [73].
A gene is declared differentially expressed if the Bonferroni-corrected P-Value is less than
0.05.
All other experimental data are presented as means ± SEM. One-way analysis of variance
(ANOVA) was used to test differences. If ANOVA revealed significant effects, the means
were compared by Fisher’s test, with P<0.05 considered significant. Different letters indicate
significant differences.

27
Authors' contributions
SE performed the experiences, the sequence alignment and the microarray analysis. FB
participated in the design of the study and coordinated oocytes and embryos collection. IC
participated in the experiences. SB carried out the microarrays hybridization. MLMM
performed the statistical analysis of microarray data. PM participated in the design of the
study and provided the list of murine oocyte genes identified in silico. EB participated in the
design of the study. MSG conceived of the study, and participated in its design and
coordination. SE and MSG wrote and revised the manuscript. All authors read and approved
the final manuscript.
Acknowledgments
We thank Svétlana Uzbekova and Rozenn Dalbies-Tran for helpful discussion, Sonia Métayer
for igf2 primers and Frederic Mercerand and Jean-Didier Terlot-Bryssine for expert animal
care. This study was supported by the "Institut National de la Recherche Agronomique". S
Elis was supported by a fellowship from the Institut National de la Recherche Agronomique
and "Région Centre".

28
References
1. Evsikov AV, Graber JH, Brockman JM, Hampl A, Holbrook AE, Singh P, Eppig JJ,
Solter D, Knowles BB: Cracking the egg: molecular dynamics and evolutionary
aspects of the transition from the fully grown oocyte to embryo. Genes Dev 2006,
20(19):2713-2727.
2. Evsikov AV, de Vries WN, Peaston AE, Radford EE, Fancher KS, Chen FH, Blake
JA, Bult CJ, Latham KE, Solter D et al: Systems biology of the 2-cell mouse
embryo. Cytogenet Genome Res 2004, 105(2-4):240-250.
3. Hake LE, Richter JD: Translational regulation of maternal mRNA. Biochimica et
Biophysica Acta (BBA) - Reviews on Cancer 1997, 1332(1):M31-M38.
4. Bashirullah A, Cooperstock RL, Lipshitz HD: Spatial and temporal control of RNA
stability. Proc Natl Acad Sci U S A 2001, 98(13):7025-7028.
5. DeRenzo C, Seydoux G: A clean start: degradation of maternal proteins at the
oocyte-to-embryo transition. Trends Cell Biol 2004, 14(8):420-426.
6. Alizadeh Z, Kageyama S, Aoki F: Degradation of maternal mRNA in mouse
embryos: selective degradation of specific mRNAs after fertilization. Mol Reprod
Dev 2005, 72(3):281-290.
7. Schupbach T, Wieschaus E: Female sterile mutations on the second chromosome of
Drosophila melanogaster. I. Maternal effect mutations. Genetics 1989, 121(1):101-
117.
8. Golden A, Sadler PL, Wallenfang MR, Schumacher JM, Hamill DR, Bates G,
Bowerman B, Seydoux G, Shakes DC: Metaphase to anaphase (mat) transition-
defective mutants in Caenorhabditis elegans. J Cell Biol 2000, 151(7):1469-1482.
9. Christians ES: [When the mother further impacts the destiny of her offspring:
maternal effect mutations]. Med Sci (Paris) 2003, 19(4):459-464.
10. Pelegri F, Knaut H, Maischein HM, Schulte-Merker S, Nusslein-Volhard C: A
mutation in the zebrafish maternal-effect gene nebel affects furrow formation
and vasa RNA localization. Curr Biol 1999, 9(24):1431-1440.
11. Kubota HY, Itoh K, Asada-Kubota M: Cytological and biochemical analyses of the
maternal-effect mutant embryos with abnormal cleavage furrow formation in
Xenopus laevis. Dev Biol 1991, 144(1):145-151.
12. Dean J: Oocyte-specific genes regulate follicle formation, fertility and early mouse
development. J Reprod Immunol 2002, 53(1-2):171-180.
13. Zagris N, Kalantzis K, Guialis A: Activation of embryonic genome in chick. Zygote
1998, 6(3):227-231.
14. Meirelles FV, Caetano AR, Watanabe YF, Ripamonte P, Carambula SF, Merighe GK,
Garcia SM: Genome activation and developmental block in bovine embryos.
Animal Reproduction Science Research and Practice III 15th International Congress
on Animal Reproduction 2004, 82-83:13-20.
15. Eric M. Thompson EL, Jean-Paul Renard,: Mouse embryos do not wait for the
MBT: Chromatin and RNA polymerase remodeling in genome activation at the
onset of development. Developmental Genetics 1998, 22(1):31-42.
16. Callebaut M: Origin, fate, and function of the components of the avian germ disc
region and early blastoderm: role of ooplasmic determinants. Dev Dyn 2005,
233(4):1194-1216.
17. Yao HH, Bahr JM: Chicken granulosa cells show differential expression of
epidermal growth factor (EGF) and luteinizing hormone (LH) receptor
29
messenger RNA and differential responsiveness to EGF and LH dependent upon
location of granulosa cells to the germinal disc. Biol Reprod 2001, 64(6):1790-
1796.
18. Etches RJ, Petitte JN: Reptilian and avian follicular hierarchies: models for the
study of ovarian development. J Exp Zool Suppl 1990, 4:112-122.
19. Olszanska B: [Role of polyadenylic segments and RNA polyadenylation in
embryonic development]. Postepy Biochem 1985, 31(2):365-384.
20. Olszanska B, Borgul A: Quantitation of nanogram amounts of nucleic acids in the
presence of proteins by the ethidium bromide staining technique. Acta Biochim
Pol 1990, 37(1):59-63.
21. Olszanska B, Borgul A: Maternal RNA content in oocytes of several mammalian
and avian species. J Exp Zool 1993, 265(3):317-320.
22. Olszanska B, Kludkiewicz B, Lassota Z: Transcription and polyadenylation
processes during early development of quail embryo. J Embryol Exp Morphol
1984, 79:11-24.
23. Tsunekawa N, Naito M, Sakai Y, Nishida T, Noce T: Isolation of chicken vasa
homolog gene and tracing the origin of primordial germ cells. Development 2000,
127(12):2741-2750.
24. Wang Y, Li J, Ying Wang C, Yan Kwok AH, Leung FC: Epidermal growth factor
(EGF) receptor ligands in the chicken ovary: I. Evidence for heparin-binding
EGF-like growth factor (HB-EGF) as a potential oocyte-derived signal to control
granulosa cell proliferation and HB-EGF and kit ligand expression.
Endocrinology 2007, 148(7):3426-3440.
25. Dade S, Callebaut I, Mermillod P, Monget P: Identification of a new expanding
family of genes characterized by atypical LRR domains. Localization of a cluster
preferentially expressed in oocyte. FEBS Lett 2003, 555(3):533-538.
26. Dade S, Callebaut I, Paillisson A, Bontoux M, Dalbies-Tran R, Monget P: In silico
identification and structural features of six new genes similar to MATER
specifically expressed in the oocyte. Biochem Biophys Res Commun 2004,
324(2):547-553.
27. Paillisson A, Dade S, Callebaut I, Bontoux M, Dalbies-Tran R, Vaiman D, Monget P:
Identification, characterization and metagenome analysis of oocyte-specific genes
organized in clusters in the mouse genome. BMC Genomics 2005, 6(1):76.
28. mapview [http://www.ncbi.nlm.nih.gov/mapviewh]
29. blat search [http://www.genome.ucsc.edu/cgi-bin/hgBlat]
30. Elis S, Dupont J, Couty I, Persani L, Govoroun M, Blesbois E, Batellier F, Monget P:
Expression and biological effects of bone morphogenetic protein-15 in the hen
ovary. J Endocrinol 2007, 194(3):485-497.
31. Okumura H, Kohno Y, Iwata Y, Mori H, Aoki N, Sato C, Kitajima K, Nadano D,
Matsuda T: A newly identified zona pellucida glycoprotein, ZPD, and dimeric ZP1
of chicken egg envelope are involved in sperm activation on sperm-egg
interaction. Biochem J 2004, 384(Pt 1):191-199.
32. Goudet G, Mugnier S, Callebaut I, Monget P: Phylogenetic Analysis and
Identification of Pseudogenes Reveal a Progressive Loss of Zona Pellucida Genes
During Evolution of Vertebrates. Biol Reprod 2007.
33. Marina S Govoroun MP, Eric Pailhoux, Julie Cocquet, Jean-Pierre Brillard, Isabelle
Couty, Florence Batellier, Corinne Cotinot,: Isolation of chicken homolog of the
FOXL2 gene and comparison of its expression patterns with those of aromatase
during ovarian development. Developmental Dynamics 2004, 231(4):859-870.

30
34. Aegerter S, Jalabert B, Bobe J: Large scale real-time PCR analysis of mRNA
abundance in rainbow trout eggs in relationship with egg quality and post-
ovulatory ageing. Mol Reprod Dev 2005, 72(3):377-385.
35. Heck A, Metayer S, Onagbesan OM, Williams J: mRNA expression of components
of the IGF system and of GH and insulin receptors in ovaries of broiler breeder
hens fed ad libitum or restricted from 4 to 16 weeks of age. Domest Anim
Endocrinol 2003, 25(3):287-294.
36. Anckar J, Sistonen L: Heat shock factor 1 as a coordinator of stress and
developmental pathways. Adv Exp Med Biol 2007, 594:78-88.
37. Okumura H, Aoki N, Sato C, Nadano D, Matsuda T: Heterocomplex Formation and
Cell-Surface Accumulation of Hen's Serum Zona Pellucida B1 (ZPB1)with ZPC
Expressed by a Mammalian Cell Line (COS-7): A Possible Initiating Step of Egg-
Envelope Matrix Construction. Biol Reprod 2007, 76(1):9-18.
38. Schmidt M, Oskarsson MK, Dunn JK, Blair DG, Hughes S, Propst F, Vande Woude
GF: Chicken homolog of the mos proto-oncogene. Mol Cell Biol 1988, 8(2):923-
929.
39. Maddox-Hyttel P, Svarcova O, Laurincik J: Ribosomal RNA and nucleolar proteins
from the oocyte are to some degree used for embryonic nucleolar formation in
cattle and pig. Theriogenology 2007, 68 Suppl 1:S63-70.
40. De La Fuente R, Viveiros MM, Burns KH, Adashi EY, Matzuk MM, Eppig JJ: Major
chromatin remodeling in the germinal vesicle (GV) of mammalian oocytes is
dispensable for global transcriptional silencing but required for centromeric
heterochromatin function. Dev Biol 2004, 275(2):447-458.
41. Haccard O, Jessus C: Oocyte maturation, Mos and cyclins--a matter of synthesis:
two functionally redundant ways to induce meiotic maturation. Cell Cycle 2006,
5(11):1152-1159.
42. Inoue D, Ohe M, Kanemori Y, Nobui T, Sagata N: A direct link of the Mos-MAPK
pathway to Erp1/Emi2 in meiotic arrest of Xenopus laevis eggs. Nature 2007,
446(7139):1100-1104.
43. Yue J, Ferrell JE, Jr: Mechanistic Studies of the Mitotic Activation of Mos. Mol
Cell Biol 2006, 26(14):5300-5309.
44. Buanne P, Corrente G, Micheli L, Palena A, Lavia P, Spadafora C, Lakshmana MK,
Rinaldi A, Banfi S, Quarto M et al: Cloning of PC3B, a novel member of the
PC3/BTG/TOB family of growth inhibitory genes, highly expressed in the
olfactory epithelium. Genomics 2000, 68(3):253-263.
45. Pennetier S, Uzbekova S, Guyader-Joly C, Humblot P, Mermillod P, Dalbies-Tran R:
Genes Preferentially Expressed in Bovine Oocytes Revealed by Subtractive and
Suppressive Hybridization. Biol Reprod 2005, 73(4):713-720.
46. Vallee M, Gravel C, Palin M-F, Reghenas H, Stothard P, Wishart DS, Sirard M-A:
Identification of Novel and Known Oocyte-Specific Genes Using Complementary
DNA Subtraction and Microarray Analysis in Three Different Species. Biol
Reprod 2005, 73(1):63-71.
47. Aizawa K, Shimada A, Naruse K, Mitani H, Shima A: The medaka midblastula
transition as revealed by the expression of the paternal genome. Gene Expr
Patterns 2003, 3(1):43-47.
48. Xu H, Li M, Gui J, Hong Y: Cloning and expression of medaka dazl during
embryogenesis and gametogenesis. Gene Expression Patterns 2007, 7(3):332-338.
49. Wassarman PM, Jovine L, Litscher ES: Mouse zona pellucida genes and
glycoproteins. Cytogenet Genome Res 2004, 105(2-4):228-234.
31
50. Zeng F, Schultz RM: Gene expression in mouse oocytes and preimplantation
embryos: use of suppression subtractive hybridization to identify oocyte- and
embryo-specific genes. Biol Reprod 2003, 68(1):31-39.
51. Epifano O, Liang LF, Familari M, Moos MC, Jr., Dean J: Coordinate expression of
the three zona pellucida genes during mouse oogenesis. Development 1995,
121(7):1947-1956.
52. Takeuchi Y, Nishimura K, Aoki N, Adachi T, Sato C, Kitajima K, Matsuda T: A 42-
kDa glycoprotein from chicken egg-envelope, an avian homolog of the ZPC
family glycoproteins in mammalian zona pellucida . Its first identification, cDNA
cloning and granulosa cell-specific expression European Journal of Biochemistry
1999, 260(3):736-742.
53. Kolle S, Dubois CS, Caillaud M, Lahuec C, Sinowatz F, Goudet G: Equine zona
protein synthesis and ZP structure during folliculogenesis, oocyte maturation,
and embryogenesis. Mol Reprod Dev 2007, 74(7):851-859.
54. Wu X, Viveiros MM, Eppig JJ, Bai Y, Fitzpatrick SL, Matzuk MM: Zygote arrest 1
(Zar1) is a novel maternal-effect gene critical for the oocyte-to-embryo transition.
Nat Genet 2003, 33(2):187-191.
55. Uzbekova S, Roy-Sabau M, Dalbies-Tran R, Perreau C, Papillier P, Mompart F,
Thelie A, Pennetier S, Cognie J, Cadoret V et al: Zygote arrest 1 gene in pig, cattle
and human: evidence of different transcript variants in male and female germ
cells. Reprod Biol Endocrinol 2006, 4:12.
56. Cox DN, Lu B, Sun TQ, Williams LT, Jan YN: Drosophila par-1 is required for
oocyte differentiation and microtubule organization. Curr Biol 2001, 11(2):75-87.
57. Ossipova O, He X, Green J: Molecular cloning and developmental expression of
Par-1/MARK homologues XPar-1A and XPar-1B from Xenopus laevis. Mech Dev
2002, 119 Suppl 1:S143-148.
58. Ossipova O, Dhawan S, Sokol S, Green JB: Distinct PAR-1 proteins function in
different branches of Wnt signaling during vertebrate development. Dev Cell
2005, 8(6):829-841.
59. Acevedo N, Smith GD: Oocyte-specific gene signaling and its regulation of
mammalian reproductive potential. Front Biosci 2005, 10:2335-2345.
60. Malewska A, Olszanska B: Accumulation and localisation of maternal RNA in
oocytes of Japanese quail. Zygote 1999, 7(1):51-59.
61. Eyal-Giladi H, Kochav S: From cleavage to primitive streak formation: a
complementary normal table and a new look at the first stages of the development of the chick. I. General morphology. Dev Biol 1976, 49(2):321-337.
62. Hamburger V, Hamilton HL: A series of normal stages in the development of the
chick embryo. 1951. Dev Dyn 1992, 195(4):231-272.
63. Perry MM, Gilbert AB, Evans AJ: The structure of the germinal disc region of the
hen's ovarian follicle during the rapid growth phase. J Anat 1978, 127(Pt 2):379-
392.
64. Tischkau SA, Bahr JM: Avian germinal disc region secretes factors that stimulate
proliferation and inhibit progesterone production by granulosa cells. Biol Reprod
1996, 54(4):865-870.
65. pubmed [http://www.ncbi.nlm.nih.gov/BLAST/Blast.cgi]
66. ensembl [http://www.ensembl.org/Gallus_gallus/syntenyview]
67. Wheeler DL, Barrett T, Benson DA, Bryant SH, Canese K, Chetvernin V, Church
DM, DiCuccio M, Edgar R, Federhen S et al: Database resources of the National
Center for Biotechnology Information. Nucleic Acids Res 2006, 34(Database
issue):D173-180.

32
68. Eisen MB, Spellman PT, Brown PO, Botstein D: Cluster analysis and display of
genome-wide expression patterns. Proc Natl Acad Sci U S A 1998, 95(25):14863-
14868.
69. Pierre A, Pisselet C, Dupont J, Bontoux M, Monget P: Bone morphogenetic protein
5 expression in the rat ovary: biological effects on granulosa cell proliferation
and steroidogenesis. Biol Reprod 2005, 73(6):1102-1108.
70. Irizarry RA, Hobbs B, Collin F, Beazer-Barclay YD, Antonellis KJ, Scherf U, Speed
TP: Exploration, normalization, and summaries of high density oligonucleotide
array probe level data. Biostatistics 2003, 4(2):249-264.
71. gentleman R, Carey V: Bioconductor. RNews 2002, 2:1116.
72. Delmar P, Robin S, Daudin JJ: VarMixt: efficient variance modelling for the
differential analysis of replicated gene expression data. Bioinformatics 2005,
21(4):502-508.
73. Ge Y, Dudoit S, Speed TP: Resampling-based multiple testing for microarray data
analysis. TEST 12 2003:1-44.
33
Figure legends
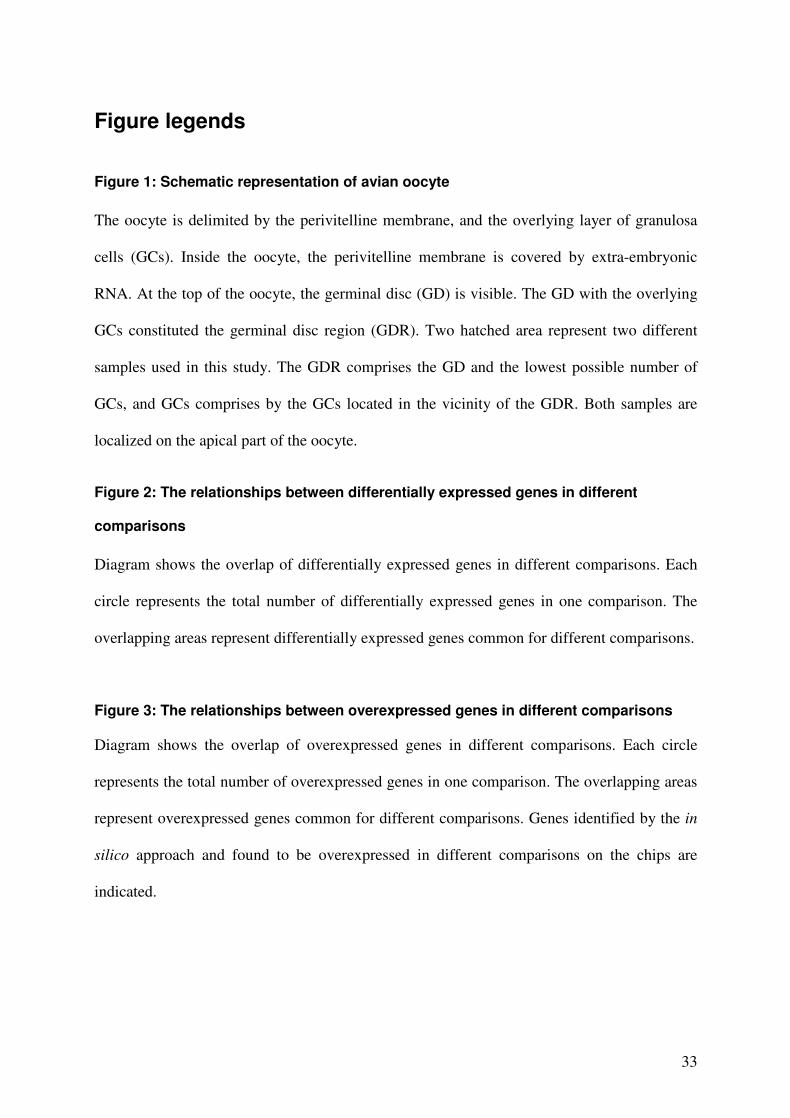
Figure 1: Schematic representation of avian oocyte
The oocyte is delimited by the perivitelline membrane, and the overlying layer of granulosa
cells (GCs). Inside the oocyte, the perivitelline membrane is covered by extra-embryonic
RNA. At the top of the oocyte, the germinal disc (GD) is visible. The GD with the overlying
GCs constituted the germinal disc region (GDR). Two hatched area represent two different
samples used in this study. The GDR comprises the GD and the lowest possible number of
GCs, and GCs comprises by the GCs located in the vicinity of the GDR. Both samples are
localized on the apical part of the oocyte.
Figure 2: The relationships between differentially expressed genes in different
comparisons
Diagram shows the overlap of differentially expressed genes in different comparisons. Each
circle represents the total number of differentially expressed genes in one comparison. The
overlapping areas represent differentially expressed genes common for different comparisons.
Figure 3: The relationships between overexpressed genes in different comparisons
Diagram shows the overlap of overexpressed genes in different comparisons. Each circle
represents the total number of overexpressed genes in one comparison. The overlapping areas
represent overexpressed genes common for different comparisons. Genes identified by the in
silico approach and found to be overexpressed in different comparisons on the chips are
indicated.
34
Figure 4: Gene ontology (GO) classification of genes overexpressed in GDR of mature
oocytes and in F1 GCs identified using Affymetrix microarray analysis.
The rows represent percentages of genes linked to a function calculated from a total number
of genes linked to any function. The columns present sets of genes overexpressed in different
cell layers. GO annotations were found with Netaffx software, as described in Materials and
Methods.
Figure 5: Real-time PCR analysis of the expression of candidate genes in hen tissues
Total RNA was isolated from whole ovary (O), spleen (Sp), intestine (I), gizzard (G), liver
(L), heart (H), skin (S), brain (B), pectoralis muscle (M), lung (Lu) and pituitary gland (Pg)
and real time PCR was performed as described in the Materials and Methods. Ribosomic
RNA 18S was used as a reporter gene. The negative control (water) is indicated as (C-). The
results represent the means ± SEM. The same letters indicate that differences were not
significant. Different letters indicate that differences were significant (p<0.05).
Figure 6: Ribosomic and messenger RNA profiles during oocyte maturation and early
embryo development
Total RNA was extracted from the GDR of an oocyte or from the embryo. RNA quality was
assessed using nanochips (Agilent technologies) as described in the Materials and Methods.
This analysis represents rRNA 18S and 28S subunit profiles in the samples (A). Ribosomic
RNA 18S and 28S subunit profiles were then confirmed by real time PCR analysis (B and C,
respectively) using the TaqMan kit (Eurogentec) as described in the Materials and Methods.
Labelled 32
P reverse transcription was performed to investigate the quality of mRNA
extracted from F1 GDR, Ov GDR and from the ovary. The radioactive signal for samples and
ethidium bromide staining for the ladder are shown (D).

35
Figure 7: Unsupervised hierarchical clustering of candidate genes during follicular
maturation and early embryo development
Real time PCR analysis was performed in duplicate on samples at 18 different stages with two
biological replicates. Total GDR and GC RNA from different preovulatory follicles (F1 to
F6), and total GDR RNA from just ovulated oocytes and early embryos at 6.5h, 12h, 24h, 36h
and 48h post ovulation were extracted as described in the Materials and Methods.
Unsupervised hierarchical clustering of biological samples was performed using Cluster 3.0
software as described in the Materials and Methods. Node correlation thresholds are
indicated.
Figure 8: Supervised hierarchical clustering of candidate genes during follicular
maturation and early embryo development
Real time PCR analysis was performed in duplicate on samples at 18 different stages with two
biological replicates. Total GDR and GC RNA from different preovulatory follicles (F1 to
F6), and total GDR RNA from just ovulated oocytes and early embryos at 6.5h, 12h, 24h, 36h
and 48h post ovulation were extracted as described in the Materials and Methods. Supervised
hierarchical clustering of genes was performed using Cluster 3.0 software as described in the
Materials and Methods. Five clusters are shown (C1 to C5). Node correlation thresholds are
indicated for each cluster.
Figure 9: Expression profiles of some representative genes from 5 clusters (C1 to C5),
defined using supervised hierarchical clustering, during follicular maturation and
early embryogenesis.
Real time PCR analyses were performed in duplicate on samples at 18 different stages with
two biological replicates. Total mRNA of GDR and GCs from different preovulatory follicles
(F1 to F6), and from GDR of just ovulated oocytes and early embryos at 6.5h, 12h, 24h, 36h

36
and 48h post ovulation were extracted as described in the Materials and Methods. Three
different reporter genes were used (β actin, ef1 α and gapdh) because their expression was
stable during oogenesis and early embryo development (data not shown). Results represent
means ± SEM. The same letters indicate that differences were not significant. Different letters
indicate that differences were significant (p<0.05).
Figure 10: Localization of candidate genes mRNA in the hen ovary
Localization of dazL(A), btg4 (B), vasa (C), fbox (D), chkmos (E), zpA (F), zpC (G) and zpD
(H) by in situ hybridization in immature ovaries (A, B, C and D) or in mature ovaries (E, F, G
and H) as described in the Materials and Methods. Bright fields are on the left, and dark fields
are on the right. The control sections were hybridized with sense probes. The hybridization
with only one sense probes is represented because no signal was observed after hybridization
with any sense probes. Oocytes (Oo), granulosa cells (GCs) and somatic cells (SCs) are
indicated. Scale bar = 100 µm.

37
Tables
Table 1 - Accession numbers of murine sequences used and of
homolog chicken sequences found
Bold text represents chicken genes whose syntenic regions are conserved with the appropriate
murine homologs.
Murine genes Chicken genes
Localisation Localisation Accession
number Name Chromosome
Position (kb)
Accession number Name
tblastn score
Chromosome
Position (kb) abbreviation
XM205433.2 Oog2-like 4 E1 142170 XM_417634 similar to zinc finger protein RIZ.
partial 100 21 4843 znfingerRIZ
XM357175.2 TRAF-interacting
protein 2A1 6081 XM_416727 similar to mtprd protein - mouse 102 1 100734 mtprd
AK054339.1 FBXO12A 9F2 109192 XM_419103 similar to hypothetical protein 104 2 91887 fbox
AY351591.1 Msh4 3H3 154505.7 XM_422549 similar to MutS homolog 4 107 8 29983 msh4
XM_138939.3 Speer-like 14A3 20635 XM_421604 similar to Discs. large homolog 5 132 6 12497.5 discs5
AK018361.1 Zfp393 4D2 116103.6 XM_422416 similar to Kruppel-like
transcription factor neptune 288 8 20700.7 ktfn
NM_172481.1 Nalp9E 7A1 5473.6 XM_420951 similar to mast cell maturation
inducible protein 1 473 5 3008 mcmip
BC066811.1 Btg4 9A5 51279 XM_417919 similar to p30 B9.10 599 24 5212.7 btg4
XM_355960.1 PAR-1Alike 7A3 11760.3 XM_421385
similar to MAP/microtubule affinity-regulating kinase 3 long
isoform 643 5 47042.5 mark3
AY191415.1 Zar1 5 72968 XM_424318 Gallus gallus similar to zygote
arrest 1 643 4 68326.1 zar1
XM_139155.2 14D3 71005 XM_416218 similar to transcription factor 20
isoform 1 688 1 46012.9 transfact20
NM010021.2 Dazl 17B1 48475 NM_204218 deleted in azoospermia-like 863 2 33589.4 dazL
NM_020021.1 Mos 4A1 3798.4 M19412 Chicken c-mos proto-oncogene 955 2 110418 chkmos
NM_011775.2 ZP2 7F2 107432.5 XM_424608 similar to zona pellucida A 1146 6 15797.3 zpA
NM_201370.1 WEE1hu 6B1 40383 XM_425491 similar to Wee1A kinase 1218 1 54018.4 wee
NM_011776.1 ZP3 5G2 133429.5 D89097 zona pellucida C protein 2149 10 188.600 zpC
38
Table 2 - Genes differentially expressed in Affymetrix experiment
Bold text represents genes that were further studied using real time RT-PCR
Affymetrix reference Accession number Gene name found by Blast search
Abbreviation of genes studied
Fold change Comparison
Number of overexpressed
genes
Gga.305.1.S1_at NM_204783.1 Gallus gallus wingless-type MMTV integration site family, member
4 150
GgaAffx.13126.1.S1_at AJ721023 Gallus gallus mRNA for hypothetical protein, clone 32l2 129
Gga.5341.1.S1_at BU365377 Finished cDNA, clone ChEST746h6 105
Gga.7980.1.S1_at CD730241 similar to Interferon regulatory factor 6 102
Gga.4536.2.S1_a_at BX934646.1 aldo-keto reductase family 1, member D1 (delta 4-3-ketosteroid-5-
beta-reductase) 94
Gga.9136.2.S1_a_at CD740066 Gallus gallus tumor-associated calcium signal transducer 1 92
GgaAffx.11525.1.S1_s_at AJ719422 Gallus gallus claudin 1 91
GgaAffx.20379.1.S1_at CR524236.1 Finished cDNA, clone ChEST914o3 90
Gga.9936.1.S1_at BX936026.2 Amyotrophic lateral sclerosis 2 chromosomal region candidate
gene protein 7 83
Gga.5597.1.S1_at BU450115 B-cell translocation gene 4 btg4 52
F1 GCs and
Ov GDR
56 genes overexpressed
in Ov GDR
Gga.14454.1.S1_at NM_213576.1 zona pellucida protein D zpD 890
Gga.12391.1.S1_at BX935169.2 Gallus gallus similar to adrenodoxin homolog 718
Gga.1824.1.S1_at BU350625 Gallus gallus finished cDNA, clone ChEST974b18 703
Gga.6358.1.S1_at BX265773 Gallus gallus similar to chromosome 9 open reading frame 61 687
Gga.596.1.S2_at NM_205118.1 Gallus gallus 3beta-hydroxysteroid dehydrogenase/delta5-delta4
isomerase 667
Gga.17706.1.S1_at CR388473.1 Gallus gallus finished cDNA, clone ChEST591g11 579
Gga.3095.1.S1_a_at BX932425.2 similar to hypothetical protein FLJ22662 561
Gga.13065.1.S1_at BU424424 Gallus gallus finished cDNA, clone ChEST537h21 559
GgaAffx.5954.1.S1_at ENSGALT00000015374.1 Gallus gallus similar to LRTS841 557
GgaAffx.24194.1.S1_at ENSGALT00000021874.1 Gallus gallus similar to CG8947-PA 534
F1 GCs and
Ov GDR
392 genes overexpressed
in F1 GCs
Gga.305.1.S1_at NM_204783.1 Gallus gallus wingless-type MMTV integration site family, member
4 90
Gga.7980.1.S1_at CD730241 similar to Interferon regulatory factor 6 80
Gga.6103.1.S1_x_at BU242707 Gallus gallus similar to CG31613-PA 75
Gga.4901.1.S1_at BU424477 Gallus gallus similar to carbonic anhydrase 9 72
Gga.9136.2.S1_a_at CD740066 Gallus gallus tumor-associated calcium signal transducer 1 66
Gga.5133.1.S1_at NM_204218.1 Gallus gallus deleted in azoospermia-like dazL 34
Gga.5597.1.S1_at BU450115 B-cell translocation gene 4 btg4 33
Gga.8089.1.S1_at BU258896 Gallus gallus similar to Kruppel-like transcription factor neptune ktfn 18
Gga.5714.1.S1_at BX268842 Gallus gallus similar to zona pellucida A zpA 12
GgaAffx.9819.1.S1_at ENSGALT00000024851.1 oocyte maturation factor Mos chkmos 10
F1 GDR and
F1 GCs
238 genes overexpressed
in F1 GDR
Gga.9254.1.S1_at CF384921 120
GgaAffx.96.1.S1_s_at ENSGALT00000000192.1 Gallus gallus similar to CG8947-PA 68
Gga.12454.1.S1_at BU435007 similar to relaxin 3 preproprotein 68
Gga.11031.1.S1_at BU450054 Gallus gallus finished cDNA, clone ChEST699k2 56
GgaAffx.24194.1.S1_at ENSGALT00000021874.1 Gallus gallus similar to CG8947-PA 31
Gga.572.1.S1_at NM_205078.1 Gallus gallus nuclear receptor subfamily 5, group A, member 2 27
Gga.10434.1.S1_at BX933855.1 Gallus gallus similar to chromosome 9 open reading frame 61 19
Gga.4510.1.S1_a_at NM_205261.1 Gallus gallus finished cDNA, clone ChEST159o8 17
Gga.7212.1.S1_at BU124346 Gallus gallus similar to Ephx1 protein 14
Gga.3667.1.S1_at NM_204839.1 Gallus gallus reversion-induced LIM protein 13
F1 GDR And
F1 GCs
104 genes overexpressed
in F1 GCs
Gga.14454.1.S1_at NM_213576.1 Gallus gallus zona pellucida protein D zpD 602
Gga.12391.1.S1_at BX935169.2 similar to adrenodoxin homolog - chicken 321
Gga.596.1.S2_at NM_205118.1 Gallus gallus 3beta-hydroxysteroid dehydrogenase delta5-delta4
isomerase 317
Gga.17706.1.S1_at CR388473.1 Finished cDNA, clone ChEST591g11 307
GgaAffx.5954.1.S1_at ENSGALT00000015374.1 similar to LRTS841 247
Gga.6358.1.S1_at BX265773 weak similarity to HUMAN Putative protein X123 240
Gga.1824.1.S1_at BU350625 Finished cDNA, clone ChEST974b18 213
Gga.13065.1.S1_at BU424424 Finished cDNA, clone ChEST738j4 195
Gga.3095.1.S1_a_at BX932425.2 similar to hypothetical protein FLJ22662 183
Gga.7210.1.S1_at NM_204389.1 Gallus gallus zona pellucida glycoprotein 3 zpC 64
F1 GDR And
Ov GDR
92 genes overexpressed
in F1 GDR
39
Table 3 - Accession number of chicken genes selected on the basis
of the literature
Bibliographic reference Accession number Name Abbreviation
Govoroun et al. 2004 NM_001012612 forkhead box L2 foxL2
Aegerter et al. 2005, Heck et al. 2005 XM_421026 Insulin growth factor 2 Igf 2
Tsunekawa et al. 2000 NM_204708 Gallus gallus DEAD (Asp-Glu-Ala-Asp) box polypeptide 4 (DDX4) cvh
Hsf1 Anckar et al. 2007 L06098 chicken heat shock factor protein 1 hsf1
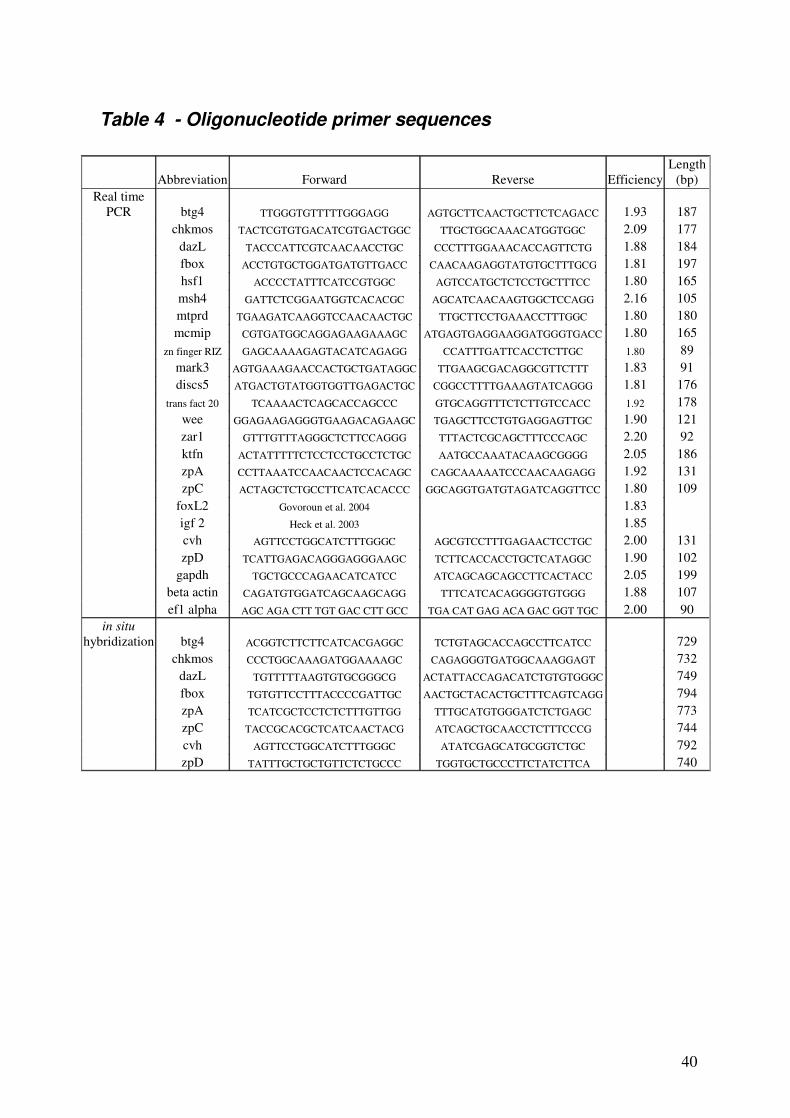
40
Table 4 - Oligonucleotide primer sequences
Abbreviation Forward Reverse Efficiency
Length
(bp)
Real time
PCR btg4 TTGGGTGTTTTTGGGAGG AGTGCTTCAACTGCTTCTCAGACC 1.93 187
chkmos TACTCGTGTGACATCGTGACTGGC TTGCTGGCAAACATGGTGGC 2.09 177
dazL TACCCATTCGTCAACAACCTGC CCCTTTGGAAACACCAGTTCTG 1.88 184
fbox ACCTGTGCTGGATGATGTTGACC CAACAAGAGGTATGTGCTTTGCG 1.81 197
hsf1 ACCCCTATTTCATCCGTGGC AGTCCATGCTCTCCTGCTTTCC 1.80 165
msh4 GATTCTCGGAATGGTCACACGC AGCATCAACAAGTGGCTCCAGG 2.16 105
mtprd TGAAGATCAAGGTCCAACAACTGC TTGCTTCCTGAAACCTTTGGC 1.80 180
mcmip CGTGATGGCAGGAGAAGAAAGC ATGAGTGAGGAAGGATGGGTGACC 1.80 165
zn finger RIZ GAGCAAAAGAGTACATCAGAGG CCATTTGATTCACCTCTTGC 1.80 89
mark3 AGTGAAAGAACCACTGCTGATAGGC TTGAAGCGACAGGCGTTCTTT 1.83 91
discs5 ATGACTGTATGGTGGTTGAGACTGC CGGCCTTTTGAAAGTATCAGGG 1.81 176
trans fact 20 TCAAAACTCAGCACCAGCCC GTGCAGGTTTCTCTTGTCCACC 1.92 178
wee GGAGAAGAGGGTGAAGACAGAAGC TGAGCTTCCTGTGAGGAGTTGC 1.90 121
zar1 GTTTGTTTAGGGCTCTTCCAGGG TTTACTCGCAGCTTTCCCAGC 2.20 92
ktfn ACTATTTTTCTCCTCCTGCCTCTGC AATGCCAAATACAAGCGGGG 2.05 186
zpA CCTTAAATCCAACAACTCCACAGC CAGCAAAAATCCCAACAAGAGG 1.92 131
zpC ACTAGCTCTGCCTTCATCACACCC GGCAGGTGATGTAGATCAGGTTCC 1.80 109
foxL2 Govoroun et al. 2004 1.83
igf 2 Heck et al. 2003 1.85
cvh AGTTCCTGGCATCTTTGGGC AGCGTCCTTTGAGAACTCCTGC 2.00 131
zpD TCATTGAGACAGGGAGGGAAGC TCTTCACCACCTGCTCATAGGC 1.90 102
gapdh TGCTGCCCAGAACATCATCC ATCAGCAGCAGCCTTCACTACC 2.05 199
beta actin CAGATGTGGATCAGCAAGCAGG TTTCATCACAGGGGTGTGGG 1.88 107
ef1 alpha AGC AGA CTT TGT GAC CTT GCC TGA CAT GAG ACA GAC GGT TGC 2.00 90
in situ
hybridization btg4 ACGGTCTTCTTCATCACGAGGC TCTGTAGCACCAGCCTTCATCC 729
chkmos CCCTGGCAAAGATGGAAAAGC CAGAGGGTGATGGCAAAGGAGT 732
dazL TGTTTTTAAGTGTGCGGGCG ACTATTACCAGACATCTGTGTGGGC 749
fbox TGTGTTCCTTTACCCCGATTGC AACTGCTACACTGCTTTCAGTCAGG 794
zpA TCATCGCTCCTCTCTTTGTTGG TTTGCATGTGGGATCTCTGAGC 773
zpC TACCGCACGCTCATCAACTACG ATCAGCTGCAACCTCTTTCCCG 744
cvh AGTTCCTGGCATCTTTGGGC ATATCGAGCATGCGGTCTGC 792
zpD TATTTGCTGCTGTTCTCTGCCC TGGTGCTGCCCTTCTATCTTCA 740

41
Additional files
Additionnal file 1
File format PNG
Title : Real time RT-PCR analysis of expression of chkmos, btg4, wee, zpA, dazL and cvh
transcript during follicular maturation and early embryo development
Description : The real time RT-PCR data provided represent the related expression of the 6
genes chkmos, btg4, wee, zpA, dazL and cvh during follicular maturation and early embryo
development, in granulosa cells and in germinal disc region.
Additionnal file 2
File format PNG
Title : Real time RT-PCR analysis of expression of ktfn, zar1, zpC, zpD and mcmip transcript
during follicular maturation and early embryo development
Description : The real time RT-PCR data provided represent the related expression of the 5
genes ktfn, zar1, zpC, zpD and mcmip during follicular maturation and early embryo
development, in granulosa cells and in germinal disc region
Additionnal file 3
File format PNG
Title : Real time RT-PCR analysis of expression of mark3, igf2, trans fact 20, znfingerRIZ,
msh4 and foxL2 during follicular maturation and early embryo development
Description : The real time RT-PCR data provided represent the related expression of the 6
genes mark3, igf2, trans fact 20, znfingerRIZ, msh4 and foxL2 during follicular maturation
and early embryo development, in granulosa cells and in germinal disc region
Additionnal file 4
File format PNG
Title : Real time RT-PCR analysis of expression of discs5, mtprd, fbox and hsf1 during
follicular maturation and early embryo development
Description : The real time RT-PCR data provided represent the related expression of the 4
genes discs5, mtprd, fbox and hsf1 during follicular maturation and early embryo
development, in granulosa cells and in germinal disc region
Related expression measured by real time RT-PCR (as described in materials and methods)

Figure 1

Figure 2

Figure 3
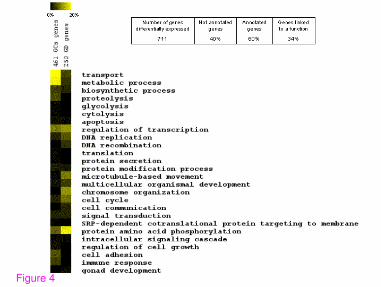
Figure 4

Figure 5

Figure 6

Figure 7

Figure 8

Figure 9
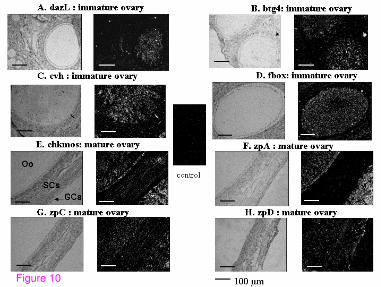
Figure 10

Additional files provided with this submission:
Additional file 1: additionnal file 1.png, 6Khttp://www.biomedcentral.com/imedia/1648444707183688/supp1.pngAdditional file 2: additionnal file 2.png, 5Khttp://www.biomedcentral.com/imedia/1097594712183688/supp2.pngAdditional file 3: additionnal file 3.png, 6Khttp://www.biomedcentral.com/imedia/1284988998183687/supp3.pngAdditional file 4: additionnal file 4.png, 4Khttp://www.biomedcentral.com/imedia/3554321161836885/supp4.png