blank page · · 2016-11-18provided at the top of this page. ... from the graph, identify which...
TRANSCRIPT

For Examiner’s use only
Question Number Marks
12345678
Total Marks
9700
TIME1 hour 30 minutes.
INSTRUCTIONS TO CANDIDATESWrite your Centre Number and Candidate Number in the spaces provided at the top of this page.Write your answers in the spaces provided in this question paper.There is an extra lined page at the end of the paper if required.Answer all eight questions.You are provided with Photographs 2.6A and 2.6B for use with Question 6 in this paper. Do not write your answers on these photographs.
INFORMATION FOR CANDIDATESThe total mark for this paper is 75.Section A carries 60 marks. Section B carries 15 marks.Figures in brackets printed down the right-hand side of pages indicate the marks awarded to each question or part question.You are reminded of the need for good English and clear presentation in your answers.Use accurate scientific terminology in all answers.You should spend approximately 20 minutes on Section B.You are expected to answer Section B in continuous prose.Quality of written communication will be assessed in Section B, and awarded a maximum of 2 marks.
ADVANCED SUBSIDIARY (AS)General Certificate of Education
2015
Biology
Assessment Unit AS 2assessing
Organisms and Biodiversity
[AB121]WEDNESDAY 17 JUNE, MORNING
Centre Number
Candidate Number
AB
121
*AB121*

29700
BLANK PAGE

3 [Turn over9700
Examiner Only Marks Remark
Section A
1 Identify the word or phrase described by each of the following statements, which relate to the mammalian heart.
• The ability of cardiac muscle to contract without stimulation from an external source
_______________________________________________________
• The specialised muscle fibres which convey an impulse down the septum from the atrio-ventricular node
_______________________________________________________
• The structures which prevent the atrio-ventricular valves from turning inside out during ventricular systole
_______________________________________________________
• The valves which close when arterial pressure exceeds ventricular pressure
_______________________________________________________
• The arteries which carry oxygenated blood to the heart muscle itself
_______________________________________________________ [5]

49700
Examiner Only Marks Remark
2 Red blood cells contain a pigment called haemoglobin which is responsible for the transport of oxygen in the blood.
(a) Describe concisely the structure of a molecule of haemoglobin.
_______________________________________________________
_______________________________________________________
_______________________________________________________
_____________________________________________________ [2]
The oxygen dissociation curve for human haemoglobin is shown in the graph below.
100
90
80
70
60
50
40
30
20
10
0 0 2 4 6 8 10 12 14
Partial pressure of oxygen/kPa
Sat
urat
ion
of h
aem
oglo
bin
with
oxy
gen/
%
(b) (i) On the horizontal axis of the graph, indicate with an X the approximate partial pressure of oxygen in the alveoli. [1]
(ii) Determine the partial pressure of oxygen which results in 50% saturation of haemoglobin with oxygen.
_________________ kPa [1]
Examiner Only Marks Remark

5 [Turn over9700
Examiner Only Marks Remark
The partial pressure of oxygen which results in 50% saturation of haemoglobin in an animal is termed the P50 value.
The graph below shows P50 values for haemoglobin in a number of different animals.
0
1
2
3
4
5
6
7
8
Alpaca Pig Pigeon Lugworm
Animal
P50
val
ue/k
Pa
(c) (i) From the graph, identify which animal’s haemoglobin has the lowest affinity for oxygen.
______________________________ [1]
(ii) Suggest how the low P50 value of haemoglobin in the lugworm enables it to live in muddy habitats.
________________________________________________________
________________________________________________________
______________________________________________________ [1]
(d) Describe two factors which promote the dissociation of oxygen from haemoglobin in heavily respiring muscle tissue.
1. _____________________________________________________
2. ___________________________________________________ [2]

69700
Examiner Only Marks Remark
3 The Common Scoter duck (Melanitta nigra) was first found breeding in Lower Lough Erne in 1905. Its numbers increased until the late 1970s but it is now extinct in the lough. The Common Scoter nests close to the lough shore, usually under dense cover. The female incubates the eggs alone for between 27 and 31 days. The ducks feed on small invertebrates.
In the 1960s, roach (Rutilus rutilus) was introduced to the lough. The population of this fish increased rapidly so that it currently represents more than 60% of all fish biomass in the lough. Roach also feed on small invertebrates.
Farming of mink (Neovison vison) began in the area in the late 1950s. Escaped mink are known to have established wild populations around the lough. Mink are carnivorous mammals which feed on ground-nesting birds and their eggs.
Pollution of the lough increased in the 1970s, causing a reduction in the invertebrate biomass.
Using the information provided and your knowledge, answer the following questions.
(a) State the genus of the Common Scoter.
______________________________ [1]
(b) (i) The death rate was particularly high in female Scoter ducks. Explain why.
________________________________________________________
________________________________________________________
________________________________________________________
______________________________________________________ [2]

7 [Turn over9700
Examiner Only Marks Remark
(ii) Explain two reasons why the Scoter duck population has declined and become extinct.
1. _____________________________________________________
________________________________________________________
________________________________________________________
2. _____________________________________________________
________________________________________________________
______________________________________________________ [2]
(c) Much of the land around Lower Lough Erne has been subjected to drainage, ploughing and reseeding. Explain how these practices lead to reduced biodiversity on land.
_______________________________________________________
_______________________________________________________
_______________________________________________________
_______________________________________________________
_______________________________________________________
_______________________________________________________
_______________________________________________________
_____________________________________________________ [3]

89700
Examiner Only Marks Remark
4 The metabolic activity of an organism can be indicated by the cell respiration rate. One way of investigating the cell respiration rate is to measure the oxygen consumed by an organism over a period of time.
The table below shows the cell respiration rates of mammals of different body masses. The cell respiration rate is given as mm3 of oxygen consumed per gram of body mass per hour.
Mammal Typical body mass/kg Cell respiration rate/mm3 O2 g–1 hr –1
Mouse 0.03 1518
Rabbit 2.2 466
Dog 12 318
Human 70 202
Horse 700 106
Elephant 3800 67
(a) Using the information in the table, describe the relationship between body mass and cell respiration rate.
_______________________________________________________
_______________________________________________________
_____________________________________________________ [1]
(b) Calculate the oxygen consumed in 1 hour by the mouse. (Show your working.)
Answer _________________ mm3 [2]
9 [Turn over9700
Examiner Only Marks Remark
The metabolic activity of an organism is influenced both by its surface area and its volume.
(c) (i) State how the surface area to volume ratio would differ between the dog and the mouse.
________________________________________________________
________________________________________________________
______________________________________________________ [1]
(ii) Suggest the relationship between the surface area to volume ratio and cell metabolic activity.
________________________________________________________
________________________________________________________
______________________________________________________ [1]
(d) In mammals, the uptake of oxygen from the atmosphere and its subsequent delivery to the respiring tissues is facilitated by structures with a large surface area.
Identify three ways in which a large surface area is achieved in mammals to enable a high uptake and delivery of oxygen.
1. _____________________________________________________
_______________________________________________________
2. _____________________________________________________
_______________________________________________________
3. _____________________________________________________
_____________________________________________________ [3]
[Turn over

109700
Examiner Only Marks Remark
5 Sheltered rocky seashores have distinct zones which result from the extent to which water covers the area during high and low tides.
Zones on a rocky seashore are indicated in the diagram below.
AB
C
D
E
sea
rocky seashore
Details of each of the zones A to E are given in the table below.
Zone Tidal coverage details Dominant seaweed species
A never covered in water but sprayed or splashed with saltwater
no seaweed present
B only covered in water during the highest tides
channelled wrack, spiral wrack
C covered in water during most high tides and exposed to air during most low tides
bladder wrack, egg wrack
D only exposed to air during the lowest tides
saw wrack, thongweed
E never exposed to air sugar kelp, oarweed
(a) (i) A student proposes the hypothesis that seaweeds can only obtain their required minerals when covered in seawater. Identify the evidence from the table which supports this hypothesis.
________________________________________________________
________________________________________________________
______________________________________________________ [1]
(ii) Name one seaweed species from the table which would be expected to have highly developed adaptations to prevent desiccation (drying out).
______________________________________________________ [1]

119700
Examiner Only Marks Remark
(b) Explain one biotic and one abiotic factor which may prevent sugar kelp and oarweed from growing further up the shore than zone E.
Biotic __________________________________________________
_______________________________________________________
_______________________________________________________
Abiotic _________________________________________________
_______________________________________________________
_____________________________________________________ [2]
(c) Describe a method which could be used to sample a rocky shore in order to determine how the distribution of seaweed species changes from zone A to zone D. Your answer should include one safety precaution.
_______________________________________________________
_______________________________________________________
_______________________________________________________
_______________________________________________________
_______________________________________________________
_______________________________________________________
_______________________________________________________
_______________________________________________________
_______________________________________________________
_______________________________________________________
_______________________________________________________
_______________________________________________________
_______________________________________________________
_____________________________________________________ [5]
[Turn over
129700
Examiner Only Marks Remark
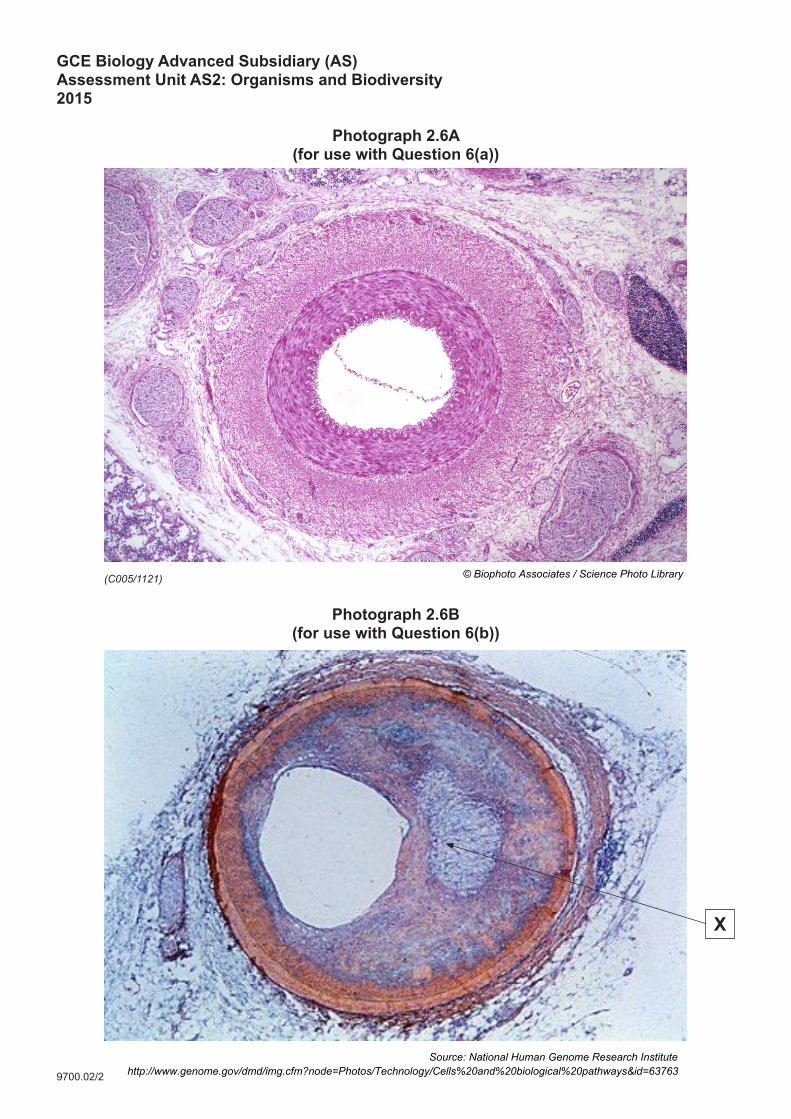
6 (a) Photograph 2.6A shows a transverse section through an artery.
(i) Draw a block diagram of this artery in the box below. Label your diagram to show the tissues found in the wall of the artery.
[4]
(ii) State the function of one of the tissues you have labelled in the block diagram.
________________________________________________________
______________________________________________________ [1]

13 [Turn over9700
Examiner Only Marks Remark
(b) Photograph 2.6B shows another artery. The structure labelled X is an atheroma.
(i) Suggest the effect of the atheroma on the rate of blood flow in this blood vessel.
________________________________________________________
______________________________________________________ [1]
(ii) Describe precisely the sequence of events resulting in the formation of an atheroma.
________________________________________________________
________________________________________________________
________________________________________________________
________________________________________________________
________________________________________________________
________________________________________________________
________________________________________________________
______________________________________________________ [3]
149700
Examiner Only Marks Remark
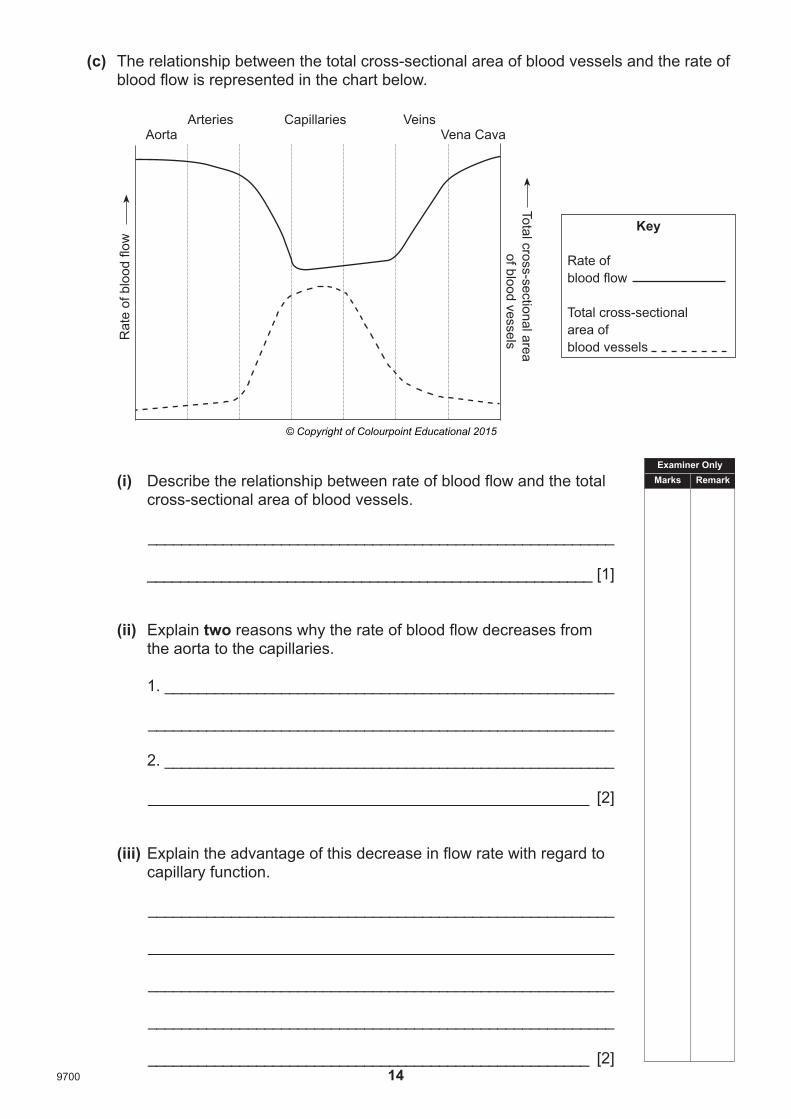
(c) The relationship between the total cross-sectional area of blood vessels and the rate of blood flow is represented in the chart below.
Arteries VeinsCapillariesAorta Vena Cava
Total cross-sectional area of blood vesselsR
ate
of b
lood
flow
Key
Rate of blood flow
Total cross-sectional area of blood vessels
(i) Describe the relationship between rate of blood flow and the total cross-sectional area of blood vessels.
________________________________________________________
______________________________________________________ [1]
(ii) Explain two reasons why the rate of blood flow decreases from the aorta to the capillaries.
1. ______________________________________________________
________________________________________________________
2. ______________________________________________________
_____________________________________________________ [2]
(iii) Explain the advantage of this decrease in flow rate with regard to capillary function.
________________________________________________________
________________________________________________________
________________________________________________________
________________________________________________________
_____________________________________________________ [2]
© Copyright of Colourpoint Educational 2015

15 [Turn over9700
Examiner Only Marks Remark
7 The stomatal density (number of stomata per unit area) found on leaves may be influenced by the plant’s habitat.
An investigation was carried out to determine the stomatal density in four different plant species. The number of stomata on 4.5 mm2 of leaf lower epidermis was counted.
The table below shows the results.
Species Number ofstomata
Stomatal density/stomata mm–2
A 26 5.78
B 40 8.89
C 37
D 20 4.44
(a) (i) Calculate the stomatal density for species C.
_________________ stomata mm–2 [1]
(ii) Identify which of the species investigated is most likely to grow in a dry environment. Explain your answer.
________________________________________________________
________________________________________________________
________________________________________________________
_____________________________________________________ [2]

169700
Examiner Only Marks Remark
(b) (i) Define the term transpiration.
________________________________________________________
________________________________________________________
________________________________________________________
_____________________________________________________ [2]
The leaves of plants growing in dry environments often have microscopic leaf hairs extending from their lower epidermis.
(ii) Explain the advantage of this.
________________________________________________________
________________________________________________________
________________________________________________________
________________________________________________________
________________________________________________________
________________________________________________________
_____________________________________________________ [3]
179700
Examiner Only Marks Remark
[Turn over
Section B
Quality of written communication is awarded a maximum of 2 marks in this section.
8 Directional selection is one of the processes which accounts for the large diversity of organisms on our planet.
Taxonomy is the study of this diversity with the aim of analysing the similarities and differences between organisms, so that they can be classified. Currently, the five kingdom system is the most widely accepted model for classification of organisms.
(a) Describe the process of directional selection. [5]
(b) Describe the main features of organisms in each of the five kingdoms. [8]
Quality of written communication [2]
___________________________
(a) Describe the process of directional selection.
_______________________________________________________
_______________________________________________________
_______________________________________________________
_______________________________________________________
_______________________________________________________
_______________________________________________________
_______________________________________________________
_______________________________________________________
_______________________________________________________
_______________________________________________________
_______________________________________________________
_______________________________________________________
_______________________________________________________
_______________________________________________________
_______________________________________________________
189700
Examiner Only Marks Remark _______________________________________________________
_______________________________________________________
_______________________________________________________
_______________________________________________________
_______________________________________________________
_______________________________________________________
_______________________________________________________
_______________________________________________________
_______________________________________________________
_______________________________________________________
_______________________________________________________
_______________________________________________________
_______________________________________________________
(b) Describe the main features of organisms in each of the five kingdoms.
_______________________________________________________
_______________________________________________________
_______________________________________________________
_______________________________________________________
_______________________________________________________
_______________________________________________________
_______________________________________________________
_______________________________________________________
_______________________________________________________
_______________________________________________________
_______________________________________________________
_______________________________________________________

199700
Examiner Only Marks Remark
[Turn over
_______________________________________________________
_______________________________________________________
_______________________________________________________
_______________________________________________________
_______________________________________________________
_______________________________________________________
_______________________________________________________
_______________________________________________________
_______________________________________________________
_______________________________________________________
_______________________________________________________
_______________________________________________________
_______________________________________________________
_______________________________________________________
_______________________________________________________
_______________________________________________________
_______________________________________________________
_______________________________________________________
_______________________________________________________
_______________________________________________________
_______________________________________________________
_______________________________________________________
_______________________________________________________
_______________________________________________________
_______________________________________________________
_______________________________________________________
_______________________________________________________

209700
Examiner Only Marks Remark
Extra lined page
_______________________________________________________
_______________________________________________________
_______________________________________________________
_______________________________________________________
_______________________________________________________
_______________________________________________________
_______________________________________________________
_______________________________________________________
_______________________________________________________
_______________________________________________________
_______________________________________________________
_______________________________________________________
_______________________________________________________
_______________________________________________________
_______________________________________________________
_______________________________________________________
_______________________________________________________
_______________________________________________________
_______________________________________________________
_______________________________________________________
_______________________________________________________
_______________________________________________________
_______________________________________________________
_______________________________________________________
_______________________________________________________
_______________________________________________________

THIS IS THE END OF THE QUESTION PAPER


Permission to reproduce all copyright material has been applied for.In some cases, efforts to contact copyright holders may have been unsuccessful and CCEAwill be happy to rectify any omissions of acknowledgement in future if notified.
9700/5
9700.02/2
X
GCE Biology Advanced Subsidiary (AS)Assessment Unit AS2: Organisms and Biodiversity2015
Photograph 2.6A(for use with Question 6(a))
(C005/1121)
Photograph 2.6B(for use with Question 6(b))
© Biophoto Associates / Science Photo Library
Source: National Human Genome Research Institute http://www.genome.gov/dmd/img.cfm?node=Photos/Technology/Cells%20and%20biological%20pathways&id=63763