blair final ppt
TRANSCRIPT
Miami University Oxford, OH
Matt Murtha | Kasey Marenco | Alex Puthumana | Jack Bennett
Skipper’s Sporting GoodsValuation and Suggestion
Executive Summary
Company & Industry Overview
Potential Buyers
Valuation
Recommendation
3
5
10
14
22
Appendix 24
2
Executive SummaryCompany & Industry
OverviewPotential Buyers Valuation Recommendation 3
Executive Summary
Executive SummaryCompany & Industry
OverviewPotential Buyers Valuation Recommendation
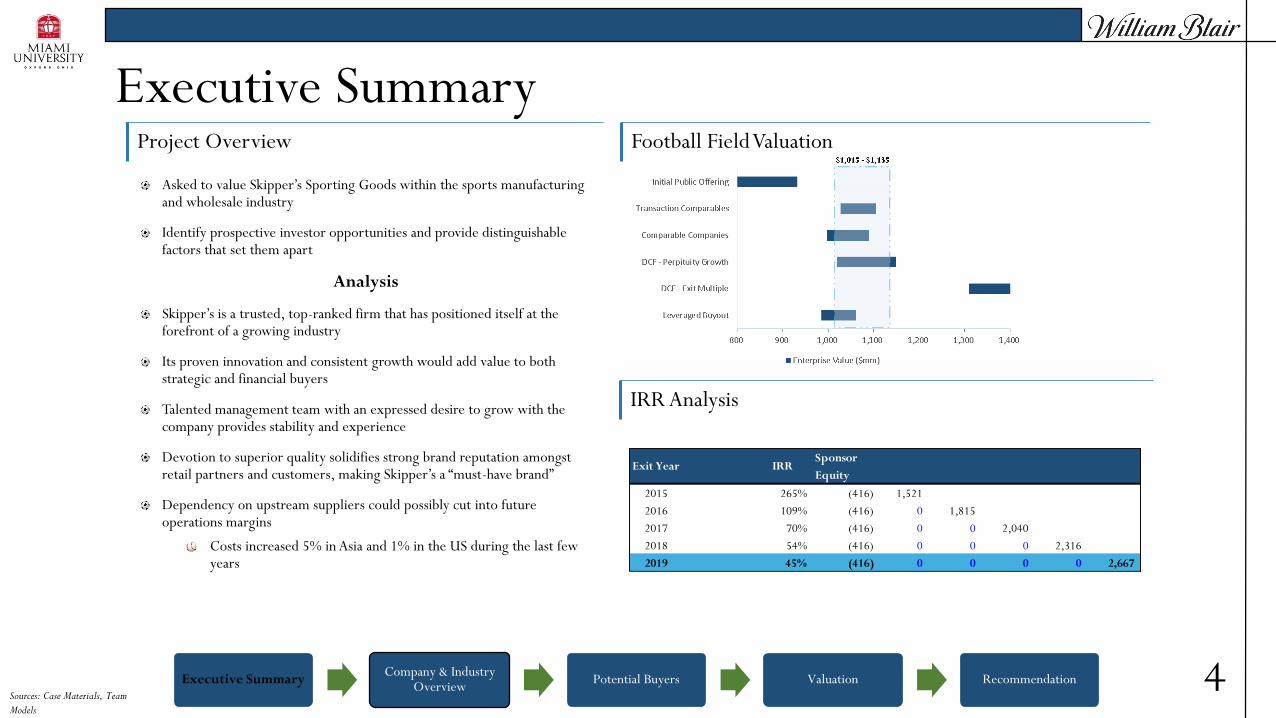
Project Overview Football Field Valuation
IRR Analysis
4
Executive Summary
Asked to value Skipper’s Sporting Goods within the sports manufacturing and wholesale industry
Identify prospective investor opportunities and provide distinguishable factors that set them apart
Analysis
Skipper’s is a trusted, top-ranked firm that has positioned itself at the forefront of a growing industry
Its proven innovation and consistent growth would add value to both strategic and financial buyers
Talented management team with an expressed desire to grow with the company provides stability and experience
Devotion to superior quality solidifies strong brand reputation amongst retail partners and customers, making Skipper’s a “must-have brand”
Dependency on upstream suppliers could possibly cut into future operations margins
Costs increased 5% in Asia and 1% in the US during the last few years
Sponsor
Equity
2015 265% (416) 1,521
2016 109% (416) 0 1,815
2017 70% (416) 0 0 2,040
2018 54% (416) 0 0 0 2,316
2019 45% (416) 0 0 0 0 2,667
IRRExit Year
Sources: Case Materials, Team
Models
Executive SummaryCompany &
Industry OverviewPotential Buyers Valuation Recommendation 5
Company & Industry Overview
Executive SummaryCompany &
Industry OverviewPotential Buyers Valuation Recommendation
Key Selling Points Competitive Advantages
Growth ProfileYOY LTM % Growth
6
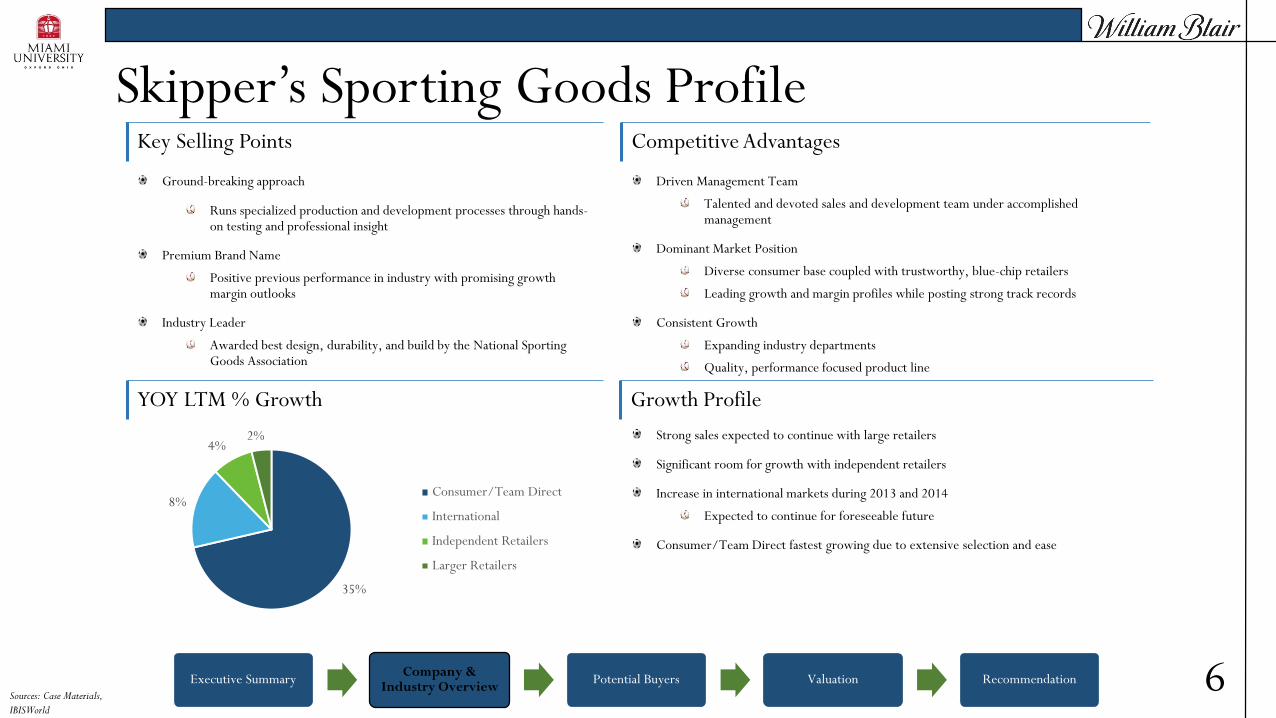
Skipper’s Sporting Goods Profile
Ground-breaking approach
Runs specialized production and development processes through hands-on testing and professional insight
Premium Brand Name
Positive previous performance in industry with promising growth margin outlooks
Industry Leader
Awarded best design, durability, and build by the National Sporting Goods Association
Sources: Case Materials,
IBISWorld
Driven Management Team
Talented and devoted sales and development team under accomplished management
Dominant Market Position
Diverse consumer base coupled with trustworthy, blue-chip retailers
Leading growth and margin profiles while posting strong track records
Consistent Growth
Expanding industry departments
Quality, performance focused product line
Strong sales expected to continue with large retailers
Significant room for growth with independent retailers
Increase in international markets during 2013 and 2014
Expected to continue for foreseeable future
Consumer/Team Direct fastest growing due to extensive selection and ease
35%
8%
4%2%
Consumer/Team Direct
International
Independent Retailers
Larger Retailers
Executive SummaryCompany &
Industry OverviewPotential Buyers Valuation Recommendation
Segment Offerings and Operational Overview Revenue by Segment
Segment Growth
7
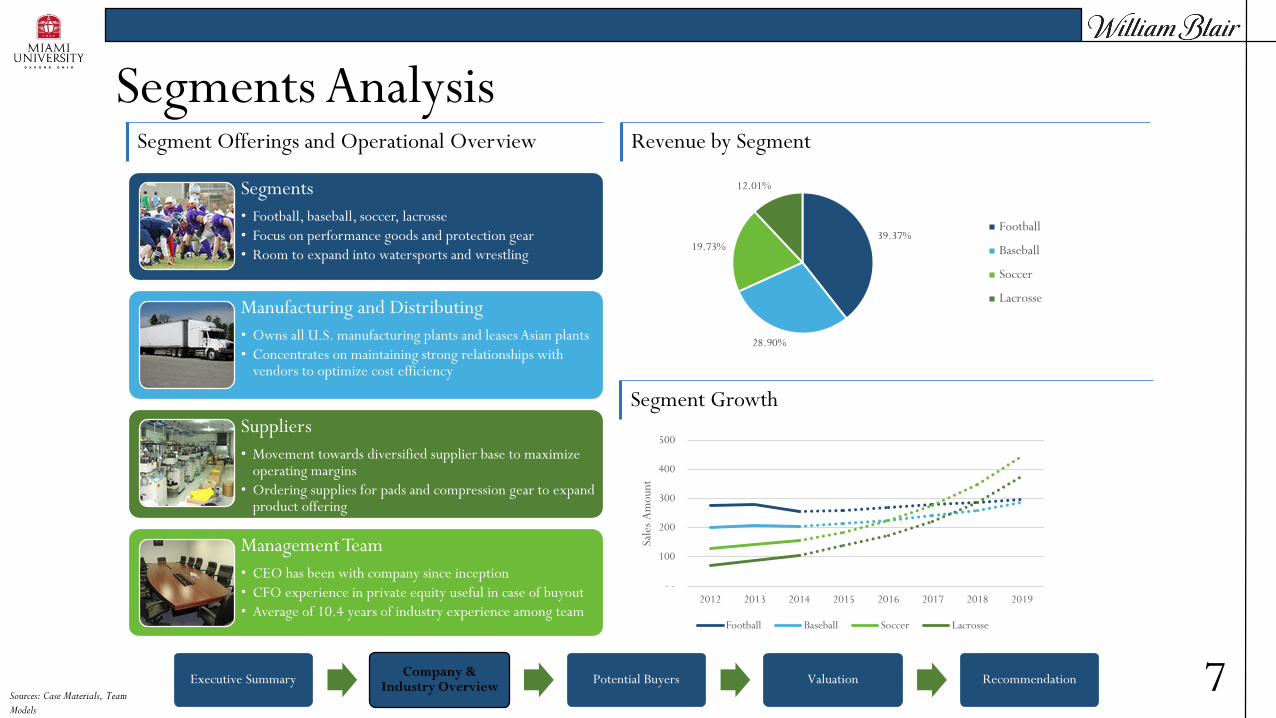
Segments Analysis
Segments
• Football, baseball, soccer, lacrosse
• Focus on performance goods and protection gear
• Room to expand into watersports and wrestling
Manufacturing and Distributing
• Owns all U.S. manufacturing plants and leases Asian plants
• Concentrates on maintaining strong relationships with vendors to optimize cost efficiency
Suppliers
• Movement towards diversified supplier base to maximize operating margins
• Ordering supplies for pads and compression gear to expand product offering
Management Team
• CEO has been with company since inception
• CFO experience in private equity useful in case of buyout
• Average of 10.4 years of industry experience among team
Sources: Case Materials, Team
Models
39.37%
28.90%
19.73%
12.01%
Football
Baseball
Soccer
Lacrosse
- -
100
200
300
400
500
2012 2013 2014 2015 2016 2017 2018 2019
Sale
s A
mou
nt
Football Baseball Soccer Lacrosse
Executive SummaryCompany & Industry
OverviewPotential Buyers Valuation Recommendation
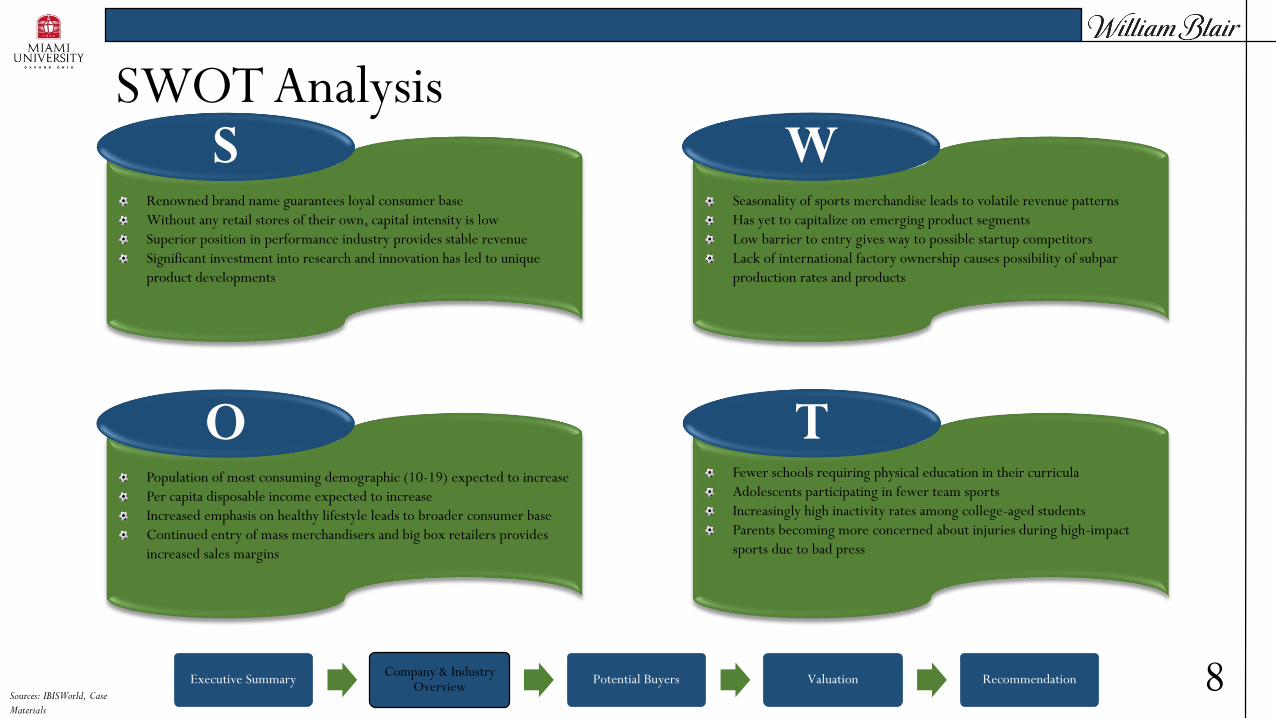
Seasonality of sports merchandise leads to volatile revenue patterns
Has yet to capitalize on emerging product segments
Low barrier to entry gives way to possible startup competitors
Lack of international factory ownership causes possibility of subpar
production rates and products
Fewer schools requiring physical education in their curricula
Adolescents participating in fewer team sports
Increasingly high inactivity rates among college-aged students
Parents becoming more concerned about injuries during high-impact
sports due to bad press
Population of most consuming demographic (10-19) expected to increase
Per capita disposable income expected to increase
Increased emphasis on healthy lifestyle leads to broader consumer base
Continued entry of mass merchandisers and big box retailers provides
increased sales margins
Renowned brand name guarantees loyal consumer base
Without any retail stores of their own, capital intensity is low
Superior position in performance industry provides stable revenue
Significant investment into research and innovation has led to unique
product developments
S W
TO
SWOT Analysis
8Sources: IBISWorld, Case
Materials
Executive SummaryCompany &
Industry OverviewPotential Buyers Valuation Recommendation
Industry Trends Sales by Channel
Industry Performance
9
Sports Manufacturing and Wholesale
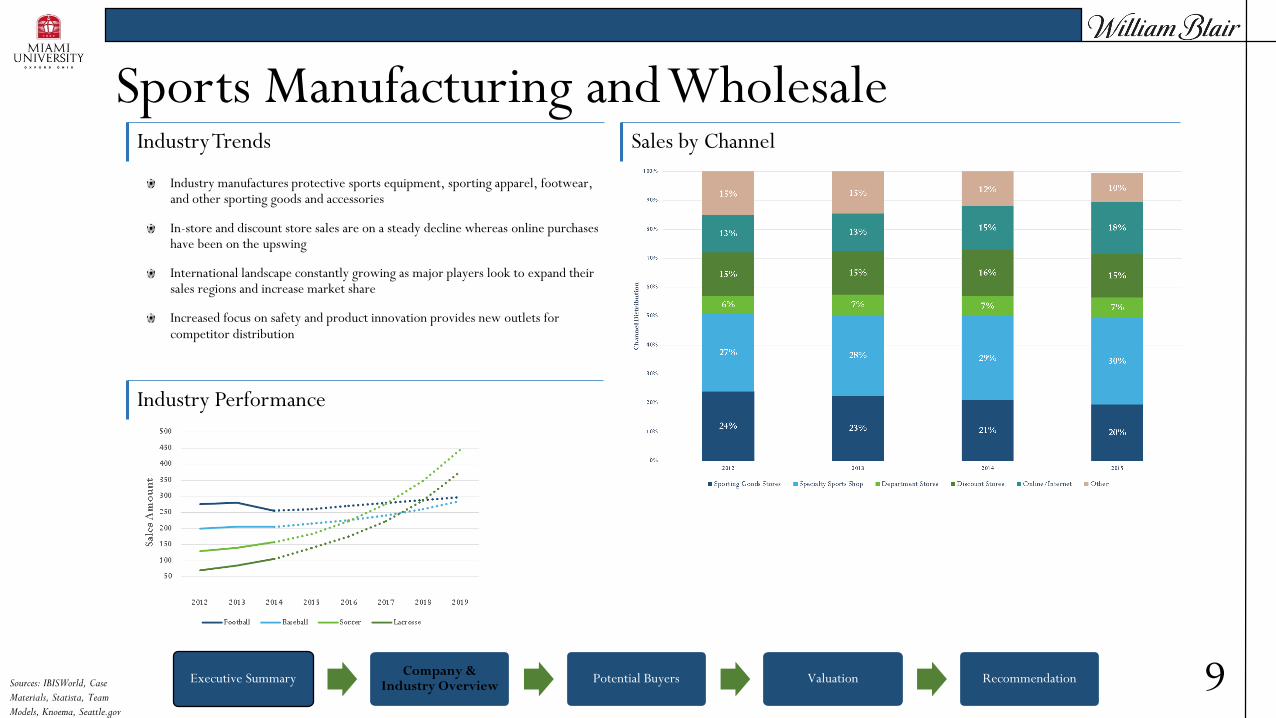
Industry manufactures protective sports equipment, sporting apparel, footwear, and other sporting goods and accessories
In-store and discount store sales are on a steady decline whereas online purchases have been on the upswing
International landscape constantly growing as major players look to expand their sales regions and increase market share
Increased focus on safety and product innovation provides new outlets for competitor distribution
Sources: IBISWorld, Case
Materials, Statista, Team
Models, Knoema, Seattle.gov
Executive SummaryCompany & Industry
OverviewPotential Buyers Valuation Recommendation 10
Potential Buyers
Executive SummaryCompany & Industry
OverviewPotential Buyers Valuation Recommendation
PE Overview PE Fundraising & Financing
0
0.2
0.4
0.6
0.8
1
1.2
0
0.2
0.4
0.6
0.8
1
1.2
Capital Raised (Bil.) Avg. Equity Financing
PE Dry Powder
$0
$200
$400
$600
$800
$1,000
$1,200
2004 2005 2006 2007 2008 2009 2010 2011 2012 2013
Dry Powder (Bil.)
PE Exits
$0
$10
$20
$30
$40
$50
$60
2004 2005 2006 2007 2008 2009 2010 2011 2012 2013
Exit Amount (Bil.)
11
Private Equity Industry Analysis
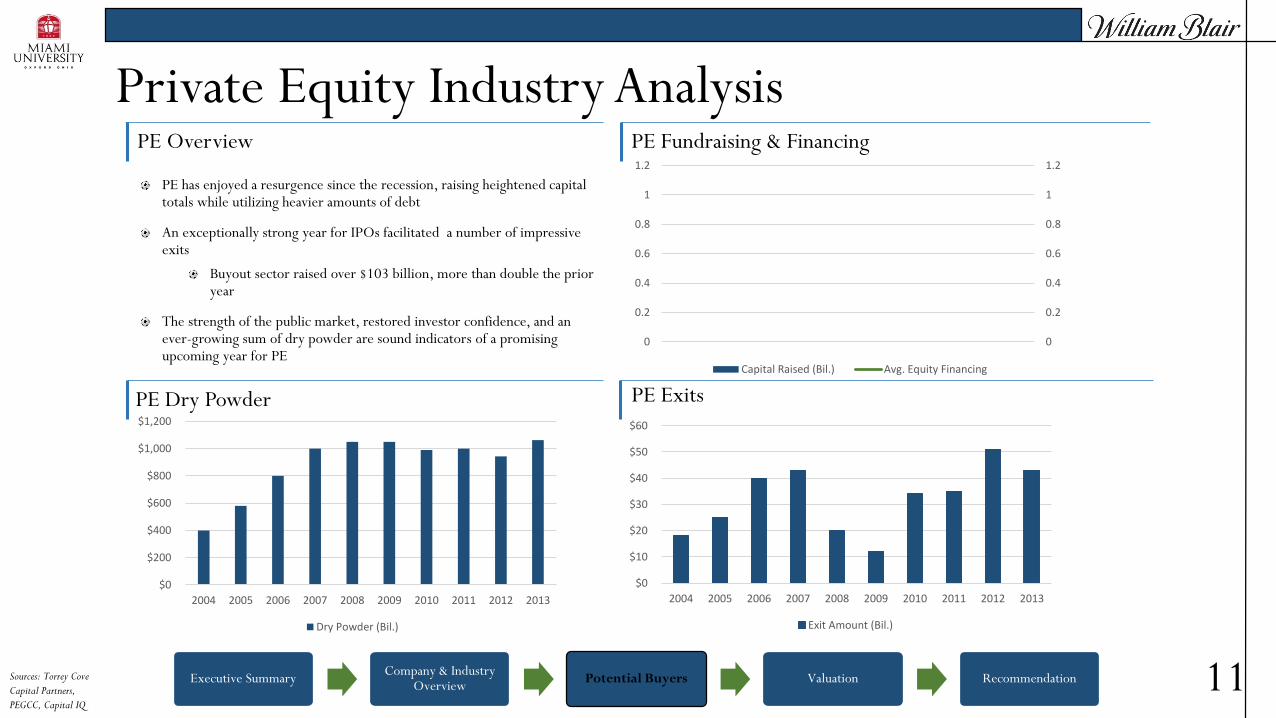
PE has enjoyed a resurgence since the recession, raising heightened capital totals while utilizing heavier amounts of debt
An exceptionally strong year for IPOs facilitated a number of impressive exits
Buyout sector raised over $103 billion, more than double the prior year
The strength of the public market, restored investor confidence, and an ever-growing sum of dry powder are sound indicators of a promising upcoming year for PE
Sources: Torrey Cove
Capital Partners,
PEGCC, Capital IQ
Industry Overview Company Profile Potential Buyers Valuation Recommendation 12
Potential Strategic Buyers
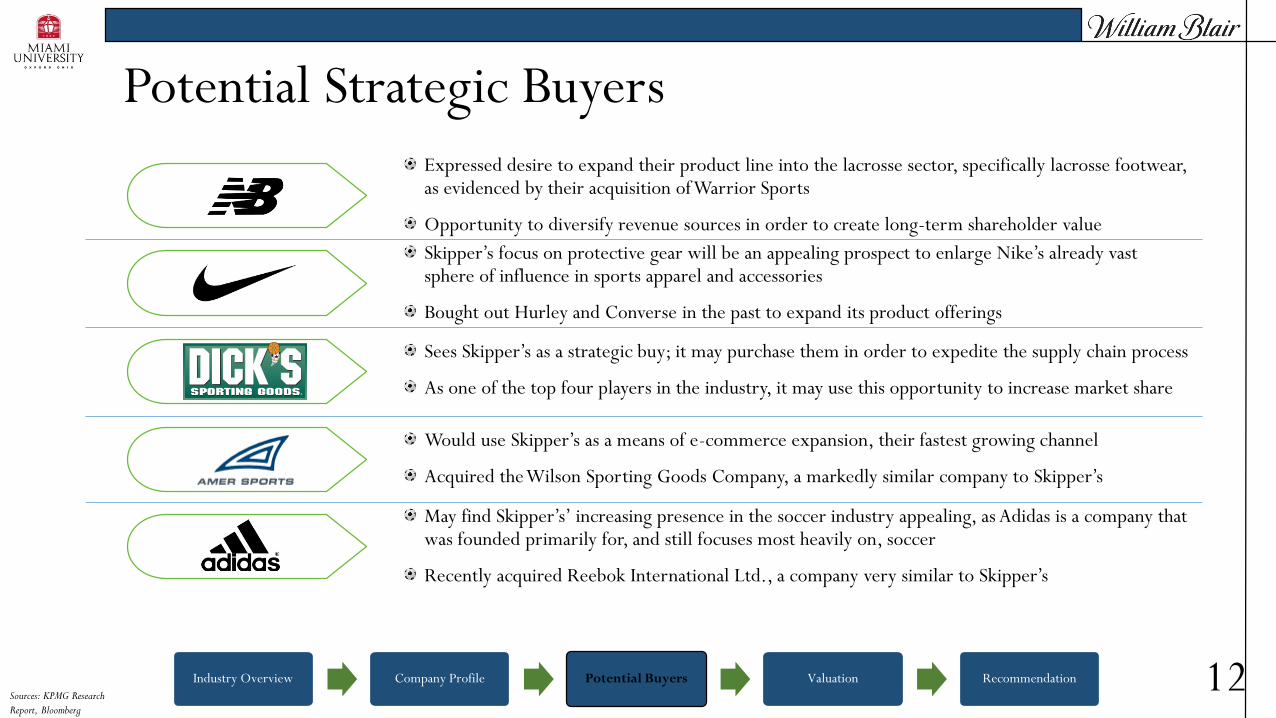
Expressed desire to expand their product line into the lacrosse sector, specifically lacrosse footwear, as evidenced by their acquisition of Warrior Sports
Opportunity to diversify revenue sources in order to create long-term shareholder value
Skipper’s focus on protective gear will be an appealing prospect to enlarge Nike’s already vast sphere of influence in sports apparel and accessories
Bought out Hurley and Converse in the past to expand its product offerings
Sees Skipper’s as a strategic buy; it may purchase them in order to expedite the supply chain process
As one of the top four players in the industry, it may use this opportunity to increase market share
Would use Skipper’s as a means of e-commerce expansion, their fastest growing channel
Acquired the Wilson Sporting Goods Company, a markedly similar company to Skipper’s
May find Skipper’s’ increasing presence in the soccer industry appealing, as Adidas is a company that was founded primarily for, and still focuses most heavily on, soccer
Recently acquired Reebok International Ltd., a company very similar to Skipper’s
Sources: KPMG Research
Report, Bloomberg
Industry Overview Company Profile Potential Buyers Valuation Recommendation 13
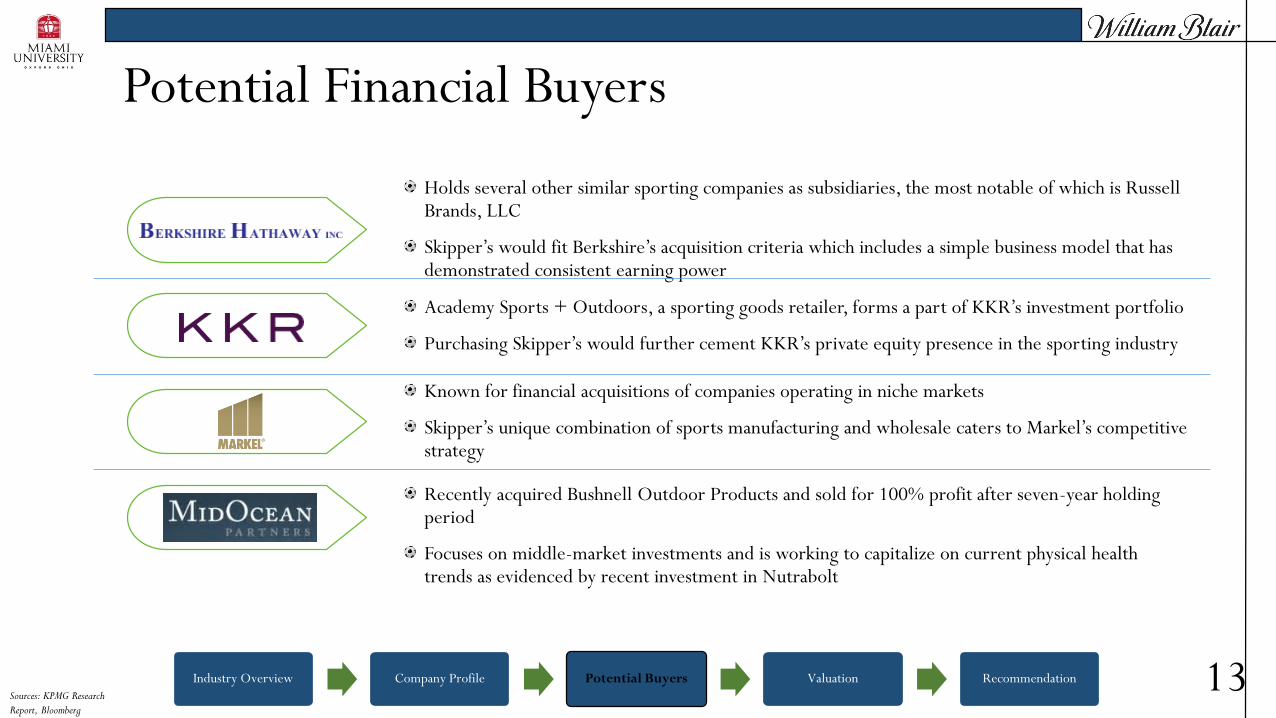
Holds several other similar sporting companies as subsidiaries, the most notable of which is Russell Brands, LLC
Skipper’s would fit Berkshire’s acquisition criteria which includes a simple business model that has demonstrated consistent earning power
Academy Sports + Outdoors, a sporting goods retailer, forms a part of KKR’s investment portfolio
Purchasing Skipper’s would further cement KKR’s private equity presence in the sporting industry
Known for financial acquisitions of companies operating in niche markets
Skipper’s unique combination of sports manufacturing and wholesale caters to Markel’s competitive strategy
Recently acquired Bushnell Outdoor Products and sold for 100% profit after seven-year holding period
Focuses on middle-market investments and is working to capitalize on current physical health trends as evidenced by recent investment in Nutrabolt
Potential Financial Buyers
Sources: KPMG Research
Report, Bloomberg
Executive SummaryCompany & Industry
OverviewPotential Buyers Valuation Recommendation 14
Valuation
Executive SummaryCompany & Industry
OverviewPotential Buyers Valuation Recommendation
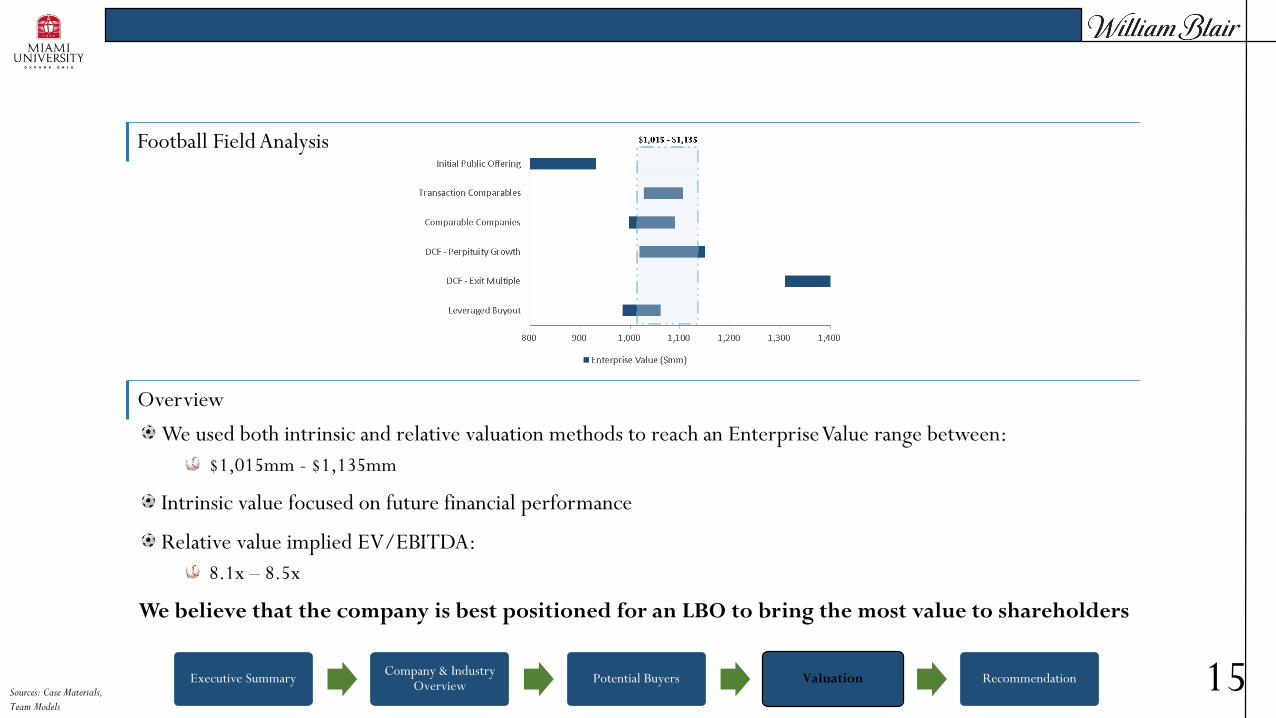
Football Field Analysis
Overview
15
We used both intrinsic and relative valuation methods to reach an Enterprise Value range between:
$1,015mm - $1,135mm
Intrinsic value focused on future financial performance
Relative value implied EV/EBITDA:
8.1x – 8.5x
We believe that the company is best positioned for an LBO to bring the most value to shareholders
Sources: Case Materials,
Team Models
Big Dogs
Consumer Direct
Niche Providers
Executive SummaryCompany & Industry
OverviewPotential Buyers Valuation Recommendation
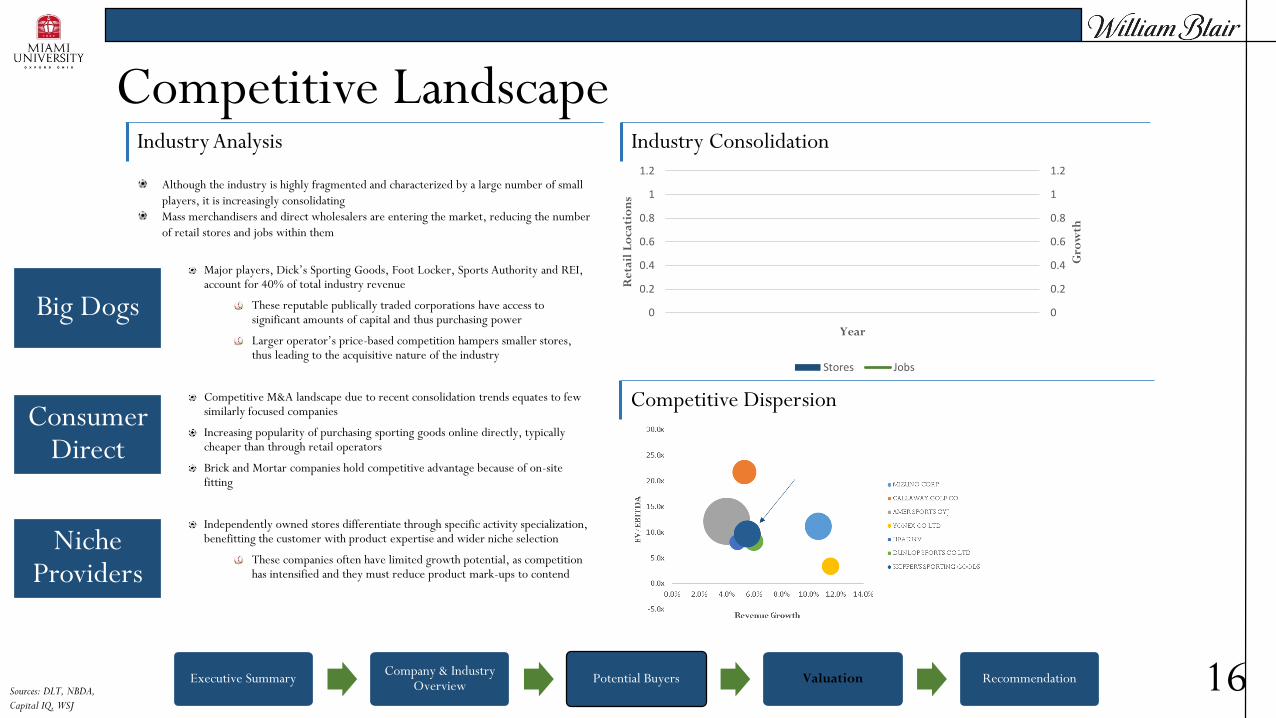
Industry Analysis Industry Consolidation
Competitive Dispersion
0
0.2
0.4
0.6
0.8
1
1.2
0
0.2
0.4
0.6
0.8
1
1.2
Gro
wth
Re
tail
Lo
cat
ion
s
Year
Stores Jobs
16
Competitive Landscape
Although the industry is highly fragmented and characterized by a large number of small
players, it is increasingly consolidating
Mass merchandisers and direct wholesalers are entering the market, reducing the number
of retail stores and jobs within them
Major players, Dick’s Sporting Goods, Foot Locker, Sports Authority and REI, account for 40% of total industry revenue
These reputable publically traded corporations have access to significant amounts of capital and thus purchasing power
Larger operator’s price-based competition hampers smaller stores, thus leading to the acquisitive nature of the industry
Competitive M&A landscape due to recent consolidation trends equates to few similarly focused companies
Increasing popularity of purchasing sporting goods online directly, typically cheaper than through retail operators
Brick and Mortar companies hold competitive advantage because of on-site fitting
Independently owned stores differentiate through specific activity specialization, benefitting the customer with product expertise and wider niche selection
These companies often have limited growth potential, as competition has intensified and they must reduce product mark-ups to contend
Sources: DLT, NBDA,
Capital IQ, WSJ
Executive SummaryCompany & Industry
OverviewPotential Buyers Valuation Recommendation
Transaction Comparable Analysis
Valuation AnalysisValuation
17
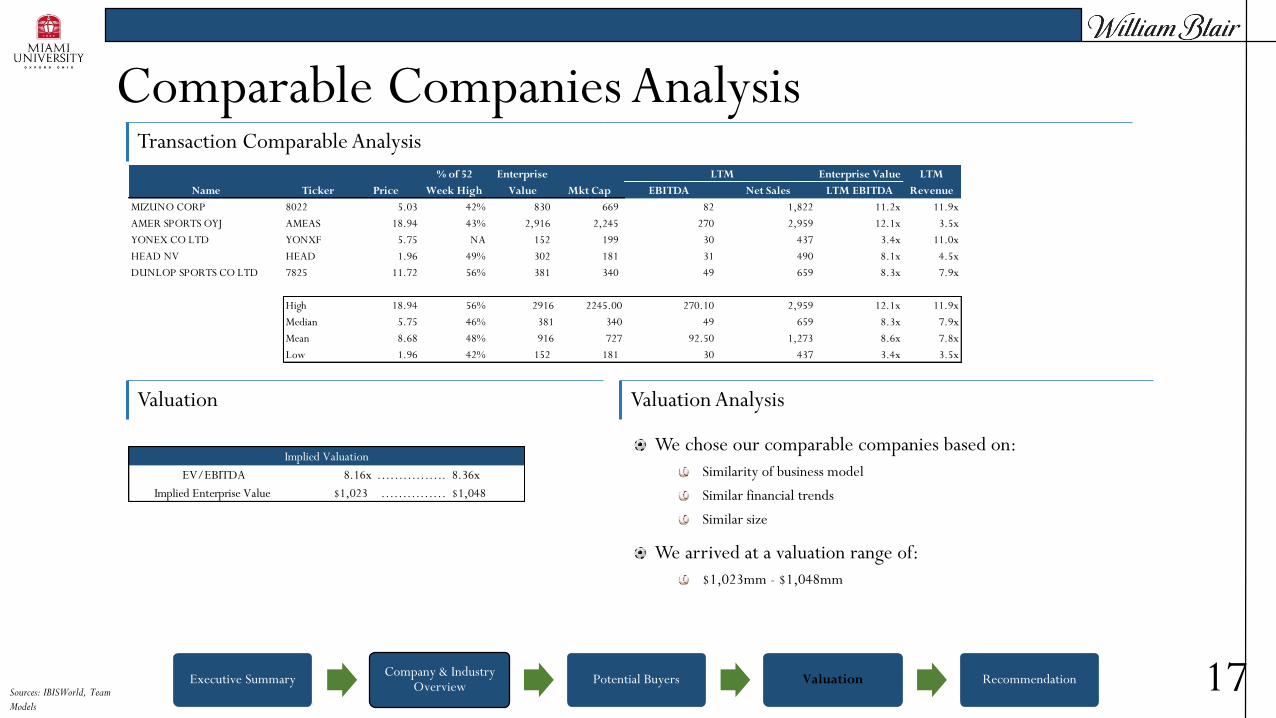
Comparable Companies Analysis
We chose our comparable companies based on:
Similarity of business model
Similar financial trends
Similar size
We arrived at a valuation range of:
$1,023mm - $1,048mm
Enterprise Value
EBITDA Net Sales LTM EBITDA
MIZUNO CORP 8022 5.03 42% 830 669 82 1,822 11.2x 11.9x
AMER SPORTS OYJ AMEAS 18.94 43% 2,916 2,245 270 2,959 12.1x 3.5x
YONEX CO LTD YONXF 5.75 NA 152 199 30 437 3.4x 11.0x
HEAD NV HEAD 1.96 49% 302 181 31 490 8.1x 4.5x
DUNLOP SPORTS CO LTD 7825 11.72 56% 381 340 49 659 8.3x 7.9x
High 18.94 56% 2916 2245.00 270.10 2,959 12.1x 11.9x
Median 5.75 46% 381 340 49 659 8.3x 7.9x
Mean 8.68 48% 916 727 92.50 1,273 8.6x 7.8x
Low 1.96 42% 152 181 30 437 3.4x 3.5x
LTM LTM
Revenue Name Ticker Price
% of 52
Week High
Enterprise
Value Mkt Cap
EV/EBITDA 8.16x ……………. 8.36x
Implied Enterprise Value $1,023 …………… $1,048
Implied Valuation
Sources: IBISWorld, Team
Models
Executive SummaryCompany & Industry
OverviewPotential Buyers Valuation Recommendation
Transaction Comparable Analysis
Valuation AnalysisValuation
18
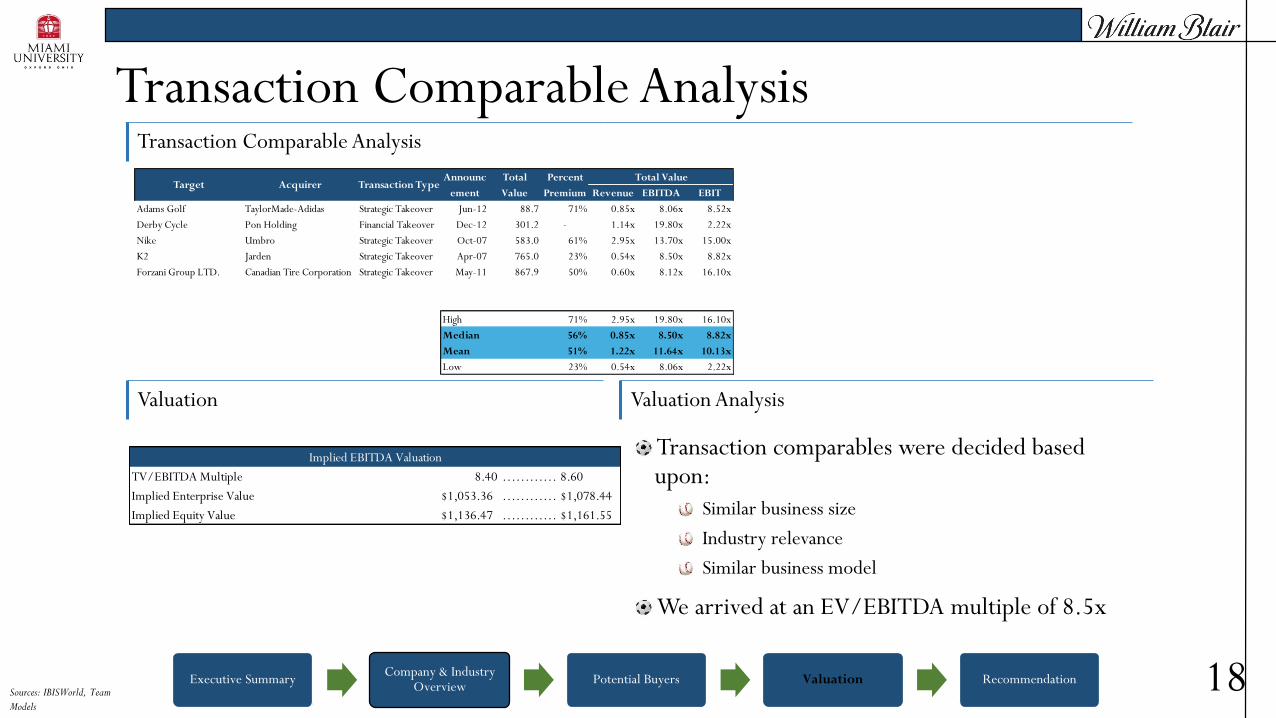
Transaction Comparable Analysis
Transaction comparables were decided based upon:
Similar business size
Industry relevance
Similar business model
We arrived at an EV/EBITDA multiple of 8.5x
Revenue EBITDA EBIT
Adams Golf TaylorMade-Adidas Strategic Takeover Jun-12 88.7 71% 0.85x 8.06x 8.52x
Derby Cycle Pon Holding Financial Takeover Dec-12 301.2 - 1.14x 19.80x 2.22x
Nike Umbro Strategic Takeover Oct-07 583.0 61% 2.95x 13.70x 15.00x
K2 Jarden Strategic Takeover Apr-07 765.0 23% 0.54x 8.50x 8.82x
Forzani Group LTD. Canadian Tire Corporation Strategic Takeover May-11 867.9 50% 0.60x 8.12x 16.10x
High 71% 2.95x 19.80x 16.10x
Median 56% 0.85x 8.50x 8.82x
Mean 51% 1.22x 11.64x 10.13x
Low 23% 0.54x 8.06x 2.22x
Total ValueTarget Acquirer Transaction Type
Announc
ement
Total
Value
Percent
Premium
TV/EBITDA Multiple 8.40 ………………8.60
Implied Enterprise Value $1,053.36 ………………$1,078.44
Implied Equity Value $1,136.47 ………………$1,161.55
Implied EBITDA Valuation
Sources: IBISWorld, Team
Models
Executive SummaryCompany & Industry
OverviewPotential Buyers Valuation Recommendation
DCF Projection Period
Valuation
Sensitivity Analysis
19
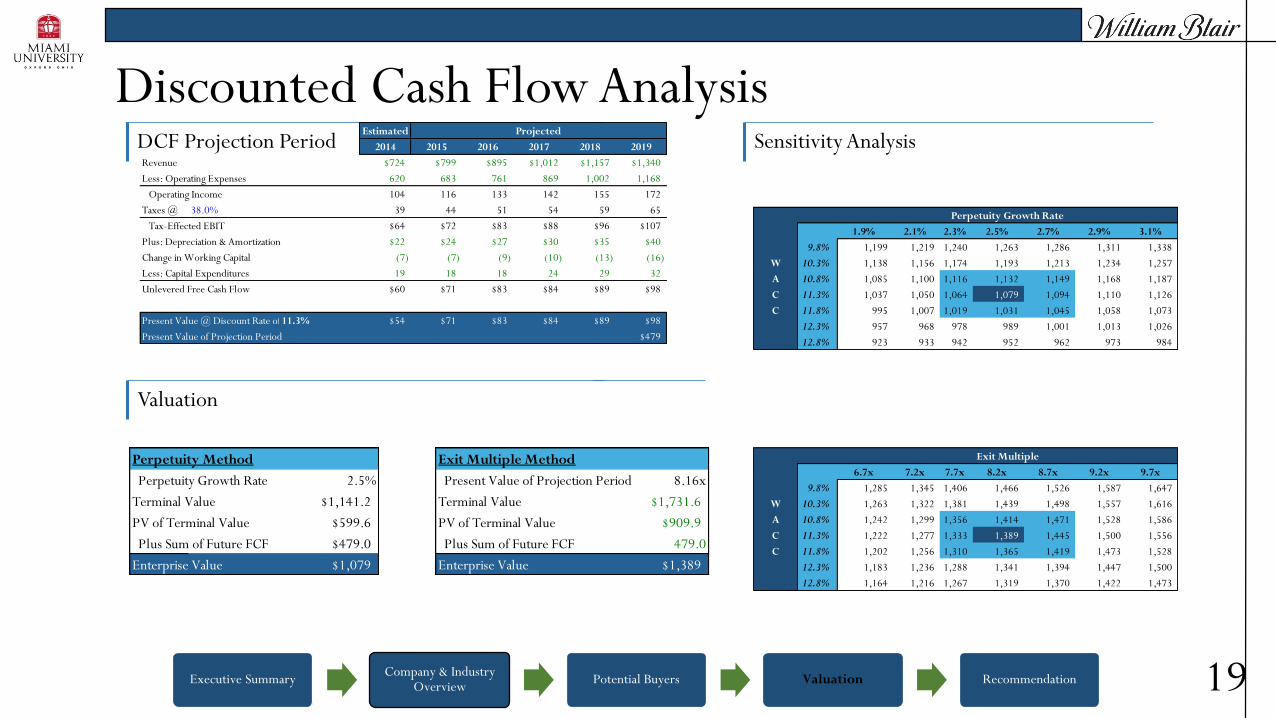
Discounted Cash Flow Analysis
Perpetuity Method
Perpetuity Growth Rate 2.5%
Terminal Value $1,141.2
PV of Terminal Value $599.6
Plus Sum of Future FCF $479.0
Enterprise Value $1,079
Exit Multiple Method
Present Value of Projection Period 8.16x
Terminal Value $1,731.6
PV of Terminal Value $909.9
Plus Sum of Future FCF 479.0
Enterprise Value $1,389
Perpetuity Growth Rate
1.9% 2.1% 2.3% 2.5% 2.7% 2.9% 3.1%
9.8% 1,199 1,219 1,240 1,263 1,286 1,311 1,338
W 10.3% 1,138 1,156 1,174 1,193 1,213 1,234 1,257
A 10.8% 1,085 1,100 1,116 1,132 1,149 1,168 1,187
C 11.3% 1,037 1,050 1,064 1,079 1,094 1,110 1,126
C 11.8% 995 1,007 1,019 1,031 1,045 1,058 1,073
12.3% 957 968 978 989 1,001 1,013 1,026
12.8% 923 933 942 952 962 973 984
Exit Multiple
6.7x 7.2x 7.7x 8.2x 8.7x 9.2x 9.7x
9.8% 1,285 1,345 1,406 1,466 1,526 1,587 1,647
W 10.3% 1,263 1,322 1,381 1,439 1,498 1,557 1,616
A 10.8% 1,242 1,299 1,356 1,414 1,471 1,528 1,586
C 11.3% 1,222 1,277 1,333 1,389 1,445 1,500 1,556
C 11.8% 1,202 1,256 1,310 1,365 1,419 1,473 1,528
12.3% 1,183 1,236 1,288 1,341 1,394 1,447 1,500
12.8% 1,164 1,216 1,267 1,319 1,370 1,422 1,473
Estimated
2014 2015 2016 2017 2018 2019
Revenue $724 $799 $895 $1,012 $1,157 $1,340
Less: Operating Expenses 620 683 761 869 1,002 1,168
Operating Income 104 116 133 142 155 172
Taxes @ 38.0% 39 44 51 54 59 65
Tax-Effected EBIT $64 $72 $83 $88 $96 $107
Plus: Depreciation & Amortization $22 $24 $27 $30 $35 $40
Change in Working Capital (7) (7) (9) (10) (13) (16)
Less: Capital Expenditures 19 18 18 24 29 32
Unlevered Free Cash Flow $60 $71 $83 $84 $89 $98
Present Value @ Discount Rate of:11.3% $54 $71 $83 $84 $89 $98
Present Value of Projection Period $479
Projected
Executive SummaryCompany & Industry
OverviewPotential Buyers Valuation Recommendation
Deal Assumptions IRR Analysis
Sensitivity Analysis – Exit Year: 2019
20
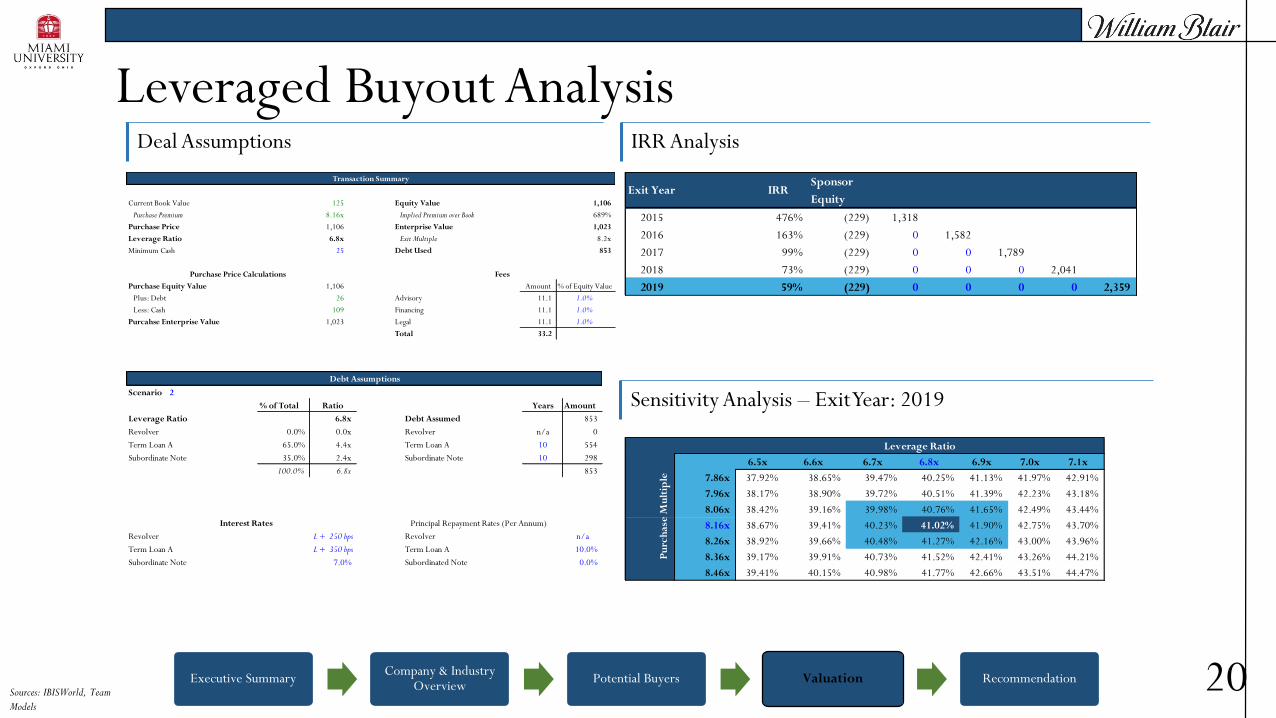
Leveraged Buyout Analysis
Sponsor
Equity
2015 476% (229) 1,318
2016 163% (229) 0 1,582
2017 99% (229) 0 0 1,789
2018 73% (229) 0 0 0 2,041
2019 59% (229) 0 0 0 0 2,359
IRRExit Year
6.5x 6.6x 6.7x 6.8x 6.9x 7.0x 7.1x
7.86x 37.92% 38.65% 39.47% 40.25% 41.13% 41.97% 42.91%
7.96x 38.17% 38.90% 39.72% 40.51% 41.39% 42.23% 43.18%
8.06x 38.42% 39.16% 39.98% 40.76% 41.65% 42.49% 43.44%
8.16x 38.67% 39.41% 40.23% 41.02% 41.90% 42.75% 43.70%
8.26x 38.92% 39.66% 40.48% 41.27% 42.16% 43.00% 43.96%
8.36x 39.17% 39.91% 40.73% 41.52% 42.41% 43.26% 44.21%
8.46x 39.41% 40.15% 40.98% 41.77% 42.66% 43.51% 44.47%
Leverage Ratio
Pu
rch
ase
Mu
ltip
le
Current Book Value 125 Equity Value 1,106
Purchase Premium 8.16x Implied Premium over Book 689%
Purchase Price 1,106 Enterprise Value 1,023
Leverage Ratio 6.8x Exit Multiple 8.2x
Minimum Cash 25 Debt Used 853
Fees
Purchase Equity Value 1,106 Amount % of Equity Value
Plus: Debt 26 Advisory 11.1 1.0%
Less: Cash 109 Financing 11.1 1.0%
Purcahse Enterprise Value 1,023 Legal 11.1 1.0%
Total 33.2
Transaction Summary
Purchase Price Calculations
Scenario 2
% of Total Ratio Years Amount
Leverage Ratio 6.8x Debt Assumed 853
Revolver 0.0% 0.0x Revolver n/a 0
Term Loan A 65.0% 4.4x Term Loan A 10 554
Subordinate Note 35.0% 2.4x Subordinate Note 10 298
100.0% 6.8x 853
Interest Rates Principal Repayment Rates (Per Annum)
Revolver L + 250 bps Revolver n/a
Term Loan A L + 350 bps Term Loan A 10.0%
Subordinate Note 7.0% Subordinated Note 0.0%
Debt Assumptions
Sources: IBISWorld, Team
Models
Executive SummaryCompany & Industry
OverviewPotential Buyers Valuation Recommendation
IPO Valuation IPO Market Overview
Sensitivity AnalysisIPO Valuation
21
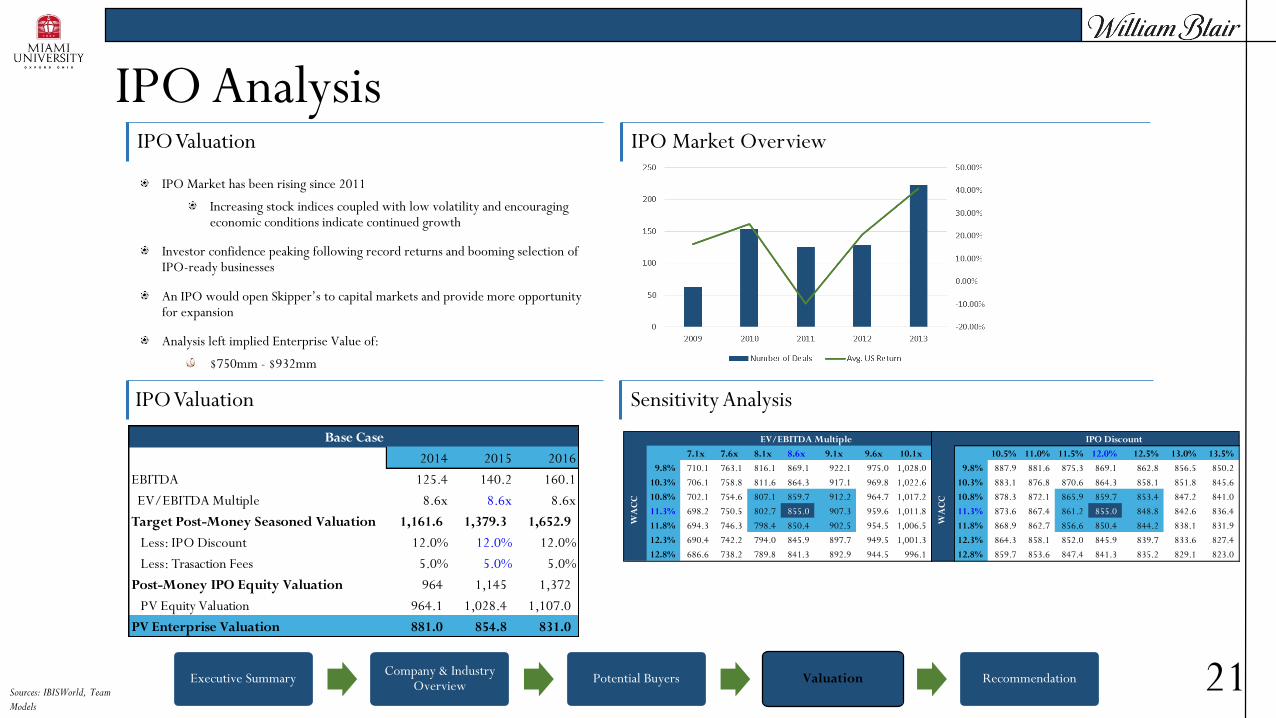
IPO Analysis
IPO Market has been rising since 2011
Increasing stock indices coupled with low volatility and encouraging economic conditions indicate continued growth
Investor confidence peaking following record returns and booming selection of IPO-ready businesses
An IPO would open Skipper’s to capital markets and provide more opportunity for expansion
Analysis left implied Enterprise Value of:
$750mm - $932mm
EV/EBITDA Multiple
7.1x 7.6x 8.1x 8.6x 9.1x 9.6x 10.1x
9.8% 710.1 763.1 816.1 869.1 922.1 975.0 1,028.0
10.3% 706.1 758.8 811.6 864.3 917.1 969.8 1,022.6
10.8% 702.1 754.6 807.1 859.7 912.2 964.7 1,017.2
11.3% 698.2 750.5 802.7 855.0 907.3 959.6 1,011.8
11.8% 694.3 746.3 798.4 850.4 902.5 954.5 1,006.5
12.3% 690.4 742.2 794.0 845.9 897.7 949.5 1,001.3
12.8% 686.6 738.2 789.8 841.3 892.9 944.5 996.1
WA
CC
IPO Discount
10.5% 11.0% 11.5% 12.0% 12.5% 13.0% 13.5%
9.8% 887.9 881.6 875.3 869.1 862.8 856.5 850.2
10.3% 883.1 876.8 870.6 864.3 858.1 851.8 845.6
10.8% 878.3 872.1 865.9 859.7 853.4 847.2 841.0
11.3% 873.6 867.4 861.2 855.0 848.8 842.6 836.4
11.8% 868.9 862.7 856.6 850.4 844.2 838.1 831.9
12.3% 864.3 858.1 852.0 845.9 839.7 833.6 827.4
12.8% 859.7 853.6 847.4 841.3 835.2 829.1 823.0
WA
CC
2014 2015 2016
EBITDA 125.4 140.2 160.1
EV/EBITDA Multiple 8.6x 8.6x 8.6x
Target Post-Money Seasoned Valuation 1,161.6 1,379.3 1,652.9
Less: IPO Discount 12.0% 12.0% 12.0%
Less: Trasaction Fees 5.0% 5.0% 5.0%
Post-Money IPO Equity Valuation 964 1,145 1,372
PV Equity Valuation 964.1 1,028.4 1,107.0
PV Enterprise Valuation 881.0 854.8 831.0
Base Case
Sources: IBISWorld, Team
Models
Executive SummaryCompany & Industry
OverviewPotential Buyers Valuation Recommendation 22
Recommendation
Executive SummaryCompany & Industry
OverviewPotential Buyers Valuation Recommendation
Valuation Range LBO
Discounted Cash Flows Public Comparable and Precedent Transactions
23
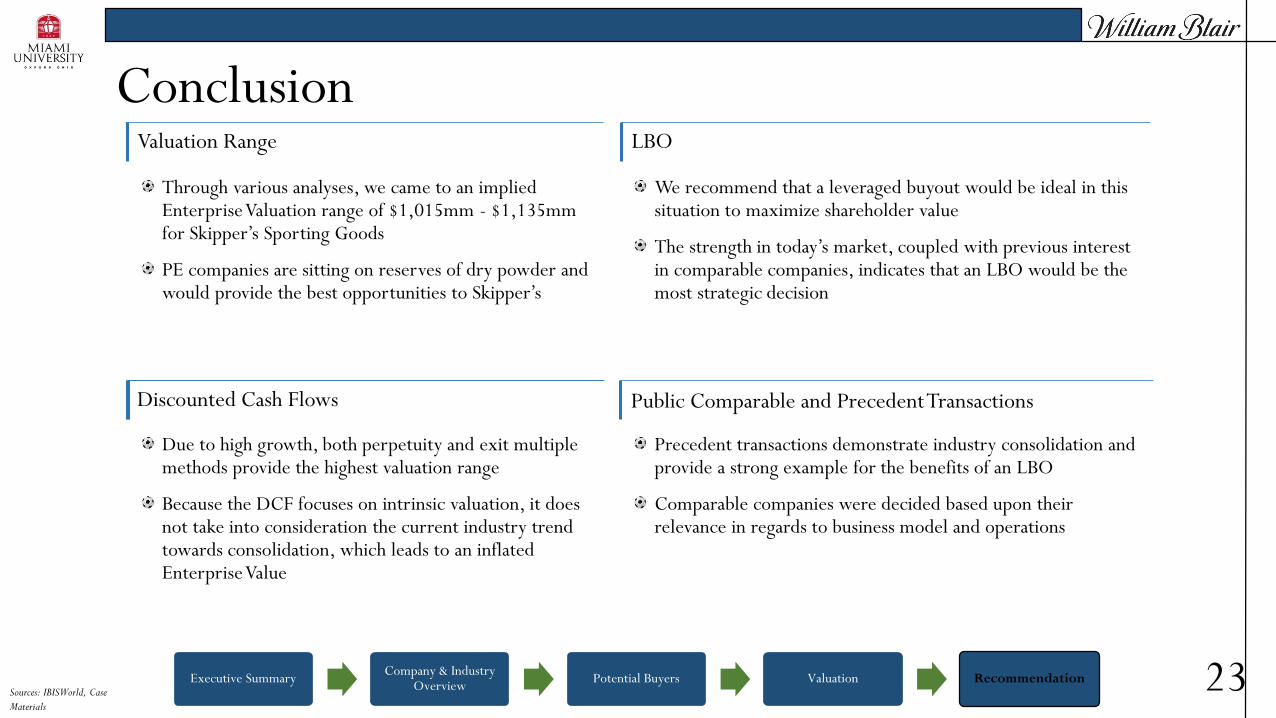
Conclusion
Through various analyses, we came to an implied Enterprise Valuation range of $1,015mm - $1,135mm for Skipper’s Sporting Goods
PE companies are sitting on reserves of dry powder and would provide the best opportunities to Skipper’s
Precedent transactions demonstrate industry consolidation and provide a strong example for the benefits of an LBO
Comparable companies were decided based upon their relevance in regards to business model and operations
Due to high growth, both perpetuity and exit multiple methods provide the highest valuation range
Because the DCF focuses on intrinsic valuation, it does not take into consideration the current industry trend towards consolidation, which leads to an inflated Enterprise Value
We recommend that a leveraged buyout would be ideal in this situation to maximize shareholder value
The strength in today’s market, coupled with previous interest in comparable companies, indicates that an LBO would be the most strategic decision
Sources: IBISWorld, Case
Materials
Executive SummaryCompany & Industry
OverviewPotential Buyers Valuation Recommendation 24
Appendix
Executive SummaryCompany & Industry
OverviewPotential Buyers Valuation Recommendation 25
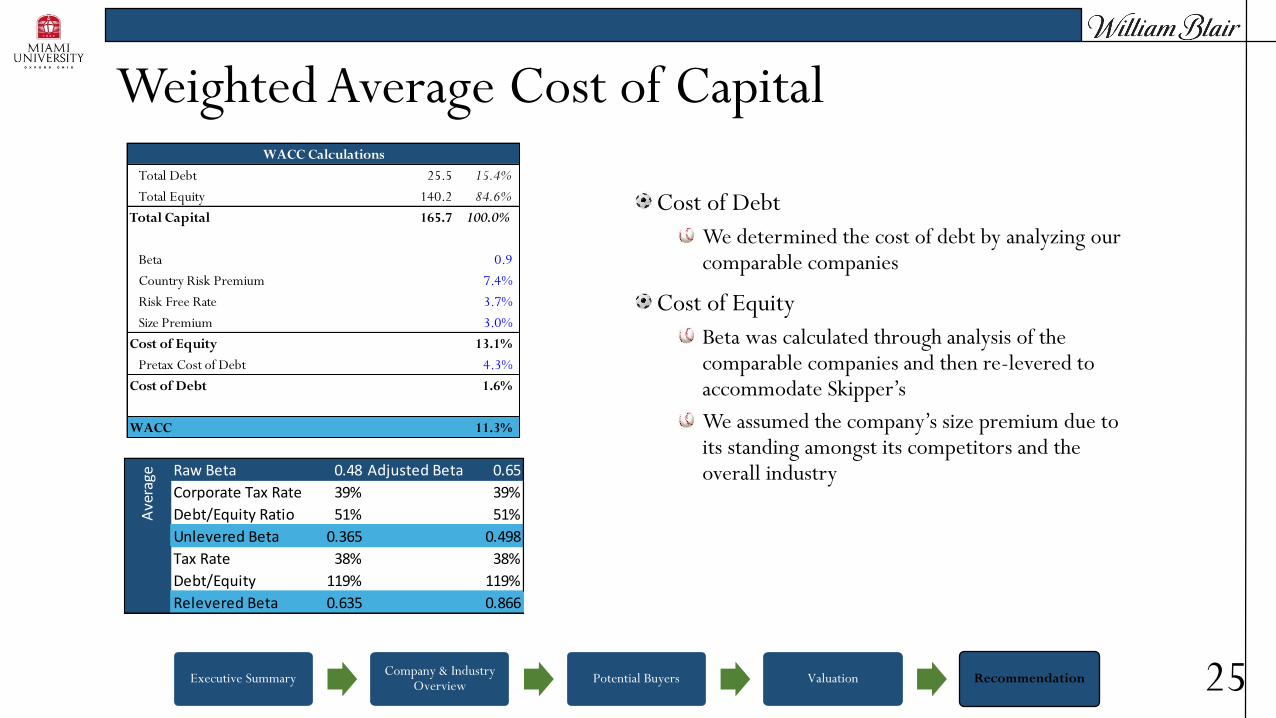
Weighted Average Cost of Capital
Cost of Debt
We determined the cost of debt by analyzing our comparable companies
Cost of Equity
Beta was calculated through analysis of the comparable companies and then re-levered to accommodate Skipper’s
We assumed the company’s size premium due to its standing amongst its competitors and the overall industry
Total Debt 25.5 15.4%
Total Equity 140.2 84.6%
Total Capital 165.7 100.0%
Beta 0.9
Country Risk Premium 7.4%
Risk Free Rate 3.7%
Size Premium 3.0%
Cost of Equity 13.1%
Pretax Cost of Debt 4.3%
Cost of Debt 1.6%
WACC 11.3%
WACC Calculations
Raw Beta 0.48 Adjusted Beta 0.65
Corporate Tax Rate 39% 39%
Debt/Equity Ratio 51% 51%
Unlevered Beta 0.365 0.498
Tax Rate 38% 38%
Debt/Equity 119% 119%
Relevered Beta 0.635 0.866
Ave
rage