bizbrain ibp presentation at sap insider 2016
TRANSCRIPT

Speed and complexity: Lessons learned and best prac5ces in implemen5ng SAP® IBP for companies of different sizes and different business process variants
bridging Business and Technology

The speakers
Luca Massasso Bizbrain Technologies co-‐founder. 15+ years experience in enterprise so=ware. Eleven years of work experience at SAP in various roles (SAP® SCM Development Architect, Business Development Manager, Global New Product IntroducOon Program Manager).
Krishna Mamidipaka Bizbrain Technologies co-‐founder. 20+ years SAP experience in small and large enterprises. At SAP Krishna led the SAP the global product launch of several SAP products, including the latest SAP® HANA soluOons. Prior to SAP Krishna was SVP at Freshdirect.
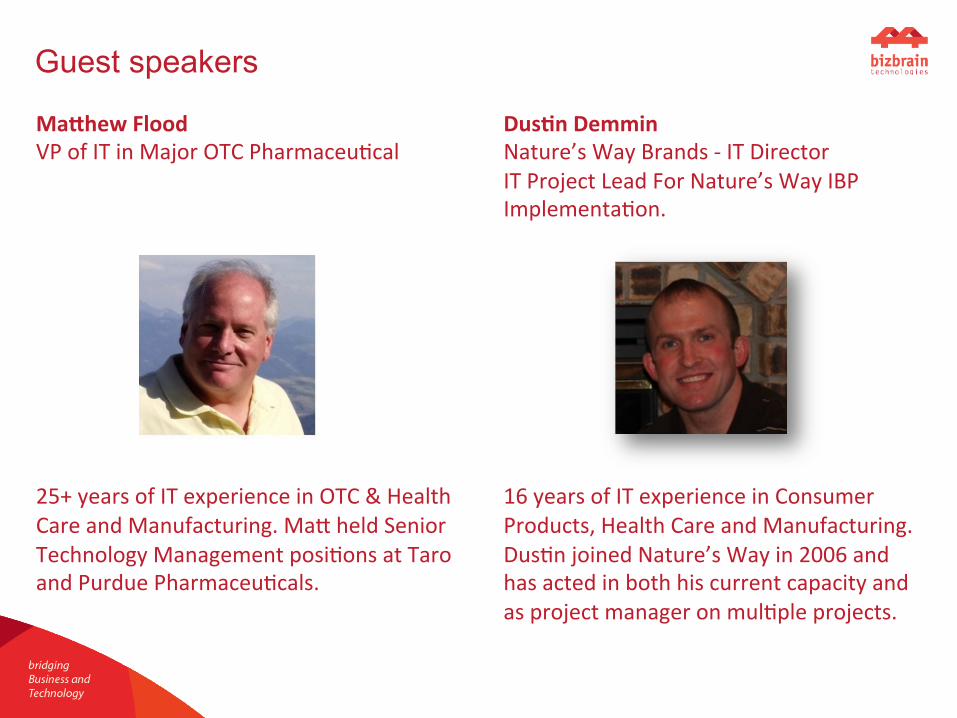
Guest speakers
Dus3n Demmin Nature’s Way Brands -‐ IT Director IT Project Lead For Nature’s Way IBP ImplementaOon. 16 years of IT experience in Consumer Products, Health Care and Manufacturing. DusOn joined Nature’s Way in 2006 and has acted in both his current capacity and as project manager on mulOple projects.
Ma5hew Flood VP of IT in Major OTC PharmaceuOcal 25+ years of IT experience in OTC & Health Care and Manufacturing. Ma^ held Senior Technology Management posiOons at Taro and Purdue PharmaceuOcals.

Introduction
Goals • Share lessons learned (avoid
pi_alls) • Walk away with good ideas on
how to drive value using SAP® IBP • Maximize the return of SAP® IBP
investment using a progressive step by step approach (avoiding expensive rework)
Target Audience • SAP Customer/Prospects
interested in developing an efficient SAP® IBP Roadmap
• Planners/Business Users interested in maximizing the value of SAP® IBP
• IT Professionals interested in SAP® IBP Best pracOces

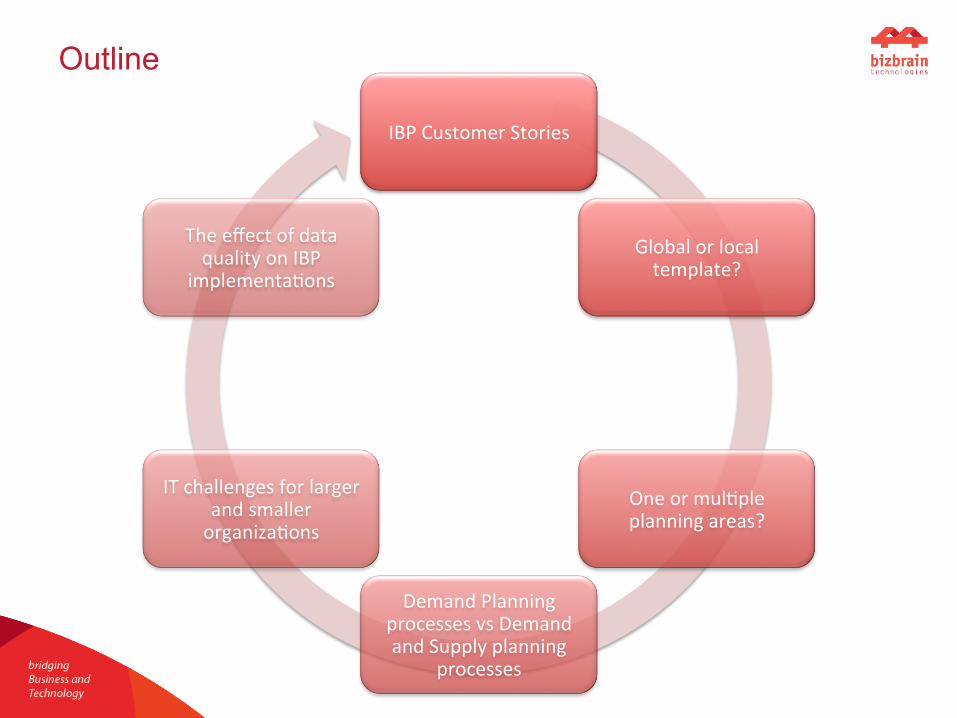
Outline
Global or local template?
One or mulOple planning areas?
Demand Planning processes vs Demand and Supply planning
processes
IT challenges for larger and smaller organizaOons
The effect of data quality on IBP
implementaOons
IBP Customer Stories

Global or local template?
• Is your Supply Chain really global?
• Do you have global planners?
• Do you have a global Supply Chain Unit?
• Do you plan consistently across Regions/ Line of business?
• What processes are you running globally? S&OP? CollaboraOve demand planning? Integrated Business Planning?

Are you ready for a global S&OP template?
• Are certain Line-‐of-‐business/Divisions/Market Units requiring specific process variants?
• Do you have a diverse IT system landscape? • Do you have mulOple ERP instances? • Are you replacing other soluOons?

Generate more value out of SAP® IBP: Time horizons
Short term -‐ ExecuOon
Mid term -‐ TacOcal
Longer term – Strategic/TacOcal

Solution/Process mapping by time horizon
Short term -‐ ExecuOon
Mid term -‐ TacOcal
Longer term – Strategic/TacOcal
SAP® ECC
SAP® APO
SAP® IBP
SAP® BPC
Corporate Strategy
Budget
SAP® PLM
Dashboard/ AnalyOcs
Top Mgmt
Mgmt
Planners
OperaOons

Generate more value out of SAP® IBP: data stack
Master Data
Key Figures
OperaOons Stock on hand and Projected Inventory
Costs
Financial
Corporate
Transport ProducOon
History Delivery and Sales Inventory Revenue/Prices
External Receipts Capacity UOlizaOon Gross Demand Net Demand
Manufacturing cost rate TransportaOon cost rate
Inventory cost rate Non delivery cost rate Op3mizer costs
Prices Procurement cost rate
Inventory cost rate
Projected Revenue Projected Procurement Costs
Projected Manufacturing costs
Projected ProducOon Costs
Projected Overhead Costs
Business OperaOng Plan Sales Quota
Budget
Projected Gross Margin
Target Product Profitability

Levers/values made possible by SAP® IBP
• Process harmonizaOon/standardizaOon • CentralizaOon of informaOon/unique version of the “truth” • ReducOon of planning cycles/increased planners producOvity • Faster management response to planning changes

Outline
One or mulOple planning areas?
Demand Planning processes vs Demand and Supply planning
processes
IT challenges for larger and smaller organizaOons
The effect of data quality on IBP
implementaOons
IBP Customer Stories
Global or local template?

The SAP® IBP Supply model
SCM Input Key Figures
SCM Adjusted Key Figures
SCM Output Key figures SAP® IBP SCM Planning Operator
(HeurisOcs or OpOmizer)
Input
Output
Master Data
SAP® IBP for Supply requires to use an “API” comprising Master data and specific Key figures

Typical SAP® IBP for Supply implementation (global template)
SCM Input Key Figures
SCM Adjusted Key Figures
SCM Output Key figures
SCM Calculated Key Figures
SCM Stored Key Figures Other Stored Key Figures
Other Calculated Key Figures (KPIs, ReporOng KF, etc)
SAP® IBP SCM Planning Operator
(HeurisOcs or OpOmizer)
Input
Output
Master Data

Planning Area
The Planning Area concept
SCM Input Key Figures
SCM Adjusted Key Figures
SCM Output Key figures
SCM Calculated Key Figures
SCM Stored Key Figures Other Stored Key Figures
Other Calculated Key Figures (KPIs, ReporOng KF, etc)
SAP® IBP SCM Planning Operator
(HeurisOcs or OpOmizer)
Input
Output
Master Data

Global Dashboards and Reports

Global Reporting or Global planning
Define a “standard” set of Global Key Figures to steer the Top Management decisions (typically Revenue, Margin, Inventory projecOons)

How to manage process variants
Establish Business and IT governance Task the Business Process governance to manage process harmonizaOon whenever possible and IT governance to efficiently model the Supply Chain

Governance: Master Data
Master Data cannot be parametrized: the Master data structures MUST be the same (difference in process variants can be managed by a^ribute redundancies)

Governance: SCM Key Figures
Key Figures calculaOons may have to be parametrized: establish an internal governance

One or multiple Planning Areas? The available options
Master Data
Planning Area
Master Data
Planning Area A
Planning Area B
Master Data 1
Planning Area 1
Master Data 2
Planning Area 2
One Planning Area All the business processes are supported by one Planning area and one set of Master Data tables.
Mul3ple Planning Areas sharing Master Data
One unique set of Master Data supports mulOple Planning Areas. The Excel Plugin allows the consumpOon of one Planning area data at a Ome.
Independent Planning Areas Independent planning areas are built on independent set of Master Data tables.

Integration and cost of maintenance
One Planning Area HCI may integrate through a common interface definiOon, both for Key Figures and Master Data.
Mul3ple Planning Areas sharing Master Data
Should the Master data have the exact same number of Master Data objects, HCI may integrate through a common interface definiOon. Kay Figures integraOons are potenOally different.
Independent Planning Areas Master Data and Key figures integraOon are potenOally independent.
HCI HCI HCI

Typical use cases ONE Planning area Common MD
With design guidelines for Planning area
Dis3nct Pl. Areas With Design guidelines
Dis3nct Pl. Areas (silos)
• One Unique Planning area • Follow SAP guidelines on Modeling
• MulOple Planning area
• Common Master data is enforcing common MD design
• Common guidelines and governance must be followed for Key Figures and Planning levels to bring this scenario to ONE Planning area
• MulOple Planning areas
• Common guidelines and governance provided for: • Master data • Planning levels • Key figures
Must be followed in order to port this case to ONE Planning area
• MulOple Planning areas without common design guidelines and governance
• Convergence to ONE planning area may require significant rework and it may prove very challenging
readiness

Outline Demand Planning
processes vs Demand and Supply planning
processes
IT challenges for larger and smaller organizaOons
The effect of data quality on IBP
implementaOons
IBP Customer stories
Global or local template?
One or mulOple planning areas?
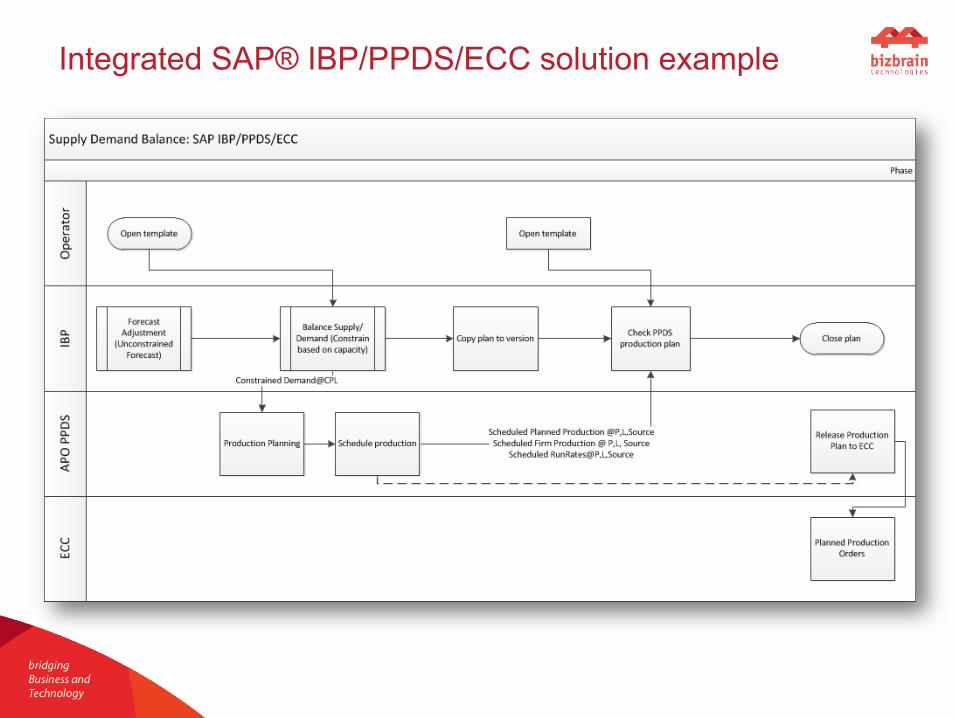
Integrated SAP® IBP/PPDS/ECC solution example

Example of S&OP with generic backend system

Recommendations while following a phased approach
• Follow the SAP Standard • Design the “Demand” process
looking at the “Supply” side to avoid future rework
• Set up currency from day one for currency-‐dependent key figures
• Set up Unit of measures • Consider the “Realignment”
requirements

Outline IT challenges/
advantages for larger and smaller organizaOons
The effect of data quality on IBP
implementaOons
IBP Customer Stories
Global or local template?
One or mulOple planning areas?
Demand Planning processes vs Demand and Supply planning
processes

IT challenges for larger and smaller organizations
• Alignment across LOBs is paramount for process definiOon: you MUST achieve alignment before you start the configuraOon
• Small companies need educaOon on cloud soluOons • Tendency of interpreOng SAP® IBP as reporOng tool vs. planning tool • Understanding the role of SAP® IBP in their soluOon stack (planning
tool, not scheduling tool or data harmonizaOon tool)

IT advantages for larger and smaller organizations
• Short deployment Omes (12 weeks!) • Faster SAP® HANA adopOon • Faster value realizaOon drives IT credibility to the business
community • Hassle-‐free Upgrades and patches
• Cloud soluOons increases IT producOvity as IT can release resources from system maintenance and support

Outline The effect of data quality on IBP
implementaOons
IBP Customer Stories
Global or local template?
One or mulOple planning areas?
Demand Planning processes vs Demand and Supply planning
processes
IT challenges for larger and smaller organizaOons

Impact of data quality on IBP implementations
• Realignment • ReconciliaOon of the data (make sure data matches in all systems) • Lack of data understanding leads to project delays • MulOple Backend systems (i.e. mulOple SAP ECC): SAP® IBP is not an
harmonizaOon tool • Data harmonizaOon is done outside SAP IBP • Master data governance must be in place to enforce the rules
across systems and LOBs
Any of the above items WILL delay your deadlines!!
Outline
IBP Customer Stories
Global or local template?
One or mulOple planning areas?
Demand Planning processes vs Demand and Supply planning
processes
IT challenges for larger and smaller organizaOons
The effect of data quality on IBP
implementaOons

OTC : Business Issues • Sales and OperaOon Process was completely manual – Excel
– No easy access to the enOre data set – Data disconnected from the planning tools
• Develop Sales Budget and Quotas – 3-‐4 weeks to complete • Current business process stagnated business growth and
acquisiOons • Processes was extremely slow • BW reports were slow – remote access even slower • End result was difficult to achieve accurately – many
spreadsheets to analyze and consolidate • Manual process – high rate of errors

Overall IBP Project
• Started with 12 week project – monthly forecasOng Phase 1 only
• Project went so well – Sales OperaOons Planning team decided to construct our enOre SOP on IBP
–Project went to 5 Phases including HCI – 11 months
–Phased ImplementaOon criOcal -‐ easier to manage, test, train users and go live
• Sales Quota – brand/customer required decrease – IBP calculaOon engine would redistribute quotas to other customers automaOcally
• Monthly Forecasts – instantaneous access to previous forecasts
• As phases were implemented, users trust with the system grew

OTC : Key Benefits Achieved • Centralized tool where teams can collaborate in the development
of yearly plans with real Ome visibility, updates to the enOre management team
• Improved data accuracy and consistency with a consolidated and standardized process
• Leading to trusted and reliable input from Sales and MarkeOng • Be^er data accuracy and less rework, shorter Ome to compleOon • Smooth transiOon due to use of familiar tool -‐ Excel • Consensus of Sales , MarkeOng and Demand Planning was now
possible and Quotas planning went from 3-‐4 weeks to hours • Provided foundaOon for M & A – IntegraOon in days & ERP agnosOc • IBP templates run in a minute

OTC : Lessons Learned • Data Quality and Data Life Cycle
• IBP is not reporOng tool
• Change management
• Plan sufficient Ome for IntegraOon and business simulaOon tests
• So=ware life cycle management (Patches and Plugin)

Up to 7 BOM levels Internal and External Manufacturing and Packaging
1800+ finished goods planned
>> Process Management & Collabora3on Clear Visibility to monthly planning process and collaboraOon uOlizing SAP JAM. >> Harmonized Data Model for Demand and Supply Quickly react to changes in demand while balancing inventory, rough cut capacity, and revenue. >> Mul3-‐Level Supply Planning for internal and external produc3on and procurement View demand and sourcing changes and their impact on costs, inventory and capacity in real Ome. >> Built on SAP HANA Real Ome updates to plan with ability to aggregate and disaggregate to any level
SOLUTION HIGHLIGHTS
>> Accelera3on of Nature’s Way’s S&OP Process Maturity Defined CollaboraOon and Process cadence with measurable tasks. >> Visibility to Demand & Supply in a single solu3on Sales, MarkeOng, OperaOons and Finance working from a single plan. >> Real Time Scenarios anywhere in Supply Network Real Ome What-‐If Scenarios in Supply Planning give quick insight to adjustments required to meet demand. >> Real 3me analy3cs support key decisions Access to key decision making data with defined & add-‐hoc analyOcs and planning views .
KEY BENEFITS
Key Considera3ons:
IBP Processes involve all Departments C-‐Level Sponsorship is CriOcal Cross funcOonal teams are key to success
Execu3ve Support
Stack Successes Grow SoluOon with your Process Maturity Implement in Phases
Manageable Phases
Define IBP data needs Determine Data IntegraOon Frequency Commit to Clean Master Data
Know your Data
Know your business and process Consider Ome constraints of project team Include Ome for Corporate Change Management
Realis3c Timelines
Process and SoluOon Engineering in Parallel will increase scope and risk Draw from experienced implementaOon team Build a team with Diverse Skillsets
Experience Ma5ers
Brands Including: Nature’s Way, EnzymaOc Therapy and IntegraOve TherapeuOcs
Retail, Mass, PracOOoner and InternaOonal Business Units
Nature’s Way: Integrated Business Planning Journey
www.bizbraintech.com
Contacts

Abstract
Speed and complexity: lessons learned and best prac3ces in implemen3ng SAP IBP for companies of different sizes and different business process variants. This session will detail the main differences of an SAP IBP implementaOon within companies of different sizes and different business process. For a successful and effecOve adopOon of SAP IBP, come and hear real project experience covering the following dimensions: • S&OP/IBP global templates rollouts vs one instance implementaOons of mulOple
process variants • Global roll-‐outs of Demand Planning challenges vs Demand and Supply balance
processes • Integrated planning implementaOons (i.e. with SAP PPDS) vs stand-‐alone SAP IBP • Planning vs ReporOng • How to support IT organizaOon in smaller or larger organizaOons • Data quality and governance