birdsong variation as a source of information for
TRANSCRIPT

University of Massachusetts Amherst University of Massachusetts Amherst
ScholarWorks@UMass Amherst ScholarWorks@UMass Amherst
Open Access Dissertations
9-2013
Birdsong variation as a source of information for migrating Birdsong variation as a source of information for migrating
common yellowthroats common yellowthroats
Rachel Theresa Bolus University of Massachusetts Amherst
Follow this and additional works at: https://scholarworks.umass.edu/open_access_dissertations
Part of the Ornithology Commons
Recommended Citation Recommended Citation Bolus, Rachel Theresa, "Birdsong variation as a source of information for migrating common yellowthroats" (2013). Open Access Dissertations. 778. https://doi.org/10.7275/1ahp-hz15 https://scholarworks.umass.edu/open_access_dissertations/778
This Open Access Dissertation is brought to you for free and open access by ScholarWorks@UMass Amherst. It has been accepted for inclusion in Open Access Dissertations by an authorized administrator of ScholarWorks@UMass Amherst. For more information, please contact [email protected].

BIRDSONG VARIATION AS A SOURCE OF SOCIAL INFORMATION FOR MIGRATING COMMON YELLOWTHROATS
A Dissertation Presented
by
RACHEL THERESA BOLUS
Submitted to the Graduate School of the University of Massachusetts Amherst in partial fulfillment
of the requirements for the degree of
DOCTOR OF PHILOSOPHY
September 2013
Organismic and Evolutionary Biology

© Copyright by Rachel Theresa Bolus 2013
All Rights Reserved

BIRDSONG VARIATION AS A SOURCE OF SOCIAL INFORMATION FOR MIGRATING COMMON YELLOWTHROATS
A Dissertation Presented
by
RACHEL THERESA BOLUS
Approved as to style and content by: _________________________________________ Bruce E. Byers, Chair _________________________________________ Lynn S. Adler, Member _________________________________________ Jeffrey Podos, Member _________________________________________ Robert J. Smith, Member
______________________________________ Elizabeth R. Dumont, Program Director Organismic and Evolutionary Biology

DEDICATION
To:
Matt and Stephen Bolus
Stephen and Sally Bru
Sam and Charlotte Bolus

v
ACKNOWLEDGMENTS
I thank Bruce Byers for being an inspiring example of a scientist, writer, teacher, and
advisor. He has encouraged me to value intellectual curiosity, scientific rigor, clear and precise
writing, and undergraduate training. I also appreciate Lynn Adler, Jeff Podos, and Rob Smith for
serving on my committee and giving me good advice throughout my graduate career.
I am grateful to Rob Smith and Meg Hatch for allowing me to work at their field site in
Pennsylvania, and for their kind hospitality during the field season each spring.
I also appreciate those who volunteered to help with field work and data collection,
especially Matt Bolus, Kayla Baker, Sara Corey, Katie Kauffman, Chi-Yun Kuo, Artemis Roehrig,
Meghan Stewart, Carlos Varelas, and Hannah Ye.
I thank The Ohio State University Borror Laboratory of Bioacoustics and the Cornell
University Macaulay Library of Natural Sounds for access to and permission to use archived song
recordings. I would also like to acknowledge Anna Bushko, Lackawanna State Park, the Wellfleet
Bay Wildlife Sanctuary, and Cape Cod National Seashore for permission to work on their lands.
I was funded by a National Science Foundation Graduate Research Fellowship, the
University of Massachusetts Amherst Biology and Psychology Departments, and the University
of Massachusetts Amherst Graduate Program in Organismic and Evolutionary Biology. The
Pennsylvania DCR and the University of Scranton also provided funding for the mist-netting data
used in Chapter 4.
My family and friends have supported me in every way imaginable the last six years. The
list of people who have contributed to my successes is too long to include here, but you know
who you are and I love what you have done for me.

vi
ABSTRACT
BIRDSONG VARIATION AS A SOURCE OF SOCIAL INFORMATION FOR MIGRATING COMMON YELLOWTHROATS
SEPTEMBER 2013
RACHEL THERESA BOLUS, B.S., UNIVERSITY OF SOUTHERN MISSISSIPPI
M.S., UNIVERSITY OF SOUTHERN MISSISSIPPI
Ph.D., UNIVERSITY OF MASSACHUSETTS AMHERST
Directed by: Professor Bruce E. Byers
Social information affects the movement decisions of animals and is often an essential factor in habitat selection. Social information should be especially relevant to long-distance migrating birds that navigate over long distances through unfamiliar habitats to find resources to survive. This information likely varies in both availability and importance at the different spatial scales relevant to migrating birds. Using the common yellowthroat as a case study, I tested whether cues might be available in the songs of locally breeding birds at the continental, within-site, and within-territory scales. At the continental scale, I described the geographic variation in song among genetic groups and subspecies, which may provide useful information for migrants navigating across the continent. I found differences in song structure including the duration of silences between notes, number of notes, and bandwidths which might provide cues. Additionally, bandwidth was related to habitat density. At the within-site scale, I tested whether there is a relationship between song, habitat structure, habitat quality, bird size, and bird quality. I found no evidence that song variation is an available source of information about habitat type or quality to migrants exploring habitat variation at the within-site scale. At the same scale, I tested whether migrating common yellowthroats use the presence of song to find habitat by broadcasting song recordings in suitable and unsuitable habitat patches, but did not lure any migrants. However, when I compared the distance between local singing males and the capture locations of migrant common yellowthroat in a passive mist-netting array to the distances expected by chance, I found that migrants were further away from singing local males than expected, perhaps to avoid costly aggressive interactions. At the within-territory scale, I tested whether a singer’s location is predictive of microhabitat structure or food abundance, and whether song rate or duration is predictive of a local male’s activities. I found that the location of a singing bird may provide migrants with information about the location of food and structurally denser habitat. Song variation may also predict the likelihood of attack should a migrant intrude in the local male’s territory.

vii
TABLE OF CONTENTS
Page ACKNOWLEDGMENTS ...................................................................................................................... v
ABSTRACT ........................................................................................................................................ vi
LIST OF TABLES .................................................................................................................................ix
LIST OF FIGURES ............................................................................................................................... x
CHAPTER
1 GEOGRAPHIC VARIATION IN SONGS OF THE COMMON YELLOWTHROAT ......................... 1
2 ASSESSING SOCIAL INFORMATION AVAILABLE IN BIRDSONG TO MIGRATING BIRDS
SELECTING HABITATS WITHIN STOPOVER SITES ............................................................................ 19
3 THE ROLE OF SOCIAL CUES FOR MIGRATING BIRDS: COMMON YELLOWTHROAT SONG
VARIATION MAY CONTAIN CUES ABOUT MICROHABITAT AND THE LOCATION OF FOOD ........... 34
4 EVIDENCE THAT MIGRATING COMMON YELLOWTHROATS AVOID SINGING
CONSPECIFICS DURING STOPOVER ................................................................................................ 45
5 CONCLUSIONS ................................................................................................................... 57

viii
APPENDICES ................................................................................................................................... 61
A TABLES .............................................................................................................................. 62
B FIGURES ............................................................................................................................ 71
C SONG TYPES ...................................................................................................................... 88
BIBLIOGRAPHY ............................................................................................................................... 94
ix
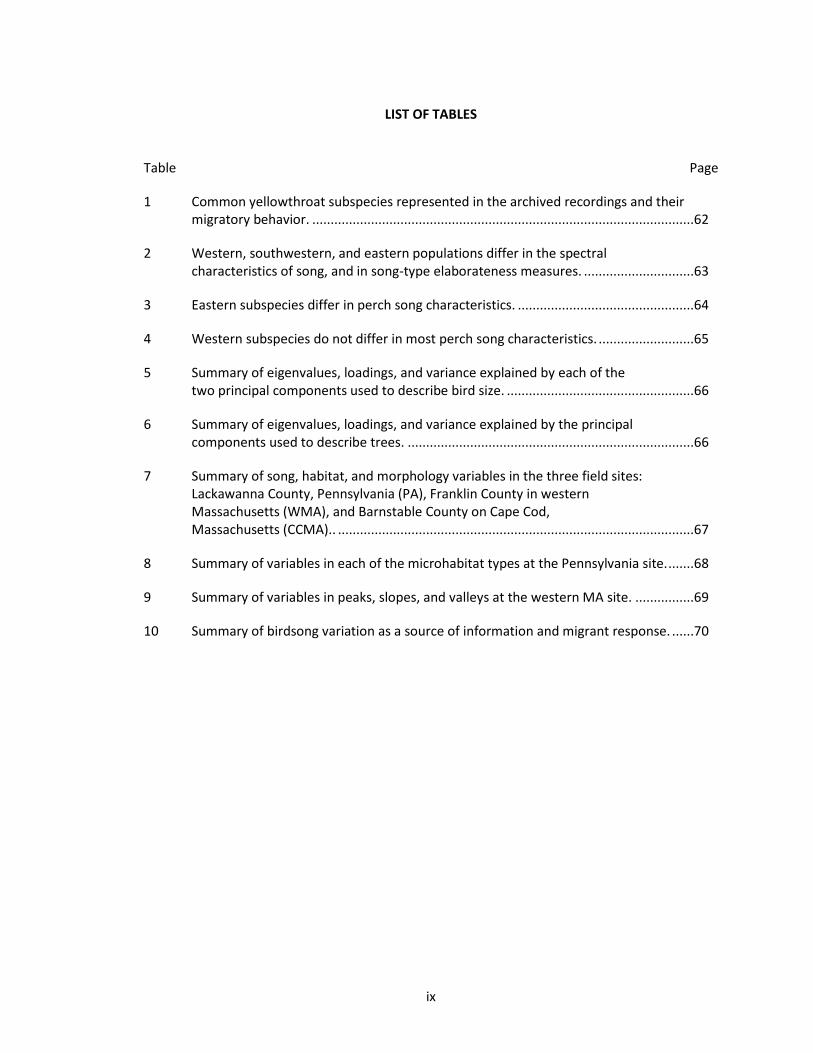
LIST OF TABLES
Table Page
1 Common yellowthroat subspecies represented in the archived recordings and their migratory behavior. ........................................................................................................62
2 Western, southwestern, and eastern populations differ in the spectral characteristics of song, and in song-type elaborateness measures. ..............................63
3 Eastern subspecies differ in perch song characteristics. ................................................64
4 Western subspecies do not differ in most perch song characteristics. ..........................65
5 Summary of eigenvalues, loadings, and variance explained by each of the two principal components used to describe bird size. ...................................................66
6 Summary of eigenvalues, loadings, and variance explained by the principal components used to describe trees. ..............................................................................66
7 Summary of song, habitat, and morphology variables in the three field sites: Lackawanna County, Pennsylvania (PA), Franklin County in western Massachusetts (WMA), and Barnstable County on Cape Cod, Massachusetts (CCMA).. .................................................................................................67
8 Summary of variables in each of the microhabitat types at the Pennsylvania site. .......68
9 Summary of variables in peaks, slopes, and valleys at the western MA site. ................69
10 Summary of birdsong variation as a source of information and migrant response. ......70
x
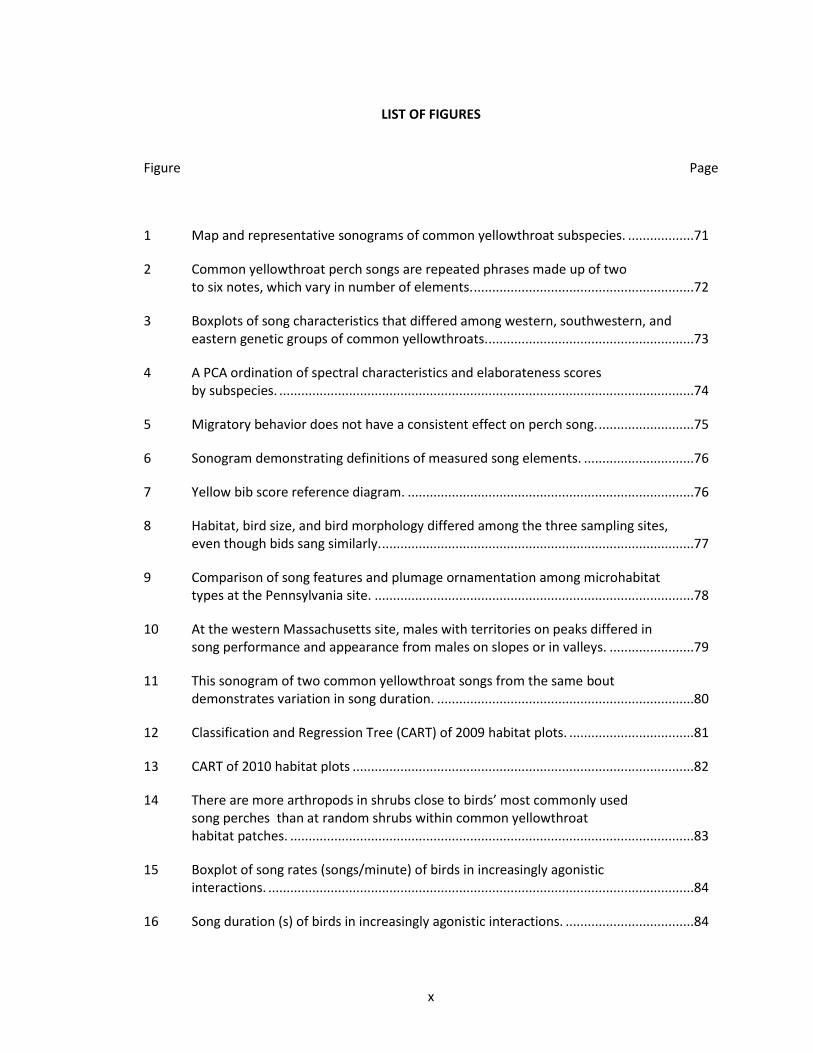
LIST OF FIGURES
Figure Page
1 Map and representative sonograms of common yellowthroat subspecies. ..................71
2 Common yellowthroat perch songs are repeated phrases made up of two to six notes, which vary in number of elements. ............................................................72
3 Boxplots of song characteristics that differed among western, southwestern, and eastern genetic groups of common yellowthroats. ........................................................73
4 A PCA ordination of spectral characteristics and elaborateness scores by subspecies. .................................................................................................................74
5 Migratory behavior does not have a consistent effect on perch song. ..........................75
6 Sonogram demonstrating definitions of measured song elements. ..............................76
7 Yellow bib score reference diagram. ..............................................................................76
8 Habitat, bird size, and bird morphology differed among the three sampling sites, even though bids sang similarly. .....................................................................................77
9 Comparison of song features and plumage ornamentation among microhabitat types at the Pennsylvania site. .......................................................................................78
10 At the western Massachusetts site, males with territories on peaks differed in song performance and appearance from males on slopes or in valleys. .......................79
11 This sonogram of two common yellowthroat songs from the same bout demonstrates variation in song duration. ......................................................................80
12 Classification and Regression Tree (CART) of 2009 habitat plots. ..................................81
13 CART of 2010 habitat plots .............................................................................................82
14 There are more arthropods in shrubs close to birds’ most commonly used song perches than at random shrubs within common yellowthroat habitat patches. ..............................................................................................................83
15 Boxplot of song rates (songs/minute) of birds in increasingly agonistic interactions. ....................................................................................................................84
16 Song duration (s) of birds in increasingly agonistic interactions. ...................................84

xi
17 Playback treatment affected heterospecific capture at the Pennsylvania site, but not at the Massachusetts site. .................................................................................85
18 Capture locations from 2005-2010 at the passive mist-netting station at the Pennsylvania site.............................................................................................................86
19 Migrants were captured farther away from locally singing males than expected. ........87

1
CHAPTER 1
GEOGRAPHIC VARIATION IN SONGS OF THE COMMON YELLOWTHROAT
Abstract
The common yellowthroat (Geothlypis trichas) exhibits widespread geographic variation
in plumage, morphology, migratory behavior, and song. In addition, researchers recently found
evidence that the common yellowthroat has three genetically distinct groups across their North
American range: eastern, western, and southwestern (Escalante et al. 2009). These groups are
more similar to other Geothlypis species than to each other, suggesting relatively long-term
isolation. I hypothesized that geographic variation of song behavior should reflect these genetic
differences. To test this hypothesis, I examined spatial patterns of variation in both note types
and acoustic characteristics of song, using archived and personal Common Yellowthroat song
recordings. Consistent with the hypothesis, I found significant variation among the three
groups, particularly in frequency measures, internote duration lengths, notes per phrase, and
note elaborateness. Within the eastern and western groups, I also found significant song
differences among historically recognized subspecies. In contrast, observed song differences are
not convergent between eastern and western subspecies that are found at similar latitudes and
that exhibit similar migratory behavior. Two possible explanations for this lack of convergence
are stochastic changes in song in isolated populations, and non-latitudinal dissimilarities in
habitat, including transmission properties or effects on morphological evolution, that drive song
divergence. Without excluding the first explanation, I found evidence of the last; individuals in
open, low-canopied habitats sang songs with broader frequency bandwidths, and subspecies
with larger bills sang songs with lower frequencies.

2
Introduction
Geographic variation can reveal much about the evolutionary history of a species. Such
variation results from mutation and dispersal, and may be reinforced by isolation, drift, and
selection (Endler 1977). The geographic variation of vocalizations, such as birdsong, is especially
informative, as it reflects both genetic and cultural changes that occur as populations expand
into new environments (Lemon 1975, Mundinger 1983, Podos and Warren 2007).
New song variants may spread as subsequent generations disperse. Birds closer
together often sing more similarly to each other than birds farther apart, with increasing
divergence over space (e.g. Morton 1987). Eventually, isolated birds may sing so differently that
they do not recognize conspecifics from other populations (Irwin 2000, Derryberry 2007). How
do these changes occur? One explanation is that regional differences in song arise due to
stochastic events (Podos and Warren 2007). However there are also selective pressures that
may shape song, and these pressures may vary among different populations that live in different
environments.
For example, sounds transmit in different ways among different microhabitats and
climates, and the spectral qualities of local birdsong may be selected to optimize transmission in
these areas over time, through a process of acoustic adaptation (Morton 1975, Wiley and
Richards 1978, Boncoraglio and Saino 2007). Also, it is hypothesized that sexual selection is
stronger for birds breeding at higher latitudes (with shorter breeding seasons) than for their
near-equatorial counterparts, a difference that presumably also influences the evolution of
sexual signals including song (Spottiswoode and Moller 2004, Cardoso et al. 2012).
Whether or not song traits are subject to direct natural or sexual selection, change over
time may be caused by variation in traits that affect performance or perception. For example,
morphology can physically constrain vocal spectral features including frequency and timing

3
(Bowman 1979, Ryan and Brenowitz 1985, Podos 2001). Similarly, neural differences may
influence rates of innovation or learning errors (e.g., Prather et al. 2012). Genetic differences
influence both genetic and cultural evolution of songs.
In the study described here, I investigate how some of these mechanisms may have
influenced song evolution in North American populations of the common yellowthroat
(Geothlypis trichas). There is evidence of extensive geographic differentiation in Common
Yellowthroat molecular, morphological, and behavioral traits. First, there are three genetically
distinct populations of common yellowthroats (Escalante et al. 2009): the eastern, western, and
southwestern groups. Despite their similarities in appearance and behavior, the eastern and
western groups are more genetically similar to other Geothlypis species than to each other.
Specifically, the eastern group is more closely related to the Central American resident species
Geothlypis nelsoni and Geothlpis flavovelata, whereas the western group is more closely related
to Geothlypis beldingi of Baja California. The southwestern group appears to be more recently
differentiated, and more closely related to eastern than to western Geothlypis trichas. Given the
genetic differentiation (and correspondingly distinct recent evolutionary histories) of the
eastern, western, and southwestern groups, I hypothesize that they will have evolved distinct
songs. Also, I predict that the southwestern group will sing more similarly to the eastern group,
given that they appear to share a more recent evolutionary history (Escalante et al. 2009). In
addition to the three genetic groups, the common yellowthroat currently has 13 described
subspecies (Pyle 1997, Guzy and Ritchison 1999). Nine of these subspecies are represented in
archived song recordings (Figure 1). The common yellowthroat subspecies have not been
validated by molecular evidence, but the subspecies descriptions reflect true geographic
variation in plumage, size, and migratory behavior (Guzy and Ritchison 1999). Specifically,
subspecies have varying amounts and intensity of yellow on the underparts, as well as

4
distinctive shades of green on the back. Song types also vary among subspecies (Borror 1967).
By comparing subspecies within the genetic groups I was able to test hypotheses about
mechanisms driving the evolutionary history of the songs of this species.
As in many migratory species, common yellowthroat populations vary along the
continuum of completely sedentary to long-distance migratory (Table 1). I compared migratory
subspecies to sedentary subspecies in both the eastern and western groups, to test the
hypothesis that migratory populations should sing songs that require higher levels of vocal
performance, presumably due to increased sexual selection at higher latitudes. If this hypothesis
is true, then migratory subspecies in the eastern and western populations should sing higher
performance songs compared to sedentary subspecies. Migration may also have other
consistent effects on the evolution of singing behavior. For example, subspecies differing in
migratory habits likely vary in their potential for long-distance dispersal. Although most
migratory birds return to breed near their natal area (Greenwood and Harvey 1982), occasional
navigational errors of young birds traveling long distances may result in much larger dispersal
distances than sedentary birds. I explore the potential effects of dispersal on common
yellowthroat song evolution by comparing song characteristics among subspecies with different
migratory habits, and therefore different dispersal potential.
In addition, I test the role of habitat and bird size on song spectral qualities in common
yellowthroats. Specifically, I predict that habitat structure (i.e. open, edge, or closed-canopy
habitat) will affect the frequency of song. As predicted by the acoustic adaptation hypothesis,
birds in open habitats should sing with broader bandwidths than birds in closed, high-canopy
habitats (Morton 1975). If bird size is a factor in the spectral qualities of song, I predict that
subspecies with larger bill dimensions will also sing lower frequency songs (Podos 2001).

5
Methods
Focal species
The Common Yellowthroat is a small wood warbler that uses many different habitats,
including cattails, marshes, bogs, agricultural and forest edges, and shrublands. It prefers
breeding habitats with low canopy cover and dense low-level vegetation, as it nests and feeds
low to the ground. The common yellowthroat is a generalist insectivore that feeds mainly by
gleaning the leaves and twigs of shrubs (Guzy and Ritchison 1999).
Song basics
The common yellowthroat has two songs categories, the rare flight song and the perch
song (Ritchison 1991, 1995, Guzy and Ritchison 1999). The perch song has been most commonly
observed and recorded, and is the focus of my analyses. Males sing the perch song throughout
spring and summer, using it for mate attraction and territorial defense (Kroodsma and Byers
1991, Ritchison 1995). Each individual has a repertoire of one perch song, which is learned
(Kroodsma et al. 1983) but which does not change after crystallization (Borror 1967, Ritchison
1995). Local breeding groups may contain many song types, although shared types within a
population are common. Song types extend for approximately 198 to 454 km (Borror 1967).
Components of song are variously named among species and researchers. I chose to use the
same terms as Borror (1967), who referred to common yellowthroat song as being made of
distinct, repeated “phrases” (Figure 2). In the common mnemonic for common yellowthroat
song, “witchity-witchity-witchity,” each witchity is considered an individual phrase. The number
of times an individual male repeats his phrase per song can vary; it is greater on average during
the courtship phase of the breeding season (Ritchison 1995), and can change within a day and
even within a bout of singing. Song length and the number of repeated phrases are therefore
good measures of an individual’s context-dependent seasonal variability, but a poor measure of

6
between-individual variation. A better unit for exploring broad geographic variation is the
structure of the phrase itself, as it is usually consistent within an individual’s songs but differs
among birds. The phrases are made up of two to six “notes” sung in a consistent order. Notes
are defined as the discrete units within a phrase that are separated by silence. These notes are
further described as having distinct “elements,” or individual frequency upsweeps and
downsweeps. Notes may have as few as one or as many as five distinct elements (Borror 1967).
Song data
I obtained archived recordings from three sources: The Cornell Lab of Ornithology
Macaulay Library of Natural Sounds (n = 57 individuals), The Ohio State University Borror
Laboratory of Bioacoustics (n = 57 individuals), and xeno-canto.org (n = 10 individuals). In
addition, I included one of my own recordings from each of the following locations: Lackawanna
County, Pennsylvania, Franklin County, Massachusetts, and Mobile County, Alabama (n = 3
individuals). Therefore the total number of individuals from all sources was 127. One randomly
selected song per individual (n =127 songs) was measured.
I randomly selected a single individual from each latitude and longitude (to the nearest
degree) combination, to ensure independence of sampled songs. Latitude and longitude were
obtained from field notes submitted by the recordist. If the recordist noted the latitude and
longitude specifically, I used their information in the analysis. In other cases only locations (e.g.
towns, counties, state parks, road names, etc.) were mentioned, so latitude and longitude were
estimated from Google™ Maps’ “getlatlongPlus” application.
I classified G. trichas individuals as “eastern” or “western” using the 100° W longitude
line to split eastern from western birds in the south, and the Rocky Mountains in the north
(Kelley and Hutto 2005). Birds in the subspecies G. t. chyrseola were classified as southwestern
(Escalante et al. 2009). There was a recording bias towards eastern birds in the archived data (n

7
= 96), as compared to western (n = 25) or southwestern birds (n = 6). I classified individuals as
members of a subspecies based on maps and descriptions in Borror (1967) and Pyle (1997). One
individual was not assigned to any classification due to uncertainty, as it was located on a border
between G. t. trichas and G. t. typhicola.
The archived songs were recorded between 1929 and 2011. Although cultural evolution
likely affected populations during this time period, I am confident that the differences among
populations is greater than the changes within them during this period, and that the differences
among populations remains relatively consistent. First, regional song types appear to persist for
a long time. For example, a song type originally recorded in 1963 in Lackawanna County,
Pennsylvania was still present in 2008, and a song type recorded in 1951 in Kern County,
California was still present in 2001. Second, to ensure that time was not a factor in the spatial
analyses, I ran a constrained analysis (capscale in the vegan package in R) on eastern and
western spectral song data with latitude, longitude, and time as the constrained factors. By
comparing models with and without time (recording year), I found that time was not a
significant factor in either the east (F = 1.27, df = 1, 92, p = 0.23) or the west (F = 0.49, df = 1, 21,
p = 0.81).
I collected data on the presence or absence of previously defined note types and on
spectral characteristics. Specifically, I assessed the note types defined by Borror (1967), who
identified 83 notes from the 411 songs he sampled. Most notes observed matched one of these
notes, but I encountered 15 new notes, for a total of 80 notes.
An individual blind to the predictions of the study measured the spectral characteristics
of all songs with Raven 1.4. Common yellowthroat songs have a few introductory notes of low
amplitude, so in each song the first clearly visible phrase was measured. An individual’s song can
begin with any note of the phrase, so identifying a note as the beginning or end of a phrase is

8
subjective. For consistency, I defined the beginning of a phrase as the note with the lowest
beginning frequency. The following phrase measurements were made: maximal frequency (Hz),
minimal frequency (Hz), peak frequency (or frequency in Hz of the peak power, calculated by
Raven), and phrase duration (s). I defined phrase duration as the time between the beginning of
the initial note and the beginning of its next repetition. Using the measured maximal and
minimal frequencies (Hz), I calculated the difference between them, the bandwidth. In addition I
calculated the bandwidth per phrase duration (Hz/s), a coarse measure of singing performance.
Songs with larger bandwidth per second measures are considered higher performance due to
the difficulty of performing a broader bandwidth over a shorter time period. Lastly, the duration
of each note and internote intervals (silence) in the phrase were measured, and then I
calculated the mean note duration (sec) and mean internote duration (s) across the measured
phrase. All frequency measurements were made with an FFT value of 1024 (precision = 47 Hz)
and all time measurements were made with an FFT value of 128 (precision = 1.3 ms). To
estimate song elaborateness, I noted the number of notes per phrase, and calculated the mean
number of elements per note (total elements/number of notes per phrase).
Statistics
All statistical tests were computed using R. All reported values in the text and tables are
means ± SD; boxplots show medians bounded by IQR.
To compare spectral characteristics among the three groups, I first plotted PCA scores to
visualize similarity among groups. I performed a permutational multivariate analysis of variance
using distance matrices (adonis function from the vegan package in R) on the column-
standardized data, a robust multivariate permutation test to compare groups. I then used the
Kruskall-Wallis test as a post-hoc test to examine each of the spectral variables separately
among the groups (similar to how a Tukey’s test is used with a univariate ANOVA).

9
To compare note-type distribution among the three genetically distinct groups, I
computed rates of note-type sharing, and used a chi-square test to test whether the number of
unique note types per group indicated differences in rates of song change or was more
reflective of variation in sampling effort.
I performed similar tests to compare note types and spectral characteristics
among subspecies, evaluating the eastern and western subspecies separately. I dropped
subspecies with only one individual per subspecies (i.e., western G. t. trichas, eastern G.
t.typhicola, and the unknown eastern individual). Within regions, I also tested whether
euclidean distance predicted similarity of note types, using a Mantel test that compared
latitude/longitude with presence/absence of note types, both transformed into euclidean
distance matrices.
Lastly, to explore possible correlates of geographic variation, I tested the relationships
between common yellowthroat song and morphology, and between song and habitat. To
compare song and morphology, I tested for correlations between the subspecies mean culmen
length (Pyle 1997) and the subspecies mean of each frequency variable. To compare song and
habitat, I used the subset of the Macaulay Library archives that included habitat descriptions,
and personal recordings, for which the habitat was known. Forty Yellowthroats were recorded in
9 habitat types. I classified the habitat types into low (marsh, fallow field, meadow, bog), middle
(brush, riparian, edge), or high (forest, swamp) canopy types. I then used an ANOVA to test the
difference in minimal frequency, maximal frequency, peak frequency, and bandwidth, and used
post-hoc Tukey HSD for pairwise comparisons when results were significant.
Level of significance of most tests is 0.05, with the exception of the Kruskall-Wallis (K-
W) tests. I used the multivariate tests as many ANOVA tests are, as the first level of tests for
significance; I only considered post-hoc K-W tests in interpretation if the multivariate tests were

10
first significant. The purpose of the K-W tests was to elucidate which variables were driving the
differences among the groups (like a Tukey’s test in a univariate procedure). Two of the ten song
variables, notes per phrase and elements per note, were song elaborateness count data, not
spectral measurements. These song elaborateness variables were not included in the initial
multivariate analysis of the continuous spectral measurement data, but were reported with
their K-W scores in the tables for comparison.
Results
Comparing eastern, southwestern, and western regions
Spectral characteristics differed among the regions (F = 5.2, df = 2, 124, p = 0.001).
Specifically, western birds’ songs had larger maximal frequencies, bandwidths, bandwidth per
phrase duration, and mean internote duration than eastern birds (Figure 3). Southwestern birds
had larger internote duration and more elements per note than eastern birds, but had
intermediate values in the other spectral characteristics. All groups had similar peak
frequencies, phrase duration, and mean note duration (Table 2). Southeastern birds had more
note types per song than any other regional group.
Groups also differed in their average note and song elaborateness. Southwestern birds
had the highest mean elements per note (more frequency upsweeps and downsweeps per
note). Eastern birds had the fewest mean elements per note. This relationship was partly driven
by southeastern birds, which mostly had notes with only one or two upsweeps or downsweeps,
a pattern originally noticed by Borror (1967). Even though notes were less elaborate,
southeastern birds had more note types per song than any other regional group.
The three genetically distinct groups had a broad overlap in note types among the
groups. 45% of note types were shared between at least two groups, and 9% were shared
among all three groups. The number of unique note types per group did not differ from chance

11
(χ2 = 0.79, df = 2, p = 0.68). However, five out of six southwestern birds shared a particular note
type that was not observed in the other groups, despite sharing 89% of their note-type
repertoire with eastern and western birds. This note (fig. 42 in Borror 1967) was also the only
note in the perch song repertoire to show pronounced harmonic overtones.
Eastern subspecies
Eastern subspecies differed significantly in spectral characteristics (F = 5.0, df = 4, 91, p =
0.001). The sedentary G. t. ignota and the two migratory subspecies, G. t. trichas and G. t.
campicola had very little overlap, especially between G. t. ignota and G. t. campicola, which are
farthest apart geographically (Figure 4). G. t. trichas and G. t. campicola had shorter phrases
with less notes per phrase, than G. t. ignota, a pattern also noted by Borror (1967). G. t. ignota
had shorter internote durations, lower maximal and minimal frequency values, more narrow
frequency bandwidths, and a smaller bandwidth per phrase duration values than the migratory
subspecies (Figure 5). The subspecies had similar peak frequencies. Overall, eastern migratory
subspecies had less elaborate songs (fewer notes per phrase), more elaborate notes (more
elements per note), and higher performance phrases (higher bandwidth over phrase duration)
than did sedentary birds (Table 3).
Eastern subspecies showed substantial overlap of note types, even though they had
different song types. Unique note types per subspecies did not differ from chance (χ2 = 1.5, df =
4, p = 0.82). At this scale, birds that were closer to each other spatially were more likely to share
note types than were birds that were farther apart (Mantel r = 0.13, p = 0.01). However,
adjacent subspecies shared the same proportion of note types with each other as non-adjacent
subspecies. Specifically, adjacent G. t. ignota and G. t. trichas shared 33% of their note-type
repertoires, adjacent G. t. trichas and G. t. campicola shared 26%, and non-adjacent G. t. ignota
and G. t. campicola shared 25%.
12
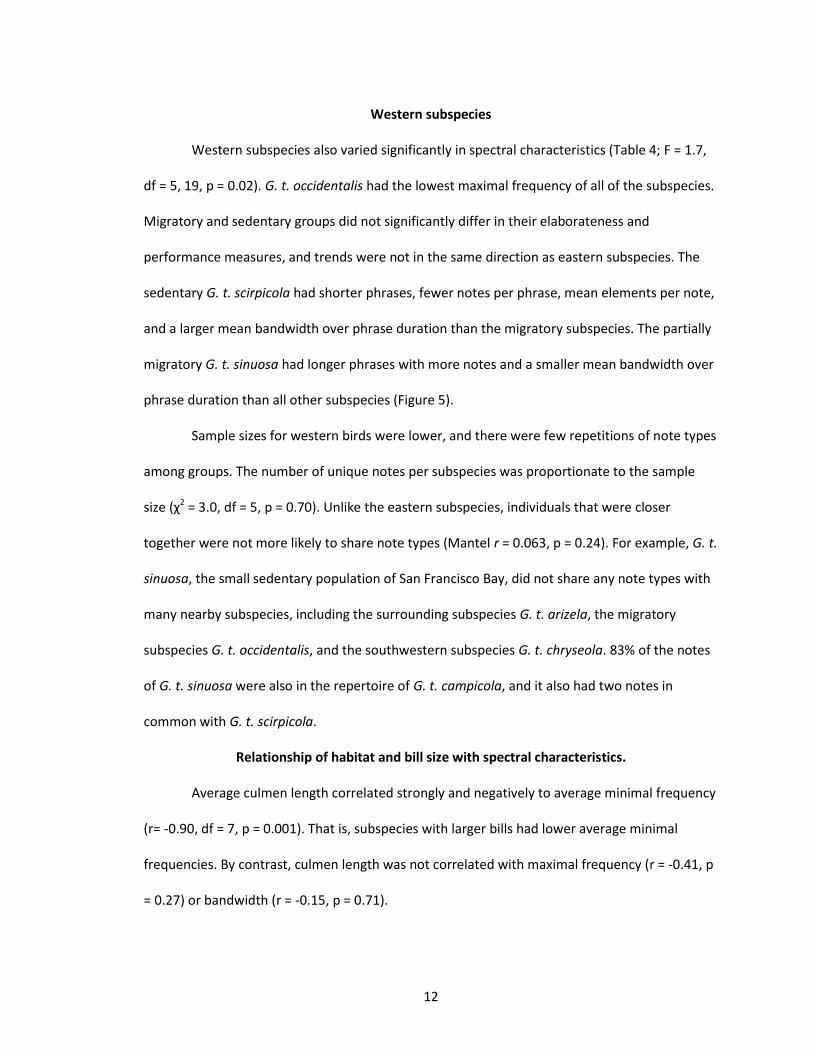
Western subspecies
Western subspecies also varied significantly in spectral characteristics (Table 4; F = 1.7,
df = 5, 19, p = 0.02). G. t. occidentalis had the lowest maximal frequency of all of the subspecies.
Migratory and sedentary groups did not significantly differ in their elaborateness and
performance measures, and trends were not in the same direction as eastern subspecies. The
sedentary G. t. scirpicola had shorter phrases, fewer notes per phrase, mean elements per note,
and a larger mean bandwidth over phrase duration than the migratory subspecies. The partially
migratory G. t. sinuosa had longer phrases with more notes and a smaller mean bandwidth over
phrase duration than all other subspecies (Figure 5).
Sample sizes for western birds were lower, and there were few repetitions of note types
among groups. The number of unique notes per subspecies was proportionate to the sample
size (χ2 = 3.0, df = 5, p = 0.70). Unlike the eastern subspecies, individuals that were closer
together were not more likely to share note types (Mantel r = 0.063, p = 0.24). For example, G. t.
sinuosa, the small sedentary population of San Francisco Bay, did not share any note types with
many nearby subspecies, including the surrounding subspecies G. t. arizela, the migratory
subspecies G. t. occidentalis, and the southwestern subspecies G. t. chryseola. 83% of the notes
of G. t. sinuosa were also in the repertoire of G. t. campicola, and it also had two notes in
common with G. t. scirpicola.
Relationship of habitat and bill size with spectral characteristics.
Average culmen length correlated strongly and negatively to average minimal frequency
(r= -0.90, df = 7, p = 0.001). That is, subspecies with larger bills had lower average minimal
frequencies. By contrast, culmen length was not correlated with maximal frequency (r = -0.41, p
= 0.27) or bandwidth (r = -0.15, p = 0.71).

13
Common yellowthroats in low-canopy habitats sang broader frequency ranges (mean =
4736 ± 890 Hz, n = 11) than did individuals in middle (mean = 4019 ± 563 Hz, n = 11) or high-
canopy habitats (mean = 4012 ± 477 Hz, n = 17; F = 5.0, df = 2, 36, p = 0.01). Post-hoc Tukey's
HSD tests confirmed that common yellowthroats in low-canopy habitats sang broader
bandwidths than both middle and high-canopy singers, but middle and high-canopy songs did
not differ from each other.
Minimal frequency (F = 0.58, df = 2, 36, p = 0.56), maximal frequency (F = 3.1, p = 0.06),
and peak frequencies (F = 1.8, df = 2, 36, p = 0.17) did not correlate with canopy height.
Discussion
The geographic variation present in the songs of common yellowthroat suggests
isolation, migration, differences in morphology, and differences in habitat affect song evolution
in this species. Published data on patterns of genetic divergence imply that the eastern,
western, and southwestern populations are isolated from each other. The present data suggest
that their singing behavior has diverged accordingly. Specifically, the western and eastern birds
differed from each other in most frequency measures, internote durations, and both note and
song elaborateness (average elements per note and notes per phrase). Despite genetic similarity
to the eastern birds, southwestern birds did not sing more similarly to them than to the western
birds (see Table 2). They had larger internote durations and greater note complexity than
eastern birds, and intermediate values for bandwidth per phrase duration and average number
of notes per phrase (Figure 3). The mostly intermediate characteristics of the southwestern
birds might have arisen because the southwestern group is geographically closer to western
birds, with more similarities in climate and habitat, even though they are genetically closer to
the eastern birds (Escalante et al. 2009)

14
Some song measures had high variation within groups, or a lack of variation among
them. Specifically, peak frequencies were not variable. In contrast, phrase durations and
average note durations did not differ among groups because they were highly variable within
each group. Adding elements to a note or notes to a phrase do not seem to affect species
recognition in this species (Wunderle 1979). As phrase types are learned, phrase and note
durations may be more subject to cultural drift. In contrast, Yellowthroats do use internote
durations for species recognition (Wunderle 1979), responding less to songs that diverge from
population averages, yet eastern, western, and southwestern birds had different internote
durations. Between-group divergence of internote durations could lead to greater isolation and
eventual speciation among the three groups, if changing internote durations impedes species
recognition among them.
The eastern, western, and southwestern groups may have diverged in acoustic
characteristics, but they did not differ in their distribution of note types. A wide diversity of note
types was found across the species range. Of the 127 birds sampled, 80 note types were
observed, and 37 of them were shared across two or more groups. The 43 note types that were
unique to one group were distributed among the groups according to sample size, as expected
by chance. It is not clear why notes types are distributed so widely given the evidence of genetic
isolation. Perhaps chance long-distance dispersal events have led to the widespread colonization
of certain note types. Maybe biases inherent in common yellowthroat neurobiology create
similar note types independently across the species range, and/or select which are most likely to
become integrated into a population’s repertoire. For example, a simple frequency downsweep
is a common note structure in common yellowthroat songs (Borror 1967), and individuals that
sing a downsweep in the same frequency range may be convergent.

15
Although note types appear to be distributed haphazardly at the continental scale, note
and song types are shared more extensively at smaller scales. The southwestern group has a
large proportion of note-type sharing; five out of the six representative individuals shared an
unusual harmonic note type (fig. 42, Borror 1967). The frequent occurrence of this note type in
the perch song repertoire might reflect the smaller geographic range of the southwestern
group, compared to the eastern and western groups. Additionally, the popularity of a unique
note type supports the hypothesized recency of this group (Escalante et al. 2009), which may
have had less time to mutate and culturally diversify since isolation and range expansion.
Some researchers have suggested that migration is a consistent force in song evolution,
pushing birds towards more elaborate, higher performance song repertoires (Catchpole 1982,
Read and Weary 1992, Spottiswoode and Møller 2004, Cardoso et al. 2012). However,
comparing differences among subspecies, migratory common yellowthroats do not consistently
show more elaborate (or higher performance) song than their sedentary counterparts in the
same region (Figure 5). In the east, migratory birds have fewer notes per phrase but more
elements per note than the sedentary G. t. ignota, and they have higher “performance” songs,
with higher bandwidth over phrase duration measures. In the west, migratory subspecies have
more notes per phrase and lower bandwidth over phrase duration than the sedentary G. t.
scirpicola. The partially migratory G. t. sinuosa has more notes per phrase than G. t. scirpicola
and the other migratory subspecies, but it also has longer internote duration and lower
bandwidth over phrase duration. All subspecies in the west have similar mean elements per
note. The patterns observed do not have parallel directionality between regions, and suggest
stochastic changes, or unique selective pressures among subspecies that are unrelated to
migration or latitudinal factors. They are not consistent with the hypothesis that migrants evolve
more elaborate songs due to increased sexual selection.

16
The evolution of migratory behavior and associated traits is varied, depending on
species’ evolutionary histories (Zink 2002). For common yellowthroats, the original Geothlypis
was most likely a sedentary tropical species that descended from a migratory Opornis ancestor
(Escalante et al. 2009). The current sedentary tropical Geothlypis species evolved and spread
north, until some of the G. trichas subspecies regained migration. The evolution of migration
might not be convergent in the east and in the west. The eastern subspecies’ singing behaviors
suggests a gradual range expansion and separation of sedentary and migratory subspecies,
perhaps due to dissimilarities in the timing of breeding activities (e.g. Bearhop et al. 2005). In
the west, however, the story appears different. The G. t. sinusosa and G. t. scirpicola subspecies
have very small ranges, and are similar in many acoustic measures to the other western
subspecies. It is possible that they are more recently founded sedentary populations that have
broken off from contiguous migratory subspecies, rather than the direct descendents of
sedentary groups that expanded into the current migratory subspecies. Indeed, the patterns of
note-type sharing hint at the relationships of subspecies to G. t. sinuosa. G. t. sinuosa does not
share any note types with the surrounding migratory G. t. arizela. Most of the G. t. sinuosa note
repertoire (83 %) is also found in the long-distance migratory subspecies, G. t. campicola.
Perhaps this small partially migratory population was founded when opportunistic migrant G. t.
campicola individuals settled in the seasonally mild San Francisco Bay area, forgoing long-
distance migration in future generations. G. t. sinuosa do migrate extremely short distances
down the California coast to San Diego (Bent 1963), which may be evidence of their migratory
origins.
Acoustic ecology also appears to play a role in song evolution. Common yellowthroats
prefer densely shrubby habitats (Guzy and Rithison 1999), and often sing in the middle of
shrubs, particularly when interacting with their mate or fighting with neighboring males (pers.

17
obs.). Dense habitat structure attenuates sound, and can affect the clarity of the signal (Morton
1975). Higher frequencies attenuate more than lower frequencies, so if common yellowthroats
songs have evolved to maximize transmission, they should be as low-frequency as physically
possible (Marten and Marler 1977). Supporting this prediction, common yellowthroat song is
tightly correlated to bill morphology; subspecies with the largest culmens have lower minimal
frequencies. If bill length limits song frequency (Palacios and Tubaro 2000, Podos et al. 2004),
the observed correlation suggests that each common yellowthroat sings as low as it possibly
can.
Habitat diversity also appears to influence common yellowthroat song geographic
variation. Common yellowthroats, although preferring low-canopy habitat with dense
understory, have generalist macrohabitat preferences (Guzy and Ritchison 1999). Some
populations may breed in marshes with standing water and sparse song perch trees, whereas
others may breed in dry agricultural edges next to a dense coniferous forest. These diverse
habitats vary greatly in acoustic transmission properties (Morton 1975, Marten and Marler
1977, Slabbekoorn and Smith 2002, Derryberry 2009). As predicted by the acoustic adaptation
hypothesis, common yellowthroats singing in low-canopy, open habitats had broader frequency
ranges than individuals in middle or high-canopy habitats (Morton 1975).
When considering the bandwidth components (minimal and maximal frequencies)
separately, there was no difference in minimal frequencies among habitat types, but the
difference in maximal frequencies was nearly significant; birds singing in middle and high-
canopy habitats had similar values, but low-canopy singers sang at higher frequencies. In all
habitats, birds may sing as low as they can to maximize transmission, but in open habitats they
may be released from selective pressures to keep bandwidths small, as acoustically there is little
negative consequence of singing higher there (Morton 1975). At the same time, common

18
yellowthroats prefer open and edge habitats to high-canopy, forested habitats (Guzy & Ritchison
1999). If higher bandwidths are associated with higher performance, birds may sing smaller
bandwidths in forested habitats because they are poorer quality individuals that are relegated
to less-preferred habitat.
In conclusion, the present data offer a tantalizing peek at the evolution of common
yellowthroat song, and illustrate that genetically different groups have evolved distinct songs,
reflective of unique evolutionary histories and trajectories. As such, song diversity reflects
common yellowthroat diversity.

19
CHAPTER 2
ASSESSING SOCIAL INFORMATION AVAILABLE IN BIRDSONG TO MIGRATING BIRDS SELECTING
HABITATS WITHIN STOPOVER SITES
Abstract
Birdsong characteristics may reflect the singer’s habitat and/or morphology, and
therefore may be an important source of information for prospecting migrant birds to locate
and assess habitat characteristics, including those related to the size or quality of resident
males. In order to be an available cue for migrants, this information should be consistent at
different locations. To test this hypothesis, I recorded the songs of common yellowthroat
(Geothlypis tricas) males at three sites in the northeastern United States from 2009-2011,
comparing song characteristics to microhabitat, size, and plumage ornamentation. Songs did not
differ among sites in acoustic parameters or performance, even though microhabitat, size, and
plumage ornaments of males were significantly different. Although there was not a significant
linear relationship between song characteristics and habitat or bird morphology when all sites
were pooled, relationships between song, habitat, and morphology did occur within sites. At the
Pennsylvania site, I found that male song performance varied among microhabitat types. In the
most open habitat, birds sang with the highest performance and most consistency, both of
which decreased with increasing vegetation density. At the Massachusetts site, which varied
greatly in elevation, there was a trend that males sang with higher performance in territories on
peaks, even though the most-ornamented, higher quality males were found in the valleys. Song
appeared to reflect transmission properties of the environment more than habitat quality. I
found that the relationships between song, habitat, and morphology were not consistent
enough among sites for migrants to use song as a cue to habitat quality at the within-site scale.

20
In order to use song to evaluate male quality, migrants would have to evaluate song features
and performance among a network of males, a task that may be more difficult for transient
birds unfamiliar with local dynamics.
Introduction
Many animals use social information to select habitat (Fletcher and Sieving 2010)
(Fletcher and Sieving 2010). In an unfamiliar environment, social information is often better
than personal information, or information acquired from personal sampling (Danchin et al.
2004). Individuals can make decisions more quickly and with less risk using information gleaned
from more experienced individuals. Efficient information gathering may be especially important
for animals such as migrating birds that must sample unfamiliar landscapes to find suitable
habitat containing needed resources (Németh and Moore 2007).
Although there are many cues that migrating birds could use to select habitat, cues
contained in birdsong seems to be especially useful. Birdsong is a conspicuous, long-distance
vocalization that is rich in information (Kroodsma and Byers 1991). Variation in birdsong may
provide useful social information for migrants making movement decisions within a stopover
site, especially information about habitat type (Boncoraglio and Saino 2007) or quality
(Slabbekoorn and Smith 2002), and singer size (Ryan and Brenowitz 1985) or quality (Gil and
Gahr 2002), which also may be predictive of habitat quality.
What might cause song variation that migrants could potentially use to evaluate
habitat? Singing birds’ size and habitat might be especially important (e.g., Derryberry 2009).
Body size often correlates with the frequency or timing of vocalizations because it is often
related to the size of sound-producing organs, which exert physical limitations on sound
production (Ryan and Brenowitz 1985, Palacios and Tubaro 2000, Podos 2001). In particular,

21
birds with larger bodies and/or bills often sing songs with lower frequencies, longer intervals
between repeated song elements, and narrower bandwidths. Once an individual’s song is
broadcast into the environment, it is transmitted through a habitat that includes sound-
distorting plants and topography (Wiley and Richards 1978), but the song can only be effective if
it reaches receivers with minimum distortion (Morton 1975). Therefore, selection favoring
optimal sound transmission in the structurally varying habitats may result in variation in songs
among species and populations, an idea also known as the acoustic adaptation hypothesis
(Morton 1975, Hansen 1979, Boncoraglio and Saino 2007). Specifically, birds that sing in habitats
with more vertical structure (i.e. closed habitats, forests) often have narrower bandwidths,
longer intervals between repeated song elements, and lower minimal frequencies.
Another influence on song variation is the “quality” of the singer, which is
presumably correlated to the quality of the habitat it occupies. Songs can vary in how well they
are performed. One measure of performance is how closely a particular physically challenging
song component (e.g., fast trill rates of some sparrows, Podos 1997, Ballentine 2009)
approaches physical limits on performance. Another performance measure is the consistency
with which a bird sings a song across renditions and bouts, with the idea that it is more difficult
to sing a song exactly the same way every time than to allow it to vary (Byers 2007). Measures
of performance consistency may also reveal the differences between a young bird still practicing
its song in the early phases of crystallization and an experienced bird with a fully crystallized
song. Birds with higher performance song often have higher fitness (Byers 2007, Janicke et al.
2008, Botero et al. 2009, Sakata and Vehrencamp 2012); they may also have higher-quality
territories. Therefore, song performance can provide informative cues about habitat quality.
If the relationship between song and habitat and/or bird quality is not consistent across
populations, then migrants unfamiliar with local song features and dynamics may have difficulty

22
using song to predict habitat quality. In this case, song variation would not be an available cue.
There are two ways that song would be consistent enough to be interpretable as a cue by
migrants unfamiliar with local songs: 1) within a species, there might be a global relationship
between song variation and habitat that is dictated by the physical relationship between sound,
bird size, and habitat structure (e.g., as the minimal frequency of songs increase by x units, the
shrub density of birds’ territories increase by y units), or 2) among populations, the relative
relationship between song variation and habitat is consistent (e.g., in all populations, birds with
high performance songs are found in good habitat). In this study, I test both of these
hypotheses- which I here call the “global assessment hypothesis” and the “local dynamics
assessment hypothesis”- to determine if common yellowthroat song reliably predicts differences
in habitat structure or quality at the within-site scale.
Methods
Focal species
The common yellowthroat (Geothlypis trichas) is a small insectivorous warbler. It is an extremely
common eastern migrant that breeds in scrubby forest edges, and its song has been thoroughly
documented and studied (Borror 1967, Wunderle 1978, Wunderle 1979, Kowalski 1983,
Kroodsma et al. 1983, Ritchison 1991, Ritchison 1995). The black mask area of the face and the
intensity of yellow on the breast are correlated with fitness in some populations (Tarof et al.
2005, Dunn et al. 2008), and can therefore serve as fitness proxies for estimating male quality.
Field sites
I conducted research at three field sites in the northeastern United States: private lands
in Lackawanna County, Pennsylvania (41°33'51"N, 75°43'15"W), a power-cut in Franklin County,
Massachusetts (42°27'15"N, 72°28'27"W), and Cape Cod National Seashore and Wellfleet Bay
Wildlife Sanctuary in Barnstable County, Massachusetts (41°53'0"N, 69°59'47"W). The

23
Pennsylvania (PA) site is composed of four major microhabitat types: a shrubby marsh area
adjacent to a small road, a secondary-growth ash grove, a honeysuckle thicket, and a shrubby
field managed for turkey hunting. I collected data at the PA site from 2009-2011. The western
Massachusetts (WMA) site is a 50-m wide power-cut managed by the power company to keep
the canopy low. Within the wet, rocky cut there are numerous clumps of mountain laurel and
alder shrubs, as well as dense groundcover consisting primarily of grape, blackberry, and
raspberry vines, ferns, and grasses. On either side of the corridor are tracts of mixed hardwood
forest with little understory. Common yellowthroats are found linearly in the cut and forest
edge only. There is some variation in vegetation across the cut, but the biggest source of
variation is elevation. The steep grade of this site creates variation in vegetation-independent
acoustic transmission properties, with increases in transmission distance at peaks. I collected
data at the WMA site from 2009-2010. The Cape Cod, Massachusetts (CCMA) site is located on
the marshes and tidal estuaries of Wellfleet and Truro, MA, where clumps of trees and shrubs
grow in the wetlands. I collected data from the CCMA site in 2011.
Recordings and song measurements
In the early spring (May through early June) I recorded common yellowthroats for 10-
minute sessions from the dawn chorus until 11:00 am. I used a Sennheiser ME66 shotgun
microphone and a M-Audio MicroTrack II Portable Digital Recorder, at a sampling rate of 44.1
kHz.
Common yellowthroats have two song types, the flight song and the perch song (Guzy
and Ritchison 1999). The flight song is sung infrequently during the early season, and therefore
is not an available cue for migrating or newly arrived, locally breeding birds. Each individual has
a repertoire of one perch song. A perch song consists of a repeated phrase, which contains two
to six notes (Figure 6). Individuals can be distinguished by the acoustic properties of the phrase,

24
because phrase structure is consistent among the songs of an individual, but highly variable
among birds (Borror 1967).
Using Raven Pro, I measured several characteristics of the first distinct phrase of each
song, skipping the typically lower-amplitude introductory notes. I defined the beginning of a
phrase as the note with the lowest beginning frequency and the end of the phrase as the end of
the last note. I measured the first phrase of all good quality songs recorded, averaging the
values for each individual (n = 2992 phrases from 37 individuals, with a mean of 81 phrases
measured per individual). I measured maximal and minimal frequency (at 1024 FFT or 47 Hz
precision) and used the values to calculate bandwidth. I also measured phrase duration (at 128
FFT or 1.3 ms precision).
I approximated song performance in two ways, consistency and bandwidth over phrase
duration. To calculate an individual’s ability to consistently sing a phrase across song renditions,
I first used Raven to calculate spectrogram cross-correlations for all pairwise combinations of
phrases measured for a bird (i.e. first full-amplitude phrase), after standardizing amplitude and
filtering out everything below 1500 Hz and above 9000 Hz. Then I averaged the cross-correlation
values from each individual. The bandwidth over phrase duration calculation demonstrates how
quickly the bird is able to modulate its song across that bandwidth. Birds with larger values sing
a broader bandwidth over a short period of time, which should be more difficult to sing than a
song with a narrow bandwidth over a longer amount of time. Phrases with short phrase
durations but narrow bandwidths or long phrases and broader bandwidths have intermediate
values in this metric.
Morphology measurements
I captured, banded, and color-banded each recorded bird, then determined its age as a
first-time breeder (second year, or SY) or experienced breeder (after-second-year, or ASY) using

25
Pyle (1997). I also measured bill length (mm), and bird mass (g). To quantify plumage
ornamentation (fitness proxies), I measured the black mask area and scored the extent of the
yellow bib of each male.
To make standardized measurements of black mask area (cm2), I photographed the right
side of each bird as the bird was held against a grid background. Images were standardized using
the following procedure: 1) I attached the grid perpendicular to a small table; 2) I held the bird
with its right cheek facing the camera and slipped its bill inside a paperclip loop that was
secured to a particular location on the grid; and 3) I took the picture with the camera on a small
tripod that kept the camera at a consistent height and angle relative to the bird. I measured the
area in ImageJ. Specifically, I calibrated the photo by using the “set scale” function with the
known grid width, cropped the image to the bird’s head, transformed it to a binary image, and
measured the black area using the “analyze particles” function. I did not have high-quality
images for four of the 37 birds, so I assigned the sample mean to those individuals.
Although a mask is not completely flat, it is sufficiently two-dimensional to justify
assessing it with a two-dimensional measurement. The yellow bib, however, is decidedly three-
dimensional and therefore not amenable to area measurements from a two-dimensional image.
Instead, to quantify bib size(amount of yellow body feathers on the bird’s chin, throat, and
abdomen),I created a scale of 1-6 (including half numbers for intermediate values) by drawing a
reference diagram indicating the location of the border of each number on the scale on the
bird’s body. For example, birds with yellow only on their chin were scored “1”, and birds with
yellow extending across their whole lower body (from below the bill down the chin , throat,
abdomen, to the undertail region)were scored “6” (see Figure 7).

26
Habitat plots
For each recorded bird, I measured habitat in an 11.3 m radius circular plot centered on
the bird’s most frequently used song perch. For many birds (especially at the PA and CCMA
sites), singing territories were so small that additional non-overlapping plots would not fit within
the territories. Of habitat variables, vertical structure/stem density and canopy cover affect
sound transmission the most. Therefore, I measured the number of trees in different size
classes, number of shrubs, canopy cover, and canopy height (methods in James and Shugart
1970).
Statistics
Global assessment hypothesis
To test the global assessment hypothesis that song characteristics predict bird size and
habitat structure across all sites, I pooled data from all sites and years (n =37 birds). Some birds
were sampled over multiple years; only their first year’s data were used in this analysis, as songs
and territories did not typically change among years (only 2 individuals changed territories once
each within a site).I performed a canonical ordination (redundancy analysis, or RDA). Bandwidth,
minimal frequency, and phrase duration were the predictor variables. Even though minimal
frequency is used to compute bandwidth, the two measures were not correlated (r = -0.145, df =
35, p = 0.39). The response variables included two uncorrelated size variables derived using PCA,
as bill length, wing length, and mass were correlated (Table 5). I also included the following
habitat response variables in the model: number of shrubs and a tree variable derived from a
PCA of number of trees, percent canopy cover, and mean canopy height (Table 6). The
distributions of number of trees, number of shrubs, and mean canopy height were right-skewed,
so I square-root transformed these variables. Lastly, I column-standardized (z-score) all variables

27
– bird size, habitat, and song– to control for differences in measurement units. To test for
model significance, I used the “anova” function on the rda output (vegan package).
In the next set of global models I tested the hypothesis that song performance predicts
the quality of the singing bird, using mask area and yellow bib scores as proxies for male quality.
To test the relationship between song and plumage ornaments, I performed two multiple linear
regressions, one with black mask area and the other with yellow-bib score as the response
variable. Bandwidth over phrase duration and performance consistency were the predictor
variables in both models. All variables were column-standardized (z-score), to control for units.
For each regression I calculated a p-value for the full model, using the null hypothesis that the
slopes of all predictor variables were 0.
To explore the factors that could influence the global relationship (or lack thereof), I
compared song, habitat, and bird characteristics of the three sites (nPA = 15, nWMA = 17, nCCMA =
5), I performed three MANOVAs, all with site as the categorical independent variable and with
the following dependent variables: 1) song characteristics: phrase duration, minimal frequency,
and bandwidth, bandwidth over phrase duration, and consistency as the dependent variable, 2)
habitat characteristics: the PC1 of trees and number of shrubs, and 3) bird characteristics: PC1
and PC2 describing bird size, black mask area, and yellow bib score.
Local-dynamics assessment hypothesis
To explore the hypothesis that useful information is available to migrants able to assess
differences in song structure or performance of singing birds within a site, I tested whether song
variation predicts habitat or bird variation in the PA birds (n = 15)and WMA birds (n = 17)
separately. I did not test relationships within the CCMA site because the sample size was too
small (n = 5).

28
In order to support the local dynamics hypothesis, the song characteristics that predict
habitat structure or quality must be the same between the two sites. Even if some song
characteristics are predictive of habitat within a site, if one song characteristic (e.g., minimal
frequency) is predictive of habitat at one site, and another (e.g., performance consistency) is
predictive of habitat at the other, then a migrant bird would not be able to have a consistent
rule for evaluating relative song performance among individuals at unfamiliar sites.
PA site
To test if song predicts habitat structure, bird size, and bird quality at the PA site, I used
the same variables and models that I used in the pooled RDA on the PA birds only.
The habitat variables in the models account for differences in habitat among the song
perches of singing males, but linear analysis of these variables may not reveal differences in
songs between habitat types. Therefore, I also compared the song variables of PA birds among
the four microhabitats (ash grove, marsh, shrubs at the bottom of field, honeysuckle thicket)
using MANOVAs. To improve the sample size in this comparison, all birds whose songs I
recorded were included in this analysis, even birds that were not captured and banded (n = 24).
These birds were identified as unique individuals by their song, but there were no corresponding
morphological measurements. I also compared the bird quality variables (black mask area and
yellow bib score) among the microhabitats using a MANOVA. As an additional bird quality
assessment, I computed the percentage of birds in the two age classes (SY, or first-year breeders
an ASY, or experienced breeders) in each of the microhabitats.
WMA site
I used the same models as used in the PA-only tests, except the WMA site did not have
distinct microhabitats within the power-cut. It did have steep and varying topography. In the
valley territories, signal transmission should be poorer due to reverberation against the steep

29
slopes of the valley. Therefore I tested whether there was a relationship between topography
and song by comparing song variables in peaks, slopes, and valleys using MANOVA. To assess
differences in habitat quality among peaks, slopes, and valleys, I used MANOVA to compare
plumage ornamentation and determined age class distributions among topographies.
Results
Global assessment hypothesis
There was no support for the global assessment hypothesis. Overall, song characteristics
did not predict habitat structure or bird size (F = 0.96, df = 3,33, p = 0.49). Similarly, song
performance did not predict male quality as represented by black mask area (df = 2, 34, p =
0.52) or yellow bib score (df = 2, 34, p = 0.518).
Song characteristics did not differ significantly among the three sites (F = 0.843, df = 2,
34, p = 0.59; Table 7). In contrast, habitat structure did differ among the sites (F = 7.62, df= 2,
34, p < 0.0001). The habitat plots at the most commonly used song perches at the WMA site had
fewer shrubs than did those at the PA and CCMA sites (Figure 8). Birds at different sites also
differed in size and plumage (F = 5.06, df = 2, 34, p < 0.0001). Overall, males in CCMA were
larger and more ornamented than PA or WMA birds. Specifically, CCMA birds had longer wings
than PA or WMA birds. PA birds weighed the least. Black mask area and yellow bib scores varied
longitudinally; the CCMA males had the largest black masks and the most extensive yellow bibs.
Local dynamics assessment hypothesis
There was also no support for the local dynamics assessment hypothesis. Although
songs varied among habitat types and topographies within the PA and WMA sites, relative
differences in song performance did not consistently correlate with habitat quality gradients. At
the PA site, song structure did not predict habitat and bird size characteristics (F = 1.19, df = 3,

30
11, p = 0.37). Song performance did not predict black mask area (df = 2, 12, p = 0.18) or yellow
bib score (df = 2, 12, p =0.52).
Birds did sing differently among the microhabitats at the PA site (F = 2.20, df = 3, 17, p =
0.02; Table 8). Specifically, birds in more open, wetter habitats sang with higher performance
and higher minimal frequencies than birds in more closed, drier habitats (Figure 9). In the
marsh, birds had the highest performance consistency. In the shrubs at the bottom of the field,
birds sang with high performance consistency and the highest bandwidth over phrase duration.
In the honeysuckle thicket, birds sang songs with intermediate values in all variables. In the ash
grove, the habitat with the densest vegetation, birds had the worst performance, singing with
the least performance consistency and the lowest bandwidth over phrase duration, and also
sang with the lowest minimal frequencies.
The differences in song performance among microhabitats were not mirrored by
differences in measures of bird quality, except for age. Birds in more open, wetter habitats did
not have significantly larger mask areas or yellow bibs. However, birds in open habits tended to
be older; only 17% of the first-time breeding birds (SY, n = 6) were found in open habitats,
compared to 42% of experienced breeders (ASY, n = 12).
At the WMA site, there was not a linear relationship between song, habitat, and
morphology (F = 0.612, df = 3, 13, p = 0.73) Birds did not sing differently among peaks, slopes, or
valleys at the WMA site (F = 1.185, df = 2, 14, p = 0.35; Table 9). Although the model was not
significant, there was a trend that males with territories on peaks sang the broadest bandwidths
over phrase durations compared to birds singing on slopes and in valleys (Figure 10a).
Although song was not associated with topography, plumage was. Plumage
ornamentation differed among territories with different topographies (F = 4.097, df = 2, 14, p =
0.01; Figure 10b-c).Individuals in valleys had larger mask areas than birds on slopes or peaks,

31
and had larger yellow bibs. Age was also related to topography. Although older birds were found
in all areas (n = 4 on peaks, n = 6 on slopes, n =3 in valleys), one hundred percent of
inexperienced breeding birds (SY, n = 3) had territories on slopes.
Discussion
It would be difficult for a migrant common yellowthroat to gain information about
variation in habitat structure or quality within a stopover site by attending to the song variation
of locally breeding birds. Relationships between signal variation and characteristics of the
environment can only be considered cues if the information is available for the recipients of
social information to use (Fletcher and Sieving 2010). For migrating birds, such information will
be available only if there are consistent, widespread rules that predict a song’s relationship to
habitat structure or quality. However, I found little evidence of such consistent rules, and
therefore little evidence supporting the global assessment hypothesis.
The data also did not support the local dynamics assessment hypothesis. Although I
found evidence of a relationship between song performance and microhabitat type at the PA
site and topography at the WMA site, these relationships were not consistent between sites.
High-performance songs predicted high-quality habitat at the PA site, but they predicted low-
quality habitat at the WMA site (relative habitat quality among microhabitats and topography
types was suggested by the age and ornamentation of males occupying them). Therefore song
performance differences could not be a cue for a migrant naïve to a site’s unique population
dynamics. For example, birds migrating north for the first time likely have experience only with
the songs of their natal area, and not with those encountered at stopover sites. Even more
experienced migrants typically do not use the same migratory routes across years (Berthold
2001), so their knowledge of site-specific song variation may also be patchy.

32
Although the relationship between performance measures and bird and habitat quality
was not consistent between the PA and WMA sites, there was a consistent relationship between
song performance and expected sound transmission properties of the varying microhabitats and
topographies. Birds had the lowest performance (bandwidth over phrase duration) in the ash
grove at the PA site and in the valleys at the WMA site. The ash grove is the most structurally
dense (closed) of the microhabitats, so attenuation and reverberation of transmitted sounds is
probably high, likely affecting migrant perception of song consistency. In WMA, attenuation and
reverberation are likely highest in the territories in valleys, where steep slopes block the long-
distance transmission of sounds (personal observation). Thus, in both PA and WMA, birds with
the lowest song performance occupied high-reverberation territories. Singing birds in these
territories may have adjusted both the bandwidths and the phrase duration of their songs to
reduce attenuation and reverberation in their territory.
Are common yellowthroats capable of modifying their songs for optimal transmission?
Common yellowthroats do not change their songs from year to year (Borror 1967), but they do
crystallize their songs post-dispersal (unpublished data, RTB) and do not often change territories
between years. As Hansen (1979) hypothesized, young birds may have learned the song with the
best transmission properties for their territory by selecting for imitation the nearby song that
was least distorted. Perhaps these young birds were able to optimize transmission further by
subtly changing the frequency and timing parameters of the tutor song in different renditions
during their practice phase, and then gauging the response of neighbors and mates. Many birds
at each site shared the same song types (unique arrangement of notes), which differed in their
frequencies and/or timing.

33
If common yellowthroats can modify their songs to optimize transmission, why was song
structure so similar among the three sites, even though their habitats are so different? One
reason may be that other factors may affect the evolution of birdsong form more than those
related to the physics of sound production and transmission. For example, song structure may
be more influenced by its effectiveness in communicating group membership (e.g., local
adaptation hypothesis or social adaptation hypothesis, see Beecher and Brenowitz 2006, Podos
and Warren 2007) than by its effectiveness in communicating male size or quality.
In conclusion, migrant common yellowthroats may not be able to use song variation at
the within-site scale to evaluate habitat. Other scales that may still be relevant to migrant birds
for movement decisions include the continental, landscape, and within-territory scales.
Specifically, broad geographic patterns in songs may provide evidence that a migrating bird is in
the vicinity of its breeding grounds, or how far it still has to travel. (see Ch 1). Within a
landscape, the presence of conspecific song in preferred habitat patches may act as a habitat
cue at all stages of migration, including stopover (e.g., Mukhin et al . 2008, Alessi et al. 2010)
and breeding-site selection (e.g., Hahn and Silverman 2006). The variation in bird densities
among adjacent patches in a landscape may cue birds to differences among patches in habitat
quality (Cody 1981, Fletcher 2007), or a migrant could compare the average song performances
of birds among patches. Within a territory, migrants could eavesdrop on the location, rate, or
duration of songs to evaluate fine-scale habitat differences and locate food or shelter (see Ch 3),
or to avoid aggressive interactions with locally breeding territorial birds (see Ch 4). At each of
these scales, the variation in birdsong potentially may provide important cues.

34
CHAPTER 3
THE ROLE OF SOCIAL CUES FOR MIGRATING BIRDS: COMMON YELLOWTHROAT SONG
VARIATION MAY CONTAIN CUES ABOUT MICROHABITAT AND THE LOCATION OF FOOD
Abstract
Birdsong varies temporally according to context. Even birds that sing a single song type-
such as the common yellowthroat-may vary their singing rate, song duration, and singing
location. This variation may communicate information to receivers or eavesdroppers, including
information about habitat quality and food availability in the signaler’s territory. These cues
could be beneficial to migrants trying to efficiently locate habitat and food when exploring
unfamiliar stopover sites. To determine if cues are encoded in song variation, I recorded the
songs of common yellowthroat males in 2009 -2011 at three sites in the northeastern United
States. For each bird, I measured habitat at the site of its most commonly used song perch, and
at another randomly selected, non-overlapping plot on the site for comparison. For each
recorded song sample, I sampled the arthropods in the shrubs at the location where the bird
spent the most time during the recording, and then immediately sampled another random
location. I also noted whether or not the singing bird was foraging during the song bout, and
whether or not it interacted with a conspecific. Preferred song perches were located in areas
that had fewer trees and denser shrubs. Birds also tended to sing in locations that had higher
arthropod densities, indicating that the location of the singing bird could provide migrants with
important cues about the location of preferred microhabitat and food.
Introduction
Mortality is higher during bird migration than any other life-history stage (Sillett and
Holmes 2002, Newton 2006) and the decisions that migrants make are imperative for their

35
survival. Decisions at a stopover site may be especially important, because migrant birds spend
more time and energy at stopover sites than migrating between them (Wilkelski et al 2003).
Migrants must repeatedly explore unfamiliar stopover habitats to find the food and shelter they
need to survive migration (Mettke-Hoffman and Greenberg 2005), and should be able to explore
more efficiently by attending to local social cues (Danchin et al. 2004, Németh and Moore 2007).
Some of these cues may provide information at the landscape scale, allowing migrant birds to
use social cues when choosing among habitat patches (Herremans 1990, Mukhin et al. 2008,
Alessi et al. 2010). Another scale at which social cues may be important to a migrant bird is the
within-territory scale. The location of a singing local bird within its territory may provide
important information about variation in microhabitat structure and food availability.
Birdsong, a long-distance signal, is the most readily available social cue to a bird
exploring across a habitat patch. However, one function of birdsong is to signal territoriality
(Kroodsma and Byers 1991, Marler and Slabbekoorn 2004). Therefore, even if singing by a local
male indicates the location of the best habitat containing the most food, a migrant may not be
able to use it if the local male perceives the migrant as an intruder (Fletcher 2007). Any
additional information about the local male’s within-territory movements or motivational state
may inform the eavesdropping migrant about whether it is possible to forage on a local male’s
territory or whether it should avoid an energetically costly aggressive encounter.
In the context of breeding, birdsong can be rich in cues, and migrants could benefit from
using more information than just the presence of singing males when locating habitat patches. If
the location of singing males or the variation in their song is related to food or shelter, birdsong
could aid migrants’ movement and foraging decisions. Using common yellowthroats (Geothlypis
trichas) as a case study, I here explore the singing behaviors of territorial males during the
period when conspecifics are migrating to their more-northern breeding grounds. I analyzed the

36
location of singing birds, song rate, and song duration to determine whether they could be
informative cues to migrating birds that may stop over for a short time and are primarily
concerned with survival.
Methods
Common yellowthroats are insectivorous warblers (Family: Parulidae) that often breed
in wet, shrubby habitats (Guzy and Ritchison 1999). In the early breeding season, males sing a
loud “perch song” to establish territories and attract mates (Borror 1967). This perch song
consists of a series of repeated “phrases”, or a unit of two to six “notes,” which are defined as
the individual units separated by silence (See Borror 1967 for origin of nomenclature). Song
duration varies among renditions as the bird varies the number of notes within its song (Figure
11).
I studied three populations of common yellowthroats, one on private lands in
Lackawanna County, Pennsylvania (41°33'51"N, 75°43'15"W), another on a power-cut in
Franklin County, Massachusetts (42°27'15"N, 72°28'27"W), and the last at Cape Cod National
Seashore and Wellfleet Bay Wildlife Sanctuary in Barnstable County, Massachusetts (41°53'0"N,
69°59'47"W). I recorded males, measured habitat, and sampled arthropods for the first three
weeks of May of 2009-2010 and the last week of May in 2011 at the Pennsylvania site (PA), for
the last week of May and the first few weeks of June of 2009 and 2010 at the western
Massachusetts site in Franklin County (WMA), and for the first three weeks of May in 2011 at
the Cape Cod, Massachusetts site (CCMA).
The habitat was quite different at the three sites. The PA site consisted of several
microhabitat types: a thicket of dense honeysuckle bushes interspersed with occasional single
deciduous trees, a small shrubby marsh area with a small stream bordered by deciduous forest
on one side and old-growth hemlock forest on the other, an early-successional ash grove, an

37
area at the bottom of a fallow field managed for turkey hunting, and a lakeside forest-edge
wetland. The WMA site was a 50-m wide power-cut right of way actively managed by the power
company to remain treeless. It was commonly used by outdoor recreationists, especially ATVs,
which maintain a high level of disturbance. A stream ran across the lowest elevation of the site,
and much of the higher elevations were wet and covered by mountain laurel, grapes,
blueberries, raspberries, and ferns. The power-cut was surrounded by mixed forest, so the
habitat was quite dichotomous. Common yellowthroats used the shrubby power-cut itself and
the forest edges, but their singing territories did not extend far into the forest itself, which had a
sparse understory. Yellowthroat territories in this habitat were therefore arranged linearly. The
CCMA site included three patches: one at Wellfleet Bay Wildlife Sanctuary, where two
individuals lived at the edge of a marsh abutting Wellfleet Bay, and the other seven in inland
estuaries in Cape Cod National Seashore. Dominant plants at the Cape Cod site included pitch
pines and oaks, winterberries, beach plums, and blackberries.
I recorded as many common yellowthroats as possible each morning, starting when
birds began to sing during the dawn chorus and ending by 11:00 am (n = 162 10-minute samples
from 75 individuals, nPA = 82 samples from 28 individuals, nWMA = 71 samples from 30 individuals,
nCCMA = 9 samples from 9 individuals). I started at different locations on the site each day,
ensuring that birds recorded multiple times were recorded at different times of the morning. I
recorded songs for 10-minute sessions using a Sennheiser ME 66 shotgun microphone and an
M-Audio Micro-track II digital recorder, at a sampling rate of 44.1 Hz. I recorded uninterrupted
for the full ten minutes. I did not record song on rainy or freezing mornings, as birds did not sing
until much later in the day under those conditions. Therefore, most song samples were taken
on good weather days, which is also when pulses of migrant were more likely to arrive, so this
sampling bias should have little impact on the understanding of available cues for migrants.

38
Using Raven 1.4, I examined spectrograms to calculate song rate (the number of songs
produced per minute) by counting the total number of songs per sample and then dividing by 10
minutes. I also measured duration of the songs (s) from spectrograms calculated at 128 Fast
fourier transform (precision = 1.3 msec) to calculate average song duration.
To determine if males have microhabitat singing preferences, in 2009 and 2010 I
measured two circular habitat plots of 11.3 m radius per bird, one at the location of the bird’s
most commonly used song perch and the other at a randomly selected location in the study area
(2009: nbird = 30, nrandom = 30, 2010: nbird = 25, nrandom = 25) . The randomly located plot was
selected using an online random point generator (www.geomidpoint.com/random/), where
points were selected within a specified polygon (i.e. the study area). If randomly selected plots
overlapped a previously selected bird or random plot, it was not used and a different random
location was generated. No CCMA birds were included in this analysis as they were not sampled
in 2009 and 2010.
For each point, I used the James and Shugart (1970) method to quantify vegetation in an
11.3 m radius plot. To estimate vertical structure (i.e. whether a plot was open or dense in
shrubs and/or trees), I counted all of the trees in each plot in each of five size bins (DBH classes
in 7.6 cm increments) and estimated woody shrub density by counting the number of shrub
stems along north/south transects of the plots. I also calculated canopy cover (%) and ground
cover (%) using a tubular densitometer. Lastly, I measured canopy height by measuring the
distance (m) and angle to crown (°) of the three tallest trees in the plot and averaging their
heights.
All statistics were performed using R 2.15.2. I tested whether song perches indicate
microhabitat preferences (therefore providing information about microhabitat differences to
receivers and eavesdroppers) using the Classification and Regression Trees procedure (CART,

39
De’ath and Fabricius 2000) to compare the habitat plots at the locations of birds’ most
commonly used song perches (one plot per bird) to the randomly selected habitat plots. The
CART algorithm partitioned the observations (i.e. plots) repeatedly, using each variable to
optimally split the observations into groups with similar values using the information criterion.
Once the observations were grouped into the terminal nodes of the tree, each node was
classified as a bird or random plot depending on whether more bird or random plots were
included in that node. Trees of varying size (i.e. number of terminal nodes) were compared
using the v-fold cross validation technique, the tree size that maximized node purity was
selected, and the additional, overly fit branches were pruned. A correct classification rate (CCR,
% of plots correctly classified as bird or random plots) and Cohen’s kappa (percent correct
classification compared to random group assignment) were calculated for the tree. I used a
Monte Carlo procedure to test for a significant difference between the tree and randomized
trees (monte.cart function from cartware.R, available at www.umass.edu/ opensource/schweik/
documents/cartware.R). A combination of high CCR, high Cohen’s kappa, and significant
difference between the tree and randomized trees (p < 0.05) indicates that the difference
between the two groups is significant. Plots were non-overlapping within years, but not
between years, so I analyzed 2009 and 2010 separately.
After each song recording, I sampled arthropods using the beating-sheet method
(hitting a shrub 10 times with a stick over a plastic collecting board) on the shrub closest to the
singing location of the bird (nbird =162 samples). I counted the number of arthropods per order.
Immediately after sampling at the bird location, I sampled again at a random location (nrandom =
162 samples), which I determined in the field using a stopwatch. Specifically, I stopped and
started a stopwatch without looking three times to randomly select a compass direction
(subtracting 360 degrees until the direction was between 0-360 degrees if the random number

40
was greater than 360 degrees), and then stopped and started the stopwatch again two more
times to determine the number of steps to take in that compass direction (0-99 steps). To
compare food abundance at sites where birds are singing compared to food availability across
the site, I compared total arthropods sampled at bird versus random plots with a student’s t-
test. I also compared arthropod communities (classified to order, norders = 16, nsamples = 324) in
bird and randomly selected plots using CART.
For each recording, I noted whether the bird was foraging during the recording. Song
bouts were defined as “bouts with foraging” if the bird ate a prey item at least once during the
10-minute song sampling period. If the bird was out of sight during part of the 10-minute
sample and no foraging was observed, the sample was categorized as “unknown if foraging” and
dropped from the model (58/162 dropped). To test whether foraging during a bout affected
song rate or duration, I used a mixed-model linear regression (lmer in lme4 package). In the
song rate model, song rate was the independent variable, foraging was the fixed effect, and
individual was the random effect. In the song duration model, song duration was the
independent variable and the same predictors as the song rate model were used. To test models
for significance, I used a likelihood ratio test by running an ANOVA between the full model and
the null model (minus foraging).
To test whether participating in interactive behaviors during the bout affected song rate
or duration, I categorized bouts into one of the following interaction types: spontaneous
singing, distant singing, close singing, soft singing or fighting/chasing during the recorded song
bouts (females were cryptic and were not observed consistently enough to evaluate male-
female interactions directly). The terms and definitions of “spontaneous singing,” “distant
singing,” and “close singing” originate from Ritchison (1995). Specifically, “spontaneous singing”
occurs when males sing without interacting with other birds. “Distant singing” refers to songs

41
that are produced in response to neighbors that are singing from non-adjacent territories; males
alternate singing in a regular rhythm during these interactions. Bouts were considered “distant
singing” if birds were singing in response to the singing of non-adjacent neighbors at least once
during the bout (although most bouts contained longer periods of interaction than just one
song). “Close singing” bouts included songs produced in response to males singing on
neighboring territories. “Soft songs” are low-amplitude songs that are good predictors of attack
in similar species (e.g., Hof and Hazlett 2010), and is the same as Ritchison’s (1995) “low
volume” songs. “Soft-singing” bouts included at least one instance of soft song. I used mixed
model-fixed effect linear regressions for these models as well, with song rate and duration as
the independent variable in each of the two models, and interaction type as the fixed effect and
individual as the random effect in both models. I used a likelihood ratio test, comparing models
with and without the interaction type using an ANOVA.
Results
In both 2009 and 2010, habitat plots that contained birds’ most commonly used song
perches differed from random plots (2009: Correct classification rate = 88%, Kappa = 0.77, p <
0.002; 2010: CCR = 82%, Kappa = 0.64, p < 0.003). In 2009, bird plots had lower canopy heights,
more shrubs, less canopy cover, fewer trees with 7.6- 15.2 cm DBH, and larger proportions of
snags (Figure 12). In 2010, bird plots were characterized by less canopy cover and more shrubs
(Figure 13).
There were more arthropods in the shrubs nearest bird’s most commonly used song
perches than shrubs found randomly across the site (t = 2.02, df = 1, 322, p = 0.044, Figure 14).
Additionally, the CART for arthropod communities produced a tree that was significantly
different than random trees, but the CCR and Cohen’s kappa were fairly low, suggesting that the

42
arthropod communities at bird and random locations were similar (CCR = 57%, Kappa = 0.13, p <
0.03).
Foraging while singing was not related to song rate (χ2= 0.361, df = 1, p = 0.548) or
duration (χ2= 0.418, df = 1, p = 0.518). The intensity of interaction were also not related to song
rates (χ2= 2.85, df = 1, p = 0.091), although song rates were lower when males were also fighting
during the bout (Figure 15). However, the intensity of interaction did relate to song duration (χ2=
5.61, df = 1, p = 0.018). Specifically, bouts had songs with the longest duration when birds were
distant singing, intermediate duration when spontaneously singing, close singing, and soft
singing, and shortest duration when fighting (Figure 16).
Discussion
Theoretically, social cues from birdsong could allow eavesdropping migrant common
yellowthroats to efficiently find species-preferred microhabitat and abundant food by attending
to the location of locally breeding males. Migrants should benefit by using the same locations as
these local males. At these birds’ preferred singing locations, the shrubs are denser, which could
provide migrants with better shelter for resting and avoiding predators (Petit 2000) and more
foraging substrate. There is also more abundant food, which would allow migrants to replenish
their fat stores more quickly and better maintain their condition, ultimately affecting their
chance of surviving migration and increasing their fitness (Sandberg and Moore 1996, Smith and
Moore 2003). The presence of loud, long-distance cues at superior locations could benefit
migrants by decreasing their search time when exploring new habitats, a benefit that might be
even greater after energetically costly stages of migration, such as nonstop flights over large
ecological barriers (e.g. Gulf of Mexico, Saharan Desert, etc.).
Common yellowthroat males had similar song rates whether they were foraging or not.
Even though it is physically impossible for a bird to eat an arthropod and sing at the same time,

43
yellowthroats are good at quickly alternating between these behaviors (pers. obsv.). As locally
breeding birds are often simultaneously singing and foraging, migrants could locate local males
by listening for their song, determine if they are foraging using visual cues, and then watch
foraging behaviors to pinpoint food resources in the trees and bushes around a song perch.
The singing and foraging locations of locally breeding males could be useful information
for exploring migrants. However, during the early spring when migrants are stopping over,
locally breeding males are actively patrolling their territories to exclude intruding locally
breeding males. Common yellowthroats are especially aggressive toward non-neighboring
intruders, attacking them not only in the center of their territories, but on the edges where
neighbors are allowed to approach if they are familiar to the incumbent (Wunderle 1978).
Therefore, local males may treat migrant males as potential rivals, and indeed they may be
rivals, as migrants sometimes copulate en route (Quay 1985), possibly with local females. The
offspring of unknown paternity that are often discovered in genetic studies of paternities (e.g.,
Pedersen et al. 2006) may have migrant fathers. However, female migrants are probably less
likely to elicit an aggressive response from local males. Therefore, I predict that some within-
patch social cues that repel males may attract females (see Ch 4). Additionally, females may
benefit more from attending to foraging cues, as it is especially important for females to
maintain their condition during migration, as their condition upon arrival at the breeding
grounds can impact reproductive success (Sandberg and Moore 1996, Smith and Moore 2003).
If song contained information about the breeding male’s current aggressive behaviors,
an eavesdropping male may be able to evaluate whether trespassing is advisable. The
interaction types varied in interaction intensity (Ritchison 1995). Spontaneous singing occurring
when no receivers were detected (no male-male interaction, female interaction was unknown).
Although more interactive than spontaneous singing, distant singing with non-adjacent males is

44
less interactive than close singing, which occasionally escalates to fights during the early
breeding season when males are negotiating territory borders. Even more aggressive than
distant or close singing, soft singing is more predictive of subsequent attacks than regular
volume song for some species. The most aggressive of all of these behaviors is fighting. Although
not significant, median song rates decreased during more aggressive interactions. Song rate was
lowest when males were fighting, as fighting birds are busy flying, chasing, and pecking, and are
only singing between fights. Eavesdropping migrants’ intrusions may be tolerated more when
local males’ song rates are highest and cues are the most available. Additionally, migrants that
do not wish to become involved in confrontation may be better able to avoid singing males
within their territory when song rates are highest, as their location is being advertised.
Song duration was longer in interactions that occurred over longer distances, and
shortest during fights. Ritchison (1995) found that common yellowthroat songs were longest
during the egg-laying period, which occurs after pairing and after territorial boundaries have
been established. Given this evidence, shorter songs appear more indicative of current
aggression. Migrants may be better able to intrude on the territories of males singing longer
songs at higher rates.
In summary, the location, rate, and duration of common yellowthroat birdsong could
contain cues useful to eavesdropping migrants. Specifically, migrants could use singing males’
perch locations to locate preferred microhabitat and food. They could use also use song rate
and duration to assess the location and aggressiveness of local males. Knowledge about the
location of resources and the probable response of local males could inform the small-scale
foraging and movement decisions of migrants, which are critical for survival.

45
CHAPTER 4
EVIDENCE THAT MIGRATING COMMON YELLOWTHROATS AVOID SINGING CONSPECIFICS
DURING STOPOVER
Abstract
Migrating birds may be able to offset the costs of uncertainty at unfamiliar stopover
sites by assessing local social information. During spring migration, the songs of locally breeding
birds may be a source of such information, acting as cues for migrants that are searching the
landscape for suitable habitat patches and would benefit from a quick assessment of habitat
quality. I tested this hypothesis by broadcasting recordings of common yellowthroat song
recordings to determine if it attracts migrant common yellowthroats to habitat in the pre-dawn
darkness. I found migrants were not lured close enough to playback sites to be captured. To test
whether song affected migrants’ movements within a habitat patch, I compared the locations of
migrants captured in a passive mist-netting array to daily variation in the locations of singing
males. Migrants were farther away from singing males than expected by chance, which suggests
that migrants could be avoiding aggressive interactions with singing males. However, female
migrants were captured closer to singing males than male migrants. They were also more likely
to be captured near the territories of experienced breeders than inexperienced breeders,
suggesting that they were selecting higher quality habitat for stopping over, and were more-
likely to be permitted to intrude on the territories of locally breeding males.
Introduction
Over the course of many weeks, migratory birds follow the onset of spring by making a
series of flights to their breeding grounds, stopping over to rest and refuel at multiple unfamiliar
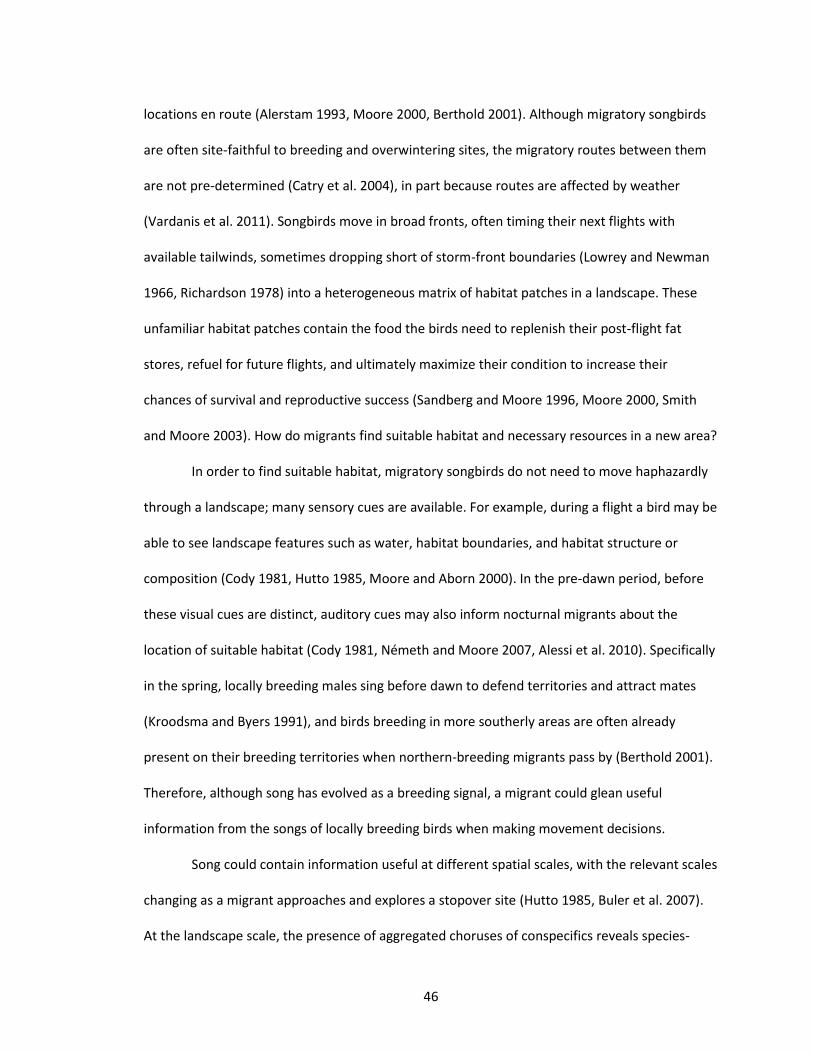
46
locations en route (Alerstam 1993, Moore 2000, Berthold 2001). Although migratory songbirds
are often site-faithful to breeding and overwintering sites, the migratory routes between them
are not pre-determined (Catry et al. 2004), in part because routes are affected by weather
(Vardanis et al. 2011). Songbirds move in broad fronts, often timing their next flights with
available tailwinds, sometimes dropping short of storm-front boundaries (Lowrey and Newman
1966, Richardson 1978) into a heterogeneous matrix of habitat patches in a landscape. These
unfamiliar habitat patches contain the food the birds need to replenish their post-flight fat
stores, refuel for future flights, and ultimately maximize their condition to increase their
chances of survival and reproductive success (Sandberg and Moore 1996, Moore 2000, Smith
and Moore 2003). How do migrants find suitable habitat and necessary resources in a new area?
In order to find suitable habitat, migratory songbirds do not need to move haphazardly
through a landscape; many sensory cues are available. For example, during a flight a bird may be
able to see landscape features such as water, habitat boundaries, and habitat structure or
composition (Cody 1981, Hutto 1985, Moore and Aborn 2000). In the pre-dawn period, before
these visual cues are distinct, auditory cues may also inform nocturnal migrants about the
location of suitable habitat (Cody 1981, Németh and Moore 2007, Alessi et al. 2010). Specifically
in the spring, locally breeding males sing before dawn to defend territories and attract mates
(Kroodsma and Byers 1991), and birds breeding in more southerly areas are often already
present on their breeding territories when northern-breeding migrants pass by (Berthold 2001).
Therefore, although song has evolved as a breeding signal, a migrant could glean useful
information from the songs of locally breeding birds when making movement decisions.
Song could contain information useful at different spatial scales, with the relevant scales
changing as a migrant approaches and explores a stopover site (Hutto 1985, Buler et al. 2007).
At the landscape scale, the presence of aggregated choruses of conspecifics reveals species-

47
preferred habitat patches (Fletcher and Sieving 2010). At the within-patch scale, variation
among locally breeding males’ songs may reflect differences in microhabitat sound transmission
properties (Morton 1975) and/or male quality (Gil and Gahr 2002), both of which may also
reflect differences in habitat quality. Therefore, song location and variation may help migrants
to quickly find a suitable habitat and then evaluate habitat quality and resource availability
within the patch. However, although song may induce migrants to move towards suitable
habitat patches at the landscape scale, they may avoid aggressive singing males within a habitat
patch. Therefore, song may both attract and repel migrants (Fletcher 2007).
If nocturnal migrants are attracted to conspecific song at the landscape scale, they
should approach pre-dawn song playback, even if it issues from unsuitable habitats. If, after
arriving in a habitat patch at a stopover site, migrants avoid aggressive singing males, migrants
should be found farther from singing males than expected by chance. Alternatively, if migrants
use song to locate resources within a habitat patch, they will be found closer to singing males
than expected by chance. I report tests of these predictions, which arise from the hypothesis
that the response of in-transit migrants to local song may differ at different scales.
Methods
Playback experiments
To test the hypothesis that nocturnal migrants approach singing males I ran two
playback experiments for two weeks in early May. I ran the first experiment in Lackawanna
Country, Pennsylvania (N 41.56°, W 75.72°) in 2010 and a second one in Wellfleet, Barnstable
County, Massachusetts (N 41.88°, W 70.00°) in 2011. In each experiment I used four mist-net
arrays, each composed of three 12-meter nets arranged in a triangle and connected at their
ends, ensuring that birds approaching from any direction were captured (modified from Mukhin
et al. 2008). In the center of each net triangle I placed a song playback apparatus, an iPod Nano

48
connected to a ChillPill speaker, which I used to broadcast song for two hours each morning. I
began playback at the time when local birds were beginning their dawn chorus, which at this
time of year was when the sky was just beginning to lighten at civil twilight, when migrants
perform exploratory morning flights (Bingman 1980, Moore and Aborn 2000).
The treatments, controls, and habitat types differed somewhat between the two
experiments due to modifications introduced in an effort to increase migrant response in the
second experiment. At the Pennsylvania site, net arrays were placed at least 50 m apart in an
ash grove (n = 2 arrays), mixed-hardwood forest edge (n = 1 array), and hemlock forest edge (n =
1 array), in all cases just outside of the territories of locally singing males. Each net array was
open for six days (the number of days with weather suitable for netting over the two-week
experimental period) or approximately 12 total hours per array. During a trial, I broadcast four
different stimuli simultaneously, one at each net array: 1) common yellowthroat song from
yellowthroats with large black masks, indicative of higher-quality males (high-quality conspecific
treatment); 2) common yellowthroat song from yellowthroats with small black masks, indicative
of lower-quality males (low-quality conspecific treatment); 3) eastern towhee song
(heterospecific control); and 4) pulsed white noise (negative control). Each day, stimuli were
randomly assigned to net arrays, so that treatment effects were not confounded by location. In
the Massachusetts experiment, nets were placed along the outer edges of a coastal heath. This
coastal heath was considered “unsuitable habitat,” and was not initially adjacent to the
territories of local males (~350 m from nearest territory). However, during the course of the
experiment, a young locally breeding male arrived and set up a territory in a clump of black
locust trees on the edge of the heath, about 15 m away from one array. Each net array was open
for eight days or approximately 20 total hours per array. The four treatments were: 1) common
yellowthroat song (conspecific treatment), 2) ovenbird song (heterospecific control), 3) pulsed

49
white noise (sound control), and 4) silence, where the iPod and speakers were connected and
turned on but not playing sound (control).
In both experiments, the acoustic stimuli in the treatments consisted of recordings
looped continuously for the duration of a trial. The common yellowthroat and ovenbird song
stimuli were built from short bouts of natural singing recorded in Pennsylvania and
Massachusetts, with background noise filtered-out, and with song rate and amplitude
standardized (4 songs/minute, 2000 RMS in Raven). Each common yellowthroat playback
exemplar was used in only a single trial, to avoid pseudoreplication (Kroodsma 1989b). The
eastern towhee song stimulus was an archived recording (Cornell Library of Natural Sounds)
from the northeastern United States, also filtered and standardized. I created the pulsed white
noise stimuli by using Raven to edit continuous white noise into pulses of the same rate and
duration of songs in the common yellowthroat playbacks.
All birds captured during trials were banded, aged, sexed, and assessed for
subcutaneous fat stores (Helms and Drury 1960). Common yellowthroats were also color-
banded prior to release. In this way I was able to differentiate migrant from locally breeding
common yellowthroats, as locally breeding birds were later observed defending territories, and
(in Pennsylvania) were captured subsequently in a passive mist-netting array that was
monitored throughout the breeding season. Assessing fat stores helped further support the
migrant/breeder classification, as local breeders typically had lower fat stores than the migrants.
For each experiment, I used ANOVA to test the effects of playback treatment, net
location, and the playback*net interaction on capture rate per net hour. I ran two versions of
each ANOVA, the first including only migrant common yellowthroats, and the second including
all birds captured.

50
Comparison of spatial distribution of migrants and locally breeding males
I explored the interactions of migrants and locally breeding birds by comparing the
spatial distributions of migrant and breeding common yellowthroats in a separate study at the
Pennsylvania site. In this analysis, I compared the locations at which individuals were initially
captured in a 15-net passive netting array from 2005-2010. Most of the nets were in shrubby
habitat dominated by honeysuckle and small ash trees. During the study period, the net array
captured 75 locally breeding (55 male [M], 20 female [F]) and 139 migrant (79 M, 60 F) common
yellowthroats.
Because net locations were defined by two variables (latitude and longitude), I used
MANOVA to make several comparisons of capture locations. I compared all migrants vs. all
locally breeding birds; experienced (after-second-year, or ASY) breeding birds vs. first-time
(second-year, or SY) breeding birds; male migrants vs. ASY breeding birds; male migrants vs. SY
breeding birds, female migrants vs. ASY breeding birds; and female migrants vs. SY breeding
birds. I analyzed males and females separately because male and female migrants are
hypothesized to have different priorities during migration (optimizing arrival timing vs.
maintaining condition, Sandberg and Moore 1996), and are also likely to be treated differently
by local aggressive males.
Analysis of whether the spatial distribution of migrants is related to song
In the early breeding season, there is a lot of temporal and individual variation in singing
rates. Common yellowthroat song rates diminish greatly when males are paired (Ritchison 1995)
but occasionally temporarily increase again, presumably in response to territorial challenges or
the influx of newly arrived breeding females or rivals. Individuals vary greatly in their seasonal
song rates; some males sing constantly regardless of their pairing status, whereas others will not
sing after pairing, instead mediating aggressive interactions with chatter calls and chips. This

51
variation means that at a particular breeding/stopover site, the song landscape changes daily
even though the habitat does not. Therefore we can test whether migrants respond to song
while controlling for the confounding fact that locally breeding males sing in suitable habitat
that migrants need.
I tested whether migrant birds were captured at the passive mist-netting station in
Pennsylvania closer or farther from a singing bird than expected by chance. The test compared
the observed mean of Euclidean distances between each migrant’s capture location and the
nearest male singing that day to the expected mean of migrant-singer distances generated in a
Monte Carlo simulation. The Monte Carlo simulation accounted for the spatial arrangement of
nets and daily variation in sampling effort among the nets (i.e., whether a net was open on a
given day and for how long). To determine the locations of singing males, I walked continuous
transects around the site between 7 May and 20 May for 10 days in 2010, noting the identity of
each locally breeding male that was singing that morning. Although males move around their
territories when singing, I used the location of a male’s most commonly used singing perch as
the recorded location for that bird, which I determined by observing males for 10-minute
singing bouts several times each during the season. I measured the latitude and longitude using
a Garmin eTrex Vista CX GPS.
I wrote the algorithm for the Monte Carlo simulation in R. For each migrant captured in
2010 (n = 16), the algorithm randomly selected the coordinates of one net location ,with
probability of selecting a location weighted by the number of hours (rounded to the nearest
0.25 hour) that each net was open on the day the migrant was captured. Next, the algorithm
calculated Euclidean distances between each random migrant location and the locations of each
male singing that day (1-6 singing males per day, mean 2.3). Third, the algorithm selected the
shortest of these distances. Next, I calculated the mean of the 16 shortest distances to a singing

52
male. Last, I ran this algorithm 10,000 times. For each simulation, I recorded whether the
expected mean was less than the actual mean. To calculate a p-value, I used the formula
(r+1)/(n+1), when r = number of times the expected mean was less than the actual mean, and n
= number of simulations (North et al. 2002).
I did not separate male (n =6) and female (n = 9) migrants in this simulation. However, I
did calculate the mean observed distances between capture location and the nearest singing
male for males and females.
Results
Playback experiments
I did not catch any migrant common yellowthroats during the playback experiments in
either 2010 or 2011.
Although I did not capture any migrant common yellowthroats, I did capture birds of
other species. At the Pennsylvania site (Figure 17a), I captured 22 birds from 9 species. Playback
treatment was significantly related to total captures (F = 4.4, df = 3, p = 0.036). More birds were
captured in nets with eastern towhee playback than with either the common yellowthroat or
pulsed white noise playbacks. Neither the net location (F = 2.59, df = 3, p = 0.12) nor the
interaction between treatment and location (F = 0.57, df = 8, p = 0.78) were significantly related
to total birds captured per hour.
At the Massachusetts site (Figure 17b), I caught 56 birds from 17 species including three
migrant species- wood thrush, blackpoll warbler, and northern parula. Capture rates did not
differ among treatments (F = 0.25, df = 3, p = 0.86) or locations (F = 2.1, df = 3, p = 0.17), and
there was no interaction between treatment or net location (F = 2.36, df = 3, p = 0.10).

53
Comparison of spatial distributions of migrants and locally breeding males
Both migrants and locally breeding birds were widespread at the study site (Figure 18).
Migrants and locally breeding birds had similar capture locations (F=1.34, df = 2, 211, p =0.27).
The different age classes of locally breeding males were partitioned within the site, however.
Experienced (after-second-year, or ASY in ornithological ageing nomenclature) and first-time
(second-year, or SY) breeding males occupied different parts of the site (F =3.16 , df =2, 62, p =
0.049), likely due to differences in habitat quality. Experienced males were found in the center
of the site, where honeysuckle shrubs were the thickest and the canopy was mostly open,
although some tall trees were present that males often used as singing perches. First-time
breeding males were more likely to be found along the periphery of the site, near edges
between open habitat and adjacent hemlock forest, ash grove, field, or road.
The distributions of male and female migrants differed. Male migrants were captured
throughout the site; their distribution overlapped with those of both experienced breeding
males (F =1.38, df =2, 117 p = 0.26) and first-time breeding males (F =1.17, df = 2, 100, p = 0.32).
In contrast, female migrants were rarely captured near first-time breeding males (F =5.44, df = 2,
81, p =0.006), although their distribution did overlap with the distribution of experienced
breeding males (F =2.99, df =2, 98, p =0.06).
Migrant locations’ relationship to singing bird locations
The distances between migrant common yellowthroats and the nearest local singing
male differed from the distances expected by chance (Figure 19, p = 0.004).The mean distance
between a migrant’s capture location and the nearest singing male was 53 ± 36 m, compared to
an expected mean of 28 ± 21 m. Males were captured 59 ± 44 m from the nearest singing male,
and females were captured 49 ± 30 m away.

54
Discussion
I found evidence that migratory common yellowthroats do consider the behavior of
locally breeding males when making movement decisions. I predicted that migrants are
attracted to song at the landscape scale and are repelled from aggressive males within a habitat
patch (Fletcher 2007). Contrary to the landscape-scale prediction, I did not capture any migrant
common yellowthroats in the experimental playback arrays. This result suggests that migrating
yellowthroats are not lured to habitat patches by singing males, although it is possible that
migrants were attracted to the broadcast song playback, but did not approach closely enough to
be captured. Although I did not find evidence that migrants were attracted to song at the
landscape scale, breeding and migrating common yellowthroats use the same habitat types
(Deppe and Rotenberry 2008), and the locations of migrants at the Pennsylvania site completely
overlapped with those of locally breeding birds. This finding indicates that migratory birds are
not repelled from singing males at the landscape scale.
At the within-patch scale, I found evidence supporting the prediction that migrants
avoid singing males. Migrants could be found farther away from singing males either because
they are actively avoiding aggressive encounters or because males are actively excluding them
from their territories, pushing migrants to the lower-quality periphery of preferred habitat. In
southern Texas, the subspecies Geothylpis trichas insperata is reported to be so aggressive that
no migrating common yellowthroats can be found in that region (Guzy and Ritchison 1999). I
have captured some migrants in the net at the same time as the local territory holder, evidence
that migrants are sometimes aggressively chased. However, the result that migrants are
captured more often farther away from actively defending males suggests that migrants more
often avoid local males.

55
Although I found that migrants overall were further away from singing males than
expected, I also found that the distances were quite variable. The sample size was not large
enough to explore the potential interactive effects of age and condition factors that could affect
a bird’s willingness or ability to approach a singing male. For example, older males may be
better able to intrude on subordinate males’ territories. In addition, a migrant arriving in poor
condition may be more likely to invade a resource-rich territory occupied by a singing male,
despite the risk of aggression, as it is in more urgent need of food than a migrant in good
condition (similar to condition effects on predator avoidance, see Cimprich and Moore 2006). I
was able to observe that males were, on average, farther away from singing males than female
migrants were, and that females were captured nearer to the presumably higher-quality
territories of experienced male breeders.
Male and female migrants used habitat in ways that reflect hypothesized differences in
spring migratory strategies (Sandberg and Moore 1996). Both males and females need to
maintain their fat stores to improve their chances of surviving migration and the inclement
weather that often occurs in the early breeding season; however, females need more fat stores
than males because they also produce eggs. Therefore, they are predicted to prioritize decisions
that optimize their condition, such as consistently using the highest quality habitat available.
Consistent with this prediction, I found that females were captured closer to experienced males,
which presumably occupy higher-quality territories, whereas males were as likely to use the
habitat in the territories of first-time breeding males as experienced males.
In addition to differences in their need to optimize condition, males and females also
differ in how local males are likely to respond to them, and their movement in response to song
reflected these differences. Male migrants are more likely to elicit aggressive responses from
locally breeding males, as they are more likely to be perceived as potential rivals for locally

56
breeding females than female migrants. Males are hypothesized to optimize the timing of their
migrations to arrive at the breeding grounds before rivals (Sandberg and Moore 1996). Although
using high-quality habitat --as advertised by the presence of local, singing males-- should
improve their refueling rates, migrant males might avoid singing males more often than migrant
females if energetically costly fighting ultimately slows their progress.
In the playback experiments, neither common yellowthroat song nor ovenbird song
affected the response of heterospecific birds, but eastern towhee song did seem to attract birds.
Just as migrant species vary in their response to vocalizations (Mukhin et al. 2008), the
vocalizations of different species may vary in their usefulness as cues to heterospecific birds. To
a non-warbler species, a common yellowthroat or ovenbird song may be perceived as
“warblerish,” with its loud, repetitive phrases in a frequency range typical of warbler song. Even
though their songs are similar, common yellowthroats and ovenbirds prefer different breeding
habitats, so for a listener that could not distinguish the two species songs would not receive
reliable information about habitat type from them. In contrast, eastern towhee song is quite
distinctive and different from warbler song, and may therefore be a more salient cue to shrubby
habitat.
In conclusion, I found evidence that migrating birds use social information differently at
different spatial scales, and that migrating birds avoid singing males within a stopover site.
Future experiments can clarify whether common yellowthroats use song cues to select habitat
at the landscape scale, or whether heterospecific cues are better for locating habitat than
common yellowthroat song. By studying how migrant birds and locally breeding bird
communities interact, researchers may develop new insights on factors that may impact the
survival and evolution of migratory birds, including aggression and social information.

57
CHAPTER 5
CONCLUSIONS
In conclusion, I have found evidence that song variation could contain information
useful for migrants at multiple scales, and that migrants may respond to this variation (Table
10).
Specifically, common yellowthroat song variation could provide information that might
be used for navigation at the continental, regional, and landscape scales. I found significant
differences in song characteristics among genetic groups, subspecies, and populations.
Therefore, by attending to the cues found in song variation at a stopover site, a migrant could
theoretically discern its geographic location within the continent or region, which could be
useful for navigation. It could also pinpoint the location of preferred habitat patches within a
matrix of heterogeneous patches by locating a chorus of conspecific males. Information at each
of these scales would benefit migrants by allowing them to efficiently navigate in order to
optimize their arrival timing at their breeding grounds.
Do migrants respond to song variation at the continental scale? I did not test whether
migrants responded to this scale, but it seems unlikely that migrants use cues for continental
navigation. There are many additional cues that migrants are known to use including the
rotation of stars, polarized light, photoperiod, geomagnetic cues, and landscape-level landmarks
(Berthold 2001). Attending to the geographic variation of song may be redundant and less
predictable than celestial and geomagnetic cues. Additionally, in order to use geographic
variation in song for navigation, birds would have to create cognitive maps of the geographic
variation in songs that would likely have to be learned over time, a process that may take too
long for short-lived species like warblers.

58
At the regional scale, cognitive maps of the distribution of song types among regional
populations might be more useful, as first-year breeding birds often disperse from their natal
grounds within the region of their origin, and may be exposed to regional variation when
learning songs in the post-fledgling, migration preparation phase of the late summer. During
this period, young birds do not stay on their natal territories. This time is likely an important
phase for exploring and learning local song traditions. Even if the spatial extent of these
explorations is limited, young birds likely learn to recognize their natal song types and structure
in contrast to foreign songs. Older birds likely have knowledge of their natal and breeding song
neighborhoods, and can use this information to evaluate whether or not they have arrived at
their breeding grounds, which might influence their decision to stop migrating in the spring. At
this point birds might stop using song as a cue for navigation and habitat choice and begin to use
it for its evolved function as a breeding signal.
En route, locating suitable habitat for stopover is important for survival, and the location
of a chorus of singing, locally breeding males is predictive of suitable habitat. In the playback
experiment described in Chapter 4, common yellowthroats did not appear to respond to singing
males, or at least they were not lured close enough for capture in the mist-net array. However,
common yellowthroats do use species-typical habitat during migration (Deppe and Rotenberry
2008), and were captured within the matrix of singing males in a mist-net array at the
Pennsylvania site, suggesting that they are not repelled by song at the landscape scale. By
simulating the expected distances between migrant capture locations in the PA mist-netting
array and the nearest singing birds, I found that migrant common yellowthroats were actually
avoiding singing males within the stopover site, which may explain why they were not captured
in the playback experiment. In the future, I plan to clarify migrant response to song at the
landscape scale by blanketing unsuitable habitat with nets and playbacks representing a chorus

59
of local males, with playback available on alternating nights. Ideally I could compare this to a
nearby mist-netting site in suitable habitat where birds are singing naturally. In this way I could
test the relative roles of visual and social cues in habitat selection at the landscape scale.
Although I found evidence that song variation could provide information at the broader
scales, I found evidence that common yellowthroat song variation may be less useful for
assessing habitat structure and quality at the within-site scale. Local breeding birds may be
familiar with local dynamics, or how song variation predicts habitat quality gradients and habitat
transmission properties within the site. However, there was no consistent relationship between
song and habitat among sites. Therefore, song variation at the within-site scale would not
provide information to migrants unfamiliar with the stopover site.
At the within-territory scale, I found that the location of commonly used song perches
could help migrants find preferred microhabitat that contains more arthropod food. However,
migrants do not appear to be using this information, and are instead avoiding potentially
aggressive singing males. The costs of settling in slightly lower quality habitat in the periphery of
a stopover site may be less than the costs of fighting with local males. However, context may
influence migrant response. Female migrants are less likely to elicit aggressive responses from
males trying to attract mates, and were captured slightly closer to local singing males than male
migrants. Male migrants in poor condition may be more likely to trespass if the location of
singing males dramatically decreases the search time for much needed food. Alternatively, male
migrants that have superior fighting ability may not hesitate from challenging local males or may
be allowed to trespass on higher-quality territories. Lastly, dispersing migrants that are nearing
their potential breeding grounds may begin to use song not only as cue to needed resources but
as a signal during the transition between migration and breeding. These young migrants (or

60
potentially arriving local breeders) might approach singing males if they are more carefully
assessing networks of local males in order to choose their breeding grounds.
Overall, this study revealed that birdsong is rich in pertinent information for migrants
making movement decisions. Migrants may be simultaneously attracted to and repelled from
singing males and the habitat and resources they defend depending on scale and context.
Although ephemeral, the interactions of locally breeding males and migrants stopping over in
their territories may be more important than previously emphasized.

61
APPENDICES

62
APPENDIX A
TABLES
Table 1. Common yellowthroat subspecies represented in the archived recordings and their migratory behavior.
Migratory status n
Eastern
G. t. campicola Migratory 7 G. t. trichas Migratory 76
G. t. typhicola Migratory 1 G. t. ignota Sedentary 11 Southwestern
G. t. chryseola Partially migratory 6 Western
G. t. campicola Migratory 8 G. t. arizela Migratory 4 G. t. occidentalis Migratory 7 G. t. sinuosa Partially migratory 3 G. t. scirpicola Sedentary 2

63
Table 2. Western, southwestern, and eastern populations differ in the spectral characteristics of song, and in song-type elaborateness measures.
West
Southwest
East
(n = 31) (n = 6) (n = 90) χ2 p
Minimal frequency (Hz) 2325 2130 2465 7.21 0.027 ±273 ±223 ±383
Maximal frequency (Hz)
6886
6344
6361
8.58
0.014
±846 ±698 ±769 Peak frequency (Hz)
4734
4658
4475
3.20
0.202
±650 ±771 ±551 Bandwidth (Hz)
4562
4214
3895
14.7
<0.001
±812 ±634 ±590 Phrase duration (s)
0.529
0.520
0.537
0.03
0.985
±0.080 ±0.050 ±0.098 Bandwidth/phrase (Hz/s)
8812
8137
7516
8.63
0.013
±2013 ±1115 ±1851 Mean note duration (s)
0.120
0.111
0.114
1.14
0.567
±0.020 ±0.020 ±0.023 Mean internote duration (s)
0.064
0.063
0.051
27.9
<0.001
±0.010 ±0.010 ±0.009 Mean notes per phrase
2.92
3.00
3.34
6.30
0.043
±0.49 ±0 ±0.87 Mean elements per note
2.42
2.83
1.96
27.0
<0.001
±0.51 ±0.07 ±0.51

64
Table 3. Eastern subspecies differ in perch song characteristics.
G. t.
campicola
G. t.
trichas
G. t.
ignota
(n = 7) (n = 76) (n = 11) χ2 p
Minimal frequency (Hz) 2630 2483 2143 12.1 0.017 ± 484 ± 359 ± 258
Maximal frequency (Hz)
6655
6453
5544
16.5
0.002
± 595 ± 760 ± 462 Peak frequency (Hz)
4424
4480
4439
1.96
0.743
± 674 ± 569 ± 374 Bandwidth (Hz)
4025
3968
3401
12.4
0.015
±313 ± 590 ± 434 Phrase duration (s)
0.471
0.523
0.677
21.2
<0.001
± 0.08 ± 0.08 ± 0.08 Bandwidth/phrase
8852
7767
5120
9.48
<0.001
(Hz/s) ± 2104 ± 1647 ± 1043 Mean note duration (s)
0.124
0.115
0.101
9.48
0.050
± 0.03 ± 0.02 ± 0.02 Mean internote duration (s)
0.056
0.053
0.042
18.8
<0.001
± 0.01 ± 0.01 ± 0.01 Mean notes per phrase
2.71
3.17
4.82
32.2
<0.001
± 0.76 ± 0.62 ± 0.87 Mean elements per note
1.99
2.00
1.67
7.83
0.098
± 0.47 ± 0.52 ± 0.37

65
Table 4. Western subspecies do not differ in most perch song characteristics.
G. t.
arizela
G. t.
campicola
G. t.
occidentalis
G. t.
scirpicola
G. t.
sinuosa
(n = 4) (n = 8) (n = 7) (n = 2) (n = 3) χ2 p
Minimal freq. (Hz)
2334 ± 306
2417 ± 267
2323 ± 142
2041 ± 187
2450 ± 353
6.43
0.27
Maximal freq.(Hz)
7285 ± 979
7155 ± 744
6220 ± 572
7449 ± 463
7352 ± 187
10.7 0.05
Peak freq, (Hz)
5136 ± 802
4533 ± 732
4614 ± 606
4823 ± 487
5096 ± 431
4.13 0.51
Bandwidth (Hz)
4951 ± 1012
4739 ± 698
3898 ± 629
5408 ± 277
4902 ± 224
10.2 0.07
Phrase duration (s)
0.528 ± 0.09
0.545 ± 0.05
0.494 ± 0.08
0.449 ± 0.03
0.652 ± 0.06
9.81 0.08
Bandwidth/ phrase (Hz/s)
9492 ± 2064
8746 ± 1463
8209 ± 2437
12097 ± 1322
7544 ± 592
6.49 0.26
Mean note duration (s)
0.118 ± 0.02
0.123 ± 0.04
0.119 ± 0.01
0.122 ± 0.04
0.120 ± 0.03
1.77 0.88
Internote duration (s)
0.058 ± 0.01
0.064 ± 0.01
0.064 ± 0.00
0.063 ± 0.02
0.079 ± 0.01
7.06 0.22
Mean notes per phrase
3.00 ± 0
3.00 ± 0.53
2.71 ± 0.49
2.50 ± 0.71
3.33 ± 0.58
5.09 0.41
Mean elements per note
2.58 ± 0.32
2.28 ± 0.38
2.45 ± 0.46
2.50 ± 0.71
2.78 ± 0.84
4.50 0.48

66
Table 5. Summary of eigenvalues, loadings, and variance explained by each of the two principal components used to describe bird size.
Table 6. Summary of eigenvalues, loadings, and variance explained by the principal components used to describe trees.
PC1
PC2
Mass (g) 0.631 -0.291
Wing length (mm) 0.620 -0.368
Bill length (mm) 0.466 0.883 Eigenvalue 1.830 0.771 Percent variance 60.99 25.69
PC1
Number trees 0.567
Mean canopy height (m) 0.628
Canopy cover (%) 0.534 Eigenvalue 2.154 Percent variance 71.79

67
Table 7. Summary of song, habitat, and morphology variables in the three field sites: Lackawanna County, Pennsylvania (PA), Franklin County in western Massachusetts (WMA), and Barnstable County on Cape Cod, Massachusetts (CCMA).
PA WMA CCMA
n=15 n=17 n=5
Bandwidth (Hz)
4104 ±728
4035 ±417
4029±
523
Phrase duration (s) 0.46 ±0.05
0.43 ±0.06
0.51 ±0.1
Minimal frequency (Hz) 2521 ±379
2586 284
2372 ±230
Bandwidth/phrase (Hz /s) 9107 ±1272
9460 ±1663
8145 ±1580
Consistency (%) 69 ±6
65 ±8
68 ±8
Trees/plot 12.2 ±10.1
5.2 ±9.0
14.3 ±10.0
Shrub stems 148 ±72
42 ±34
160 ±72
Canopy cover (%) 51 ±19
33 ±29
42 ±27
Mean canopy height (m) 13.2 ±6.3
10 ±8.6
9.4 ±3.1
Bill length (mm) 7.76 ±0.24
7.99 ±0.3
8.21 ±0.15
Wing length (mm) 53.3 ±1.7
54.1 ±1.7
55.8 ±1.3
Mass (g) 9.8 ±0.4
10.5 ±0.6
10.7 ±0.5
Black mask area (cm2) 1.14
±0.18 1.14
±0.18 1.46
±0.22
Yellow bib score 2.7 ±0.65
2.7 ±0.88
3.6 ±0.42

68
Table 8. Summary of variables in each of the microhabitat types at the Pennsylvania site.
Ash grove
n = 7
Honeysuckle
thicket n = 9
Marsh
n = 5
Bottom of
field n = 3
Bandwidth (Hz)
3834 ±418
4203 ±460
4312 ±359
4340 ±343
Phrase duration (sec) 0.48 ±0.05
0.46 ±0.03
0.45 ±0.04
0.43 ±0.01
Minimal frequency (Hz) 2363 ±222
2726 ±410
2424 ±133
2744 ±424
Bandwidth/phrase (Hz/s) 8022
±1009 9212
±1105 9541
±1161 10125 ±977
Consistency (%) 62
±7 70 ±3
72 ±4
73 ±4
Black mask area (cm2) 1.05
±0.20 1.09
±0.21 1.12
±0.22 1.1 ±0
Yellow bib score 2.6
±0.9 2.6
±0.6 3
±0.5 2.5 ±0

69
Table 9. Summary of variables in peaks, slopes, and valleys at the western Massachusetts site.
Peaks n = 4
Slopes n = 9
Valleys n = 4
Bandwidth (Hz)
4526 ±584
4128 ±385
3717 ±439
Phrase duration (sec) 0.39 ±0.08
0.46 ±0.05
0.44 ±0.06
Minimal frequency (Hz) 2503
±134 2508 ±146
2575 ±177
Bandwidth/phrase (Hz sec-1) 11471
±3239 8996 ±860
8444 ±438
Consistency (%) 58
±3 66 ±7
61 ±1
Black mask area (cm2) 1.11
±0.09 1.14
±0.09 1.29
±0.16
Yellow bib score 3.3 ±0.65
2.17 ±0.66
3.25 ±0.96

70
Table 10. Summary of birdsong variation as a source of information and migrant response.
Scale
Hypothesized Use
Information?
Response?
Continental
Navigation
Yes
?
Regional Navigation Yes ?
Regional Habitat No
Landscape Habitat location Yes Maybe
Within-site Habitat structure No?
Within-site Habitat quality No
Within-territory Location of habitat
Yes Avoid
Within-territory Location of food Yes Avoid
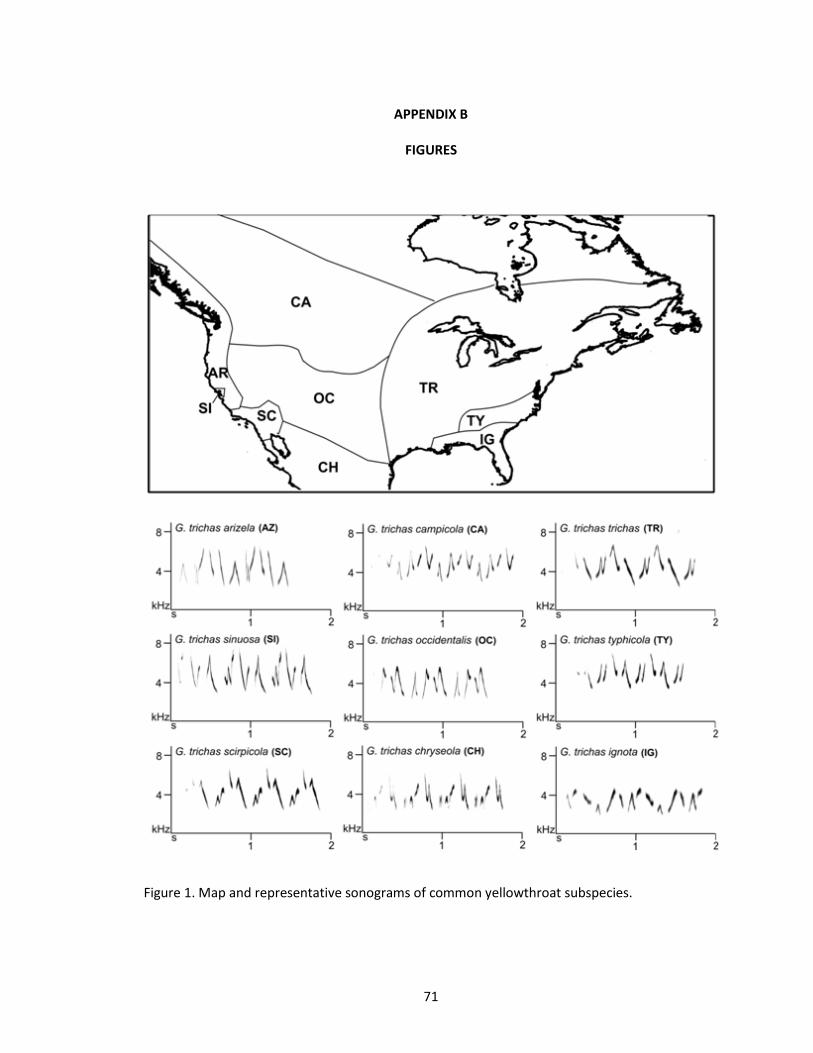
71
APPENDIX B
FIGURES
Figure 1. Map and representative sonograms of common yellowthroat subspecies.

72
Figure 2. Common yellowthroat perch songs are repeated phrases made up of two to six notes, which vary in number of elements.

73
Figure 3. Boxplots of song characteristics that differed among western, southwestern, and eastern genetic groups of common yellowthroats.

74
Figure 4. A PCA ordination of spectral characteristics and elaborateness scores by subspecies. The southeastern Geothlypis trichas ignota sang quite differently than the two migratory subspecies in the east, Geothlypis trichas trichas and Geothlypis trichas campicola. Circles are 95% confidence ellipses

75
Figure 5. Migratory behavior does not have a consistent effect on perch song. Subspecies are on the y-axes along the continuum of long-distance migration (top) to completely sedentary (bottom).

76
Figure 6. Sonogram demonstrating definitions of measured song elements.
Figure 7. Yellow bib score reference diagram.
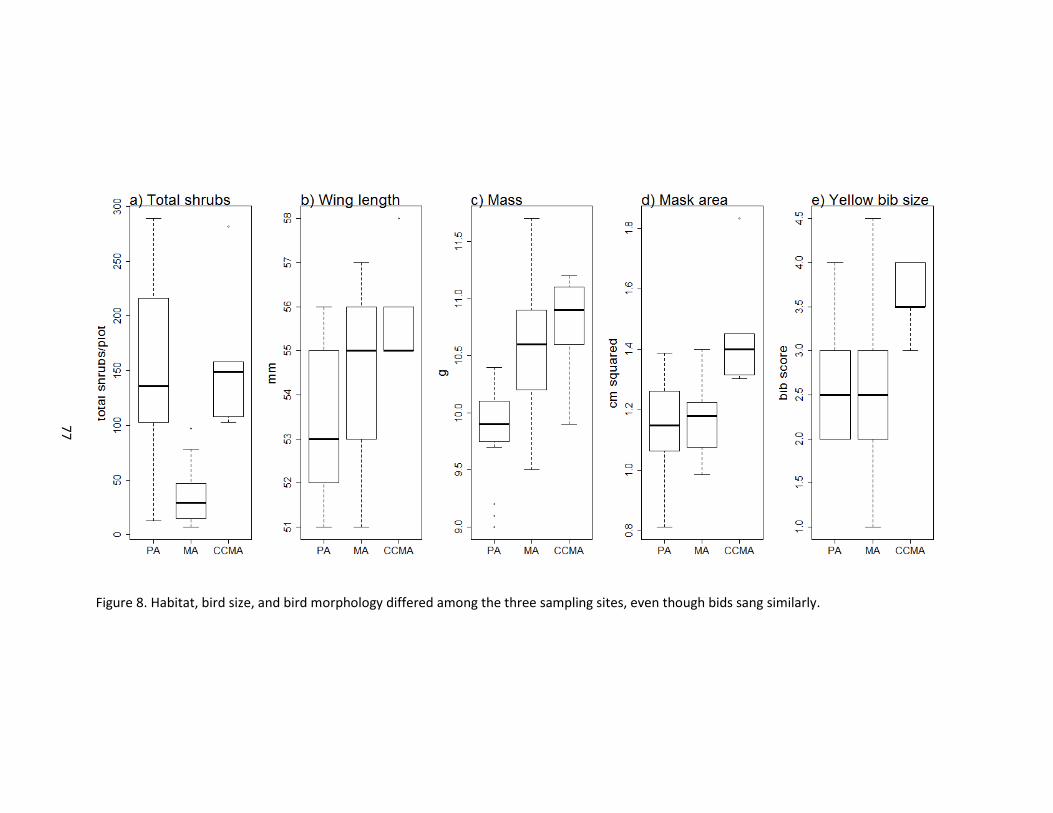
77
Figure 8. Habitat, bird size, and bird morphology differed among the three sampling sites, even though bids sang similarly.
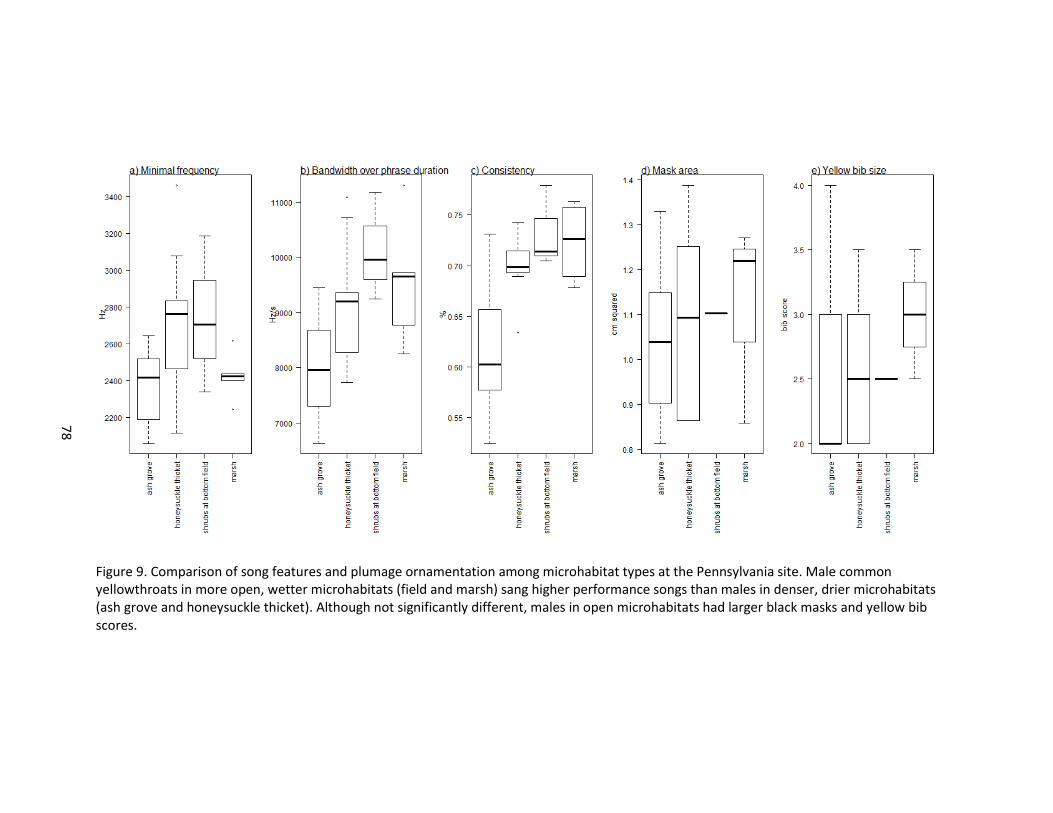
78
Figure 9. Comparison of song features and plumage ornamentation among microhabitat types at the Pennsylvania site. Male common yellowthroats in more open, wetter microhabitats (field and marsh) sang higher performance songs than males in denser, drier microhabitats (ash grove and honeysuckle thicket). Although not significantly different, males in open microhabitats had larger black masks and yellow bib scores.

79
Figure 10. At the western Massachusetts site, common yellowthroat males with territories on peaks differed in song performance and appearance from males on slopes or in valleys.

80
Figure 11. This sonogram of two common yellowthroat songs from the same bout demonstrates variation in song duration.

81
Figure 12. Classification and Regression Tree (CART) of 2009 habitat plots. Locally breeding males sang on perches that differed in microhabitat characteristics from randomly selected plots in the study area. Branches indicate the variable and variable value (z-score) at each split. At each terminal node, class assignment (i.e., bird or random) is listed, as well as the proportion of observations that match this classification, and the total number of observations classified in that group (in parentheses). For example, in the top right split 12 plots were classified as random, based on the split between all plots with average canopy heights with z-scores greater than 0.7751. The arrow (<) indicates whether groups on the left-hand split are greater than or less than the value. One-hundred percent of these 12 plots actually were random plots. In the next split (total shrubs), 86% of the seven plots that had low average canopy heights in the first split and low shrubs in the second split were actually random plots. (n = 60. Correct classification rate = 88%, Kappa = 0.77, p < 0.002).

82
Figure 13. CART of 2010 habitat plots (n = 50, CCR = 82%, p < 0.003).

83
Figure 14. There are more arthropods in shrubs close to birds’ most commonly used song perches (n =162) than at random shrubs within common yellowthroat habitat patches (n = 162).

84
Figure 15. Boxplot of song rates (songs/minute) of birds in increasingly agonistic interactions. There is a trend that birds exhibiting high-intensity interactions, especially fighting, have low song rates.
Figure 16. Song duration (s) of birds in increasingly agonistic interactions.

85
Figure 17. Playback treatment affected heterospecific capture at the Pennsylvania site, but not at the Massachusetts site. Net location did not significantly affect capture rates.

86
Var1
Va
r2
(41.5623,41.56236]
(41.56236,41.56242]
(41.56242,41.56248]
(41.56248,41.56254]
(41.56254,41.5626]
(41.5626,41.56266]
(41.56266,41.56272]
(41.56272,41.56278]
(41.56278,41.56284]
(41.56284,41.5629]
(41.5629,41.56296]
(41.56296,41.56302]
(41.56302,41.56308]
(41.56308,41.56314]
(41.56314,41.5632]
(41.5632,41.56326]
(41.56326,41.56332]
(41.56332,41.56338]
(41.56338,41.56344]
(41.56344,41.5635]
(-75.7
236,-
75.7
234]
(-75.7
234,-
75.7
233]
(-75.7
233,-
75.7
232]
(-75.7
232,-
75.7
23]
(-75.7
23,-
75.7
229]
(-75.7
229,-
75.7
228]
(-75.7
228,-
75.7
226]
(-75.7
226,-
75.7
225]
(-75.7
225,-
75.7
223]
(-75.7
223,-
75.7
222]
(-75.7
222,-
75.7
221]
(-75.7
221,-
75.7
219]
(-75.7
219,-
75.7
218]
(-75.7
218,-
75.7
217]
(-75.7
217,-
75.7
215]
(-75.7
215,-
75.7
214]
(-75.7
214,-
75.7
212]
(-75.7
212,-
75.7
211]
(-75.7
211,-
75.7
21]
(-75.7
21,-
75.7
208]
0
5
10
15
20
Var1V
ar2
(41.5623,41.56236]
(41.56236,41.56242]
(41.56242,41.56248]
(41.56248,41.56254]
(41.56254,41.5626]
(41.5626,41.56266]
(41.56266,41.56272]
(41.56272,41.56278]
(41.56278,41.56284]
(41.56284,41.5629]
(41.5629,41.56296]
(41.56296,41.56302]
(41.56302,41.56308]
(41.56308,41.56314]
(41.56314,41.5632]
(41.5632,41.56326]
(41.56326,41.56332]
(41.56332,41.56338]
(41.56338,41.56344]
(41.56344,41.5635]
(-75.7
236,-
75.7
234]
(-75.7
234,-
75.7
233]
(-75.7
233,-
75.7
232]
(-75.7
232,-
75.7
23]
(-75.7
23,-
75.7
229]
(-75.7
229,-
75.7
228]
(-75.7
228,-
75.7
226]
(-75.7
226,-
75.7
225]
(-75.7
225,-
75.7
223]
(-75.7
223,-
75.7
222]
(-75.7
222,-
75.7
221]
(-75.7
221,-
75.7
219]
(-75.7
219,-
75.7
218]
(-75.7
218,-
75.7
217]
(-75.7
217,-
75.7
215]
(-75.7
215,-
75.7
214]
(-75.7
214,-
75.7
212]
(-75.7
212,-
75.7
211]
(-75.7
211,-
75.7
21]
(-75.7
21,-
75.7
208]
0
1
2
3
4
5
6
7
8
Var1
Va
r2
(41.5623,41.56234]
(41.56234,41.56238]
(41.56238,41.56243]
(41.56243,41.56247]
(41.56247,41.56251]
(41.56251,41.56255]
(41.56255,41.56259]
(41.56259,41.56264]
(41.56264,41.56268]
(41.56268,41.56272]
(41.56272,41.56276]
(41.56276,41.5628]
(41.5628,41.56285]
(41.56285,41.56289]
(41.56289,41.56293]
(41.56293,41.56297]
(41.56297,41.56301]
(41.56301,41.56306]
(41.56306,41.5631]
(41.5631,41.56314]
(-75.7
231,-
75.7
229]
(-75.7
229,-
75.7
228]
(-75.7
228,-
75.7
227]
(-75.7
227,-
75.7
226]
(-75.7
226,-
75.7
225]
(-75.7
225,-
75.7
224]
(-75.7
224,-
75.7
223]
(-75.7
223,-
75.7
222]
(-75.7
222,-
75.7
221]
(-75.7
221,-
75.7
219]
(-75.7
219,-
75.7
218]
(-75.7
218,-
75.7
217]
(-75.7
217,-
75.7
216]
(-75.7
216,-
75.7
215]
(-75.7
215,-
75.7
214]
(-75.7
214,-
75.7
213]
(-75.7
213,-
75.7
212]
(-75.7
212,-
75.7
211]
(-75.7
211,-
75.7
209]
(-75.7
209,-
75.7
208]
0
1
2
3
4
5
Var1
Va
r2
(41.5623,41.56235]
(41.56235,41.56241]
(41.56241,41.56247]
(41.56247,41.56252]
(41.56252,41.56258]
(41.56258,41.56264]
(41.56264,41.56269]
(41.56269,41.56275]
(41.56275,41.5628]
(41.5628,41.56286]
(41.56286,41.56292]
(41.56292,41.56297]
(41.56297,41.56303]
(41.56303,41.56308]
(41.56308,41.56314]
(41.56314,41.5632]
(41.5632,41.56325]
(41.56325,41.56331]
(41.56331,41.56337]
(41.56337,41.56342]
(-75.7
236,-
75.7
235]
(-75.7
235,-
75.7
233]
(-75.7
233,-
75.7
232]
(-75.7
232,-
75.7
231]
(-75.7
231,-
75.7
229]
(-75.7
229,-
75.7
228]
(-75.7
228,-
75.7
227]
(-75.7
227,-
75.7
226]
(-75.7
226,-
75.7
224]
(-75.7
224,-
75.7
223]
(-75.7
223,-
75.7
222]
(-75.7
222,-
75.7
22]
(-75.7
22,-
75.7
219]
(-75.7
219,-
75.7
218]
(-75.7
218,-
75.7
217]
(-75.7
217,-
75.7
215]
(-75.7
215,-
75.7
214]
(-75.7
214,-
75.7
213]
(-75.7
213,-
75.7
211]
(-75.7
211,-
75.7
21]
0.0
0.5
1.0
1.5
2.0
2.5
3.0
Var1
Va
r2
(41.5623,41.56236]
(41.56236,41.56242]
(41.56242,41.56248]
(41.56248,41.56254]
(41.56254,41.5626]
(41.5626,41.56266]
(41.56266,41.56272]
(41.56272,41.56278]
(41.56278,41.56284]
(41.56284,41.5629]
(41.5629,41.56296]
(41.56296,41.56302]
(41.56302,41.56308]
(41.56308,41.56314]
(41.56314,41.5632]
(41.5632,41.56326]
(41.56326,41.56332]
(41.56332,41.56338]
(41.56338,41.56344]
(41.56344,41.5635]
(-75.7
236,-
75.7
234]
(-75.7
234,-
75.7
233]
(-75.7
233,-
75.7
232]
(-75.7
232,-
75.7
23]
(-75.7
23,-
75.7
229]
(-75.7
229,-
75.7
228]
(-75.7
228,-
75.7
226]
(-75.7
226,-
75.7
225]
(-75.7
225,-
75.7
223]
(-75.7
223,-
75.7
222]
(-75.7
222,-
75.7
221]
(-75.7
221,-
75.7
219]
(-75.7
219,-
75.7
218]
(-75.7
218,-
75.7
217]
(-75.7
217,-
75.7
215]
(-75.7
215,-
75.7
214]
(-75.7
214,-
75.7
212]
(-75.7
212,-
75.7
211]
(-75.7
211,-
75.7
21]
(-75.7
21,-
75.7
208]
0
2
4
6
8
Var1
Va
r2
(41.5623,41.56236]
(41.56236,41.56242]
(41.56242,41.56248]
(41.56248,41.56254]
(41.56254,41.5626]
(41.5626,41.56266]
(41.56266,41.56272]
(41.56272,41.56278]
(41.56278,41.56284]
(41.56284,41.5629]
(41.5629,41.56296]
(41.56296,41.56302]
(41.56302,41.56308]
(41.56308,41.56314]
(41.56314,41.5632]
(41.5632,41.56326]
(41.56326,41.56332]
(41.56332,41.56338]
(41.56338,41.56344]
(41.56344,41.5635]
(-75.7
236,-
75.7
234]
(-75.7
234,-
75.7
233]
(-75.7
233,-
75.7
232]
(-75.7
232,-
75.7
23]
(-75.7
23,-
75.7
229]
(-75.7
229,-
75.7
228]
(-75.7
228,-
75.7
226]
(-75.7
226,-
75.7
225]
(-75.7
225,-
75.7
223]
(-75.7
223,-
75.7
222]
(-75.7
222,-
75.7
221]
(-75.7
221,-
75.7
219]
(-75.7
219,-
75.7
218]
(-75.7
218,-
75.7
217]
(-75.7
217,-
75.7
215]
(-75.7
215,-
75.7
214]
(-75.7
214,-
75.7
212]
(-75.7
212,-
75.7
211]
(-75.7
211,-
75.7
21]
(-75.7
21,-
75.7
208]
0
2
4
6
8
10
All migrants All locally-breeding birds
First-time breeding males (SY) Experienced breeding males (ASY)
Male migrants Female migrants
Figure 18. Capture locations from 2005-2010 at the passive mist-netting station at the Pennsylvania site. The x axes are latitude and the y axes are longitude. Warmer colors indicate net locations where more birds were captured.

87
Figure 19. Migrants were captured farther away from locally singing males than expected. The histogram shows the expected random distribution of distances between a captured migrant and the nearest singing male. The boxplot shows the actual, observed distribution of captured migrants.
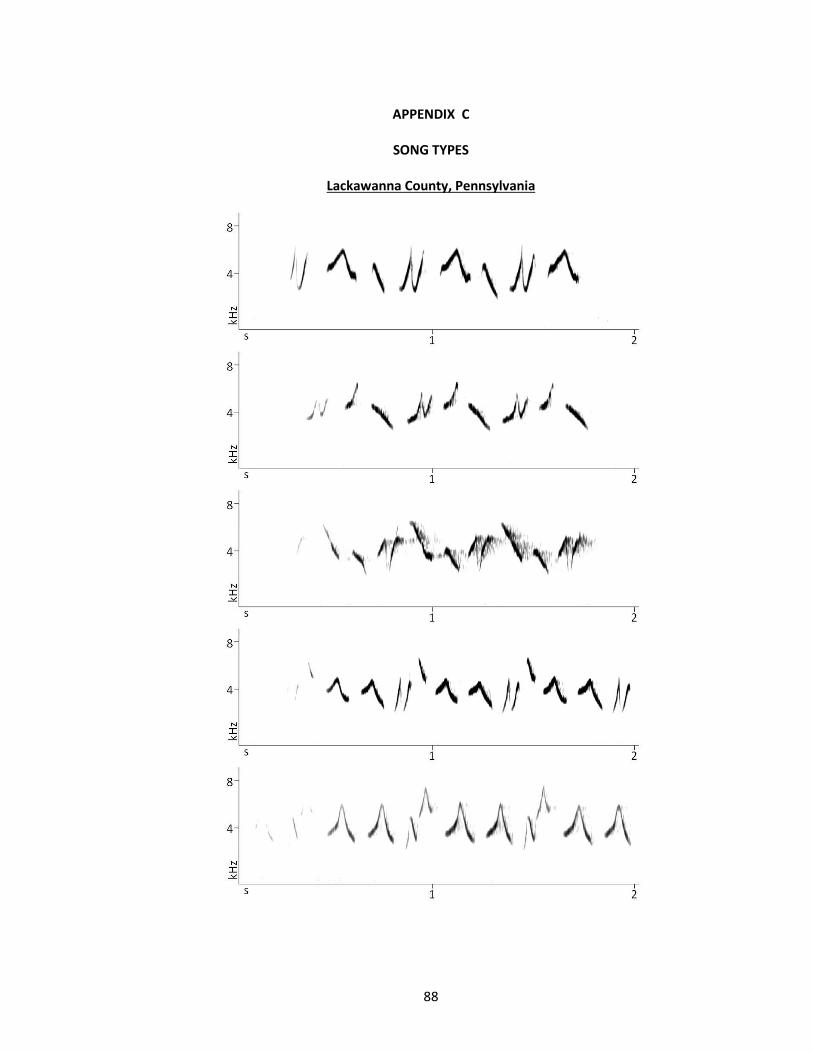
88
APPENDIX C
SONG TYPES
Lackawanna County, Pennsylvania

89
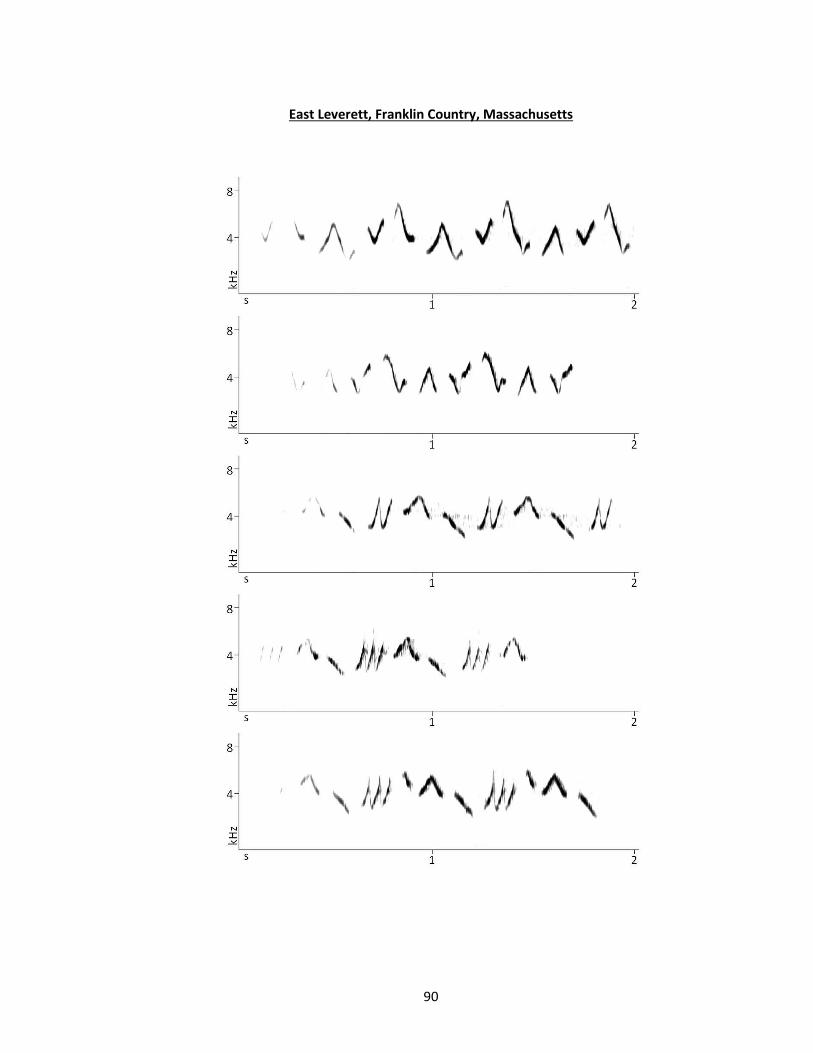
90
East Leverett, Franklin Country, Massachusetts

91

92
Cape Cod National Seashore, Truro, Massachusetts

93
Wellfleet Bay Wildlife Sanctuary, Wellfleet, Cape Cod, Massachusetts

94
BIBLIOGRAPHY
Alerstam, T. 1993. Bird migration. New York, NY, Cambridge University Press. Alessi, M. G., T. J. Benson, and M. P. Ward. 2010. Nocturnal social cues attract migrating yellow-
breasted chats. Wilson Journal of Ornithology 122(4): 780-783. Ballentine, B. 2009. The ability to perform physically challenging songs predicts age and size in
male swamp sparrows, Melospiza georgiana. Animal Behaviour 77: 973-978. Bearhop, S., W. Fiedler, R. W. Furness, S. C. Votier, S. Waldron, J. Newton, G. J. Bowen, P.
Berthold, and K. Farnsworth. 2005. Assortative mating as a mechanism for rapid evolution of a migratory divide. Science 310:502-504.
Beecher, M. D. and E. A. Brenowitz. 2006. Functional aspects of song learning in songbirds.
Trends in Ecology and Evolution 20(3): 143-149. Berthold, P. 2001. Bird migration: A general survey. New York, NY, Oxford University Press, Inc. Bent, A. C. 1963. Life histories of North American wood warblers. Part 2. New York, NY, Dover
Publication, Inc. Bingman, V. P. 1980. Inland morning flight behavior of nocturnal passerine migrants in eastern
New York. Auk 97(3): 465-472. Boncoraglio, G. and N. Saino. 2007. Habitat structure and the evolution of bird song: a meta-
analysis of the evidence for the acoustic adaptation hypothesis. Functional Ecology 21:134-142.
Borror, D. J. 1967. Songs of the yellowthroat. Living Bird 6:141-161. Botero, C. A., R. J. Rossman, L.M. Caro, L. M. Stenzler, I. J. Lovette, S. R. de Cort, and S. L.
Vehrencamp. 2009. Syllable type consistency is related to age, social status and reproductive success in the tropical mockingbird. Animal Behaviour 77: 701-706.
Bowman, R. I. 1979. Adaptive morphology of song dialects in Darwin's finches. Journal of
Ornithology 120:353-389. Buler, J. J., F. R. Moore, and S. Woltmann. 2007. A multi-scale examination of stopover habitat
use by birds. Ecology 88(7): 1789-1802. Byers, B. E. 2007. Extrapair paternity in chestnut-sided warblers is correlated with consistent
vocal performance. Behavioral Ecology 18(1): 130-136. Cardoso, G. C., Y. Hu, and P. G. Mota. 2012. Birdsong, sexual selection, and the flawed
taxonomy of canaries, goldfinches and allies. Animal Behaviour 84:111-119.

95
Catchpole, C. K. 1982. The evolution of bird sounds in relation to mating and spacing behavior,
p. 297-319. In D. E. Kroodsma and E. H. Miller [eds.], Acoustic communication in birds. Academic Press, New York.
Catry, P., V. Encarnação, A. Araújo, P. Fearon, A. Fearon, M. Armelin, and P. Delaloye. 2004. Are
long-distance migrant passerines faithful to their stopover sites? Journal of Avian Biology 35(2): 170-181.
Cimprich, D. A. and F. R. Moore 2006. Fat affects predator-avoidance behavior in Gray Catbirds
(Dumetella carolinensis) during migratory stopover. Auk 123(1069-1076). Cody, M. L. 1981. Habitat selection in birds: the roles of vegetation structure, competitors, and
productivity. Bioscience 31(2): 107-113. Danchin, E., L. A. Giraldeau, T. J. Valone, R. H. Wagner. 2004. Public information: From nosy
neighbors to cultural evolution. Science 305: 487-491. De'ath, G. and K. E. Fabricius 2000. Classification and regression trees: A powerful yet simple
technique for ecological data analysis. Ecology 81(11): 3178-3192. Deppe, J. L. and J. T. Rotenberry 2008. Scale-dependent habitat use by fall migratory birds:
Vegetation structure, floristics, and geography. Ecological Monographs 78(3): 461-487. Derryberry, E. P. 2007. Evolution of bird song affects signal efficacy: an experimental test using
historical and current signals. Evolution 61:1938-1945. ________. 2009. Ecology shapes birdsong evolution: Variation in morphology and habitat
explains variation in white-crowned sparrow song. American Naturalist 174:24-33. Dunn, P. O., L. A. Whittingham, C. R. Freeman-Gallant, J.DeCoste. 2008. Geographic variation in
the function of ornaments in the common yellowthroat, Geothlypis trichas. Journal of Avian Biology 39: 66-72.
Endler, J. A. 1977. Geographic variation, speciation, and clines. Princeton, NJ,
Princeton University Press. Escalante, P., L. Márquez-Valdelamar, P. de la Torre, J. Laclette, and J. Klicka. 2009.
Evolutionary history of a prominent North American warbler clade: The Oporornis– Geothlypis complex. Molecular Phylogenetics and Evolution 53:668-678.
Fletcher, R. J. 2007. Species interactions and population densities mediate the use of social cues
for habitat selection. Journal of Animal Ecology 76: 598-606. Fletcher, R. J., and K. E. Sieving 2010. Social-information use in heterogenous landscapes: a
prospectus. The Condor 112(2): 225-234.

96
Gil, D., and M. Gahr 2002. The honesty of bird song: multiple constraints for multiple traits.
Trends in Ecology and Evolution 17(3): 133-141. Greenwood, P. J. and P. H. Harvey. 1982. The natal and breeding dispersal of birds. Annual
Review of Ecology and Systematics 13: 1-21.
Guzy, M. J. and G. Ritchison 1999. Common Yellowthroat (Geothlypis trichas). In A. Poole and F. Gill [eds.], The Birds of North America, Philadelphia, PA, Birds of North America, Inc.
Hahn, B. A. and E. D. Silverman. 2006. Social cues facilitate habitat selection: American redstarts
establish breeding territories in response to song. Biology Letters 2: 337-340. Hansen, P. 1979. Vocal learning: its role in adapting sound structures to long-distance
propogation, and a hypothesis on its evolution. Animal Behaviour 27(4): 1270-1271. Helms, C. W. and W. H. Drury. 1960. Winter and migratory weight and fat field studies on some
North American buntings. Bird Banding 31: 1-40. Herremans, M. 1990. Can night migrants use interspecific song recognition to assess habitat? Le
Gerfaut 80: 141-148. Hof, D. and N. Hazlett 2010. Low-amplitude song predicts attack in a North American wood
warbler. Animal Behaviour 80: 821-828. Hutto, R. L. 1985. Habitat selection by nonbreeding, migratory land birds. In M. L. Cody [ed.]
Habitat selection in birds. Orlando, FL, Academic Press. Irwin, D. E. 2000. Song variation in an avian ring species. Evolution 54:998–1010. James, F. C. and H. H. Shugart 1970. A quantitative method of habitat description. Audubon
Field Notes 24: 727-736. Janicke, T., S. Hahn, M. S. Ritz, and H. Peter. 2008. Vocal performance reflects individual quality
in a nonpasserine. Animal Behaviour 75: 91-98. Kelley, J. F. and R. L. Hutto. 2005. An east-west comparison of migration in North American
wood warblers. Condor 107:197-211. Kowalski, M. P. 1983. Factors affecting the performance of flight songs and perch songs in the
common yellowthroat. Wilson Bulletin 95(1): 140-142. Kroodsma, D. E. 1989b. Suggested experimental designs for song playbacks. Animal Behaviour
37: 600-609. Kroodsma, D. E. and B. E. Byers. 1991. The function(s) of bird song. American Zoologist
31:318-328.

97
Kroodsma, D. E., W. R. Meservey, and R. Pickert. 1983. Vocal learning in the Parulinae. Wilson
Bulletin 95:140-142. Lowrey, G. H., Jr. and R. J. Newman 1966. A continent wide view of bird migration on four nights
in October. Auk 83: 547-586. Marler, P. and H. Slabbekoorn, Eds. 2004. Nature's music: The science of birdsong. San Diego,
Elsevier Academic Press. Marten, K. and P. Marler. 1977. Sound transmission and its significance for animal vocalization:
I. Temperate habitats. Behavioral Ecology and Sociobiology 2:271-290.
Mettke-Hoffman, C. and R. Greenberg 2005. Behavioral and cognitive adaptations to long- distance migration. In R. Greenberg and P. P. Marra [eds.], Birds of two worlds: The ecology and evolution of migratory birds. John Hopkins University Press: 114-123.
Moore, F. R. 2000. Stopover ecology of neartic-neotropical landbird migrants: Habitat relations
and conservation implications. Studies in Avian Biology 20. Moore, F. R. and D. A. Aborn. 2000. Mechanisms of en route habitat selection: How do migrants
make habitat decisions during stopover? Studies in Avian Biology 20: 34-42. Morton, E. S. 1975. Ecological sources of selection on avian sounds. American Naturalist
109:17-34. ________. 1987. The effects of distance and isolation on song-type sharing in the carolina
wren. Wilson Bulletin 99:601-610. Mukhin, A., N. Chernetsov, D. N. Kishkinev. 2008. Acoustic information as a distant cue for
habitat recognition by nocturnally migrating passerines during landfall. Behavioral Ecology 19(4): 716-723.
Muller, K. E. 1981. Relationships between redundancy analysis, canonical correlation, and
multivariate regression. Psychometrika 46(2):139-142. Mundinger, P. C. 1983. Microgeographic and macrogeographic variation in acquired vocal
patterns. p. 147-208. In D.E. Kroodsma and H. Miller [eds.], Acoustic communication in birds, Volume 2. Academic Press, New York.
Németh, Z. and F. R. Moore 2007. Unfamiliar stopover sites and the value of social information
during migration. Journal of Ornithology 148(Suppl 2): S369-S376. Newton, I. 2006. Can conditions experienced during migration limit the population levels of
birds? Journal of Ornithology 147: 146-166.

98
North, B. V., D. Curtis, and P. C. Sham. 2002. A note on the calculation of empirical P values from Monte Carlo procedures. American Journal of Human Genetics 71: 439-441.
Palacios, M. G. and P. L. Tubaro. 2000. Does beak size affect acoustic frequencies in
woodcreepers? Condor 102:533-560. Pedersen, M. C., P. O. Dunn, and L. A. Whittingham. 2006. Extraterritorial forays are related to a
male ornamental trait in the common yellowthroat. Animal Behaviour 72: 479-486. Petit, D. R. 2000. Habitat use by landbirds along neartic-neotropical migration routes:
Implications for conservation of stopover habitats. Studies in Avian Biology 20: 15-33. Podos, J. 1997. A performance constraint on the evolution of trilled vocalizations in a songbird
family (Passeriformes: Emberizidae)." Evolution 51(2): 537-551.
________. 2001. Correlated evolution of morphology and vocal signal structure in Darwin's finches. Nature 409:185-188.
Podos, J., J. A. Southall, and M. R. Rossi-Santos. 2004. Vocal mechanics in Darwin's finches:
correlation of beak gape and song frequency. Journal of Experimental Biology 207:607- 619.
Podos, J., and P. S. Warren. 2007. The Evolution of Geographic Variation in Birdsong.
Advances in the Study of Behavior 37:403-458. Prather, J. F., S. Peters, R. Mooney, and S. Nowicki. 2012. Sensory constraints on birdsong
syntax: neural responses to swamp sparrow songs with accelerated trill rates. Animal Behaviour 83:1411-1420.
Pyle, P. 1997. Identification guide to North American birds. Pt. 1. Slate Creek Press, Bolinas,
CA. Quay, W. B. 1985. Cloacal sperm in spring migrants: occurrence and interpretation. Condor
87: 273-280. Read, A. F. and D. M. Weary. 1992. The evolution of bird song: comparative analyses.
Philosophical Transactions of the Royal Society of London B 338:165-187. Richardson, W. J. 1978. Timing and amount of bird migration in relation to weather: A review.
Oikos 30(2): 224-272. Ritchison, G. 1991. The flight songs of common yellowthroats: description and causation.
Condor 93:12-18. ________. 1995. Characteristics, use, and possible functions of the perch songs and chatter
calls of male common yellowthroats. Condor 97:27-38.
99
Ryan, M. J. and E. A. Brenowitz. 1985. The role of body size, phylogeny, and ambient noise in the evolution of birdsong. American Naturalist 126:87-100.
Sakata, J. T. and S. L. Vehrencamp. 2012. Integrating perspectives on vocal performance and
consistency. Journal of Experimental Biology 215: 201-209. Sandberg, R. and F. R. Moore. 1996. Fat stores and arrival on the breeding grounds:
Reproductive consequences for passerine migrants. Oikos 77(3): 577-581. Sillett, T. S. and R. T. Holmes 2002. Variation in survivorship of a migratory songbird throughout
its annual cycle. Journal of Animal Ecology 71(2): 296-308. Slabbekoorn, H. and T. B. Smith. 2002. Bird song, ecology and speciation. Proceedings of the
Royal Society B 357:493–503. Smith, R. J. and F. R. Moore 2003. Arrival fat and reproductive performance in a long-distance
passerine migrant. Oecologia 134(3): 325-331. Spottiswoode, C. and A. P. Møller. 2004. Extrapair paternity, migration, and breeding
synchrony in birds. Behavioral Ecology 15:41-57. Tarof, S. A., P. O. Dunn, and L. A. Whittingham. 2005. Dual functions of a melanin-based
ornament in the common yellowthroat. Proceedings of the Royal Society B 272(1568): 1121-1127.
Vardanis, Y., R. H. G. Klaassen, R. Strandber, and T. Alerstam. 2011. Individuality in bird
migration: routes and timing. Biology Letters 7: 502-505. Wiley, R. H. and D. G. Richards. 1978. Physical constraints on acoustic communication in the
atmosphere: Implications for the evolution of animal vocalizations. Behavioral Ecology and Sociobiology 3:69-94.
Wilkelski, M., E. M. Tarlow, A. Raim, R. H. Diehl, R. P. Larkin, and G. H. Visser. 2003. Costs of
migration in free-flying songbird. Nature 423: 704. Wunderle, J. M., Jr. 1978. Differential response of territorial Yellowthroats to songs of
neighbors and non-neighbors. Auk 95: 389-395. ________. 1979. Components of song used for species recognition in the common
yellowthroat. Animal Behaviour 27:982-996. Zink, R. M. 2002. Towards a framework for understanding the evolution of avian migration.
Journal of Avian Biology 33:433–436.