biotechnological potential of impacted scenarios for the ... · trabalho de projeto apresentado à...
TRANSCRIPT

Biotechnological potential of impacted scenarios for the restoration of TBT contaminated environments
Hugo Ricardo Soares Monteiro
Trabalho de projeto apresentado à Escola Superior de Turismo e Tecnologia do Mar do Instituto Politécnico de Leiria para a obtenção do grau de Mestre em Biotecnologia dos Recursos Marinhos, realizado sob a orientação científica do Doutor Marco Filipe Loureiro Lemos, Professor Adjunto da Escola Superior de Turismo e Tecnologia do Mar do Instituto Politécnico de Leiria e da Doutora Ana Cristina Esteves, Investigadora em Pós-doutoramento no Centro de Estudos do Ambiente e Mar e Departamento de Biologia da Universidade de Aveiro.
2011

ii
Title: Biotechnological potential of impacted scenarios for the restoration of TBT
contaminated environments
Copyright © Hugo Ricardo Soares Monteiro
A Escola Superior de Turismo e Tecnologia do Mar e o Instituto Politécnico de Leiria têm o direito, perpétuo e sem limites geográficos, de arquivar e publicar este trabalho de projeto através de exemplares impressos reproduzidos em papel ou de forma digital, ou por qualquer outro meio conhecido ou que venha a ser inventado, e de a divulgar através de repositórios científicos e de admitir a sua cópia e distribuição com objetivos educacionais ou de investigação, não comerciais, desde que seja dado crédito ao autor e editor.

iii
Agradecimentos
Queria agradecer em primeiro lugar à minha família, em especial aos meus pais,
por todos os esforços feitos para que pudesse prosseguir a minha formação. Espero que
tenha estado sempre à altura das espectativas.
Aos meus orientadores, Doutor Marco Lemos e Doutora Ana Cristina Esteves, pelo
apoio prestado para a concretização deste trabalho. Obrigado pela disponibilidade e
partilha de conhecimentos que me permitiram evoluir como investigador ao longo deste
trabalho.
A todos os meus colegas de laboratório, mestrado, da sala do GIRM, gabinete
técnico e bolseiros que, de forma direta ou indireta, contribuíram para a realização deste
trabalho. Agradecimento especial à Alcina Sousa, pelo apoio constante, por me aturar e me
ajudar a manter a minha sanidade mental. Tudo se torna mais simples quando temos
alguém sempre ao nosso lado. Particular agradecimento também à Rita Sousa, Joana
Furtado e Vera Teles pela ajuda oferecida numa fase crucial da minha tese.
À Kaori da Fonseca e Illyane Lima por me ajudarem, tolerarem, aturarem e
aguentarem durante grande parte deste trabalho e, depois de tudo, ainda conseguirem falar
comigo com um sorriso na cara.
À ESTM-IPL, ao Departamento de Biologia-UA e ao CESAM-UA pelo apoio e
instalações facultados e ao Prof. Doutor António Correia (CESAM) por me ter recebido no
seu laboratório.
Ao Luís Vala, colega, companheiro, amigo, pela influência que tiveste nesta fase e
terás para sempre na minha vida. Com muita saudade, dedico-te este trabalho.

iv

v
Resumo
O Tributil-estanho (TBT) é um composto organoestânico bastante utilizado na
formulação de tintas de barcos como anti-incrustante. Devido à sua ampla aplicação
industrial e consequente descarga para o ambiente, este composto tem sido reconhecido
como um problema ambiental de escala global devido à sua toxicidade em organismos
marinhos. Tendo sido por esta razão considerado como a substância mais tóxica alguma
vez introduzida no ambiente marinho.
Os microrganismos presentes em locais historicamente contaminados possuem a
capacidade de tolerar contaminantes e eventualmente de os degradar, o que pode
constituir um fator chave no restabelecimento de ambientes contaminados. No entanto,
os subprodutos resultantes da degradação de um poluente poderão ser tão ou mais tóxicos
que o composto original. A deteção de um composto através de procedimentos químicos
analíticos, embora importante, não fornece dados sobre a sua relevância ecológica, visto
que estes poderão não estar relacionados com a sua ecotoxicidade.
Neste estudo, bactérias resistentes ao TBT foram recolhidas em 7 portos de pesca
Portugueses (Póvoa de Varzim, Leixões, Aveiro, Figueira da Foz, Peniche, Setúbal e
Sines) e posteriormente isoladas na presença de concentrações crescentes de TBT (0.1, 1,
e 3mM). As bactérias tolerantes à concentração mais elevada foram caracterizadas por
genotipagem (REP-PCR) e o seu potencial de bioremediação foi avaliado em águas
contaminadas em laboratório.
A percentagem de microrganismos resistentes variou entre 0.08% (Setúbal) e
7.67% (Peniche). A análise de REP-PCR revelou um total de 111 perfis genéticos
distintos, sendo que Peniche foi o local com menos variabilidade, enquanto Figueira da
Foz foi o local com maior variabilidade. Os isolados selecionados foram usados em
ensaios de bioremediação e o seu potencial de bioremediação foi avaliado através de
ensaios ecotoxicológicos com o gastrópode Gibbula umbilicalis. Os ensaios
ecotoxicológicos realizados sugerem que algumas bactérias marinhas são capazes de
reduzir a toxicidade em águas contaminadas com TBT.

vi
Este estudo contribuiu com novos dados sobre a resistência ao TBT, no entanto,
estudos mais aprofundados na área da bioremediação do TBT mediada por bactérias
marinhas são ainda necessários, nomeadamente na compreensão dos mecanismos
associados à resistência e na identificação de vias e genes responsáveis pela sua
degradação.
Palavras-chave: Tributil-estanho, resistência ao TBT, bactérias marinhas, ecotoxicologia, genotipagem

vii
Abstract
Tributyltin (TBT) is an organotin compound commonly used as an antifouling
agent in marine paint formulations. Due to its wide industrial application and its
consequent discharge into the environment, TBT pollution is recognized as major
environmental problem at a global scale, being recently considered to be the most toxic
substance ever introduced into the marine environment.
Microorganisms from historically contaminated sites are able to tolerate pollutants
and even degrade them, which may be a key factor in the restoration of contaminated
environments. Nevertheless, byproducts resulting from the degradation process might be
more or less toxic than the parent compound to ecological relevant species. The
determination of the substance presence by analytical chemistry, although essential, may
not present ecological relevance, as it might not be related to its ecotoxicity.
In this study, TBT-resistant bacteria collected from 7 Portuguese ports (Póvoa de
Varzim, Leixões, Aveiro, Figueira da Foz, Peniche, Setúbal and Sines) were isolated in
increasing concentrations of the toxicant (0.1, 1, and 3mM of TBT) and those growing at
the highest concentration were characterized by genomic fingerprinting (REP-PCR) and
tested as potential bioremediation tool in laboratory contaminated media.
The percentage of TBT-resistant isolates varied between 0.08% (Setúbal harbor)
and 7.67% (Peniche). REP-PCR analysis revealed a total 111 distinct genetic profiles,
being Peniche the location with lower variability while Figueira da Foz had the highest
variability. Selected isolates were used to bioremediate waters contaminated waters, and
their potential as bioremediation tools was assessed through ecotoxicological testing with
the gastropod Gibbula umbilicalis. Ecotoxicological testing suggested that some TBT-
resistant bacteria are able to reduce the toxicity of TBT contaminated waters.
This study contributed to the understanding of TBT resistance, however more
intensive and focused research in the area of TBT bioremediation mediated by marine
bacteria is still needed, particularly on the mechanisms behind TBT resistance and on the
identification of pathways and genes responsible for TBT degradation.

viii
Keywords: Tributyltin, TBT resistance, marine bacteria, ecotoxicology, genomic
fingerprinting
ix
Parts of this work are published in the ISI journal Current Opinion in Biotechnology: Monteiro H.R., Esteves A.C., Soares A.M.V.M., Correia A.C., Lemos M.F.L. 2011. Bioremediation of TBT-contaminated marine waters by bacteria and ecotoxicological evaluation of its by products. Current Opinion in Biotechnology. 22, s38

x

xi
Table of Contents
Resumo .............................................................................................................................................. v
Abstract ........................................................................................................................................... vii
1. Background ................................................................................................................................... 1 1.1 Pollution of the marine environment .................................................................................... 1 1.2 Degradation processes of pollutants .................................................................................... 2 1.3 Endocrine Disruptor Compounds and Organotins ............................................................... 4 1.4 Toxic effects of TBT .............................................................................................................. 5 1.5 Human exposure to TBT ....................................................................................................... 7 1.6 TBT levels in water and regulation on its use ....................................................................... 8 1.7 Bioremediation of TBT .......................................................................................................... 9 1.8 Importance of ecotoxicological assays in Environmental Biotechnology .......................... 11
2. Objectives .................................................................................................................................... 13
3. Materials and Methods .............................................................................................................. 15 3.1 Sampling locations and collection ......................................................................................... 15 3.2 Chemical analysis of butyltins ................................................................................................ 16 3.3 Chemical preparation of TBT ................................................................................................ 16 3.4 Selective medium preparation ................................................................................................ 16 3.5 Microorganism isolation ........................................................................................................ 16 3.6 Extraction of genomic DNA ................................................................................................... 17 3.7 Rep-PCR genomic fingerprinting ........................................................................................... 18 3.8 Dice/UPGMA cluster analysis of REP-PCR genomic fingerprints ....................................... 18 3.9 Bacterial growth curve assessment ........................................................................................ 19 3.10 Acute test of tributyltin with Gibbula umbilicalis ................................................................ 19 3.11 Bioremediation assays .......................................................................................................... 19 3.12 Ecotoxicological testing of potentially bioremediated media .............................................. 20 3.13 Statistical analysis ................................................................................................................ 20
4. Results .......................................................................................................................................... 21 4.1 Physicochemical properties of port and harbor samples ....................................................... 21 4.2 Chemical analysis of butyltins of port and harbour samples ................................................. 21 4.3 Bacterial isolation and percentage of resistant bacteria ....................................................... 21 4.4 Rep-PCR genomic fingerprinting ........................................................................................... 22 4.5 Bacterial growth quantification in increasing tributytin concentrations ............................... 29 4.6 Tributyltin acute ecotoxicology assays .................................................................................. 30 4.7 Bioremediation and ecotoxicology assays ............................................................................. 30
5. Discussion and Conclusions ....................................................................................................... 33
6. Future prospects ......................................................................................................................... 45
7. References .................................................................................................................................... 47
8. Annexes ........................................................................................................................................ 55

xii

xiii
List of Figures
Figure 3.1 Map of Portugal with the locations of sampling sites. .............................................. 15
Figure 4.1 – Concentration of isolates at increasing concentrations of tributyltin (0, 0.1, 1 and 3mM) for all sampling sites. ........................................................................................................... 23
Figure 4.2 – Dendrogram showing genetic relatedness of isolated bacteria determined by analysis of REP-PCR fingerprint patterns using Dice similarity coefficient and UPGMA cluster methods. .............................................................................................................................. 27
Figure 4.3 – Growth curves of bacteria selected for bioremediation assays in the presence of tributyltin. ....................................................................................................................................... 29
Figure 5.1 - Chronic effects and acute toxicity of tributyltin, and tributyltin concentrations in the water column on the German North Sea coast. ..................................................................... 37
Figure 8.1 – Growth curves of total isolates. ................................................................................ 61

xiv

xv
List of Tables
Table 1.1 TBT Degradation Pathway through consecutive dealkylation by enzyme action ... 11
Table 4.1 Physicochemical properties of near-sediment waters from sampling sites .............. 21
Table 4.2 Generation time of selected isolates exposed to tributyltin and tributyltin-free media. ............................................................................................................................................... 30
Table 4.3 Median Lethal concentration values for all treatments after 48, 72 and 96 hours exposure in Gibbula umbilicalis ..................................................................................................... 31
Table 4.4 Percentage of Gibbula umbilicalis mortality registered in treatments with bacterial inoculum and seawater after 48, 72 and 96 hours ....................................................................... 32
Table 8.1 Generation time of isolates with and without TBT ..................................................... 55

xvi

1
1. Background
1.1 Pollution of the marine environment
The history of marine contamination goes as back as to the geologic beginning of
the planet. Nevertheless, population growth and increasing human activities in coastal
regions have generated a greater contaminant input threatening significantly and
dangerously global biodiversity and the productivity of marine ecosystems (Jenssen,
2003).
The ocean covers more than 70% of the Earth’s surface and therefore is a large
source of biological diversity (Targett et al., 2002). However marine pollution did not
receive much attention until adverse consequences on organisms and ecosystems were
evident (Islam and Tanaka, 2004). Since then, marine pollution has become a global
concern but even so, most developed nations are still producing substantial pollution loads
and the trends are expected to increase (Islam and Tanaka, 2004). Annually, an estimated
300 Mt of chemicals find their way into receiving watercourses mainly through industrial
effluents (Schwarzenbach et al., 2006).
In this scenario, mitigating the risks that pollutants pose to the environment and
human health is a major global concern and one of the greatest challenges for the 21st
century. In recent years many organizations made several efforts to help raise awareness to
take steps to halt biodiversity loss (e.g. the EU biodiversity strategy to 2020 and WWF).
In general, abnormalities suspected to be caused by exposure to toxic
environmental contaminants have been largely found and reported in marine life (Tanabe,
2002). For example, as reported by Tanabe (2002), since 1960s sterility, abortion,
stillbirths, diseases and strandings are increasing in marine mammals like pinnipeds and
cetaceans all over the world, with most of these abnormalities taken place during the 1980s
and the 1990s due to the incidence of organochlorines and other toxic contaminats. Other
undesirable consequences of pollution include the loss of nesting sites of turtles (Kasparek
et al., 2001), mortality, malformation and abnormal chromosome division of fish embryos
(Longwell et al., 1992) and the decline in populations of seabirds (Yorio et al., 2010).

2
Many pollutants accumulate in marine organisms, and later enter the food chain,
and therefore humans are often exposed to persistent organic pollutants (POPs) such as
polycyclic aromatic hydrocarbons (PAHs), polychlorinated biphenyls (PCBs) and some
heavy metals (Jenssen, 2003). Therefore today’s concern is focused not only towards the
impacts on wildlife and the environment but also towards human health.
1.2 Degradation processes of pollutants
As stated above, many compounds discharged into the aquatic environment are
toxic and persistent, not being easily removed during wastewater treatments (Peñuela and
Barceló, 1998). Once in the environment, most pollutants may undergo volatilization,
photolysis, chemical oxidation, adsorption or biodegradation (Haritash and Kaushik, 2009).
Most of modern society's environmental pollutants like organic and many inorganic
chemicals are subject to biodegradation, i.e., an enzymatic degradation through the
activities of living organisms (Crawford and Crawford, 2005).
Biodegradation is an important but poorly understood process that is crucial to all
mitigation strategies. Biodegradation may be applied to remove or detoxify pollutants that
threaten public health and to restore the environment, in a process termed bioremediation
(Crawford and Crawford, 2005). Usually, this process is carried out by microorganisms
such as bacteria, yeasts and microalgae or by plants and seaweeds (Bonaventura and
Johnson, 1997).
This approach, which is potentially more cost-effective than traditional techniques
such as incineration of soils, requires an understanding of how organisms transform
chemicals (and knowing the toxicity of the degradation products), how they survive in
polluted environments and how they should be employed in the environment (Crawford
and Crawford, 2005).
Among the current wide-ranging research in bioremediation, some studies are
focusing on identifying organisms that possess the ability to degrade specific pollutants
(Fingerman and Nagabhushanam, 2005).
Recent advances in molecular biology techniques have provided sensitive, rapid
and quantitative analytical tools for identifying and characterize microorganisms at species

3
and subspecies levels (Adiguzel et al., 2009; Girones et al., 2010). Genomic fingerprinting
of microorganisms i.e., the capability to differentiate individuals of the same phylotype,
have significantly evolved in the last years, by a series of methods that take avail of the
variations found in their DNA. Among these methods, repetitive sequence based
polymerase chain reaction (rep-PCR) is based on the usage of PCR primers
complementary to interspersed repetitive sequences (Adiguzel et al., 2009). This technique
enables the amplification of differently sized DNA fragments lying between these elements,
producing clearly resolvable bands by agarose gel electrophoresis (Versalovic et al., 1991).
BOX, ERIC (enterobacterial repetitive intergenic consensus) and REP (Repetitive
Extragenic Palindromic) elements are examples of evolutionarily conserved repetitive
sequences (Adiguzel et al., 2009). Rep-PCR fingerprinting is a well-established technique
for the differentiation of species genetically close to each other (Adiguzel et al., 2009; Xie
et al., 2008). Compared with other genomic fingerprinting techniques, such as RFLP
(restriction fragment length polymorphism) and RAPD (random amplified polymorphic
DNA), the reliability, reproducibility, low cost, high resolution and discrimination makes
rep-PCR advantageous especially when the targeting closely related strains (Rademaker
and de Bruijn, 1997;Trindade et al., 2003; Xie et al., 2008). However, although this
technique has already been applied extensively in taxonomy studies, relatively little work
has been done to determine the efficacy of using rep-PCR to characterize the diversity of
environmental samples (Xie et al., 2008).
The correct identification and classification of microorganisms is of extreme
practical importance for environmental biotechnology studies. With several detoxificating
microorganisms already identified, studies are being conducted to identify the mechanisms
whereby some pollutants are being removed from the environment (Fingerman and
Nagabhushanam, 2005). Several mechanisms have been proposed like immobilization,
which refers to the removal of contaminants, typically metals, by means of adsorption or
bioaccumulation by various microorganisms or plants (Evans and Furlong, 2010a).
Another important mechanism of detoxification is the transformation of toxic species into
inactive forms by reduction, methylation or precipitation (Cloirec and Andrès, 2005). Yet,
another mechanism of degradation consists on using the pollutant as a nutrient source.
Plants are also capable to remove degrade or sequester hazardous contaminants
from the environment, in a process known as phytoremediation (Glass, 2005). Although

4
some phytoremediation applications are believed to be carried out by rhizosphere bacteria,
the focus of phytoremediation is to use plants for this purpose (Glass, 2005). For example,
Radwan et al. (2000) reported that plants like the leguminous Vicia Faba can be used to
remove hydrocarbon from contaminated soils. Plants are also naturally capable of
accumulating large amounts of metals, pesticides, solvents and various organic chemicals,
(Evans and Furlong, 2010b; Glass, 2005) making them a potential solution to restore
contaminated environments.
1.3 Endocrine Disruptor Compounds and Organotins
In recent years there has been increasing concern about the possible consequences
of environmental exposure to a group of chemicals that are suspected to disrupt the normal
endocrine functioning of wildlife populations, causing adverse health effects in an intact
organism, its offspring, or (sub) population, the Endocrine Disruptor Compounds (EDCs)
(Hagger et al., 2006; Lemos et al., 2010a, 2011a). Some known EDCs, like chlordane
compounds (CHLs) and polychlorinated biphenyls (PCBs) have already attracted great
attention due to their severe toxicity, high accumulation potential in the body and
persistence in the environment, posing a great ecological risk (Tanabe, 2002). Also, in
2000 the European Commission (Groshart and Okkerman, 2000) published a list of
potential EDCs based on their persistence, evidences of endocrines disruption and wildlife
and human exposure. This list includes industrial chemicals such as plasticizers (e.g.
bisphenol A), flame retardants (e.g. PBBS) or biocides with antifouling properties
(organotin compounds).
Organotins are the most toxic pollutants for aquatic life known so far (Fent, 2006).
The discovery of the first organotin compound, di-ethyltin diiodide, was made by Edward
Frankland in 1849 and, until 1940s, the importance of these compounds was merely
scientific. Since then, many reports were published mentioning several practical
applications of organotins, such as PVC stabilizers (Thoonen et al., 2004) and as
antifouling agents (Dubey and Roy, 2003). Those are still the major applications of
organotins nowadays.

5
Of all know organotins, some of the most toxic are tributyltin (TBT) compounds
like tributyltin oxide (TBTO) and tributyltin chloride (TBTCl) (Carfi’ et al., 2008). TBT
compounds are organic derivatives of tin (Sn4+) characterized by the presence of covalent
bonds between three carbon atoms and a tin atom (Antizar-Ladislao, 2008). While
inorganic forms of tin are regarded as non-toxic, these lipid-soluble organotins can be
highly toxic (Gadd, 2000).
Tributyltin has been used extensively since 1960s as a toxic chemical for various
industrial purposes such as slime control in paper, as a wood preservative (Antizar-
Ladislao, 2008) and as a polyvinyl chloride (PVC) stabilizer (Mimura, et al., 2008). In the
1970s, TBT paints replaced copper-based paints due to a superior performance in terms of
efficacy and duration (Sonak, 2009). Since then, TBT has been used mostly as an
antifouling agent in marine paint formulations to prevent the attachment of barnacles and
slime on boat hulls and aquaculture nets (Kannan et al., 1998). In fact, TBT compounds are
the main active ingredients in biocides used to control a broad spectrum of organisms
(Fent, 2006), as it acts as a biocide for fungi, bacteria and insects (Mimura, et al., 2008).
Due to its widespread use as an antifouling agent in boat paints, TBT is a common
contaminant of marine and freshwater ecosystems. Due to high boat traffic, ports and
harbors waters and sediments are historically contaminated with TBT (Champ, 2003).
Tributyltin damaging consequences to marine ecosystems were recognized in early
1980s as the cause for the decline of oysters (Alzieu et al., 1982) Recently it has been
considered by some authors to be the most toxic substance ever introduced into the marine
environment (Antizar-Ladislao, 2008; Guo et al., 2010; (Sonak, 2009). This issue will be
further discussed below.
1.4 Toxic effects of TBT
Since that TBT is used in a variety of industrial processes, its subsequent discharge
into the environment, its fate, toxicity and human exposure are topics of current concern. It
has been reported that TBT causes impairments in growth, development and reproduction,
which ultimately may lead to the extinction of some populations (Guo et al., 2010).

6
Tributyltin from hulls and nets can be adsorbed onto suspended particles in the
water (Gadd, 2000), sediment and biota. Subsequently it is readily incorporated into the
tissues of filter-feeding zooplankton, invertebrates and eventually higher organisms such as
fish and mammals where it accumulates (Antizar-Ladislao, 2008). Nonetheless, research
undertaken since the early 1970s has shown that TBT is very toxic to a large number of
aquatic organisms than those targeted (Antizar-Ladislao, 2008).
Tributyltin is known as an endocrine disruptor that promotes adverse effects in
diverse organisms from snails to mammals (Guo et al., 2010). Two of the best-documented
adverse impacts of TBT in non-target organisms are imposex and intersex in prosobranch
snails (Matthiessen and Gibbs, 1998). Imposex occurs when male sex characteristics and
organs, such as penis and vas deferens, are superimposed on normal female gastropods
(Pavoni et al., 2007). The first clues linking TBT to imposex were reported in 1970 for
Nucella lapillus in the UK (Antizar-Ladislao, 2008). Since then several studies have
related TBT to the worldwide decline of marine molluscs is coastal areas due to imposex
(Pavoni et al., 2007). Imposex has also been associated with reduced fecundity, sterility,
population declines, and local extinctions of gastropod populations (Barroso et al., 2002;
Tewari et al., 2002) Additionally, marine invertebrates are extremely sensitive to TBT, and
imposex can be observed in gastropods at concentrations lower than 1 ng TBT L-1
(Gooding et al., 2003). Other major toxic effects of TBT include neurotoxicity and
immunotoxicity (Asakawa et al., 2010).
These are perhaps the most complete examples of ED studies caused by TBT in
wildlife populations. Although invertebrates dominate over 95% of the known animal
species (McClellan-Green et al., 2007) other examples for ED in invertebrates are scarce
and limited to laboratory studies.
At higher concentrations TBT may also be lethal to several marine and freshwater
species. Short and Thrower (1987) reported that the 96 hour LC50 for juvenile Chinook
salmon, (Oncorhynchus tshawytscha) is 1.5 µg L-1. TBT also appears to have distinct
effects on different life cycle stages. For example, the 96 hours LC50 for larval Pacific
oysters, Crassostrea gigas, is 1.6 µg L-1, whereas the value for adults of the same species is
282.2 µg L-1 (Thain, 1983).

7
In a study conducted by Guo et al. (2010) on Western clawed frog embryos,
Xenopus tropicalis the results suggested that TBT might be the cause of several
malformations. These include the loss of eye pigmentation, enlarged trunks and bent tails,
in the presence of 50 ng L-1 of TBTCl after 24 hours of exposure. This is particularly
relevant since the levels of TBT in open water, bays, estuaries, lakes and freshwater
harbors are commonly higher than 50 ng L-1. Highest TBT values can be found near
marinas and seaports. Although TBT levels have been decreasing in the last decades,
mainly due to restrictions in its use, it is still present at ng L-1 levels (Fent, 2006).
Concerning phytotoxicity, Turner et al. (2010) showed that concentrations of
antifouling paint particles of few mg L-1 significantly reduced the photosynthetic response
of the marine macroalgae, Ulva lactuca.
Furthermore, TBT has also been linked to malfunctions of mitochondria in some
species (Antizar-Ladislao, 2008). Due to its persistence in sediments, gastropods that live
on sediment may not recover for many years (Galante-Oliveira et al., 2010). Due with its
lipophilicity, it tends to accumulate in oysters, mussels, crustaceans, molluscs, fish, and
algae favouring the bioconcentration up the marine predators' food chain (Cruz et al., 2010;
Santos et al., 2009).
1.5 Human exposure to TBT
To what concerns human health, two main routes of exposure are generally
proposed: (1) direct ingestion of contaminated seafood and (2) indirect exposure from
household items containing butyltin compounds (Azenha and Vasconcelos, 2002). Studies
have shown that organotins leach from PVC and related materials, resulting in
contamination of foodstuff and beverages like drinking water and wine (Antizar-Ladislao,
2008; Chien et al., 2002; Forsyth and Jay, 1997). Although in recent years there has been a
significant increase of public concern on possible harmful effects of TBT on human health,
there is still limited data available on organotin deposition in humans. Most information is
estimated or extrapolated from rodent toxicity studies. Several experiments have suggested
that potential adverse effects of organotins in humans includes cardiovascular, respiratory
and reproductive deficiencies (Antizar-Ladislao, 2008). In vitro studies also suggest that
organotins may compromise the immune response in humans by affecting survival,

8
proliferation and differentiation of lymphocytes B and reducing natural killer cells (NK
cells) activity (Azenha and Vasconcelos, 2002).
Based on immunological studies, a Tolerable Daily Intake (TDI) value for TBT of
0.25 µg kg body weight−1 day−1 was established (Antizar-Ladislao, 2008). This TDI was
based on rat immunotoxicity, and takes a safety factor of 100 to account for some
uncertainties in human-rat toxicity extrapolation (Santos et al., 2009). It is now
internationally accepted and it has been adopted by the World Health Organisation (WHO,
1999) and by European Food Safety Authority (EFSA, 2004).
In order to improve the understanding of the risk involved in the consumption of
seafood, it has been suggested the calculation of the tolerable average residue levels
(TARL), which is defined as the daily amount of TBT in seafood that is tolerable for the
average consumer (Santos et al., 2009). Based on average seafood consumption, the TARL
for Portuguese consumers is 93 ng g wet weight−1. Santos et al. (2009) reported that four
bivalve samples selected from Portuguese markets displayed butyltin levels above TARL,
which indicates that bivalve consumers may be at risk, making TBT contamination more
than “just” an environmental issue of concern.
However more research is still needed to elucidate which is the ideal method for
estimating organotin destination and its consequences in humans, as well to uncover its
mechanism of toxicity in humans.
1.6 TBT levels in water and regulation on its use
As a result of field evidences of negative ecological impact of organotins, in 1989
the European Union published a directive (89/677/CEE) banning TBT on ships smaller
than 25 m (Santos et al., 2002). This legislation was adopted by Portugal a few years later
in 1993 (D.L. 54/93) (Santos et al., 2009). On the assumption that TBT concentrations in
the open sea were too low to cause effects there were not many restrictions on the use of
organotins in larger ships. However, a similar impact in the open sea as in coastal areas has
been shown for TBT with incidence of imposex being correlated with shipping density
(Santos et al., 2002). The International Maritime Organization banned the application of
TBT-based paints in 2003 and called for a global agreement for total prohibition of the

9
presence of organotins on ship hulls in 2008 (Antizar-Ladislao, 2008; Wang et al., 2010).
Albeit these restrictions, TBT is still present in water and sediments (Fent, 2006).
Levels in harbor and port waters prior to restrictions on TBT use in antifouling
paints have shown levels higher than 0.5 µg L-1 in North American and European marinas.
For example, in 1986, TBT concentrations in Wroxham Broad (Norfolk, England) and at
the nearby River Bure boatyard (Norfolk, England) were 0.9 µg L-1 and 1.5 µg L-1,
respectively (Waite et al., 1989). They were significantly higher than in open surface
waters, bays and estuaries where commonly values of up to 50 ng L-1 were observed (Fent,
2006). Highest TBT levels are still found near harbors and ports due to painting operations.
(Fent, 2006).
Albeit this regulation for the use of TBT, recent studies still indicate levels higher
than those reported to cause effects at a global scale: for example, 13 ng L-1 in South Korea
coastal waters (Sidharthan et al., 2002), an average of 6.8 ng L-1 in several Japanese coastal
waters (Takeuchi et al., 2004), and up to 200 ng L-1in Corsica, Western Mediterranean
(Michel et al., 2001).
Present restrictions will not immediately remove TBT and its degradation products
from the marine environment. TBT can be expected to remain in waters and sediments for
long periods of time because of the low degradation rates in anoxic sediments and their
widespread presence (Cruz et al., 2010; Santos et al., 2009).
1.7 Bioremediation of TBT
Once released from an antifouling coating, the fate of TBT will depend on physical
and chemical reactions as well on biological activity it is subjected to (Gadd, 2000).
Tributyltin is susceptible to degradation in water with half-lives ranging from few days to
several months in water (Cooney, 1988). Reported degradation half-lives for TBT include
2 months in seawater (5.5 months in marine sediment), 4 to 19 days in estuarine waters and
6 days in freshwater (4 months in freshwater sediment) Adelman D et al., (1990).
Maguire et al. (1983) demonstrated that TBT dissolved in water does not volatizes
after 2 months in the dark at 20ºC. Their results from experiments in water have also
indicated that abiotic degradation of TBT is limited to photolysis in surface water (Maguire

10
et al., 1983, 1985).
Several microorganisms have been reported to present resistance to organotins,
such as Aeromonas molluscorum Av27 and Aeromonas molluscorum G.N1.24, two
bacteria isolated from an estuarine environment, in Ria de Aveiro (NW Portugal) (Cruz et
al., 2007). These microorganisms may have an important role in organotins’ environmental
cycle and may be applied as TBT indicators in contaminated waters. Reactions known to
be carried out by bacteria and algae include accumulation, release and degradation of TBT
(Gadd, 2000; Luan et al., 2006).
Under favourable conditions TBT may be biodegraded through successive
dealkylation to produce dibutyltin (DBT), monobutyltin (MBT), and ultimately inorganic
tin, becoming progressively less toxic in the process (Table 1.1) (Dubey and Roy, 2003).
Dibutyltin is less toxic than TBT and its toxicity action is by blocking the
absorption of oxygen in the mitochondria, while MBT has no reported toxic effect on
mammals (Antizar-Ladislao, 2008). However, information on the mechanisms of TBT
degradation mediated by microorganisms in marine environments is still very limited
(Antizar-Ladislao, 2008). Some mechanisms have been proposed that could be involved in
TBT degradation by bacteria, like metabolic consumption as a carbon source (Kawai et al.,
1998) or bioaccumulation into the cell (Cruz et al., 2007). Because of its persistence and
slow degradation it is valuable to use microorganisms for TBT degradation.
Given the function played by bacteria in biogeochemical cycles, the identification
and characterization of TBT pollutant-degrading bacterial strains is crucial. Knowledge of
their physiology and genetics is fundamental for their future application as natural
decontamination agents. For example, several studies reported that most TBT-resistant
bacteria possess plasmids, which might codify for TBT resistance. (Baya et al., 1986; Cruz
et al., 2007; Wuertz et al., 1991). Moreover, TBT-resistance has also been associated to
resistance to drugs, heavy metals and other contaminants (Suehiro et al., 2007; Baya et al.,
1986; Suzuki et al., 1992; Wuertz et al., 1991).

11
1.8 Importance of ecotoxicological assays in Environmental Biotechnology
Bioremediation processes should be taken into account when removing pollutants
from the marine environment, as it is emerging as an effective and economically viable
alternative to traditional techniques. However, from biodegradation processes can result
unexpected outcomes and consequences. For example, a xenobiotic pollutant might be
mineralized, transformed to another compound that may be toxic and bound to natural
materials in soils, sediments or waters (Crawford and Crawford, 2005).
Table 1.1 TBT Degradation Pathway through consecutive dealkylation by enzyme action
Compound Formula Chemical
Structure Enzyme
Tributyltin (TBT)
C12H27Sn+
TBT dioxygenase
β-hydroxybutyl-
dibutyltin C12H27OSn+
DBT dioxygenase
Dibutyltin (DBT) C8H18Sn2+
β-hydroxybutyl-butyltin C8H18OSn2+
MBT dioxygenase
Monobutyltin (MBT) C4H9Sn3+
β-hydroxybutyltin C4H12OSn3+
Sn4+ Sn
Adapted from “Biocatalysis/Biodegradation Database” University of Minnesota; http://umbbd.msi.umn.edu/ last updated 12 October 2011 and Antizar-Ladislao (2008).

12
After the treatment with bacteria, it is important to assess if the pollutant was
degraded into a less toxic compound and/or less bioavailble. Analytical chemistry provides
information on abundance or presence of a particular substance in a sample, although no
information is provided on its toxicy. Hence it is also necessary to perform
ecotoxicological assays. These assays are very useful to understand the effects of any
chemical toxicants on ecologically relevant species (Lemos et al., 2010b). With these tests
it is possible to observe the effect of a toxicant on ecologically relevant species, and
therefore evaluate the pollutant and its degradation products toxicity. Gastropods and
bivalves are among the most sensitive organisms to the toxic effects of organotins (Santos
et al., 2002).
Gibbula sp. is a genus of sea snails, marine gastropods of the family Trochidae
inhabiting the upper intertidal zone on rocky shores. Many of them are very tolerant to
sewage discharges and heavy metals, living around the high tide mark with only brief
periods of immersion (Ali and Bream, 2010). As prosobranch snails, Gibbula sp. can be
used as biomarker of TBT environmental concentrations (Galante-Oliveira et al., 2010).
These gastropods are known to be the animal group most sensitive to TBT, with several
malformation symptoms being reported (Nehring, 2000). Also, this group of gastropods is
largely affected by imposex and intersex, making them a focus group for TBT effects.

13
2. Objectives
The present study aimed to isolate TBT-resistant bacteria collected from
Portuguese ports and evaluate their ability to bioremediate TBT into less toxic compounds
through ecotoxicological assays.
The specific aims of this study were:
- Isolate bacteria highly resistant to TBT;
- Characterize TBT-resistant bacteria by REP-PCR and test them as potential
bioremediation tool in laboratory contaminated waters through ecotoxicological
assays;
- Optimize acute ecotoxicological assays for TBT using Gibbula umbilicalis as a
model organism and calculate the median lethal concentration (LC50).

14

15
3. Materials and Methods
3.1 Sampling locations and collection
The water samples were collected from 7 Portuguese ports (Figure 3.1):
Location 1 – Póvoa de Varzim (V; 41.376120,-8.766945);
Location 2 – Leixões (L; 41.195238,-8.684177);
Location 3 – Aveiro (A; 40.645899,-8.727098);
Location 4 – Figueira (F; 40.146848,-8.849176);
Location 5 – Peniche (P; 39.355422,-9.375479);
Location 6 – Setubal (St; 38.521228,-8.887277);
Location 7 – Sines (S; 37.950219,-8.864599).
Figure 3.1 Map of Portugal with the locations of sampling sites.
2
1
3
4
5
6
7

16
These ports were selected because they are amongst the Portuguese ports with
highest marine traffic. Also, because they are located in different latitudes, it is expected to
have distinct physicochemical properties, and different bacterial communities. All samples
were collected during low tide using a Van-Dorn water sampler 50 cm above the sediment
level. Water parameters (pH, salinity, temperature, dissolved oxygen and depth) were
measured with a Hanna HI 9828 (Hanna Instruments, Italy) multiparameter meter. A total
of 2 L was collected at each sampling site, of which 1 L were used for chemical analysis
(500 mL for heavy metals analysis and 500 mL for butyltins (TBT, DBT and MBT)
analysis). Samples were transported to the laboratory in an icebox and processed within 8 h.
3.2 Chemical analysis of butyltins
Chemical analyses of butyltins were made at the Laboratório de Análises do
Instituto Superior Técnico (Lisbon, Portugal). Samples were derivatised with
tetraethylborate and analysed by GC-MS, using an RTX-5MS column (30mm x0.25 mm x
0.25 µm). Monobutyltin chloride, Dibutyltin chloride and tributyltin chloride were used as
standards. Quantification was achieved by comparison with an internal standard.
3.3 Chemical preparation of TBT
TBT (tributyltin chloride, purity 96%; Sigma-Aldrich, Spain) stock solution was
prepared in absolute ethanol and stored in the dark at room temperature.
3.4 Selective medium preparation
Microbial selective growth medium was prepared with Tryptic Soy Agar (TSA)
medium (Sharlau, Spain) supplemented with 1.5% (w/v) NaCl (Sharlau, Spain). TSA was
also supplemented with 0.1, 1 and 3 mM TBT by adding the proper volume of TBT stock
solution and adjusting the total volume of ethanol in media to 1% (v/v). This procedure
was performed under sterile conditions.
3.5 Microorganism isolation
Membrane filtration technique was used for the processing of all water samples.
Briefly, water samples were filtered in vacuum through a membrane filter with pore size
0.45 µm and 47 mm in diameter (Sartorius Stedim Biotech, Germany), in which

17
microorganisms get concentrated on its surface. Different volumes were filtered of each
sample, to ensure that for every concentration colony forming units (cfu) in the filter were
between a countable number of 9 and 90, and only those included in this range were
considered. These filters were then placed on the top of the medium in 50 mm diameter
plates and incubated at 30 °C for 48 hours. Three replicates of each sample and
concentration were made. Colony forming units were then counted and all 3mM
TBT-resistant bacteria of 1 random plate per location were isolated and purified by
streaking technique.
3.6 Extraction of genomic DNA
Bacterial stocks were maintained both in TSA containing 3mM of TBT at 4ºC and
in glycerol (Sharlau, Spain) stocks at -80ºC Tryptic Soy Broth (TSB) (Sharlau, Spain) with
20% (v/v) of glycerol. Before the extraction process fresh cultures were prepared.
The extraction began with the inoculation of one colony in 500 µL of TSB, which
was incubated overnight, at 30ºC and 200 rpm in an orbital shaker (heidolph titramax
1000). Subsequently, 250 µL of the culture were transferred into a sterile microtube. Cells
were pelleted by centrifugation for 5 min at 15680 g and resuspended in 50 µL TE buffer
(10 mMTris, 1 mM EDTA). Cell lysis was induced with 5 µl of Lysozyme (from hen egg
white, 10 mg/mL; Sigma, Switzerland) followed by 1 hour incubation at 37ºC and then by
50 µL of Lysis Solution (Genomic DNA purification kit, Fermentas, Germany) followed
by a 10 minute incubation at 65ºC. One hundred µL of chloroform (Fisher Scientific,
United Kingdom) was added and thoroughly mixed with the lysate before spin 5 min at
15680 g. Aqueous phase was then transferred to another microtube, mixed with 100 µL of
isopropanol (Panreac, Spain) and centrifuged at 15680 g during 10 min. Afterwards the
supernatant was removed and the pellet washed with 100 µL of 70% (v/v) ethanol. After
centrifugation (5 min, 15680 g) the supernatant was discarded and the pellet dried at room
temperature. Lastly the pellet was resuspended in 50 µL of TE buffer and stored at -20ºC.
DNA quality and extraction efficiency were evaluated through electrophoresis in
0.8% (w/v) agarose gel at 80 V for 80 min in 1xTAE buffer (40 mM Tris, 20mM acetic
acid, 1 mM EDTA) and stained in ethidium bromide solution (10 µg Etbr /L 1× TAE
buffer).

18
3.7 Rep-PCR genomic fingerprinting
Rep-PCR was conducted to obtain the genomic fingerprinting of the isolated
bacteria. This technique allowed to verify the diversity of the samples, but also enabled to
select only the isolates with distinct genetic patterns for subsequent assays. The primers
used for this reaction were: REP1R (5' IIIICGICGICATCIGGC 3') and (REP2I 5’
ICGICTTATCIGGCCTAC 3') (Stab Vida, Portugal) (Adiguzel et al., 2009). Briefly,
24 µL of reaction cocktail was prepared as follows: 11.15 µL of ultrapure water, 5 µL of
5x buffer (Promega, USA), 3 µL of MgCl2 (25mM) (Promega, USA), 1.5 µL of dNTP
solution (2mM of each dNTP (Bioline, UK), 1.25 µL of DMSO (99.5%; Sigma, USA), 1
µL of each primer at 10mM and 0.1 µL of taq DNA Polymerase (Promega, USA). Lastly,
1 µL of extracted DNA was used as a template in a 25 µL reaction mixture. A negative
control (no DNA) was included in each PCR assay. The whole process was conducted on
ice and in sterile environment. PCR amplification reactions were performed with a
thermocycler (MyCycler Thermal Cycler, BIO-RAD) using the following conditions: an
initial denaturation at 95 °C for 5 min followed by 30 cycles consisting of denaturation at
94ºC for 1 min, annealing at 40ºC for 1 min and extension at 65ºC for 8 min. A final
extension at 65ºC for 16 min was performed before cooling at 15ºC. The PCR products
were then stored at -20ºC. Twenty microliters of the PCR products were examined by
agarose gel (1.5% w/v) at 80v for 150 min and stained in ethidium bromide solution and
analyzed by Dice/UPGMA cluster analysis, after image acquisition of a Gel-Doc (Bio-
Rad).
3.8 Dice/UPGMA cluster analysis of REP-PCR genomic fingerprints
Banding patterns were analyzed with the software GelCompar II (version 3.0;
Applied Maths, Kortrijk, Belgium). Relationships between the PCR-generated patterns
were examined through cluster analysis using the unweighted pair-group method with
average linkages (UPGMA) (Tacão et al., 2005). Similarity between fingerprints was
calculated with the Dice coefficient. Patterns with more or equal to 94% similarity were
regarded as the same - this similarity level was determined using control samples in all
agarose gels.

19
3.9 Bacterial growth curve assessment
All selected isolates (different phylotypes) were transferred to 6 mM media. After
this, isolates that grew in these conditions were then grown in triplicates in a 96 well plate
with increasing concentrations of TBT (0, 1, 3 and 6 mM in TSB), and incubated at 160
rpm on a orbital incubator (Stuart Scientific SI50), at 30ºC. Isolates were previously grown
until reaching an O.D. of 0.600 to standardize growth conditions. After this, same isolates
were grown. Absorbance was read at 570nm in a Labsystems Multiskan EX well plate
reader (Helsinki, Finland) at every 30 minutes until reaching the stationary phase. After
this growth curves were plotted and bacterial generation time was calculated.
3.10 Acute test of tributyltin with Gibbula umbilicalis
The test organism used in this assays was the sea snail Gibbula umbilicalis (da
Costa, 1778), collected in the coast of Peniche (Portugal; 39.368773, -9.378371) during
low tide. The tested organisms were then acclimated in glass tanks with clean seawater
(adjusted to 34 PSU with distilled water) at 20 ± 1 ºC for 15 days with a photoperiod of
16h:8h light:dark, and fed ad libitum with the macroalgae Ulva lactuca (Linnaeus, 1753)
collected in the Mondego estuary during low tide (Portugal; 40.118491, -8.830175). Prior
to conducting an ecotoxicological test, organisms with approximate shell length sizes were
chosen (10 ± 2 mm) and kept for 24 hours without food. Organisms were individually
exposed in 60 mL glass flasks filled to the top and covered with tulle netting to prevent
their escape but assuring proper aeration and animal submersion and left in same
conditions described above for cultures, but unfed. The sea snails were exposed to
increasing dilutions of the media with clean seawater to obtain nominal concentrations of:
0.01; 0.05; 0.2; 0.5; 1; 2; 5; 10; 25; 50; and 100 µg L-1. Eight replicates were used for each
concentration and after 48, and 96 hours, mortality was checked and the LC50 determined.
3.11 Bioremediation assays
To select isolates for bioremediation assays, selected microorganisms were exposed
to a high concentration of TBT (6 mM) in TSA medium for 48 hours. A total of 66 isolates
grew in these conditions and their growth curve was measured until stationary phase. To
determine the potential of the selected microorganisms to bioremediate TBT contaminated

20
media, glass bottles were filled with 250 mL of sterile seawater (34 PSU) contaminated
with 500 µg L-1 of TBT. Selected bacteria were grown overnight in TSB and the inoculum
was then individually added to these contaminated media - 0.1% TSB, O.D. = 0.600 at 570
nm. To one treatment 0.1% of sterile TSB was added. Simultaneously, glass bottles with
250 mL of sterile seawater and each bacterial inoculum (0.1% TSB, O.D. = 0.600 at 570
nm) were kept in the same conditions to assess possible toxic effects of each tested bacteria.
Three replicates were made for each of the mentioned treatment. This apparatus was kept
in the dark for 48 hours at 20 ± 1 ºC. After that period the bottle content was filtered (0.45
µm pore size, cellulose nitrate filter) transferred to dark glass bottles and kept at -20ºC
until chemical analysis were made. For the ecotoxicological testing, replicates were pooled
and stored in the cold until used (in less than 8 h).
3.12 Ecotoxicological testing of potentially bioremediated media
To assess different toxicity between potentially bioremediated and non-
bioremediated treatments, an acute test with Gibulla sp. was performed (same condition as
described in 3.10). The sea snails were exposed to increasing dilutions of the media with
clean seawater to obtain dilutions of: 20; 12.2; 7.6; 4.6; 2.8; 1.8; 1; 0.7 and 0.4% of the
initial media. These concentrations were chosen after prior range-finding tests (results not
shown). Eight replicates were used for each concentration and after 48, 72, and 96 hours,
mortality was checked and the LC50 determined.
3.13 Statistical analysis
One-way analysis of variance (ANOVA) was used to analyze data among
treatments, followed by Dunnett test (when applicable) to discriminate significant
differences between treatments and controls. When applicable, results are presented as
mean ± SEM. These analyses were performed using GraphPad Prism 5 for Mac. Median
lethal concentration was determined using Probit analysis (Finney, 1971) with StatPlus for
Mac. The significance level was inferred at P<0.05 for all statistical tests.

21
4. Results
4.1 Physicochemical properties of port and harbor samples
The physicochemical properties (pH, salinity, temperature, conductivity, dissolved
oxygen (DO) and collection depth of sampled waters are described in table 4.1.
Table 4.1 Physicochemical properties of near-sediment waters from sampling sites
Physicochemical properties
Póvoa de Varzim Leixões Aveiro
Figueira da Foz Peniche Setúbal Sines
pH 8.7 8.9 8.1 8.3 7.8 8.8 9.0
Salinity (‰) 34.5 34.2 37.4 37.3 31.8 27.9 34.8
Temperature (ºC) 13.6 14.4 11.5 13.5 17.8 15.8 16.1
Conductivity (WS.cm-1) 46.3 46.3 52.9 46.2 43.8 39 47.3
Dissolved Oxygen (%) 92.5 48.0 82.0 76.0 69.3 99.9 99.0
Depth (m) 3.0 8.0 7.5 5.0 6.5 3.5 4.0
4.2 Chemical analysis of butyltins of port and harbour samples
The concentration of butyltins (MBT, DTB and TBT) was below 50 ng L-1 on all
near-sediment sampled waters.
4.3 Bacterial isolation and percentage of resistant bacteria
Bacterial growth was witnessed for all seawater samples at every TBT
concentration tested and the results are represented in the form of colony forming units per
milliliter (cfu mL-1) (figure 4.1 – a to g).
It is possible to observe for all sampled locations that with increasing
concentrations of TBT, the number of colony forming units per milliliter decreases and
consequently the percentage of resistant bacteria compared to the control is also lower
(values above bars on figure 4.1). At 0.1 mM, Póvoa de Varzim had the highest percentage
of resistants’ (45.46 ± 6.83%) while Setúbal had the lowest (2.56 ± 0.65%). Regarding

22
1 mM and 3mM concentrations, Peniche had the highest percentage rate (8.20 ± 0.53% and
7.67 ± 1.82% respectively) as well the highest number of colony forming units per
milliliter values (410 ± 26 cfu mL-1 and 383 ± 91 cfu mL-1 respectively). On the other hand
Aveiro (0.26 ± 0.09%) and Setúbal (0.08 ± 0.03%) had the lowest percentage of resistants’
for 1 mM and 3 mM, respectively.
Aveiro also had the lowest cfu mL-1 in the control, while Peniche had the highest.
Statistically significant differences were observed for all locations between selective media
and control groups (ANOVA, Dunnett’s test, P < 0.05).
A total of 157 isolates resistant to 3mM TBT were isolated from the 7 ports and
used in subsequent assays.
4.4 Rep-PCR genomic fingerprinting
Due to high TBT pressure, it was expected that despite the high number of bacteria
isolates there would be a low level of variability. Thus all isolates were subjected to rep-
PCR genomic fingerprinting using primer sets corresponding to REP elements. Several
bacteria exhibited similarities on their profiles. For this purpose rep profiles with more or
equal to 94% similarity were regarded as the same (this similarity level was determined
using control samples in all agarose gels) (Figure 4.2). The sample with the highest
variability was Figueira da Foz (21 out of 23 different isolates) and the sample with the
lowest was Peniche (5 out of 30 different isolates). Similarity among isolates ranged from
37.5% to 100%. A total of 111 isolates were acknowledged as different through this
genomic fingerprinting technique.

23
Figure 4.1 – Concentration of isolates (cfu mL-1) at increasing concentrations of tributyltin (0, 0.1, 1 and 3mM) for all sampling sites (a – Setúbal; b – Sines; c – Póvoa de Varzim; d – Aveiro; e Figueira da Foz; f – Peniche; g – Leixões). Asterisk (*) indicates signifcant diferences between treatments and control with p ≤ 0.05.
*
* *
*
* *
*
* *
*
* *
*
* *
*
* *
* * *
a) b)
c) d)
e) f)
g)

24

25

26

27

28
Figure 4.2 – Dendrogram showing genetic relatedness of isolated bacteria determined by analysis of REP-PCR fingerprint patterns using Dice similarity coefficient and UPGMA cluster methods. Based on control samples, isolates clustered together to the right of red line (94%) are regarded as being the same phylotype.

29
4.5 Bacterial growth quantification in increasing tributytin concentrations
As previously stated selected isolates were grown in 96 well plates in increasing
concentrations of TBT (from 1mM to 6mM). A selection of 5 isolates for subsequent
assays was made according to their sample location and higher growth in the presence of
the highest concentrations of TBT. Bacteria selected for bioremediation assays were the
ones previously labeled as S13, F3, L31, St11 and V11. The growth curves of these
bacteria are represented in figure 4.3 and generation times are presented in table 4.2 (for
the remaining growth curves please refer to the annex).
Figure 4.3 – Growth curves of bacteria selected for bioremediation assays (a- L31; b- S13; c – F3; d – St11; e- V11) in the presence of tributyltin. Graphics plotted as mean ± SEM.

30
Table 4.2 Generation time of selected isolates exposed to tributyltin and tributyltin-free media.
Isolate Generation time (h)
Control 1 mM 3mM 6mM
L31 1.62 2.06 2.72 2.57 S13 3.13 3.15 2.81 3.10 F3 1.39 1.45 2.66 2.39
St11 2.40 2.15 2.68 3.57 V11 2.24 3.06 2.96 2.90
It is possible to observe that the growth of all isolates was affected by the presence
of TBT, being S13 the less affected isolate. No specific pattern was detected between
generation times of all isolates.
4.6 Tributyltin acute ecotoxicology assays
Median lethal concentration was calculated for Gibbula umbilicalis exposed to
TBT contaminated contaminated seawater. The LC50 (confidence interval) values for 48
and 96h were 61.45 µg L-1 (39.85 µg L-1 - 124.92 µg L-1) and 15.69 µg L-1 (9.59 µg L-1-
25.56 µg L-1), respectively.
4.7 Bioremediation and ecotoxicology assays
Median lethal concentration was calculated for Gibbula umbilicalis exposed to
contaminated and potentially remediated water. The LC50 values as well the 95%
confidence interval for each treatment are presented in table 4.3. The LC50 values are
presented as a percentage of the initial contaminated solution (500 µg L-1).
After 48 hours of exposure it was only possible to determine the LC50 for the
control treatment (TBT aerated for 48 h) with a LC50 of 16.83% (12.26% - 40.07%). For
all treatments with the bacteria the LC50 was above the highest concentration tested (20%
of the initial solution). After 72 hours, the control treatment had the lowest LC50 value,
8.58% (6.70% – 10.88%), compared to all other treatments. For the treatment with S13 the
LC50 was still above test concentrations. After 96 hours, once again the control treatment
had the lowest LC50, 5,07% (4.01% - 6.58%), while the treatments with L31 [11.19%
(8.35% - 16.15%)], V11 [13.66% (9.80% - 25.02%)] and S13 [19.78% (15.13% -
145.97%)] had the highest values of LC50.

31
Table 4.3 Median Lethal concentration values for all treatments after 48, 72 and 96 hours exposure in Gibbula umbilicalis
Hours after exposure Treatment LC50 (%) 95% Confidence Interval
48h
Control (TBT) 16.83 12.26 - 40.07
S13 + TBT >20 n.d.
F3 + TBT >20 n.d.
L31 +TBT >20 n.d.
St11 + TBT >20 n.d.
V11 +TBT >20 n.d.
72h
Control (TBT) 8.58 6.70 - 10.88
S13 + TBT >20 n.d.
F3 + TBT 17.45 11.33 - 61.75
L31 +TBT 12.84 9.49 - 20.32
St11 + TBT 9.46 6.55 - 15.98
V11 +TBT 17.38 12.14 - 50.57
96h
Control (TBT) 5.07 4.01 - 6.58
S13 + TBT 19.78 15.13 - 145.97
F3 + TBT 9.48 6.36 - 17.47
L31 +TBT 11.19 8.35 - 16.15
St11 + TBT 6.23 4.41 - 9.18
V11 +TBT 13.66 9.80 - 25.02
As mentioned in section 3.10, glass bottles with seawater plus bacterial inoculum
were kept in the same conditions as the other treatments. Gibbula umbilicalis individuals
were exposed to increasing dilutions of these solutions. It was observed that these solutions
at 100% concentration, for S13 and L31 inoculums, killed all tested individuals. However
below 20% of the initial solution (corresponding to the highest dilution tested on
bioremediation treatments) no mortalities were registered during the 96 hour period in any
treatments (Table 4.4).

32
Table 4.4 Percentage of Gibbula umbilicalis mortality registered in treatments with bacterial inoculum and seawater after 48, 72 and 96 hours
Treatment Concentration
(%) 48h mortality
(%) 72h mortality
(%) 96h mortality
(%)
S13 + Salt water
100 100 100 100 20 0 0 0 10 0 0 0 5 0 0 0
L31 + Salt water
100 100 100 100 20 0 0 0 10 0 0 0 5 0 0 0
F3 + Salt water
100 0 0 0 20 0 0 0 10 0 0 0 5 0 0 0
St11 + Salt water
100 0 0 0 20 0 0 0 10 0 0 0 5 0 0 0
V11 + Salt water
100 0 0 0 20 0 0 0 10 0 0 0 5 0 0 0

33
5. Discussion and Conclusions
In order to isolate and evaluate TBT-resistant bacteria, Portuguese port and harbor
water samples were exposed to high concentrations of TBT in TSA medium. Previous
studies have reported these heavily impacted sites as sources of bacteria with tolerance and
degrading capabilities (Cruz et al., 2007). In the same study for samples collected in the
Ria de Aveiro (Portugal) 3 mM resistant bacteria were regarded as highly resistant. In this
study we searched for 0.1; 1 and 3 mM resistant bacteria. According to the data shown in
figure 4.1 it is possible to observe that the concentration of TBT in the medium has
influence on bacteria growth. The number of cfu mL-1 in the media with and without the
contaminant is significantly different, supporting that the media with TBT limit the
organisms that are able to grow and are very selective when compared to the control. In all
sampled locations, there was a decrease in the number of cfu mL-1 as the concentration
increases, meaning also that the number of resistant bacteria is concentration dependent.
For all sampled locations, at 0.1 mM the microorganisms’ growth was already affected
with a decline of at least 50% of cfu mL-1 when compared to the control, implying that this
concentration is already considerably toxic (ANOVA, Dunnett’s test, P < 0.05).
Seaport waters and sediments are due to be historically contaminated with several
pollutants such as heavy metals, PCBs and PAHs (Rank, 2009; Lepland et al., 2010),
making these environments more selective for bacteria since they have to develop
mechanisms to adapt and be stable in such conditions (Ferrer et al., 2007). TBT resistance
mechanisms are usually associated to the resistance of drugs, organic solvents and heavy
metals (Suheiro et al., 2007), which might explain the presence of high numbers of TBT-
resistants’ in all locations and concentrations. In Peniche, it is possible to observe that the
percentage of resistant bacteria did not vary much within TBT concentrations (0.1 – 3 mM).
Peniche was the also the location where there was the highest percentage of resistant
bacteria at the highest concentration tested. These results might be explained by the
possibility of this location having the highest levels of contaminants and also because the
initial pool of microorganisms was the highest from all samples tested
(5000 ± 513 cfu mL-1), increasing the chances to find more resistants’.
It may be expected that there is a connection between the occurrence of TBT-

34
resistant bacteria and the levels of TBT in water and sediment; however some studies
demonstrated that this supposition is not correct. Suehiro et al. (2007) reported that the
occurrence of TBT-resistant bacteria was not correlated with the occurrence of TBT in
sediment from and near the Mekong River in Indochina. In the same line of work, Wuertz
et al. (1991) reached a similar conclusion in estuarine samples from Boston Harbor,
suggesting other factors and chemicals might determine whether populations become
resistant to TBT. For example, Suzuki et al. (1992) demonstrated that there is a correlation
between cadmium and TBT tolerance. Wuertz et al. (1991) observed that their TBT-
resistant organisms were all resistant to copper and most of them were also resistant to
other heavy metals like lead or zinc. Moreover, most TBT-resistant bacteria have multiple
antibiotic resistances (Baya et al., 1986; Wuertz et al., 1991) Hence it is clear that
resistance to metals and antibiotics are common among TBT-resistant organisms (Suehiro
et al., 2007; Wuertz et al., 1991). However, further monitoring and experimental studies
are required to elucidate the mechanism of TBT-resistant bacteria occurrence (Suehiro et
al., 2007). In the present work the water samples were analyzed for their content in
butyltins (TBT, DBT, and MBT) but quantifiable levels were not found (<50 ng L-1).
Despite this, we cannot exclude that although not quantifiable, due to this chemical
extremely high toxicity, small concentrations might be available and thus conferring
resistance to these microorganisms. Also, it cannot be excluded that these environments
could have been previously contaminated with TBT and the natural occurring bacteria
were able to restore these contaminated environments, and therefore justifying their
presence in this areas and the non-quantifiable butyltins. Moreover, further work must be
done in analytical chemistry to quantify other contaminants that, as stated above, might
confer bacteria TBT tolerance (e.g., heavy metals).
In this study it was noticed that some of TBT-resistant isolates contained plasmids
in high number (data not shown). Similar results were perceived by Baya et al. (1986) and
by Wuertz et al. (1991), they found that many TBT-resistant isolates, besides having
multiple antibiotic and heavy-metal resistances also contained plasmids. These plasmids
might play an important role in TBT resistance and possibly in the transfer of TBT
resistance between microorganisms (Cruz et al., 2007; Miller et al., 1995). However
genetic studies on TBT-resistant and degrading bacterial strains are limited and the
involvement of plasmids in resistance to organotins has not been properly addressed to

35
date. Nonetheless, Miller et al. (1995) reported that the plasmid pUM505, known to encode
chromium resistance in Pseudomonas aeruginosa, also confers resistance to TBT.
Understanding the involvement of plasmids in bacterial resistance to TBT will be
important for further applications of TBT-degrading bacteria in situ and genetic
engineering for ex-situ use.
Nevertheless, TBT resistance is not exclusively associated with plasmids, since not
all TBT-resistant bacteria contain plasmids. Jude et al. (2004) described the mechanism of
TBT resistance in Pseudomonas stutzeri 5MP1. This resistance is associated with the
presence of an operon called tbtABM (Jude et al., 2004), which is linked to multidrug
resistance such as the resistance-nodulation-cell division (RND) efflux pumps system
(Suehiro et al., 2007). These pumps are the most important multidrug resistance efflux
system in gram-negative bacteria and they export antibiotics, biocides, dyes, detergents,
organic solvents and heavy metals (Suehiro et al., 2007). This mechanism might explain
the resistance to TBT of several bacteria, especially gram-negative bacteria. However there
is no evidence that this mechanism might be associated with TBT degradation or removal
from surrounding environment. Fukagawa and Suzuki (1993) also characterized a
chromosomal gene involved in TBT resistance in a strain of Alteromonas sp. that is devoid
of any plasmids.
To characterize 3 mM resistant bacteria, rep-PCR method was used in this study for
molecular typing of 157 isolates. This technique is based on the amplification of DNA
fragments lying between interspersed repeated sequences and DNA primers corresponding
to one of these sequences (REP elements) were used. Although this technique has been
widely applied in diversity and taxonomic analysis of various bacteria species, relatively
little work has been done to determine the efficacy of using rep-PCR to identify diversity
of environmental isolates (Xie et al., 2008).
Relationships between the PCR-generated patterns were examined through cluster
analysis (Figure 4.2). Among the 157 isolates examined, 111 different banding patterns
were identified. Peniche port, despite having the highest rate of tolerants had the lowest
diversity, with only 5 distinct banding patterns identified out of 30 isolates. Additionally,
the similarity between these isolates was above 79%, suggesting that these isolates are
genetically close to each other. This lower diversity might be explained with adverse

36
conditions resulting from contamination by marine traffic. It is known that in stressed
environments, the diversity is usually lower due to selectivity of surrounding environment
(Haller et al., 2011). However this is just a presumption since there is no available data of
contamination in Peniche’s port and the results of chemical analysis on heavy metals of
collected samples are not yet available. Moreover, there are not isolates from different
sampling sites clustering together. This suggests that all samples locations have distinct
microbial communities. As mentioned before, Peniche’s port had the highest percentage of
resistant bacteria at higher concentrations of TBT, however the genomic fingerprinting
analysis revealed that the diversity of this sample was indeed very low. These results
suggest that the TBT-resistant bacteria are very common in this location, which might be
associated with a previously contamination of TBT as usual nearby ports and harbors.
However the initial diversity of the sample could also be low, which could explain the high
percentage of resistants in this location. This analysis of diversity and abundance of
microbial community on the sample is currently being evaluated by Denaturing Gradient
Gel Electrophoresis (DGGE).
As mentioned above, this genomic fingerprining method is based on the use of
primers corresponding to naturally occurring repetitive elements in bacteria. Besides REP,
some examples of other repetitive sequences are BOX, ERIC and (GTG)5 (Masco et al.,
2003) The corresponding protocols are referred to as BOX-PCR, ERIC-PCR and (GTG)5-
PCR, respectively, and together with REP-PCR this protocols are collectively termed rep-
PCR (Braem et al., 2011; de Bruijn et al., 1996. Because these sequences are located in
distinct positions, these banding patterns generated form each protocol is different (de
Bruijn et al., 1996). So the combined analysis of patterns generated by each protocol,
increases discrimination between isolates (Vinuesa et al., 1998), meaning that it is possible
that isolates that clustered together in this experiment might generate different patterns in
other protocols and correspond to different bacteria. However, this technique allowed
identifying at least 111 different profiles form a high selective medium, suggesting that
there is a lot of diversity among TBT-resistant bacteria, increasing the possibility that some
of these isolates are not yet described by the literature as TBT-resistants’. Nonetheless,
these results support that REP-PCR is a powerful molecular technique for characterization
of TBT-resistant bacterial strains. This work also demonstrates that rep-PCR technique
might be applied to environmental isolates, as Adiguzel et al. (2009) and Xie et al. (2008)

37
have previously demonstrated.
Ecotoxicological testing proved to be a great tool to evaluate acute toxicity of TBT
on test specie but also valuable to assess the effectiveness of the bioremediation assays.
Acute ecotoxicological testing revealed that the LC50 (CI) values of TBT on Gibbula
umbilicalis for 48 and 96 hours were 61.45 µg L-1 (39.85 µg L-1 - 124.92 µg L-1) and
15.69 µg L-1 (9.59 µg L-1 - 25.56 µg L-1), respectively. These results broaden the
knowledge of the effects of TBT on gastropods, especially on prosobranch gastropods.
These results suggest that Gibbula umbilicalis, however, is not as susceptible to TBT as
most marine gastropods, or marine organisms in general. For example, acute toxicity tests
of TBT exposure on Thais clavigera, Haliotis discus discus and Haliotis madaka indicated
that the 48 hour LC50 values was of 5.6 µg L-1, 5.4 µg L-1, 3.9 µg L-1, respectively
(Horiguchi et al., 1998). Nehring, (2000) compiled information on acute toxicity and
chronic effects of TBT in gastropods and compared those data to TBT levels found in the
environment (Figure 5.1). It is clear that environment concentrations of TBT were high
enough to cause adverse effects on some organisms.
Figure 5.1 - Chronic effects and acute toxicity of tributyltin, and tributyltin concentrations in the water column on the German North Sea coast (original figure in Nehring, 2000).

38
Nevertheless, TBT affects other groups of marine organisms from crustaceans to
fish. For example, the LC50 for the crustacean Palaemon serratus is 17.52 µg L−1 (48 h)
(Bellas et al., 2005) and the 48 hour LC50 values for five gammarids ranged from 17.8 to
23.1 µg L-1 (Ohji et al., 2002), while on test fish Tilapia, a 96 hour LC50 of 3,800 µg L-1
was reported (Hongxia et al., 1998).
Most recent studies focus however on the chronic effects of TBT on gastropods,
particularly imposex. Abidli et al. (2012) reported that the exposure of Hexaplex trunculus
and Bolinus brandaris to 50 ng L-1 TBT for 2 months induces imposex. Similar results
were obtained by Santos et al. (2005) on Nucella lapillus after 3 months of exposure to 50
ng L-1 TBT. Gooding et al. (2003) results revealed an increase of imposex incidence to
27% in Ilyanassa obsoleta at a concentration as low 1 ng L-1 TBT, an environmentally
relevant concentration. Other laboratory studies indicated other effects of TBT exposure
like shell abnormalities in oysters at concentrations as low as 2 ng L-1 (Chagot et al., 1990).
In this study, the concentration of butyltins in all water samples was below the
quantification limit (< 50 ng L-1). However there are some studies reporting the levels of
organotins in Portuguese waters and sediments. During April 1999 to May 2000, Díez et
al. (2005) collected samples from 46 stations along Portuguese coastal and continental
waters (including samples near ports and harbors). The values of MBT, DBT and TBT
vary between varied between >3.3 and 26 ng L-1, >3.0 and 30 ng L-1 and >3.1 to 29 ng L-1,
respectively. In the same study, sediment samples from 14 stations revealed a total of
butyltins ranging from 12 to 151 µg kg-1 dry weight, whilst TBT levels ranged between 3.8
and 12.4 µg kg-1 dry weight. Bettencourt et al. (1999) reported that values of TBT on
samples collected Tagus estuary, Portugal, ranged from 1.13 to 21.13 ng L-1. Also in Tagus
estuary, Nogueira et al. (2003) reported that concentrations of TBT in sediment samples
ranged from 5 to 35 µg kg-1 dry weight. These values are below the levels reported near
ports and harbors in other regions of Europe. For example, in Gijon, Spain, Rodriguez-
Gonzalez et al. (2006) detected concentrations of TBT in water samples collected near the
marina up to 196.6 ng L-1. In Saronikos, Greece, TBT levels in water were detected up to
70 ng L-1 (Thomaidis et al., 2007). Some of these reported concentrations, as seen above,
are high enough to cause adverse effects on several organisms.

39
In this study, sediment samples were not collected. However, it is expected that the
values of TBT in sediments are higher than in water, since butyltins have a strong affinity
to sediments, where they persist (Antizar-Ladislao, 2008; Xiao et al., 2011). It is also
expected that butyltin levels in coastal sediments to be high, due to boat traffic and
shipyard activities (Díez et al., 2005). Plus, marinas end ports were already identified as
hotspots of TBT contamination in the surface water and sediments (Dafforn et al., 2011).
For example, in Gipuzkoa, Spain, TBT sediment concentrations were as high as 5480 µg
kg-1 in superficial sediments (Arambarri et al., 2003). Field data suggests that TBT
sediment concentrations between 300 and 1000 µg kg-1 have adverse effects on the bivalve
Scrobicularia plana (Langston and Burt, 1991). Also, Meador and Rice (2001) observed a
reduction in growth of the polychaete Armandia brevis at 100 µg kg- TBT. Nevertheless,
resuspension of sedimented TBT is possible through storms or dredging leading to an
increase of organotin levels in the water column (Díez et al., 2005).
Regardless of the restrictions on TBT use, and consecutive bans, it is clear that the
adverse effects to its exposure are still prominent, since it is a very persistent compound in
the environment. Imposex, intersex and other adverse consequences are still being reported
due to a chronic exposure to this toxicant. Chronic effects of TBT on Gibbula umbilicalis
are yet to be studied. It might be important to assess the chronic effects on this organism,
as it belongs to the most affected group by imposex. It is also important to study the
mechanism of imposex development in prosobranch gastropods, as it is still not fully
understood (Lima et al., 2011). Not less important is to develop tools to remove or reduce
TBT levels from contaminated environments.
To select isolates for bioremediation assays and reduce more the number of
potential candidates as a bioremediation tool (genomic fingerprinting only allowed to
reduce 27% of isolates), selected microorganisms were exposed to a high concentration of
TBT (6 mM) in TSA medium for 48 hours. A total of 66 isolates grew in these conditions
and their growth curve was measured until stationary phase. In figure 4.3 is presented the
growth curve of 5 of those bacteria – considered to be the most suitable candidates due to
their higher growth in TBT medium. It is observed that the presence of TBT inhibits the
growth of those isolates. It is also observed that there is not a dependence on the
concentration between 1 mM, 3 mM and 6 mM of TBT, meaning that the growth of these
isolates is similarly affected by all tested concentrations. To our knowledge there are no

40
reports of bacteria growing in the presence of 6 mM TBT. Cruz et al. (2007) reported that
bacteria transferred to gradually higher TBT concentrations in vitro, results in an increased
resistance to TBT, suggesting the existence of a “memory response” mechanism to TBT
exposure. This mechanism could explain why some isolates grew in such high
concentrations of TBT, however we couldn’t confirm that hypothesis as we have no
information if they were naturally resistant to 6 mM TBT because the highest
concentration tested on the initial screening was 3 mM.
The five TBT-resistant previously selected isolates candidates were used in the
bioremediation assays for 48h, and after their potential as bioremediation tools was
evaluated through ecotoxicological tests. Different bioremediation periods were previously
tested and results showed that this period was enough to find degradation (results not
shown). After the potential remediation, the sea snails we exposed to the media, and except
for the isolate “St11” all other treatments with the bacteria caused an increase in the LC50
after 72 and 96 hours when compared to the control, meaning a decrease of toxicity. The
most promising bacterium was “S13”, causing a great increase in the LC50 when compared
to the control (>20% for S13 and 8.58% for control at 72 hours; 19.78% for S13 and
5.07% for control at 96 hours). An increase in LC50 values was also observed in “L31”,
“V11” and “F3”. This suggests that there was bioremediation and the medium became less
toxic. Although the ecotoxicological approach having its importance and showing the
relevant effect on targeted species, this should be complemented with chemical analysis in
order to assess and understand this occurrence. Chemical analysis will provide information
if TBT has been degraded into DTB, MBT or inorganic tin, which are less toxic. It is
important to take into account that these results were obtained after only after 48 hours of
exposure. It is possible that a longer exposure to TBT will enhance the degradation of
TBT, as shown by Sakultantimetha et al. (2011) where degradation of TBT by sediment
microbial communities occurred in a seven-day period. Therefore, further testing should be
performed with an increase in time of bioremediation tests to assess the increased
biotechnological potential of longer remediation periods. It may be also interesting to
change or optimize conditions for TBT removal. As demonstrated by Sakultantimetha et
al. (2010), increasing temperature accelerates TBT degradation. Nevertheless, it is
important to take into account that in situ degradation takes place at ambient temperature

41
where degradation is dependent on seasonal and geographical variations (Sakultantimetha
et al., 2011).
It might be argued that in this experiment there was an abiotic degradation of TBT,
but Voulvoulis and Lester (2006) demonstrated that anaerobic digestion of TBT is
minimal, contrarily to aerobic degradation (Stasinakis, et al., 2005). Plus, TBT is not
volatile (Sakultantimetha et al., 2011), as shown by Maguire et al. (1983) TBT dissolved in
water does not volatize after 2 months in the dark at 20ºC. The treatments were maintained
in the dark during bioremediation assays, so direct photolysis in surface water is not
expected to have occurred. It might also be argued that TBT was adsorbed to the glass,
however Maguire et al. (1983) experiments ruled out the possibility of TBT adsorbing to
the glass. So any degradation of TBT from this experiment is expected to be carried out by
bacteria.
As seen in table 4.4, the by-products resulting of the growth of two isolates (L31
and S13) are toxic to Gibbula umbilicalis. Nonetheless, at the highest dilution tested for
bioremediation assays no mortalities were recorded. Interestingly, those two isolates had a
promising result in bioremediation testing. It would be important in forthcoming studies to
analyze and identify these by-products, if and how they interact with TBT and their
influence on TBT degradation, taking in mind that this by-products may limit in situ
application of these isolates. Some marine bacteria are known to cause mortality in
gastropods, like Vibrio, for example V. alginolyticus, V. harveyi and V. parahaemolyticus,
which have been isolated from diseased abalones (Haliotis) and are responsible by mass
mortalities on that genus (Romalde and Barja, 2010). Moreover, Fukagawa et al. (1992)
isolated a TBT-resistant Vibrio strain.
Ecotoxicological testing, with the ecologically relevant specie Gibbula umbilicalis,
proved to be a strong tool to evaluate toxic effects of TBT and of potentially bioremediated
waters. Nevertheless, chemical analysis of the potential remediated waters are still needed
to assess TBT levels and possible degradation products. As mentioned above, some
mechanisms of TBT degradation by bacteria have been proposed. TBT might be degraded
through a dealkylation mechanism, might be metabolized as a carbon source or be
accumulated into the cell of bacteria. Hence, it is important to also assess TBT by-products
ecotoxicity and develop tools to remove them.

42
As previously discussed, the occurrence of TBT-resistant bacteria is usually not
correlated with the occurrence of TBT. We here suggest that the occurrence of resistant
bacteria in a TBT non-contaminated environment, might sustain that this environment was
previously contaminated and these bacteria were able to restore it. But also it is possible
that these contaminants have never been present in relevant concentrations, and the
presence of these resistant bacteria is due to other contaminant resistance mechanisms.
However, further studies are still needed to evaluate this. As shown here, naturally
occurring marine bacteria from Portuguese ports are able to tolerate high concentrations of
TBT and even degrade it. Plus, chemical analysis to near-sediment waters revealed that the
levels of TBT in Portuguese ports with intense activity were below 50 ng L-1, a much
lower level than verified in other regions of the globe.
Although TBT levels have been decreasing in the last years, mainly due to
restrictions in its use, it is still present at levels of concern. Unfortunately, present and
future restrictions will not immediately remove TBT and its degradation products from the
environment, since these compounds are retained in the sediments where they persist and
can also be continuously ressuspended due to hydrodynamics.
Several marine invertebrates are extremely sensitive to TBT, and imposex can be
observed in some prosobranch gastropods at concentrations usually found in the water
column near ports and harbors. Mostly due to this effect, TBT has been considered as the
most toxic substance ever introduced into the marine environment. Additionally, it is
important to be aware that the effects of TBT contamination also have the potential to
extend to higher organisms through consumption, making TBT a topic for human health
concern.
This work presented a possible tool to accelerate TBT removal from contaminated
waters: bioremediation using marine bacteria from Portuguese ports. It was demonstrated
that some of these bacteria are able to tolerate extremely high concentrations of TBT and
may be potential bioremediation tools of contaminated waters. Since resistance to heavy
metals and antibiotics are common among TBT-resistant organisms, studying TBT-
resistant might not only be vital for the restoration of TBT-contaminated environments, but
to heavily contaminated environments in general.

43
Ecotoxicological testing using Gibbula umbilicalis provided information on acute
toxicity of TBT and was also an efficient tool to assess the efficiency of bioremediation
scenarios.

44

45
6. Future prospects
The use of natural microbial populations for bioremediation of TBT contaminated
sites is far away from a large-scale application since little work has been done to explore
the exact mechanism or the genes involved in the process.
In this work, a total of 111 different genetic profiles were detected among all 3 mM
TBT-resistant bacteria. To our knowledge, there are not many identified TBT-resistant
bacteria, especially to that high concentration. Therefore it would be important to identify
the isolated bacteria in this study to extend the knowledge on TBT-resistant bacteria.
Moreover, albeit the increasing studies on TBT resistance by bacteria, there is still limited
work to understand the mechanisms behind that resistance. It has been proposed that TBT
resistance may be plasmid mediated or coded in chromosomal DNA. Therefore identifying
and cloning genes involved in degradation and in TBT resistance will be crucial for further
studies.
Only 5 out of 111 different isolates were tested in bioremediation assays in this
study, meaning that there are still a big number of TBT-resistant isolates from Portuguese
ports to be tested as potential bioremediation tools for TBT. Ecotoxicological testing
revealed to be useful to understand the effects of pollutants’ toxicity on Gibbula
umbilicalis, however chemical analysis will be essential on future studies to measure TBT
and its degradation products. It would be also interesting in future studies to assess the
growth of marine bacteria in the presence of environmental relevant concentrations of TBT,
to evaluate how TBT affects the microbial community of a contaminated area and also to
assess on possible synergisms between TBT degrading bacteria on the restoration of a
contaminated environment.
Microorganisms adapted to extreme environments, are potential producers of
enzymes with great practical importance for industrial applications (Ferrer et al, 2007). A
simultaneous study with the same isolates aimed to detect enzymatic activity in TBT-
resistant microorganisms has been performed (Lemos et al., 2011b). Results show these
isolates have the capacity of producing enzymes with a large biotechnological potential,
exhibiting extracellular activities such as proteolytic, lipolytic, and amylolytic activities.

46
Thus, further studies with these isolates should be explored in order to fully assess their
biotechnological potential.

47
7. References
Abidli, S., Machado, M., Lahbib, Y., Filipe, L., Castro, C., Reis-henriques, M.A., Trigui, N., Menif, E., 2012. Tributyltin ( TBT ) effects on Hexaplex trunculus and Bolinus brandaris ( Gastropoda : Muricidae ): Imposex induction and sex hormone levels insights. Ecological Indicators. 13, 13-21.
Adelman, D., Hinga, K.R., Pilson, M.E.Q., 1990. Biogeochemistry of butyltins in an enclosed marine ecosystem. Environmental Science & Technology. 24, 1027-1032.
Adiguzel, A., Ozkan, H., Baris, O., Inan, K., Gulluce, M., Sahin, F., 2009. Identification and characterization of thermophilic bacteria isolated from hot springs in Turkey. Journal of microbiological methods. 79, 321-328. Ali, R.A.S., Bream, A.S., 2010. The Effects of Sewage Discharge on The Marine Gastropod Gibbula sp., Collected From The Coast of Al-Hanyaa, Libya. Egyptian Academic Journal of Biological Sciences. 2, 47- 52.
Alzieu, C., Héral, M., Thbaud, Y., 1982. I Influence Des Peintures Antisalissures A Rase D'organostanniques Sur La Calcification De La Coquille De L'huitre Cràssostreâ Gigas. Revue des Travaux de l'Institut des Peches Maritimes. 45, 101-116.
Antizar-Ladislao, B., 2008. Environmental levels, toxicity and human exposure to tributyltin (TBT)-contaminated marine environment. a review. Environment international. 34, 292-308.
Arambarri, I., Garcia, R., Millán, E., 2003. Assessment of tin and butyltin species in estuarine superficial sediments from Gipuzkoa, Spain. Chemosphere. 51, 643-9.
Asakawa, H., Tsunoda, M., Kaido, T., Hosokawa, M., Sugaya, C., Inoue, Y., Kudo, Y., Satoh, T., Katagiri, H., Akita, H., Saji, M., Wakasa, M., Negishi, T., Tashiro, T., Aizawa, Y., 2010. Enhanced inhibitory effects of TBT chloride on the development of F1 rats. Archives of environmental contamination and toxicology. 58, 1065-1073.
Azenha, M., Vasconcelos, M.T., 2002. Butyltin compounds in Portuguese wines. Journal of agricultural and food chemistry. 50, 2713-6.
Barroso, C.M., Moreira, M.H., Bebianno, M.J., 2002. Imposex , female sterility and organotin contamination of the prosobranch Nassarius reticulatus from the Portuguese coast. Marine Ecology Progress Series. 230, 127-135.
Baya, A.M., Brayton, P.R., Brown, V.L., Grimes, D.J., Russek-Cohen, E., Colwell, R.R., 1986. Coincident plasmids and antimicrobial resistance in marine bacteria isolated from polluted and unpolluted Atlantic Ocean samples. Applied and environmental microbiology. 51, 1285-1292.
Bellas, J., Beiras, R., Mariño-Balsa, J.C., Fernández, N., 2005. Toxicity of organic compounds to marine invertebrate embryos and larvae: a comparison between the sea urchin embryogenesis bioassay and alternative test species. Ecotoxicology 14, 337-353.
Bettencourt, A.M.M.D., Andreae, M.O., Cais, Y., Gomes, M.L., Schebek, L., Vilas, L.F., Verney, L.A., De, U., 1999. Organotin in the Tagus estuary. Aquatic Ecology. 33, 271-280.
Bonaventura, C., Johnson, F.M., 1997. Healthy environments for healthy people: bioremediation today and tomorrow. Environmental health perspectives. 105(1), 5-20.

48
Braem, G., De Vliegher, S., Supré, K., Haesebrouck, F., Leroy, F., De Vuyst, L., 2011. (GTG)5-PCR fingerprinting for the classification and identification of coagulase-negative Staphylococcus species from bovine milk and teat apices: a comparison of type strains and field isolates. Veterinary microbiology. 147, 67-74.
Carfi’, M., Croera, C., Ferrario, D., Campi, V., Bowe, G., Pieters, R., Gribaldo, L., 2008. TBTC induces adipocyte differentiation in human bone marrow long term culture. Toxicology. 249, 11-18.
Chagot, D., Alzieu, C., Sanjuan, J., Grizel, H., 1990. Sublethal and histopathological effects of trace levels of tributyltin fluoride on adult oysters Crassostrea gigas. Aquatic Living Resources 3, 121-130.
Champ, M.A., 2003. Economic and environmental impacts on ports and harbors from the convention to ban harmful marine anti-fouling systems. Marine pollution bulletin. 46, 935-940.
Chien, L.-C., Hung, T.-C., Choang, K.-Y., Yeh, C.-Y., Meng, P.-J., Shieh, M.-J., Ha, B.-C., 2002. Daily intake of TBT, Cu, Zn, Cd and As for fishermen in Taiwan. The Science of the total environment .285, 177-85.
Cloirec, P.L. and Andrès, Y., 2005, Bioremediation of Heavy Metals Using Microorganisms, in: Fingerman, M., Nagabhushanam, R. (Eds.), Bioremediation Of Aquatic and Terrestrial Ecosystems. Science Publishers Inc., New Hampshire, pp. 97-140.
Cooney, J.J., 1988. Microbial transformations of tin and tin compounds. Journal of Industrial Microbiology & Biotechnology. 3, 195-204.
Crawford, R.L., Crawford, D.L., 2005. Bioremediation: Principles and Applications, first ed. Cambridge University Press, Cambridge Cruz, A., Caetano, T., Suzuki, S., Mendo, S., 2007. Aeromonas veronii, a tributyltin (TBT)-degrading bacterium isolated from an estuarine environment, Ria de Aveiro in Portugal. Marine environmental research. 64, 639-50.
Cruz, A., Oliveira, V., Baptista, I., Almeida, A., Cunha, A., Suzuki, S., Mendo, S., 2010. Effect of tributyltin (TBT) in the metabolic activity of TBT-resistant and sensitive estuarine bacteria. Environmental toxicology.
Dafforn, K.A., Lewis, J.A., Johnston, E.L., 2011. Antifouling strategies : History and regulation , ecological impacts and mitigation. Marine Pollution Bulletin. 62, 453-465.
de Bruijn, F.J., Rademaker, J., Schneider, M., Rossbach, U., Louws, F.J., 1996. Rep-PCR genomic fingerprinting of plant-associated bacteria and computer-assisted phylogenetic analyses, in: Stacey, G., Mullin, B., Gresshoff, P. (Eds), Biology of plant-microbe interaction: Proceedings of the 8th International Congress of Molecular Plant-Microbe Interactions. APS Press, Tennessee, pp. 497-502.
Díez, S., Lacorte, S., Viana, P., Barceló, D., Bayona, J.M., 2005. Survey of organotin compounds in rivers and coastal environments in Portugal 1999-2000. Environmental pollution. 136, 525-36.
Dubey, S.K., Roy, U., 2003. Review: Biodegradation of tributyltins (organotins) by marine bacteria. Applied Organometallic Chemistry. 17, 3-8.
EFSA, 2004. Opinion of the scientific panel on contaminants in the food chain on a request from the commission to asses the health risks to consumers associated with exposure to organotins in foodstuffs. The EFSA Journal. 102, 1-114.

49
Evans, G.M. and Furlong, J.C., 2010a, Contaminated Land and Bio-Remediation, in: Evans, G.M. and Furlong, J.C. (Eds.), Environmental Biotechnology: Theory and Application, Second Edition. John Wiley & Sons Inc., Chichester, pp.91-116.
Evans, G.M. and Furlong, J.C., 2010b. Phytotechnology and Photosynthesis, in: Evans, G.M. and Furlong, J.C. (Eds.), Environmental Biotechnology: Theory and Application, Second Edition. John Wiley & Sons Inc., Chichester, pp.143-172.
Fent, K., 2006. Worldwide Occurrence of Organotins from Antifouling Paints and Effects in the Aquatic Environment. 5, 71-100.
Ferrer, M., Golyshina, O., Beloqui, A., Golyshin, P.N., 2007. Mining enzymes from extreme environments. Current opinion in microbiology. 10, 207-214.
Fingerman, M., Nagabhushanam, R., 2005. Bioremediation Of Aquatic and Terrestrial Ecosystems. Science Publishers Inc., New Hampshire. Finney, D.J., 1971. Probit Analysis. Cambridge University Press, London.
Forsyth, D.S., Jay, B., 1997. Organotin Leachates in Drinking Water from Chlorinated Poly(vinyl chloride) (CPVC) Pipe. Applied Organometallic Chemistry. 11, 551-558.
Fukagawa, T., Suzuki, S., 1993. Cloning of Gene Responsible for Tributyltin Chloride (TBTCl) Resistance in TBTCl-Resistant Marine Bacterium, Alteromonas sp M-1. Biochemical and Biophysical Research Communications. 194, 733-740.
Fukagawa, T., Suzuki, S., Fukunaga, K., Suzuki, T., Takama, K., 1992. Isolation and characterization of tributyltin chloride-resistant marine Vibrio. FEMS microbiology letters. 72, 83-68.
Gadd, G., 2000. Microbial interactions with tributyltin compounds: detoxification, accumulation, and environmental fate. The Science of The Total Environment. 258, 119-127.
Galante-Oliveira, S., Oliveira, I., Pacheco, M., Barroso, C.M., 2010. Hydrobia ulvae imposex levels at Ria de Aveiro (NW Portugal) between 1998 and 2007: a counter-current bioindicator? Journal of environmental monitoring. 12, 500-507.
Girones, R., Ferrús, M.A., Alonso, J.L., Rodriguez-Manzano, J., Calgua, B., Corrêa, A.D.A., Hundesa, A., Carratala, A., Bofill-Mas, S., 2010. Molecular detection of pathogens in water--the pros and cons of molecular techniques. Water research. 44, 4325-4339.
Glass, D.J., 2005, Commercial Use of Genetically Modified Organisms (GMOs) in Bioremediation and Phytoremediation, in: Fingerman, M., Nagabhushanam, R. (Eds.), Bioremediation Of Aquatic and Terrestrial Ecosystems. Science Publishers Inc., New Hampshire, pp. 41-96.
Gooding, M.P., Wilson, V.S., Folmar, L.C., Marcovich, D.T., LeBlanc, G.A., 2003. The Biocide Tributyltin Reduces the Accumulation of Testosterone as Fatty Acid Esters in the Mud Snail (Ilyanassa obsoleta). Environmental Health Perspectives. 111, 426-430.
Groshart, C., Okkerman, P., 2000. Towards the establishment of a priority list of substances for further evaluation of their role in endocrine disruption - preparation of a candidate list of substances as a basis for priority setting. Final Report. European Commission DG ENV. http://ec.europa.eu/environment/docum/pdf/bkh_main.pdf (Last accessed on 10 October 2011)
Guo, S., Qian, L., Shi, H., Barry, T., Cao, Q., Liu, J., 2010. Effects of tributyltin (TBT) on Xenopus

50
tropicalis embryos at environmentally relevant concentrations. Chemosphere. 79, 529-33.
Hagger, J.A. Depledge, M.H., Oehlmann, J., Jobling, S., Galloway, T.S., 2006. Is There a Causal Association between Genotoxicity and the Imposex Effect? Environmental Health Perspectives. 114, 20-26.
Haller, L., Tonolla, M., Zopfi, J., Peduzzi, R., Wildi, W., Poté, J., 2011. Composition of bacterial and archaeal communities in freshwater sediments with different contamination levels (Lake Geneva, Switzerland). Water research. 45, 1213-28.
Haritash, A.K., Kaushik, C.P., 2009. Biodegradation aspects of polycyclic aromatic hydrocarbons (PAHs): a review. Journal of hazardous materials.169, 1-15.
Hongxia, L., Guolan, H., Shugui, D., 1998. Toxicity andaccumulation of tributyltin chloride on tilapia. Applied Organometallic Chemistry. 12, 109-119.
Horiguchi, T., Imai, T., Cho, H.S., Shiraishi, H., Shibata, Y., Marita, M., Shimizu, M., 1998. Acute toxicity of organotin compounds to the larvae of the rock shell, Thais clavigera, the disk abalone, Haliotis discus discus and the giant abalone, Haliotis madaka. Marine Environmental Research. 46, 469-473.
Islam, M.S., Tanaka, M., 2004. Impacts of pollution on coastal and marine ecosystems including coastal and marine fisheries and approach for management: a review and synthesis. Marine pollution bulletin. 48, 624-49.
Jenssen, B.M., 2003. Marine pollution: the future challenge is to link human and wildlife studies. Environmental health perspectives. 111, A198-199.
Jude, F., Arpin, C., Brachet-Castang, C., Capdepuy, M., Caumette, P., Quentin, C., 2004. TbtABM, a multidrug efflux pump associated with tributyltin resistance in Pseudomonas stutzeri. FEMS Microbiology Letters. 232, 7-14.
Kannan, K., Guruge, K.S., Thomas, N.J., Tanabe, S., Giesy, J.P., 1998. Butyltin Residues in Southern Sea Otters (Enhydra lutris nereis) Found Dead along California Coastal Waters. Environmental Science & Technology. 32, 1169-1175.
Kasparek, M., Godley, B.J., Broderick, A.C., 2001. Nesting of the Green Turtle , Chelonia mydas , in the Mediterranean : a review of status and conservation needs Nesting population : distribution and numbers Nesting in Turkey. Zoology in the Middle East. 24, 45-74.
Kawai, S., Kurokawa, Y., Harino, H., Fukushima, M., 1998. Degradation of tributyltin by a bacterial strain isolated from polluted river water. Environmental Pollution. 102, 259–263.
Langston, W.J., Burg, G.R., 1991. Bioavailability and effects of sediment-bound TBT in deposit-feeding clams, Scrobicularia plana. Marine Environmental Research. 32, 61-77.
Lemos, M.F.L., Esteves, A.C., Samyn, B., Timperman, I., van Beeumen, J., Correia, A., van Gestel, C.A.M., Soares, A.M.V.M., 2010a. Protein differential expression induced by endocrine disrupting compounds in a terrestrial isopod. Chemosphere. 79, 570-576.
Lemos, M.F.L., Soares, A.M.V.M., Correia, A.C., Esteves, A.C., 2010b. Proteins in ecotoxicology - How, why and why not? Proteomics. 10, 873-887.
Lemos, M.F.L., Lima, I.S.M., da Fonseca, K.L., Monteiro, H.R., Esteves, A.C., 2011. Extracellular

51
enzymatic activity from tributyltin resistant microorganisms. Current Opinion in Biotechnology. 22, S80.
Lemos M.F.L., Esteves A.C., Pestana J.L.T., (2011). Fungicides as endocrine disrupters in non-target organisms, in: Thajuddin, N. (Eds.) Fungicides - Book 2. InTech Publisher.
Lepland, A., Andersen, T.J., Lepland, A., Arp, H.P.H., Alve, E., Breedveld, G.D., Rindby, A., 2010. Sedimentation and chronology of heavy metal pollution in Oslo harbor, Norway. Marine pollution bulletin. 60, 1512-1522.
Lima, D., Reis-Henriques, M.A., Silva, R., Santos, A.I., Castro, L.F.C., Santos, M.M., 2011. Tributyltin-induced imposex in marine gastropods involves tissue-specific modulation of the retinoid X receptor. Aquatic toxicology. 101, 221-227.
Longwell, A.C., Chang, S., Hebert, A., Hughes, J.B., Perry, D., 1992. Pollution and developmental abnormalities of Atlantic fishes. Environmental Biology of Fishes. 35, 1-21.
Luan, T., Jin, J., Chan, S., Wong, Y., Tam, N., 2006. Biosorption and biodegradation of tributyltin (TBT) by alginate immobilized Chlorella vulgaris beads in several treatment cycles. Process Biochemistry. 41, 1560-1565.
Maguire, R., 1985. Degradation of the tri-n-butyltin species in water and sediment from Toronto harbor. Journal of Agricultural and Food. 33, 947-953.
Maguire, R.J., Carey, J.H., Hale, E.J., 1983. Degradation of the Tri-n -butyltin Species in Water. J. Agrlc. Food Chem. 31, 1060-1065.
Masco, L., Huys, G., Gevers, D., Verbrugghen, L., Swings, J., 2003. Identification of Bifidobacterium species using rep-PCR fingerprinting. Systematic and applied microbiology. 26, 557-563.
Matthiessen, P., Gibbs, P.E., 1998. Critical Appraisal of the Evidence for Tributyltin-Mediated Endocrine Disruption in Mollusks. Environmental Toxicology and Chemistry. 17, 37-43.
McClellan-Green, P., Romano, J., Oberdörster, E., 2007. Does gender really matter in contaminant exposure? A case study using invertebrate models. Environmental research 104, 183-191.
Meador, J.P., Rice, C.A., 2001. Impaired growth in the polychaete Armandia brevis exposed to tributyltin in sediment. Marine environmental research. 51, 113-29.
Michel, P., Averty, B., Andral, B., Chiffoleau, J.F., Galgani, F., 2001. Tributyltin along the coasts of Corsica (Western Mediterranean): a persistent problem. Marine Pollution Bulletin. 42, 1128-1132.
Miller, C.E., Wuertz, S., C, J.J., Pfister, R.M., 1995. Plasmids in tributyltin-resistant bacteria from fresh and estuarine waters. Environmental Sciences. 337-342.
Mimura, H., Sato, R., Furuyama, Y., Taniike, A., Yagi, M., Yoshida, K., Kitamura, A., 2008. Adsorption of tributyltin by tributyltin resistant marine Pseudoalteromonas sp. cells. Marine pollution bulletin. 57, 877-82.
Nehring, S., 2000. Long-term changes in Prosobranchia ( Gastropoda ) abundances on the German North Sea coast : the role of the anti-fouling biocide tributyltin. Journal of Sea Research. 43, 151-165.

52
Nogueira, J.M.F., Simplício, B., Floréncio, M.H., Bettencourt, a M.M., 2003. Levels of tributyltin in sediments from Tagus estuary nature reserve. Estuaries. 26, 798-802.
Ohji, M., Takeuchi, I., Takahashi, S., Tanabe, S., Miyazaki, N., 2002. Differences in the acute toxicities of tributyltin between the Caprellidea and the Gammaridea (Crustacea: Amphipoda). Marine Pollution Bulletin. 44, 16-24.
Pavoni, B., Centanni, E., Valcanover, S., Fasolato, M., Ceccato, S., Tagliapietra, D., 2007. Imposex levels and concentrations of organotin compounds (TBT and its metabolites) in Nassarius nitidus from the Lagoon of Venice. Marine pollution bulletin. 55, 505-511.
Peñuela, G., Barceló, D., 1998. Photosensitized degradation of organic pollutants in water: processes and analytical applications. TrAC Trends in Analytical Chemistry. 17, 605-612.
Rademaker J.L.W., de Bruijn F.J., 1997. Characterization and classification of microbes by rep-PCR genomic fingerprinting and computer assisted pattern analysis, in: Caetano-Anollés, G., Gresshoff, P.M. (Eds.), DNA markers: protocols, applications and overviews. John Wiley and Sons Inc., New York, pp. 151–171.
Radwan, S.S., Al-Awadhi., H., El-Nemr, I., 2000. Cropping as a Phytoremediation Practice for Oily Desert Soil with Reference to Crop Safety as Food. International Journal of Phytoremediation 2, 383-396.
Rank, J., 2009. Intersex in Littorina littorea and DNA damage in Mytilus edulis as indicators of harbour pollution. Ecotoxicology and environmental safety. 72, 1271-1277.
Rodríguez-González, P., Encinar, J.R., Alonso, J.I.G., Sanz-Medel, A., 2006. Contamination of the Coastal Waters of Gijón (North West Spain) by Butyltin Compounds. Water, Air, and Soil Pollution. 174, 127-139.
Romalde, J.L., Barja, J.L., 2010. Bacteria in molluscs: good and bad guys. Applied Microbiology. 136-147.
Sakultantimetha, A., Keenan, H.E., Beattie, T.K., Aspray, T.J., Bangkedphol, S., Songsasen, A., 2010. Acceleration of tributyltin biodegradation by sediment microorganisms under optimized environmental conditions. International Biodeterioration & Biodegradation. 64, 467-473.
Sakultantimetha, A., Keenan, H.E., Beattie, T.K., Bangkedphol, S., Cavoura, O., 2011. Bioremediation of tributyltin contaminated sediment: degradation enhancement and improvement of bioavailability to promote treatment processes. Chemosphere. 83, 680-6.
Santos, M., Ten Hallers-Tjabbes, C.C., Santos, A.M., Vieira, N., 2002. Imposex in Nucella lapillus, a bioindicator for TBT contamination: re-survey along the Portuguese coast to monitor the effectiveness of EU regulation. Journal of Sea Research. 48, 217-223.
Santos, M.M., Castro, L.F.C., Vieira, M.N., Micael, J., Morabito, R., Massanisso, P., Reis-Henriques, M.A., 2005. New insights into the mechanism of imposex induction in the dogwhelk Nucella lapillus. Comparative biochemistry and physiology. Toxicology & pharmacology. 141, 101-109.
Santos, M.M., Enes, P., Reis-Henriques, M. a, Kuballa, J., Castro, L.F.C., Vieira, M.N., 2009. Organotin levels in seafood from Portuguese markets and the risk for consumers. Chemosphere. 75, 661-666.

53
Schwarzenbach, R.P., Escher, B.I., Fenner, K., Hofstetter, T.B., Johnson, C.A., von Gunten, U., Wehrli, B., 2006. The challenge of micropollutants in aquatic systems. Science. 313, 1072-1077.
Short, J., Thrower, F., 1987. Toxicity of tri-n-butyl-tin to chinook salmon, Oncorhynchus tshawytscha, adapted to seawater. Aquaculture. 61, 193-200.
Sidharthan, M., Young, K.S., Woul, L.H., Soon, P.K., Shin, H.W., 2002. TBT toxicity on the marine microalga Nannochloropsis oculata. Marine Pollution Bulletin. 45, 177-180.
Sonak, S., 2009. Implications of organotins in the marine environment and their prohibition. Journal of environmental management. 90(1), S1-3.
Stasinakis, A.S., Thomaidis, N.S., Nikolaou, A., Kantifes, A., 2005. Aerobic biodegradation of organotin compounds in activated sludge batch reactors. Environmental pollution.134, 431-438.
Suehiro, F., Mochizuki, H., Nakamura, S., Iwata, H., Kobayashi, T., Tanabe, S., Fujimori, Y., Nishimura, F., Tuyen, B.C., Tana, T.S., Suzuki, S., 2007. Occurrence of tributyltin (TBT)-resistant bacteria is not related to TBT pollution in Mekong River and coastal sediment: with a hypothesis of selective pressure from suspended solid. Chemosphere. 68, 1459-1464.
Suzuki, S., Fukagawa, T., Takama, K., 1992. Occurrence of tributyltin-tolerant bacteria in tributyltin- or cadmium-containing seawater. Applied and environmental microbiology. 58, 3410-3412.
Tacão, M., Alves, A., Saavedra, M.J., Correia, A., 2005. BOX-PCR is an adequate tool for typing Aeromonas spp. Antonie van Leeuwenhoek. 88, 173-179.
Takeuchi, I., Takahashi, S., Tanabe, S., Miyazaki, N., 2004. Butyltin concentrations along the Japanese coast from 1997 to 1999 monitored by Caprella spp. (Crustacea: Amphipoda). Marine environmental research. 57, 397-414.
Tanabe, S., 2002. Contamination and toxic effects of persistent endocrine disrupters in marine mammals and birds. Marine pollution bulletin 45, 69-77.
Targett, N., Baier, R., Gerwick, W., Grimes, D.J., Heidelberg, J., Pomponi, S. and Prince, R., 2002. Marine Biotechnology in the Twenty-First Century - Problems, Promise and Products. National Academy Press, Washington, D.C..
Tewari, A., Raghunathan, C., Joshi, H.V., Khambhaty, Y., 2002. Imposex in rock whelks Thais and Ocenebra species (Mollusca, Neogastropoda, Muricidae) from Gujarat coast. Indian Journal of Marine Sciences. 31, 321-328.
Thomaidis, N.S., Stasinakis, A.S., Gatidou, G., Morabito, R., Massanisso, P., Lekkas, T.D., 2007. Occurrence of Organotin Compounds in the Aquatic Environment of Greece. Water, Air, and Soil Pollution. 181, 201-210.
Thoonen, S.H.L., Deelman, B.J., Koten, G.V., 2004. Synthetic aspects of tetraorganotins and organotin(IV) halides. Journal of Organometallic Chemistry. 689, 2145-2157.
Trindade, P.A., McCulloch, J.A., Oliveira, G.A., Mamizuka, E.M., 2003. Molecular techniques for MRSA typing: current issues and perspectives. The Brazilian journal of infectious diseases : an official publication of the Brazilian Society of Infectious Diseases. 7, 32-43.
Turner, A., Pollock, H., Brown, M.T., 2009. Accumulation of Cu and Zn from antifouling paint particles by the marine macroalga, Ulva lactuca. Environmental Pollution. 157, 2314–2319.

54
Versalovic, J., Koeuth, T., Lupski, J.R., 1991. Distribution of repetitive DNA sequences in eubacteria and application to fingerprinting of bacterial genomes. Nucleic acids research. 19, 6823-6831. Vinuesa, P., Rademaker, J.L., De Bruijn, F.J., Werner, D., 1998. Genotypic characterization of Bradyrhizobium strains nodulating endemic woody legumes of the Canary Islands by PCR-restriction fragment length polymorphism analysis of genes encoding 16S rRNA (16S rDNA) and 16S-23S rDNA intergenic spacers, repetitive extr. Applied and Environmental Microbiology. 64, 2096-2104. Voulvoulis, N., Lester, J.N., 2006. Fate of organotins in sewage sludge during anaerobic digestion. Science of the total environment. 371, 373-82.
Waite, M.E., Evans, K.E., Thain, J.E., Waldock, M.J., 1989. Organotin concentrations in the Rivers Bure and Yare, Norfolk Broads, England. Applied Organometallic Chemistry. 3, 383-391.
Wang, X., Fang, C., Hong, H., Wang, W.-X., 2010. Gender differences in TBT accumulation and transformation in Thais clavigera after aqueous and dietary exposure. Aquatic toxicology. 99, 413-422.
WHO, 1999. Concise international chemical assessment document 14. Tributyltin oxide.
Wuertz, S., Miller, C., Pfister, R., Cooney, J., 1991. Tributyltin-resistant bacteria from estuarine and freshwater sediments. Applied and environmental microbiology. 57, 2783-2789.
Xiao, X., Sheng, G.D., Qiu, Y., 2011. Improved understanding of tributyltin sorption on natural and biochar-amended sediments. Environmental toxicology and chemistry. 30, 2682-2687.
Xie, M., Yin, H., Liu, Y., Liu, J., Liu, X., 2008. Repetitive sequence based polymerase chain reaction to differentiate close bacteria strains in acidic sites. Transactions of Nonferrous Metals Society of China. 18, 1392-1397.
Yorio, P., Frere, E., Gandini, P., Conway, W., 2010. Status and conservation of seabirds breeding in Argentina. Bird Conservation International. 9, 299-314.

55
8. Annexes
Table 8.1 Generation time of isolates with and without TBT
Isolate Generation time (h)
Control 1 mM 3mM 6mM A1 3.42 2.92 3.23 3.44 A11 2.68 n.d. n.d. n.d. A15 2.49 n.d. n.d. n.d. A2 2.03 2.32 2.17 1.94 A4 2.26 n.d. n.d. n.d. A5 1.35 n.d. n.d. n.d. F17 1.47 1.73 1.98 2.01 F18 1.34 1.46 1.39 1.26 F19 1.29 2.31 2.21 2.65 F20 2.5 n.d. 1.76 n.d. F27 1.38 n.d. n.d. n.d. F28 1.8 n.d. n.d. n.d. F5 1.91 n.d. n.d. n.d. F8 1.87 n.d. n.d. n.d. L1 3.15 n.d. n.d. n.d. L15 1.51 2.72 2.6 3.14 L17 n.d. n.d. n.d. n.d. L18 1.19 n.d. n.d. n.d. L2 1.4 n.d. n.d. n.d. L20 1.32 n.d. n.d. n.d. L21 1.1 n.d. n.d. n.d. L23 n.d. n.d. n.d. n.d. L26 1.43 n.d. n.d. n.d. L28 1.65 n.d. n.d. n.d. L29 3.82 3.25 3.26 2.33 L8 1.35 1.22 1.63 2.81 L9 n.d. n.d. n.d. n.d. P1 3.69 5.12 3.66 4.56 P19 1.53 n.d. n.d. n.d. P28 1.8 2.17 2.19 2.23 P3 3.53 3.93 3.44 3.32 P30 1.06 n.d. n.d. n.d. S15 n.d. n.d. n.d. n.d. S21 3.53 6.67 5.02 4.56 S6 2.76 2.21 2.31 2.56 S7 n.d. n.d. n.d. n.d. St13 3.67 3.4 1.1 1.67 St14 3.72 3.78 3.58 3.64

56
St16 2.76 4.1 4.31 4.73 St18 0.98 1.92 2.02 2.13 St20 1.58 2.91 2.86 2.91 St21 5.35 2.43 2.58 2.76 St22 2.27 2.68 2.43 2.49 St23 1.46 1.05 0.96 1.04 St25 1.93 3.89 3.54 3.85 St26 1.64 2.57 2.55 3.08 St9 3.66 0.81 0.87 1.57 V1 1.6 1.43 1.24 2.33 V12 2.34 2.65 2.29 2.74 V2 1.41 1.41 1.42 2.03 V22 2.01 n.d. n.d. n.d. V25 1.61 2.76 3.31 3.16 V26 3.81 4.86 4.12 4.97 V27 1.69 1.4 1.07 2.66 V28 1.7 1.88 1.84 3.67 V29 3.74 3.34 2.85 3.62 V3 2.27 n.d. n.d. n.d. V31 1.68 2.68 1.17 2.13 V7 1.43 2.15 1.82 2.26

57

58
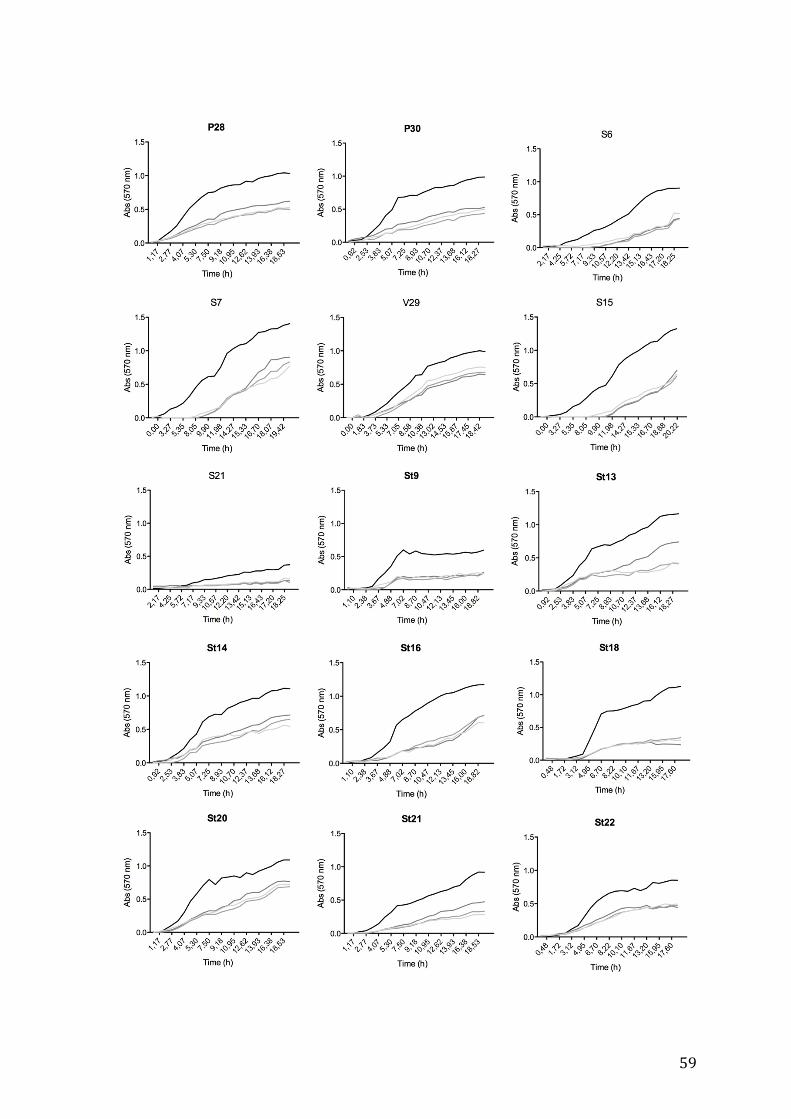
59

60

61
Figure 8.1 – Growth curves of total isolates (not selected for further use).
Legend of all graphs: