biosyst-mebios. model-based approach purpose improve understanding optimization control macroscale...
TRANSCRIPT
BIO
SY
ST
-MeB
ioS
BIO
SY
ST
-MeB
ioS
Model-based approachPurpose
Improve understanding
Optimization
Control
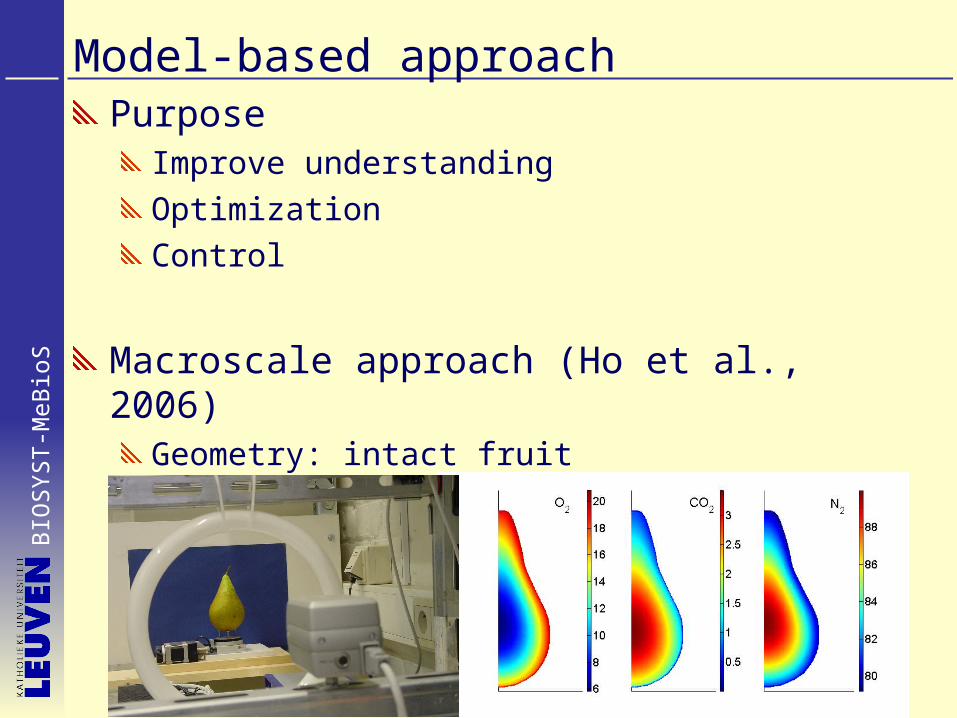
Macroscale approach (Ho et al., 2006)Geometry: intact fruit
Gas transport coupled with respiration kinetics

BIO
SY
ST
-MeB
ioS
Gas transport properties of macroscale Assumption
Homogeneous material
Measurement
Biological variability
DCO2 > DO2
Anisotropic diffusivity Apparant values
Deff
BIO
SY
ST
-MeB
ioS
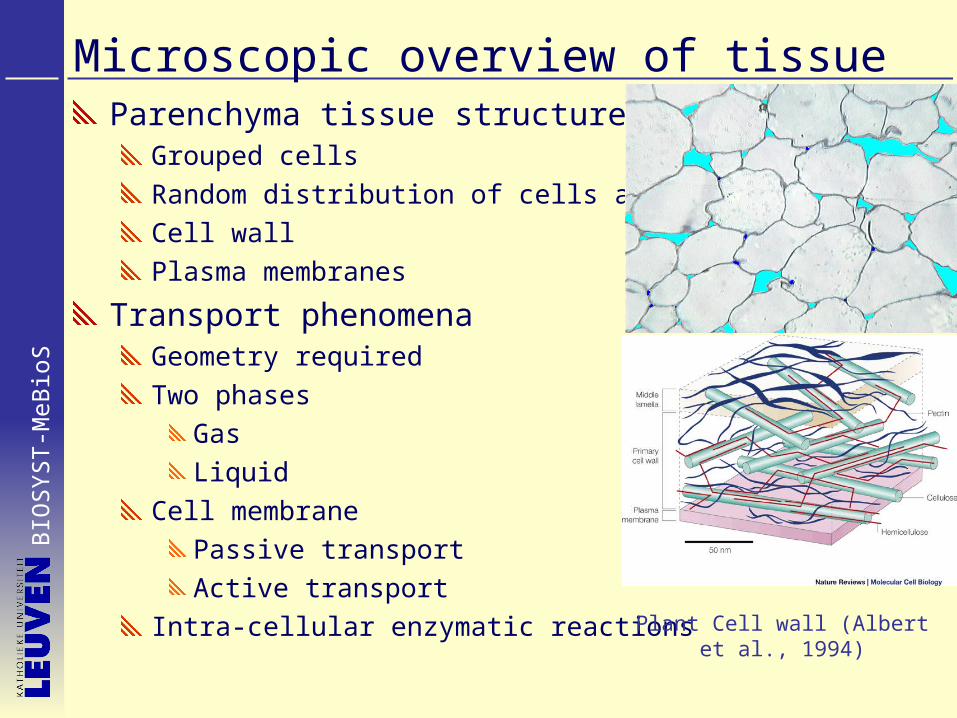
Microscopic overview of tissueParenchyma tissue structure
Grouped cells
Random distribution of cells and pores
Cell wall
Plasma membranes
Transport phenomenaGeometry required
Two phases
Gas
Liquid
Cell membrane
Passive transport
Active transport
Intra-cellular enzymatic reactions Plant Cell wall (Albert et al., 1994)
BIO
SY
ST
-MeB
ioS
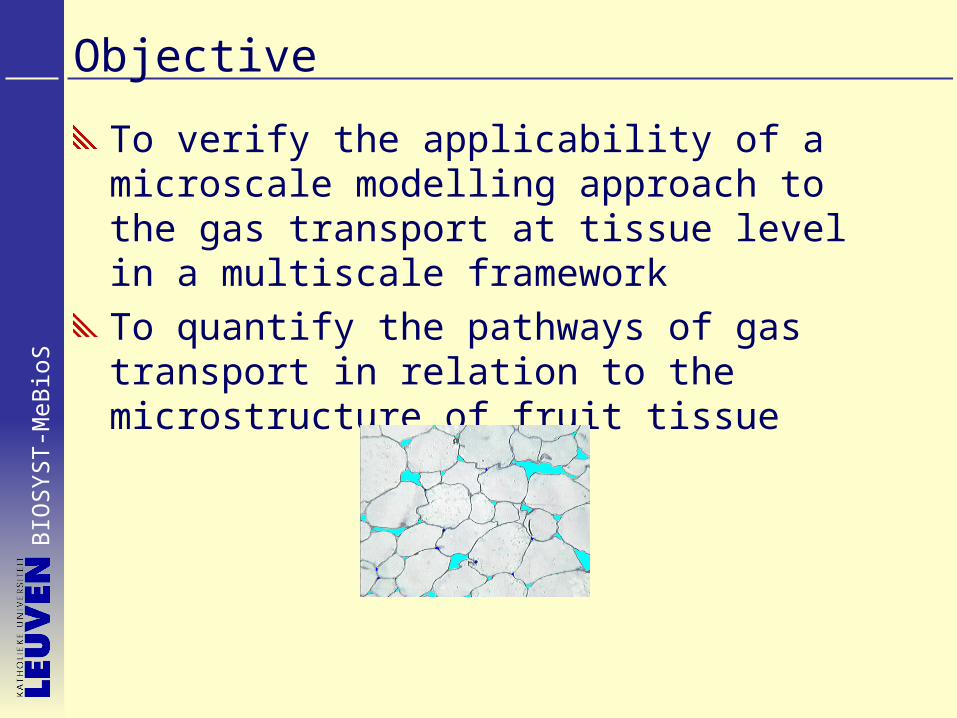
Objective
To verify the applicability of a microscale modelling approach to the gas transport at tissue level in a multiscale framework
To quantify the pathways of gas transport in relation to the microstructure of fruit tissue

BIOSYST-MeBioS www.biw.kuleuven.be
Microscale modelling of gas diffusion in fruit tissue
Q. Tri Ho, Hibru K. Mebatsion, Fernando Mendoza, Bert E. Verlinden, Pieter Verboven, Stefan Vandewalle and Bart M. Nicolaï
IUFoST 13TH WORLD CONGRESS OF FOOD SCIENCE & TECHNOLOGY
Food is Life, 17 -21 September 2006Nantes France

BIO
SY
ST
-MeB
ioS
Geometry model
Light microscopy images (Mebatsion et al, 2006)
Parenchyma tissues of ‘Conference’ pear
Resolution 1pixel~0.735µm
Digitization of image
Geometry model generation (Mebatsion et al, 2006)
Ellipse tessellation algorithm

BIO
SY
ST
-MeB
ioS
Ellipse tesselation
Cell
Cell wall
Intercellular space
TEM image of Conference pear
Cells

BIO
SY
ST
-MeB
ioS
Concept of gas transport
Air filled intercellular space
O2,l
CO2,l
ADP +Pi
ATP synthase
ATP
Work
Mitochondrion
Cytosol
ATP
HCO3-
CO2,g
O2,g
Liquid
Pore
Gas exchange of fruit
At the interface
Intra-cell
BIO
SY
ST
-MeB
ioS
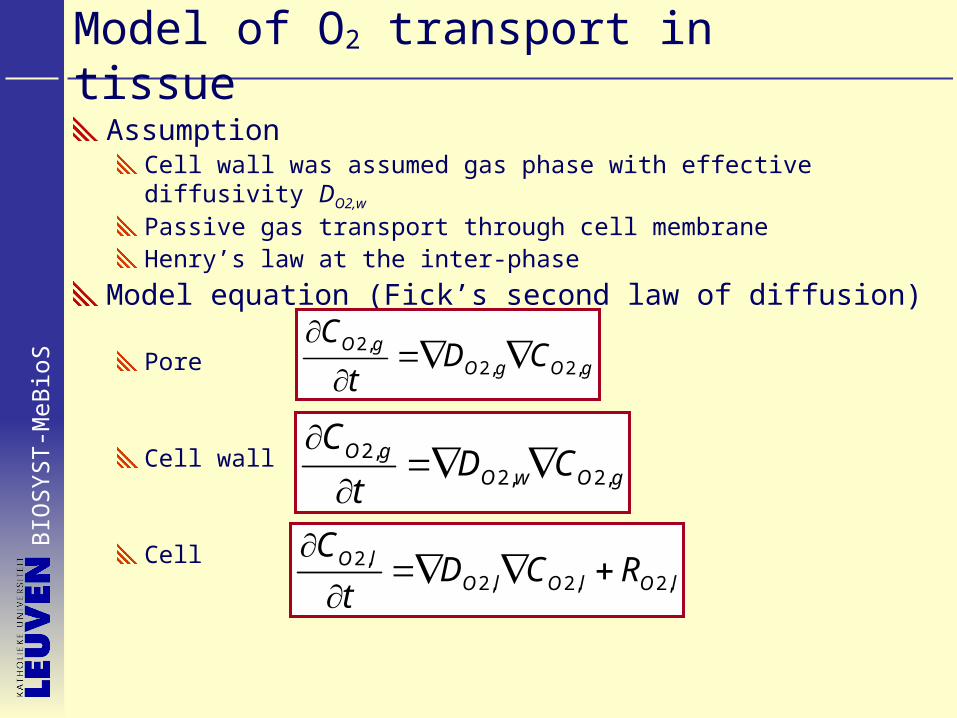
Model of O2 transport in tissue
AssumptionCell wall was assumed gas phase with effective diffusivity DO2,w
Passive gas transport through cell membraneHenry’s law at the inter-phase
Model equation (Fick’s second law of diffusion)
Pore
Cell wall
Cell
2,2, 2,
O gO g O g
CD C
t
2,2, 2,
O gO w O g
CD C
t
2,2, 2, 2,
O lO l O l O l
CD C R
t

BIO
SY
ST
-MeB
ioS
O2 model equation in liquid phase
O2 consumption at intra-cell
Michaelis-Menten reaction
CO2,l can be rewritten in equilibrium gas phase CO2,g
2 2,2
, 2, 2,
mO O lO
m O cell O l
V CR
K C
2,2 2, 2 2, 2
O gO O l O O g O
CR T H D R T H C R
t
BIO
SY
ST
-MeB
ioS
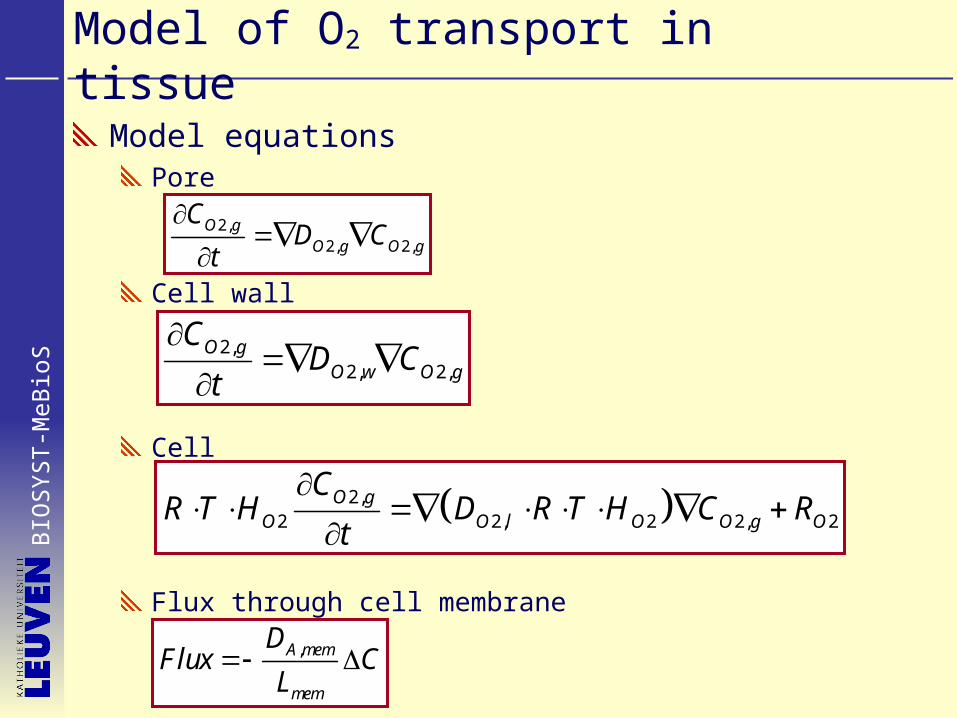
Model of O2 transport in tissue
Model equations Pore
Cell wall
Cell
Flux through cell membrane
2,2, 2,
O gO g O g
CD C
t
2,2, 2,
O gO w O g
CD C
t
2,2 2, 2 2, 2
O gO O l O O g O
CR T H D R T H C R
t
,A mem
mem
DFlux C
L

BIO
SY
ST
-MeB
ioS
Physical parametersLiterature Model
Diffusivity: Pore
Cell
Cell wall
DO2,gas =1.6×10⁻⁵ m2/s (1)
DO2,l=2.01×10⁻⁹ m2/s (1)
DO2,W = ?
DO2,gas=1.6 ×10⁻⁹ m2/s
DO2,l=2.01 ×10⁻⁹ m2/s
DO2,W = 5×10⁻⁹ m2/s
Cell wall thickness 0.76 µm 0.76 µm
Membrane L =6-10 nm (2)
DO2,membrane =2.91×10⁻⁹ m2/s (3)
Permeability
hO2=3.63 ×10⁻² m/s
Henry’s constant HO2=0.01371 (mol/m3Pa) (1) HO2=0.01371 (mol/m3Pa)
Source : 1: Lide (1999)
2: Gunning and Steer (1996)
3: Uchida et al. (1992)

BIO
SY
ST
-MeB
ioS
Numerical solution
Meshing125050 elements
SolutionFinite element method
Femlab 3.1 (Comsol AB, Stockholm)

BIO
SY
ST
-MeB
ioS
Estimation of Dtissue, eff
Steady stateBoundary condition
Side 1: C1 ; Side 2: C2
C2
C1
Ltissue
,tissue
tissue eff
Flux LD
C
Isolated boundary

BIO
SY
ST
-MeB
ioS
Simulation result
BIO
SY
ST
-MeB
ioS
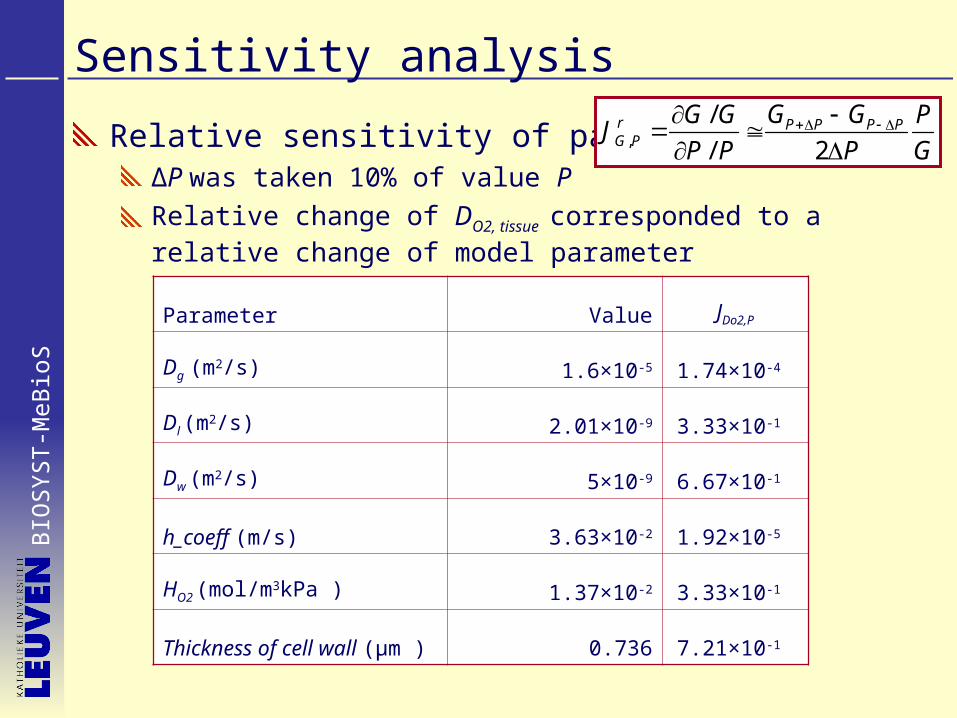
Sensitivity analysis
Relative sensitivity of parameter:∆P was taken 10% of value P
Relative change of DO2, tissue corresponded to a relative change of model parameter
,
/
/ 2r P P P PG P
G GG G PJ
P P P G
Parameter Value JDo2,P
Dg (m2/s) 1.6×10⁻⁵ 1.74×10⁻⁴
Dl (m2/s) 2.01×10⁻⁹ 3.33×10⁻¹
Dw (m2/s) 5×10⁻⁹ 6.67×10⁻¹
h_coeff (m/s) 3.63×10⁻² 1.92×10⁻⁵
HO2 (mol/m3kPa ) 1.37×10⁻² 3.33×10⁻¹
Thickness of cell wall (µm ) 0.736 7.21×10⁻¹

BIO
SY
ST
-MeB
ioS
Estimated O2 diffusivity of pear tissue
DO2, tissue (m2/s)
Micro scale Ellipse Tesselation 3.2×10⁻¹⁰
Measurement (Macro scale)(2.560.48)10-10 (Ho et al., 2005)(4.31.7)10-10 (Schotsmans et al., 2003)
DO2,cell wall =5×10⁻⁹ m2/sCell wall thickness= 0.73 µm
(TEM, Mebatsion 2006, unpublished data)
BIO
SY
ST
-MeB
ioS
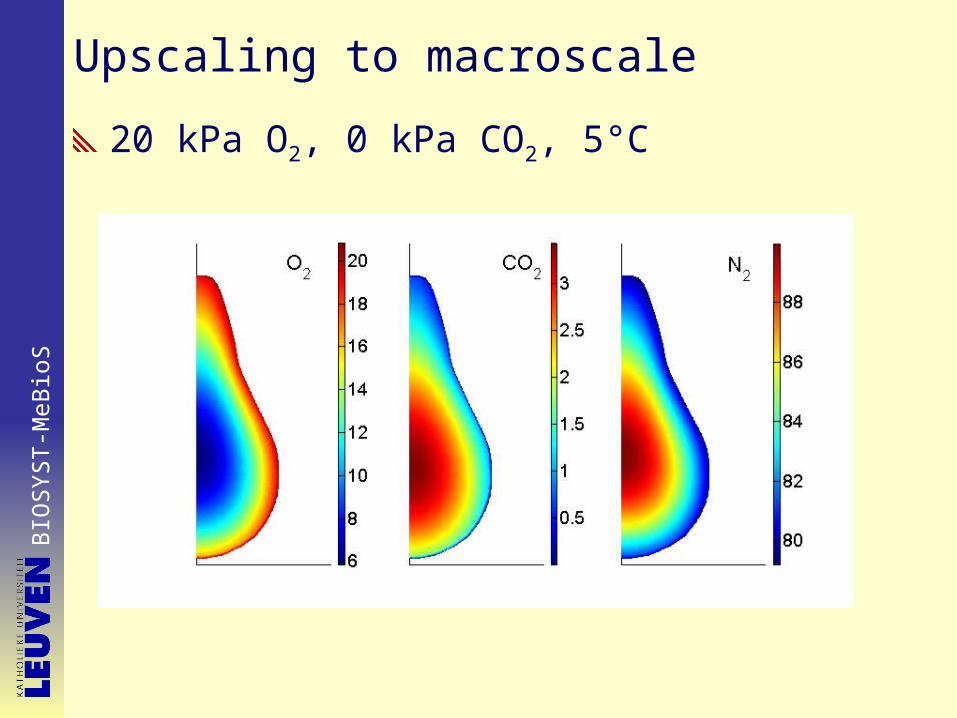
Upscaling to macroscale
20 kPa O2, 0 kPa CO2, 5°C
BIO
SY
ST
-MeB
ioS
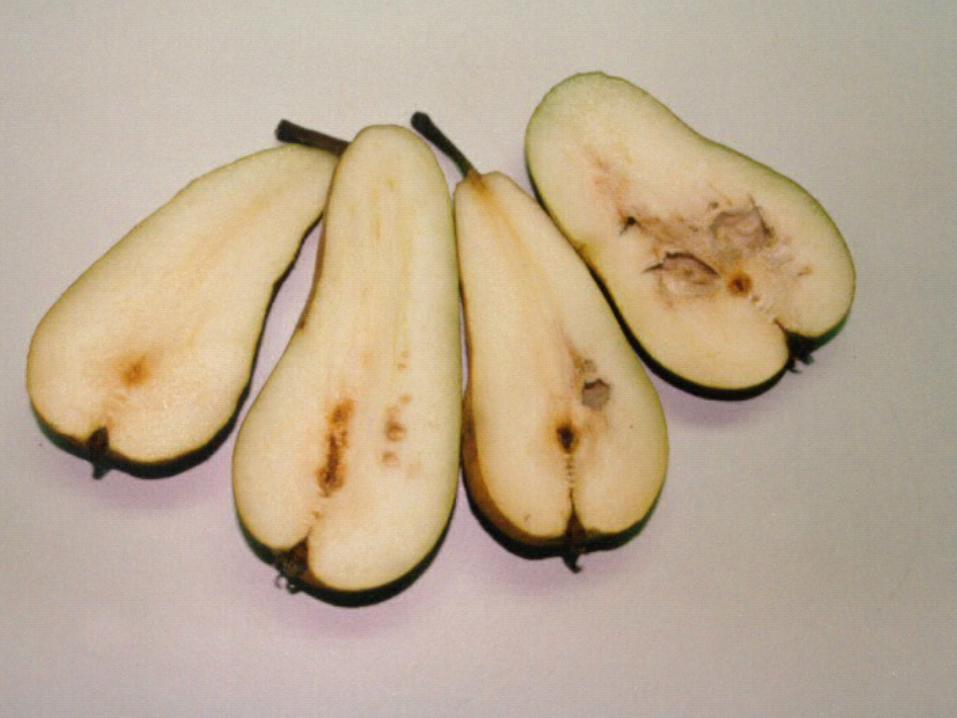
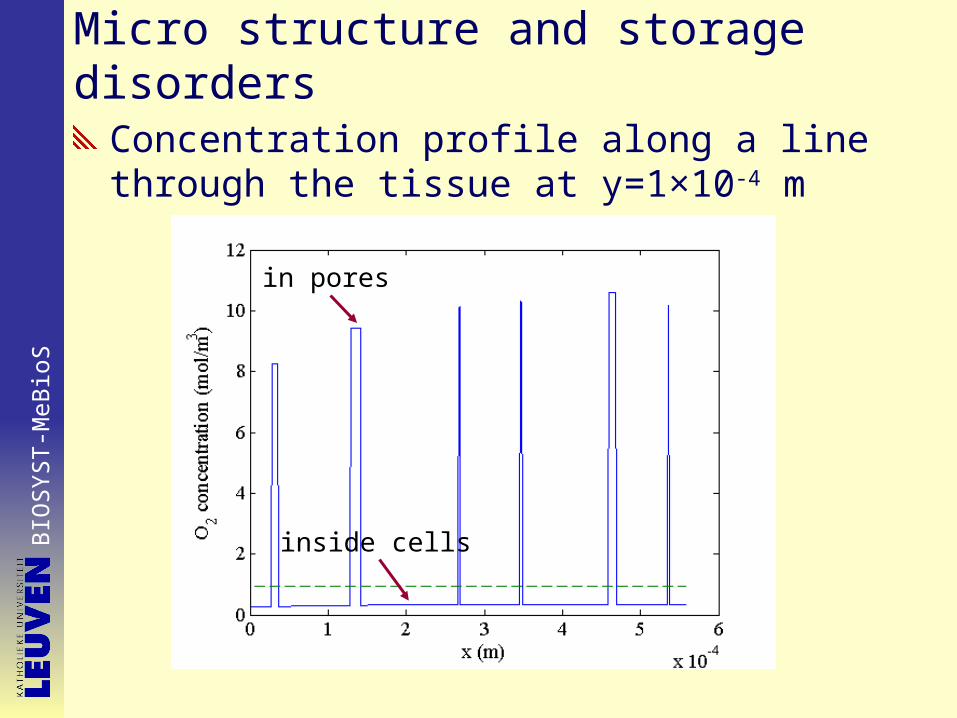
Micro structure and storage disorders
Concentration profile along a line through the tissue at y=1×10⁻⁴ m
inside cells
in pores
BIO
SY
ST
-MeB
ioS
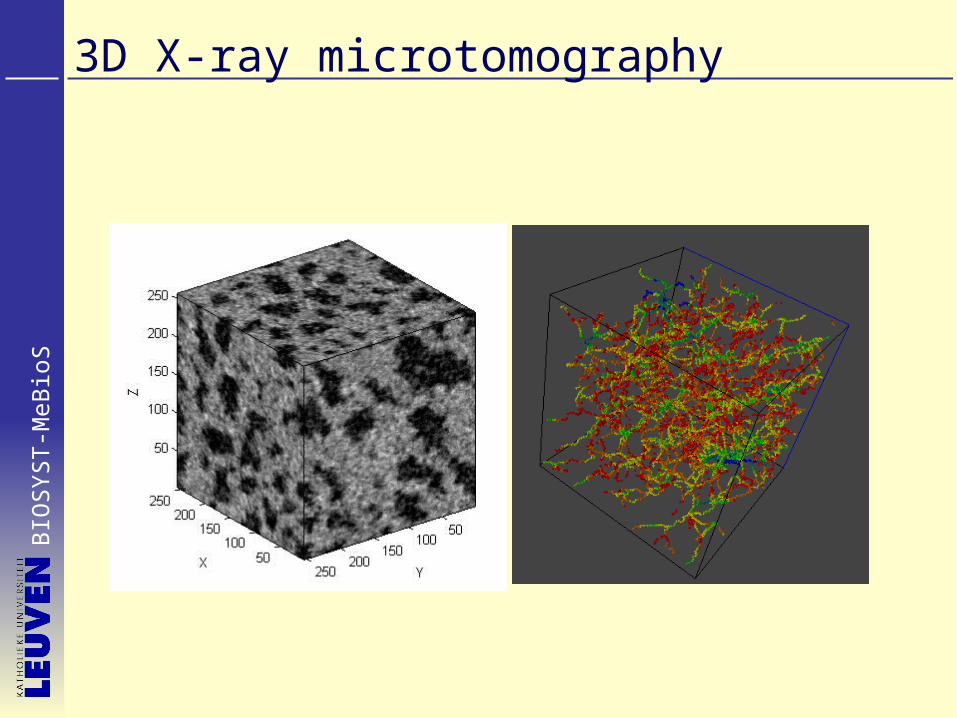
3D X-ray microtomography

BIO
SY
ST
-MeB
ioS
Conclusions
A model was presented to study gas transport at the microscale
O2 mainly transports in the gas phase of intercellular space and cell wall networks
Macroscopic diffusivity was estimated using microscale simulations
Important consequences for respiration–related disorders

BIO
SY
ST
-MeB
ioS
Thank you