citethis:mol. iosyst.,2011,7 ,14091419 paper ournal is c the royal society of chemistry 2011 mol....
TRANSCRIPT
This journal is c The Royal Society of Chemistry 2011 Mol. BioSyst., 2011, 7, 1409–1419 1409
Cite this: Mol. BioSyst., 2011, 7, 1409–1419
Tracking cellular metabolomics in lipoapoptosis- and steatosis-developing
liver cells
Yasushi Noguchi, Jamey D. Young, Jose O. Aleman, Michael E. Hansen,
Joanne K. Kelleher and Gregory Stephanopoulos*
Received 2nd December 2010, Accepted 24th January 2011
DOI: 10.1039/c0mb00309c
Palmitate (PA) is known to induce reactive oxygen species (ROS) formation and apoptosis in liver
cells, whereas concurrent treatment of oleate (OA) with PA predominately induces steatosis
without ROS in liver cells. We previously reported that PA treatment induces the decoupling of
glycolysis and tricarboxylic acid cycle (TCA cycle) fluxes, but OA co-treatment restored most
metabolic fluxes to their control levels. However, the mechanisms by which metabolites are linked
to metabolic fluxes and subsequent lipoapoptotic or steatotic phenotypes remain unclear.
To determine the link, we used GC-MS-based polar and non-polar metabolic profiling in
lipoapoptosis- or steatosis-developing H4IIEC3 hepatoma cells, to examine the metabolome at
different time points after treatment with either PA alone (PA cells) or both PA and OA
(PA/OA cells). Metabolic profiles revealed various changes in metabolite levels for TCA cycle
intermediates, pentose phosphate pathway (PPP) intermediates, and energy storage metabolites
between PA and PA/OA cells. For example, adenosine was markedly increased only in PA cells,
whereas gluconate was increased in PA/OA cells. To assess the interaction among these metabolites,
the metabolite-to-metabolite correlations were calculated and correlation networks were visualized.
These correlation networks demonstrate that a dissociation among PPP metabolites was introduced
in PA-treated cells, and this dissociation was restored in PA/OA-treated cells. Thus, our data
suggest that abnormal PPP fluxes, in addition to increased adenosine levels, might be related to
the decoupling of glycolysis and the resulting lipoapoptotic phenotype.
Introduction
Analysis of the cellular metabolome is important when relating
metabolites to cellular phenotype.1,2 Various metabolomic
studies have been reported in cellular models of drug
response,3 adipocytes,4 viral infection,5 carcinogenesis6,7 and
more recently embryonic stem cell differentiation.8
Elevated serum free fatty acids (FFA) cause hepatic apoptosis,9
which is a prominent feature of non-alcoholic steatohepatitis
(NASH) that correlates with disease severity.10 Previous
in vitro studies in Chinese hamster ovary (CHO) cells,9,11
cardiac myocytes,12 pancreatic b-cells,13 and hepatic cells14,15
demonstrated that saturated fatty acids (SFA), but not mono-
unsaturated fatty acids (MUFAs), induce reactive oxygen
species (ROS) generation and apoptosis, whereas MUFAs
predominately induce steatosis. An earlier study showed that
MUFA co-treatment changed the palmitate (PA)-induced
phenotype from apoptosis to steatosis by diverting SFA into
triglyceride synthesis, thereby reducing apoptosis in CHO cells.11
Ceramide accumulation has been considered as a primary factor
responsible for SFA-induced ROS generation and apoptosis
because ceramides are synthesized de novo from PA and serine,
and they also have been shown to activate apoptotic signaling.16
More recent studies including ours, however, have reported that
SFA can induce apoptosis through ROS formation17 and
endoplasmic reticulum stress, independent of intracellular
ceramide levels.18
We previously examined metabolic flux using isotopic
tracers to quantify phenotypic changes in H4IIEC3 hepatoma
cells treated with either PA alone (PA cells) or a combination
of PA and oleate (OA) (PA/OA cells).17 Our results indicate
that the FFA-induced ROS generation and apoptosis are
accompanied by the decoupling of glycolytic and TCA cycle
fluxes, leading to abnormal cytosolic redox states. However,
the mechanism by which glycolytic and TCA cycle fluxes are
disconnected by elevated serum FFA is still indistinct.
To further address this question, we hypothesized that there
could be as yet unknown metabolites that contribute to the
dissociation between glycolysis and the TCA cycle leading to
ROS generation in the early phases of apoptosis in cells.
In the current study, we conducted GC-MS-based
comprehensive profiling of polar and non-polar metabolites
Department of Chemical Engineering, Massachusetts Institute ofTechnology, Cambridge MA 02139, USA. E-mail: [email protected];Fax: +1 617-253-3122; Tel: +1 617-258-0398
MolecularBioSystems
Dynamic Article Links
www.rsc.org/molecularbiosystems PAPER
Dow
nloa
ded
by V
ande
rbilt
Uni
vers
ity o
n 25
Jan
uary
201
2Pu
blis
hed
on 1
6 Fe
brua
ry 2
011
on h
ttp://
pubs
.rsc
.org
| do
i:10.
1039
/C0M
B00
309C
View Online / Journal Homepage / Table of Contents for this issue

1410 Mol. BioSyst., 2011, 7, 1409–1419 This journal is c The Royal Society of Chemistry 2011
to find metabolites corresponding to fatty acid induced
apoptosis or steatosis in H4IIEC3 hepatoma cells. These
metabolites were then correlated with other metabolites
discovered separately in apoptotic and steatotic cells, to
identify factors causing SFA-induced apoptosis and restoration
of normal cellular metabolism by MUFA.
Results
PA-induced lipoapoptosis and restoration of normal cellular
metabolism by OA under normal physiological amino acid
concentrations
Previously, we showed that PA induced the decoupling of the
glycolytic and TCA cycle fluxes in H4IIEC3 rat hepatoma cells
cultured in media containing physiological amino acid
concentrations, whereas treatment with OA in addition to
PA restored most fluxes to normal levels.17 Table 2 shows the
influence of treatment with 400 mM PA or OA alone or
co-treatment with 10, 50 or 200 mMOA on ROS concentration,
cell viability and cellular lipid levels using growth medium
containing the same amino acid composition. The data clearly
show that the induction of ROS and cell death were caused by
treatment with PA alone, whereas treatment with OA alone
and concurrent treatment with OA and PA increased cellular
lipid concentration (Table 2 and Fig. 1). Co-treatment with
OA concentrations over 50 mMwas sufficient to normalize PA-
induced ROS generation and to restore cell viability (Fig. 1).
Treatment with PA disturbs cellular metabolite levels
In the present study, we investigated time-dependent changes in
cellular metabolite concentrations after the treatment of H4IIEC3
cells with 400 mM PA alone (PA cells) or both 400 mM PA and
50 mM OA (PA/OA cells), to identify metabolites related to
apoptosis and steatosis. We applied GC-MS based comprehensive
metabolite profiling to untreated cells, PA-cells and PA/OA-cells
after varying incubation times (3, 6 and 12 h). In these experiments,
the amino acid concentrations were set at physiological levels (total
amino acids= 2.15 mM). Representative GC-MS chromatograms
of polar and non-polar metabolites from H4IIEC3 cells are shown
in Fig. 3. Using our method, we were able to simultaneously
observe concentrations of various amino acids, organic acids,
nucleic acids and sugar metabolites from polar extracts in addition
to concentrations of FFA, cholesterols, ceramides, monoacyl-
glycerols and diacylglycerols from non-polar extracts (Fig. 2A
and B). We identified a total of 468 peaks from polar (325 peaks)
and non-polar (143 peaks) fractions obtained from H4IIEC3 cell
lysates (data not shown). After the removal of non-reproducible
peaks, we were left with a total of 254 well-conserved peaks and
identified 107 metabolites from these peaks, using the NIST05 and
in-house standard libraries as described in Experimental
Procedures.
Fig. 3A shows the relative abundance (R.A.) of 254 meta-
bolites against p-values derived from a 2-way ANOVA. The
33 most abundant and significant metabolites (R.A. > 0.5 and
p o 0.00005) from Fig. 3A were subjected to FDA to obtain a
clear time-dependent separation among untreated cells, PA cells
and PA/OA cells (Fig. 3B and C). In Fig. 3B and C, the y1 axis
roughly corresponds to the steatotic phenotype, and the y2 axis
represents the apoptotic phenotype. We identified marker
metabolites including adenosine, malate, serine, citrate, aspartate,
C16 ceramide and diacylglycerol (DAG) in PA cells and fructose,
gluconate, glutamate and desmosterol in PA/OA cells. In
addition, we found relatively high glycerate levels in both
untreated and PA cells in comparison to PA/OA cells. A detailed
list of these marker metabolites is presented in Table 3. We also
explored low-abundance metabolites as phenotypic markers, as
described in Fig. 4A (total 117 metabolites, R.A. > 0.001 and
p o 0.00005). Pearson (r) correlation analysis between the most
and least abundant metabolites listed in Table 3 allowed the
identification of pyruvate, galactonate and other minor ceramide
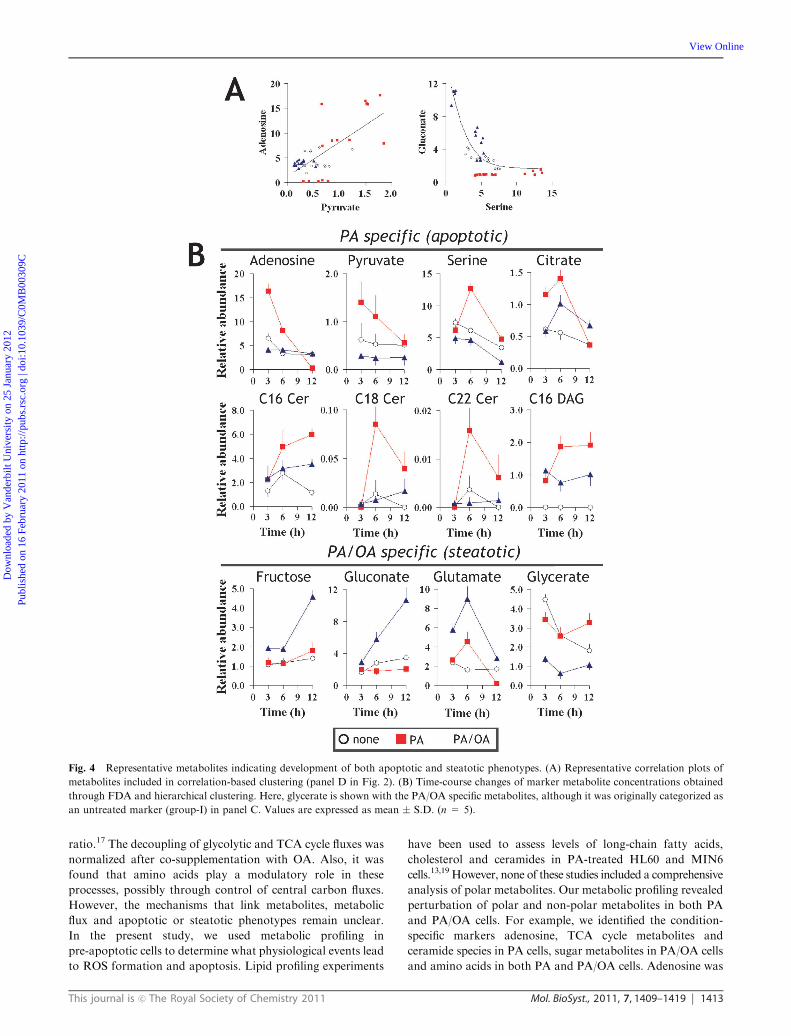
species as additional markers (Fig. 3D). Representative
correlation plots are shown in Fig. 4A. Pyruvate exhibited a clear
positive correlation with adenosine. Serine, a marker of PA cells,
showed a positive correlation with alanine but a negative
correlation with gluconate, a marker of PA/OA cells (Fig. 4A).
Time-dependent changes in phenotypic metabolites are shown in
Fig. 4B. Cellular adenosine and pyruvate were strongly increased
in PA cells from 3 to 6 h but were decreased at 12 h (Fig. 4B).
Additionally, ceramide and 1,2 dipalmitoylglycerol (DAG) levels
were continuously higher in PA cells than in PA/OA-cells
(Fig. 4B). Both gluconate and galactonate were increased only
in PA/OA cells (Fig. 4B). Glycerate, a product of glycerolipids,
was consistently lower in PA/OA cells (Fig. 4B).
Fig. 1 Microscopic observations of FFA-induced lipid accumulation and ROS generation in H4IIEC3 cells. Cells were incubated with 400 mMpalmitate (PA), 400 mM oleate (OA), 400 mM PA plus 10 mM or 50 mM OA or without FFA (none) for either 12 h (for ROS detection) or 24 h
(for lipid detection). Cellular lipids and ROS were determined using Nile red and DCF fluorescence, respectively.
Dow
nloa
ded
by V
ande
rbilt
Uni
vers
ity o
n 25
Jan
uary
201
2Pu
blis
hed
on 1
6 Fe
brua
ry 2
011
on h
ttp://
pubs
.rsc
.org
| do
i:10.
1039
/C0M
B00
309C
View Online

This journal is c The Royal Society of Chemistry 2011 Mol. BioSyst., 2011, 7, 1409–1419 1411
Comparison of metabolite–metabolite correlation between
apoptotic and steatotic cells
Changes in metabolite–metabolite correlation pairs between
control and apoptotic or steatotic phenotypes were assessed
using a total of 117 metabolites (R.A. > 0.001 and p o0.00005). We choose to use Spearman r for comparison of
metabolite–metabolite correlated pairs because we found non-
linear relationships in most of the scatter plots (Fig. 5A).
Fig. 5A shows a histogram of the Spearman r between each
metabolite-to-metabolite pair, where 6786 metabolite-to-
metabolite pairs were generated from 117 metabolites. To
examine whether FFA treatments altered the correlation
between metabolite-to-metabolite pairs, the metabolite-to-
metabolite pairs were arranged in order of the change in rbetween the two groups from the negative to positive
maximum, leading to the finding that some of the metabolites
were clearly sensitive to FFA treatment (Fig. 5B).
To assess the significance of correlated pairs, we determined a
false discovery rate (FDR) by estimating a q-value for each
correlated pair. Predicted q-values for PA and PA/OA conditions
were compared to p-values for approximately 6786 metabolite
pairs (Fig. 5C). For the PA-cell dataset, a p-value of 0.0488 has a
corresponding q value of 0.05, which on average was associated
with a correlation value (r) of 0.55 (Fig. 5D). This estimation of
the FDR was different from the distribution seen in the PA/OA
cell dataset. In PA/OA cell data, a p-value of 0.0594 has a
corresponding q value of 0.05, which on average was associated
with a correlation value (r) of 0.53 (Fig. 5D).
Comparison of the metabolite-to-metabolite network between
apoptotic and steatotic cells
Metabolite-to-metabolite correlated pairs were visualized as
network graphs using the Spearman r matrices obtained from
PA and PA/OA cells (Fig. 6). For this analysis, a correlation
cutoff was set at 0.55, which is greater than the minimum
r value of 0.05 indicated by a q-value of 0.05 (Fig. 5C). The
q value estimation of the FDR suggests that correlations
having an absolute value greater than 0.55 are likely to be
reproducible. To evaluate the significance of each element in
the correlation network, we used the degree as a standard
measure of centrality, and also applied a k-core analysis to
generate a sequence of sub-networks that gradually reveals the
globally central region of the original network. In Fig. 6, each
node is characterized by shape (metabolite), size (degree of
correlation) and color (‘‘coreness’’). In addition, a red or blue
line corresponds to whether the relationship lies inside or
outside of the coreness—kmax, respectively. Correlation
networks in apoptotic and steatotic groups were developed
using PA cells (n= 15) and PA/OA cells (n= 15), respectively
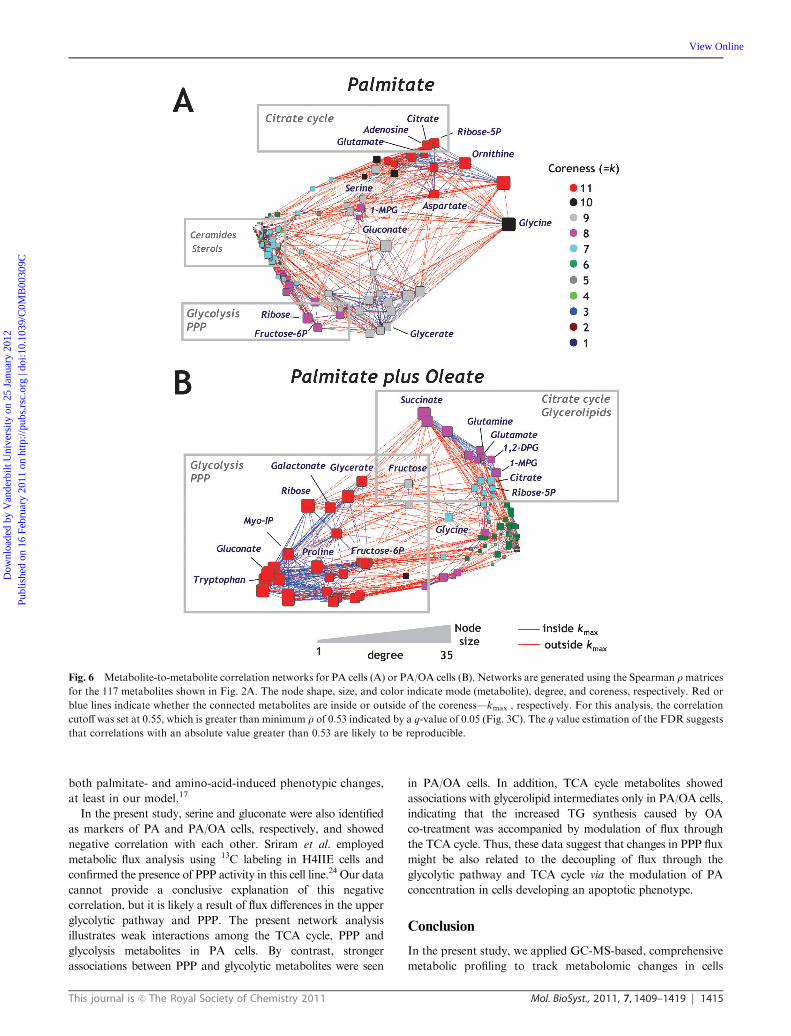
(Fig. 6A and B). In PA cells, network analysis revealed a
relatively higher degree of correlation among TCA cyclerelated
metabolites such as citrate, glutamate and adenosine with
smaller node sizes, with the glycolytic and PPP metabolites
fructose-6P, ribose-5P and gluconate observed to scatter
broadly among the network, generating different clusters
(Fig. 6A). Notably, ceramides and other lipid molecules were
observed to have smaller degrees of centrality and coreness.
Thus, this network reveals weak interactions among TCA
cycle, PPP and glycolysis metabolites in PA cells. By contrast,
PA/OA cells show a higher degree of correlation between PPP
and glycolytic metabolites, such as fructose-6P, ribose,
gluconate and galactonate. In addition, TCA cycle inter-
mediates and mono- or diacylglycerols showed relatively
higher degrees of centrality and coreness in PA/OA cells,
suggesting that the coordination between the TCA cycle
and lipogenesis was accelerated to provide for triglyceride
production in these cells (Fig. 6C).
Fig. 2 Representative gas chromatography profiles of polar and non-polar metabolites from H4IIEC3 cells. A biphasic metabolite extraction was
examined from H4IIEC3 cells grown in 100 mm dishes, with polar metabolites partitioning into a methanol/water phase (A) and non-polar
metabolites partitioning into a chloroform phase (B). GC-MS analysis was performed as described in the Experimental Procedures with the non-
polar internal standards 4.96 nmol pentadecanoate, 2.94 nmol 5a-cholestane and 4.2 nmol N-pentadecanoyl-sphingosine (C15 ceramide) in
addition to the polar internal standards 9.9 nmol ribitol (shown in italics).
Dow
nloa
ded
by V
ande
rbilt
Uni
vers
ity o
n 25
Jan
uary
201
2Pu
blis
hed
on 1
6 Fe
brua
ry 2
011
on h
ttp://
pubs
.rsc
.org
| do
i:10.
1039
/C0M
B00
309C
View Online

1412 Mol. BioSyst., 2011, 7, 1409–1419 This journal is c The Royal Society of Chemistry 2011
Discussion
We previously used stable isotopic analyses of metabolic flux
in central carbon metabolic pathways to uncover metabolic
disturbances that precede the onset of apoptotic or steatotic
phenotypes.17 Our results clearly show that the activation of
TCA fluxes by PA occurs concomitantly with a reduction of
glycolysis and an increase in the cytosolic NAD+/NADH
Fig. 3 Marker identification from H4IIEC3 cells developing apoptotic and steatotic phenotypes. (A) Comprehensive metabolite profiles of
untreated cells, PA cells and PA/OA cells at varying incubation times (3, 6 and 12 h) were obtained using GC-MS analyses as shown in Fig. 1. In
total, 254 well-conserved peaks were obtained using the SpectConnect software, and 107 metabolites were identified using the NIST05 and in-
house standard libraries. Relative abundances (R.A.) against p values from the 2-way ANOVA of 254 metabolites are shown inside the blue box in
panel A, with the 117 metabolites with relatively higher significance (R.A. > 0.001 and p o 0.00005) and the 33 most abundant and significant
metabolites (R.A. > 0.5 and po 0.00005) highlighted inside orange and red boxes, respectively. (B and C) Fisher discriminant analysis (FDA) and
its loading plot. The y1 axis roughly corresponds to the steatotic phenotype, and the y2 axis represents the apoptotic phenotype. In panel B, PA
and PA/OA conditions are represented by red and blue symbols, respectively, and the FDA analysis shows the time-dependent separation among
the three groups. In panel C, polar and non-polar metabolites are shown as blue and pink symbols, respectively. A detailed list of marker
metabolites is presented in Table 3. (D) Correlation-based clustering to explore phenotypic metabolites from the low R.A. metabolites (total 117
metabolites, orange symbols in panel A). Metabolites with red text represent highly reliable markers obtained from FDA (panel C).
Dow
nloa
ded
by V
ande
rbilt
Uni
vers
ity o
n 25
Jan
uary
201
2Pu
blis
hed
on 1
6 Fe
brua
ry 2
011
on h
ttp://
pubs
.rsc
.org
| do
i:10.
1039
/C0M
B00
309C
View Online
This journal is c The Royal Society of Chemistry 2011 Mol. BioSyst., 2011, 7, 1409–1419 1413
ratio.17 The decoupling of glycolytic and TCA cycle fluxes was
normalized after co-supplementation with OA. Also, it was
found that amino acids play a modulatory role in these
processes, possibly through control of central carbon fluxes.
However, the mechanisms that link metabolites, metabolic
flux and apoptotic or steatotic phenotypes remain unclear.
In the present study, we used metabolic profiling in
pre-apoptotic cells to determine what physiological events lead
to ROS formation and apoptosis. Lipid profiling experiments
have been used to assess levels of long-chain fatty acids,
cholesterol and ceramides in PA-treated HL60 and MIN6
cells.13,19 However, none of these studies included a comprehensive
analysis of polar metabolites. Our metabolic profiling revealed
perturbation of polar and non-polar metabolites in both PA
and PA/OA cells. For example, we identified the condition-
specific markers adenosine, TCA cycle metabolites and
ceramide species in PA cells, sugar metabolites in PA/OA cells
and amino acids in both PA and PA/OA cells. Adenosine was
Fig. 4 Representative metabolites indicating development of both apoptotic and steatotic phenotypes. (A) Representative correlation plots of
metabolites included in correlation-based clustering (panel D in Fig. 2). (B) Time-course changes of marker metabolite concentrations obtained
through FDA and hierarchical clustering. Here, glycerate is shown with the PA/OA specific metabolites, although it was originally categorized as
an untreated marker (group-I) in panel C. Values are expressed as mean � S.D. (n = 5).
Dow
nloa
ded
by V
ande
rbilt
Uni
vers
ity o
n 25
Jan
uary
201
2Pu
blis
hed
on 1
6 Fe
brua
ry 2
011
on h
ttp://
pubs
.rsc
.org
| do
i:10.
1039
/C0M
B00
309C
View Online

1414 Mol. BioSyst., 2011, 7, 1409–1419 This journal is c The Royal Society of Chemistry 2011
strongly increased in PA cells. Recent studies have presented
evidence that PA can inhibit the adenosine nucleotide
translocator (ANT) in isolated mitochondria.20,21 Inhibition
of ANT has been proposed to contribute to cellular dysfunction
by increasing ROS and adenosine levels by affecting the
coenzyme Q redox state, mitochondrial membrane potential
and cytosolic ATP concentration.21 Furthermore, exchange of
ATP and ADP via ANT across the mitochondrial membrane
is normally cooperative with the hexokinase reaction, a first
step of glycolysis.22,23 Thus, inhibition of ANT could
potentially lead to reduced glycolysis and an increased
cytosolic NAD+/NADH ratio.
Ceramide has been considered as a factor responsible for
palmitate-induced apoptosis, because it also has been shown
to activate apoptotic signaling. Recent studies, however, have
reported that SFAs can induce apoptosis through ROS
formation and endoplasmic reticulum stress without altering
intracellular ceramide levels.16 In our previous study, ceramide
synthesis inhibitors had no effect on palmitate-induced ROS
generation and caspase 3/7 activation, even though they
completely suppressed cellular ceramide.17 Ceramide is known
to be synthesized de novo from palmitate and serine. We
previously showed that cellular ceramide could be influenced
by medium amino acid availability, but it is not involved in
Fig. 5 Metabolite-to-metabolite correlativity in FFA-treated H4IIEC3 cells. (A) Histograms of Spearman’s rank correlation (r) of metabolite-to-
metabolite correlated pairs calculated for metabolites from PA cells (sum of 3, 6, 12 h time points, n= 15) and PA/OA cells (sum of 3, 6, 12 h time
points, n=15). In total, 6786 metabolite-to-metabolite pairs were generated from 117 metabolites described in Fig. 2A. (B) Changes in metabolite-
to-metabolite correlations (r) after treatment with FFA. Metabolite-to-metabolite pairs are ranked in order of the change in r (PA/OA–PA) from
negative maximum to positive maximum (bottom panel). (C) Estimation of the false discovery rate (FDR). Comparisons of q-values and p-values
for the metabolite:metabolite correlates are shown for the datasets from PA-cells and PA/OA-cells; q values of 0.05 for PA-cells and PA/OA-cells
are associated with p values of approximately 0.0488 and 0.0594, respectively. (D) Distribution of metabolite-to-metabolite correlations (r) top-values.
Dow
nloa
ded
by V
ande
rbilt
Uni
vers
ity o
n 25
Jan
uary
201
2Pu
blis
hed
on 1
6 Fe
brua
ry 2
011
on h
ttp://
pubs
.rsc
.org
| do
i:10.
1039
/C0M
B00
309C
View Online
This journal is c The Royal Society of Chemistry 2011 Mol. BioSyst., 2011, 7, 1409–1419 1415
both palmitate- and amino-acid-induced phenotypic changes,
at least in our model.17
In the present study, serine and gluconate were also identified
as markers of PA and PA/OA cells, respectively, and showed
negative correlation with each other. Sriram et al. employed
metabolic flux analysis using 13C labeling in H4IIE cells and
confirmed the presence of PPP activity in this cell line.24 Our data
cannot provide a conclusive explanation of this negative
correlation, but it is likely a result of flux differences in the upper
glycolytic pathway and PPP. The present network analysis
illustrates weak interactions among the TCA cycle, PPP and
glycolysis metabolites in PA cells. By contrast, stronger
associations between PPP and glycolytic metabolites were seen
in PA/OA cells. In addition, TCA cycle metabolites showed
associations with glycerolipid intermediates only in PA/OA cells,
indicating that the increased TG synthesis caused by OA
co-treatment was accompanied by modulation of flux through
the TCA cycle. Thus, these data suggest that changes in PPP flux
might be also related to the decoupling of flux through the
glycolytic pathway and TCA cycle via the modulation of PA
concentration in cells developing an apoptotic phenotype.
Conclusion
In the present study, we applied GC-MS-based, comprehensive
metabolic profiling to track metabolomic changes in cells
Fig. 6 Metabolite-to-metabolite correlation networks for PA cells (A) or PA/OA cells (B). Networks are generated using the Spearman rmatrices
for the 117 metabolites shown in Fig. 2A. The node shape, size, and color indicate mode (metabolite), degree, and coreness, respectively. Red or
blue lines indicate whether the connected metabolites are inside or outside of the coreness—kmax , respectively. For this analysis, the correlation
cutoff was set at 0.55, which is greater than minimum r of 0.53 indicated by a q-value of 0.05 (Fig. 3C). The q value estimation of the FDR suggests
that correlations with an absolute value greater than 0.53 are likely to be reproducible.
Dow
nloa
ded
by V
ande
rbilt
Uni
vers
ity o
n 25
Jan
uary
201
2Pu
blis
hed
on 1
6 Fe
brua
ry 2
011
on h
ttp://
pubs
.rsc
.org
| do
i:10.
1039
/C0M
B00
309C
View Online

1416 Mol. BioSyst., 2011, 7, 1409–1419 This journal is c The Royal Society of Chemistry 2011
developing lipoapoptotic and steatotic phenotypes, and we
successfully identified phenotype-specific changes. We believe
that our methods can be used as powerful tools for the
discovery of metabolic profiles in various mammalian cell
models. Further studies will be needed to determine the
significance of all identified metabolites in these lipoapoptotic
and steatotic phenotypes.
Experimental procedures
Materials
Free amino acids were purchased from Sigma (St. Louis, MO,
USA). Fatty-acid-free bovine serum albumin (BSA) was
purchased from JRH Biosciences (Lenexa, KS, USA).
Amino-acid-free Dulbecco’s modified Eagle’s medium
(DMEM) was a gift from Ajinomoto (Tokyo, Japan). All
silylation reagents used in this study were purchased from
Pierce (Rockford, IL, USA).
Cell culture
H4IIEC3 cells (American Type Culture Collection, Manassas,
VA, USA) were cultured in DMEM supplemented with 10%
fetal bovine serum, 50 units per ml penicillin and 50 units per
ml streptomycin sulfate. Medium was changed to a customized
medium containing 25 mM glucose, 2.15 mM amino acids,
amino-acid-free DMEM, 20 mM HEPES and 0.5% serum
replacement 3 with or without FFA–BSA complex. Based on
our previous study,17 the amino acid composition was
designed to resemble rat plasma amino acids (Table 1).
Metabolites in the intracellular compartment were analyzed
by GC-MS at 3, 6 and 12 h.
ROS measurement
Cellular ROS generation was measured using H2DCFDA
(Invitrogen, Carlsbad, CA, USA) as described previously.25
H2DCFDA is a non-polar compound that readily diffuses into
cells, where it is hydrolyzed by intracellular esterases to the
nonfluorescent molecule dichlorodihydrofluorescein, which
remains trapped within the cells. In the presence of a proper
oxidant, dichlorodihydrofluorescein is oxidized to the highly
fluorescent 2,7-dichlorofluorescein. Cells treated with various
fatty acids or amino acids were incubated with 10 mMH2DCFDA for 30 min at 37 1C in the dark, then resuspended
with Hanks balanced salt solution (HBSS). The fluorescence
intensity was measured at an excitation/emission wavelength
of 490/530 nm using a FusionTM universal microplate
analyzer (PerkinElmer, Shelton, CT, USA).
Nile red staining
Cells were cultured in 96-well plates with or without FFA.
After a 24 h incubation, cells were stained with Nile red using
AdipoRed reagent (Cambrex, East Rutherford, NJ, USA).
Intracellular lipid accumulation was observed using a fluorescence
microscope and quantified using a microplate analyzer at an
excitation/emission wavelength of 485/590 nm.
Cell viability
Cultured cells in 96-well plates were washed twice with PBS
and then incubated with serum-free DMEM for 4 h at 37 1C.
Cellular metabolic capacity was measured based on reduction
of resazurin using the CellTiter-Blues cell viability assay
(Promega, Madison, WI, USA).
Metabolite extraction
We employed a biphasic extraction protocol, with non-polar
metabolites partitioning into a chloroform phase and polar
metabolites partitioning into a methanol/water phase. Cells
cultured in 100 mm dishes were washed twice with ice-cold
Table 1 Comparison of physiological and medium amino acids.Rat plasma amino acids are cited from our previous study17
Amino acid
Plasma Culture medium
Rat DMEM This study
Histidine 45–90 200 50Isoleucine 30–115 800 50Leucine 40–195 800 100Lysine 80–285 800 200Methionine 30–100 200 50Phenylalanine 34–85 400 50Threonine 55–270 800 100Tryptophan 30–105 100 50Valine 55–235 800 150Alanine 220–460 400 250Arginine 36–143 400 80Asparagine 35–58 0 50Asparatate 38–90 0 20Cystine 10–56 200 50Glutamate 42–94 0 50Glutamine 375–700 4000 450Glycine 105–460 400 150Proline 100–200 0 100Serine 110–210 400 100Tyrosine 30–100 400 50Essential/non-essential 0.30–0.66 0.79 0.59Total 1875–3500 11 100 2150
Table 2 FFA-induced apoptosis and steatosis in H4IIEC3 cells under physiological amino acids
Cellular lipids ROS Cell viability
(Nile red fluorescence) (DCF fluorescence) (Resazurin reduction)
Untreated 3837 � 143 (100) 4292 � 584 (100) 1.0 � 0.073 (100)400 mM PA 17 064 � 980* (445) 9732 � 154* (227) 0.44 � 0.041* (44)400 mM PA + 10 mM OA 19 384 � 1054* (505) 6752 � 1334* (157) 0.54 � 0.070* (54)400 mM PA + 50 mM OA 30 718 � 920* (801) 4934 � 621 (115) 0.96 � 0.063 (96)400 mM PA + 200 mM OA 35 678 � 1444* (930) 4201 � 244 (98) 0.99 � 0.045 (99)400 mM OA 20 167 � 1497* (526) 2460 � 1056* (57) 0.95 � 0.049 (95)
Values are expressed as mean � SEM (n = 3). *p o 0.05 for the comparison with untreated cells. Values in parentheses are percent control.
Dow
nloa
ded
by V
ande
rbilt
Uni
vers
ity o
n 25
Jan
uary
201
2Pu
blis
hed
on 1
6 Fe
brua
ry 2
011
on h
ttp://
pubs
.rsc
.org
| do
i:10.
1039
/C0M
B00
309C
View Online

This journal is c The Royal Society of Chemistry 2011 Mol. BioSyst., 2011, 7, 1409–1419 1417
PBS and immediately quenched with 1 ml pre-cooled methanol
(�80 1C). Cells were collected in glass tubes with a cell scraper
(BD Biosciences, San Jose, CA, USA). Cells were resuspended
with 1 ml ice-cold water, and the remaining cells were
combined in the same tubes. For determination of protein
concentration, 20 ml of cell suspension was taken from the
sample tubes and stored at �80 1C.
To prepare samples for GC-MS analysis, 15.8 nmol trihepta-
decanoin, 4.96 nmol pentadecanoate, 2.94 nmol 5a-cholestaneand 4.2 nmol N-pentadecanoyl-sphingosine (C15 ceramide) in
30 ml chloroform (non-polar internal standards) and also
9.9 nmol ribitol in 30 ml methanol (polar internal standards)
were added. After addition of 1 ml chloroform, samples were
shaken for 30 min at room temperature and then 3 ml chloroform
and 2 ml water were added. Vortexed samples were centrifuged
at 4000g for 30 min at room temperature. Two 2 ml extracts
from the methanol/water phase or non-polar samples from the
chloroform phase were separately collected in new tubes and
then evaporated to dryness. All samples were stored at �80 1Cuntil analysis. The protein content for each sample was
quantified using a BCA assay kit (Pierce, Rockford, IL, USA).
Polar metabolite analysis
Derivatization of polar metabolites was performed according
to previous studies.17,26 One of each pair of dried samples was
dissolved in 30 ml of methoxyamine hydrochloride (20 mg per
ml in pyridine). Sample solutions were sonicated for 15 min at
room temperature and incubated for 120 min at 37 1C. After
incubation, 70 ml MBTSTFA+ 1% TBDMCS was added and
the solutions were further incubated overnight at room
temperature.
Gas chromatography-mass spectrometry (GC-MS) analysis
was performed using an Agilent 6890N GC equipped with a
30 M DB-35ms capillary column connected to an Agilent
5975B MS operating under ionization by electron impact
(EI) at 70 eV. An injection volume of 1 ml was introduced in
splitless mode at an injection temperature of 270 1C. The
temperature of the MS source and quadrupole were held at
230 1C and 150 1C, respectively. The detector was set to scan
over the mass range 50–550 m/z. The GC temperature
program was optimized to follow a large number of metabolites
simultaneously: 5 min at 90 1C, 60 min ramp to 280 1C and
held for 5 min at 280 1C (total 70 min per run).
Table 3 Phenotypic metabolites in FFA treated H4IIEC3 cells
No.Loading(y2/y1)a Metabolite Fr.b Ionc/m/z RTd/min Description from best library hit
Probability(%)
1 �9.16 Unknown PF 204 48.2 No library fit o202 �4.28 Adenosine PF 230 67.5 Adenosine-tetrakis (trimethylsilyl) 98.43 2.69 Citrate PF 273 43.9 Citric acid, tetrakis (trimethylsilyl) 74.94 2.47 Aspartate PF 232 29.1 L-Aspartic acid, N-(trimethylsilyl)-, bis(trimethylsilyl) ester 91.55 2.33 Threonine PF 218 21.7 N,O,O-Tris-(trimethylsilyl)-L-threonine 96.86 2.32 1-Monopalmitoyl-glycerol NF 371 22.3 1-Monopalmitin trimethylsilyl ether 94.37 2.22 2-Monopalmitoyl-glycerol NF 218 21.9 2-Monopalmitin trimethylsilyl ether 88.08 �2.03 Malate PF 233 27.7 Tris(trimethylsilyl) malic acid 78.59 2.00 Unknown PF 171 26.5 No library fit o2010 �1.96 Serine PF 204 20.8 N,O,O0-Tris-(trimethylsilyl)-serine 79.011 1.79 C16 Ceramide NF 370 51.1 In-house library hit n/a12 1.68 Unknown NF 73 11.4 No library fit o2013 1.61 1,2-Dipalmitoyl-glycerol NF 145 53.0 2-(Palmitoyloxy)-1-([(trimethylsilyl)oxy]methyl)ethyl palmitate 87.814 1.20 Glycine PF 174 17.9 Glycine, N,N-bis(trimethylsilyl)-, trimethylsilyl ester 90.215 1.15 Unknown PF 73 55.9 No library fit o2016 1.09 Myo-inositol-phosphate PF 318 66.8 D-Myo-inositol,1,2,4,5,6-pentakis-O-(trimethylsilyl)-,
2,3-bis[(trimethylsilyl)oxy]propyl trimethylsilyl phosphate97.0
17 1.09 Unknown PF 147 55.0 No library fit o2018 1.05 Unknown PF 217 56.7 No library fit o2019 0.86 Unknown PF 113 20.8 No library fit o2020 0.70 Proline PF 142 18.9 N,O-Bis-(trimethylsilyl)-proline 93.621 0.66 Glutamine PF 156 33.4 In-house library hit n/a22 0.66 N-Acetyl-glutamate PF 174 32.5 Bis(trimethylsilyl) 2-(acetylamino)pentanedioate 52.623 0.64 Unknown PF 446 63.9 No library fit o2024 �0.62 Unknown PF 73 66.6 No library fit o2025 0.61 Unknown PF 129 29.7 No library fit o2026 0.56 Desmosterol NF 129 36.9 Cholesta-5,24-diene, 3b-(trimethylsiloxy)- 95.527 0.34 Glutamate PF 246 34.0 L-Glutamic acid, N-(trimethylsilyl)-, bis(trimethylsilyl) ester 90.428 0.26 9H-Purin-2-amine PF 324 69.5 9H-Purin-2-amine, N-(trimethylsilyl)-6-[(trimethylsilyl)oxy]-9-
[2,3,5-tris-O-(trimethylsilyl)-b-D-ribofuranosyl]-87.7
29 �0.26 D-Gluconate PF 333 46.0 D-Gluconic acid, 2,3,4,5,6-pentakis-O-(trimethylsilyl)-,trimethylsilyl ester
76.2
30 0.22 Unknown PF 305 49.9 No library fit o2031 �0.19 Glycerate PF 292 19.7 Glyceric acid, tris(trimethylsilyl) 95.932 �0.12 Unknown PF 247 34.5 No library fit o2033 �0.01 PF 307 42.9 D-Fructose, 1,3,4,5,6-pentakis-O-(trimethylsilyl)-,
O-methyloxime88.6
a y2/y1 values of each metabolite in Fig. 3C. b Fraction (Fr. ) in extraction process: PF, polar fraction; NP, non-polar fraction. c Specific ion of
each marker metabolite. d Retention time (RT). n/a, Not applicable.
Dow
nloa
ded
by V
ande
rbilt
Uni
vers
ity o
n 25
Jan
uary
201
2Pu
blis
hed
on 1
6 Fe
brua
ry 2
011
on h
ttp://
pubs
.rsc
.org
| do
i:10.
1039
/C0M
B00
309C
View Online

1418 Mol. BioSyst., 2011, 7, 1409–1419 This journal is c The Royal Society of Chemistry 2011
Non-polar metabolite analysis
For non-polar metabolite analysis, dried non-polar samples
were dissolved in 1.55 ml of isooctane : methanol : ethyl
acetate (20 : 10 : 1). To remove triglycerides, samples were
applied to a silica gel-packed Poly-Prep column (BIO-RAD,
Hercules, CA, USA) as previously described.27,28 Eluted free
lipid fractions were evaporated to dryness. For ceramide
analysis, samples were re-dissolved in 250 ml of phosphate
buffer (0.1 M, pH 7.0) containing 0.1 U sphingomyelinase and
1 mMMgCl2. Free lipid fractions were extracted three times in
500 ml isooctane: ethyl acetate (3 : 1) and then evaporated to
dryness. Samples were dissolved in 150 ml BSTFA + 1%
TMCS: acetonitrile (4 : 1) and then incubated overnight at
room temperature. GC-MS analysis of free lipids was
performed with the following parameter settings. The
temperatures of the injection port, MS source and quadrupole
were set at 310 1C, 230 1C and 150 1C, respectively. The GC
temperature program was set as follows: 3 min at 130 1C,
4 min ramp to 190 1C, 3 min at 190 1C, 12.3 min ramp to
264 1C, 5 min at 264 1C, 5.75 min ramp to 287 1C, 8 min at
287 1C, 4.6 min ramp to 310 1C, 3 min at 310 1C, 4.7 min ramp
to 325 1C, and 16.6 min at 325 1C (total 70 min per run).
GC-MS data analysis
All GC-MS data were analyzed according to the method of
Styczynski et al.29 Briefly, mass spectra were processed using
AMDIS software (http://chemdata.nist.gov/mass-spc/amdis/;
National Institute of Standards and Technology). The resulting
ELU files were further analyzed by the SpectConnect software
(http://spectconnect.mit.edu/), developed by our laboratory,
to identify well-conserved peaks among multiple GC-MS
chromatograms. SpectConnect can automatically catalog and
track otherwise unidentifiable conserved metabolite peaks across
sample replicates and different sample condition groups without
use of reference spectra. SpectConnect compares every spectrum
in each sample to the spectra in every other sample. By doing so,
it is capable of determining which components are conserved
across replicate samples. SpectConnect also determines which of
these components differentiate one sample condition (e.g.,
time or treatment) from another, whether by changes in
concentrations or merely by their presence/absence. The
only requirement of the experimental measurements is that
each sample condition must have replicates. In a sense,
SpectConnect relies on an increase in signal relative to noise
that is created by this requirement of replicates.29 In the present
study, all experiments were examined by biological replications
in a group of samples (n = 5). Metabolite identification of
EI-MS peaks was performed using in-house standard libraries
along with the NIST05 MS library described in previous
paper.30 Two-dimensional clustering of metabolite correlativity
was performed using JMP (SAS Institute Inc., Cary, NC, USA).
Correlation-based metabolite-to-gene network analysis
Correlation networks were constructed in accord with the
previously reported method.31 To uncover possible inter-
actions between two entities i (=metabolite X) and j
(=metabolite Y), the Pearson or Spearman’s rank correlation
coefficient rij was calculated for each pair within the obtained
dataset. The significance of each pair of metabolite and
transcript correlations was assessed using the FDR by estimating
a q-value for each correlated pair32 The q-value measures the
predicted FDR associated with a significant test when multiple
hypotheses are tested, i.e., a q-value of 0.05 implies that for
every 100 significant correlates, five false correlated pairs are
expected. A comparison of multiple false discovery estimations
on several -omics datasets suggests that the q-value method
has a high apparent power and strong control of the FDR. By
eliminating the associations with lower |rij| pairs (n = 15–30),
we selected only the networks that contained highly significant
correlated entities.
To measure centrality in metabolite–metabolite correlation
datasets or a projected bipartite network, several standard
measures of centrality can be used, such as degree, closeness,
betweenness and eigenvector centrality.33 In the present study,
we used degree as a standard measure of centrality, where the
degree of centrality of a node is defined as the number of edges
incident upon that node. In the case of the correlation of a
metabolite and transcript, this means that the degree of a
metabolite is the number of transcripts that relate to the meta-
bolite, and the degree of a transcript is the number of
metabolites that relate with the other metabolites. Thus,
degree has a clear and simple interpretation in the correlation
network. In addition, we introduced the k-core decomposition
as an additional dimension to visualize complex networks.34
This decomposition, based on a recursive pruning of the least
connected vertices, allows disentanglement of the hierarchical
structure of networks by progressively focusing on their
central cores. The k-core decomposition consists of k-cores
that identify particular subsets; each one was obtained by
recursively removing all vertices having a degree smaller than
k until the degree of all the remaining vertices became greater
than or equal to k (0, 1, 2, . . .kmax). Larger values of
‘‘coreness’’ simply correspond to vertices with larger degrees
and more central positions in the given network.35
Statistics
Statistical significance among the groups was determined by
Tukey’s honestly significant difference test after ANOVA for
multiple comparisons. All correlation analyses were
performed using JMP. Fisher discriminant analysis (FDA)
was performed using our lab’s original software BioSystAnse
1.07. The false discovery rate (FDR) for each metabolite-to-gene
correlate pair was estimated as a q-value using software
created by Alan Dabney and John Storey.36 For generation
of metabolite-to-gene network images, UCINET version
6.34 (Analytic Technologies Inc., Harvard, MA) was used.
This work was supported by NIH DK075850 and NIH
ES013925. J.D.Y. was supported by NIH grant F32 DK072856.
Abbreviations
1,2-DPG 1,2-dipalmitoyl-glycerol
Fructose-6P fructose-6-phosphate
1-MPG 1-monopalmitoyl-glycerol
MUFA monounsaturated fatty acid
Myo-IP Myo-inositol-phosphate
Ribose-5P ribose-5-phosphate
Dow
nloa
ded
by V
ande
rbilt
Uni
vers
ity o
n 25
Jan
uary
201
2Pu
blis
hed
on 1
6 Fe
brua
ry 2
011
on h
ttp://
pubs
.rsc
.org
| do
i:10.
1039
/C0M
B00
309C
View Online

This journal is c The Royal Society of Chemistry 2011 Mol. BioSyst., 2011, 7, 1409–1419 1419
References
1 M. Cuperlovic-Culf, D. A. Barnett, A. S. Culf and I. Chute,Drug Discovery Today, 2010, 15, 610–621.
2 M. Heinemann and R. Zenobi, Curr. Opin. Biotechnol., 2010, 22, 1–6.3 S. Tiziani, A. Lodi, F. L. Khanim, M. R. Viant, C. M. Bunce andU. L. Gunther, PLoS One, 2009, 4, e4251.
4 Y. Si, H. Shi and K. Lee, PLoS One, 2009, 4, e7000.5 S. Lin, N. Liu, Z. Yang, W. Song, P. Wang, H. Chen, M. Lucio,P. Schmitt-Kopplin, G. Chen and Z. Cai, Talanta, 2010, 83,262–268.
6 G. Catchpole, A. Platzer, C. Weikert, C. Kempkensteffen,M. Johannsen, H. Krause, K. Jung, K. Miller, L. Willmitzer,J. Selbig and S. Weikert, J. Cell. Mol. Med., 2009.
7 A. Ramanathan, C. Wang and S. L. Schreiber, Proc. Natl. Acad.Sci. U. S. A., 2005, 102, 5992–5997.
8 O. Yanes, J. Clark, D. M. Wong, G. J. Patti, A. Sanchez-Ruiz,H. P. Benton, S. A. Trauger, C. Desponts, S. Ding and G. Siuzdak,Nat. Chem. Biol., 2010, 6, 411–417.
9 L. L. Listenberger, D. S. Ory and J. E. Schaffer, J. Biol. Chem.,2001, 276, 14890–14895.
10 A. Wieckowska, A. J. McCullough and A. E. Feldstein,Hepatology, 2007, 46, 582–589.
11 L. L. Listenberger, X. Han, S. E. Lewis, S. Cases, R. V. Farese, Jr.,D. S. Ory and J. E. Schaffer, Proc. Natl. Acad. Sci. U. S. A., 2003,100, 3077–3082.
12 I. C. Okere, M. P. Chandler, T. A. McElfresh, J. H. Rennison,V. Sharov, H. N. Sabbah, K. Y. Tserng, B. D. Hoit, P. Ernsberger,M. E. Young and W. C. Stanley, Am. J. Physiol.: Heart Circ.Physiol., 2006, 291, H38–44.
13 A. K. Busch, E. Gurisik, D. V. Cordery, M. Sudlow, G. S. Denyer,D. R. Laybutt, W. E. Hughes and T. J. Biden, Diabetes, 2005, 54,2917–2924.
14 F. J. Barreyro, S. Kobayashi, S. F. Bronk, N. W. Werneburg,H. Malhi and G. J. Gores, J. Biol. Chem., 2007, 282, 27141–27154.
15 H. Malhi, S. F. Bronk, N. W. Werneburg and G. J. Gores, J. Biol.Chem., 2006, 281, 12093–12101.
16 R. H. Unger and Y. T. Zhou, Diabetes, 2001, 50(Suppl 1),S118–121.
17 Y. Noguchi, J. D. Young, J. O. Aleman, M. E. Hansen,J. K. Kelleher and G. Stephanopoulos, J. Biol. Chem., 2009, 284,33425–33436.
18 W. Guo, S. Wong, W. Xie, T. Lei and Z. Luo, Am. J. Physiol.:Endocrinol. Metab., 2007, 293, E576–586.
19 K. Y. Tserng and R. L. Griffin, Biochem. J., 2004, 380, 715–722.20 J. Ciapaite, S. J. Bakker, M. Diamant, G. van Eikenhorst,
R. J. Heine, H. V. Westerhoff and K. Krab, FEBS J., 2006, 273,5288–5302.
21 J. Ciapaite, G. van Eikenhorst and K. Krab,Mol. Biol. Rep., 2002,29, 13–16.
22 A. Chevrollier, D. Loiseau, B. Chabi, G. Renier, O. Douay,Y. Malthiery and G. Stepien, J. Bioenerg. Biomembr., 2005, 37,307–316.
23 J. G. Pastorino, N. Shulga and J. B. Hoek, J. Biol. Chem., 2002,277, 7610–7618.
24 G. Sriram, L. Rahib, J. S. He, A. E. Campos, L. S. Parr, J. C. Liaoand K. M. Dipple, Mol. Genet. Metab., 2008, 93, 145–159.
25 G. Sudhandiran and C. Shaha, J. Biol. Chem., 2003, 278,25120–25132.
26 Y. Noguchi, N. Nishikata, N. Shikata, Y. Kimura, J. O. Aleman,J. D. Young, N. Koyama, J. K. Kelleher, M. Takahashi andG. Stephanopoulos, PLoS One, 2010, 5, e12057.
27 K. Y. Tserng and R. Griffin, Anal. Biochem., 2003, 323, 84–93.
28 C. Vieu, F. Terce, F. Chevy, C. Rolland, R. Barbaras, H. Chap,C. Wolf, B. Perret and X. Collet, J. Lipid Res., 2002, 43, 510–522.
29 M. P. Styczynski, J. F. Moxley, L. V. Tong, J. L. Walther,K. L. Jensen and G. N. Stephanopoulos, Anal. Chem., 2007, 79,966–973.
30 Y. Tikunov, A. Lommen, C. H. de Vos, H. A. Verhoeven,R. J. Bino, R. D. Hall and A. G. Bovy, Plant Physiol., 2005,139, 1125–1137.
31 Y. Noguchi, N. Shikata, Y. Furuhata, T. Kimura andM. Takahashi, Physiol. Genomics, 2008, 34, 315–326.
32 B. Z. Ring, S. Chang, L. W. Ring, R. S. Seitz and D. T. Ross, BMCGenomics, 2008, 9, 74.
33 S. P. Borgatti and M. G. Everett, Soc. Networks, 1997, 19,243–269.
34 J. I. Alvarez-Hamelin, L. Dall’Asta, A. Barrat and A. Vespignani,Adv. Neural Inf. Process. Syst., 2006, 18, 41 http://arxiv.org/abs/cs.ni/0504107.
35 S. Wachi, K. Yoneda and R. Wu, Bioinformatics, 2005, 21,4205–4208.
36 Q-Value, [http://faculty.washington.edu/jstorey/qvalue/].
Dow
nloa
ded
by V
ande
rbilt
Uni
vers
ity o
n 25
Jan
uary
201
2Pu
blis
hed
on 1
6 Fe
brua
ry 2
011
on h
ttp://
pubs
.rsc
.org
| do
i:10.
1039
/C0M
B00
309C
View Online