bioprocess monitoring using sequential injection …
TRANSCRIPT

BIOPROCESS MONITORING USING
SEQUENTIAL INJECTION CAPILLARY
ELECTROPHORESIS
By
Ala Abdulkareem A. Alhusban
M.Sc. (Pharmaceutical Sciences)
School of Medicine/Pharmacy
Submitted in fulfilment of the requirements for the Degree of
Doctor of Philosophy
University of Tasmania (December, 2015)

i
Declaration
This thesis contains no material which has been accepted for a degree or diploma by
the University or any other institution, except by way of background information and
duly acknowledged in the thesis, and to the best of my knowledge and belief no
material previously published or written by another person except where due
acknowledgement is made in the text of the thesis, nor does the thesis contain any
material that infringes copyright.
The publishers of the papers in this thesis hold the copyright for that content, and
access to the material should be sought from the respective journals. The remaining
non-published content of the thesis may be made available for loan and limited
copying and communication in accordance with the
Copyright Act 1968
Ala Abdulkareem A. Alhusban
December 2015

ii
Acknowledgement
First and foremost, I am offering my thanks, obedience and gratitude to Allah who
helped me and gave me the strength to achieve this thesis and whom I always revive
assistants and protection. Grateful thanks and full appreciation go to my PhD
supervisors, Dr. Rosanne Guijt, Associate Professor Nuri Gueven and Professor
Michael Breadmore for their supervision, assistance, encouragement, guidance,
patience, constructive advice and continuous help.I would like to extend my genuine
gratitude to all members of School of Medicine/Pharmacy and members of Australian
Centre for Research in Separation Science (ACROSS) for helping me with my
research and their friendship and kindness. From those, special thanks go to Aliaa,
Jamuna, Chiing, Wolde, Adam, Aarati, Ryan, Qi, Aemi, Stephenie, Petr, Madhur,
Phil, Mohammad, Abbas, Fotouh, Dario and more for giving moral and technical
support whenever I need. My acknowledgement goes to my PhD coordinator Dr.
Rahul Patel, the laboratory manager Dr. Peter Traill, Anthony Whitty and Heather
Galloway for their continuous help. And to UTAS Central Science Laboratory staff
including Mr. John Davis and Mr. Paul Waller, who assisted me in my research by
construction of mechanical and electrical hardware. I am very grateful to my father,
mother, brothers and sisters for always being next to me whenever I need them. My
deepest gratitude goes to Alzytoonah University of Jordan for the financial support.

iii
Statement of co-authorship
The following people and institutions contributed to the publication of work undertaken
as part of this thesis:
Author details and their roles:
Paper 1, <Alhusban, A. A., Breadmore, M. C.; Guijt, R. M. Capillary
Electrophoresis for Monitoring Bioprocesses, Electrophoresis, 34, (2013) 1465-
1482.>:
This paper comprises the majority of Chapter 1
Ala A. Alhusban was the primary author (70%) and collected all the papers, organized
the manuscript and wrote the review. The co-authors contributed a total of 30% to the
published work. Michael Breadmore and Rosanne Guijt contributed to idea, its
structure and reviewing the manuscript.
Paper 2, <Alhusban, A. A., Gaudry, A. J., Breadmore, M. C., Gueven, N., Guijt, R.
M. On-line Sequential Injection Capillary Electrophoresis for Near-real-time
Monitoring of Extracellular Lactate in Cell Culture Flasks, Journal of
Chromatography A, (2014) 1323, 157-162. >:
This paper comprises the majority of Chapter 2
Ala A. Alhusban was the primary author (70%) and conducted all the experiments,
analysed data and wrote the manuscript. The co-authors contributed a total of 30% to
the published work. Adam Gaudry, Michael Breadmore, Nuri Gueven and Rosanne
Guijt contributed to the concept, development, refinement and presentation.
Paper 3, <Alhusban, A. A., Breadmore, M. C., Gueven, N., Guijt, R. M. Capillary
Electrophoresis for Automated On-line Monitoring of Suspension Cultures:
Correlating Cell Density, Nutrients and Metabolites in Near-real-time, Analytica
Chimica Acta, (2015) ACA-15-2656, accepted. >:

iv
This paper comprises the majority of Chapter 3
Ala A. Alhusban was the primary author (70%) and conducted all the experiments,
analysed data and wrote the manuscript. The co-authors contributed a total of 30% to
the published work. Michael Breadmore, Nuri Gueven and Rosanne Guijt contributed
to the concept, development, refinement and presentation.
Paper 4, < Alhusban, A. A., Breadmore, M. C., Gueven, N., Guijt, R. M. Parallel
Monitoring of Pharmacological Assays using Sequential Injection Capillary
Electrophoresis, Analytical Chemistry, (2016) ac-2015-04822f, under review. >:
This paper comprises the majority of Chapter 4
Ala A. Alhusban was the primary author (70%) and conducted all the experiments,
analysed data and wrote the manuscript. The co-authors contributed a total of 30% to
the published work. Michael Breadmore, Nuri Gueven and Rosanne Guijt contributed
to the concept, development, refinement and presentation.
We the undersigned agree with the above stated “proportion of work undertaken” for
each of the above published (or submitted) peer-reviewed manuscripts contributing to
this thesis:
Signed:
Dr. Rosanne Guijt
Supervisor
School of Medicine
University of Tasmania
Date: 13 April 16
Signed:
Associate Professor Lisa Fao
Associate Head Research
School of Medicine
University of Tasmania
Date: 21-4-16

v
List of publications and presentations
Parts of research works described in this thesis have been or will be reported in the
following publications and presentations:
1. Alhusban, A. A., Breadmore, M. C.; Guijt, R. M. Capillary Electrophoresis
for Monitoring Bioprocesses, Electrophoresis, 34, (2013) 1465-1482. DOI:
10.1002/elps.201200646. (Chapter 1)
2. Alhusban, A. A., Gaudry, A. J., Breadmore, M. C., Gueven, N., Guijt, R. M.
On-line Sequential Injection-Capillary Electrophoresis for Near-real-time
Monitoring of Extracellular Lactate in Cell Culture Flasks, Journal of
Chromatography A, 1323, 157-162. DOI: 10.1016/j.chroma.2013.11.006.
(Chapter 2)
3. Alhusban, A. A., Breadmore, M. C., Gueven, N., Guijt, R. M. Capillary
Electrophoresis for Automated On-line Monitoring of Suspension
Cultures: Correlating Cell Density, Nutrients and Metabolites in Near-
real-time, Analytica Chimica Acta, ACA-15-2656, xxx-xxx. (Chapter 3)
4. Alhusban, A. A., Breadmore, M. C., Gueven, N., Guijt, R. M. Parallel
Monitoring of Pharmacological Assays using Sequential Injection
Capillary Electrophoresis, Analytical Chemistry, ac-2015-04822f, xxx-xxx.
(Chapter 4)

vi
5. Alhusban, A. A., Breadmore, M. C., Gueven, N., Guijt, R. M. Online
Organic Acids Characterisation and monitoring from Bioprocess Using
Sequential Injection Capillary Electrophoresis. 20th Research and
Development Topics Conference, Deakin University, Geelong, Australia, 11th
to 14th of December 2012.
6. Alhusban, A. A., Breadmore, M. C., Gueven, N., Guijt, R. M. Sequential
Injection Capillary Electrophoresis for Bioprocess Monitoring. UTAS
Postgraduate Conference, University of Tasmania, Hobart, Australia, 4th to 7th
of September 2012.
7. Alhusban, A. A., Breadmore, M. C., Gueven, N., Guijt, R. M. On-line SI-CE
for Near-real-time Monitoring of Extracellular Lactate in Cell Culture.
Tasmanian Health Science HDR Student Conference, University of Tasmania,
Hobart, Australia, 5th and 6th of September 2013.
8. Alhusban, A. A., Breadmore, M. C., Gueven, N., Guijt, R. M. Online
Monitoring of Cell Culture by Sequential Injection Capillary
Electrophoresis. 40th International Symposium on High-Performance Liquid-
Phase Separations and Related Techniques, Hobart, Australia, 18th to 21th
November 2013.
9. Alhusban, A. A., Breadmore, M. C., Gueven, N., Guijt, R. M. On-line
Monitoring of Cell Cultures. The 3rd International Conference

vii
Implementation of Microreactor in Biotechnology (IMTB), Opatija, Croatia
10th to 13th May 2015.
10. R.M. Guijt, A. A. Alhusban, A. Shallan, U. Kalsoom,, M. Boyce, M.C.
Breadmore, Alternative Approaches for Sample Preparation in Capillary
Electrophoresis, CECE 2015 – International Interdisciplinary Meeting on
Bioanalysis, Brno, Czech Republic, 21th to 23th September 2015

viii
List of Abbreviations
BGE
CAPS
Background electrolyte
Cleaved Amplified
CGE Capillary Gel Electrophoresis
cITP Capillary isotachophoresis
CTAB Cetyl trimethylammonium bromide
DAD
DTT
ED
EDTA
ESI-IT-MS
ESI-TOF-MS
HBLC
HDMB
hGF
HPMC
HTAB
LA-coA
LDH
LIF
MEKC
MES
Diode array detector
Dithiothreitol
Electrochemical detection
Ethylenediaminetetraacetic acid
Electrospray ion-trap mass spectrometry
Time-of-flight mass spectrometry
High Performance Liquid Chromatography
Hexadimethrine bromide
Human growth factor
Hydroxypropyl methylcellulose
Hexadecyltrimethylammonium bromide
Lactate-coenzyme A
Lactate dehydrogenase
Laser Induced Fluorescence
Micellar electrokinetic
2-(N-Morpholine) ethanesulfonic acid

ix
MOA
NADP
Mars Organic Analyser
Nicotinamide adenine dinucleotide phosphate
PAGE Polyacrylamide gel electrophoresis
PDCA
PCR
Pyridine-2,6-dicarboxylic acid
Polymerase Chain Reaction
PLA Poly Lactic Acid
RQ Respiration Quotient
SCFA Short Chain Fatty Acids
SDS Sodium dodecyl sulfate
SHMT Serine hydroxymethyltransferase
SSCP Single-stranded conformation polymorphism
Tris Tris(hydroxymethyl)aminomethane
TTAB Tetradecyltrimethyl ammonium bromide

x
Abstract
Bioprocess monitoring has received significant interest over the past few years. The
production of biopharmaceuticals synthesized by living cells during fermentation or
cell culture processes is a rapidly growing field. Additionally, cell based assays have
replaced many in vivo assays because of ethical and regulatory restrictions on
working with laboratory animals. Biological processes are naturally susceptible to
variability because living cells consume substrates and produce metabolites and
products in a dynamic way with variations in metabolic rate across short time
intervals. For the production of biopharmaceuticals, the FDA recommends
documentation of nutrient and metabolite time profiles in the process analytical
technology (PAT) policy to ensure product quality. At present, the majority of cell
culture based monitoring is restricted to a few end point based assays that do not
reflect the dynamic metabolic processes in cells that influence the final product.
Therefore, a detailed and continuous monitoring of the bioprocesses in each
production batch would significantly help manufacturers to control product quality,
increase production yields and reduce production costs. At the same time, online
monitoring of bioprocesses will also significantly enhance our understanding of
fundamental dynamic cellular metabolic reactions that cannot be easily ascertained by
end point measurements, and in turn facilitate pharmacological and biotechnological
studies employed for screening and compounds testing.
This thesis explores the potential of capillary electrophoresis (CE) for bioprocess
monitoring. CE is a powerful and high resolution separation technique with the
potential to provide detailed chemical information quickly using small sample
volumes. First, the potential of Sequential injection capillary electrophoresis (SI-CE)
for monitoring lactate production, an important metabolic indicator, during adherent

xi
mammalian cell culture, was examined. A new sampling interface was developed to
sample from the medium covering a culture of human embryonic kidney cell line
HEK293 and mouse fibroblast cell lines. Changes in lactate concentration in the cell
culture medium were measured every 20 minutes over 3 days, requiring only 8.73 µL
of sample per analysis. Second, a SI-CE system was developed for automated, on-
line, near real-time monitoring of suspension cultures by integrating microfluidic
components for cell counting and analyte extraction with the high-resolution
separation technique. The correlation of cell growth of a human lymphocyte cell line
with changes in the essential metabolic markers including glucose, glutamine,
leucine/isoleucine and lactate provided new insights in the metabolic changes over
time.Using only 8.1 mL of media (41 µL per analysis), the metabolic status and cell
density were recorded every 30 minutes over 4 days. This system provides a
promising new solution to meet the future demands in process monitoring in the
biopharmaceutical industry.
The developed platform for monitoring suspension cultures was extended to
simultaneous monitoring of five parallel suspension cultures, capable of conducting
cell density measurement and a high-resolution separation every 12 minutes for
4 days. This system was applied to study the metabolic effects of the drugs rotenone,
β-lapachone and clioquinol on metabolism using lactate as indicator. For each drug,
suspension culture experiments for three drug concentrations and two controls were
monitored in parallel. Over the 4 days, 5.78 mL of media was consumed from each
culture, equating to 60 µL per analysis. The fully automated system offers high
sample throughput, good temporal resolution and low sample consumption combined
with robustness, sensitivity and flexibility which provides a promising new platform
for pharmacological and biotechnological studies.
xii
1. Table of Contents
Declaration ...................................................................................................................... i
Acknowledgement ........................................................................................................ ii
Statement of co-authorship .......................................................................................... iii
List of publications and presentations ............................................................................ v
List of Abbreviations ................................................................................................. viii
Abstract .......................................................................................................................... x
Preface ............................................................................................................................ 1
The importance of bioprocess monitoring ................................................................. 1
Capillary electrophoresis and its potential for bioprocess monitoring ...................... 2
Project aims and scopes of study ............................................................................... 3
1 Chapter 1 ................................................................................................................ 4
1.1 Introduction ..................................................................................................... 4
1.2 The role of CE in wine making ..................................................................... 17
1.3 Analyte classes important in bioprocess analysis ......................................... 23
1.3.1 Organic acids ......................................................................................... 23
1.3.2 Pharmaceutical active compounds ......................................................... 37
1.3.3 Protein and peptides ............................................................................... 46
1.3.4 Sugars ..................................................................................................... 48
1.3.5 Amino acids ........................................................................................... 49

xiii
1.3.6 Metabolites and nutrients ....................................................................... 51
1.3.7 Bacteria .................................................................................................. 53
1.4 Conclusion ..................................................................................................... 54
1.5 References ..................................................................................................... 56
2 Chapter 2 .............................................................................................................. 76
2.1 Introduction ................................................................................................... 76
2.2 Materials and methods .................................................................................. 79
2.2.1 Chemicals ............................................................................................... 79
2.2.2 Instrument design and operation ............................................................ 80
2.2.3 Electrophoretic conditions ..................................................................... 84
2.2.4 Application in monitoring mammalian cell culture ............................... 85
2.3 Results and discussion ................................................................................... 86
2.3.1 Method development ............................................................................. 86
2.3.2 Sampling interface ................................................................................. 92
2.3.3 Monitoring of lactate production in HEK293 cells ................................ 97
2.3.4 Monitoring of lactate production in mouse fibroblast cells ................. 101
2.4 Conclusion ................................................................................................... 106
2.5 References ................................................................................................... 107
3 Chapter 3 ............................................................................................................ 112
3.1 Introduction ................................................................................................. 112
3.2 Materials and Methods ................................................................................ 115

xiv
3.2.1 Chemicals ............................................................................................. 115
3.2.2 Fabrication of H-filter .......................................................................... 115
3.2.3 Cell culture ........................................................................................... 116
3.2.4 Cell density measurement .................................................................... 116
3.2.5 Instrument Design and Operation ........................................................ 119
3.2.6 Electrophoretic Conditions .................................................................. 123
3.3 Results ......................................................................................................... 124
3.3.1 Cell culture optimization ...................................................................... 124
3.3.2 Automated cell counting ...................................................................... 127
3.3.3 On-line removal of cells and particulates ............................................ 131
3.3.4 SI-CE.................................................................................................... 135
3.3.5 Bioprocess monitoring of suspension cells .......................................... 140
3.4 Discussion ................................................................................................... 144
3.5 Conclusion ................................................................................................... 148
3.6 References: .................................................................................................. 150
4 Chapter 4 ............................................................................................................ 157
4.1 Introduction ................................................................................................. 157
4.2 Experimental Section .................................................................................. 159
4.2.1 Chemicals and Reagents ...................................................................... 159
4.2.2 Instrument Design ................................................................................ 159
4.2.3 Cell Density Measurement ................................................................... 160

xv
4.2.4 H-Filter ................................................................................................. 161
4.2.5 Instrument Operation ........................................................................... 161
4.2.6 Electrophoretic Conditions .................................................................. 165
4.2.7 Cell Culture .......................................................................................... 165
4.3 Results and discussion ................................................................................. 166
4.3.1 Analytical performance of the multi-flask system ............................... 167
4.3.2 Simultaneous monitoring of five parallel cell cultures ........................ 171
4.3.3 Pharmacological Applications ............................................................. 175
4.4 Conclusion ................................................................................................... 190
4.5 References ................................................................................................... 192
5 Chapter 5 ............................................................................................................ 197
1.1 General conclusions .................................................................................... 197
5.1 Future directions .......................................................................................... 201
5.2 Reference ..................................................................................................... 204

1
Preface
The importance of bioprocess monitoring
A bioprocess is a biological process where living cells and/or their components are
studied or utilized to produce a desired product, with fermenters and cell cultures
applied throughout life sciences. Moreover, biopharmaceuticals produced from living
cells during fermentations or cell cultures is a fast growing field. Around 35 percent
of the authorized therapeutic products are biopharmaceuticals. The significance of cell
culture based technologies is in their employment in drug screening and discovery as
well as the pharmacodynamics studies of the existing and the new potential drug
targets. Therefore, it is essential to monitor such bioprocesses to ensure the safety of
the product together with satisfying economic and regulatory demands, and to provide
a feasible ways to perform accurate and reliable pharmacological and
biotechnological studies.
Cellular bioprocesses are mainly controlled through the manipulation of their external
environment, which are the cell culture medium and its chemical composition.
Currently, most of the chemical analysis in bioprocesses does not reflect the dynamic
metabolic processes in cells that influence the final product because these assays are
restricted to end point analysis. New systems for continuous and detailed monitoring
of the bioprocess would aid manufacturers to control product quality. Furthermore, it
would enhance the understanding of fundamental dynamic cellular metabolic
reactions and will reduce production costs and increase production yields. The same
technology would also provide the data required for deeper understanding in cell
based assays increasingly used to substitute in vivo assays as a result of restrictions on
working with laboratory animals.

2
Capillary electrophoresis and its potential for bioprocess monitoring
At present, diverse methods are employed for bioprocess monitoring, the most
important being enzymatic assays, biosensors, spectroscopic techniques, such as UV,
FTIR or RAMAN, and analytical separations such as liquid chromatography (LC),
mass spectrometry, and capillary electrophoresis (CE). Enzymatic assays are specific
and simple, but time consuming – normally needing hours per analysis, are limited to
a single analyte and may require expensive reagents. Biosensors are specific and
selective but are again limited to one analyte and require regular calibrations.
Spectroscopic techniques have the capability to provide detailed chemical
information, but despite advances in the interpretation of spectra, resolving complex
analyte sets with similar functional groups remains challenging. Chromatographic
techniques are sensitive, versatile and highly reproducible. Yet, separations are slow
(typically tens of minutes) and sample pre-treatment is typically required. Mass
spectrometry can been used to detect a whole set of analytes in cell culture media, but
the extensive sample clean-up limits its use for automated continuous monitoring.
Additionally, it is unable to resolve compounds with similar mass, complicating the
resolution of mono- and polysaccharides.
CE is a powerful technique characterized by quicker separations compared to LC and
has been broadly used to separate a range of analytes, from small ions to
macromolecules in various fields. For bioprocess monitoring, CE has been employed
for the analysis of discrete samples, using commercially available single or multiple
capillary instruments. It has similarly been employed for on-line monitoring of a
range of analytes in various matrices and environments, but only a few reports present
dedicated, online sampling interfaces for CE analysis. The low sample volume, ability
to be automated, robustness, speed, high sample throughput, good temporal

3
resolution, selectivity, flexibility and multi-analytes analysis makes CE ideally suited
for monitoring cell cultures and cell-based assays.
Project aims and scopes of study
As pointed out above, bioprocess monitoring is highly desirable. Increasingly
stringent demands on the production of biopharmaceuticals demand monitoring of
process parameters that impact on their quality. And with a move away from animal
models, early stage pharmacological studies depend on in vitro methodologies for
screening and testing compounds. The advantages of CE mentioned early make it an
attractive analytical technique to reach this goal provided suitable sampling methods
are available. The overall aim of this thesis is to develop new sampling interfaces to
enable to capitalise on the potential of CE as instrumental analytical tool for
bioprocess monitoring.The findings will provide insights towards realistic involving
of CE for the employment in the field of bioprocess monitoring.
The specific aims of the project are to:
• Develop a CE method and sampling interface for monitoring lactic acid
production in adherent cell cultures.
• Develop a CE method and microfluidic components to expand the monitoring
to more substrates and metabolites in suspension cell cultures and correlating
them to cell density.
• Develop a CE method for simultaneous monitoring of multiple suspension cell
cultureswith correlation to cell density.
• Develop a CE method for parallel monitoring of pharmacological assays.

This chapter has been removed for
copyright or proprietary reasons.
Alhusban, A. A., Breadmore, M. C.; Guijt, R. M. 2013, Capillary electrophoresisfor monitoring bioprocesses, Electrophoresis, 34(11), 1465-1482.

76
2 Chapter 2
On-line Sequential Injection-Capillary Electrophoresis for near
real-time Monitoring of Extracellular Lactate in Cell Culture
Flasks2
2.1 Introduction
Cell culture of eukaryotic cells is widely applied throughout life sciences. At the small scale,
cell based assays have replaced many in vivo assays because of ethical and regulatory
restrictions on working with laboratory animals. Additionally, the production of
biopharmaceuticals synthesized by living cells during fermentation or cell culture processes
is a rapidly growing field. According to the FDA, approximately 30–40 percent of the
authorized medical products in 2012 were biopharmaceuticals. Bioprocessing offers many
advantages. For example, the production of vaccines by cell culture technology instead of
conventional methods provides the capability for rapid manufacturing start-up in case of a
pandemic because characterized cell lines can be stored and are thus readily available.
Moreover, the risk of impurities can be reduced because vaccine production takes place in a
highly controlled, closed and sterile environment1. Cell culture based technologies are
intensively employed in drug discovery2, and are significant tools for drug screening and new
potential drug targets studies3. In 2012 alone, 35 novel biologics were developed by the
biopharmaceutical industry and approved by the FDA4. In this context it is important to note
2 Update from an article published in, Alhusban, A. A.; Gaudry, A. J.; Breadmore, M. C.; Gueven, N.; Guijt, R. M., On-line sequential injection-capillary electrophoresis for near-real-time monitoring of extracellular lactate in cell culture flasks. Journal of Chromatography A 2014, 1323, 157-162.

77
that bioprocess monitoring in the production process of biopharmaceuticals is essential to
ensure the safety of the product as well as to satisfy economic and regulatory demands.
At present, the majority of cell culture based monitoring is restricted to a few end point based
assays that do not reflect the dynamic metabolic processes in cells that influence the final
product. Therefore, a detailed and continuous monitoring of the bioprocesses in each
production batch would significantly help manufacturers to control product quality, increase
production yields and reduce production costs5. At the same time, online monitoring of
bioprocesses will also significantly enhance our understanding of fundamental dynamic
cellular metabolic reactions that cannot be easily ascertained by end point measurements.
Lactate is one of the major products of eukaryotic and prokaryotic cells and is one of the
most important organic acids in extracellular media that can be used to monitor cellular
metabolism and energy status. It is produced from glucose and glutamine in mammalian
cells6. It is important to monitor because it affects the physicochemical stability of the
bioprocess medium by reducing pH levels and is outright toxic to some cells. In addition,
under certain conditions, cultured cells can use lactate as an alternative source for carbon,
even in the presence of glucose7. At the same time, lactate can be used as an indicator of
biological activity. For example, metabolic shifting from lactate production to lactate
consumption was reported to result in improvements of process performance regarding
productivity, scalability, process robustness and cell growth8.
Due to the tight connection between extracellular and intracellular metabolic pathways,
cellular bioprocesses are primarily controlled by manipulating the external environment in
form of the composition of the cell culture medium9. Therefore, timely information about
even small changes in the concentration of extracellular lactic acid during cell culture will
directly help to control and improve the efficiency of the bioprocess. Realizing this depends
on the availability of suitable and functional tools that can be used for monitoring10.
78
Currently, a number of different methods are used for lactate detection, the most important
being enzymatic assays11,12, and analytical separations such as liquid chromatography
(LC)13,14 and capillary electrophoresis (CE)15,16. Enzymatic assays are highly specific,
instrumentally simple, but sometimes too time consuming – typically requiring hours per
measurement17, and are restricted to a single analyte. Chromatographic techniques are
sensitive, versatile, and have excellent reproducibility. However, separations are slow and
typically sample pre-treatment is required. Capillary Electrophoresis (CE) is a powerful
alternative characterized by faster separation compared to LC and has been widely used to
separate a diverse range of analytes, from small ions through to macromolecules in many
fields18,19, in particular for monitoring bioprocesses. As discussed in a recent review, CE has
been readily employed for the analysis of discrete samples, utilizing commercially available
single or multiple capillary instruments20. It has also been employed for on line monitoring of
a variety of analytes in different matrices and environments, but only a few reports present
dedicated, online sampling interfaces for CE analysis20. One of those, a CE method with
conductivity detection was applied for automated continuous on-line analysis of 23 ions in
tap water over two days21. CE was also used for on-line determination of perchlorate in
biological samples such as breast milk, human urine, serum, red wine and cow’s milk using a
supported liquid membrane22. A filter probe was integrated with a computerized pneumatic
sampling system to monitor the bioaccumulation of Cu2+, Zn2+, Co2+ and Cd2+ in the bacteria
species Rhodococcus sp.23.
Another CE method using LIF detection was successfully employed for microbial analysis of
water collected from two local streams through continuous electrokinetic injection under field
amplified conditions24.
The low sample volume makes CE ideally suited for monitoring cell culture conditions and
cell-based assays. In this study, an automated, robust and portable SI-CE setup was

79
developed by modifying the experimental set up previously reported by Blanco et al.25. A
flow-through interface was designed to sample cell-free media for monitoring lactate
production by the human embryonic kidney cell line HEK293 and mouse fibroblast cell lines
(Fe18.83 and Fe20.4). The unique combination of the sampling interface and SI-CE system
minimised sample consumption and analysis time. Using this system, 72 samples were
analysed per day using less than 700 µL of sample per day, enabling monitoring of lactate
production by HEK293 cells in vitro over three days, using less than 10% of the total media
volume. The system was also applied to study the difference in lactate production between a
WT and mitochondrial function compromised ND4 knockout mouse fibroblast cell lines.
2.2 Materials and methods
2.2.1 Chemicals
All reagents were analytical grade reagent obtained from Sigma–Aldrich (Sydney, AUS) and
were used as supplied unless otherwise stated. Solutions were prepared in Milli-Q water
(Millipore, Bedford, MA, USA). Lactate standard solution (10 mM) was prepared weekly and
stored at 8 ◦C by dissolution of its sodium salt. Chloride standard solution (2 M) was prepared
monthly from sodium chloride and stored at room temperature.
The cationic polyelectrolyte poly(ethylenimine) (PEI) (ACROS organics, Geel, Belgium) was
added to BGE. A polyelectrolyte multilayer coated fused-silica capillary prepared from
hexadimethrine bromide (HDMB) (Sigma–Aldrich, St. Louis, MO, USA) and poly(sodium 4-
styrene sulfonate homopolymer) (PSS) and (HDMB) again in order to reverse the EOF.
Cetyltrimethylammonium bromide (CTAB) was added to BGE in case of dynamic coating.
Two studied BGEs including a combination of (tris(hydroxymethyl)aminomethane
(Tris))/Ncyclohexyl-2-aminoethanesulfonic acid (CHES), pH 8.85 and 2-(N-

80
morpholino)ethanesulfonic acid (MES)/20 mM l-histidine (His), pH 6.15 were evaluated for
optimum separation.
2.2.2 Instrument design and operation
A scheme of the instrumental set up used for this work is shown in Figure 2-1. The SI-CE
instrumentation is composed of two peristaltic pumps (PeriWaves, CorSolutions, Ithaca, NY,
USA) for sample and BGE delivery to the system. A two-position injector valve (MXP-7980,
Rheodyne, Oak Harbor, WA, USA) was used to direct sample or BGE to the analytical
system. A PEEK T-piece-connector (P-727, Upchurch Scientific, OakHarbor, WA, USA)
was used for interfacing the flow system and the CE capillary. This interface allows inserting
the capillary with a small internal volume (0.57 µL).

81
Figure 2-1 Schematic diagram of the SI-CE system placed inside an incubator. Sample and
BGE and introduced by the peristaltic sample and BGE pumps, respectively. An injector
valve directs the BGE or sample towards the sampling interface. When the isolation valve is
open, sample or BGE flows into the waste vial, when the valve is closed, the liquid will be
forced into the 50 µm I.D. fused silica capillary. The CE separation is achieved by applying
+30 kV (HV) to the outlet vial while the interface was grounded (G). A capacitively coupled
contactless conductivity detector (C4D) was positioned 10 cm from the outlet of the 85 cm
long capillary.

82
All connecting tubing was selected based on a narrow diameter (381 µm) to reduce dead
volume and to minimize turbulent flow. The capillary inlet was fixed near the interface centre
at a position to eliminate consecutive sample carry over, and the outlet end was immersed in
a 25 mL glass vial filled with BGE. A stainless steel syringe needle was cut to yield a 2 cm
long, 0.51 mm internal diameter tube and was employed as electrode and connected to the
interface through the waste tubing. A solenoid (isolation) valve (HP225K021, NResearch,
West Caldwell, NJ, USA) was linked on the waste tubing at the T piece outlet to control
solutions direction either to capillary or to waste. A commercial capacitively coupled
contactless conductivity detector, C4D (TraceDec), was supplied by Innovative Sensor
Technologies (Strassahof, Austria). Detection parameters were optimized according to
capillary internal diameter. The detector operational parameters were selected as following:
frequency, 2× high (5 MHz); voltage, 18 db; gain, 200%; off set, 008. The detector sensing
head was fixed 10 cm from the outlet end of the CE capillary. A high-voltage power supply
was used for CE under reversed polarity, with the anode (+) electrode immersed in the outlet
glass vial. The injector valve, pumps and high-voltage power supply were connected with an
NI USB-6212 data acquisition interface board (National instruments, Austin, TX, USA) and
controlled using Lab-View v8.1 (National Instruments).
It is important to note that all the described components were sufficiently compact to be
placed inside an incubator (BBD6220, Heraeus, Thermo-Fisher, Kendo Laboratory Products,
Zurich, Switzerland) that was operated at fixed humidity (90%) and constant temperature (37
◦C). A CO2 Laser Engraver (40 W CO2 Deluxe Hobby Laser, Full Spectrum Laser LLC, Las
Vegas, NV, USA) was used to fabricate a hole in both the sampling tubing interface and cell
culture flask. Sequential injection of samples was optimized and the sequence of analysis
steps is detailed in Table 2-1.

83
Table 2-1 Sequence of events in the SI-CE system operation, the HV power supply is only
activated during separation
Setup operation
Position of valve
Used BGE volume µL
Used sample volume µL
Flow rate (µLmin-1)
Used time (s)
Isolation Valve
Sample pump
BGE Pump
1 Flushing of capillary and interface
1 100 0 100 60 Close Off On
2 Equilibrate 1 0 0 0 1 Open Off Off
3 Sample introduction
2 0 8.33 25 20 Open On Off
4 Sample injection
2 0 0.33 20 1 Close On Off
5 Flushing of interface
1 83.33 0 500 10 Open Off On
6 Separation 1 923.33 0 50 1108 Open Off On

84
The SI-CE system was operated as follows: the capillary and the interface were filled and
flushed with BGE in order to equilibrate the capillary and to remove any air bubbles. The
sample was introduced into the interface before being injected into the capillary by briefly
closing the solenoid valve. The interface was then flushed with BGE (83 µL) at a high flow
rate (0.5 mL.min-1) before applying the high voltage (+30 kV) for electrophoretic separation.
2.2.3 Electrophoretic conditions
Fused-silica capillaries (50 µm I.D; Polymicro Technologies, Phoenix, AZ, USA) with 85 cm
length (75 cm effective length) were used. Capillaries were conditioned by flushing with 1 M
NaOH at 0.5 µL.min−1 for 5 min then Milli-Q water at the same rate for 5 min. For the
multilayer polymer coating, the capillary was flushed with 1% aqueous solution of HDMB
for 5 min at 0.5 µL.min−1, 1% PSS for 5 min at 0.5 µL.min−1, 1% aqueous solution of HDMB
for 5 min at 0.5 µL.min−1 and finally with BGE for 30 min. The BGE solutions after
optimization consisted of 50 mM/50 mM of Tris (tris(hydroxymethyl)-aminomethane) and
CHES (cyclohexyl-2-aminoethanesulfonic acid) at pH 8.85 and 20 mM/20 mM 2-(N-
morpholino)ethanesulfonic acid (MES) and L-histidine (His) at pH 6.15. 0.02% (w/v) PEI
was added in order to stabilize the coating and to alter the selectivity. For the CTAB dynamic
coating, after flushing with 1 M NaOH and Milli-Q water, capillaries were flushed for 60 min
with BGE containing 0.03 mM CTAB. Two BGEs were evaluated: Tris/CHES and
MES/HIS. Separation was performed at −30 kV. The BGE bottle in case of using Tris/CHES
was connected to a nitrogen line to keep the solution and the headspace with fresh nitrogen to
prevent alteration of the pH from CO2 absorption. The EOF in the electropherogram appeared
as a negative peak from with the low-conductivity sample.
85
2.2.4 Application in monitoring mammalian cell culture
2.2.4.1 Human embryonic kidney cells
Human embryonic kidney cells (HEK293, Sigma–Aldrich, Castle Hill, Australia) were
routinely cultured under standard conditions (5% CO2, 37 ◦C, 90% humidity) in Dulbeccos
Modified Eagles Medium (DMEM, InVitro, Noble Park North, Australia) supplemented with
10% fetal calf serum (FCS, VWR, Murarrie, Australia) and penicillin/streptomycin/glutamine
(Invitrogen, Mulgrave, Australia). For measurement of lactate production, cells were seeded
at 8 × 10⁵ cells/cm2 in growth media in specially prepared T75 flask (Corning® 75 cm2
rectangular canted neck cell culture flask with vented cap) with a 510 µm I.D. hole at the top
cover which was engraved using a laser engraver (at 30% cut speed, 5% laser power and 5
repeats) and sealed to prevent any contamination prior to cultivation. The flask also contained
the sampling interface, which was inserted through the hole at its top cover and was prepared
by engraving a 500 µm I.D. hole 500 µm from the end of 508 µm I.D. tubing (1522,
Upchurch Scientific fluorinated ethylenepropylene) using a laser engraver (26 repeats at
100% speed, 5% laser power). Cells were left to adhere over night before they were washed
with PBS twice and the medium was changed to a total of 20 mL Leibowitz L15 medium
(VWR, Murarrie, Australia) containing 5% FCS and penicillin/streptomycin/glutamine. Cells
were immediately transferred to a second humidified, cell culture incubator (90% humidity,
37 ◦C, without CO2 supply) that contained the sampling and measurement set up. The
incubator was not opened for the duration of the experiment.
2.2.4.2 Mouse fibroblast cells
Mouse fibroblast cells (Fe18.83, ND4 knockout, David Thorburne, Melbourne, Australia)
and (Fe20.4, Wild Type WT, Thorburne, Melbourne, Australia) were routinely cultured under
standard conditions (5% CO2, 37 ◦C, 90% humidity) DMEM supplemented with 5% fetal calf

86
serum and penicillin/streptomycin/glutamine. For measurement of lactate production, cells
were seeded at 2 × 10⁵ cells/cm2 in growth media in the particularly prepared T75 flask
following the procedure described in the previous section. After the first three-day
monitoring experiment, media was removed and the cells adhered at the bottom of the T75
flask were washed twice with PBS before 20 mL fresh Leibowitz L15 medium containing 5%
FCS and penicillin/streptomycin/glutamine was added. The flask was directly transferred
back to the cell culture incubator (without CO2 supply) and connected with the analytical
system (the connection tubing was rinsed at least 3 times with 70% ethanol and autoclaved to
eliminate any source of contamination) to start the second 3-day monitoring experiment.
2.3 Results and discussion
2.3.1 Method development
2.3.1.1 SI-CE of lactate
A CE method for monitoring lactate in cell cultures must be a fast, efficient, selective, and
automated. Most importantly, it should only use minute amounts of sample per analysis. As
our previously described SI-CE system21,25 had the potential to meet the sampling
requirements, this set-up was modified to develop a suitable separation method. The most
significant change compared to our previous work is the use of peristaltic pumps instead of
the MilliGAT piston pumps. Peristaltic pumps were selected because the liquid solution does
not come in contact with the pump, hence eliminating the risk of blocking/damaging valuable
parts of the pump. Cell culture broths contain proteins, lipids and cellular debris, which can
likely adhere to and contaminate and destruct the inside of other pump types, while in
peristaltic pump the tubing can be simply replaced. The accuracy of the employed pumps was
tested at the used flow rate and the deviation from the programmed flow was found to be
approximately 1.5%. The peristaltic pumps are programed to deliver BGE and sample,

87
respectively. First, the interface and the capillary are flushed with BGE, closing the solenoid
isolation valve to flush BGE through the capillary. Subsequently, the six-port valve is
switched to allow the sample pump to introduce sufficient sample to fill the interface
(solenoid isolation valve open) and to inject a small plug of sample onto the capillary by the
build-up of pressure when the solenoid isolation valve is closed for 1 s. Then the six-port vale
is switched again to pump BGE into the system to remove excess sample from the interface
and to start separation (solenoid isolation valve open). To reduce BGE and sample
consumption, the sample pump is stopped when the system is flushed with BGE and vice
versa. Both dynamic and permanent coatings were explored for finding the best
electrophoretic separation conditions in terms of reproducibility, repeatability, linearity,
coating and base line stabilities, limit of detection and limit of quantification.
As CTAB has been used as effective EOF reversal agent in C4D of anions26, this was initially
examined27,28. Using MES/HIS and operating the system at a constant 37 ◦C inside the
incubator, the precision of lactate electrophoretic mobilities (7.14% RSD) was comparable to
those obtained at room temperature (8.87% RSD), but lower baseline stability was noticed
which led to decreased precision in the lactate peak area. Changing to Tris/CHES enhanced
the electrophoretic mobility precision (3.92% RSD) and the base line stability, but the
precision of the peak areas was still poor (15.19% RSD). These results suggested that the
CTAB dynamic coating was not sufficiently reliable and a polyelectrolyte multilayer coating
was adopted using the polymers HDMB and PSS. A 3-layer, HDMB/PSS/HDMB coating
was prepared, which significantly improved the repeatability as demonstrated in Table 2-2
with excellent electrophoretic mobility precision (0.07% RSD) and good base line stability
and very good precision of the peak areas (3.98% RSD). Because the baseline when using
Tris/CHES BGE was slightly more stable than when using MES/HIS, this BGE was selected
for further optimization.

88
Table 2-2 Summary of validation results of lactate monitoring developed methods in terms of
repeatability, reproducibility, linearity and limit of detection and quantification.
CTAB
added to
BGE
MES/HIS
CTAB
added to
BGE
Tris/CHE
S
HDMB/PS
S/HDMB,
PEI added
to BGE
MES/HIS
HDMB/PS
S/ HDMB,
PEI added
to BGE
Tris/CHES
Intraday precision (Electrophoretic
mobilities) n= 5
7.14% 3.92% 0.11% 0.07%
Interday precision (Electrophoretic
mobilities), n=5
8.23% 4.35% 0.15% 0.09%
Intraday precision (Peak areas), n=5 15.09% 15.19% 10.22% 3.98%
Interday precision (Peak areas), n=5 18.41% 22.14% 11.36% 6.57%
LOD 2 µM 3 µM 3 µM 3 µM
LOQ 1 µM 13 µM 15 µM 11 µM
Base line stabilities + ++ +++ ++++
Linearity (0.15-5 mM) 0.9589 0.9622 0.9954 0.9977

89
2.3.1.2 SI-CE of lactate in cell culture media
Cell culture media contains a wide variety of compounds including inorganic ions, amino
acids, sugars, vitamins and proteins. It was essential to further optimize the developed
method to resolve lactate from interference from other anions. The PEI concentration, BGE
concentration and pH, and capillary coating, I.D. and length were all investigated. The
optimized conditions were as follows: 85 cm × 50 µm I.D. (10 cm to detector)
HDMB/PSS/HDMB coated capillary, 25 mM Tris/35 mM CHES, pH 8.65 with 0.02% PEI.
Figure 2-2 shows an electropherogram of cell culture media spiked with 0.125 mM lactate
and without added lactate.
To test the monitoring system, a lactate standard solution (3.5 mM) was monitored at 20 min
intervals over 2 days using the optimized conditions. Figure 2-3 illustrates the change in peak
area over time, the oscillating variation is most likely related to the pulsation of the peristaltic
pump, introducing different amounts of sample into the capillary depending on the phase of
the pulse and the closing of the isolation valve.

90
Figure 2-2 Electropherograms of cell culture media alone (black) and of the same media
spiked with 0.125 mM lactate (red), Conditions: 85 cm x 50 µm I.D. fused silica capillary
coated with HDMB/PSS/HDMB; BGE: 25 mM Tris/35 mM CHES, pH 8.85 with 0.02% PEI;
+30 kV applied to outlet vial while interface was grounded. Signal was obtained using a
TraceDEC conductivity detector C4D positioned 10 cm from the outlet.
0 200 400 600 8000
10
20
30
Lactate
Sig
nal (
mV
)
Time (seconds)
Culture media alone Culture media spiked with lactate
Lactate

91
Figure 2-3 Monitoring of a standard solution containing 3.5 mM lactate over time. Conditions
as described in Figure 2-2.
0 20 40 600
1
2
3
4
Lact
ate
conc
. (m
M)
Time (hours)

92
Displacement pumps provide suitable, pulsation-free alternative to introduce approximately
equal amounts of sample each run as described by Tahkoiemi et al. for online bioprocess
monitoring as mentioned above23,29. Displacement pumps, however, require a larger amount
of sample (44 µL) for each run, more than five times the volume that can be achieved using
peristaltic pumps. As the small sample volume is a crucial for the use of the proposed system
for bioprocess monitoring, a correction for oscillations the due to the use of a peristaltic
pump was made using chloride as internal standard to correct the lactate peak area. The level
of chloride in the cell culture media (241 mM) is not expected to vary significantly over time
despite the small but continuous flux of chloride into and out of cells to maintain ion
homeostasis. The chloride peak area was found to vary by ± 5% over 225 runs over 3 days,
indicating only minimal fluctuations in chloride over time.
2.3.2 Sampling interface
To chemically monitor the composition of the media in culture by CE, a method for cell-free
sampling is required to avoid clogging of the capillaries and other fluidic connections. From
the variety of flasks available, a standard flask with a surface area of 75 cm2 was selected for
seeding 1,000,000 cells using 20 mL media. A CO2 laser engraver was used to engrave a hole
in the culturing flask to serve as an access hole for the sampling interface, and this hole was
sealed with sticky tape immediately after ablation to minimize the risk of contamination.
Viable HEK293 cells are, like most mammalian cell lines, adherent, which means they will
attach to the bottom of the culturing flask. As a result, the media above the cells can be
considered as cell-free, and is suitable for direct injection into the SI-CE system. To
selectively sample from this cell-free layer of media, a sampling interface was developed
from a piece of Teflon tubing. Using the CO2 laser engraver, a 500 µm hole was ablated in a

93
1.588 mm O.D., 0.508 mm I.D. tube, spaced 500 µm away from the end of the tube Figure
2-4.

94
Figure 2-4 Photograph of the sampling interface consisting of a laser machined 500 µm hole,
500 µm from the edge of a piece of Teflon tubing (1.588 mm O.D., 0.508 mm I.D.).

95
This distance was selected to be sufficiently high above the cells to prevent any cells from
entering the analytical system, and sufficiently low to ensure that media but not air was
sampled for the duration of the experiment. This sampling tube was sterilized carefully with
70% ethanol before its insertion into the culturing flask.
For assembly, the tape isolating the hole in the cell culture bottle was removed from the
culturing flask in a sterile biohazard cabinet and the tubing, sterilized with 70% ethanol, was
fed through the hole and pressed firmly on the bottom to ensure a liquid seal. This seal is
important to restrict the fluid intake to the sampling hole, preventing the cells from entering
the sampling tube through the bottom of the tube (Figure 2-5). The sampling tube was then
sealed in place with sterile aquarium grade silicon, and connected to the peristaltic pump.

96
Figure 2-5 Photograph of the Sampling tubing inserted through a 510 µm hole laser machined
in a 75 cm2 culture flask. The sampling tubing touches the bottom of the flask.

97
2.3.3 Monitoring of lactate production in HEK293 cells
Cells were loaded into the prepared culturing flask with sampling interface and left to adhere
overnight before being washed with PBS twice before 20 mL Leibowitz L15 medium was
placed in the flask. The adhesion of the cells to the bottom of the flask is crucial for sampling
cell-free media. The flask was then immediately transferred to the humidified, 37 ◦C cell
culture incubator and connected to the sampling and measurement set up. Here, a Y-
connector was used to dilute the sampled cell culture media 1:1 with Milli-Q water before
injection in the SI-CE system. This reduced protein content and served to halved the required
sampling volume. Based on the process times reported in Table 2-1, a new sample was
analysed every 20 min, resulting in a total of 228 electropherograms over 76 h. Figure 2-6
shows ten selected electropherograms from 20 to 200 min after the start of the sampling. For
each analysis, only 8.73 µL of culture media was consumed, resulting in a total sample
volume of 1.99 mL of media over three days – this is less than 10% of the total media present
in the culture flask.

98
Figure 2-6 Monitoring lactate production of HEK293 cells. The image shows 10 consecutive
electropherograms recorded between 20 and 200 minutes from the start of the experiment,
conditions as in Figure 2-2.
300 400 500 6000
50
100
150
200
Lact
ate
Chloride
Sign
al (m
V)
Time (seconds)
after 200 min
after 180 min
after 160 min
after 140 min
after 120 min
after 100 min
after 80 min
after 60 min
after 40 min
after 20 min

99
While the gradual decrease in the amount of media in each run is small, there is still the
possibility that this volume change will induce changes in concentration and contribute as a
major error in the measurements. This was minimised by using chloride as internal standard
to lower any possible variations in lactate level readings. However, both the amount of
sample used for analysis and the sampling time intervals can be controlled according to the
practical application and the volume of cell culture.
Figure 2-7 represents the change in lactate concentrations over the cell culture. During the
first 30 h of culture, the lactate concentration in the culture media remained unchanged before
increasing steadily at a rate of 0.03 mM lactate per hour. This likely represents the lactate
production by HEK293 cells under mostly anaerobic conditions.

100
Figure 2-7 Lactate production of HEK293 cells over 76 hours, Peak areas corrected for
changes in injection volume using Cl- as internal standard. ∆lactate = lactate (measured) -
lactate (basal).
0 20 40 60 800.0
0.5
1.0Δ
Lact
ate c
onc.
(mM
)
Time (hours)

101
2.3.4 Monitoring of lactate production in mouse fibroblast cells
One of the main advantages of the presented system is the ability to show variations in lactate
concentration over short time intervals. This feature is of importance to compare any change
in the lactate production profiles between cells with different mitochondrial activity. Here, we
measured lactate production in fibroblasts cell culture of a wild type (WT) mouse (control)
and compared it with the lactate production profile from fibroblasts taken from another
mouse with abnormal mitochondrial function, a mitochondrial gene ND4 knockout ( ND4 is a
subunit of mitochondrial respiratory chain complex 1). It was expected to observe higher
lactate production rate in cells cultured from the mice with the abnormal mitochondrial
function compared to the WT.
After leaving cells to adhere on the culture flask bottom surface, cells were washed with PBS
and cultured with Leibowitz L15 medium before the transfer to the incubator containing the
analytical system. Samples were taken and analysed every 20 min for 3 days. Figure 2-8
shows the change in lactate concentrations from each cell line.

102
Figure 2-8 Lactate production of WT (Fe20.40) and ND4 knockout (Fe18.83) cell lines over
56 hours, peak areas corrected for changes in injection volume using Cl- as internal standard.
∆lactate = lactate (measured) - lactate (basal).
0 20 40 60 800.0
0.4
0.8
1.2
1.6
2.0
2.4 Fe20.40 WT Fe18.83 ND4 knockout
Δ La
ctat
e con
c. (m
M)
Time (hours)

103
As expected, the lactate production in the ND4 knockout cell line occurred at a higher rate
than in the WT. In the first 10 h of culture, lactate was produced in a similar rate in both cell
lines. An elevated high rate of lactate production was noticed in the time period between 10 –
20 h in the ND4 knockout cell line (216 µM/h) compared to the WT (8 µM/h). Between 20 –
43 h a steep increase in lactate production was observed for the WT (55 µM/h) whereas over
this time interval the lactate production in the ND4 knockout had slowed down to 18 µM/h.
Then a sudden decrease in lactate production was recorded in the MD4 knockout from 43 h to
the end of culture.
To repeat this experiment, new cell lines were obtained from other mice, again one WT and
one ND4 knockout cell line. This time, the monitoring study was carried out twice,
interrupted shortly for between runs to wash and provide fresh media to the cells attached on
the culture flask, to assess the reproducibility of lactate profile for each cell line. Figure 2-9A
shows the lactate production by the WT cell line for the two runs, demonstrating the lactate
production rate was statistically similar (p = 0.104) between the two runs. The ND4 knockout
cell line also showed a high degree of similarity in lactate production between repetitions (p =
0.905) (Figure 2-9B). The similarity of the profiles provides between the two repeats
provides confidence in the presented approach.
Surprisingly, comparing lactate profiles between the WT and ND4 knockout cell lines
contradicts the trend observed in the earlier experiment (Figure 2-9C). In both repeats, the
lactate production rate in the ND4 knockout cell line was (10 µM/h), compared with 16 µM/h
in the WT (values reported as average of both repetitions).
At this point, the data are non-conclusive and the experiment was repeated. Unfortunately, an
infection compromised this experiment and killed the cell lines. No new cell lines could be
obtained, which led to the termination of this study.

104
0 20 40 60 800.0
0.4
0.8
1.2
1.6
2.0
2.4 Normal cells 1st analysis Normal cells 2nd analysis
Δ La
ctat
e con
c. (m
M)
Time (hours)
A
0 20 40 60 800.0
0.4
0.8
1.2
1.6
2.0
2.4B
Abnormal cells 1st analysis Abnormal cells 2nd analysis
Δ La
ctat
e con
c. (m
M)
Time (hours)

105
Figure 2-9 Lactate production of WT (Fe20.40) and ND4 knockout (Fe18.83) cell lines over
73 hours, A: Repeat experiments in the WT cell line, B: Repeat experiments in the ND4
knockout, C: Comparison of lactate production in WT and ND4 knockout cell lines. Peak
areas corrected for changes in injection volume using Cl- as internal standard. ∆lactate = lactate
(measured) - lactate (basal).
0 20 40 60 800.0
0.4
0.8
1.2
1.6
2.0
2.4C
Normal cells 1st analysis Normal cells 2nd analysis Abnormal cells 1st analysis Abnormal cells 2nd analysis
Δ La
ctat
e con
c. (m
M)
Time (hours)

106
The observed time-dependent change in lactate production, as well as the rate of lactate
production provides valuable insights into the cell culturing process, and would not have been
observed using end-point measurements. The elucidation of the changes in lactate production,
and hence cellular metabolism and energy levels over time will lead to a deeper
understanding and improved control of bioprocesses.
2.4 Conclusion
An online, automated system for monitoring lactate in cell culture is presented, consuming
less than 10% of media (1.99 mL), or only 8.73 µL of sample per run, over a three-day period
(76 h). A flow-through sequential injection capillary electrophoresis system was connected to
a sampling interface to inject cell-free media from an adherent cell culture into the analytical
system and applied for near-time monitoring of the production of lactate in mammalian cell
culture. The system is flexible and could be up- and out-scaled, with developments in
separation chemistry allowing for the expansion of the analyte range and/or increase of the
analysis frequency whilst small changes in hardware would enable monitoring of multiple
cultures in parallel. The capability of online monitoring of bioprocesses introduces a new era
in cell culture experiments, replacing end-point analytical assays with insights into temporal
changes in the extracellular media, and hence in cell health. This will provide the data
required for improved understanding of biological processes, for example in elucidating
pharmacological mechanisms, as well as in optimizing and regulating biopharmaceutical
production.

107
2.5 References
1. Geigert, J., Complex Process-Related Impurities. In The Challenge of CMC
Regulatory Compliance for Biopharmaceuticals and Other Biologics, Springer: 2013; pp
199-219.
2. Eglen, R. M.; Gilchrist, A.; Reisine, T., An overview of drug screening using primary
and embryonic stem cells. Combinatorial Chemistry & High Throughput Screening 2008, 11
(7), 566-572.
3. Allen, D. D.; Caviedes, R.; Cárdenas, A. M.; Shimahara, T.; Segura-Aguilar, J.;
Caviedes, P. A., Cell lines as in vitro models for drug screening and toxicity studies. Drug
Development and Industrial Pharmacy 2005, 31 (8), 757-768.
4. Huang, S. M.; Abernethy, D. R.; Wang, Y.; Zhao, P.; Zineh, I., The utility of
modeling and simulation in drug development and regulatory review. Journal of
Pharmaceutical Sciences 2013, 102 (9), 2912-2923.
5. Streefland, M.; Martens, D. E.; Beuvery, E. C.; Wijffels, R. H., Process analytical
technology (PAT) tools for the cultivation step in biopharmaceutical production. Engineering
in Life Sciences 2013, 13 (3), 212-223.
6. Quek, L. E.; Dietmair, S.; Krömer, J. O.; Nielsen, L. K., Metabolic flux analysis in
mammalian cell culture. Metabolic Engineering 2010, 12 (2), 161-171.
108
7. Li, J.; Wong, C. L.; Vijayasankaran, N.; Hudson, T.; Amanullah, A., Feeding lactate
for CHO cell culture processes: Impact on culture metabolism and performance.
Biotechnology and Bioengineering 2012, 109 (5), 1173-1186.
8. Luo, J.; Vijayasankaran, N.; Autsen, J.; Santuray, R.; Hudson, T.; Amanullah, A.; Li,
F., Comparative metabolite analysis to understand lactate metabolism shift in Chinese
hamster ovary cell culture process. Biotechnology and Bioengineering 2012, 109 (1), 146-
156.
9. Alford, J. S., Bioprocess control: Advances and challenges. Computers and Chemical
Engineering 2006, 30 (10-12), 1464-1475.
10. Sonnleitner, B., Automated measurement and monitoring of bioprocesses: key
elements of the m(3)c strategy. Adv Biochem Eng Biotechnol. 2013, 132, 1-33.
11. Matsumoto, K.; Taguchi, S., Enzymatic and whole-cell synthesis of lactate-containing
polyesters: Toward the complete biological production of polylactate. Applied Microbiology
and Biotechnology 2010, 85 (4), 921-932.
12. Sonveaux, P.; Vegran, F.; Schroeder, T.; Wergin, M. C.; Verrax, J.; Rabbani, Z. N.;
De Saedeleer, C. J.; Kennedy, K. M.; Diepart, C.; Jordan, B. F., Targeting lactate-fueled
respiration selectively kills hypoxic tumor cells in mice. The Journal of Clinical Investigation
2008, 118 (12), 3930.
13. Paik, M. J.; Cho, E. Y.; Kim, H.; Kim, K. R.; Choi, S.; Ahn, Y. H.; Lee, G.,
Simultaneous clinical monitoring of lactic acid, pyruvic acid and ketone bodies in plasma as

109
methoxime/tert‐butyldimethylsilyl derivatives by gas chromatography–mass spectrometry
in selected ion monitoring mode. Biomedical Chromatography 2008, 22 (5), 450-453.
14. Tao, N.; DePeters, E.; German, J.; Grimm, R.; Lebrilla, C., Variations in bovine milk
oligosaccharides during early and middle lactation stages analyzed by high-performance
liquid chromatography-chip/mass spectrometry. Journal of Dairy Science 2009, 92 (7), 2991-
3001.
15. Smejkal, P.; Breadmore, M. C.; Guijt, R. M.; Foret, F.; Bek, F.; Macka, M.,
Isotachophoresis on a chip with indirect fluorescence detection as a field deployable system
for analysis of carboxylic acids. Electrophoresis 2012, 33 (21), 3166-3172.
16. Endo, A.; Okada, S., Monitoring the lactic acid bacterial diversity during shochu
fermentation by PCR-denaturing gradient gel electrophoresis. Journal of Bioscience and
Bioengineering 2005, 99 (3), 216-221.
17. Sonveaux, P.; Copetti, T.; de Saedeleer, C. J.; Végran, F.; Verrax, J.; Kennedy, K. M.;
Moon, E. J.; Dhup, S.; Danhier, P.; Frérart, F.; Gallez, B.; Ribeiro, A.; Michiels, C.;
Dewhirst, M. W.; Feron, O., Targeting the lactate transporter MCT1 in endothelial cells
inhibits lactate-induced HIF-1 activation and tumor angiogenesis. PLoS ONE 2012, 7 (3).
18. Breadmore, M. C.; Thabano, J. R.; Dawod, M.; Kazarian, A. A.; Quirino, J. P.; Guijt,
R. M., Recent advances in enhancing the sensitivity of electrophoresis and
electrochromatography in capillaries and microchips (2006–2008). Electrophoresis 2009, 30
(1), 230-248.

110
19. Breadmore, M. C.; Dawod, M.; Quirino, J. P., Recent advances in enhancing the
sensitivity of electrophoresis and electrochromatography in capillaries and microchips (2008–
2010). Electrophoresis 2011, 32 (1), 127-148.
20. Alhusban, A. A.; Breadmore, M. C.; Guijt, R. M., Capillary electrophoresis for
monitoring bioprocesses. Electrophoresis 2013, 34 (11), 1465-1482.
21. Gaudry, A. J.; Guijt, R. M.; Macka, M.; Hutchinson, J. P.; Johns, C.; Hilder, E. F.;
Dicinoski, G. W.; Nesterenko, P. N.; Haddad, P. R.; Breadmore, M. C., On-line simultaneous
and rapid separation of anions and cations from a single sample using dual-capillary
sequential injection-capillary electrophoresis. Analytica Chimica Acta 2013, 781, 80-87.
22. Kubáň, P.; Kiplagat, I. K.; Boček, P., Electrokinetic injection across supported liquid
membranes: New sample pretreatment technique for online coupling to capillary
electrophoresis. Direct analysis of perchlorate in biological samples. Electrophoresis 2012,
33 (17), 2695-2702.
23. Tahkoniemi, H.; Helmja, K.; Menert, A.; Kaljurand, M., Fermentation reactor coupled
with capillary electrophoresis for on-line bioprocess monitoring. Journal of Pharmaceutical
and Biomedical Analysis 2006, 41 (5), 1585-1591.
24. Phung, S. C.; Nai, Y. H.; Powell, S. M.; Macka, M.; Breadmore, M. C., Rapid and
sensitive microbial analysis by capillary isotachophoresis with continuous electrokinetic
injection under field amplified conditions. Electrophoresis 2013, 34 (11), 1657-1662.

111
25. Blanco, G. A.; Nai, Y. H.; Hilder, E. F.; Shellie, R. A.; Dicinoski, G. W.; Haddad, P.
R.; Breadmore, M. C., Identification of inorganic improvised explosive devices using
sequential injection capillary electrophoresis and contactless conductivity detection.
Analytical Chemistry 2011, 83 (23), 9068-9075.
26. El‐Attug, M. N.; Adams, E.; Van Schepdael, A., Development and validation of a
capillary electrophoresis method with capacitively coupled contactless conductivity detection
(CE‐C4D) for the analysis of amikacin and its related substances. Electrophoresis 2012, 33
(17), 2777-2782.
27. Elbashir, A. A.; Aboul‐Enein, H. Y., Applications of capillary electrophoresis with
capacitively coupled contactless conductivity detection (CE‐C4D) in pharmaceutical and
biological analysis. Biomedical Chromatography 2010, 24 (10), 1038-1044.
28. Law, W. S.; Kubàn, P.; Yuan, L. L.; Zhao, J. H.; Li, S. F. Y.; Hauser, P. C.,
Determination of tobramycin in human serum by capillary electrophoresis with contactless
conductivity detection. Electrophoresis 2006, 27 (10), 1932-1938.
29. Kuldvee, R.; Kaljurand, M., Stacking from the sample stream in CZE using a
pneumatically driven computerized sampler. Analytical Chemistry 1998, 70 (17), 3695-3698.

112
3 Chapter 3
Capillary Electrophoresis for Automated On-line Monitoring of Suspension Cultures: Correlating Cell Density, Nutrients and
Metabolites in near real-time3
3.1 Introduction
Bioprocess monitoring has gained importance over the past few years1. The production of
chemicals or biopharmaceuticals using biological processes is naturally susceptible to
variability because living cells consume substrates and produce metabolites and products in a
dynamic way with variations in metabolic rate across short time intervals. The FDA
recommends documentation of nutrient and metabolite time profiles in the process analytical
technology (PAT) policy to ensure product quality2. Whilst bioreactors are typically equipped
with hardware for monitoring a range of physicochemical variables including pH,
temperature and dissolved oxygen3, cell count and the analysis of metabolite levels are
usually conducted off-line4,5, making it difficult to control production in a quality-by-design
manner. Recent advances in multivariate analysis in combination with spectroscopic
techniques can provide more detailed chemical information, for example using UV6 FTIR7 or
RAMAN spectroscopy8,9. Whilst advances in chemometry and the interpretation of spectra
have greatly advanced, the resolution of complex analyte sets with similar functional groups
remains challenging. Separation science provides many solutions for the analysis of complex
samples, for example using high performance liquid chromatography (HPLC) offline10 or on
online11. Though mass spectrometry offers faster analysis, like other spectroscopic techniques
3 Update from an article accepted in, Alhusban, A. A.; Breadmore, M. C.; Gueven, N.; Guijt, R. M., Capillary electrophoresis for automated on-line monitoring of suspension cultures: correlating cell density, nutrients and metabolites in near real-time, Analytica Chimica Acta 2015, ACA-15-2656, xxx-xxx.

113
the ability to analyse complex samples, or to distinguish isomers with identical mass
sequentially without extensive sample clean-up limits its applicability. Additionally, once an
automatic sampling routine has been established, the analyte set can easily be expanded by
changes to the separation chemistry and/or detector.
Capillary electrophoresis (CE) is an alternative high-resolution separation technique to HPLC
with the potential to provide detailed chemical information faster and using smaller sample
volumes12. In a recent example, using off-line derivatisation with a fluorescent label, Turkia
et al. used capillary electrophoresis for monitoring the uptake of amino acids in beer
brewing13. For automated, on-line monitoring, the same group constructed a CE system with
flow-through sampling vial and cross filtration unit for online monitoring of the production of
carboxylic acids by two different yeasts cultures. In their work, the yeast kluyveromyces
lactis cultivation was monitored for 173 hours and 0.87 L of sample was used for 97 analyses
(8.94 mL per analysis)14.
Here, a robust and reliable electrophoretic separation method was developed for the analysis
of the metabolic biomarkers glucose, glutamine, leucine/isoleucine and lactate from media
and combined online with sampling and cell density measurements. The platform,
schematically depicted in Figure 3-1 was used to monitor cell density and these four
biomarkers in a culture of human T lymphocytes every 30 minutes over 4 days, using less
than 41 µL of sample per assay. The highly flexible platform is automated, fast and reliable
and as such expected to be able to provide new insights in the way chemical changes
influence the production of biotechnology products, including biopharmaceuticals, and will
enable the establishment of boundary conditions ensuring their quality.

114
Figure 3-1 Platform used for near real-time monitoring of Jurkat cells, the cells were cultured
under standard conditions in a bioreactor. Microfluidic devices were used to measure cell
density and to derive a cell-and particulate free sample for analysis by SI-CE.

115
3.2 Materials and Methods
3.2.1 Chemicals
All reagents were analytical grade obtained from Sigma-Aldrich (Sydney, AUS) and were
used as supplied unless stated otherwise. Milli-Q water (Millipore, Bedford, MA, USA) was
used to prepare solutions. Standards containing 0.30 mM sodium fluorescein or 0.42 mM
rhodamine-6G (BDH Chemical Ltd, Poole, UK) were prepared in milliQ water and stored at
room temperature in a dark place. Fresh standards containing 10 mM lactate, 10 mM L-
glutamine, 5 mM L-leucine, 5 mM L-Isoleucine or 40 mM D-glucose standard solution were
prepared each week and stored at 8 ºC. A 2 M chloride standard was prepared monthly by
dissolution of its sodium salt and stored at room temperature. The cationic polyelectrolytes
poly(ethylenimine) (PEI) (ACROS organics, Geel, Belgium) at 0.075% (w/v) and
hexadimethrine bromide (HDMB) at 0.005% (w/v) were added to BGE. A 90 cm PMMA
capillary was coated with a polyelectrolyte coating prepared from (HDMB) and poly(sodium
4-styrene sulfonate homopolymer) (PSS) and (HDMB) to reverse the EOF. The BGE
included a combination of 60 mM triethylamine (TEA) and 10 mM N-cyclohexyl-3-
aminopropanesulfonic acid (CAPS).
3.2.2 Fabrication of H-filter
Templates were made using dry film resist with slight modifications15. A PMMA slide (80 ×
60 × 1 mm), which were rinsed with methanol, dried using compressed air were laminated
sequentially with three 0.1 mm EP SUEX TDFS sheets (Sudbury, MA, USA) at 60 °C and
cooled down with compressed air. The protective film was removed before applying the next
layer. After removal of the final protective coversheet of the top film, a transparency mask,
made by laser printing on an overhead transparency, was positioned on top and the substrate
was exposed for 21 minutes to the output of a UV LED array (OTHL-0480-UV, Opto

116
Technology, Wheeling, IL, USA)16 and then baked at 110 °C according to the SUEX
processing guidelines. Substrates were developed in propylene glycol monomethyl ether
acetate (PGMEA), followed by a wash with isopropanol and then dried with compressed air.
The microfluidic H-filter devices were created by casting polydimethylsiloxane (PDMS)
using soft lithography with the PDMS cured for 1 hour in an oven at 70 °C. Access holes
were made at the end of each channel using a hole puncher and the device was irreversibly
sealed by plasma bonding with a glass microscope slide (75 × 51 × 1 mm). A digital
fluorescence microscope (AM4113/AD4113, Dino-lite premier digital microscope, Taiwan)
was used for testing the fabricated device.
3.2.3 Cell culture
The human T lymphocyte cell line (Jurkat ATCC® TIB-152) were routinely cultured in cell
culture flasks at 37 ºC in a cell culture incubator without CO2, in RPMI-1640 Medium (25
mM HEPES, L-glutamine without NaHCO2; 5% fetal calf serum; FCS, VWR, Murarrie,
Australia). For measurement of glucose, glutamine, leucine/isoleucine and lactate, 45 million
cells were centrifuged for 5 minutes at 200 g at room temperature before the pellet was re-
suspended gently in 30 mL culture medium and transferred into a 250 mL double sidearm
Celstir® spinner flask (Thomas Scientific, Swedesboro, NJ, U.S.A) to form a total volume of
175 mL, equivalent to 7.5 x 10⁵ cells.mL-1. The pre-assembled culture device including the
sampling tubing (inserted through a hole in the coverlid), bioreactor, coverlids, peristaltic
pump tubing and the H-filter device, was autoclaved as one unit prior to its use.
3.2.4 Cell density measurement
Cell counting microscopy chambers (1µ-slideVI0.1, Ibidi GmbH, Martinsried, Germany) were
treated with 5 mL 10% HCl (v/v) several times at room temperature and left overnight to
remove the Poly-L-Lysine coating to prevent cell adhesion between runs. They were

117
subsequently washed several times with MilliQ water and rinsed with 70% ethanol before
use. A prepared microscopy chamber was fixed onto the stage of a phase contrast microscope
(Eclipse TS100, Nikon, Japan) equipped with a digital camera (AM7023B Dino-Eye, New
Taipei City, 241 Taiwan) to capture images for cell counting. Images of cells flowing from
the bioreactor through the counting microscopy chamber were automatically captured using
software written with LabView software v8.1 (National Instruments) every 30 minutes at
40 x magnification and coincided with injection into the capillary electrophoresis instrument.
The resulting images were analysed based on % surface area covered by cells or multicellular
aggregates. The image analysis procedure comprised cropping the image to remove unrelated
area, converting the image to black and white, adjusting the black colour intensity and finally
determining the % surface area covered by cells or cell aggregates in the adjusted image
(Figure 3-2) and was conducted using the freeware package Image J.

118
Figure 3-2 Analysis for automated assessment of cell density using ImageJ software;
The following steps were followed in image analysis
Open image → Image/Crop → Image/Type/Select 8 bit (to convert the image into BW
image) Image/Adjust/Threshold: "black background" top bar at 85, lower bar at 255, default,
back and B&W then Apply Analyze/Analyze particles, Size 10-Infinity, Circularity 0-1,
Show Masks, select all except "record stats" → get the % Surface area→ OK

119
3.2.5 Instrument Design and Operation
The SI-CE instrumentation is based on previous designs used in our laboratory17,18. It is
composed of two peristaltic pumps (PeriWaves, CorSolutions, Ithaca, NY, USA) for both
sample and BGE delivery. The H-filter was positioned between the sample pump and
injection valve to prevent cells from clogging the valve. A three way solenoid valve
(360T041SHH, NResearch, West Caldwell, NJ, USA) was used to direct the extracted sample
solution into the injector or waste. A high-pressure two-position six way switching valve
(MXP9900-000, Rheodyne, Oak Harbor, WA, U.S.A) was used to control the delivery of the
BGE or sample to the capillary interface. A PEEK T-piece-connector (P-727, Upchurch
Scientific, OakHarbor, WA, U.S.A.) was used to interface the separation capillary with the
flow injection system. A PMMA capillary (28 µm I.D.; Paradigm Optics, Vancouver, WA,
U.S.A) served as separation capillary and its inlet was fixed in a position to minimize carry
over. The outlet end was immersed in a 25 mL glass vial filled with BGE. A stainless steel
syringe needle was used as hollow electrode and connected the T-interface with the
1.5875 mm O.D., 0.508 mm I.D. Teflon tubing leading to the waste. A two way solenoid
valve (HP225K021, NResearch, West Caldwell, NJ, USA) was connected with this tubing to
control the flow between the separation capillary and waste (Figure 3-3). Capacitively
coupled contactless conductivity detection, C4D, was used because of its demonstrated ability
to detect optically transparent analytes like lactate for monitoring exhaled breath19 or
adhesion cultures18.
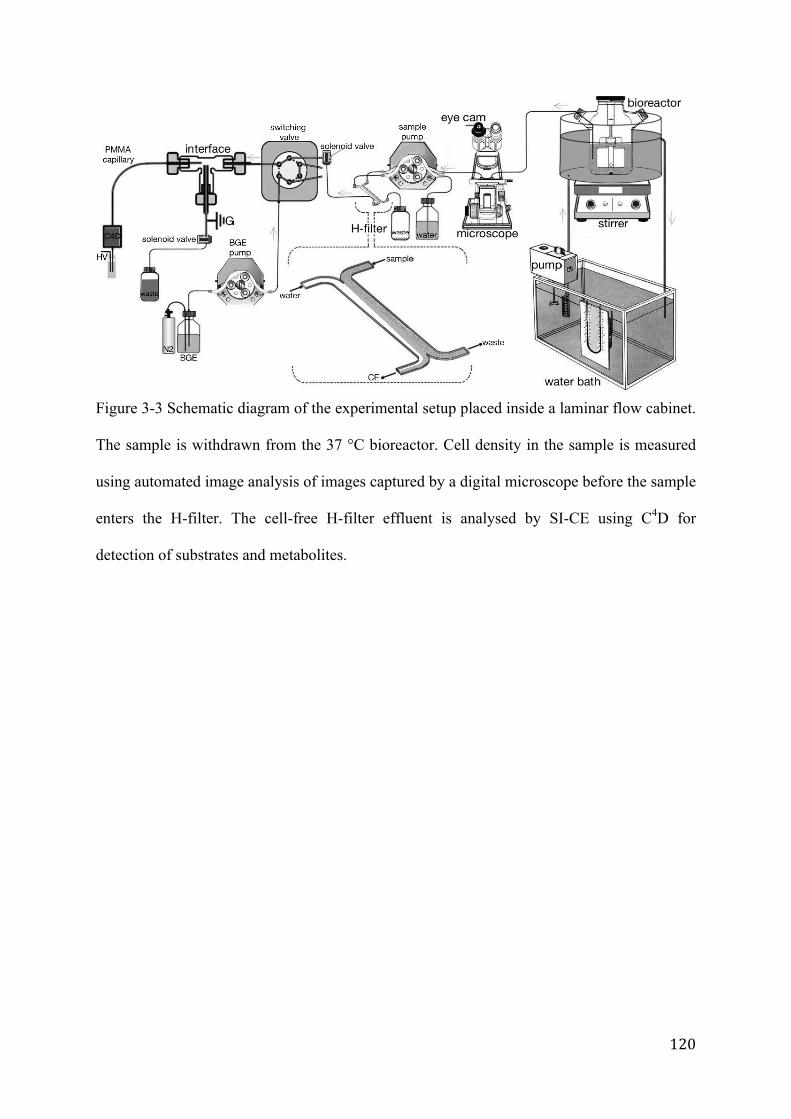
120
Figure 3-3 Schematic diagram of the experimental setup placed inside a laminar flow cabinet.
The sample is withdrawn from the 37 °C bioreactor. Cell density in the sample is measured
using automated image analysis of images captured by a digital microscope before the sample
enters the H-filter. The cell-free H-filter effluent is analysed by SI-CE using C4D for
detection of substrates and metabolites.

121
The operational parameters for the C4D were optimized as follow: frequency, 2x high;
voltage, 18 Db; gain, 200%; off set, 000. The anode (+) electrode of a reversed polarity high-
voltage power supply (4300 Emco, Sydney, NSW, Australia) was positioned in the outlet
BGE vial. A NI USB-6212 data acquisition interface board (National instruments, Austin,
TX, U.S.A.) was controlled using LabView v8.1 (National Instruments) to control the pumps,
switching valve, solenoid valves and power supply. The operation of the SI-CE setup was as
follows: both the T-interface and capillary were filled and flushed with BGE for equilibration
and cleaning purposes. The three way solenoid valve (solenoid connected to the H-filter) was
opened to flush the contents of the H-filter to waste and closed to deliver the cell-free media
sample into the switching valve. The switching valve was switched to direct sample to the T-
interface and the two way solenoid valve was briefly closed to hydrodynamically inject the
sample into the separation capillary. The switching valve was switched back to direct BGE
towards the T-interface, which was cleaned with BGE at a high flow rate. A high voltage
(+30 kV) was applied for electrophoretic separation of the sample. The sequence of events
was carefully optimized and the optimized conditions are detailed in Table 3-1. All
separations were performed at ambient temperature (20 °C).

122
Table 3-1 CE system sequence of events, the platform was operated by Labview.
Operation Position switching
valve
Position 3-way
solenoid
Position 2-way
solenoid
Flow rate (µL.min
−1)
Time (s)
BGE used (µL)
Sample used (µL)
1 Flushing of capillary with BGE 1 Open Close 50 180 150 0
2 Equilibrate 1 Open Open 0 1 0 0
3 Activation H-filter 2 Open Open 8 210 0 28
4 Filling interface with sample 2 Close Open 8 85 0 11.33
5 Hydrodynamic injection 2 Close Close 15 5 0 1.25
6 Filling interface with BGE 1 Open Open 250 15 62.5 0
7 Separation 1 Open Open 75 1304 1630 0

123
A double sidearm Celstir® bioreactor was used for culturing the T-cells. It was placed in a
plastic container above a magnetic stirrer (Townson and Mercer, Manchester, UK) and
connected to a water bath (Techne, Duxford, Cambridge, UK). A pump was used to circulate
water at 37 °C continuously through the plastic container to thermostat the bioreactor. A
1.59 mm diameter hole was drilled into the coverlid of the flask sidearm to insert 1.5875 mm
O.D. Teflon tubing for sampling. This tubing was connected to the inlet of a counting
chamber placed on a microscope with digital camera (AM7023B Dino-Eye, New Taipei City,
241 Taiwan) to capture images for cell counting. The outlet of the counting chamber was
connected to a peristaltic pump and the setup was placed in a laminar flow cabinet (ESCO,
Singapore) to minimize the risk of contamination.
3.2.6 Electrophoretic Conditions
PMMA capillaries with 90 cm length (LD = 80 cm) were used. Capillaries were flushed with
ethanol for 1 hour followed by 2.5 mM NaOH at 0.5 µL.min-1 for 20 min, then Milli-Q water
at the same flow rate for 5 min. After that, the capillaries were flushed with 1% aqueous
solution of HDMB for 10 min at 0.5 µL.min-1, Milli-Q water at 0.5 µL.min-1 for 5 min, 1%
PSS for 10 min at 0.5 µL.min-1, Milli-Q water at 0.5 µL.min-1 for 5 min, 1% aqueous solution
of HDMB for 10 min at 0.5 µL.min-1. After this procedure, the capillaries were left for at
least three days to strengthen the polyelectrolyte coating, and the coated capillary was flushed
with BGE for 30 min prior to use. The BGE consisted of 60 mM triethyamine (TEA) and 10
mM cyclohexyl-2-aminoethanesulfonic acid (CAPS) at pH 12.40. 0.005% HDMB (w/v) and
0.075% (w/v) PEI were added to stabilize the polyelectrolyte coating and to adjust selectivity.
Electrophoretic separations were conducted at -30 kV. The BGE bottle was connected to a
nitrogen gas line to prevent alteration of the pH from CO2 absorption.

124
3.3 Results
3.3.1 Cell culture optimization
Selecting the appropriate conditions required for cell growth is crucial. The recommended
media for culturing Jurkat cells is RPMI-1640 medium with 10% FCS at 37 °C in 5% CO2
incubator. High growth rate of cells in preliminary studies required lowering the amount of
FCS to 5% and decreasing the starting density to 0.5 x 10⁵ cell.mL-1 to enable passaging
every 4 days. Monitoring cell growth status and viability for several weeks, different media
were tested to allow the growth of cells in CO2 free environment which is required for the
electrophoresis system. RPMI-1640 with HEPES, 5%FCS and starting density of 0.75 x 10⁵
cell.mL-1 were the optimized conditions for healthy growth. The most challenging step was to
optimize cell growth and viability in the bioreactor flask that was surrounded by 37 °C
flowing water. Here, the position of the bioreactor, the spinning rate, amount and content of
media, rate of water flow to the plastic container that contained the flask, temperature control
and other parameters were also optimized to make sure that cells were growing at a relatively
constant rate without variation in viability. The growth state was estimated in term of
cumulative population doublings in the three environments; CO2 incubator (Figure 3-4A),
CO2 free incubator combined with bicarbonate free media (Figure 3-4B) and a water bath
combined with bicarbonate-free media (Figure 3-4C), in which cell viability was determined
by trypan blue assay (Figure 3-4D). The used media was specifically formulated to be
buffered without CO2, a method commonly used in large-scale bioreactors, for other
applications were CO2 might be essential for cell growth, the bioreactor could be connected to
a CO2 cylinder which will enable the flow of constant CO2 to keep carbonate level in the
media required for culture growth.

125
0 24 48 72 96 120 144 1680
10
20
30
40
50
60
70
80
90
100[ln
(har
vest
ed)-l
n(se
eded
)]/ln
(2)
Time (days)
y = 0.5256x + 1.9103R² = 0.9985
A
0 12 24 36 48 600
2
4
6
8
10
12
14
16
18
20B
[ln(h
arve
sted
)-ln(
seed
ed)]/
ln(2
)
Time (days)
y = 0.3805x + 0.4657R² = 0.9982

126
Figure 3-4 Cumulative population doublings of Jurkat cells in A: CO2 incubator, B; CO2 free
incubator, C: water bath at 37 °C and D: % dead cells determined using Trypan blue assay.
0 12 24 36 48 600
2
4
6
8
10
12
14
16
18
20C
y = 0.3471x + 0.0844R² = 0.9764
[ln(h
arve
sted
)-ln(
seed
ed)]/
ln(2
)
Time (days)
2.312.49
3.07 3.12
1 2 3 40.0
0.5
1.0
1.5
2.0
2.5
3.0
3.5D
% D
ead
cells
Culture number

127
3.3.2 Automated cell counting
Cell density is a key parameter to understand changes in nutrients and metabolites and
correlate these to changes of cellular metabolism. Traditional cell counting using a
haemocytometer is tedious and time-consuming, lacks statistical robustness and the validity
of results is often compromised by counting errors and variations between investigators20.
Flow cytometry provides an alternative to count cells more quickly and with superior
reproducibility compared to manual counting. However, expensive equipment, specialized
technical expertise regarding the repeated calibration and instrument software are essential to
generate reliable data21. Digital imaging of cells in a flow chamber is gaining popularity as an
alternative for cell counting as it minimises human errors, time and therefore cost22.
In this study, a microfluidic counting chamber and digital microscope were used for
automated counting of Jurkat cells. A prepared microscopy chamber was fixed onto the stage
of a phase contrast microscope equipped with a digital camera to capture images for cell
counting every 30 minutes. The resulting images were analysed based on % surface area
covered by cells (Figure 3-5).

128
Figure 3-5 Image analysis protocol, expressed as % surface area covered by cells, calibration
and validation with measurements made manually using a haemocytometer for cell density
determination.
0.0 0.5 1.0 1.5 2.0 2.5 3.0 3.50.0
0.1
0.2
0.3
0.4
0.5
0.6
0.7
0.8
0.9
1.0
y = 2.1999x + 0.2045
R² = 0.9641
Sur
face
are
a (%
)
Cell density ( 106 cells/mL)

129
This approach cannot discriminate between live and dead cells, but with the % of dead cells
determined to range from 2.3-3.1% (Figure 3-4D), this was not considered to be a concern.
Seven cells densities ranging from 0.5-3.5 million cells.mL-1 were measured in triplicate and
used to validate the automated counting procedure. Good linearity (r2= 0.9641) and precision
(RSD range 3.16-8.41) were obtained (Figure 3-5).
Over a period of 78 hours, the % surface area covered determined by image processing
correlated well with the data obtained by manual counting of samples taken from the same
culture using a haemocytometer. Beyond 78 hours, cell clumping, especially when the
density exceeded three million cells.mL-1, complicated the manual counting and the results
from the manual counting indicated that the cells had reached a plateau phase of growth. The
% coverage data obtained through image processing, however, suggested that growth
continued linearly (Figure 3-6). The reported difficulties with counting the clumped cells by
haemocytometry suggest that the digital image processing method might be more accurate
and reliable at these high cell densities. For other commercial cell cultures such as
prokaryotic cells, which might be run at high densities as high as 100 cells.mL-1, cell
clumping could be overcome by diluting the media withdrawn from the culture with 2x PBS
solution. This will decrease the aggregation between individual cells and will keep cells
amount passing the counting device within the calibrated range. Though, the phase contrast
used has given an indication to distinguish between living and dead cells. For accurate life-
dead cell differentiation, the use of fluorescence microscopy combined with commercially
available life-dead stains such as kits from Promega, in which life cells are green and dead
cells are red, would be a suggested solution. Besides, a more quantitative method would be to
measure accumulated fluorescence over a certain amount of time or volume by attaching the
system to a flow cytometer that can quantify total fluorescence in red and green channels in a
defined volume. Here, the % viability would be represented by the ratio of red to green.

130
Figure 3-6 Correlation of cell density measurements determined using the developed image
analysis protocol, expressed as % surface area covered (red/white circles), with
measurements made manually using a haemocytometer over the assay period of 100 h (black
crossed squares).
0 20 40 60 80 100
0 20 40 60 80 100
0.1
0.2
0.3
0.4
0.5
0.6
0.7
0.8
0.9
1.0
1.1
1.2 % Surface area covered Cell density ( 106 cells/mL)
Time (hours)
Surfa
ce a
rea
cove
red
(%)
0.751.001.251.501.752.002.252.502.753.003.253.503.754.004.254.50
Cel
l den
sity
( 10
6 ce
lls/m
L)

131
3.3.3 On-line removal of cells and particulates
Analysis using a SI-CE17,18,23,24 system will require a cell- and particulate free sample to
prevent clogging of the valve, capillary and fluidic connections. Filtration is an obvious
choice, and in the CE-based bioprocess monitoring system reported by Turkia et al. filtration
was used to obtain a cell- and particulate free sample from the suspension fermentation.
Filtration, however, is prone to clogging, especially when used for extended periods of time,
and Turkia et al. reported issues with cell agglomeration on the filter. H-filters exploit
laminar flow to ensure the transport of small molecules between two parallel fluid flows
based on diffusion differences between small molecules, macromolecules and
particulates25,26. The concept was introduced by Yager et al.27, and has been widely used in
different designs and forms28,29,30,31,32,33,34. In this work, the use of an H-filter to feed a cell-
free sample from a suspension culture into a sequential injection capillary electrophoresis
instrument (SI-CE) was investigated.
A H-filter with a 40 mm long, 1 mm wide and 0.285 mm high central channel was made by
soft lithography in PDMS using a dry film photoresist template created using a transparency
mask. The low Reynolds number (Re<<1) dictates laminar flow, and hence transport between
the two flows is only based on diffusion. Several models and tests were initially conducted to
ensure the efficiency and effectivity of the device design. For example, 5 µm fluorescent
beads were diluted and used to resemble cells where at the proper flow rate and channels
designs they did not have the time needed to be diffused from the donor to accepter solution
according to fluorimeter testing of products from each channel. Array reader and collecting
flows measurements have been studied for the same purpose. The transport of the target
analytes from the donor (media) into the acceptor (milliQ water) at flow rates ranging from 8
to 110 µL.min-1 was quantified by connecting the H-filter with the SI-CE system discussed
below. As illustrated in (Figure 3-7), the concentration of analyte in the acceptor phase was at

132
least 30% of the target donor phase at a flow rate of 8 µL.min-1 – the minimum flow rate the
peristaltic pump could deliver (residence time in the H-filter 9.6 seconds).
Fluorescence microscopy confirmed Rhodamine-6G stained Jurkat cells did not cross into the
acceptor solution whilst the small molecule fluorescein diffused into the acceptor solution
(Figure 3-8).

133
Figure 3-7 the influence of the flow rate on the transfer of analyte from the donor into the
acceptor solution in the H-filter. The analyte concentrations in the acceptor solution were
measured at different flow rates and expressed % of donor solution.

134
Figure 3-8 Visualising H-filter performance when operated at 8 µL.min−1 for fluorescein and
Jurkat cells. A: Diffusion of 10 ppm fluorescein from the donor stream into the acceptor
stream (water). B: Rhodamine-6G stained Jurkat cells do not diffuse into the acceptor stream
(water) at 8 µL.min−1.

135
3.3.4 SI-CE
Traditionally, sample injection in capillary electrophoresis, like in HPLC, is performed from
a sample vial. As this complicates its use for online monitoring purposes, our group has
developed SI-CE systems for rapid identification of inorganic ions in explosive devices23 and
water samples17, demonstrating that the speed, selectivity and efficiency of CE could be used
in conjunction with a flow-through interface. A similar system was used for monitoring
lactate production in adherent cell cultures in chapter 2, demonstrating minimal sample use
with 228 assays over 3 days using a total of 1.99 mL of sample18.
The SI-CE system used for this work, connected with the H-filter cell counter, is
schematically indicated in Figure 3-1, a more detailed schematic can be found in Figure 3-3.
The system comprises of two pumps (for sample and BGE respectively), a 6-port valve to
select sample or BGE to move towards the separation system and a T-interface connecting
the 6-port valve with the 28 µm I.D. PMMA separation capillary and through a tubular
ground electrode to the outlet vial. A two-way solenoid valve was positioned between the T-
interface and outlet vial to direct the liquid into the separation capillary, allowing for flushing
of the capillary and hydrodynamic sample injection. The control and data acquisition are fully
automated and controlled using a PC with NI Labview. After filling the system with BGE,
the 6-port valve is actuated to direct sample towards the T-interface. Brief closure of the two-
way solenoid valve hydrodynamically injects a small sample plug into the separation
capillary. With the solenoid open, the sample in the tubing is replaced with BGE, leaving
only the small sample plug in the separation capillary. A high voltage (+30 kV) was applied
for electrophoretic separation of the sample. The sequence of events was carefully optimized
and the optimized conditions are detailed in Table 3-1. All separations were performed at
ambient temperature (20 °C).
Combined with cell density, concentration profiles of the biomarkers glucose, glutamine,

136
leucine/isoleucine and lactate will provide insight in the cell metabolism and growth. With no
previous report for the analysis of these analytes from cell culture medium by CE, a new
separation method was developed. To separate glucose from other saccharides by CE requires
a strongly alkaline BGE with a pH value of over 12 to dissociate the semi- acetal groups into
their anionic form. The only used BGE for this purpose with conductivity detection was
NaOH 35,36,37,38. In our initial work, we developed a method based on the use of CTAB as a
dynamic coating for EOF reversal and BGE consisted of 10 mM NaOH. 60 mM TEA and/or
DEA were added to the BGE to lower the buffer conductivity in order to stabilize the
separation baseline for better qualitative selectivity and accurate quantitative measurements.
Even though good preliminary results were obtained in terms of low detection limits, low
limits of quantification and high interday and intraday precisions values were unacceptable.
Lactate and glutamine peaks could not be resolved from other components peaks in the
RPMI-1640 media and the capillary coating failed when running the system for long time
because the high content of protein in the media, that competed with CTAB binding sites on
the surface of the capillary. However, many other approaches were explored for coating fused
silica capillaries to achieve the required separation and stability against high alkalinity of the
BGE. Polyelectrolyte coatings have shown promising results in terms of separation,
selectivity and stability. Different polymers combinations were tested PDDAC/PSS/PDDAC,
PDDAC/PEI/PDDAC, HDMB/PEI/HDMB, PDDAC/PEI/ HDMB and HDMB/PSS/HDMB,
using different fused silica capillary internal diameters (10 μm I.D., 25 μm I.D., 50 μm I.D.
and 75 μm I.D.), and applying diverse coating procedures and changing times for each layer
coating, and changing various BGE solutions and concentrations around the required pH
value of more than 12. This optimization process required a very long period of time since
any change between any of the parameters mentioned required testing the coating stability for
several days. However, using HDMB/PSS/HDMB coating, 75 μm I.D. fused silica capillary,

137
coating step time intervals of 5-10 minutes and BGE of (TEA/CAPS) gave the best results
based on reproducibility of migration times and peak area, except that the stability of the
coating could not last more than 20 hours when using diluted media. The slow dissolution of
the silica at high pH was believed to be the source of the instability. After testing many
alternatives, PMMA capillaries were shown to have stronger binding with the cationic
polymers for more stable coating, and were used because of their superior stability compared
to fused silica at high pH. Using a BGE consisting of 60 mM TEA and 10 mM CAPS and a
capillary coated with a HDMB/PSS/HDMB polyelectrolyte coating all target analytes were
well resolved from interfering compounds present in the media and a stable baseline was
obtained (Figure 3-9). The performance of the optimized method was validated (Table 3-2).

138
Figure 3-9 Electropherogram showing the target analytes, carbonate and chloride in RPMI-
1640 cell culture medium. Conditions: 90 cm × 28 µm I.D. × 328 µm O.D. PMMA capillary
coated with HDMB/PSS/HDMB; BGE: 60 mM TEA/10 mM CAPS, pH 12.4 with 0.075%
PEI and 0.005% HDMB; +30 kV applied to outlet BGE vial while interface was grounded.
4 6 8 10 12 14 16
-10
-5
0
5
10
gluc
ose
leuc
ine/
isol
euci
negl
utam
ine
lact
ate
carb
onat
e
chlo
ride
Sign
al (m
V)
Time (min)

139
Table 3-2 Summary of validation results of the developed electrophoretic method in terms of
repeatability, reproducibility, linearity and limit of detection and quantification, peak areas
were corrected using chloride as internal standard.
Glucose Glutamine Leucine/Isoleucine Lactate
Intraday precision (electrophoretic mobility) n = 5
0.27% 0.15% 0.15% 0.12%
Interday precision (electrophoretic mobility), n = 5
7.21% 5.11% 5.07% 4.93%
Intraday precision (corrected peak area), n = 5
7.91% 4.57% 4.90% 3.85%
Interday precision (corrected peak area), n = 5
9.95% 6.99% 8.31% 7.21%
LOD 32 µM 25 µM 25 µM 17 µM
LOQ 50 µM 35 µM 35 µM 25 µM
Linearity (r2, 0.15–5 mM) 0.9867 0.9906 0.9863 0.9912

140
Interday and intraday electrophoretic mobility precision averages were very good (5.58 %
RSD and 0.17% RSD), an impressive achievement considering the system was not thermally
controlled, and detection limits were obtained in the range of 0.17 µM – 0.32 µM. Because of
the harsh separation conditions, difficulties in guaranteeing the stability of the polyelectrolyte
coating over four days led to the decision to replace the capillary every day.
3.3.5 Bioprocess monitoring of suspension cells
Over a period of 4 days, 200 cell density measurements and 200 electropherograms were
recorded using only 8.1 mL of sample, comprising around 4.5% of the total volume of the
bioreactor. This cumulative volume over 4 days is smaller than the 8.94 mL of media per run
required by Turkia et al. and could potentially be further reduced to zero by minimizing dead
volume and recycling the donor solution back into the bioreactor after the H-filter. The
concentration of glucose, glutamine, leucine/isoleucine and lactate is correlated with the
corresponding cell density over the four-day period (Figure 3-10).

141
Figure 3-10 Monitoring of Jurkat cells over 100 hours, concentrations of glucose, glutamine,
leucine/isoleucine, lactate on the left axis, cell density on the right hand axis. Peak areas
corrected using Cl− as internal standard. ΔLactate is the change in lactate relative to the basal
lactate level in the media.
0 20 40 60 80 100
0 20 40 60 80 100
0
2
4
6
8
10Δ LactateGlutamineGlucoseLeu./IsoeucineCell density
Time (hours)
Ana
lyte
(mM
)
1.0
1.5
2.0
2.5
3.0
3.5
4.0
4.5
Cel
l den
sity
(106
cells
/mL)

142
Three monitoring experiments were conducted spaced one month apart to ensure data could
be compared between experiments. The average standard deviation was significant, ranging
from 11-62% for lactate. When correcting for cell density (this was done every 30 minutes by
dividing the amount of lactate produced per mL by the number of cells per mL, resulting in
the amount of lactate produced per cell), however, this was reduced to 3-49%. The large
standard deviations were typical for the earlier measurements, with the average RSD for
lactate being reduced by a third from 24 to 16% when corrected for cell density. The raw and
corrected data with error bars reflecting the standard deviation are presented in Figure 3-11.
The RSDs <10% obtained for lactate for the last four measurements demonstrates the
robustness of the presented system as the validation of the CE separation method indicates
the analytical part already contributes 7.21 % of intraday variation (Table 3-2).

143
Figure 3-11 Averaged values with error bars for A: Δlactate; B: glucose; C: glutamine and D:
leucine/isoleucine for three 100 h experiments. Raw data (black) and data corrected for cell
density (blue).
0 20 40 60 80 1000
2
4
6
8
A
Time (hours)
ΔLa
ctat
e (m
M)
0 20 40 60 80 100
0
2
4
6
8
ΔLa
ctat
e/ce
ll (fm
ol/c
ell)
0 20 40 60 80 1000
2
4
6
8
10
12
14
16
B
Time (hours)
Glu
cose
(mM
)
0 20 40 60 80 100
0
2
4
6
8
10
12
14
16
Glu
cose
/cel
l (fm
ol/c
ell)
0 20 40 60 80 100
0
1
2
C
Time (hours)
Glu
tam
ine
(mM
)
0 20 40 60 80 100
0
1
2
Glu
tam
ine/
cell
(fmol
/cel
l)
0 20 40 60 80 1000.0
0.2
0.4
0.6
0.8
1.0
D
Time (hours)
Leu
/Isol
euci
ne (m
M)
0 20 40 60 80 100
0.0
0.2
0.4
0.6
0.8
1.0
Leu
/Isol
euci
ne/c
ell (
fmol
/cel
l)

144
3.4 Discussion
Over the first 6 hours of culture, a considerable loss of glucose (44%) and glutamine (49%)
was evident despite a low rate of cell proliferation and no change to lactate concentrations
(Figure 3-10). The consumption of glucose is necessary for the cells to produce energy in the
form of adenosine triphosphate (ATP), while the consumption of glutamine reflects
glutaminolysis to produce nicotinamide adenine dinucleotide phosphate (NADPH) for
anabolic processes, such as the synthesis of fatty acids, and protein synthesis. Both processes
are essential for cell growth and duplication39. After 40 and 48 hours respectively, glucose
and glutamine in the media were fully depleted while lactate levels increased steadily at a rate
of about 0.17 mM.hr-1 up to 52 hours. Interestingly, in the time period between 41 to 52 hours
of cell culture – after all of the glucose and 99% of glutamine was depleted – cells kept
growing at an almost unchanged rate. Autophagy might be one of the most probable
explanations to maintain the energy required for cell growth. However, future studies should
be conducted to investigate the detailed metabolic profile during this particular time period.
Between 52 and 90 hours of culture, a sudden change from lactate production to consumption
was observed. This metabolic change is consistent with the need to explore other sources of
energy to sustain growth under condition where all the glucose, glutamine and possibly other
substrates have already been consumed. This shift from lactate production to consumption is
characteristic of fast growing cells when the only remaining energy source becomes lactate
itself39,40. From 90 hours to the end of the experiment at 100 hours, lactate levels decreased at
a lower rate despite a continued constant cell growth rate, indicating an equilibrium between
lactate production and consumption may have been established (Figure 3-10).
In order to correlate the metabolic markers to cell growth, a standardization of lactate
concentration change with cell density over the entire culture period of 4 days was performed
(Figure 1-12A). When zooming in on the time period from 10 to 52 hours (Figure 1-12B), a

145
linear correlation between the production of lactate and cell density was observed after the
first few hours representative of the lag phase of cell growth. The corrected data elucidate
that over this 10-52 h interval, 38% of lactate production was due to the increased cell
metabolism as represented by increase in lactate production per cell indicated with the dark
grey area, while 62% was a result of increased cell density (light grey area). Figure 1-12C
reflects the interval between 52 and 98 hours. Whilst the lactate measurements indicate a
stagnating increase in lactate production, the data corrected for cell density show a negative
trend, indicating a change in metabolic state to where the cells consume lactate. Because the
lactate consumption per cell remains constant over this period, one can conclude the
measured increase in lactate consumption is predominantly due to increased cell density
(Figure 1-12C).

146
0 20 40 60 80 100
0 20 40 60 80 100
0
2
4
6
8
A ΔLactate (mM) ΔLactate/cell (fmol/cell)
Time (hours)
ΔLa
ctat
e (m
M)
0
2
4
6
8
ΔLa
ctat
e/ce
ll (fm
ol/c
ell)
20 40
20 40
0
2
4
6
8
ΔLa
ctat
e (m
M)
ΔLactate (mM) ΔLactate/cell (fmol/cell)
B
62%
Time (hours)
R² = 0.9713
R² = 0.8688
38%
0
2
4
6
8
ΔLa
ctat
e/ce
ll (fm
ol/c
ell)

147
Figure 3-12 Standardization of changes in lactate deviation from the basal lactate level in the
media by cell density, A: Comparison of Δlactate from 0-100 h expressed as raw data (solid
cycles) and corrected for cell density (open triangles), B: Comparison of Δlactate from 10 - 52
h expressed as raw data (solid cycles) and corrected for cell density (open triangles), C:
Lactate consumption (1/Δlactate) (solid circles) and lactate consumption corrected for cell
density (open triangles) from 52 - 100 h.
60 80 100
60 80 100
0.00
0.02
0.04
0.06
0.08
0.10
0.12
0.14
0.16
0.18C 1/ΔLactate (L/mmol) 1/ΔLactate/cell (fmol/cell)
Time (hours)Lact
ate
cons
umpt
ion
[1/Δ
Lact
ate
(L/m
mol
)]
R² = 0.8446
R² = 0.7597
0.00
0.02
0.04
0.06
0.08
0.10
0.12
0.14
0.16
0.18
1/Δ
Lact
ate/
cell
(fmol
/cel
l)

148
The detailed analysis of the lactate date provided above demonstrates that access to the time-
dependent concentration and cell density changes provides the data required to generate a
deeper understanding of the status of suspension cultures at any given time point, which will
ultimately lead to a better control of bioprocesses. It is important to note that in this work we
focused on key anionic nutrients and metabolites, but changes to only the separation
chemistry would allow broadening the scope to analytes compatible with conductivity
detection. Relatively small changes to the SI-CE hardware would increase the set of target
analytes by at least a factor 2 without increasing the sample volume using a dual SI-CE
system, as demonstrated by our group for online automated simultaneous separation of anions
and cations in tap water17. Lastly, the system is compatible for coupling to a mass
spectrometer, or to exchange the conductivity detector with a photometric unit for absorption
of fluorescence detection. One should keep in mind the flow conditions for the H-filter
presented here were optimized for small molecules, and would have to be re-optimised when
targeting analytes with a significantly larger diffusion constant.
3.5 Conclusion
A new platform for online and automated monitoring of a mammalian suspension culture is
presented capable of measuring cell density, nutrient- and metabolite levels every 30 minutes
over a period of four days, using less than 41 µL of culture media per analysis. Digital
imaging of the Jurkat cells in a microfluidic chamber provided an automated cell counting
method with higher reliability than traditional cytometry at cell densities over three million
cells.mL-1. An H-filter was used to obtain a cell- and particulate-free solution that contained
at least 30% of the target analytes. A 6-port valve was used to inject this sample into a
sequential injection capillary electrophoresis system for quantification of glucose, glutamine,
leucine/isoleucine and lactate. Data analysis revealed a metabolic change from lactate

149
production to lactate consumption at around 50 h, behaviour that is characteristic of fast
growing cells. Correlation of the lactate profile with cell density provided insight in the
metabolic state of the cells, allowing for delineation of the lactate production as a result of
metabolism or cell density. The SI-CE method is flexible and allows for expansion of the
analyte set without increasing the sample volume, making this new flexible platform a highly
desirable asset to meet the future demands in process monitoring in the biopharmaceutical
industry.

150
3.6 References:
1. Zhao, L.; Fu, H. Y.; Zhou, W.; Hu, W. S., Advances in process monitoring tools for
cell culture bioprocesses. Engineering in Life Sciences 2015.
2. Kim, S.; Lanz, K. J.; Evans, C. E.; Gibson, E. R.; Olesberg, J. T.; Mallem, M.;
Shandil, I.; Nylen, A.; Koerperick, E. J.; Cooley, D. W., Real-time monitoring of glycerol
and methanol to enhance antibody production in industrial Pichia pastoris bioprocesses.
Biochemical Engineering Journal 2015, 94, 115-124.
3. Schwamb, S.; Puskeiler, R.; Wiedemann, P., Monitoring of Cell Culture. In Animal
Cell Culture, Springer: 2015; pp 185-221.
4. Ozturk, S.; Thrift, J.; Blackie, J.; Naveh, D., Real-time monitoring and control of
glucose and lactate concentrations in a mammalian cell perfusion reactor. Biotechnology and
Bioengineering 1997, 53 (4), 372-378.
5. Junker, B.; Wang, H., Bioprocess monitoring and computer control: key roots of the
current PAT initiative. Biotechnology and Bioengineering 2006, 95 (2), 226-261.
6. Ouyang, Q.; Zhao, J.; Pan, W.; Chen, Q., Real-time monitoring of process parameters
in rice wine fermentation by a portable spectral analytical system combined with multivariate
analysis. Food Chemistry 2015.
7. Schenk, J.; Marison, I. W.; von Stockar, U., pH prediction and control in bioprocesses
using mid-infrared spectroscopy. Biotechnology and Bioengineering 2008, 100 (1), 82-93.

151
8. Abu‐Absi, N. R.; Kenty, B. M.; Cuellar, M. E.; Borys, M. C.; Sakhamuri, S.;
Strachan, D. J.; Hausladen, M. C.; Li, Z. J., Real time monitoring of multiple parameters in
mammalian cell culture bioreactors using an in‐ line Raman spectroscopy probe.
Biotechnology and Bioengineering 2011, 108 (5), 1215-1221.
9. Whelan, J.; Craven, S.; Glennon, B., In situ Raman spectroscopy for simultaneous
monitoring of multiple process parameters in mammalian cell culture bioreactors.
Biotechnology Progress 2012, 28 (5), 1355-1362.
10. De Sá, L. R. V.; De Oliveira, M. A. L.; Cammarota, M. C.; Matos, A.; Ferreira-
Leitao, V. S., Simultaneous analysis of carbohydrates and volatile fatty acids by HPLC for
monitoring fermentative biohydrogen production. International Journal of Hydrogen Energy
2011, 36 (23), 15177-15186.
11. Tohmola, N.; Ahtinen, J.; Pitkänen, J.-P.; Parviainen, V.; Joenväärä, S.; Hautamäki,
M.; Lindroos, P.; Mäkinen, J.; Renkonen, R., On-line high performance liquid
chromatography measurements of extracellular metabolites in an aerobic batch yeast
(Saccharomyces cerevisiae) culture. Biotechnology and Bioprocess Engineering 2011, 16 (2),
264-272.
12. Alhusban, A. A.; Breadmore, M. C.; Guijt, R. M., Capillary electrophoresis for
monitoring bioprocesses. Electrophoresis 2013, 34 (11), 1465-1482.
13. Turkia, H.; Sirén, H.; Penttilä, M.; Pitkänen, J.-P., Capillary electrophoresis with
laser-induced fluorescence detection for studying amino acid uptake by yeast during beer
fermentation. Talanta 2015, 131, 366-371.

152
14. Turkia, H.; Holmstro�m, S.; Paasikallio, T.; Sirén, H.; Penttila�, M.; Pitka�nen, J.-
P., Online Capillary Electrophoresis for Monitoring Carboxylic Acid Production by Yeast
during Bioreactor Cultivations. Analytical Chemistry 2013, 85 (20), 9705-9712.
15. Guijt, R. M.; Candish, E.; Breadmore, M. C., Dry film microchips for miniaturised
separations. Electrophoresis 2009, 30 (24), 4219-4224.
16. Breadmore, M. C.; Guijt, R. M., High intensity light emitting diode array as an
alternative exposure source for the fabrication of electrophoretic microfluidic devices.
Journal of Chromatography A 2008, 1213 (1), 3-7.
17. Gaudry, A. J.; Guijt, R. M.; Macka, M.; Hutchinson, J. P.; Johns, C.; Hilder, E. F.;
Dicinoski, G. W.; Nesterenko, P. N.; Haddad, P. R.; Breadmore, M. C., On-line simultaneous
and rapid separation of anions and cations from a single sample using dual-capillary
sequential injection-capillary electrophoresis. Analytica Chimica Acta 2013, 781, 80-87.
18. Alhusban, A. A.; Gaudry, A. J.; Breadmore, M. C.; Gueven, N.; Guijt, R. M., On-line
sequential injection-capillary electrophoresis for near-real-time monitoring of extracellular
lactate in cell culture flasks. Journal of Chromatography A 2014, 1323, 157-162.
19. Greguš, M.; Foret, F.; Kindlová, D.; Pokojová, E.; Plutinský, M.; Doubková, M.;
Merta, Z.; Binková, I.; Skřičková, J.; Kubáň, P., Monitoring the ionic content of exhaled
breath condensate in various respiratory diseases by capillary electrophoresis with contactless
conductivity detection. Journal of Breath Research 2015, 9 (2), 027107.

153
20. Lee, L., Automating the Cell Counting Process. Genetic Engineering &
Biotechnology News 2014, 34 (15), 34-35.
21. Herculano-Houzel, S.; von Bartheld, C. S.; Miller, D. J.; Kaas, J. H., How to count
cells: the advantages and disadvantages of the isotropic fractionator compared with
stereology. Cell and Tissue Research 2015, 360 (1), 29-42.
22. Flight, R.; Landini, G.; Styles, I.; Shelton, R.; Milward, M.; Cooper, P., Semi-
automated cell counting in phase contrast images of epithelial monolayers. MIUA 2014, 241-
246.
23. Blanco, G. A.; Nai, Y. H.; Hilder, E. F.; Shellie, R. A.; Dicinoski, G. W.; Haddad, P.
R.; Breadmore, M. C., Identification of inorganic improvised explosive devices using
sequential injection capillary electrophoresis and contactless conductivity detection.
Analytical Chemistry 2011, 83 (23), 9068-9075.
24. Cabot, J. M.; Fuguet, E.; Roses, M.; Smejkal, P.; Breadmore, M. C., Novel instrument
for automated pKa determination by Internal Standard Capillary Electrophoresis. Analytical
Chemistry 2015.
25. Brody, J. P.; Yager, P., Diffusion-based extraction in a microfabricated device.
Sensors and Actuators A: Physical 1997, 58 (1), 13-18.
26. Wa�gli, P.; Chang, Y.-C.; Homsy, A.; Hvozdara, L.; Herzig, H. P.; de Rooij, N. F.,
Microfluidic Droplet-Based Liquid–Liquid Extraction and On-Chip IR Spectroscopy
Detection of Cocaine in Human Saliva. Analytical Chemistry 2013, 85 (15), 7558-7565.

154
27. Brody, J. P.; Kamholz, A. E.; Yager, P. In Prominent Microscopic Effects in
Microfabricated Fluidic Analysis Systems, BiOS'97, Part of Photonics West, International
Society for Optics and Photonics: 1997; pp 103-110.
28. Yager, P.; Afromowitz, M. A.; Bell, D.; Forster, F. K.; Brody, J. P.; Qin, D.; Cabrera,
C.; Holl, M.; Kamholz, A.; Weigl, B. In Design of Microfluidic Sample Preconditioning
Systems for Detection of Biological Agents in Environmental Samples, Proceedings of the
1998 Conference on Microfluidic Devices and Systems, Bellingham, WA, United States,
Santa Clara, CA, USA, SPIE: Bellingham, WA, United States, Santa Clara, CA, USA, 1998;
pp 252-259.
29. Munson, M. S.; Cabrera, C. R.; Yager, P., Passive electrophoresis in microchannels
using liquid junction potentials. Electrophoresis 2002, 23 (16), 2642-2652.
30. Jandik, P.; Weigl, B. H.; Kessler, N.; Cheng, J.; Morris, C. J.; Schulte, T.; Avdalovic,
N., Initial study of using a laminar fluid diffusion interface for sample preparation in high-
performance liquid chromatography. Journal of Chromatography A 2002, 954 (1-2), 33-40.
31. Lai, J. J.; Nelson, K. E.; Nash, M. A.; Hoffman, A. S.; Yager, P.; Stayton, P. S.,
Dynamic bioprocessing and microfluidic transport control with smart magnetic nanoparticles
in laminar-flow devices. Lab on a Chip - Miniaturisation for Chemistry and Biology 2009, 9
(14), 1997-2002.
32. Lewpiriyawong, N.; Yang, C., Continuous separation of multiple particles by negative
and positive dielectrophoresis in a modified H-filter. Electrophoresis 2014, 35 (5), 714-720.
155
33. Osborn, J. L.; Lutz, B.; Fu, E.; Kauffman, P.; Stevens, D. Y.; Yager, P., Microfluidics
without pumps: Reinventing the T-sensor and H-filter in paper networks. Lab on a Chip -
Miniaturisation for Chemistry and Biology 2010, 10 (20), 2659-2665.
34. Helton, K. L.; Nelson, K. E.; Fu, E.; Yager, P., Conditioning saliva for use in a
microfluidic biosensor. Lab on a Chip - Miniaturisation for Chemistry and Biology 2008, 8
(11), 1847-1851.
35. Vochyánová, B.; Opekar, F.; Tůma, P.; Štulík, K., Rapid determinations of
saccharides in high-energy drinks by short-capillary electrophoresis with contactless
conductivity detection. Analytical and Bioanalytical Chemistry 2012, 404 (5), 1549-1554.
36. Carvalho, A. Z.; da Silva, J. A.; do Lago, C. L., Determination of mono and
disaccharides by capillary electrophoresis with contactless conductivity detection.
Electrophoresis 2003, 24 (12,13), 2138-2143.
37. Nogueira, T.; do Lago, C. L., Detection of adulterations in processed coffee with
cereals and coffee husks using capillary zone electrophoresis. Journal of Separation Science
2009, 32 (20), 3507-3511.
38. Sarazin, C.; Delaunay, N.; Costanza, C.; Eudes, V.; Gareil, P.; Vial, J., On the use of
response surface strategy to elucidate the electrophoretic migration of carbohydrates and
optimize their separation. Journal of Separation Science 2012, 35 (10-11), 1351-1358.

156
39. Zagari, F.; Jordan, M.; Stettler, M.; Broly, H.; Wurm, F. M., Lactate metabolism shift
in CHO cell culture: the role of mitochondrial oxidative activity. New Biotechnology 2013,
30 (2), 238-245.
40. Luo, J.; Vijayasankaran, N.; Autsen, J.; Santuray, R.; Hudson, T.; Amanullah, A.; Li,
F., Comparative metabolite analysis to understand lactate metabolism shift in Chinese
hamster ovary cell culture process. Biotechnology and Bioengineering 2012, 109 (1), 146-
156.

157
4 Chapter 4
Parallel Monitoring of Pharmacological Assays using Sequential
Injection Capillary Electrophoresis4
4.1 Introduction
Regulatory and ethical constraints on performing experiments on laboratory animals have
directed pharmacological and toxicological studies towards cell-based based testing. Cell
culture experiments can be conducted with high throughput on a wide variety of cell types,
with data are typically derived as an end-point measurement using a plate reader. Whilst this
is satisfactory for drug screening, pharmacological studies would benefit from more frequent
measurements to obtain a better insight in the biochemical processes taking place over time.
Ideally, changes in nutrient, substrate and/or metabolite concentration should be determined
in an automated, low maintenance manner over short intervals and correlated with viability.
The sample consumption over the duration of the cell culture experiment should be
minimized, and the sterility of the cell culture should not be compromised by the analytical
system. Current technologies available for chemical monitoring fail to meet the combination
of these requirements. Sensors have good sensitivity and selectivity, but are through their
specificity restricted to one analyte of interest1 and as the signal is prone to drift require
regular calibration2. To simultaneously analyse a range of analytes, high-resolution analytical
techniques would be required. Spectroscopic techniques, for example using UV3 FTIR4 or
RAMAN spectroscopy5,6, can provide detailed chemical information but despite advances in
4 Update from an article under review in, Alhusban, A. A.; Breadmore, M. C.; Gueven, N.; Guijt, R. M., Parallel monitoring of pharmacological assays using sequential injection capillary electrophoresis, Analytical Chemistry, 2016, ac-2015-04822f, xxx-xxx.

158
the interpretation of spectra, resolving complex analyte sets with similar functional groups
remains challenging. Mass spectrometry can be used to analyse cell culture media, but the
extensive sample clean-up restricts its use for automated monitoring7. Chromatographic
separations require extensive sample pre-treatment and each analysis takes >10 minutes,
making it less suitable for a high throughput automated monitoring.
Capillary Electrophoresis (CE) is a powerful and fast separation technique capable of dealing
with small sample volumes8, and has been employed in bioprocess monitoring for broad
range of analytes9. For example, Sandlin et al. employed a microfluidic CE system for in vivo
bioprocess monitoring of amino acids through on-line coupling of the chip to a microdialysis
probe10. Also using a microfluidic approach, the secretion of glucagon from pancreatic islets
of Langerhans was monitored online using an electrophoretic heterogeneous immunoassay11.
Turkia et al. developed a flow-through interface for a commercial CE instrument, which was
used for monitoring organic acids over several days12. Our group developed a Sequential
Injection CE (SI-CE) system comprising a low dead volume flow-through interface for
automated sample injection13,14, which we modified for the online analysis of lactate, glucose,
glutamine, and leucine/isoleucine. Combined with an automated cell density measurement,
the system was applied to monitor a culture of human T lymphocytes every 30 minutes over 4
days15.
Here, we present a SI-CE system capable of monitoring five parallel cultures for
pharmacological assays that are typically conducted at a number of different concentrations.
This system is unique by, in addition to the CE separations, determining cell density of
human T lymphocytes every 12 minutes over 4 days, using 60 µL of sample per analysis for
five parallel cultures. To demonstrate the applicably of the system for pharmacological
studies, the five parallel assays were conducted for three different pharmaceutical compounds
selected based on their potential effect on lactate production. Being fully automated, flexible

159
and fast, this system can provide new perceptions to study biochemical and metabolic
changes in pharmacological assays.
4.2 Experimental Section
4.2.1 Chemicals and Reagents
All chemicals were obtained as analytical grade reagent from Sigma–Aldrich, (Sydney,
Australia) and used as provided unless indicated otherwise. All solutions were prepared in
Milli-Q water (Millipore, Bedford, MA, USA) and micro-filtered prior usage. 20 mM lactate,
10 mM L-glutamine, 5 mM L-leucine, 5 mM L-isoleucine, 5 mM L-arginine and 2 M
chloride standard solution were prepared and stored at 8 °C. Rotenone, β-lapachone and
clioquinol (Ciba chemicals, Basel, Switzerland) all at 10 mM were prepared and frozen
before dilution and addition to culture media. The cationic polyelectrolyte poly(ethylenimine)
(PEI) (ACROS organics, Geel, Belgium) at 0.025% was added to BGE. An 80 cm
polyelectrolyte coated fused-silica capillary was prepared from hexadimethrine bromide
(HDMB) and poly(sodium 4-styrene sulfonate homopolymer) (PSS) and (HDMB) to reverse
the EOF. The BGE consisted of a combination of tris(hydroxymethyl)aminomethane (Tris))
and N-cyclohexyl-2-aminoethanesulfonic acid (CHES) at pH 8.9.
4.2.2 Instrument Design
The SI-CE instrumentation is based upon a modified design in our laboratory16. It consists of
two peristaltic pumps (PeriWaves, CorSolutions, Ithaca, NY, USA) for sample introduction
and BGE delivery. A 7-port selector valve (MXP-7970, Rheodyne, Oak Harbor, WA, USA)
was added to enable sequential sampling from each of the five culture flasks. A microfluidic
chamber (1µ-slideVI0.1, Ibidi GmbH, Martinsried, Germany) mounted on a microscope
(Eclipse TS100, Nikon, Japan) was employed to determine the cell density. A PDMS
microfluidic H-filter cast from an in-house made dry film photoresist template with a 40 mm

160
long, 1 mm wide and 0.285 mm high central channel was used to prevent cells and debris
from clogging the injector valve. A three way solenoid valve (360T041SHH, NResearch,
West Caldwell, NJ, USA) was used to control flow of either the extracted sample or the
carrier solution into the injector. A high-pressure two-position six port switching valve
(MXP9900-000, Rheodyne, Oak Harbor, WA, U.S.A) was used to deliver either BGE or
sample to the capillary interface. A PEEK T-piece-connector (P-727, Upchurch Scientific,
OakHarbor, WA, U.S.A.) was used to interface the flow injection system with the separation
capillary. A fused silica capillary (50 µm I.D.; Polymicro Technologies, Phoenix, AZ, USA)
was used for separation and its inlet was positioned in the interface to eliminate any carry
over, with the outlet immersed in a glass vial filled with 25 mL BGE. A 20 mm long stainless
steel syringe needle was used to connect the T-interface with Teflon tubing (1.5875 mm
O.D., 0.508 mm I.D.) and used as hollow electrode that flowed to waste. A two way solenoid
valve (HP225K021, NResearch, West Caldwell, NJ, USA) was used to stop the flow between
the separation capillary and the waste tubing to perform a hydrodynamic injection. Detection
was via a capacitively coupled contactless conductivity detection (C4D) with optimized
operational parameters as follow: (frequency, 2x high; voltage, 18 Db; gain, 200%; off set,
000). A high-voltage power supply (4300 Emco, Sydney, NSW, Australia) with reversed
polarity was immersed in the outlet BGE vial. A NI USB-6212 data acquisition interface
board (National instruments, Austin, TX, U.S.A.) using LabView v8.1 (National Instruments)
was used to control the peristaltic pumps, selector valve, switching the solenoid valves and
power supply, and for collection and saving the electrophoretic data.
4.2.3 Cell Density Measurement
A microscopy chamber (1µ-slideVI0.1, Ibidi GmbH, Martinsried, Germany) prepared as
described previously was placed on the stage of a phase contrast microscope connected to a
digital camera (AM7023B Dino-Eye, New Taipei City, 241 Taiwan) to count cells by image

161
capture. Images were automatically captured at 40x magnification every 12 minutes as
programmed in the LabView code to correlate with sample injection into the SI-CE. Images
were analysed according to % surface area covered by cells or multicellular aggregates using
the freeware package Image J to determine the cell density each run. Reproducibility and
validation of this procedure is discussed elsewhere15.
4.2.4 H-Filter
A microfluidic H-filter device was made by casting polydimethylsiloxane (PDMS) onto an
in-house template. The H-filter exploits laminar flow with small molecules transport between
the two parallel fluid flows based on diffusion. This was employed to acquire a cell- and
particulate-free solution with at least 30% of the target analytes in the acceptor stream at a
flow rate of 8 µL.min-1. Design, fabrication, validation and extraction efficiency are described
in detail in our previous work15.
4.2.5 Instrument Operation
The SI-CE setup is schematically depicted in Figure 4-1 and was operated in 7 consecutive
steps.

162
Figure 4-1 Schematic diagram of the experimental setup, the sample is withdrawn from one
of the culture flasks, followed by cell density measurement using automated image analysis.
In the H-filter, analytes are extracted into a cell-free sample solution which is analysed by SI-
CE with C4D. The selector valve ensures sampling from a different flask every run, with a
run time of 12 minutes each flask is sampled once an hour.

163
The 7 port selector valve was switched to withdraw sample from the first culture flask at the
lowest flow rate to enable the image capture of the cells inside the counting device while the
three way solenoid was switched to flush the rest of previous sample to the waste.
Simultaneously, the switching valve was switched back to direct BGE towards the T-
interface at low flow rate while the two-way solenoid was open, and the high voltage (+28
kV) was applied on the capillary for the electrophoretic separation of the previous sample.
The selector valve was switched back to withdraw the sample carrier solution at higher flow
rate to carry the sample through the sample peristaltic pump into the H-filter. At the same
time, the two-way solenoid was closed and both the T-interface and capillary were filled and
flushed with BGE at higher flow rate to equilibrate the separation capillary, remove any air
bubbles or partial blockage and stabilize the baseline. The sample flow rate was lowered back
to 8 µL.min−1 to enable the diffusion of target analytes from cells into an accepter solution in
the H-filter. In parallel, the two-way solenoid was reopened and the flow of BGE reduced to
eliminate the pressure in the T-interface. The three way solenoid was switched to transport
the cell-free media into the switching valve at higher flow rate. The switching valve was
switched to direct sample to the T-interface and the two-opening solenoid valve was closed
for one second to inject the sample plug hydrodynamically into the separation capillary. In
the final stage of this run, small amount of the carrier solution was withdrawn to initiate the
sample pump for the next run. And in the meantime, the switching valve was switched to
deliver BGE to clean the T-interface from the rest of the sample at a higher flow rate, and to
prepare the setup to begin the next run. Events sequence, conditions and liquids volumes
were cautiously optimized and are detailed in Table 4-1. All separations were performed at
room temperature (20 °C).

164
Table 4-1 Sequence of events and volumes of BGE, sample and sample carrier solution used by the SI-CE system
Operation Time
(s)
Selector
valve
position
Switching
valve
position
3-way
solenoid
direction
to
2-way
solenoid
position
H
V
BGE pump
flow rate
(µL.min−1)
Sample &
Carrier pump
flow rate
(µL.min−1)
BGE
used
(µL)
Sample
used
(µL)
Carrier
used
(µL)
1 Separation &
Sampling
452 2 1 Waste Open On 50 8 376.7 60.25 0
2 Capillary flushing &
carrying sample to
H-filter
115 1 1 Waste Closed Off 250 90 479.2 0 172.5
3 Equilibrate 2 1 1 Waste Open Off 0 0 0 0 0
4 Extraction (H-filter) 60 1 1 Waste Open Off 50 8 50 0 8
5 Fill T-interface with
sample
78 1 2 Interface Open Off 0 180 0 0 234
6 Hydrodynamic
injection
1 1 2 Interface Closed Off 0 10 0 0 0.2
7 Fill T-interface with
BGE
12 1 1 Waste Open Off 250 8 50 0 1.6
165
4.2.6 Electrophoretic Conditions
Separations were performed using fused-silica capillaries (50 µm I.D., 360 µm O.D. and 80
cm in length, LD = 70 cm). Capillaries were conditioned by flushing with 1 M NaOH at 0.5
µL.min−1 for 10 min then Milli-Q water at the same rate for 5 min. For polyelectrolyte
coating, the capillary was flushed with 1% aqueous solution of HDMB for 10 min at 0.5
µL.min−1, Milli-Q water at the same rate for 5 min, 1% PSS for 10 min at 0.5 µL.min−1,
Milli-Q water at the same rate for 5 min, 1% aqueous solution of HDMB for 10 min at 0.5
µL.min−1 and finally with BGE for at least 30 min. The BGE solution after optimization
consisted of 35 mM of Tris (tris(hydroxymethyl)-aminomethane) and 35 mM CHES
(cyclohexyl-2-aminoethanesulfonic acid) at pH 8.9. 0.025% (w/v) PEI was added for coating
stabilization and selectivity alteration. Electrophoretic separations were conducted at -28 kV.
A nitrogen gas line was connected to the BGE bottle to prevent change of the pH from the
absorption of CO2.
4.2.7 Cell Culture
The human T lymphocyte cell line (Jurkat ATCC® TIB-152) was cultured in T75 cell culture
flask (Corning® 75 cm2 rectangular canted neck cell culture flask with vented cap) routinely
at 37 ºC and 5% CO2 in a cell culture incubator, in RPMI-1640 Medium (23.8 mM NaHCO2,
L-glutamine without HEPES; 10% fetal calf serum; FCS, VWR, Murarrie, Australia). For the
assays, 225 million cells were centrifuged at 200 g for 5 minutes at room temperature. Pellets
were re-suspended gently in 200 mL culture medium and transferred into a 500 mL
Erlenmeyer flask to form a total volume of 300 mL, equivalent to 7.5 x 10⁵ cells.mL−1. This
300 mL was distributed equally over 5 Pyrex® 250 mL Erlenmeyer flasks with screw cap
(4985, Fisher Scientific, USA), adding 60 mL to each. These flasks were positioned and fixed
in an orbital shaking water bath (OW1412, Paton Scientific, Victor Harbor, SA, Australia) at
166
37 °C and at 100 rpm. Water covered entire flasks to the neck to maintain a constant
temperature through culturing time. The coverlid of each flask was drilled with a 0.95 mm
diameter hole to insert (0.91 mm O.D., 0.19 mm I.D) Tygon tubing (SC0001T, ISMATEC,
Wertheim, Germany) for sampling. All five tubing sections were connected to the five inlet
ports of the selector valve at positions (no. 2 to 5). Position no.1 was connected to a carrier
solution (5% methanol solution). A (0.91 mm O.D., 0.25 mm I.D) Tygon tubing (SC0002,
ISMATEC, Wertheim, Germany) was connected to the selector valve outlet and to the inlet
of a counting chamber positioned on a microscope connected to a digital camera (AM7023B
Dino-Eye, New Taipei City, 241 Taiwan) for image capturing for cell density determinations.
The sample peristaltic pump was connected to the outlet of the counting chamber. As careful
sterility guarantee is very important to ensure reproducible and accurate outcomes the culture
flasks, Tygon tubing with coverlids, peristaltic pump tubing and the H-filter were autoclaved
prior their use. The whole setup was fitted in a laminar flow cabinet (ESCO, Singapore) to
diminish the risk of contamination.
Serial dilutions with the required media were performed by precisely adding corresponding
concentrations of each of clioquinol, β-lapachone and rotenone to its respective culture flask.
4.3 Results and discussion
Pharmacological studies are typically conducted at a number of different concentrations and
include at least one or two blanks. As biological systems are dynamic, one of the ways to
minimize biological variability is use multiple parallel flasks to culture simultaneously under
identical conditions. This requires an analytical system for each individual flask, or the
approach implemented here, a single analytical system that can sample from each flask in
sequence. We used a SI-CE which is efficient, selective and provides rapid separations in an
automated way that only requires a very small sample volume per analysis due to the use of a
flow-through interface 13,14. In our previous systems, only one culture could be monitored at a

167
time and sampling and SI-CE were conducted sequentially, leading to a significant loss in
time. Here sampling and SI-CE are done simultaneously – while performing the separation
for one flask, the next sample is being withdrawn, counted and treated at the same time. The
run-to-run time was reduced from 22.5 min to 12 min (Table 4-1) which means that when
monitoring 5 parallel cultures, each individual culture was analysed once per hour.
The time-based concentration profile of the metabolic biomarker lactate aids in understanding
the effect of drugs on cell metabolism and growth. Since each cell culture contains a range of
compounds including amino acids, sugars, proteins, vitamins, organic and inorganic ions, our
previously developed method had to be optimised16 to separate lactate from other ions. BGE
pH and concentration, PEI concentration, capillary coating, I.D. and length were all
examined. The optimised conditions were as follows: 80 cm x 50 µm I.D. (10 cm to detector)
fused silica capillary coated with polyelectrolytes HDMB/PSS/HDMB in combination with a
BGE containing, 35 mM Tris/35 mM CHES at pH 8.9 with 0.025% PEI.
4.3.1 Analytical performance of the multi-flask system
Evaluation of the system and chemistry was performed with a single flask of culture media
over 4 days. The peak area for lactate was corrected using the chloride peak to eliminate any
variation resulting from changes in injection volume. The method was validated, with
precision of the corrected migration times of 0.71 % RSD (n=5) and 0.26% RSD (n=5) for
interday and intraday respectively. The precision in normalized peak area was 7.88 % RSD
(n=5) and 5.97% RSD (n=5) for interday and intraday. The LOD for lactate was 9 µM with a
LOQ of 17 µM and the method was linear from 0.15–15 mM (r2 = 0.9931) (Figure 4-2A).

168
Figure 4-2 A: Reproducibility of analytes in RPMI-1640 cell culture media with 10% FCS
(without cells) in one flask over continuous 4 days, B: corresponding electropherogram
showing chloride, nitrate, carbonate, lactate and amino acids. Conditions: 80 cm × 50 µm I.D.
× 350 µm O.D. fused silica capillary coated with HDMB/PSS/HDMB; BGE: 35 mM Tris/35
mM CHES, pH 8.9 with 0.025% PEI; +28

169
The same analysis was then performed by analysing the same culture media (without cells) in
five flasks over 4 days, with the calculated lactate concentration of 1.37 mM, shown in Figure
4-3. It can be seen from the figure that there is excellent correlation between the lactate
concentrations in each flask (1.37mM ± 0.119 in flask 1; 1.37mM ± 0.124 in flask 2, 1.37mM
± 0.109 in flask 3, 1.38mM ± 0.117 in flask 4, 1.37mM ± 0.110 in flask 5) (p = 0.765). The
analytical variability between each flask across 4 days is less than 7.65%. It is important to
note that because of our interest in cell metabolism and the common effect of the selected
drugs on lactate, all data processing reported focuses only on lactate. Similar time-dependent
profiles for glutamine and leucine/isoleucine are expected, demonstrating the richness of the
data that can be obtained using this method (Figure 4-3B).

170
Figure 4-3 Reproducibility of lactate concentrations in RPMI-1640 cell culture media with
10% FCS (without cells) in five flasks over continuous 4 days.
0 20 40 60 80 1000
2
4
6
8
10
12
14
16
18 Flask 1 Flask 2 Flask 3 Flask 4 Flask 5
Lact
ate
(mM
)
Time (hours)

171
4.3.2 Simultaneous monitoring of five parallel cell cultures
Biological systems are dynamic systems where the metabolic behaviour should be repeatable
when the culture conditions are precisely controlled. In order to study the biological
variability, 5 parallel cell culture flasks from a common culture of T-lymphocyte cell line
(Jurkat) were cultured simultaneously under identical conditions and lactate data were
correlated with the cell growth. Following the process described in Table 4-1, a sample was
collected and analysed every 12 min. This resulted in a total of 480 electropherograms and
480 images for cell density quantification over 96 hr: 96 electropherograms and 96 images
for each culture flask. Each individual analysis required only 60.25 µL of culture media,
resulting in a total sample volume of 5.78 mL of media per flask over four days – less than
10% of the initial media volume. The change in lactate concentration for all 5 cultures over 4
days showed good similarity over the culture period (Figure 4-4). The combined variability
here was 12.05%. This means that the biological variability is only 4.40% compared to 7.65%
analytical variability. The cell growth, measured by the increase in cell density over time,
also showed excellent similarity (Figure 4-5). Plots of the change in lactate concentration
standardized with cell densities were also similar (Figure 4-6). The high level of similarity
obtained for 5 cultures run in parallel provided the confidence that the developed system
could be applied to study the effect of pharmaceutically active compounds known to
influence lactate production. It is important to note that the incidence of
infection/contamination was less than 1 in 15 flasks, as a result of careful optimization of the
sterilization process. The sealing of the Tygon tubing in the coverlids with silicone was
critical to working infection-free.

172
Figure 4-4 Simultaneous monitoring of 5 parallel cell cultures of Jurkat cells over 4 days,
changes in lactate concentration.
0 20 40 60 80 1000
2
4
6
8
10
12
14
16
18 Culture 1 Culture 2 Culture 3 Culture 4 Culture 5
ΔLa
ctat
e (m
M)
Time (hours)

173
Figure 4-5 Simultaneous monitoring of 5 parallel cell cultures of Jurkat cells over 4 days,
changes in cell density.
0 20 40 60 80 1000.0
0.5
1.0
1.5
2.0
2.5
3.0
3.5
4.0
4.5 Culture 1 Culture 2 Culture 3 Culture 4 Culture 5
Cel
l den
sity
(106 c
ells
/mL)
Time (hours)

174
Figure 4-6 Simultaneous monitoring of 5 parallel cell cultures of Jurkat cells over 4 days,
lactate concentrations standardized on cell density. No significant differences were found
between the 5 parallel cultures based on the rate of lactate production per cell per time, (p
values range 0.072 - 0.791), using one way ANOVA test.
0 20 40 60 80 1000
2
4
6
8
10 Culture 1 Culture 2 Culture 3 Culture 4 Culture 5
ΔLa
ctat
e/ce
ll (fm
ol/c
ell)
Time (hours)

175
4.3.3 Pharmacological Applications
The three drugs selected to demonstrate the SI-CE system for monitoring parallel suspension
cultures all affect lactate production. Normally, lactate is produced from glucose and
glutamine in mammalian cells17 as a result of their conversion into ATP. Lactate is
considered as one of the most important biomarkers of metabolism and energy status in
mammalian cell culture18. Lactate levels are inversely correlated to mitochondrial function, as
impaired mitochondrial function will enhance glycolysis in an attempt to meet the cells
energy needs, which in turn relies on the conversion of pyruvate into lactate to generate
nicotinamide dinucleotide NAD+ required for glycolysis. This, together with the
pharmaceutically active compounds, is depicted in a simplified schematic given in Figure
4-7. Mitochondrial impairment increases lactate production in Jurkat cells19,20, whereas,
enhancing mitochondrial oxidative phosphorylation decreases lactate production in tumour
cells21.

176
Figure 4-7 Schematic explanation of lactate production in cells as a result of the generation of
NAD+ from NADH to sustain glycolysis, rotenone is a mitochondrial poison, inhibiting
mitochondrial function; clioquinol causes oxidative stress and as a result compromises
mitochondrial function and β-lapachone results in an increase of NAD+, which is believed to
reduce the need for lactate production.

177
4.3.3.1 A Mitochondrial Inhibitor - Rotenone
Rotenone is utilized as an insecticide and its toxicity is based on inhibiting mitochondrial
respiration22. Rotenone is a high affinity mitochondrial NADH dehydrogenase (complex I)
inhibitor, an enzyme complex essential for mitochondrial oxidative phosphorylation23 and at
nM concentrations increases extracellular lactate levels24. Preliminary cell toxicity testing
(data not shown) indicated a non-toxic concentration below 10 nM, hence three
concentrations of rotenone were selected (1 nM, 6 nM and 10 nM) and control experiments
were conducted in the other two flasks. While 1 nM and 6 nM rotenone increased lactate
production (Figure 4-8), treatment with 10 nM rotenone decreased lactate production in
comparison with the control flasks, which on face value, is inconsistent with the known
behaviour. This effect was most pronounced in the time period between 5-40 hr. However,
rotenone is also known to be cytotoxic and can cause cellular death25, and the cell density
profiles (Figure 4-9) confirmed a dose- and time-dependent reduction in cell growth for
rotenone compared to controls. This demonstrates the importance of standardizing lactate
production to cell density to fully understand the change in lactate metabolism. The
standardized results (Figure 4-10) demonstrated lactate production increased with higher
levels of rotenone, suggesting that mitochondrial activity was diminished.

178
Figure 4-8 Monitoring of 5 parallel Jurkat cell cultures over 4 days in the absence or presence
of rotenone, 1 nM, 6 nM, and 10 nM of rotenone was added to individual cell cultures (shown
as lines with SD error-bars as coloured bands), changes in lactate concentration (n=5).
0 20 40 60 80 1000
2
4
6
8
10
12
14
16
18 0 nM Rotenone 1 nM Rotenone 6 nM Rotenone 10nM Rotenone
ΔLa
ctat
e (m
M)
Time (hours)

179
Figure 4-9 Monitoring of 5 parallel Jurkat cell cultures over 4 days in the absence or presence
of rotenone, 1 nM, 6 nM, and 10 nM of rotenone was added to individual cell cultures (shown
as lines with SD error-bars as coloured bands), changes in cell density (n=5).
0 20 40 60 80 1000.0
0.5
1.0
1.5
2.0
2.5
3.0
3.5
4.0
4.5C
ell d
ensi
ty (1
06 cel
ls/m
L)
Time (hours)
0 nM Rotenone 1 nM Rotenone 6 nM Rotenone 10nM Rotenone

180
Figure 4-10 Monitoring of 5 parallel Jurkat cell cultures over 4 days in the absence or
presence of rotenone, 1 nM, 6 nM, and 10 nM of rotenone was added to individual cell
cultures (shown as lines with SD error-bars as coloured bands), changes in lactate
concentrations standardized on cell density (n=5). Statistical significant differences, based on
the rate of lactate production per cell per time, were obtained between 10 nM treatment and
control (p < 0.001) and 6 nM treatment and control (p = 0.046), whereas no significant
difference between 1 nM treatment and control (p = 0.413), using one way ANOVA test.
0 20 40 60 80 1000
2
4
6
8
10Δ
Lact
ate/
cell
(fmol
/cel
l)
Time (hours)
0 nM Rotenone 1 nM Rotenone 6 nM Rotenone 10nM Rotenone

181
Treatment with 1 nM rotenone showed no effect, suggesting this concentration was below the
effective inhibitory concentration. When looking in closer detail at the profiles, the additional
information that can be obtained through monitoring rather than end-point measurements
becomes clear. When looking at the measurement made 96 hr, only lactate production from
the 10 nM rotenone treatment was distinctly different from the control and other
concentrations (p < 0.001). When looking at the time-based profile, however, we can
distinguish between the lactate levels obtained after 20 hr, and the rate of lactate production
in the first 20 hr. For the 10 nM treatment, lactate was produced at 0.44 fmole/(cell.hr) with a
significant difference compared to control (p = 0.002), for the 6 nM this was 0.31
fmole/(cell.hr) with a significant difference compared to control (p = 0.029), for the 1 nM
0.20 fmole/(cell.hr) which was not significantly different from the control 0.24 fmole/(cell.hr)
(p = 0.149). After about 20 hr, the cell metabolism switched from lactate production to lactate
consumption as evidenced by the stabilization and decrease of lactate produced per cell.
4.3.3.2 A mitochondrial toxin - clioquinol
Clioquinol (CQ) has been clinically used as an antibiotic and antifungal agent26 before it was
removed from the market due to neurotoxicity that was likely related to impaired
mitochondrial function27. CQ induces mitochondrial dysfunction indirectly by increasing
oxidative stress and lipid peroxidation (Figure 4-7). However, the cellular response to
compensate for reduced mitochondrial ATP synthesis increases glycolysis similar to
rotenone. Therefore, CQ treatment of cells was expected to increase lactate production
comparable to rotenone. Three concentrations of CQ (1 µM, 5 µM and 10 µM) were added to
three cell cultures, and together with two controls, these five flasks were monitored
simultaneously under identical culture conditions. Lactate production (Figure 4-11) in
controls and 1 µM CQ was similar (p = 0.971), and in contrast to the expectations decreased
lactate production was observed for 5 µM and 10 µM CQ. A dramatic dose-dependent

182
reduction in cell density was observed compared to the untreated control cultures (Figure
4-12). The standardized lactate production (Figure 4-13) shows the expected dose-dependent
lactate production. These results indicate that CQ has decreased the metabolic activity of
Jurkat cells by impairing their mitochondrial function. In this case, by monitoring the culture,
it is interesting to see that the lactate production rate is the same for the treated and control
experiments, but in the CQ-treated flasks, there appears to be a correlation between the length
of lactate producing phase CQ concentration. This may be explained by the fact the speed of
change from lactate production to lactate consumption may be influenced by the cells
affected by oxidative stress. The irregularity between 45 and 75 hr for the 10 µM CQ treated
culture is most likely the result of the magnified effect of the increased imprecision with low
cell count in the corrected values.

183
Figure 4-11 Monitoring of 5 parallel Jurkat cell cultures over 4 days in the absence or
presence of clioquinol, 1 µM, 5 µM and 10 µM of clioquinol was added to individual cell
cultures (shown as lines with SD error-bars as coloured bands), changes in lactate levels over
time (n=5).
0 20 40 60 80 1000
2
4
6
8
10
12
14
16
18Δ
Lact
ate
(mM
)
Time (hours)
0 µM Clioquinol 1 µM Clioquinol 5 µM Clioquinol 10µM Clioquinol

184
Figure 4-12 Monitoring of 5 parallel Jurkat cell cultures over 4 days in the absence or
presence of clioquinol, 1 µM, 5 µM and 10 µM of clioquinol was added to individual cell
cultures (shown as lines with SD error-bars as coloured bands), changes in cell density (n=5).
0 20 40 60 80 1000.0
0.5
1.0
1.5
2.0
2.5
3.0
3.5
4.0
4.5C
ell d
ensi
ty (1
06 cel
ls/m
L)
Time (hours)
0 µM Clioquinol 1 µM Clioquinol 5 µM Clioquinol 10µM Clioquinol

185
Figure 4-13 Monitoring of 5 parallel Jurkat cell cultures over 4 days in the absence or
presence of clioquinol, 1 µM, 5 µM and 10 µM of clioquinol was added to individual cell
cultures (shown as lines with SD error-bars as coloured bands), changes in lactate
concentrations standardized on cell density (n=5). Statistical significant differences, based on
the rate of lactate production were obtained between 10 µM treatment and control (p < 0.001)
and 5 µM treatment and control whereas no significant difference was found between 1 µM
and control.
0 20 40 60 80 1000
2
4
6
8
10Δ
Lact
ate/
cell
(fmol
/cel
l)
Time (hours)
0 µM Clioquinol 1 µM Clioquinol 5 µM Clioquinol 10µM Clioquinol

186
4.3.3.3 A mitochondrial activated cytotoxin - β-lapachone
β-lapachone, a naphthoquinone derivative, increases the intracellular NAD+/NADH ratio
enabling the NQO1-dependent oxidation of NADH to NAD+ 28. Jeong et al. reported a
reduction in lactate production by 1 µM β-lapachone in two cybrid cell lines29. The reason for
reduced lactate production is thought to be partially a consequence of increased NAD+ levels
by β-lapachone, alleviating the need for NAD+ production through the conversion of pyruvate
into lactate (Figure 4-7). The previously reported effective β-lapachone concentration (1 µM)
resulted in significant cytotoxicity in our cell line, with normal cell growth only observed at a
dose of 0.2 µM or below. Therefore, β-lapachone was tested at 0.05 µM, 0.1 µM and 0.2 µM.
The only significant difference in lactate levels was found between 0.1 µM treatment and
control (p = 0.015) from the three concentrations (Figure 4-14). There was no dose-dependent
effects were observed on cell density (Figure 4-15). No statistically significant differences in
lactate production standardized on cell density (Figure 4-16) were obtained based on the rate
of lactate production per cell per time between 50 nM and control (p = 0.714), between 100
nM and control (p = 0.7644) and between 200 nM and control (p = 0.145), using one way
ANOVA test. This suggests β-lapachone does not affect the lactate production, and that the
previously reported decrease in lactate production may have been the result of a decrease in
cell density as a result of toxicity rather than an actual effect on lactate production29. This
again clearly demonstrates the value of our system by being able to measure metabolite and
standardize on cell number.

187
Figure 4-14 Monitoring of 5 parallel Jurkat cell cultures over 4 days in the absence or
presence of β-lapachone, 50 nM, 100 nM, 200 nM of β-lapachone was added to individual
cell cultures (shown as lines with SD error-bars as coloured bands), changes in lactate levels
over time (n=5).
0 20 40 60 80 1000
2
4
6
8
10
12
14
16
18Δ
Lact
ate
(mM
)
Time (hours)
0 nM β-lapachone 50 nM β-lapachone 100nM β-lapachone 200nM β-lapachone

188
Figure 4-15 Monitoring of 5 parallel Jurkat cell cultures over 4 days in the absence or
presence of β-lapachone, 50 nM, 100 nM, 200 nM of β-lapachone was added to individual
cell cultures (shown as lines with SD error-bars as coloured bands), changes in cell density
(n=5).
0 20 40 60 80 1000.0
0.5
1.0
1.5
2.0
2.5
3.0
3.5
4.0
4.5C
ell d
ensi
ty (1
06 cel
ls/m
L)
Time (hours)
0 nM β-lapachone 50 nM β-lapachone 100nM β-lapachone 200nM β-lapachone
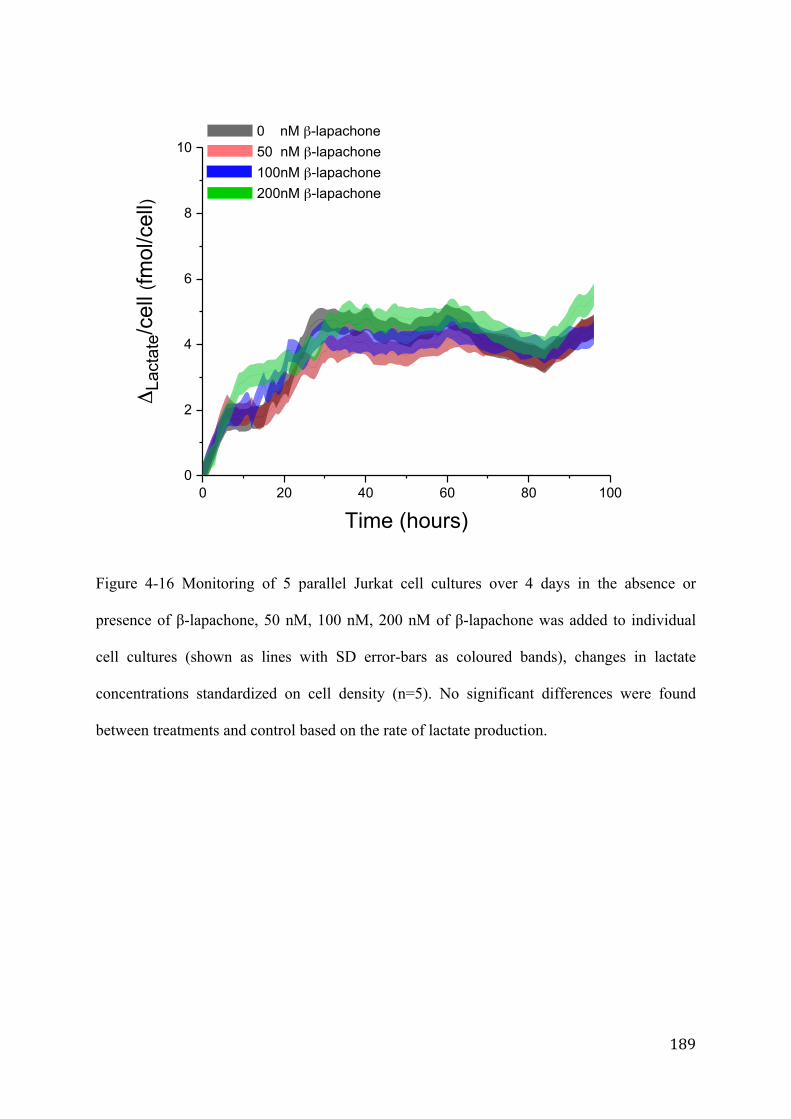
189
Figure 4-16 Monitoring of 5 parallel Jurkat cell cultures over 4 days in the absence or
presence of β-lapachone, 50 nM, 100 nM, 200 nM of β-lapachone was added to individual
cell cultures (shown as lines with SD error-bars as coloured bands), changes in lactate
concentrations standardized on cell density (n=5). No significant differences were found
between treatments and control based on the rate of lactate production.
0 20 40 60 80 1000
2
4
6
8
10Δ
Lact
ate/
cell
(fmol
/cel
l)
Time (hours)
0 nM β-lapachone 50 nM β-lapachone 100nM β-lapachone 200nM β-lapachone

190
From the three tested drugs, we can conclude that the presented SI-CE system for monitoring
5 parallel suspension cultures is suitable for conducting cell assays over at least 96 hr. The
time-dependent profile provides deeper insight in the pharmacodynamics of the administered
compound, especially because the measured effects vary over time. Recognizing further
studies are required, the differences in impact on metabolism over time for rotenone and
clioquinol may be indicative of their very different pharmacodynamics behaviour.
4.4 Conclusion
A fully automated system for monitoring variations in lactate concentration and cell density
in five parallel cultures was developed and applied to test the effects of three different
pharmaceutically active compounds. Integration of microfluidic units to a SI-CE system
enabled cell counting and extraction of analytes into a cell-free sample. With a run-to-run
time of 12 min, low sample consumption (60 µL/analysis), high throughput (480 analyses in
4 days), this robust system provides a new approach to study time-resolved pharmacological
and metabolic mechanisms. In the study presented here, the system was applied to monitoring
lactate, with the interday precision of the electrophoretic mobility and peak area 0.71 % RSD
and 7.88 % RSD respectively. Cell density and lactate measurements correlated well across
parallel cultures. A concentration-dependent increase in the production of lactate was
observed for the drugs rotenone and clioquinol, with their pharmacological differences
reflected in the lactate production rate over time. For rotenone, a steep increase was observed
over the first 20 hr, whereas for clioquinol the effect was most noticeable over the 20-96 hr
interval. For β-lapachone no concentration effect on lactate production could be
demonstrated, reinforcing the importance of correcting biological effects for cell density.
With the target analytes defined by the CE separation, the proposed system provides a
flexible platform for small molecule analytical targets, where targets can be changed by
changing the separation chemistry with no or minimal changes to the hardware. Integration of

191
the cell count and H-filter devices, as well as further miniaturization of the system would lead
to increased throughput.

192
4.5 References
1. Biechele, P.; Busse, C.; Solle, D.; Scheper, T.; Reardon, K., Sensor systems for
bioprocess monitoring. Engineering in Life Sciences 2015, 15 (5), 469-488.
2. Tohmola, N.; Ahtinen, J.; Pitkänen, J.-P.; Parviainen, V.; Joenväärä, S.; Hautamäki,
M.; Lindroos, P.; Mäkinen, J.; Renkonen, R., On-line high performance liquid
chromatography measurements of extracellular metabolites in an aerobic batch yeast
(Saccharomyces cerevisiae) culture. Biotechnology and Bioprocess Engineering 2011, 16 (2),
264-272.
3. Ouyang, Q.; Zhao, J.; Pan, W.; Chen, Q., Real-time monitoring of process parameters
in rice wine fermentation by a portable spectral analytical system combined with multivariate
analysis. Food Chemistry 2016, 190 (0), 135-141.
4. Schenk, J.; Marison, I. W.; Von Stockar, U., pH prediction and control in
bioprocesses using mid-infrared spectroscopy. Biotechnology and Bioengineering 2008, 100
(1), 82-93.
5. Abu-Absi, N. R.; Kenty, B. M.; Cuellar, M. E.; Borys, M. C.; Sakhamuri, S.;
Strachan, D. J.; Hausladen, M. C.; Li, Z. J., Real time monitoring of multiple parameters in
mammalian cell culture bioreactors using an in-line Raman spectroscopy probe.
Biotechnology and Bioengineering 2011, 108 (5), 1215-1221.

193
6. Whelan, J.; Craven, S.; Glennon, B., In situ Raman spectroscopy for simultaneous
monitoring of multiple process parameters in mammalian cell culture bioreactors.
Biotechnology Progress 2012, 28 (5), 1355-1362.
7. Paglia, G.; Hrafnsdóttir, S.; Magnúsdóttir, M.; Fleming, R. M.; Thorlacius, S.;
Palsson, B.; Thiele, I., Monitoring metabolites consumption and secretion in cultured cells
using ultra-performance liquid chromatography quadrupole–time of flight mass spectrometry
(UPLC–Q–ToF-MS). Analytical and Bioanalytical Chemistry 2012, 402 (3), 1183-1198.
8. Breadmore, M. C.; Tubaon, R. M.; Shallan, A. I.; Phung, S. C.; Abdul Keyon, A. S.;
Gstoettenmayr, D.; Prapatpong, P.; Alhusban, A. A.; Ranjbar, L.; See, H. H., Recent
advances in enhancing the sensitivity of electrophoresis and electrochromatography in
capillaries and microchips (2012–2014). Electrophoresis 2015, 36 (1), 36-61.
9. Alhusban, A. A.; Breadmore, M. C.; Guijt, R. M., Capillary electrophoresis for
monitoring bioprocesses. Electrophoresis 2013, 34 (11), 1465-1482.
10. Sandlin, Z. D.; Shou, M.; Shackman, J. G.; Kennedy, R. T., Microfluidic
electrophoresis chip coupled to microdialysis for in vivo monitoring of amino acid
neurotransmitters. Analytical Chemistry 2005, 77 (23), 7702-7708.
11. Shackman, J. G.; Reid, K. R.; Dugan, C. E.; Kennedy, R. T., Dynamic monitoring of
glucagon secretion from living cells on a microfluidic chip. Analytical and Bioanalytical
Chemistry 2012, 402 (9), 2797-2803.

194
12. Turkia, H.; Holmstro�m, S.; Paasikallio, T.; Sirén, H.; Penttila�, M.; Pitka�nen, J.-
P., Online capillary electrophoresis for monitoring carboxylic acid production by yeast during
bioreactor cultivations. Analytical Chemistry 2013, 85 (20), 9705-9712.
13. Blanco, G. A.; Nai, Y. H.; Hilder, E. F.; Shellie, R. A.; Dicinoski, G. W.; Haddad, P.
R.; Breadmore, M. C., Identification of inorganic improvised explosive devices using
sequential injection capillary electrophoresis and contactless conductivity detection.
Analytical Chemistry 2011, 83 (23), 9068-9075.
14. Gaudry, A. J.; Guijt, R. M.; Macka, M.; Hutchinson, J. P.; Johns, C.; Hilder, E. F.;
Dicinoski, G. W.; Nesterenko, P. N.; Haddad, P. R.; Breadmore, M. C., On-line simultaneous
and rapid separation of anions and cations from a single sample using dual-capillary
sequential injection-capillary electrophoresis. Analytica Chimica Acta 2013, 781, 80-87.
15. Alhusban, A. A.; Breadmore, M. C.; Gueven, N.; Guijt, R. M., Capillary
electrophoresis for automated on-line monitoring of suspension cultures: correlating cell
density, nutrients and metabolites in near real-time Analytica Chimica Acta 2016, xx (xx),
xxx.
16. Alhusban, A. A.; Gaudry, A. J.; Breadmore, M. C.; Gueven, N.; Guijt, R. M., On-line
sequential injection-capillary electrophoresis for near-real-time monitoring of extracellular
lactate in cell culture flasks. Journal of Chromatography A 2014, 1323, 157-162.
17. Quek, L.-E.; Dietmair, S.; Krömer, J. O.; Nielsen, L. K., Metabolic flux analysis in
mammalian cell culture. Metabolic Engineering 2010, 12 (2), 161-171.

195
18. Zagari, F.; Jordan, M.; Stettler, M.; Broly, H.; Wurm, F. M., Lactate metabolism shift
in CHO cell culture: the role of mitochondrial oxidative activity. New Biotechnology 2013,
30 (2), 238-245.
19. Ramanathan, A.; Schreiber, S. L., Direct control of mitochondrial function by mTOR.
Proceedings of the National Academy of Sciences 2009, 106 (52), 22229-22232.
20. Laplante, M.; Sabatini, D. M., mTOR signaling at a glance. Journal of Cell Science
2009, 122 (20), 3589-3594.
21. Lu, C.-L.; Qin, L.; Liu, H.-C.; Candas, D.; Fan, M.; Li, J. J., Tumor Cells Switch to
Mitochondrial Oxidative Phosphorylation under Radiation via mTOR-Mediated Hexokinase
II Inhibition-A Warburg-Reversing Effect. PloS One 2015, 10 (3).
22. Mane, E.; Manente, S.; Iero, A.; De Pieri, S.; Capodaglio, G.; Cima, F.; Ballarin, L.;
Bragadin, M., Beef heart mitochondria for the Rotenone monitoring. Analytical Methods
2010, 2 (7), 809-810.
23. Betarbet, R.; Sherer, T. B.; MacKenzie, G.; Garcia-Osuna, M.; Panov, A. V.;
Greenamyre, J. T., Chronic systemic pesticide exposure reproduces features of Parkinson's
disease. Nature Neuroscience 2000, 3 (12), 1301-1306.
24. Radad, K.; Rausch, W.-D.; Gille, G., Rotenone induces cell death in primary
dopaminergic culture by increasing ROS production and inhibiting mitochondrial respiration.
Neurochemistry International 2006, 49 (4), 379-386.

196
25. Pelicano, H.; Feng, L.; Zhou, Y.; Carew, J. S.; Hileman, E. O.; Plunkett, W.; Keating,
M. J.; Huang, P., Inhibition of mitochondrial respiration a novel strategy to enhance drug-
induced apoptosis in human leukemia cells by a reactive oxygen species-mediated
mechanism. Journal of Biological Chemistry 2003, 278 (39), 37832-37839.
26. Mehra, R.; Sodhi, R. K.; Aggarwal, N., Memory restorative ability of clioquinol in
copper–cholesterol-induced experimental dementia in mice. Pharmaceutical Biology 2015,
(ahead-of-print), 1-10.
27. Bareggi, S. R.; Cornelli, U., Clioquinol: review of its mechanisms of action and
clinical uses in neurodegenerative disorders. CNS Neuroscience & Therapeutics 2012, 18 (1),
41-46.
28. Pink, J. J.; Planchon, S. M.; Tagliarino, C.; Varnes, M. E.; Siegel, D.; Boothman, D.
A., NAD (P) H: quinone oxidoreductase activity is the principal determinant of β-lapachone
cytotoxicity. Journal of Biological Chemistry 2000, 275 (8), 5416-5424.
29. Jeong, M. H.; Kim, J. H.; Seo, K.-s.; Kwak, T. H.; Park, W. J., β-Lapachone
attenuates mitochondrial dysfunction in MELAS cybrid cells. Biochemical and Biophysical
Research Communications 2014, 454 (3), 417-422.

197
5 Chapter 5
General conclusions and future directions
1.1 General conclusions
Bioprocess monitoring is of high and increasing importance. First, in the production of
biopharmaceuticals, monitoring will enable control of biological process parameters to
warrant high product quality, fulfil regulatory requirements and prevent economic losses.
Adequate monitoring tools will first provide the data required for improved understanding of
these critical parameters within the dynamic biological processes, and then allow the
processes are operated within the specified margins. Second, early phase of pharmacological
studies increasingly rely on in vitro methodologies for compound testing and screening.
Monitoring would enable replacement of current end-point assays with rich, time-resolved
data providing insight in both the process and end-point. In the context of this thesis, novel
contributions have been made in the context of bioprocess monitoring relevant for both
production and drug screening. Sequential Injection Capillary Electrophoresis (SI-CE)
combines a high resolution analytical separation by capillary electrophoresis with a flow-
through interface for automated sample injection. Factors including automation, high sample
throughput, low limits of detection, low sample consumption and the ability to out-scale
make SI-CE attractive for on-line monitoring of bioprocesses.
In Chapter 2, an automated online system for monitoring lactate in different mammalian
adherent cell cultures was presented. To sample the media, a sampling interface was
developed for monitoring a human embryonic kidney cell line (HEK293) allowing for the
injection of cell-free media into the separation system. The sampling interface comprised of a
500 µm hole drilled 500 µm from the end of 500 µm I.D. Teflon® tubing. Positioning of the

198
end of the tubing on the bottom of culture flask allowed for sampling of media 500 µm from
the bottom, away from the region where the adherent cells are present. Minimising the dead
volume in the system, the sample consumption per run was only 8.73 µL resulting in a total
sample volume of 1.99 mL (less than 10% of media) used to monitor lactate production every
20 minutes over three days. The system was applied to the study the metabolic activity of
mouse fibroblasts from a mitochondrial gene ND4 knockout cell line. ND4 is a subunit of
mitochondrial respiratory chain complex 1, and the compromised mitochondrial function was
expected to increase lactate production. Increased and accelerated lactate production was
confirmed in the ND4 knock out during an initial experiment, however, these results could
not be repeated using fibroblasts obtained from another mouse.
With biopharmaceutical research and production dominated by suspension cultures, the
system described above was modified for suspension cultures in Ch 3. Three significant
changes were made, i) a microfluidic device with digital microscopy unit was included for
automated cell density measurement, ii) a H-filter was included to extract small molecules to
a cell-free acceptor phase and iii) a high resolution separation was developed allowing for
simultaneous monitoring of glucose, glutamine, leucine/isoleucine and lactate. Digital image
processing provided an automated cell counting method with improved ease of use and
higher reliability than traditional cytometry especially for cell densities above 3.5 x 10⁶
cells.mL-1. The H-filter allowed for the direction of particulate-free sample that contained at
least 30% of the target analytes towards the analytical system without the necessity of filters
or membranes that require replacement or maintenance. With the importance of glucose as a
biomarker, a CE separation method was also developed using a BGE with a pH>12 to enable
simultaneous monitoring of the essential metabolic biomarkers, glucose, glutamine,
leucine/isoleucine and lactate. Using less than 4% of media (41 µL per run), cell density and
the metabolic profile of a human lymphocyte cell line were analysed every 30 minutes over 4

199
days. In data processing, the correction of the chemical measurements for cell density
enabled for the comparison of data between runs. Importantly, correlation of the lactate
profile with cell density provided insight in the metabolic state of the cells, allowing for
delineation of the lactate production as a result of metabolism and increasing cell density.
Data analysis revealed a metabolic change from lactate production to lactate consumption at
around 50 h, behaviour that is characteristic of fast growing cells.
Ethics and governmental regulations have led to a move away from animal models to in vitro
methodologies for screening and testing compounds in early stage pharmacological studies.
Recognising the limitation of endpoint measurements as obtained using conventional assays
in terms of temporal resolution, in Ch 4 the development of a SI system for pharmacological
assays is discussed. To minimize biological variability, drug assays and controls have to be
conducted simultaneously from the same starting culture. For traditional assays, plate readers
have replaced assays in flasks to increase the sample throughput and enable the study a range
of concentrations including positive and negative controls. Because the impracticality of
connecting each parallel culture to an individual SI-CE system, the focus of Ch 4 was the
development of a method that allowed for monitoring of five parallel cultures using a single
analytical system. Through the addition of a 7 port valve to direct sampling from five
individual reactors and careful experimental design where sampling from one culture was
conducted whilst the previous was analysed, an on-line, fully automated system for near real-
time monitoring of simultaneous five parallel suspension cultures was developed. Like the
system described in Ch 3, this system was also capable of cell density measurement and a
high-resolution separations, but could do so with a 12 minute turn around time, enabling one
sample per hour from each culture. Over a period of 4 days, 480 analyses were conducted, or
96 per culture. This new approach was applied to a pharmacological study investigating the
metabolic effects of three pharmaceuticals, rotenone, β-lapachone and clioquinol, using

200
lactate as a metabolic indicator. The mitochondrial inhibitor rotenone as well as the indirect
mitochondrial poison clioquinol both showed a dose-related increase in lactate production as
a result of their effect on the mitochondria. Their profiles were different though, with
rotenone mainly exerting its effect in the first 20 hr, whereas for clioquinol the lactate
production in treated cultures only started to deviate from the control in the period between
20 hr and 40 hr. Interestingly, the lactate measurements in β-lapachone agreed with the
previously reported drop in lactate supply as a result of the presence of this NAD+ producing
compound, but when corrected for cell density there was no statistical significance between
the treatments and control. This suggests the previously presumed lactate production
inhibiting effect of β-lapachone may have been the effect of toxicity and reduction in cell
density rather than a direct metabolic effect on the cells. .
The overall aim of this thesis was to investigate the potential SI-CE for bioprocess
monitoring. A review of the literature revealed a lack of adequate sampling systems hindered
the use of CE for automated, online monitoring by capillary electrophoresis. In this thesis,
new sampling systems were introduced for sampling from adhesion cultures (Ch 2),
suspension cultures (Ch 3) and parallel suspension cultures. Combination of the sampling and
sample treatment units with carefully optimized separation chemistry allowed for the
demonstration of SI-CE for online monitoring of fermentations. With the majority of the
work presented in this thesis focusing on the use of lactate as metabolic biomarker, it is
important to realize that by changing the separation chemistry, the SI-CE systems will be
directly applicable to the analysis of different analytes, showing the flexibility of the
presented approach. In comparison to chromatographic techniques where typically off-line
sample pre-treatment is required and separations are slow, the advantages of speed,
automation and low sample consumption of the presented systems should be recognised by
the biotechnologist community. The developed systems provide a promising new platform for

201
near real-time monitoring of chemical changes in a diverse range of adhesion and suspension
cultures, potentially providing a practical way meet the future demands in process monitoring
in the biopharmaceutical industry and in pharmacological and biotechnological studies.
5.1 Future directions
Further research and development is required before the developed platforms can be used by
a non-expert in a routine setting. Further advances are particularly needed in the areas of
integration and ease of use, increase in throughput and expansion of analyte set:
1. Integration and ease of use.
The presented systems are predominantly assembled using Custom off the Shelf
(COTS) parts, including commercially available tubing, valves, fittings and
capillaries. Whilst adequate for proof of principle experiments, integration and
consolidation of fluidic functionalities onto a single platform would reduce the
complexity of the system, and reduce dead volume as discussed below. An obvious
staring point would be to use the inlet of the H-filter for the cell density measurement,
eliminating one of the microfluidic units. Recent advances in out laboratory have
demonstrated the potential of computer controlled Takasago RP-Q1 peristaltic pumps
for both pumping and valving, potentially eliminating the need of the use of the 6 and
7 port valves.
The separation conditions developed for the CE analysis of glucose requires its
deprotonation and hence required the use of BGE systems with pH>12. Fused silica
capillaries were found to be unstable at this pH, but the PMMA capillaries also
required replacement every 24 hr. The use of a less corrosive BGE would improve the
lifetime of the coating and potentially avoid the need to replace the capillary. To
provide the glucose with a charge required for its electrophoretic separation,

202
negatively charged boronate- complexes could be used in combination with a borate
buffer1.
2. Increasing throughput
For most bioprocess monitoring, a 12 minute time interval between analyses, or 1 hr
between two data points from the same reactor when 5 parallel cultures are monitored,
is sufficient for most biological and pharmacological applications. When a higher
throughput is required based on more stringent time requirements, for example for
studying quickly acting drugs, or for monitoring more than five cultures in parallel,
changes to the hardware will be required. Increasing the turn around rate to minutes
and below will require a reduction of dead volume and increase in analysis time,
which could be achieved by integration of all elements required for analysis onto a
microfluidic device. To avoid the use of external pumps and valves, pneumatically
actuated “lifting gate” microvalves and pumps as developed by Kim et al. could be
included to enable high-efficiency integrated pumping operations 2,3.
For pharmacological studies, integration of a chip-based SI-CE system with
microfluidic microbioreactors4 would provide the ultimate screening platform with
response times in seconds. The Kennedy group has already demonstrated online
electrophoretic immunoassays to study hormone excretion from isolates Islets of
Langerhans using perfusate5,6,7,8. A similar approach could be applied without much
difficulty for SI-CE of adhesion cultures, and could be used in combination with a H-
filter or using inertial flow systems for suspension cultures.
3. Expansion of analyte set
Culturing media contains a complex mixture of small and macromolecules that can be
anionic, cationic or neutral. In combination with the limited peak capacity especially
when moving from long fused silica capillaries to separation channels on microchips,

203
it will not be feasible to separate all analytes of interest using a single separation
system. By replacing the T-piece connecting the separation capillary and waste with a
cross piece, Gaudry et al., demonstrated the simultaneous analysis of anions and
cations in individual capillaries by SI-CE9. Taking advantage of enhanced fluidic
control on microfluidic devices, a novel hydrodynamic “split injection” was
developed on a PMMA device exploiting laminar flow to use individualized
separation chemistries for the cation and anion separation10. Three cations and three
anions were separated simultaneously and a series of 100 sequential injections has
given excellent reproducibility requiring only 70.5 seconds per analysis. For
bioprocess monitoring, the capillary systems presented in this thesis could be
expanded for simultaneous cation and anion analysis by replacing the T-piece with a
cross piece. Recognising optimizing the separation chemistry for a sample as complex
as media for both cation and anion separations will be a challenge, this would allow a
significant increase in the number of analytes that can be investigated without
increasing the sample consumption. Some more complex fluidic control and one or
more crosses would allow the injection from the same sample flow into separation
chemistries dedicated to peptide or protein separations, or maybe include a micellar
system for the analysis of neutrals. Using this approach, the minimal increase in
sample consumption would simplify the BGE selection process for each individual
separation. Practically, the fluidic complexity of outscaling will be easier to manage
on a microfluidic platform using external pumps and/or pneumatically controlled
pumps and valves.

204
5.2 Reference
1. Kubo, T.; Kanemori, K.; Kusumoto, R.; Kawai, T.; Sueyoshi, K.; Naito, T.; Otsuka,
K., Simple and Effective Label-Free Capillary Electrophoretic Analysis of Sugars by
Complexation Using Quinoline Boronic Acids. Analytical Chemistry 2015.
2. Kim, J.; Kang, M.; Jensen, E. C.; Mathies, R. A., Lifting gate polydimethylsiloxane
microvalves and pumps for microfluidic control. Analytical Chemistry 2012, 84 (4), 2067-
2071.
3. Kim, J.; Jensen, E. C.; Stockton, A. M.; Mathies, R. A., Universal microfluidic
automaton for autonomous sample processing: application to the Mars organic analyzer.
Analytical Chemistry 2013, 85 (16), 7682-7688.
4. van Leeuwen, M.; Krommenhoek, E. E.; Heijnen, J. J.; Gardeniers, H.; van der
Wielen, L. A.; van Gulik, W. M., Aerobic batch cultivation in micro bioreactor with
integrated electrochemical sensor array. Biotechnology Progress 2010, 26 (1), 293-300.
5. Roper, M. G.; Shackman, J. G.; Dahlgren, G. M.; Kennedy, R. T., Microfluidic chip
for continuous monitoring of hormone secretion from live cells using an electrophoresis-
based immunoassay. Analytical Chemistry 2003, 75 (18), 4711-4717.
6. Shackman, J. G.; Dahlgren, G. M.; Peters, J. L.; Kennedy, R. T., Perfusion and
chemical monitoring of living cells on a microfluidic chip. Lab on a Chip 2005, 5 (1), 56-63.

205
7. Dishinger, J. F.; Kennedy, R. T., Serial immunoassays in parallel on a microfluidic
chip for monitoring hormone secretion from living cells. Analytical Chemistry 2007, 79 (3),
947-954.
8. Dishinger, J. F.; Reid, K. R.; Kennedy, R. T., Quantitative monitoring of insulin
secretion from single islets of Langerhans in parallel on a microfluidic chip. Analytical
Chemistry 2009, 81 (8), 3119-3127.
9. Gaudry, A. J.; Guijt, R. M.; Macka, M.; Hutchinson, J. P.; Johns, C.; Hilder, E. F.;
Dicinoski, G. W.; Nesterenko, P. N.; Haddad, P. R.; Breadmore, M. C., On-line simultaneous
and rapid separation of anions and cations from a single sample using dual-capillary
sequential injection-capillary electrophoresis. Analytica Chimica Acta 2013, 781, 80-87.
10. Gaudry, A. J.; Nai, Y. H.; Guijt, R. M.; Breadmore, M. C., Polymeric microchip for
the simultaneous determination of anions and cations by hydrodynamic injection using a
dual-channel sequential injection microchip electrophoresis system. Analytical Chemistry
2014, 86 (7), 3380-3388.