biomonitoring of possible human exposure to environmental genotoxic chemicals: lessons from a study...
TRANSCRIPT

Environmental and Molecular Mutagenesis 30:97–111 (1997)
Research Articles
Biomonitoring of Possible Human Exposure toEnvironmental Genotoxic Chemicals: Lessons From aStudy Following the Wreck of the Oil Tanker Braer
Jane Cole,1 David M. Beare,1 Alastair P.W. Waugh,1 Emily Capulas,1
Kay E. Aldridge,1 Colin F. Arlett,1 Michael H.L. Green,1* Jacqueline E. Crum,2
Derek Cox,2 R. Colin Garner,3 Karen H. Dingley,3 Elizabeth A. Martin,4
Karen Podmore,4 Robert Heydon,4 and Peter B. Farmer4
1MRC Cell Mutation Unit, University of Sussex, Falmer, Brighton,East Sussex, United Kingdom
2Shetland Health Board, Brevik House, Lerwick, Shetland, United Kingdom3Jack Birch Unit for Environmental Carcinogenesis, Department of Biology,
University of York, Heslington, York, United Kingdom4MRC Toxicology Unit, Hodgkin Building, University of Leicester, Lancaster Road,
Leicester, United Kingdom
In January 1993 the oil tanker Braer ran aground be coded, (ii) clearly defined and proven protocolsin the Shetland Islands, Scotland. Approximately should be used, (iii) irreplaceable samples should80,000 tons of crude oil were released. Exception- not be used for method development, (iv) should aally high winds caused extensive pollution and ex- problem become apparent during the study, workposure of the local population to crude oil. We de- on such samples should cease immediately until thescribe the study which was immediately set in place problem is solved, (v) all critical experimental com-to examine the exposed population for evidence of ponents should be pretested against a laboratorygenotoxic exposure. Blood samples were taken and standard. (4) The study design should include repli-primary DNA damage was measured in the mono- cate experiments to monitor experimental variabilitynuclear cell fraction by the butanol modification of and reproducibility, as well as internal standardsthe 32P-postlabelling method. Mutation was mea- and cryopreserved ‘‘in house’’ samples. Care mustsured at the hprt locus in T lymphocytes. No evi- be taken that samples from any one exposure groupdence of genotoxicity was obtained for either end are spread between a number of independent ex-point, but nevertheless, we believe that useful les- periments and that each experiment includes sam-sons were learnt, which should be incorporated into ples from a number of exposure groups. (5) A com-the design of future studies: (1) A rapid response is puterised data base should be maintained with fullessential, and even if sufficient funds are not imme- details of experimental variables, donor attributes,diately available, it is still worth attempting to obtain and raw data so that any contribution of experimen-samples quickly and use cryopreservation, also to tal artefacts to ‘‘outlier’’ results can be monitored.attempt to estimate exposure. (2) Adequate num- (6) Because of the nature of the statistical variationbers of volunteers must be sought, together with for many environmental genotoxicity end points,enough controls, not just to allow meaningful analy- only a large-scale study is likely to be capable ofsis but to overcome loss of samples and failure of yielding useful information. Environ. Mol. Mutagen.things to go according to plan. (3) Points concern- 30:97–111, 1997. q 1997 Wiley-Liss, Inc.ing laboratory practice include: (i) samples should
Key words: population monitoring; 32P-postlabelling; hprt mutation; Braer wreck; environmentalgenotoxicity
Contract grant sponsor: European Communities; Contract grant number:INTRODUCTIONEV5V-CT91-0013; Contract grant sponsor: Scottish Home Office and
The Braer Incident Health Department; Contract grant sponsor: BAT Co. Ltd.
*Correspondence to: Prof. M.H.L. Green, MRC Cell Mutation Unit,On 5 January 1993, the oil tanker Braer ran agroundUniversity of Sussex, Falmer, Brighton, BN1 9RR, E. Sussex, UK;in heavy seas and gale force winds at Garths Ness nearE-mail: [email protected] Head at the southern end of the ShetlandReceived 28 August 1996; revised and accepted 17 January 1997.Islands, Scotland. The crew were rescued, but despite a
q 1997 Wiley-Liss, Inc.
492 8I17/ 8I17$$0492 09-03-97 11:12:50 wlemal W Liss: EM

98 Cole et al.
major effort, the tanker broke up in the next few days, genetic damage or gene mutations, which might act assurrogates for processes leading to an increased risk ofreleasing more than 80,000 tons of light crude oil into
the sea. In addition to coastal pollution, atmospheric pol- cancer or heritable disease. Several systems have beeninvestigated for monitoring mutations in circulatinglution in the form of both oil vapour and droplets of oil/
seawater emulsion was blown over populated areas up to blood-derived cells [reviewed in Cole and Skopek, 1994].In the Sussex laboratory we have had considerable experi-3 miles from the wreck in the following 10 days by an
exceptionally long period of high winds, resulting in con- ence over the past 12 years with one such system, whichassays mutations at the X-linked hypoxanthine-guaninesiderable pollution of the land. As a result, crops over 15
square miles were condemned and sheep were required phosphoribosyl transferase (hprt) locus in T lymphocytes[Henderson et al., 1986; Cole et al., 1988]. We and othersto be moved out of the area or be kept indoors.
As part of the European Communities Biomonitoring have investigated the potential of this surrogate gene forassessing mutagenic damage in individuals with inheritedprogramme (STEP), a collaborative group led by one of
us (P.F.) was at that time concerned with investigating defects in DNA repair [Cole et al., 1992; Cole and Arlett,1994], the effects of chemotherapy and radiation treat-the effects of airborne pollution, in particular with the
effects of genotoxicants present in the environment as a ment of patients [Sala-Trepat et al., 1990; van Dam et al.,1991], and population monitoring following workplaceresult of petrochemical processing or combustion. Contact
was made with the Shetlands Director of Public Health [Tates et al., 1995] or environmental [Cole et al., 1996]exposure to mutagens.(D.C.) within a short time of the accident, and in this
paper we describe our aims in responding to the emer- In order to assess any potential hazards to human healthas a result of the type of air pollution suffered by thegency, the results of our study (which suggest no evidence
of genotoxicity), and raise some points which we feel islanders during the Braer incident, we proposed thatblood samples should be obtained from people in theare of general relevance to population monitoring and
particularly to an emergency situation. heavily contaminated area. Both primary damage (adductformation) and secondary damage (mutation) would bedetermined. Samples were to be taken during the criticalBiomonitoring Methodsperiod after the accident to determine the extent of anyprimary damage (adduct formation) and to establish base-Biomonitoring procedures for human populations ex-
posed to potential genotoxic pollutants have been under line mutant frequency in lymphocytes at the hprt locus.It was suggested that this should be followed up by repeatdevelopment for many years [reviewed in Jolles and Cor-
dier, 1989; Mendelsohn and Albertini, 1990; Gledhill and sampling 2–3 months later (when induced mutants at thehprt locus would be expected to be expressed) and againMauro, 1991; Garner et al., 1991]. Broadly, the aims of
such studies have been twofold: The first objective of about 1 year later, which would enable any changes inboth end points to be monitored. With notable cooperationmonitoring has been the development of methods to detect
the primary damage, e.g., adducts on DNA or protein. A from the Shetlands medical community, the Medical Re-search Council, and especially the islanders themselves,variety of covalently bound adducts are formed with cel-
lular nucleophilic molecules, and the quantitative mea- blood samples from 26 volunteers in the polluted areawere received in January 1993 within about 10 days of thesurement of these adducts may be used as a monitor of
exposure to these carcinogens. The analytical methods tanker going aground; repeat samples were given about 10weeks later, and finally samples were taken at the end ofrequired to detect the adducts need to be of exceptional
sensitivity and include 32P-postlabelling, immunoassay, 1993. In addition, samples were obtained from a numberof age-matched, nonexposed control volunteers who livedand physicochemical techniques (e.g., mass spectrometry
or fluorescence measurements). 32P-postlabelling is the about 40 miles (72 km) due north of Sumborough Head.At each sampling time, mononuclear cells (MNCs) werepreferred method to use on several grounds: (1) It is cur-
rently the most sensitive widely available method for de- separated from the whole blood and cryopreserved forlater use at the Cell Mutation Unit, Sussex, where hprttecting DNA adducts; one carcinogen-modified DNA nu-
cleotide can be detected per 1010 unmodified nucleotides. mutant frequency was determined on samples from eachof the three collection times. At the time of sampling, 5(2) It detects a wide variety of DNA adducts, depending
on the chromatographic conditions applied. (3) Very ml whole fresh blood from the first and second samplingtimes was sent to the Toxicology Unit, Leicester, for po-small amounts of DNA can be used; typically, less than
4 mg can be analysed. Postlabelling has been used in tential use in haemoglobin adduct determination, in addi-tion to cryopreserved MNCs (3 to 4 1 106 cells per sam-the past to detect a variety of adducts in human tissues
[reviewed in Beach and Gupta, 1992], including, e.g., ple) from the first and third sampling times for the 32P-postlabelling assay. In the event, haemoglobin adductaromatic DNA adducts in white blood cells of foundry
workers [Phillips et al., 1988]. The second objective of determination was not undertaken since currently avail-able techniques require prior knowledge of the chemicalpopulation monitoring has been to determine the fre-
quency of damage-induced genetic events, such as cyto- structure of the adduct to be measured. In the present
492 8I17/ 8I17$$0492 09-03-97 11:12:50 wlemal W Liss: EM
Biomonitoring Following the Wreck of the Braer 99
(BPDE)-treated calf thymus DNA was a gift from R. Waters (Universitystudy, if the DNA postlabelling results had proved indica-of Wales, Swansea, UK).tive of the presence of aromatic hydrocarbon adducts, the
PEI-cellulose thin-layer chromatography (TLC) plates were suppliedhaemoglobin would have been analysed for such adducts. by Merck and used for one-dimensional separations; (20 cm2) plastic-The protein would have been subjected to mild hydrolysis backed PEI-cellulose TLC plates (10 1 20 cm; Macherey Nagel; Cam-
lab, Cambridge, UK) were used for two-dimensional separations. Theseand the released hydrocarbon diols detected by gas chro-latter proved unsatisfactory, as described below. OMAT-AR film wasmatography-mass spectroscopy [Melikian et al., 1996].from Kodak (Cambridge, UK).The planning and execution of this pilot study of moni-
toring a population accidentally exposed to potentiallyDNA Isolation and 32P-Postlabelling of Putativehazardous air pollution have given us valuable insightsAdductsinto how best to respond to such emergencies in the fu-
ture. DNA was isolated from cells using phenol extraction [Gupta, 1984].This involved digestion with RNaseA (25 mg/ml, 10 ml) for 10 min atroom temperature and proteinase K (500 mg/ml) overnight, followed by
MATERIALS AND METHODS phenol:chloroform extraction and precipitation of DNA in propanol. Inpreliminary experiments, extraction with pronase E and RNaseA [Ken-Blood Samples dall et al., 1991] was used, followed by precipitation of DNA in ethanol.DNA concentrations were determined spectrophotometrically and DNAAt each sampling time, 50 ml whole heparinised coded blood waswas stored at 0807C until required.obtained with informed consent from declared nonsmoking males aged
Each postlabelling experiment incorporated a BPDE-treated and calf-30–49 years (mean 41 { 6). The first samples from 26 people fromthymus DNA (ct-DNA) sample as positive and negative controls. Fivethe polluted region were obtained from 15 January 1993 to 18 Januarymicrograms of DNA were enzymatically digested to deoxyribonucleo-1993; the second set of 25 exposed samples were obtained from 23side-3*-monophosphates as follows: to an aqueous solution of DNA (1March 1993 to 31 March 1993, with two exceptions which were receivedmg/ml) were added 1.0 ml of 100 mM sodium succinate / 50 mMon 27 April 1993; and the final samples from 22 of the exposed groupcalcium chloride pH 6 (SSCC), 2.4 mU calf spleen phosphodiesterasewere received between 30 November 1993 and 16 December 1993.(CSPD), 0.35 U micrococcal nuclease (MN), and H2O to a final volumeBlood from nonexposed controls was taken at about the same threeof 10 ml and the mixture incubated at 377C for 2 hr. This was followedtimes (January 1993, seven samples; March 1993, nine samples; earlyby a second addition of the digestion components (0.5 ml SSCC, 2.4January 1994, five samples). Samples were flown to the Cell MutationmU CSPD, 0.35 U MN, and H2O) to a final volume of 15 ml and theUnit, Sussex, where they were processed within about 24 hr of beingmixture incubated for a further 4 hr.taken, a considerable feat on most occasions due to gale force winds
A proportion of the DNA (1.2 1 1003 mg) was retained for 32P-which delayed the flights. Samples were Ficoll-separated immediatelypostlabelling of total (or ‘‘normal’’) nucleotides using 20 mCi of [g-on arrival and the MNC fraction cryopreserved by standard methods32P]ATP (ú5,000 Ci/mmol, 10 mCi/ml) and a 4:1 v/v mixture (2.5 ml)[Cole et al., 1988] until required. As part of the Commission of theof labelling buffer:T4 polynucleotide kinase (PNK) (5 U, 3*-phosphataseEuropean Communities (CEC) programme, samples were also obtainedfree) in a total volume of 20 ml. (Labelling buffer contained 200 mMin February 1993 by two of us (R.C.G., K.H.D.) from 12 people (meanTris-HCl, 100 mM MgCl2 , 100 mM dithiothreitol, 10 mM spermidine,age 43 years { 12) in a rural area of Yorkshire, England, not subjectpH 7.5.) Ten microlitres of the labelled digest were then treated withto urban air pollution [Farmer et al., 1996]. Mutant frequency experi-potato apyrase (80 mU, incubation at 377C for 30 min). Both the apyrase-ments were undertaken on these samples over the same time period astreated and untreated normal nucleotide digests were then diluted withthe Shetlands samples, in addition to local (Sussex, England) samples10 mM Tris-HCl / 5 mM EDTA, pH 9.5, to a volume of 100 ml. A 2from normal healthy adults who acted as internal reference controls forml aliquot of this was then applied to a plastic-backed 20 cm2 PEI-our experiments. A questionnaire was completed by the donors (undercellulose TLC plate and developed in one dimension in 0.12 M sodiuman anonymous code number) at the time the samples were taken, withphosphate, pH 6.8.details of residence and work history, lifetime smoking habit, and alco-
The remaining DNA was subjected to adduct enhancement by butan-hol consumption.1-ol extraction [Gupta, 1985]. This procedure is particularly applicableto bulky lipophilic adducts. In some experiments, digestion withnuclease P1 [Reddy and Randerath, 1986] was compared with butan-1-32P-Postlabelling Experimentsol extraction. Where only one procedure could be used, due to smallamounts of DNA, the butan-1-ol method was applied. Adducted nucleo-MNC samples received from Sussex were coded, and the extractiontides were radiolabelled by 5*-phosphorylation using 80 mCi [g-32P]ATPof the DNA and subsequent 32P-postlabelling studies at Leicester wereand the same 4:1 v/v mixture of labelling buffer:T4 PNK as above inundertaken blind.a final volume of 20 ml. The efficiency of the enhancement techniqueswas assessed by comparing an aliquot of the 32P-labelled nuclease P1Materialsor butan-1-ol digests with that of 32P-labelled normal nucleotide digest.One microlitre of the enriched digests was diluted in 10.5 ml of 10 mMDeoxyribonucleic acid from calf thymus, tetrabutyl ammonium chlo-
ride, nuclease P1, micrococcal nuclease, dithiothreitol, spermidine (mo- Tris-HCl / 5 mM EDTA, pH 9.5. A 2 ml aliquot of this was examinedby TLC under the same conditions as for normal nucleotides describedlecular biology grades), potato apyrase (Sigma grade VI), magnesium
chloride hexahydrate (ACS grade), sarkosyl (N-lauroylsarcosine, so- above.To visualise any DNA adducts, the remaining 32P-labelled adductdium salt), and sodium dodecyl sulphate (SDS) were obtained from
Sigma (Poole, UK). All other chemicals were of the highest quality and samples were applied to a 10 1 20 cm plastic-backed PEI-celluloseTLC plate as described by Gupta [1985]. The plates were developed inpurchased from Fisons (Fisher Scientific, Loughborough, UK) or BDH
(Merck, Lutterworth, UK). T4 polynucleotide kinase and calf spleen D1 (1.7 M sodium phosphate, pH 6) and then washed in 20% of 0.5 Mammonium formate, pH 3.5, and water. The adducts were separated inphosphodiesterase were obtained from Boehringer Mannheim (Lewes,
UK). [g-32P]ATP and intensifying screens were obtained from Amer- two dimensions by development in D3 (4.0 M lithium formate, 8.5 Murea, pH 3.2) and D4 (0.8 M lithium chloride, 8.5 M urea, 0.5 M Tris-sham International (Aylesbury, UK). Benzo[a]pyrene-anti-diolepoxide
(7b,8a-dihydroxy-9a,10a-epoxy-7,8,9,10-tetrahydrobenzo[a]pyrene) HCl, pH 9.0) (R. Morse, personal communication). Finally, the plates
492 8I17/ 8I17$$0492 09-03-97 11:12:50 wlemal W Liss: EM

100 Cole et al.
were developed in D5 (D1). DNA adduct patterns were visualised by speculated that the phenol DNA extraction methodautoradiography at 0807C for between 1 and 72 hr. Each individual [Gupta, 1984] can induce artefactual oxidative damagespot and a ‘‘diagonal radioactive zone’’ (DRZ) were excised, and radio-
[Claycamp, 1992], initially the pronase E extractionactivity was quantified by scintillation counting. Where no adduct spotsmethod [Kendall et al., 1991] was used. The yields ofcould be visualised, the DRZ was cut out and counted. Because the
assay was not standardised, adduct yields were expressed as relative DNA obtained with the pronase E method were very low,adduct labelling (RAL). and the DNA extracted was sufficient for one postla-
belling experiment only. Consequently, DNA from theremaining samples was extracted using the phenol proce-Mutant Frequency Experimentsdure, which gives higher yields of DNA despite the draw-
Experimental procedures for hprt mutant frequency determinations back mentioned above. Because of the difficulty in ob-have been described in detail in Cole et al. [1988]. Briefly, for each taining enough DNA for measurements of both oxidativemutant frequency determination, the cryopreserved MNCs were thawed
and bulky damage, it was decided to utilise the DNArapidly and cultured overnight in HEPES buffered RPMI 1640 mediumsamples only for measuring bulky adducts. All DNA sam-(Dutch modification; GIBCO BRL, Paisley, UK) supplemented with
10% human AB serum (supplied by the Regional Blood Transfusion ples were examined using the butan-1-ol extractionService), 100 U/ml penicillin, 100 mg/ml streptomycin, and 2 mM L- method to enrich the adducts. Nuclease P1 enhancementglutamine (GIBCO BRL). The cell density was then estimated using a was also used in some experiments so that a comparisonhaemocytometer, and the cells cloned in 96-well microtitre plates (Nunc,
could be made of the two enrichment techniques.Roskilde, Denmark) in medium supplemented in addition with 0.5%The DNA adduct pattern obtained for the positive con-phytohaemagglutinin (HA15; Murex Diagnostics Ltd.), 100 U/ml re-
combinant interleukin-2 (Cetus, Norwalk, CT), and irradiated (40 Gy) trol, BPDE-treated ct-DNA, using both butan-1-ol extrac-hprt0 lymphoblastoid feeder cells (GM1899A) at 104 cells per well. For tion and the nuclease P1 enhancement method, was ofthe determination of hprt mutant frequency, 2 1 104 target cells were two clearly separated spots (Fig. 1, autoradiographs 1plated per well, and the selective agent 6-thioguanine (6TG) at 5 1
and 2). By studying the autoradiograph produced by this1006 M was added to the medium. In nonselective medium, three cellssample, it could be ascertained if each experiment workedper well were plated. Plates were scored for negative wells after 14–
17 days’ incubation and plating efficiency in the presence and absence correctly. The negative control in each experiment wasof selection calculated from the zero term of the Poisson distribution. ct-DNA (Fig. 1, autoradiograph 3). Theoretically thereWhenever possible, two or more experiments were undertaken on each should be no adducts present in this sample; therefore, ifblood sample.
radioactive spots were observed, it could be concludedthat they were artefacts of the experiment, possibly test-
Statistical Analysis of the Data tube spots. The radioactivity in the DRZ of the ct-DNAsamples was determined, and these values were used toThe statistical package GLIM was used (generalised linear interactivecorrect the values obtained in the lymphocyte DNA sam-modelling; NAG, Oxford, UK) [Payne et al., 1986]. Statistical methodsples.for analysis of the hprt assay have been described in detail [Cole et al.,
1988; Robinson et al., 1994]. In the latter paper, we used a substantial Unfortunately, the quality of the TLC plates used ininternational data set to analyse in detail the sources of variation in these experiments was very poor. For technical reasons,mutant frequency estimations and demonstrated that cloning efficiency, the manufacturing procedure for the plates had changed,smoking habit, and donor age may be confounding factors that should
and this resulted in plates giving poorer separation ofbe taken into consideration in data interpretation. For analysis of Shet-adducts and in high background radioactivity being pres-land Island data, the mean log mutant frequency was obtained from all
assays performed on a given sample. In our existing data base, in many ent. Other laboratories experienced similar difficulties atcases we have data on multiple samples from the same donor. In such this time (R. Waters, personal communication). In thecases, the mean mutant frequency was first obtained for assays on the York laboratory, the poor quality of the Machevery Nagelsame sample, then the mean for different samples from the same donor.
plates at the time that the Shetland studies were in prog-In analysis of postlabelling data, log (counts / 1) was used. Eachress at Leicester led to a switch to J.T. Baker (Phil-determination was treated separately, allowing us to compare variation
between assays on the same donor with variation between donors. lipsburg, NJ) plates, which in turn meant that alterationsin the chromatographic conditions were necessary. Be-
RESULTS cause the level of adducts we would expect to detect inthese samples was low, the correction for interexperimen-32P-Postlabelling Experimentstal differences became vital. However, these differenceswere not such a problem where the level of adducts wasDNA adduct formation was analysed in the MNC frac-
tion obtained from blood samples from 20 exposed and high; e.g., the BPDE-positive control gave RAL valuesof 12.35 1 1006, 19.79 1 1006, 27.74 1 1006, 17.49 1seven nonexposed individuals immediately after the acci-
dent and from samples from 20 exposed and four nonex- 1006, 18.56 1 1006, 15.18 1 1006, and 10.93 1 1006 inseven separate determinations. There was no correlationposed individuals obtained 1 year later. Initially it was
intended that the DNA extracted from the Shetland island- between these values and the calf thymus control back-ground in the same experiment.ers’ MNC fraction would be analysed by 32P-postlabelling
for both bulky, polycyclic aromatic hydrocarbon DNA Following postlabelling of the MNC DNA, adductsvisualised by autoradiography could be detected usingadducts and oxidative DNA adducts. Since it has been
492 8I17/ 8I17$$0492 09-03-97 11:12:50 wlemal W Liss: EM

Biomonitoring Following the Wreck of the Braer 101
Fig. 1. Autoradiographs of PEI-cellulose TLC maps of 32P-labelled unexposed individual, taken immediately (4); exposed individual, takendigests of DNA from benzo(a)pyrene and untreated standards and human immediately (5); unexposed individual, 1 year later (6); and exposedlymphocytes. Autoradiograph 1: Benzo(a)pyrene-treated calf thymus individual, 1 year later (7). Autoradiography was for 1 hr at roomDNA, butanol-extracted. Autoradiograph 2: Benzo(a)pyrene-treated calf temperature (autoradiographs 1 and 2), 6.5 hr at 0807C (3 and 4), andthymus DNA, nuclease P1-digested. Autoradiograph 3: Untreated calf- 18 hr at 0807C (5–7). The origins of the TLC plates, at the lower leftthymus DNA. Autoradiographs 4–7: Human lymphocyte DNA from hand corner, were excised before autoradiography.
both butan-1-ol (Fig. 1, autoradiographs 4–7) and variance ratioÅ 12.94, Põ 0.001). The differences couldbe fully accounted for by a correlation between high con-nuclease P1 enrichment. Radioactivity was mostly de-
tected in the DRZ, and discrete spots could also be visuali- trol background and high sample counts (estimated at anincrease of 1 1.495 in sample count per doubling ofsed inside this zone. When the two adduct enhancement
methods were used, the butan-1-ol procedure gave more control background, t Å 5.10, P õ 0.001). When thiswas allowed for, no evidence of significant differencesadducts for the MNC DNA. Significantly higher counts
were obtained for butan-1-ol-extracted BPDE-positive between donors, between exposed and nonexposed indi-viduals, or between times of sampling were observed.controls (butan-1-ol 1 4.12 higher, 2 d.f., t Å 14.3, P õ
0.01). No significant difference was observed for the calfthymus controls (butan-1-ol 1 0.84, 4 d.f., t Å 0.44, n.s.).Butan-1-ol-extracted test material gave significantly Hprt Mutant Frequency Experimentshigher values (butan-1-ol 1 1.81 higher, 37 d.f., t Å 3.87,P õ 0.001). Detailed results of the mutant frequency determinations
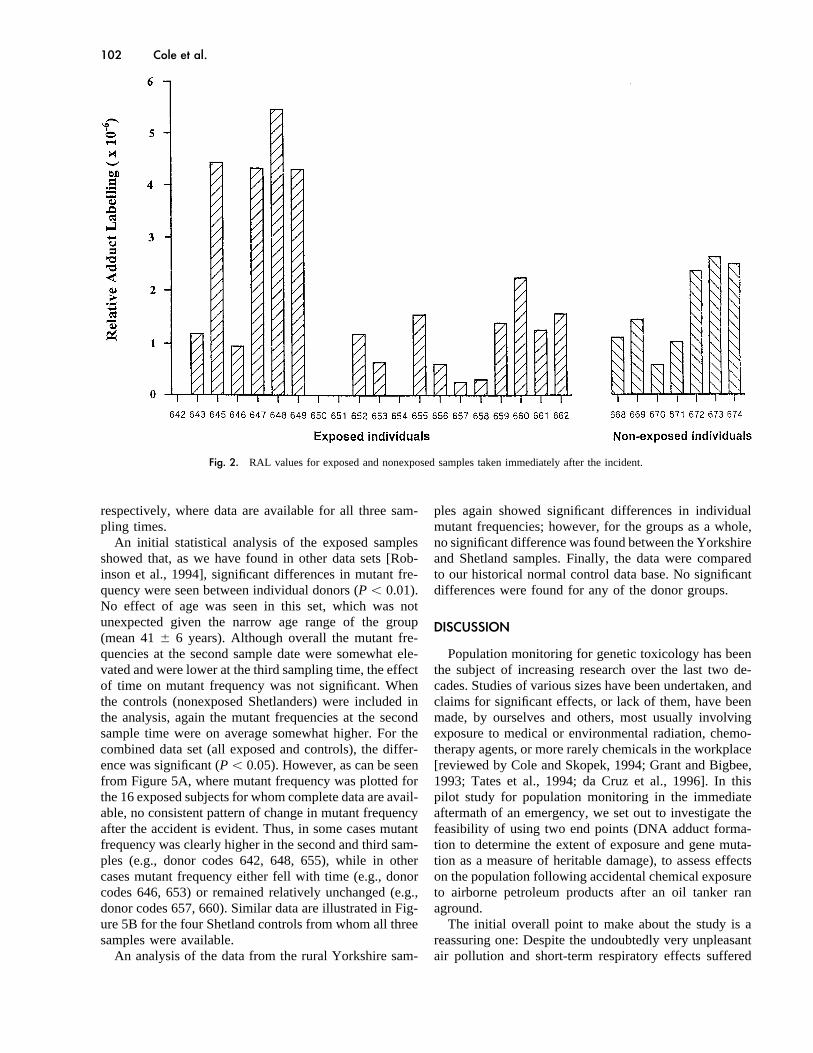
for the Shetlands samples are given in Table Ia (exposedRAL values of DNA adducts (butan-1-ol extraction)detected for each sample, collected immediately after the donors) and Ib (control donors). For comparative pur-
poses, Table II lists the mutant frequencies for the concur-wreck (0 to 5.44 1 1006) and 1 year later (0.15–7.11)are shown in Figures 2 and 3, respectively. Figure 4 shows rent nonexposed control donors from the Yorkshire area
in England. Wherever possible, two or more experimentsthe averages of these samples. If the negative controlcalf thymus RAL values were deducted from the above were undertaken on each sample. Inevitably, data are not
available for all volunteers at all sampling times. Thefigures, the RAL values for samples collected immedi-ately after the disaster were reduced to 0 to 3.08 1 1006 most serious omission, for five exposed subjects at the
first sample time, was the result of the extreme weatheradducts/108 and 1 year later the value was reduced to 0to 3.35 1 1006. conditions which delayed the arrival of the samples at
Sussex and made successful MNC separation impossible.Statistical analysis was performed on log-transformedcounts without precorrection for control background. Sev- In addition, a number of volunteers were not available
for the second or third samples. Figure 5A, B illustrateseral samples were assayed in each experiment, and therewere highly significant differences between sample the change in mutant frequency for the 16 people in the
contaminated region and for four from the control area,counts in the different experiments (n1 Å 8, n2 Å 57,
492 8I17/ 8I17$$0492 09-03-97 11:12:50 wlemal W Liss: EM
102 Cole et al.
Fig. 2. RAL values for exposed and nonexposed samples taken immediately after the incident.
respectively, where data are available for all three sam- ples again showed significant differences in individualmutant frequencies; however, for the groups as a whole,pling times.
An initial statistical analysis of the exposed samples no significant difference was found between the Yorkshireand Shetland samples. Finally, the data were comparedshowed that, as we have found in other data sets [Rob-
inson et al., 1994], significant differences in mutant fre- to our historical normal control data base. No significantdifferences were found for any of the donor groups.quency were seen between individual donors (P õ 0.01).
No effect of age was seen in this set, which was notunexpected given the narrow age range of the group DISCUSSION(mean 41 { 6 years). Although overall the mutant fre-quencies at the second sample date were somewhat ele- Population monitoring for genetic toxicology has been
the subject of increasing research over the last two de-vated and were lower at the third sampling time, the effectof time on mutant frequency was not significant. When cades. Studies of various sizes have been undertaken, and
claims for significant effects, or lack of them, have beenthe controls (nonexposed Shetlanders) were included inthe analysis, again the mutant frequencies at the second made, by ourselves and others, most usually involving
exposure to medical or environmental radiation, chemo-sample time were on average somewhat higher. For thecombined data set (all exposed and controls), the differ- therapy agents, or more rarely chemicals in the workplace
[reviewed by Cole and Skopek, 1994; Grant and Bigbee,ence was significant (P õ 0.05). However, as can be seenfrom Figure 5A, where mutant frequency was plotted for 1993; Tates et al., 1994; da Cruz et al., 1996]. In this
pilot study for population monitoring in the immediatethe 16 exposed subjects for whom complete data are avail-able, no consistent pattern of change in mutant frequency aftermath of an emergency, we set out to investigate the
feasibility of using two end points (DNA adduct forma-after the accident is evident. Thus, in some cases mutantfrequency was clearly higher in the second and third sam- tion to determine the extent of exposure and gene muta-
tion as a measure of heritable damage), to assess effectsples (e.g., donor codes 642, 648, 655), while in othercases mutant frequency either fell with time (e.g., donor on the population following accidental chemical exposure
to airborne petroleum products after an oil tanker rancodes 646, 653) or remained relatively unchanged (e.g.,donor codes 657, 660). Similar data are illustrated in Fig- aground.
The initial overall point to make about the study is aure 5B for the four Shetland controls from whom all threesamples were available. reassuring one: Despite the undoubtedly very unpleasant
air pollution and short-term respiratory effects sufferedAn analysis of the data from the rural Yorkshire sam-
492 8I17/ 8I17$$0492 09-03-97 11:12:50 wlemal W Liss: EM

Biomonitoring Following the Wreck of the Braer 103
Fig. 3. RAL values for exposed and nonexposed samples taken 1 year after the incident.
by the islanders at the time of the Braer accident, we tionnaires, issues of confidentiality concerning donoridentity and individual results, and overall experimentalhave found no clear evidence of either increased DNA
adduct formation in MNCs or raised mutant frequency in design.circulating T lymphocytes in blood samples from volun-teers in the contaminated region. Thus, despite consider- Study Designable variation in adduct estimates between donors, no
For all of the genetic toxicology end points that havesignificant differences were seen in the samples takenbeen assessed for monitoring people based on blood sam-from donors in the contaminated region compared to theples, wide interindividual variation has been found [Colecontrol set. Similarly, hprt mutant frequencies in the testand Skopek, 1994]. This is not surprising as there are sogroup were not significantly different from the Shetlandsmany potential sources of variation, including, e.g., donorcontrols at any time point or from samples from the York
area determined in the same experimental period or from age and gender, individual genetic background, lifetimecontrols in our historical data base. environment, work history, current life-style, diet, and
The second point to make is that our experience with health status. Most important is the stochastic nature ofthis study has highlighted several important issues for bio- mutation, which, when combined with clonal expansionmonitoring, covering such topics as sampling and study of particular blood cell lineages in individual donors,design, experimental methodology, and data analysis and means that one mutation event may give rise to one orinterpretation. These will be discussed in the context of many mutant cells, depending on when it arises. The usethe results we obtained. Finally, we will propose a number of detailed questionnaires for population monitoring cov-of recommendations which we feel should be carefully ering many of the potential confounders has been pro-considered when a response is made to an emergency, posed [Carrano and Natarajan, 1988], a modified versionmany of them obvious with hindsight but all of them rele- of which was used by the collaborators in our STEP proj-vant to any project concerned with population monitoring. ect [Farmer et al., 1996].
In the present study, we elected to reduce potentialIssues Concerning Study Design and Sample subject confounding factors by sampling a group of non-Collection smoking males in a narrow age range; each donor com-
pleted a simplified version of the questionnaire under aThis covers selection and size of the exposed popula-tion to be sampled, the choice of control group(s), ques- code number.
492 8I17/ 8I17$$0492 09-03-97 11:12:50 wlemal W Liss: EM

104 Cole et al.
plained to all participants. Samples should be coded andall details and results securely stored to maintain confi-dentiality; it is our policy to make the results of a studyas a whole available to the participants but not individualresults. Each experiment should include both exposed andunexposed control samples, and ideally the experimentsshould be performed blind by the laboratory worker; ifnecessary, the samples should be recoded by a differentperson from the one performing the analysis.
Timing of samples. For mutation studies, the impor-tance of collecting initial samples as soon as possibleafter an accident so that a baseline can be established isobvious. The timing of follow-up samples is more conten-tious, depending in part on the particular event beingmonitored. For blood, and probably for other tissues aswell, it is complicated by the kinetics of cell turnover
Fig. 4. Average RAL values for samples taken immediately after the [Cole and Skopek, 1994; Green et al., 1995]. The majorityincident and 1 year later.
of the studies on ‘‘induced mutation’’ have been basedon radiation exposure following the Japanese nuclearbombs 50 years ago or similarly highly toxic cancer radio-
Sample Collection and chemotherapy treatments of patients [reviewed inCole and Skopek, 1994]. In such cases, cell kill in theTissue to be sampled. Although blood has frequently
been the tissue of choice for population monitoring, other bone marrow and circulating lymphocytes (leading to lossof preexisting mutants) coupled with disturbance to stemmore biologically relevant tissues may be considered, e.g.,
oral scrapes or, in some circumstances, lung lavages and cell kinetics results in highly abnormal cell division ratesas the blood is repopulated, followed by potential clonalskin. For blood, ideally a 50–60 ml sample should be
sought as this would enable several different, complemen- expansion of induced or preexisting mutants. Such effectsare likely to distort the mutant frequency observed at thetary tests to be undertaken, covering the detection of both
primary and secondary damages. Thus, in addition to pro- time of sampling, no matter which blood cell lineage orend point is being investigated. Moreover, it is the fre-viding MNCs for analysis (e.g., 32P-postlabelling, hprt
mutant frequency in T cells, the non-Hodgkin’s quency of mutants in a given blood sample at one pointin time that is being estimated in population studies, notlymphoma-associated Bcl2 t(14:18) translocation fre-
quency in B cells [Cole et al., 1996], or standard cytoge- the more relevant rate at which new mutations are oc-curring [Cole and Skopek, 1994; Green et al., 1995].netic analysis), other studies could be undertaken. For
example, about 5 ml of whole blood would enable haemo- Thus, although studies following acute exposure are infor-mative to some extent, they do not necessarily reflect theglobin adduct assessment to be undertaken and would
provide erythrocytes for glycophorin A mutation detec- situation for the considerably less acute toxicity likelyfor most ‘‘environmental’’ exposures. Very little detailedtion in MN heterozygotes (about 50% of the population)
to be determined [Jensen et al., 1986]. Finally, serum or time course work has been achieved in this area, noneusing multiple time points and none on a sufficiently largeplasma could be stored under suitable conditions for fu-
ture use for additional analysis. Such multi-end point scale to have a 5% probability of detecting a 50% increasein mutant frequency, given the variability seen in humananalysis based on different blood cell lineages would en-
able valuable comparisons to be made between the differ- mutant frequency in blood cells [Robinson et al., 1994;also see below]. Thus, at present, it is not possible toent exposure indicators and genetic end points and per-
haps indicate mechanisms, as well as correlating primary answer important questions such as possible differentialeffects of direct-acting mutagens vs. those requiring meta-and secondary damages [Jensen et al., 1990; Langlois et
al., 1993; Grant and Bigbee, 1993]. bolic activation or the effect of complex mixtures of muta-gens and toxic chemicals on the induction, expression,For assays requiring cell culture, provision must be
made to ensure that the sample is in good condition since and persistence of new mutations in human blood cells.An ideal protocol for environmental monitoring mightdelays may be critical, as happened with five samples in
this study [see also Tates et al., 1994 for another exam- well be to obtain subsequent samples at 2–4 week inter-vals for 6 months after an accident, followed by lessple]; processing the MNCs should be undertaken as soon
as possible after the blood is taken and the cells cryopre- frequent samples for up to 3 years so that the appearance(and loss or stable occurrence) of an induced event couldserved.
Coding of samples. Informed consent should be ob- be monitored. However, this is obviously out of the ques-tion for human monitoring, and we elected for a com-tained after the objectives of the study have been ex-
492 8I17/ 8I17$$0492 09-03-97 11:12:50 wlemal W Liss: EM

Biomonitoring Following the Wreck of the Braer 105
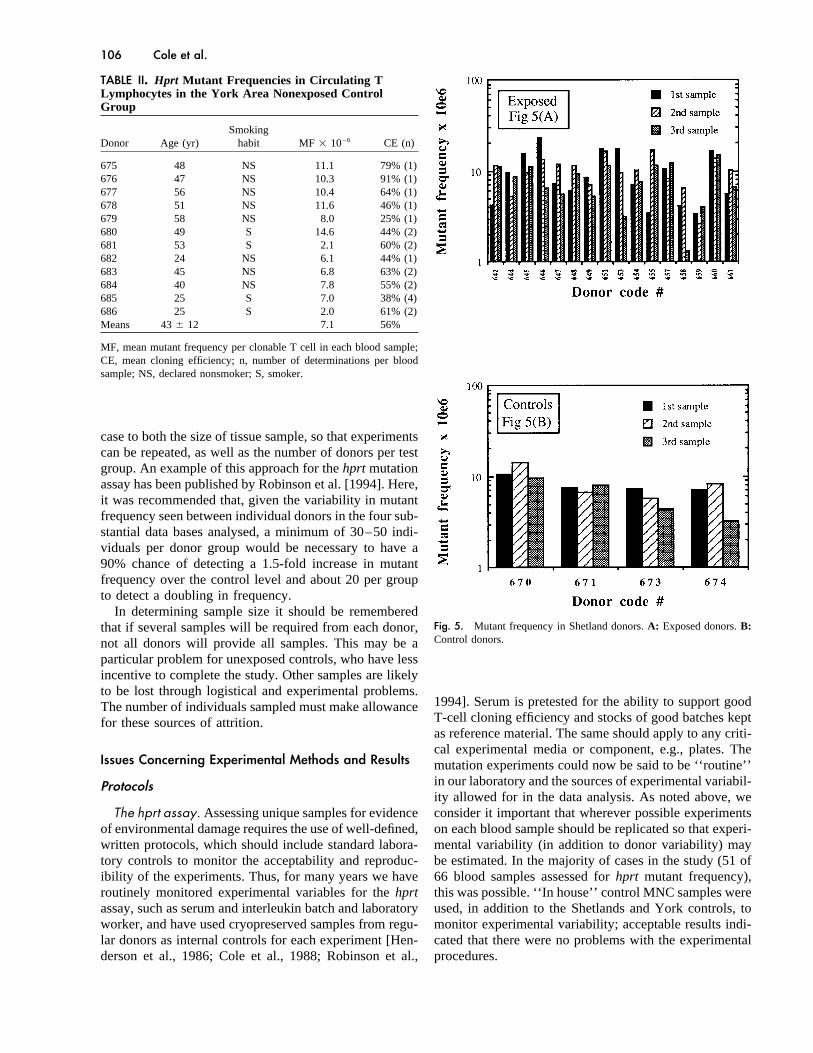
TABLE I. Hprt Mutant Frequencies in Circulating T Lymphocytes*(a) Shetland Island, Exposed Group
First sample (n) Second sample (n) Third sample (n)Subject Agecode (yr) MF 1 1006 CE MF 1 1006 CE MF 1 1006 CE
642 42 4.2 37% (2) 11.5 29% (2) 11.2 44% (2)643 49 11.7 60% (2) 13.9 37% (2) NAc NAc
644 45 9.6 17% (2) 5.3 22% (2) 8.8 44% (1)645 53 15.6 72% (1) 9.6 70% (2) 11.0 60% (2)646 34 22.8 62% (1) 13.2 23% (2) 6.5 50% (3)647 46 7.3 50% (2) 11.9 49% (2) 5.5 41% (2)648 42 6.0 48% (2) 11.6 37% (2) 9.2 46% (1)649 45 8.5 39% (1) 7.1 54% (2) 5.3 38% (2)650 34 3.1 59% (2) NAc NAc NAc NAc
651 36 17.5 27% (2) 16.3 52% (4) 11.4 27% (4)652 32 9.5 42% (1) 16.6 28% (2) Contaminated653 35 17.5 28% (1) 9.5 39% (2) 3.1 16% (1)654 49 7.1 58% (2) 10.1 42% (3) 7.5 59% (2)655 49 3.4 44% (2) 16.8 35% (3) 11.3 39% (1)656 44 5.9 27% (2) 38.4 4.7% (1)b NAc NAc
657 43 10.4 21% (2) 8.2 46% (2) 12.2 38% (2)658 39 4.1 34% (2) 6.5 48% (2) 1.3 41% (2)659 34 3.3 29% (2) 2.6 35% (2) 4.0 51% (1)660 42 16.2 62% (1) 13.6 65% (3) 14.8 62% (2)661 44 5.6 58% (1) 10.3 40% (2) 6.7 39% (2)662 38 2.9 69% (1) 3.9 87% (2) NAc NAc
663 30 a — 6.4 42% (2) 2.1 74% (2)664 32 a — 24.2 12% (2) 8.2 29% (2)665 49 a — 8.4 31% (2) 14.4 39% (2)666 39 a — 8.8 75% (2) 8.5 71% (2)667 44 a — 18.7 49% (1) ContaminatedMeans 41 { 6 7.6 45% 9.9 44% 7.0 45%
(b) Shetland Nonexposed Control Group
First sample (n) Second sample (n) Third sample (n)Donor Agecode (yr) MF 1 1006 CE MF 1 1006 CE MF 1 1006 CE
668 41 6.0 64% (1) 6.2 59% (2) NAc NAc
669 44 7.6 81% (2) 13.1 55% (2) NAc NAc
670 36 10.6 50% (2) 14.0 35% (3) 9.6 35% (2)671 39 7.6 48% (2) 6.7 37% (1) 7.9 32% (2)672 41 5.4 61% (2) 8.9 45% (2) NAc NAc
673 36 7.3 41% (2) 5.8 36% (2) 4.4 50% (2)674 39 7.0 41% (2) 8.2 57% (2) 3.2 45% (2)692 45 NAc NAc 11.8 57% (2) NAc NAc
693 44 NAc NAc 5.8 45% (2) 8.6 59% (2)Means 41 { 3 7.2 55% 8.5 47% 6.2 44%
*All donors were declared nonsmokers. MF, mean mutant frequency per clonable T cell in each blood sample; CE, mean cloning efficiency; n,number of determinations per blood sample.aBlood samples arrived in poor condition; mononuclear cells could not be separated.bSecond sample, donor 656. Very poor cloning efficiency (õ5%); this sample was not included in the means or statistical analysis.cBlood sample not available.
ability [Lovell, 1989]. An appropriate experimental de-promise of second and third samples 10 weeks andsign for population monitoring based on a given end point12 months, respectively, after the first sample, and werequires a large data base and knowledge of intraindivid-thank our volunteers for agreeing to this. Nevertheless,ual (i.e., between experiments on different blood sampleseven with our modest sample numbers, we were not ablefrom the same person) and interindividual variation into achieve a complete set of samples every time, which‘‘normal, nonexposed’’ subjects, in order that suitablecreated problems in the final analysis.sample sizes are obtained and potential confounding fac-
Experimental Design tors are taken into account (e.g., gender, age, smokingStatistical methods for genotoxicity testing have been habit, etc.) when selecting the ‘‘test’’ and ‘‘control’’
groups. Note that ‘‘suitable sample size’’ applies in thisdeveloped to detect effects over and above biological vari-
492 8I17/ 8I17$$0492 09-03-97 11:12:50 wlemal W Liss: EM
106 Cole et al.
TABLE II. Hprt Mutant Frequencies in Circulating TLymphocytes in the York Area Nonexposed ControlGroup
SmokingDonor Age (yr) habit MF 1 1006 CE (n)
675 48 NS 11.1 79% (1)676 47 NS 10.3 91% (1)677 56 NS 10.4 64% (1)678 51 NS 11.6 46% (1)679 58 NS 8.0 25% (1)680 49 S 14.6 44% (2)681 53 S 2.1 60% (2)682 24 NS 6.1 44% (1)683 45 NS 6.8 63% (2)684 40 NS 7.8 55% (2)685 25 S 7.0 38% (4)686 25 S 2.0 61% (2)Means 43 { 12 7.1 56%
MF, mean mutant frequency per clonable T cell in each blood sample;CE, mean cloning efficiency; n, number of determinations per bloodsample; NS, declared nonsmoker; S, smoker.
case to both the size of tissue sample, so that experimentscan be repeated, as well as the number of donors per testgroup. An example of this approach for the hprt mutationassay has been published by Robinson et al. [1994]. Here,it was recommended that, given the variability in mutantfrequency seen between individual donors in the four sub-stantial data bases analysed, a minimum of 30–50 indi-viduals per donor group would be necessary to have a90% chance of detecting a 1.5-fold increase in mutantfrequency over the control level and about 20 per groupto detect a doubling in frequency.
In determining sample size it should be rememberedFig. 5. Mutant frequency in Shetland donors. A: Exposed donors. B:that if several samples will be required from each donor,Control donors.not all donors will provide all samples. This may be a
particular problem for unexposed controls, who have lessincentive to complete the study. Other samples are likelyto be lost through logistical and experimental problems.
1994]. Serum is pretested for the ability to support goodThe number of individuals sampled must make allowanceT-cell cloning efficiency and stocks of good batches keptfor these sources of attrition.as reference material. The same should apply to any criti-cal experimental media or component, e.g., plates. The
Issues Concerning Experimental Methods and Results mutation experiments could now be said to be ‘‘routine’’in our laboratory and the sources of experimental variabil-Protocolsity allowed for in the data analysis. As noted above, weconsider it important that wherever possible experimentsThe hprt assay. Assessing unique samples for evidence
of environmental damage requires the use of well-defined, on each blood sample should be replicated so that experi-mental variability (in addition to donor variability) maywritten protocols, which should include standard labora-
tory controls to monitor the acceptability and reproduc- be estimated. In the majority of cases in the study (51 of66 blood samples assessed for hprt mutant frequency),ibility of the experiments. Thus, for many years we have
routinely monitored experimental variables for the hprt this was possible. ‘‘In house’’ control MNC samples wereused, in addition to the Shetlands and York controls, toassay, such as serum and interleukin batch and laboratory
worker, and have used cryopreserved samples from regu- monitor experimental variability; acceptable results indi-cated that there were no problems with the experimentallar donors as internal controls for each experiment [Hen-
derson et al., 1986; Cole et al., 1988; Robinson et al., procedures.
492 8I17/ 8I17$$0492 09-03-97 11:12:50 wlemal W Liss: EM

Biomonitoring Following the Wreck of the Braer 107
Postlabelling experiments. The experimental methods Issues Concerning Results, Data Analysis, andInterpretationfor the determination of adducts have not yet reached the
‘‘routine’’ stage of the hprt assay. Although the postla-belling assay is widely used, there is no established stan-
The Mutant Frequency Assaydardised protocol and each laboratory has its own individ-The importance of understanding the limitations andual method for storing tissue, isolating and digesting
variability of each system so that a suitable experimentalDNA, performing the enhancement techniques, 32P-la-design is worked out in advance has already been stressed.belling the nucleotides, performing the chromatographyFor the hprt assay, we have previously analysed Ç500step, and quantifying the adducts. Several interlaboratorymutant frequencies from normal donors [Robinson et al.,trials have been performed with the aim of producing a1994]. Inevitably, there is extensive variability over anddetailed standard protocol, but this is still ongoing. Untilabove any effects of subject age or smoking habit, factorsit is available, there are some specific points, not relatedwhich were not confounders in the present study sinceto interlaboratory differences, which should be taken intowe chose to monitor nonsmoking males in a limited ageconsideration and incorporated into the experimental de-range.sign of a postlabelling assay used in the future for studies
The purpose of the hprt assay was to determine if expo-of the nature described in this paper (where damage tosure, in this instance to airborne petroleum pollution, hadDNA provides mechanistic information of possible hu-resulted in a significant increase in mutations in circulat-man exposure to carcinogens).ing blood cells. Our aim was to make two comparisons.The first important point is that sufficient DNA shouldFirstly, we compared the baseline mutant frequency inbe available to allow multiple analyses and repeat experi-each exposed person immediately after the accident (whenments if necessary. Unfortunately, this was not the caseany newly induced mutants would not be expressed) withwith this study; when problems arose with the TLC plates,the frequency in the same individuals 2–3 months later,material was not available to clarify the results. Sufficientwhen any mutations at the hprt locus induced by theDNA will also allow for a variety of adduct enhancementpetroleum exposure should be detected. The final sample,techniques to be investigated (e.g., butan-1-ol andabout 1 year later, should indicate the persistence, or oth-nuclease P1). This is important when humans are exposederwise, of any induced mutations. Thus, each exposedin the environment to complex mixtures because differentperson would act as his or her own control, and anyenhancement techniques enhance different types of DNAchanges could be analysed both on an individual basis
adduct.and for the group as a whole. Secondly, obtaining samples
A second point is that each experiment should incorpo- from nonexposed persons on the island enabled us torate a range of standard DNA samples. Positive control compare mutant frequencies of exposed and nonexposedsamples would ideally be in vitro synthesised oligonucle- subjects with broadly similar life-style backgrounds, inotides or radiolabelled ct-DNA containing a range of ad- addition to a comparison with concurrent controls fromduct levels. Results could then be corrected in relation to a nonpolluted region of Yorkshire and our historical datathese known standards. A second positive control stan- base from the Sussex area. The use of replicate (two ordard could be a human DNA sample which has been more experiments from each blood sample) and repeatexposed to a complex mixture (e.g., human lung DNA (two or more blood samples from the same person) exper-from a cigarette smoker); this will be useful to check for iments enabled us to make additional observations on botha consistent DNA adduct pattern between experiments. the experimental variability of the hprt mutant frequencyA negative control sample is required in each experiment estimates and the interindividual variability of mutant fre-to check for the presence of artefactual DNA adduct spots. quencies of the control and exposed subjects. We consider
The quality of the TLC plates is essential and was not it essential that both of these sources of variation shouldsatisfactory in this study, resulting in large interexperi- be addressed if population monitoring for genetic damagemental variations and causing considerable problems with is to make a real contribution to human health hazarddata analysis. Unfortunately, time and small sample sizes assessment.did not allow for the storage and reexamination of these An analysis of the data showed that in no case were thesamples at a later date when suitable TLC plates were mutant frequencies from the potentially exposed personsobtained. If plates are obtained from a commercial source, significantly different from any controls. One point ofbatches should be pretested against a sample of proven interest was the apparent slight rise in mutant frequencyquality, and ideally the same acceptable batch should be at the second sample date, which just reached significanceused throughout. Sensitive high-performance liquid chro- when the two Shetlands sets (i.e., exposed and nonex-matographic methods for analysis of postlabelled nucleo- posed Shetlanders) were combined. The reasons for thistides are becoming available, and in the future this method are not clear. Similar marginal effects on cytogenetic endof chromatography may be more reproducible than the points have been noted in a small study [Roth et al.,
1994], who suggested that caution should be exercisedconventional TLC method.
492 8I17/ 8I17$$0492 09-03-97 11:12:50 wlemal W Liss: EM

108 Cole et al.
when comparing results from two different samplings.We have evidence from a larger study of an effect ofsampling date on mutant frequency (in preparation), butin this instance the Shetlands result is more likely to bea combination of chance due to the relatively small sam-ple size and the fact that, for various reasons, results forall volunteers were not obtained at every sample time(first sample time, N Å 28; second time, N Å 34; thirdtime N Å 25). Both intra- and interindividual variabilitiesin mutant frequency in samples from the Shetlands groupwere quite large. Repeat sampling to determine the hprtmutant frequency from individual donors over a numberof years has enabled us and others to demonstrate thatwhile intraindividual mutant frequency is significantlyless variable than interindividual variation, differences oftwo- to fivefold may be seen in the estimates from individ-ual nonexposed subjects [Henderson et al., 1986; O’Neillet al., 1987; Cole et al., 1988, 1989; Cole and Skopek,1994]. Three examples of such variation in mutant fre-quency with time from our historical data base are illus-trated in Figure 6A–C. The variation in mutant frequencyfound for individuals in the Shetlands group was verysimilar and reinforces the conclusions of Robinson et al.[1994] concerning sample size, which were finalised afterthis study was already started. For the Sussex laboratory,where an experimental design was used that includes rep-licate experiments on each sample wherever possible, asample size of Ç30 donors per group was estimated tobe the minimum required to detect a 1.5-fold increase inmutant frequency. Thus, with hindsight, obtaining a largerdonor set than we achieved would have been preferable.
DNA Adducts
The purpose of the 32P-postlabelling assay analysis wasto determine whether there was any increase in the num-ber of DNA adducts in lymphocytes from exposed indi-viduals over lymphocytes of controls. Various enhance-ment methods have been developed to increase the 32P-postlabelling assay’s sensitivity. Since only smallamounts of DNA were available to us for analysis, thechoice of which enhancement technique to use was criti-cal. The butan-1-ol extraction procedure, which is particu-larly appropriate for bulky lipophilic adducts, involvesthe organic extraction and concentration of adducted nu-cleotides in the presence of the phase transfer agent tet-rabutyl ammonium chloride. A second enhancement pro-cedure utilises the enzyme nuclease P1, which enzymati-cally digests unadducted nucleotides to nucleosides whichare not substrates in the subsequent labelling reaction.Bulky DNA adducted nucleotides are partially or totallyresistant to the 3*-dephosphorylating action of nucleaseP1 and remain available for labelling. A number of studies
Fig. 6. Variation in mutant frequency for three control donors fromhave shown that certain adducts are detected more effi- Sussex, England. A: Donor 2 (female, smoker, age at sampling timesciently with one enrichment method than the other. For 44–50 years). B: Donor 7 (male, nonsmoker, age at sampling timesexample, Gupta and Earley [1988] and Gallagher et al. 44–54 years). C: Donor 42 (male, nonsmoker, age at sample times 50–
61 years).[1989] showed that nuclease P1 treatment resulted in a
492 8I17/ 8I17$$0492 09-03-97 11:12:50 wlemal W Liss: EM

Biomonitoring Following the Wreck of the Braer 109
reduction in detection of adducts, e.g., those from 1- ble so that dose-response relationships can be investi-gated.amino-6-nitropyrene, 1-amino-8-nitropyrene, 2-amino-
fluorene, 2-naphthylamine, 4-aminobiphenyl, and deoxy- • Many population monitoring exercises involve morethan one group of scientific investigators. Collaboratingguanosine-C8-arylamine. It was decided to analyse the
Shetland Island samples using the butan-1-ol extraction laboratories should prepare a plan of work at the outsetand discuss progress at regular intervals during theprocedure since a wider range of adducts might be de-
tected using this method. In a few experiments, where course of the investigation.• Considerable thought should be given to the power andDNA was sufficient, both methods were used for com-
parison. For this material, butan-1-ol extraction gave sig- statistical analysis of any proposed method well beforeit is offered for use in an emergency so that adequatenificantly higher counts than P1, without increasing the
calf thymus controls. The difference was most marked numbers of volunteers are sought.• Note that, in an emergency, inevitably things do not(úfourfold) when the BPDE standard was analysed.
The results were analysed in two ways. For graphical always go according to plan: samples may be lost ordelayed and donors may not always be available topresentation, RAL values were calculated and corrected
by subtracting the RAL value for the negative control. provide repeat samples. Plan to obtain more than theminimum sample number estimated to be needed forFor statistical analysis, the values were transformed (log
count /1) and a multivariate analysis of variance per- reliable interpretation of the results.• In addition to sound experimental design, which is es-formed, testing for significance of any factor after
allowing for the counts in the negative control. No differ- sential for a valid statistical analysis of data, carefullaboratory practice helps to give confidence to dataences were seen in the numbers of adducts in exposed
vs. nonexposed samples or between samples taken imme- interpretation and the conclusions drawn from a study.Such codes of practice are routine for in vitro geneticdiately after the disaster and 1 year later.
DNA from a variety of human tissues has been ana- toxicology testing; similar experimental design codescould now be considered for in vivo human monitoring.lysed by postlabelling, including lung, placenta, bladder,
skin, white blood cells [reviewed in Beach and Gupta, • Examples of ‘‘good practices’’ include the following:(1) Coded samples should be used to maintain both1992], and liver [Martin et al., 1995]. These samples have
come from humans exposed to a variety of agents, includ- donor anonymity and blind scoring of experiments.Analyses should be conducted on a batch basis with aing cigarette smoke, occupational exposure (styrene, coke
oven workers), and clinical exposure (mitomycin C, pro- mix of exposed and control samples. This mix shouldbe distributed such that replicate samples are analysedcarbazine/dacarbazine, tamoxifen). Because of the prob-
lem of nonspecific background in our negative controls, on separate occasions along with different partners. Inthe case of postlabelling, this will enable batch varia-it is difficult to quantitate our results precisely; however,
when our values were corrected by subtracting calf thy- tion to be segregated from individual variation. (2)Clearly defined protocols should be used. A protocolmus values, the RAL values were approximately 0.60 1
1006 for immediate samples and 0.21 to 0.35 1 1006 for should not normally be changed during a study. Thisdoes not mean that it should never be changed. If it1-year samples. These are in the same range as those
found in white blood cells by other laboratories. Thus, becomes apparent during a study that the protocol isinappropriate, stop at once and make sure that a modi-our study does not provide evidence of an increase in
DNA adduct levels which could be attributed to petro- fication is appropriate before proceeding. (3) It shouldgo without saying that method development should notchemical exposure during the Braer oil spill.take place using unique samples, and should a problembecome apparent during a study, work on unique sam-ples should cease immediately until the problem isRecommendations for the Futuresolved. Pretesting of all critical experimental compo-nents against a laboratory standard is essential. Pilot• A rapid response to a local crisis is vital in order to
obtain samples as soon as possible after an accident. studies should be conducted where possible to familiar-ise laboratories with analysing real samples. (4) The• If sufficient funds are not immediately available to
carry out a proposed project, it is still worth attempting use of replicate experiments on any given sample tomonitor experimental variability and reproducibility, into obtain samples quickly; if this is not done, invaluable
information may be lost. Cryopreserved material can addition to internal standards and cryopreserved ‘‘inhouse’’ samples to monitor historical experimental con-always be used at a later date. If blood is the tissue of
choice, a 60 ml blood sample should be sought and the sistency, is essential. (5) A computerised data base,should be maintained, with full details of all experimen-different fractions stored appropriately so that adequate
material is available for future analysis. tal variables (worker, media/plate batch, etc.) and donorattributes (age, gender, smoking history, etc.) in addi-• Exposure of individuals to the substances under investi-
gation should always be estimated as precisely as possi- tion to raw data (plate counts) so that any contribution
492 8I17/ 8I17$$0492 09-03-97 11:12:50 wlemal W Liss: EM
110 Cole et al.
VL, Theodorakopoulos N, Bacalis NC, Natarajan AT, Tates AD,of experimental artefacts to ‘‘outlier’’ results can beHaugen A, Andreassen A, Øvebrø S, Shuker DEG, Amaningmonitored.KS, Schouft A, Ellul A, Garner RC, Dingley KH, Abbondandolo• Finally, because of the nature of variability of many A, Merlo F, Cole J, Aldridge K, Beare D, Capulas E, Rowley
environmental genotoxicity end points, it must be rec- G, Waugh APW, Povey AC, Haque K, Kirsch-Volders M, Vanognised that only a large-scale study is likely to have Hummelen P, Castelain P (1996): Biomonitoring human expo-
sure to environmental carcinogenic chemicals. Mutagenesisany possibility of yielding useful information.11:363–381.
Gallagher JE, Jackson MA, George MH, Lewtas J, Robertson IGC(1989): Differences in detection of DNA adducts in the 32P-ACKNOWLEDGMENTSpostlabelling assay after 1-butanol extraction of nuclease P1-treat-ment. Cancer Lett 49:7–12.This work was supported in part by a European Com-
Garner RC, Farmer D, Steele G, Wright A (1991): ‘‘Human Carcinogenmunities environmental research grant to P.F., R.C.G.,Exposure: Biomonitoring and Risk Assessment.’’ Oxford: Ox-
and J.C. (EV5V-CT91-0013); the Scottish Office Home ford University Press.and Health Department; and BAT Co. Ltd (studentship Gledhill BL, Mauro F (1991): ‘‘New Horizons in Biological Dosime-to K.P.). We thank the UK Medical Research Council for try.’’ New York: Wiley-Liss.
Grant SG, Bigbee WL (1993): In vivo somatic mutation and segregationits immediate response in agreeing to underwrite the costat the human glycophorin A (GPA) locus: Phenotypic variationof obtaining samples. We also acknowledge Professorsencompassing both gene-specific and chromosomal mechanisms.B.A. Bridges and R. Waters for helpful discussions. Fi-Mutat Res 288:163–172.
nally, we thank all of the Shetlanders who gave their time Green MHL, O’Neill JP, Cole J (1995): Suggestions concerning theto make this possible and especially all those volunteers relationship between mutant frequency and mutation rate at the
hprt locus in human peripheral T-lymphocytes. Mutat Reswho donated blood samples for the project.334:323–339.
Gupta RC (1984): Nonrandom binding of the carcinogen N-hydroxy-2-acetylaminofluorene to repetitive sequences of rat liver DNA inREFERENCESvivo. Proc Natl Acad Sci USA 81:6943–6947.
Beach AC, Gupta RC (1992): Human biomonitoring and the 32P-postla- Gupta RC (1985): Enhanced sensitivity of 32P-postlabelling analysis ofbelling assay. Carcinogenesis 13:1053–1074. aromatic carcinogen: DNA adducts. Cancer Res 45:5656–5662.
Carrano AV, Natarajan AT (1988): Considerations for population moni- Gupta RC, Earley K (1988): 32P-adduct assay: Comparative recoveriestoring using cytogenetic techniques. Mutat Res 204:379–406. of structurally diverse DNA adducts in the various enhancement
Claycamp HG (1992): Phenol sensitization of DNA to subsequent oxida- procedures. Carcinogenesis 9:1687–1693.tive damage in 8-hydroxyguanine assays. Carcinogenesis Henderson L, Cole H, Cole J, James SE, Green MHL (1986): Detection13:1289–1292. of somatic mutations in man: Evaluation of the microtiter cloning
Cole J, Arlett CF (1994): Cloning efficiency and spontaneous mutant assay for T-lymphocytes. Mutagenesis 1:195–200.frequency in circulating T-lymphocytes in ataxia-telangiectasia
Jensen RH, Langlois RG, Bigbee WL (1986): Determination of somaticpatients. Int J Radiat Biol 66:S123–S131.
mutations in human erythrocytes by flow cytometry. Prog ClinCole J, Skopek TR (1994): Somatic mutant frequency, mutation rates
Biol Res 209B:177–184.and mutational spectra in the human population in vivo. Mutat
Jensen RH, Bigbee WL, Langlois RG (1990): Multiple endpoints forRes 304:33–105.
somatic mutations in humans provide complementary views forCole J, Green MHL, James SE, Henderson L, Cole H (1988): Human
biodosimetry, genotoxicity and health risks. In Mendelsohn ML,population monitoring: A further assessment of factors influenc-
Albertini RJ (eds): ‘‘Mutation and the Environment, Part C: So-ing measurements of thioguanine-resistant mutant frequency inmatic and Heritable Mutation, Adduction, and Epidemiology.’’circulating T-lymphocytes. Mutat Res 204:493–507.New York: Wiley-Liss, pp 81–92.Cole J, Arlett CF, Green MHL, James SE, Henderson L, Cole H, Sala-
Jolles G, Cordier A (1989): ‘‘New Trends in Genetic Risk Assessment.’’Trepat M, Benzi R, Price ML, Bridges BA (1989): MeasurementLondon: Academic Press.of mutant frequency to 6-thioguanine resistance in circulating T-
Kendall TL, Byerley DJ, Dean R (1991): Isolation of DNA from blood.lymphocytes for human population monitoring. In Jolles G (ed.):Anal Biochem 174:74–76.‘‘New Trends in Genetic Risk Assessment.’’ London: Academic
Langlois RG, Akiyama M, Kusunoki Y, DuPont BR, Moore II DH,Press, pp 175–203.Bigbee WL, Grant SG, Jensen RH (1993): Analysis of somaticCole J, Arlett CF, Norris PG, Stephens G, Waugh APW, Beare DM,cell mutations at the glycophorin A locus in atomic bomb survi-Green MHL (1992): Elevated hprt mutant frequency in circulat-vors: A comparative study of assay methods. Radiat Resing T-lymphocytes of xeroderma pigmentosum patients. Mutat136:111–117.Res 273:171–178.
Lovell DP (1989): Statistics and genotoxicity testing. In Kirkland DJCole J, Green MHL, Bridges BA, Waugh APW, Beare DM, Henshaw(ed): ‘‘Statistical Evaluation of Mutagenicity Test Data.’’ Cam-D, Last R, Liu Y, Cortopassi G (1996): Lack of evidence for anbridge: Cambridge University Press, pp 1–24.association between the frequency of mutants or translocations
Martin EA, Rich KJ, White INH, Woods KL, Powles TJ, Smith LLin circulating lymphocytes and exposure to radon gas in the(1995): 32P-postlabelled DNA adducts in liver obtained fromhome. Radiat Res 145:61–69.women treated with tamoxifen. Carcinogenesis 16:1651–1654.da Cruz AD, Curry J, Curado MP, Glickman BW (1996): Monitoring
Melikian AA, Sun P, Coleman S, Amin S, Hecht SS (1996): Detectionhprt mutant frequency over time in T-lymphocytes of peopleof DNA and globin adducts of polynuclear aromatic hydrocarbonaccidentally exposed to high doses of ionizing radiation. Environdiol epoxides by gas chromatography-mass spectrometry andMol Mutagen 27:165–176.[3H]CH3I postlabeling of released tetraols. Chem Res ToxicolFarmer PB, Sepai O, Lawrence R, Autrup H, Sabro Neilsen P, Vester-9:508–516.gard AB, Waters R, Leuratti C, Jones NJ, Stone J, Baan RA,
van Delft JHM, Steenwinkel MJST, Kyrtopoulos SA, Souliotis Mendelsohn ML, Albertini RJ (1990): ‘‘Mutation and the Environment,
492 8I17/ 8I17$$0492 09-03-97 11:12:50 wlemal W Liss: EM
Biomonitoring Following the Wreck of the Braer 111
Part C: Somatic and Heritable Mutation, Adduction, and Epide- phocytes of pharmacists before and after working with cytostaticdrugs. Mutat Res 325:157–162.miology.’’ New York: Wiley-Liss.
O’Neill JP, McGinniss MJ, Berman JK, Sullivan LM, Nicklas JA, Al- Sala-Trepat M, Cole J, Green MHL, Rigaud O, Vilcoq JR, MoustacchiE (1990): Genotoxic effects of radiotherapy and chemotherapybertini RJ (1987): Refinement of a T-lymphocyte cloning assay
to quantify the in vivo thioguanine-resistant mutant frequency in on the circulating lymphocytes of breast cancer patients. III:Measurement of mutant frequency to 6-thioguanine resistance.humans. Mutagenesis 2:87–94.
Payne CD, Atkin M, Baker RJ, Clarke MRB, Francis B, Gilchrist R, Mutagenesis 5:593–598.Tates AD, Grummit T, van Dam FJ, de Zwart F, Kasper FJ, Rothe R,Green M, Nelder JA, Reese RA, Slater M, Swan AV, White
R (1986): The GLIM system, release 3.77. Oxford: Numerical Stirn H, Zwinderman AH, Natarajan AT (1994): Measurementof frequencies of HPRT mutants, chromosomal aberrations, mi-Algorithms Group.
Phillips DH, Hemminki K, Alhonen A, Hewer A, Grover PL (1988): cronuclei, sister chromatid exchanges and cells with high fre-quencies of SCEs in styrene/dichloromethane-exposed workers.Monitoring occupational exposure to carcinogens: Detection by
32P-postlabelling of aromatic DNA adducts in white blood cells Mutat Res 313:249–262.Tates AD, Boogaard PJ, Darroudi F, Natarajan AT, Caubo ME, vanfrom iron foundry workers. Mutat Res 204:531–541.
Reddy MV, Randerath K (1986): Nuclease P1-mediated enhancement of Sittert NJ (1995): Biological effect monitoring in industrial work-ers following incidental exposure to high concentrations of ethyl-sensitivity of 32P-postlabelling test for structurally diverse DNA
adducts. Carcinogenesis 7:1543–1551. ene oxide. Mutat Res 329:63–77.van Dam FJ, Camps JA, Woldring VM, Natarajan AT, van der Wall EE,Robinson DR, Goodall K, Albertini RJ, O’Neill JP, Finett B, Sala-
Trepat M, Tates AD, Moustacchi E, Beare D, Green MHL, Cole Zwinderman AH, Lohman PHM, Pauwels EKJ, Tates AD (1991):Radionuclide angiography with technetium-99m in vivo labeledJ (1994): An analysis of in vivo hprt mutant frequency in circulat-
ing T-lymphocytes in the normal human population: A compari- erythrocytes does not lead to induction of mutations in the HPRTgene of human T-lymphocytes. J Nucl Med 32:814–819.son of four data sets. Mutat Res 313:227–247.
Roth S, Norppa H, Jarventaus H, Kyyronen P, Ahonen M, Lehtomaki J,Accepted by—Sainio H, Sorsa M (1994): Analysis of chromosomal aberrations,
sister-chromatid exchanges and micronuclei in peripheral lym- J. Felton
492 8I17/ 8I17$$0492 09-03-97 11:12:50 wlemal W Liss: EM