biomass, density, and size distributions of fishes ... · the northern gulf of mexico (ngom) boasts...
TRANSCRIPT

BULLETIN OF MARINE SCIENCE, 86(4): 879–889, 2010doi:10.5343/bms.2010.1026
879Bulletin of Marine Science© 2010 Rosenstiel School of Marine and Atmospheric Science of the University of Miami
BIOMASS, DENSITY, AND SIZE DISTRIBUTIONS OF FISHES ASSOCIATED WITH A LARGE-SCALE ARTIFICIAL
REEF COMPLEX IN THE GULF OF MEXICO
Kevin M. Boswell, R. J. David Wells, James H. Cowan, Jr., and Charles A. Wilson
ABSTRACT
The Freeport Sulphur Mine Artificial Reef (FSMAR) is a decommissioned oil and gas platform and serves as the largest artificial reef complex in the northern Gulf of Mexico (NGOM). Given the increasing numbers of artificial reefs in the NGOM, yet the paucity of information that exists, the goals of this study were to evaluate the biomass, density, and size structure of fishes associated with FSMAR. Mobile acoustic surveys were used to assess both horizontal and vertical distribution and abundance of fishes associated with the shallow water (16 m depth) reef complex and adjacent soft-bottom habitats extending 1 km from the reef complex. Highest acoustic estimates of fish biomass and density were found directly over the reef with a five-fold and 16-fold decrease at 10 and 30 m distances from the structure, respectively. In addition, fish biomass and density were highest in the bottom water column (> 10 m), followed by mid-water (6.1–10 m), and lowest in the upper water column (1.5–6 m). Findings suggest that fish distribution at the FSMAR is much greater than previously surveyed decommissioned oil and gas platforms and natural reef habitats in the NGOM. We consider the potential importance of this unique nearshore complex as an important habitat to fishes utilizing nearby estuarine and inner shelf systems in the NGOM.
Artificial reefs are often used to enhance fishery resources and provide for in-creased fishing opportunities by acting as complex habitat for fishes (Seaman, 2007; NOAA, 2007). Given the high relative abundance of fishes associated with artificial reefs, these structures have been suggested to serve as tools to help mitigate declines in fishery stocks (Ambrose, 1994; Pickering et al., 1998; Relini et al., 2008). Moreover, artificial reef programs are growing worldwide, but basic data on distribution and abundance of fishes associated with artificial reefs are limited.
Informed decisions about the use of artificial reefs as fishery management tools requires quantitative data on spatial and temporal variations in biomass, abundance, and community composition (Grossman et al., 1997); however, fishery independent data are often difficult to obtain, particularly at decommissioned oil and gas plat-forms (Stanley and Wilson, 1996). As for highly structured natural habitats, tradi-tional active sampling methods are difficult and rarely quantitative. As such, visual census has been the primary method used for identifying and enumerating biological communities associated with artificial and natural reefs (Bortone et al., 1986; Rooker et al., 1997). However, poor visibility (Fabi and Sala, 2002) and diver impact on fish behavior (Stanley and Wilson, 1997) can affect visual survey methods. Alternatively, hydroacoustics have been used to quantify distribution, density, and size structure of fishes associated with artificial habitats in coastal waters (Fabi and Sala, 2002; Soldal et al., 2002; Brehmer et al., 2003), including the Gulf of Mexico (Stanley and Wilson,
NOTE

BULLETIN OF MARINE SCIENCE, VOL. 86, NO. 4, 2010880
1996, 1997, 2000). These techniques offer unique advantages over more traditional methods due to their non-invasive ability to acquire continuous high spatial resolu-tion of fish distribution and abundance and provide such information from reefs that are either too large or in waters too deep for visual assessments.
The northern Gulf of Mexico (NGOM) boasts one of the world’s largest artificial reef programs with approximately 4,000 petroleum platforms distributed over the continental shelf (MMS, 2007). These platforms serve secondarily as artificial reefs by providing vertical structure for fishes over relatively homogenous bottom (e.g., unconsolidated soft-sediments). The Freeport Sulphur Mine Artificial Reef (FSMAR) is the largest artificial reef complex in the NGOM located in shallow water (16 m depth) covering over 130,000 m2 of seafloor (LDWF, 2009). Due to its proximity to shore (11 km), FSMAR has historically been targeted by recreational anglers and sport divers (LDWF, 2009). As such, basic biological information of fish distribution and abundance of FSMAR is needed to understand the role of this reef complex as fish habitat in the NGOM.
The goals of this study were to describe the spatial distribution of fish biomass, density, and size associated with the FSMAR using hydroacoustic techniques. Spe-cifically, we were interested in quantifying biological parameters relative to the reef complex such as distance from the reef, vertical depth distribution, and reef size dur-ing the 2-yr study period. Ultimately, understanding the association of fish biomass, density, and size estimates relative to reef configuration will provide a better under-standing of the role of artificial reefs as a fishery management tool. Such information can then be used by management to assess the impact of current programs and guide future artificial reef projects.
Materials and Methods
Survey Site Description and Collection Parameters.—The FSMAR (29°11́ 20˝N, 89°53´20˝W) is located 11 km southeast of Barataria Bay, Louisiana (Fig. 1), in 16 m water depth and is currently the largest artificial reef complex in the NGOM. The reef complex is composed of more than 29 metal structures, including a power plant facility and numerous support platforms, in addition to 2.4 km of bridgework. The facility was decommissioned in 1992 and all superstructures were removed and the remaining components cut off at a depth of 7 m from the water’s surface and placed next to the structure on the soft-sediment sub-strate. Data were collected at FSMAR during daylight hours during eight mobile hydroacous-tic surveys conducted from August 2003 to March 2005; temperatures ranged from 28.2 ± 2.4 °C in summer months to 16.6 ± 4.1 °C in winter months. Surveys were conducted at an average vessel speed of 0.5 m s−1 and each survey comprised 16 2-km north-south or east-west tran-sect lines, depending on prevailing sea state conditions, with 80 m spacing. Vessel position (GPS) was input into the echosounder and recorded during each survey. Acoustic data were collected using a BioSonics 420 kHz split-beam transducer and DE-X scientific echosounder following the parameter settings of Boswell et al. (2007). The transducer was mounted on a towfish and aimed downward. The towfish was placed 3.5 m behind the vessel positioned ap-proximately 0.8 m below the water surface. As a result of the transducer depth and the near-field zone (~0.3 m), no data were obtained for the upper 1.5 m of the water column. Acoustic data were collected with BioSonics Acquisition Program 4.1 and calibrated with a standard reference sphere (Foote et al., 1987).
Post-processing.—Echoview 3.1 (Sonar Data Pty., Ltd.) was used for post-processing of raw acoustic data. In Echoview, analysis thresholds for both volume backscattering strength

NOTES 881
(Sv) and target strength (TS) echograms were applied, and calibration settings applied to com-pensate for temperature and salinity effects on sound speed attenuation. Following parameter configuration, echograms were visually inspected either for bad data regions (i.e., gas bubbles, abnormal towfish behavior) or for corruptions in data integrity (i.e., sudden changes in speed, loss of GPS signal). A bottom detection algorithm with a 0.5 m backstep was applied to ex-clude the sea floor and reef structure from the analysis.
Estimates of the volume backscattering coefficient (sv), the arithmetic form of SV [SV = 10 * log10 (sv)], which is proportional to fish biomass, were derived following standard echo integra-tion techniques (Simmonds and MacLennan, 2005). Integration results were analyzed in SAS (v9.1; SAS Institute, 2006). Target strength (in dB) estimates, used to approximate fish length, were generated with the split-beam single target detection algorithm where targets fulfilling single target criteria with TS greater than −55 dB [3 cm standard length (SL); McCartney and Stubbs, 1971] were accepted into the analysis. The single target algorithm was tuned to accept targets with echo envelopes between 0.6 and 1.7 times the pulse length, with a maximum beam compensation of 12 dB. An estimate of the backscattering cross section (σbs) for each individual target was calculated for each cell in SAS following MacLennan et al. (2002). Given the mixed species assemblage often associated with artificial reefs (Rooker et al., 1997; Wilson et al., 2006), the relationship defined in McCartney and Stubbs (1971) was used for TS as a function of SL (in cm), TS = 24.5 * log10 (SL) − 66.84. Fish density estimates were calculated as the mean sv divided by the mean σbs of a known volume of water given the relationship, fish density (fish m−3) = sv /σbs (MacLennan et al., 2002).
Figure 1. The FSMAR, located off Grand Isle, Louisiana, in the NGOM. Map shows position of concentric horizontal strata placed around the reef structure. The first strata (bold line) includes the reef structure and areas out to 1 m. Strata 2–6 are spaced at 10 m intervals and include dis-tances from strata 1 out to 50 m. Strata 7–14 are spaced at 25 m intervals and include distances from strata 6 out to 250 m. Strata 15 and 16 are spaced at 250 m intervals and represent distances from 250 m to 1000 m away from the reef.

BULLETIN OF MARINE SCIENCE, VOL. 86, NO. 4, 2010882
Data Analysis.—Seven concentric horizontal strata were created around the reef com-plex to analyze fish distribution in relation to the horizontal distance from the structure (Fig. 1): directly on reef structure, 1–10 m, 11–20 m, 21–30 m, 31–50 m, 51–200 m, and 201–1000 m away from the reef. Most transects comprised each horizontal strata with the exception of those transects which did not directly cover the reef structure. Acoustic data were also binned into three depth intervals to examine vertical depth distribution of fishes relative to the reef (upper: 1.5–6 m depth, mid: 6.1–10 m depth, bottom: > 10 m depth). Analysis of vari-ance (ANOVA; Table 1) was used to test for differences in biomass, density, and size with main factors of distance from the reef and depth distribution, and collection date as the blocking factor. The dependent variables, sv and σbs, were log10-transformed to approximate a normal distribution; normality and homogenous variance were tested by the Shapiro-Wilk’s test and inspection of the residuals, respectively. Post-hoc comparisons were conducted using Tukey’s HSD and significance was determined at the alpha level of 0.05. Means and standard errors are reported; standard error bounds are reported for biomass and target strength given asym-metric error distribution.
Results
Acoustic Biomass.—A significant main effect of acoustic biomass (SV) was found for distance from the reef complex (Table 1) with significantly greater biomass asso-ciated with the reef and lower biomass with increasing distance from the reef (Tukey: P < 0.01). Mean SV directly over the reef was −48.3 dB [standard error (SE) bounds: −7.9, −48.8] decreasing to < −60 dB at distances > 10 m from the reef complex (Fig. 2A). SV was significantly greater within the 1–10 m distance interval from the reef relative to intervals exceeding 10 m (Tukey: P < 0.01) and was consistently greater near the reef throughout the study period (Fig. 3). A similar main effect was found for vertical depth distribution (Tukey: P < 0.01), with significantly lower biomass in surface depths relative to midwater and bottom depths (Tukey: P < 0.01; Fig. 2). Mean estimates of acoustic biomass for surface, mid, and bottom depths were −63.9 (SE bounds: −63.2, −64.6), −56.9 (SE bounds: −56.4, −57.4), and −56.1 (SE bounds: −55.6, −56.7) dB, respectively. A significant interaction effect between distance from the reef and vertical depth distribution was observed (Tukey: P < 0.01) as biomass fluctu-ated within mid-range distances (10–50 m) from the reef complex (Fig. 2C).
Fish Density.—Patterns of fish density relative to distance from the reef complex were similar to biomass estimates with significantly higher values observed over the reef complex (Table 1; Tukey: P < 0.01; Fig. 4A). Mean density over the reef was 0.17 ± 0.01 fish m−3 and exponentially declined with increasing distance from the structure with mean density 1–10 m away from the reef of 0.03 ± 0.01 fish m−3, further decreas-ing to ≤ 0.01 ± 0.01 fish m−3 at distances exceeding 30 m. Density differences as a function of vertical depth distributions were also significant (Tukey: P < 0.01) with
Table 1. Analysis of variance type III fixed effects on acoustic proxies of fish biomass, density and target strength. Date of survey was used as blocking factor with significant co-variance structure (P < 0.03). Significance was set at α = 0.05 for all tests.
Biomass Density Target strengthSource F P F P F PDistance F6,63145 = 1,082.9 < 0.0001 F6,63145 = 517.3 <0.0001 F6,4801 = 2.7 0.0120Depth F2,63145 = 3,231.2 < 0.0001 F2,63145 = 1,494.7 <0.0001 F2,4801 = 10.9 < 0.0001Distance * Depth F12,63144 = 204.7 < 0.0001 F12,63144 = 94.9 <0.0001 F12,4800 = 3.0 0.0003

NOTES 883
highest densities at the mid (0.03 ± 0.01) and bottom (0.04 ± 0.01) depths relative to surface depth (0.01 ± 0.01; Fig. 4B). A significant interaction effect between distance from the reef and vertical depth distribution was found (Tukey: P < 0.01), suggest-ing densities within each depth distribution were dependent upon the distance from the reef structure (Fig. 4C). Significantly higher fish densities were found over the reef complex relative to other distance intervals for both the mid and bottom depth
Figure 2. SV (dB) as a function of (A) distance from reef, (B) depth interval, and (C) the interaction
of distance from the reef and depth interval (symbols: black = surface, grey = midwater, white = bottom). Error bars represent SE.
Figure 3. Temporal trends of SV (dB) with respect to distance from reef (gray bars = 0–10 m from
reef; black bars > 10 m from reef). Error bars represent standard error.
BULLETIN OF MARINE SCIENCE, VOL. 86, NO. 4, 2010884
distributions, whereas fish densities in the surface depth distribution were similar regardless of distance from the reef (Fig. 4C).
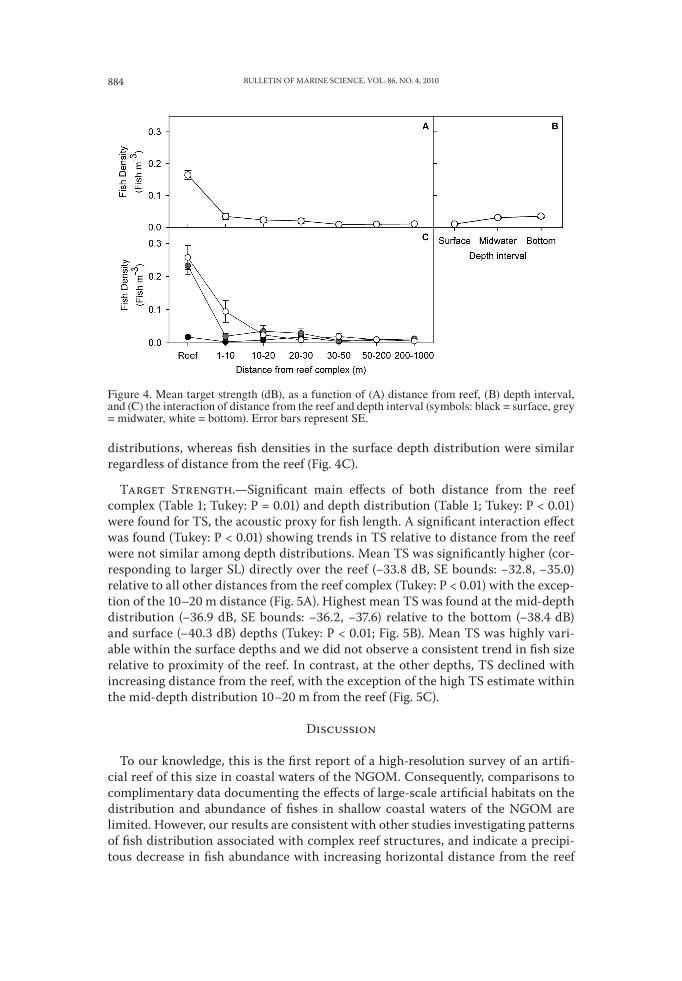
Target Strength.—Significant main effects of both distance from the reef complex (Table 1; Tukey: P = 0.01) and depth distribution (Table 1; Tukey: P < 0.01) were found for TS, the acoustic proxy for fish length. A significant interaction effect was found (Tukey: P < 0.01) showing trends in TS relative to distance from the reef were not similar among depth distributions. Mean TS was significantly higher (cor-responding to larger SL) directly over the reef (−33.8 dB, SE bounds: −32.8, −35.0) relative to all other distances from the reef complex (Tukey: P < 0.01) with the excep-tion of the 10–20 m distance (Fig. 5A). Highest mean TS was found at the mid-depth distribution (−36.9 dB, SE bounds: −36.2, −37.6) relative to the bottom (−38.4 dB) and surface (−40.3 dB) depths (Tukey: P < 0.01; Fig. 5B). Mean TS was highly vari-able within the surface depths and we did not observe a consistent trend in fish size relative to proximity of the reef. In contrast, at the other depths, TS declined with increasing distance from the reef, with the exception of the high TS estimate within the mid-depth distribution 10–20 m from the reef (Fig. 5C).
Discussion
To our knowledge, this is the first report of a high-resolution survey of an artifi-cial reef of this size in coastal waters of the NGOM. Consequently, comparisons to complimentary data documenting the effects of large-scale artificial habitats on the distribution and abundance of fishes in shallow coastal waters of the NGOM are limited. However, our results are consistent with other studies investigating patterns of fish distribution associated with complex reef structures, and indicate a precipi-tous decrease in fish abundance with increasing horizontal distance from the reef
Figure 4. Mean target strength (dB), as a function of (A) distance from reef, (B) depth interval, and (C) the interaction of distance from the reef and depth interval (symbols: black = surface, grey = midwater, white = bottom). Error bars represent SE.

NOTES 885
structure (Gerlotto et al., 1989; Stanley and Wilson, 1996, 1997, 2000; Fabi and Sala, 2002; Brehmer et al., 2003; dos Santos et al., 2010). In fact, the estimates generated from FSMAR are similar to those at other smaller standing platforms previously surveyed with hydroacoustics in the NGOM (Fig. 6; Wilson et al., 2003, 2006). While the overall biomass we found at FSMAR was similar to that reported from several standing platforms, both of which occupy large components of the water column; estimates from FSMAR were considerably higher than those found over natural reef habitats (Sonnier Bank and West Flower Garden Banks; see Wilson et al., 2003, 2006
Figure 5. Estimates of fish density (fish m-3), as a function of (A) distance from reef, (B) depth interval, and (C) the interaction of distance from the reef and depth interval (symbols: black = surface, grey = midwater, white = bottom). Error bars represent SE.
Figure 6. SV (dB) from FSMAR and previously surveyed habitats in the NGOM. Plotted data
are from standing oil and gas platforms (Stanley and Wilson 1996, 2000; Wilson et al., 2006), decommissioned oil and gas platforms (toppled and partially removed; Wilson et al., 2003), and natural reef habitats [West Flower Garden Banks (WFGB) reported by Wilson et al., (2003); Son-nier Bank reported by Wilson et al., (2006)]. Error bars represent SE of the mean.

BULLETIN OF MARINE SCIENCE, VOL. 86, NO. 4, 2010886
for estimates) in the NGOM (Fig. 6). Moreover, other decommissioned structures located in deeper water (> 30 m; either partially removed or toppled platforms; see Wilson et al., 2003, 2006) indicated a significantly lower available biomass than the shallow-water FSMAR.
Based on the results of this study, we estimate the horizontal area of influence (as defined in Stanley and Wilson, 2000) to be within 20 m of the reef structure. High-est fish abundance was observed within 20 m of the artificial reef complex, which is comparable to that reported at other oil and gas structures in the NGOM (Stanley and Wilson, 1996, 1997, 2000). In fact, we observed a five-fold decrease in fish density over a 10 m distance from the reef and an approximately 16-fold decrease in density beyond 30 m. Stanley and Wilson (1997) reported fish densities ranging between 3 and 25 times greater within 16 m from standing oil and gas platforms and noticed a decline in density to “background levels” beyond 30 m from the platforms. Simi-larly, dos Santos et al. (2010) reported an exponential decline in fish abundance with increasing distance at small shallow water (~9 m) artificial reef clusters out to 300 m. Results of other acoustic surveys at an artificial reef complex in the Adriatic Sea documented higher detection probability for fish near the reef and noted a substan-tial decrease in biomass 80 m from the reef (Fabi and Sala, 2002; Sala et al., 2007). Similarly, Brehmer et al. (2003) noted an abrupt decrease in fish biomass with in-creasing distance from an artificial reef complex in the Mediterranean Sea; however, an area of influence was not reported.
The distance of influence at the FSMAR is likely a function of water depth and con-figuration of the reef. Previously surveyed habitats in the NGOM were characterized by deeper water (> 30 m; Stanley and Wilson, 1996, 1997, 2000) and structures com-posed of single units, unlike the FSMAR which is composed of one main structure and a mosaic of smaller clusters located 50–250 m away from the main structure. In addition, the layout of the FSMAR is more complex than the general rectangular shape of the other habitats surveyed. The footprint of structures surveyed by Stanley and Wilson (1996, 1997, 2000) did not exceed 1800 m2, as compared to the FSMAR, which exceeds 130,000 m2. The FSMAR’s unique shape, shallow water environment, and expansive areal extent likely influences the distribution of fishes in the inshore waters and may explain the relatively extensive horizontal area of influence (~20 m).
Vertical depth distribution patterns were similar to those reported by Sala et al. (2007) where higher fish biomass was associated with mid- and bottom-water depth intervals compared to the surface waters. Generally, fish aggregations were observed directly over and closely associated with the vertical slope of the reef complex, as also demonstrated at other artificial reefs by Thorne et al. (1989) and Nakamura and Ha-mano (2009). It is possible that biomass estimates from the surface water column are under-represented and are a function of small sample size (e.g., reduced sample vol-ume near the transducer face) or avoidance behavior by pelagic fishes. This source of uncertainty is an important component in mobile acoustic surveys (Ona et al., 2007; De Robertis et al., 2008; Stoner et al., 2008), particularly in shallow waters; however, we did not observe the telltale signs of active avoidance in the echograms (e.g., rapid downward-moving targets, surface shoal disturbance).
The FSMAR is in close proximity to the Barataria Bay–Terrebonne Bay estuarine complex, further distinguishing the fish community associated with FSMAR from other previously surveyed habitats within the NGOM. Stanley and Wilson (2000) and Wilson et al. (2006) reported that the top-to-bottom vertical profile of stand-

NOTES 887
ing platforms attracts and holds large numbers of surface-oriented, pelagic fish spe-cies, such as blue runner Caranx crysos (Mitchill, 1815), and Bermuda chub Kyphosus sectatrix (Linnaeus, 1758), likely not associated with the inshore structures like the FSMAR. Based on previous studies of the inshore fish fauna along the Louisiana coast, including opportunistic biological surveys at FSMAR and video footage cap-tured following the decommissioning process (B. Hardcastle, Louisiana Department of Wildlife and Fisheries, unpubl. data), we expect that the FSMAR is largely inhab-ited by common nearshore [grey snapper Lutjanus griseus (Linnaeus, 1758), Atlantic spadefish Chaetodipterus faber (Broussonet, 1782), lane snapper Lutjanus synagris (Linnaeus, 1758), Spanish mackerel Scomberomorus maculatus (Mitchill, 1815)] and estuarine [spotted seatrout Cynoscion nebulosus (Cuvier, 1830), Gulf menhaden Brevoortia patronus (Goode, 1878), red drum Sciaenops ocellatus (Linnaeus, 1766), sheepshead Archosargus probatocephalus (Walbaum, 1792)] fish species.
High biomass and density estimates found directly over the FSMAR complex suggests this feature may act as an important habitat to fishes on the shallow inner shelf. As such, the unique geographical location of this reef complex may serve as an estuarine-ocean ecotone (Able, 2005), functioning as a conduit for the movement of fish species between estuarine and shallow inner shelf ecosystems. Continued efforts must be directed toward assessing and comparing distribution and abundance pat-terns of fishes associated with artificial and natural habitats.
Acknowledgments
We would like to thank the Louisiana Department of Wildlife and Fisheries for their sup-port, both financial and logistical, throughout this project; particular thanks to R. Pausina, B. Hardcastle, and the late R. Kasprzack. D. Nieland provided a thorough review and substan-tially improved this manuscript. Appreciation is due to M. Miller, Y. Allen, and S. Keenan, who provided support in the field and lab throughout the survey period.
Literature Cited
Able, K. W. 2005. A re-examination of fish estuarine dependence: evidence for connectivity between estuarine and ocean habitats. Estuar. Coast. Shelf Sci. 64: 5–17.
Ambrose, R. F. 1994. Mitigating the effects of a coastal power plant on a kelp forest community: rationale and requirements for an artificial reef. Bull. Mar. Sci. 55: 694–708.
Bortone, S. A., R. W. Hastings, and J. L. Oglesby. 1986. Quantification of reef fish assemblages: a comparison of several in situ methods. Northern Gulf Sci. 8: 1–22.
Boswell, K. M., M. P. Wilson, and C. A. Wilson. 2007. Hydroacoustics as a tool for assessing fish biomass and size distribution associated with discrete shallow water estuarine habitats in Louisiana. Estuar. Coast. 30: 607–617.
Brehmer, P., F. Gerlotto, J. Guillard, F. Sanguinede, Y. Guennegan, and D. Buestel. 2003. New applications of hydroacoustic methods for monitoring shallow water aquatic ecosystems: the case of mussel culture grounds. Aquat. Living Resour. 16: 333–338.
De Robertis, A., V. Hjellvik, N. J. Williamson, and C. D. Wilson. 2008. Silent ships do not always encounter more fish: comparison of acoustic backscatter recorded by a noise-reduced and a conventional research vessel. ICES J. Mar. Sci. 65: 1036–1045.
dos Santos, L. N., D. S. Brotto, and I. R. Zalmon. 2010. Fish response to increasing distance from artificial reefs on the Southeastern Brazilian Coast. J. Expt. Mar. Biol. Ecol. 386: 54–60.
Fabi, G. and A. Sala. 2002. An assessment of biomass and diel activity of fish at an artificial reef (Adriatic Sea) using a stationary hydroacoustic technique. ICES J. Mar. Sci. 59: 411–420.

BULLETIN OF MARINE SCIENCE, VOL. 86, NO. 4, 2010888
Foote, K. G., H. P. Knudsen, G. Vestnes, D. N. MacLennan, and E. J. Simmonds. 1987. Calibra-tion of acoustic instruments for fish density estimation: a practical guide. ICES Cooperative Research Report No 144.
Gerlotto, F., C. Bercy, and B. Bordeau. 1989. Echo integration survey around offshore oil extrac-tion platforms off Cameroon: observations of the repulsive effect on fish of some artificially emitted sounds. Proc. Ins. Ac. 19: 79–88.
Grossman, G. D., G. P. Jones, and W. J. Seaman. 1997. Do artificial reefs increase regional fish production? A review of existing data. Fisheries. 22: 17–23.
Louisiana Department of Wildlife and Fisheries (LDWF). 2009. Artificial Reef Program. Avail-able from: http://www.wlf.louisiana.gov/fishing/programs/habitat/artificialreef.cfm. Ac-cessed: Nov. 15, 2009.
MacLennan, D. N., P. G. Fernandes, and J. Dalen. 2002. A consistent approach to definitions and symbols in fisheries acoustics. ICES J. Mar. Sci. 59: 365–369.
McCartney, B. S. and A. R. Stubbs. 1971. Measurements of the acoustic target strength of fish in dorsal aspect, including swimbladder resonance. J. Sound Vib. 15: 397–420.
Minerals Management Sevice (MMS). 2007. Offshore statistics by depth. Available at: http://www.gomr.mms.gov/homepg/fastfacts/WaterDepth/WaterDepth.html. Accessed: Oct. 10, 2009.
Nakamura, T. and A. Hamano. 2009. Seasonal differences in the vertical distribution pattern of Japanese jack mackerel, Trachurus japonicus: changes according to age? ICES J. Mar. Sci. 66: 1289–1295.
National Oceanic and Atmospheric Administration (NOAA). 2007. National Artificial Reef Plan (as amended): guidelines for siting, construction, development, and assessment of artificial reefs. Available at: http://www.nmfs.noaa.gov/sfa/PartnershipsCommunications/NARPwCover3.pdf. Accessed: Jul. 27, 2010.
Ona, E., O. R. Godo, N. O. Handegard, V. H. R. Patel, and G. Pedersen. 2007. Silent research vessels are not quiet. J. Acoust. Soc. Am. 121: 145–150.
Pickering H., D. Whitmarsh, and A. Jensen. 1998. Artificial reefs as a tool to aid rehabilitation of coastal ecosystems: Investigating the potential. Mar. Pol. Bull. 37: 505–514.
Relini, G., G. Fabi, M. N. dos Santos, I. Moreno, and E. Charbonnel. 2008. Fisheries and their management using artificial reefs in the northwestern Mediterranean Sea and southern Portugal. Am. Fish. S. S. 49: 891–898.
Rooker, J. R., Q. R. Dokken, C. V. Pattengill, and G. J. Holt. 1997. Fish assemblages on artificial and natural reefs in the Flower Garden Banks National Marine Sanctuary, USA. Coral Reefs 16: 83–92.
Sala, A., G. Fabi, and S. Manoukian. 2007. Vertical diel dynamic of fish assemblage associated with an artificial reef (northern Adriatic Sea). Scientia Marina 71: 355–364.
SAS Institute Inc., 2006, Statistics Version 9.0. SAS Institute Inc. Cary, North Carolina.Seaman, W. 2007. Artificial habitats and the restoration of degraded marine ecosystems and
fisheries. Hydrobiologia 580: 143–155. Simmonds, E. J. and D. N. MacLennan. 2005. Fisheries acoustics: theory and practice, 2nd ed.
Blackwell Science, Oxford, 437 p.Soldal, A. V., I. Svellingen, T. Jørgensen, and S. Løkkeborg. 2002. Rigs-to-reefs in the North Sea:
hydroacoustic quantification of fish in the vicinity of a ‘‘semi-cold’’ platform. ICES J. Mar. Sci. 59: S281–S287.
Stanley, D. R. and C. A. Wilson. 1996. Abundance of fishes associated with a petroleum plat-form as measured with dual-beam hydroacoustics. ICES J. Mar. Sci. 53: 473–475.
___________ and ___________. 1997. Seasonal and spatial variation in the abundance and size distribution of fishes associated with a petroleum platform in the northern Gulf of Mexico. Can. J. Fish. Aquat. Sci. 54: 1166–1176.
___________ and ___________. 2000. Variation in the density and species composition of fishes associated with three petroleum platforms using dual beam hydroacoustics. Fish. Res. 47: 161–172.

NOTES 889
Stoner, A. W., C. H. Ryer, S. J. Parker, P. J. Auster, and W. W. Wakefi eld. 2008. Evaluating the role of fi sh behavior in surveys conducted with underwater vehicles. Can. J. Fish. Aquat. Sci. 65: 1230–1243.
Th orne, R. E., J. B. Hedgepeth, and J. Campos. 1989. Hydroacoustic observations of fi sh abun-dance and behavior around an artifi cial reef in Costa Rica. Bull. Mar. Sci. 44: 1058–1064.
Wilson, C. A., A. Pierce, and M. W. Miller. 2003. Rigs and reefs: a comparison of the fi sh com-munities at two artifi cial reefs, a production platform, and a natural reef in the northern Gulf of Mexico. Minerals Management Service, OCS Study MMS 2003-009, New Orleans, 95 p.
___________, M. W. Miller, Y. C. Allen, K. M. Boswell, and D. N. Nieland. 2006. Th e eff ect of depth, location, and habitat type, on relative abundance and species composition of fi shes associated with petroleum platforms and Sonnier bank in the northern Gulf of Mexico. Minerals Management Service, OCS Study MMS 2006-037, New Orleans.
Date SuBmitted: 14 April, 2010.Date Accepted: 23 August, 2010.AvailaBle Online: 17 September, 2010.
Addresses: (K.M.B., J.H.C.,Jr.) Department of Oceanography and Coastal Sciences, School of the Coast and Environment, Louisiana State University, Baton Rouge, Louisiana 70803. (R.J.D.W.) Department of Marine Biology, Texas A&M University, 5007 Avenue U., Galveston, Texas 77551. (C.A.W.) Department of Oceanography and Coastal Sciences, School of the Coast and Environment, Louisiana State University, Baton Rouge, Louisiana 70803 and Louisina Sea Grant College Program, Louisiana State University, Baton Rouge, Louisiana 70803.Corresponding Author: (K.M.B.) Phone: (225) 578-9390, Fax: (225) 578-6513, E-mail: <[email protected]>.
