biological and pathological role of a- type lamins in t
TRANSCRIPT
Universidad Autónoma de Madrid
Programa de doctorado en Biología
Biological and pathological role of A-
type lamins in T-cell mediated
immune response
Doctoral Thesis
Raquel Toribio Fernández
Madrid, 2018


Departamento de Biología
Facultad de Ciencias
Universidad Autónoma de Madrid
Programa de Doctorado en Biología
Biological and pathological role of A-type
lamins in T-cell mediated immune response
Memoria presentada por la Licenciada en Biología:
Raquel Toribio Fernández
para optar al título de Doctor por la Universidad Autónoma de Madrid
Doctorado en Biología con Mención Internacional
Director de tesis:
Dr. José María González Granado
Doctor en Fisiología por la Universidad Autónoma de Madrid
Este trabajo se realizó en el Centro Nacional de Investigaciones
Cardiovasculares (CNIC)
Madrid, 2018


José María González Granado, Doctor en Fisiología por la Universidad Autónoma de
Madrid,
CERTIFICA:
Que Raquel Toribio Fernández, Licenciada en Biología por la Universidad Autónoma
de Madrid, ha realizado bajo su dirección el trabajo de investigación correspondiente
a su Tesis Doctoral con el título:
Biological and pathological role of A-type lamins in T-cell
mediated immune response
Revisado este trabajo, el que suscribe lo considera satisfactorio y autoriza su
presentación para ser evaluado por el tribunal correspondiente.
Y para que así conste y a los efectos oportunos, firma el presente certificado en Madrid
a 22 de septiembre de 2018.
Fdo.: Dr. José María González Granado


A Salva,
a mis padres, Pilar y Jose,
y a mi hermano, Pablo.
“La vida no es fácil para ninguno
de nosotros. Pero… ¡qué importa!
Hay que perseverar y, sobre todo,
tener confianza en uno mismo”
Marie Curie


1 AGRADECIMIENTOS
AGRADECIMIENTOS
En primer lugar, quiero darle las gracias a José María por darme la oportunidad de hacer la tesis
doctoral bajo su dirección. Gracias a él he podido cumplir mi sueño de trabajar en el CNIC, el centro de
investigación que vi construir a través de mi ventana, mientras estudiaba esos apuntes infinitos de la que
sigo considerando la carrera más bonita que se puede estudiar. Nunca olvidaré su llamada telefónica a
la que contesté entre sonrisa y sonrisa, ¿en serio? Gracias por sus consejos, su apoyo, sus críticas, y sus
grandes, aunque a veces abrumadoras, ideas experimentales. Espero que se me haya pegado algo de su
incansable curiosidad científica. Gracias también por interesarse tanto por mi formación y animarme a
que me fuera de estancia; por desgracia no todos los jefes ponen interés en esta parte de su trabajo, y
por todo ello, siempre le estaré enormemente agradecida.
Gracias a Virginia por todo el apoyo experimental, y también personal. Esta tesis es en parte suya,
ya que sin ella muchos de los experimentos no podría haberlos llevado a cabo. De ella espero que se me
haya pegado algo de sus ganas de trabajar y sus escasos no por respuesta. Ha sido un placer trabajar
contigo.
Gracias al grupo de Vicente Andrés, por acogerme, apoyarme y enseñarme tanto. He tenido la suerte
de compartir estos años de trabajo con excelentes personas. Gracias a María Jesús por sus genotipados
que hacen posible el trabajo del resto del grupo. Gracias a Pilar por sus sabios consejos y charlas desde
la poyata. Gracias a Magda por contestar todas mis dudas y por ofrecerme siempre sus buenísimos
chocolates polacos. Gracias también a Bea por sus consejos y ayuda. Gracias a Álvaro por su apoyo, su
alegría, sus chistes y sus cánticos; irradias felicidad y eso genera un gran ambiente de trabajo, gracias.
Gracias también a mis compis de tesis: a Alberto, por ayudarme día a día con cada duda del labo, y por
sus malas apuestas que tres veces nos llevaron a La Chalana; a Amanda, por su amistad aunque casi algo
más jaja, y por sus clases de patinaje; a Víctor por sus interminables charlas científicas casi filosóficas,
y su especial sentido del humor; y a mi cordobesa favorita, Rosa. Contigo he compartido menos tiempo
en el labo, pero has sido la mejor compañera de ordenador (porque siempre estabas jaja). Ahora en serio,
gracias por escucharme, por aconsejarme, por tus dudas que también me hicieron aprender, por tu
constante sonrisa, y por tu palabrerío andaluz que me tanto me hizo reír. Gracias también a Lara, Cris
Rius, Elba, Cris González, Ana, Lara, Yazan, y Pedro. Gracias a Javi por todos los momentos de cafés,
comidas o desayunos; sabes hacer desaparecer las preocupaciones del trabajo, con tus conversaciones
que aunque algo escatológicas, resultan divertidas. También quiero agradecer a “las compis de enfrente”,
Rocío y Ana Marcos, por todas las conversaciones y momentos compartidos. Y a mí querida Irenita
claro. Gracias por tu dulzura, tu apoyo y comprensión, tu compañía de cada día, tus detalles de cumple,
por nuestros desayunos de pan con chocolate que tan buenos recuerdos me traían y traerán, y en
definitiva, por cada momento. De ti me llevo una gran amistad.

2 AGRADECIMIENTOS
Gracias también a Francisco Sánchez Madrid, por darme la oportunidad de formar parte de sus
labmeetings y acogerme en su laboratorio del CNIC. Ha sido una gran experiencia profesional vivir ese
ambiente de excelencia científica. Sois científicos brillantes y muy trabajadores, y ha sido un placer
trabajar a vuestro lado. Gracias a Laura especialmente, por toda su ayuda y consejos, y por nuestras
conversaciones para curar la IBD y la ansiedad al mismo tiempo.
Gracias a Jesús Vázquez y a Juan Antonio López de la unidad de Proteómica del CNIC, por llevar a
cabo el ensayo experimental y resolver todas mis dudas durante nuestra colaboración científica. Gracias
también a todo el personal de las Unidades de Celómica, Microscopía, Animalario, Cultivos Celulares,
Vectores Virales, y Genómica, pues me ayudaron en múltiples ocasiones.
También tengo que agradecer muchísimo a Philippe Collas, por abrirme las puertas de su laboratorio
en Oslo, y hacerme pasar una de las mejores experiencias profesionales y personales de mi vida. Gracias
por hacerme sentir como en casa, por su tiempo invertido en mi proyecto, y por valorar tanto mí trabajo.
Nunca antes me habían hecho sentir tan valorada profesionalmente, y gracias a ello, aprendí a creer más
en mí y en casa cosa que hago. Gracias también a Kristin y a Anita, por enseñarme tanto y ser tan
amables conmigo desde el día que llegué. También gracias al resto de compañeros que me ayudaron en
cada duda y en cada momento que lo necesité (Tarvesh, Nolwenn, Cohen, Erwan, Inwasti, Frida,
Torunn, Sumithra, Annael, Marie-Odile, and Jonas). Y muchas gracias a Anna, por ser mi amiga y
compañera desde mi primer día en Oslo. Lo expresaré también en inglés para que ellos puedan
entenderme mejor:
I also want to thank Philippe Collas for opening me the doors of his laboratory in Oslo, and give me
one of the best professional and personal experiences of my life. Thank you for making me feel at home,
for your time invested in my project, and for valuing my work so much. Before of my stay there, I had
never felt myself so professionally valued, and thanks to that, now I believe more in myself and my
work. Thanks also to Kristin and Anita for teaching me so much, and being so kind with me from the
day I arrived. Also thanks to the rest of my colleagues who helped me in every doubt and in every
moment I needed it (Tarvesh, Nolwenn, Cohen, Erwan, Inwasti, Frida, Torunn, Sumithra, Annael,
Marie-Odile, and Jonas). And thanks off course to Anna, for being my friend and partner from the
moment I arrived in Oslo.
Además me gustaría hacer una mención especial a mis tíos, Marisa y José Ramón. Gracias Marisa
por introducirme en el mundo científico, no sé si ha sido tu figura profesional o la genética lo que me
ha impulsado a trabajar en esto, pero sin duda sé que has sido uno de los factores responsables de que
haya llegado hasta aquí. Gracias a los dos por guiarme, escucharme, y ayudarme siempre que lo he
necesitado. Es un privilegio contar con vuestro apoyo, y me siento muy afortunada de teneros como
referente científico. Suponéis para mí un gran modelo profesional a seguir.

3 AGRADECIMIENTOS
Por otro lado, quiero nombrar a las personas que han compartido cada momento de mi vida
profesional y personal, y que han hecho posible que yo llegara hasta aquí. Gracias a mis padres, por
apoyarme en cada uno de los pasos que he dado, por vuestra paciencia, y por saberme llevar, que, a
veces, no es nada fácil. Gracias a mi padre por insistir tanto en que estudiara y me esforzara, gracias a
ello aprendí que el conocimiento es una de las llaves que llevan a alcanzar el sentido de la vida y la
felicidad. Gracias a mi madre por creer siempre en mí, por cada palabra de ánimo, y por hacer
desaparecer muchas veces mis nervios, miedos e inseguridades. Has sido y eres, mi amiga incondicional,
mi apoyo, y la mejor madre que podría desear. Gracias igualmente a mi hermano, por todo su cariño y
admiración que me animan a creer más en mí. Gracias por tu sentido del humor, así como por tu
positivismo y filosofía de vida, que tanto me han ayudado y me ayudan. Ojalá acabe algún día siendo
un poquito como tú, aunque me conformo con seguir de cerca esa pasión que pones en cada cosa que
haces, ya que me suscita afán de superación. Gracias a mi abuela “Cachi”, por enseñarme que el
conocimiento es la llave de la independencia y la libertad, y que en la vida debemos perseguir nuestros
sueños. Gracias también al resto de mi familia y amigos/as, que de una manera u otra me han regalado
miles de palabras de apoyo y momentos de felicidad durante estos años.
Por último, pero para nada menos importante, gracias a Salva. Gracias por completar mi vida. Me
aportas tanto cada día que me resulta muy complicado expresar en unas pocas líneas, todo lo que supones
para mi vida personal y profesional. Desde que te conozco te admiro y eres mi modelo a seguir en
muchas facetas de la vida. Gracias a ello y a tu apoyo, sé que sin ti, no podría haber llevado igual este
duro, aunque apasionante trabajo. Me impulsas a trabajar con tesón, a ser constante y no tan nerviosa, a
poner lo mejor de mí en cada cosa, a ser menos impaciente y más segura de mí misma, a controlar mis
impulsos, y en definitiva, a disfrutar más de cada experiencia de la vida. Por eso, jamás podré llegar a
agradecerte todo tu apoyo. Gracias por ser mi compañero de aventuras y enseñarme que, creer en uno
mismo y ser feliz, son la clave del éxito.
Gracias a todos por estos casi 4 años, pues han sido, sin duda, inolvidables.

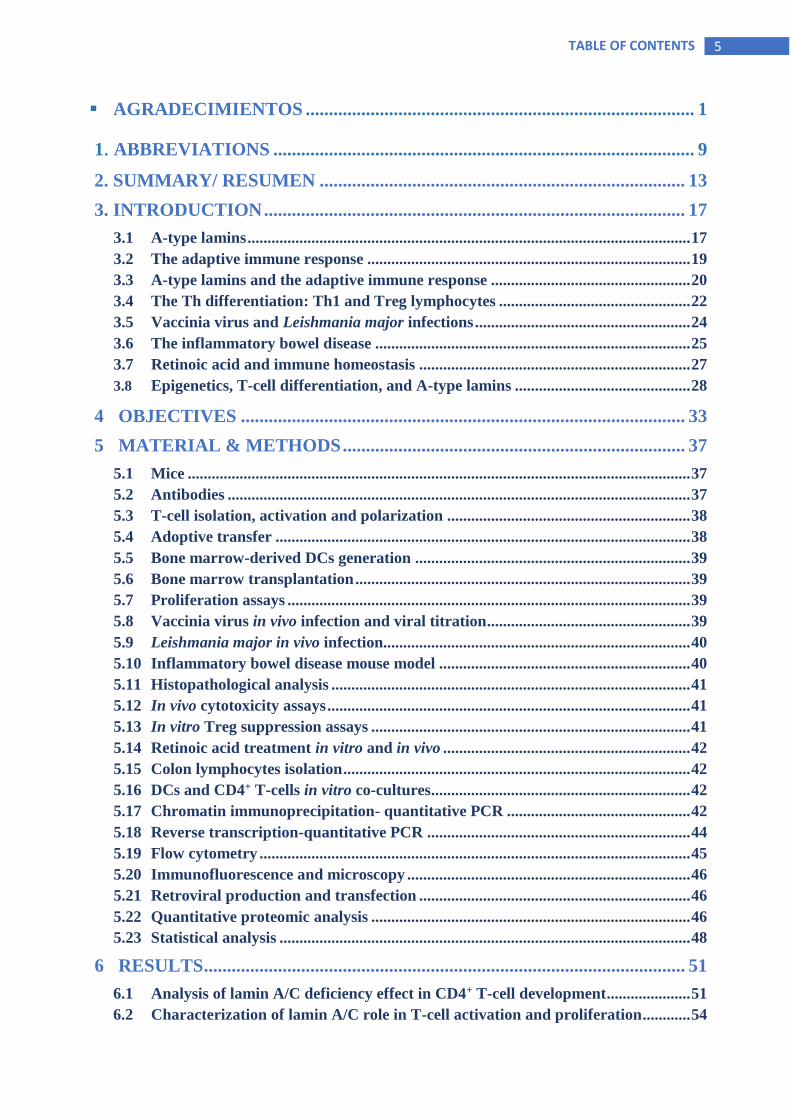
TABLE OF CONTENTS 5
AGRADECIMIENTOS .................................................................................... 1
1. ABBREVIATIONS ........................................................................................... 9
2. SUMMARY/ RESUMEN ............................................................................... 13
3. INTRODUCTION ........................................................................................... 17
3.1 A-type lamins ............................................................................................................... 17
3.2 The adaptive immune response ................................................................................. 19
3.3 A-type lamins and the adaptive immune response .................................................. 20
3.4 The Th differentiation: Th1 and Treg lymphocytes ................................................ 22
3.5 Vaccinia virus and Leishmania major infections ...................................................... 24
3.6 The inflammatory bowel disease ............................................................................... 25
3.7 Retinoic acid and immune homeostasis .................................................................... 27
3.8 Epigenetics, T-cell differentiation, and A-type lamins ............................................ 28
4 OBJECTIVES ................................................................................................ 33
5 MATERIAL & METHODS .......................................................................... 37
5.1 Mice .............................................................................................................................. 37
5.2 Antibodies .................................................................................................................... 37
5.3 T-cell isolation, activation and polarization ............................................................. 38
5.4 Adoptive transfer ........................................................................................................ 38
5.5 Bone marrow-derived DCs generation ..................................................................... 39
5.6 Bone marrow transplantation .................................................................................... 39
5.7 Proliferation assays ..................................................................................................... 39
5.8 Vaccinia virus in vivo infection and viral titration ................................................... 39
5.9 Leishmania major in vivo infection............................................................................. 40
5.10 Inflammatory bowel disease mouse model ............................................................... 40
5.11 Histopathological analysis .......................................................................................... 41
5.12 In vivo cytotoxicity assays ........................................................................................... 41
5.13 In vitro Treg suppression assays ................................................................................ 41
5.14 Retinoic acid treatment in vitro and in vivo .............................................................. 42
5.15 Colon lymphocytes isolation ....................................................................................... 42
5.16 DCs and CD4+ T-cells in vitro co-cultures................................................................. 42
5.17 Chromatin immunoprecipitation- quantitative PCR .............................................. 42
5.18 Reverse transcription-quantitative PCR .................................................................. 44
5.19 Flow cytometry ............................................................................................................ 45
5.20 Immunofluorescence and microscopy ....................................................................... 46
5.21 Retroviral production and transfection .................................................................... 46
5.22 Quantitative proteomic analysis ................................................................................ 46
5.23 Statistical analysis ....................................................................................................... 48
6 RESULTS ........................................................................................................ 51
6.1 Analysis of lamin A/C deficiency effect in CD4+ T-cell development ..................... 51
6.2 Characterization of lamin A/C role in T-cell activation and proliferation ............ 54

6 TABLE OF CONTENTS
6.2.1 Lamin A/C enhances T-cell activation in vitro and in vivo ............................................... 54
6.2.2 Lamin A/C deficient naïve CD4+ T-cells display normal early TCR-dependent signaling
in contrast to lamin A/C-expressing activated CD4+ T-cells ............................................. 56
6.2.3 Lamin A/C deficient CD4+ T-cells exhibit standard T-cell proliferation .......................... 57
6.3 Analysis of lamin A/C role in Th1 differentiation and effector function ............... 58
6.3.1 Lamin A/C regulates Th1 differentiation in vitro ............................................................. 58
6.3.2 Lamin A/C enhances Th1 responses in vivo ..................................................................... 59
6.3.3 Lamin A/C enhances T-bet expression ............................................................................. 63
6.3.4 Quantitative proteomic assays reveals that lamin A/C modifies the expression of several
epigenetic enzymes ........................................................................................................... 65
6.3.5 Lamin A/C upregulates H3K4me1 epigenetic modification in Cd69 and Tbet promoters
........................................................................................................................................... 66
6.3.6 Lamin A/C regulates Th1 immunity against pathogen infection ...................................... 67
6.3.7 Lamin A/C enhances cytotoxic capacity of CD4+ T-cells................................................. 69
6.4 Analysis of lamin A/C role in Treg polarization and suppressive function ........... 71
6.4.1 Lamin A/C deficiency in CD4+ T-cells enhances Treg differentiation in vitro ................. 71
6.4.2 Lamin A/C overexpression in CD4+ T-cells impairs Treg differentiation ........................ 72
6.4.3 Lamin A/C controls Foxp3 expression but does not modulate it epigenetically ............... 73
6.4.4 Lamin A/C mediates Treg and Th1differentiation in IBD mice model ............................ 74
6.4.5 Lamin A/C deficiency in CD4+ T-cells protects against IBD development ...................... 76
6.4.6 Lamin A/C deficiency in CD4+ T-cells confers greater Treg suppressive function .......... 79
6.5 Study of the physiological mechanism that regulates lamin A/C expression in
CD4+ T-cells upon antigen recognition .................................................................... 81
6.5.1 Retinoic acid downregulates lamin A/C expression in CD4+ T-cells ............................... 81
6.5.2 Retinoic acid-producing CD103+ DCs regulate physiologically lamin A/C expression in
CD4+ T-cells ...................................................................................................................... 83
6.5.3 Retinoic acid and lamin A/C deficiency in CD4+ T-cells enhance Treg differentiation in
vitro ................................................................................................................................... 84
6.5.4 Lamin A/C deficiency in CD4+ T-cells enhances Treg differentiation and protects from
IBD development at similar levels than retinoic acid treatment ....................................... 85
7. DISCUSSION................................................................................................... 89
7.1 Lamin A/C and T-cell development .......................................................................... 89
7.2 Lamin A/C in T-cell activation and proliferation .................................................... 89
7.3 Lamin A/C and Th1 response .................................................................................... 91
7.5 Lamin A/C and Treg response ................................................................................... 96
7.6 Physiological regulation of lamin A/C by retinoic acid ........................................... 99
7.7 Proposed model ......................................................................................................... 101
7.7 Final recapitulation and future perspectives .......................................................... 103
8. CONCLUSIONS/ CONCLUSIONES ......................................................... 107
9. REFERENCES .............................................................................................. 111
9.1 Journal articles .......................................................................................................... 111
9.2 Books .......................................................................................................................... 129
9.3 Web pages .................................................................................................................. 129
10. ANNEXES. ................................................................................................... 133

Abbreviations

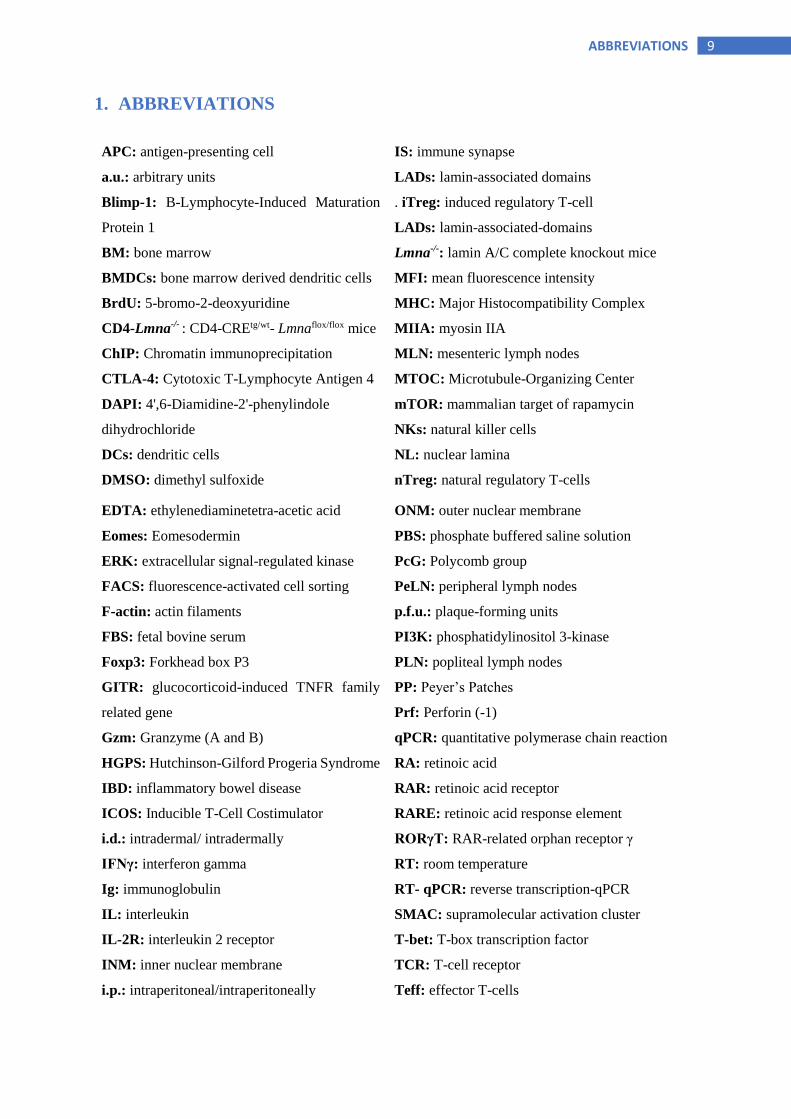
ABBREVIATIONS 9
1. ABBREVIATIONS
APC: antigen-presenting cell IS: immune synapse
a.u.: arbitrary units LADs: lamin-associated domains
Blimp-1: B-Lymphocyte-Induced Maturation
Protein 1
BM: bone marrow
. iTreg: induced regulatory T-cell
LADs: lamin-associated-domains
Lmna-/-: lamin A/C complete knockout mice
BMDCs: bone marrow derived dendritic cells MFI: mean fluorescence intensity
BrdU: 5-bromo-2-deoxyuridine
CD4-Lmna-/- : CD4-CREtg/wt- Lmnaflox/flox mice
MHC: Major Histocompatibility Complex
MIIA: myosin IIA
ChIP: Chromatin immunoprecipitation MLN: mesenteric lymph nodes
CTLA-4: Cytotoxic T-Lymphocyte Antigen 4 MTOC: Microtubule-Organizing Center
DAPI: 4',6-Diamidine-2'-phenylindole
dihydrochloride
mTOR: mammalian target of rapamycin
NKs: natural killer cells
DCs: dendritic cells NL: nuclear lamina
DMSO: dimethyl sulfoxide nTreg: natural regulatory T-cells
EDTA: ethylenediaminetetra-acetic acid ONM: outer nuclear membrane
Eomes: Eomesodermin PBS: phosphate buffered saline solution
ERK: extracellular signal-regulated kinase PcG: Polycomb group
FACS: fluorescence-activated cell sorting PeLN: peripheral lymph nodes
F-actin: actin filaments p.f.u.: plaque-forming units
FBS: fetal bovine serum PI3K: phosphatidylinositol 3-kinase
Foxp3: Forkhead box P3 PLN: popliteal lymph nodes
GITR: glucocorticoid-induced TNFR family
related gene
PP: Peyer’s Patches
Prf: Perforin (-1)
Gzm: Granzyme (A and B) qPCR: quantitative polymerase chain reaction
HGPS: Hutchinson-Gilford Progeria Syndrome RA: retinoic acid
IBD: inflammatory bowel disease RAR: retinoic acid receptor
ICOS: Inducible T-Cell Costimulator RARE: retinoic acid response element
i.d.: intradermal/ intradermally RORγT: RAR-related orphan receptor γ
IFNγ: interferon gamma RT: room temperature
Ig: immunoglobulin RT- qPCR: reverse transcription-qPCR
IL: interleukin SMAC: supramolecular activation cluster
IL-2R: interleukin 2 receptor T-bet: T-box transcription factor
INM: inner nuclear membrane TCR: T-cell receptor
i.p.: intraperitoneal/intraperitoneally Teff: effector T-cells

10 ABBREVIATIONS
TF: transcription factor
TGFβ: Transforming Growth Factor β
Th: T-helper
Treg: T-regulatory
Tr1: regulatory T-cells 1
TSS: transcription starting site
VACV: Vaccinia virus
WT: wild type

Summary/ Resumen

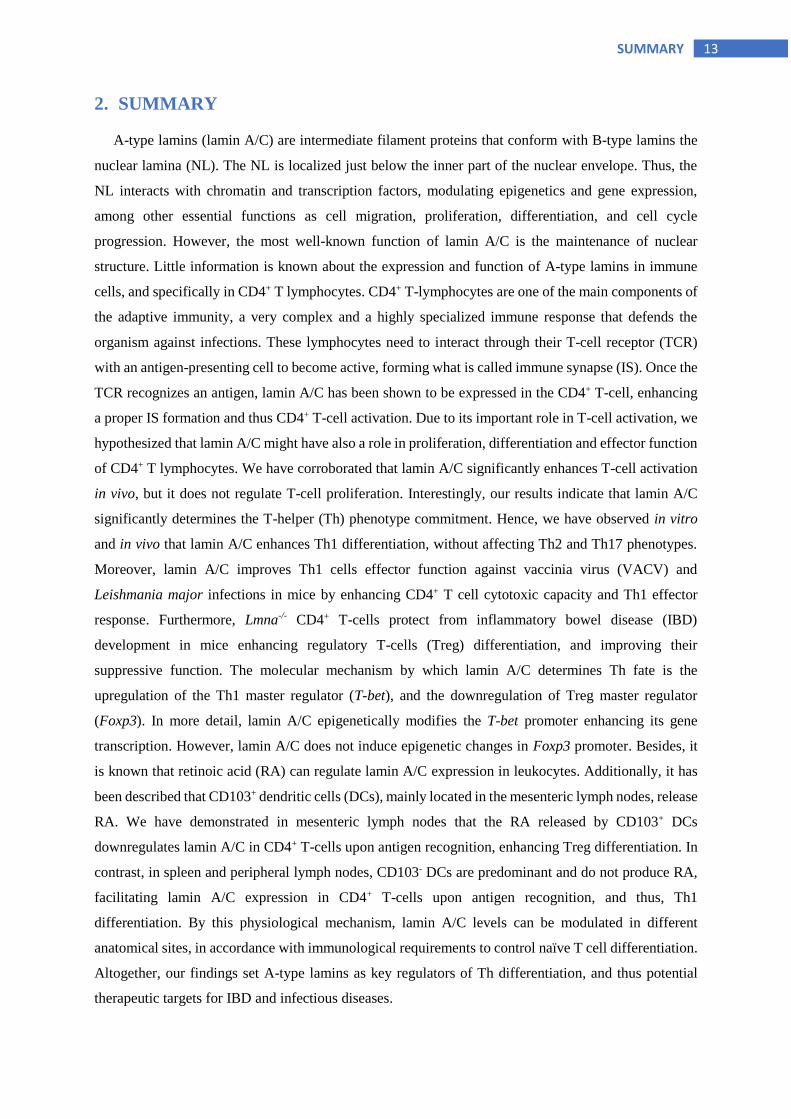
13 SUMMARY
2. SUMMARY
A-type lamins (lamin A/C) are intermediate filament proteins that conform with B-type lamins the
nuclear lamina (NL). The NL is localized just below the inner part of the nuclear envelope. Thus, the
NL interacts with chromatin and transcription factors, modulating epigenetics and gene expression,
among other essential functions as cell migration, proliferation, differentiation, and cell cycle
progression. However, the most well-known function of lamin A/C is the maintenance of nuclear
structure. Little information is known about the expression and function of A-type lamins in immune
cells, and specifically in CD4+ T lymphocytes. CD4+ T-lymphocytes are one of the main components of
the adaptive immunity, a very complex and a highly specialized immune response that defends the
organism against infections. These lymphocytes need to interact through their T-cell receptor (TCR)
with an antigen-presenting cell to become active, forming what is called immune synapse (IS). Once the
TCR recognizes an antigen, lamin A/C has been shown to be expressed in the CD4+ T-cell, enhancing
a proper IS formation and thus CD4+ T-cell activation. Due to its important role in T-cell activation, we
hypothesized that lamin A/C might have also a role in proliferation, differentiation and effector function
of CD4+ T lymphocytes. We have corroborated that lamin A/C significantly enhances T-cell activation
in vivo, but it does not regulate T-cell proliferation. Interestingly, our results indicate that lamin A/C
significantly determines the T-helper (Th) phenotype commitment. Hence, we have observed in vitro
and in vivo that lamin A/C enhances Th1 differentiation, without affecting Th2 and Th17 phenotypes.
Moreover, lamin A/C improves Th1 cells effector function against vaccinia virus (VACV) and
Leishmania major infections in mice by enhancing CD4+ T cell cytotoxic capacity and Th1 effector
response. Furthermore, Lmna-/- CD4+ T-cells protect from inflammatory bowel disease (IBD)
development in mice enhancing regulatory T-cells (Treg) differentiation, and improving their
suppressive function. The molecular mechanism by which lamin A/C determines Th fate is the
upregulation of the Th1 master regulator (T-bet), and the downregulation of Treg master regulator
(Foxp3). In more detail, lamin A/C epigenetically modifies the T-bet promoter enhancing its gene
transcription. However, lamin A/C does not induce epigenetic changes in Foxp3 promoter. Besides, it
is known that retinoic acid (RA) can regulate lamin A/C expression in leukocytes. Additionally, it has
been described that CD103+ dendritic cells (DCs), mainly located in the mesenteric lymph nodes, release
RA. We have demonstrated in mesenteric lymph nodes that the RA released by CD103+ DCs
downregulates lamin A/C in CD4+ T-cells upon antigen recognition, enhancing Treg differentiation. In
contrast, in spleen and peripheral lymph nodes, CD103- DCs are predominant and do not produce RA,
facilitating lamin A/C expression in CD4+ T-cells upon antigen recognition, and thus, Th1
differentiation. By this physiological mechanism, lamin A/C levels can be modulated in different
anatomical sites, in accordance with immunological requirements to control naïve T cell differentiation.
Altogether, our findings set A-type lamins as key regulators of Th differentiation, and thus potential
therapeutic targets for IBD and infectious diseases.

14 RESUMEN
RESUMEN
Las laminas de tipo A (lamina A/C) son filamentos intermedios que forman, junto a las laminas de
tipo B, la lamina nuclear (LN). La LN se localiza en la cara interna de la envoltura nuclear,
interaccionando con la cromatina y factores de transcripción, y modulando la epigenética y expresión
génica entre otras funciones esenciales como migración, proliferación, diferenciación, y progresión del
ciclo celular. Sin embargo, la función más conocida de la lamina A/C, es mantener la estructura nuclear.
La expresión y función de las laminas de tipo A en células inmunes, y más específicamente en los
linfocitos T CD4+, es bastante desconocida. Los linfocitos T CD4+, son componentes principales de la
inmunidad adaptativa, respuesta inmune compleja y muy especializada que defiende a nuestro
organismo frente a infecciones, e interviene en procesos inflamatorios y enfermedades autoinmunes.
Estos linfocitos, necesitan interaccionar mediante el receptor de células T (TCR) con la célula
presentadora de antígeno formando la sinapsis inmune (IS), para pasar así al estado activo. Una vez que
se produce el reconocimiento antigénico, se expresa la lamina A/C en el linfocito CD4+, facilitando la
formación de la IS y su activación. Debido a su importante papel en la activación de células T,
hipotetizamos que la lamina A/C debía tener un papel en la proliferación, diferenciación, y función
efectora de los linfocitos T. Hemos corroborado que la lamina A/C facilita la activación de la célula T
en modelos in vivo, pero no regula su proliferación. Nuestros resultados indican que la lamina A/C
modifica significativamente el compromiso fenotípico Th. Así, hemos observado in vitro e in vivo que
la lamina A/C facilita la diferenciación a Th1, sin afectar a la diferenciación hacia los fenotipos Th2 y
Th17. Igualmente, la lamina A/C mejora la función Th1 frente a infecciones por el virus vacuna y
Leishmania major en ratón. A su vez, hemos observado que las células T CD4+ Lmna-/- protegen de la
enfermedad inflamatoria intestinal (IBD) en ratón, facilitando la diferenciación de células Treg, y
mejorando su función supresora. El mecanismo molecular por el que la lamina A/C determina el destino
de las células T, es aumentando la expresión del factor de transcripción regulador de los linfocitos Th1
(T-bet) mediante modificaciones epigenéticas, y disminuyendo la del factor de transcripción regulador
de las Treg (Foxp3). Por otro lado, es sabido que el ácido retinoico (RA) puede regular la expresión de
la lamina A/C. Asimismo, se conoce que las células dendríticas (DCs) CD103+, mayoritariamente
localizadas en el intestino, son capaces de producir RA. Nosotros hemos demostrado que el RA liberado
por las DCs CD103+ del intestino en el momento del reconocimiento antigénico, disminuye la expresión
de lamina A/C en los linfocitos CD4+, facilitando así, la diferenciación hacia células Treg. Sin embargo,
en el bazo y ganglios periféricos predominan las DCs CD103- que no producen RA, lo que permite
mayor expresión de lamina A/C en los linfocitos CD4+, y promueve la diferenciación de las células T
CD4+ naïve hacia Th1. Por tanto, este parece ser un mecanismo fisiológico por el cual se regulan los
niveles de lamina A/C en el organismo para regular la diferenciación del linfocito T. En definitiva,
nuestros estudios sitúan a las laminas de tipo A como reguladores clave de la diferenciación Th, siendo
dianas terapéuticas en potencia para el tratamiento de la IBD y enfermedades infecciosas.

Introduction


17 INTRODUCTION
3. INTRODUCTION
3.1. A-type lamins.
The DNA is compartmentalized in the nucleus of the mammalian cell and separated from the
cytoplasm by the nuclear envelope. The nuclear envelope is a complex structure composed by two
membranes, the outer- (ONM) and the inner-nuclear membrane (INM). Just at the internal layer of the
INM, is where is located the nuclear lamina (NL) (Figure 1) (Hetzer M.W., 2010).
The main components of the NL are the lamins, intermediate-filament-proteins (IFPs) classified as
type V. These type V-IFPs are characterized by a nuclear localization signal (NLS), which labels these
proteins to be imported to the nucleus (Dechat T. et al, 2010). The lamins are classified in two groups:
A-type and B-type lamins. A-type lamins are expressed in differentiated cells, and are codified by an
unique gene (LMNA) that suffers an alternative splicing generating two transcripts: lamin A and lamin
C (Figure 2). Therefore, it is very common to call them jointly as lamin A/C (from now on). On the
other hand, B-type lamins are three ubiquitous IFPs that arise from two different genes: LMNB1, coding
for lamin B1, and LMNB2, coding for lamin B2 and B3 (Moir R.D. et al, 2000). These lamins are part
of the nucleoskeleton, but also interact with the cytoskeleton through nesprins and SUN domain proteins
Figure 1. NL localization in the mammalian nucleus. The nuclear envelope defines the nucleus in the
mammalian cell, separating the DNA from the cytoplasm components. It consists in two membranes, the ONM
and the INM, and the space in between called the perinuclear space. The ONM is contiguous with the rough
endoplasmic reticulum and is covered by ribosomes. In the internal part of the INM is where is located the NL,
interacting with the chromatin and TFs, as well as with the nuclear pore complexes (modified from Maidment
S.L. & Ellis J.A., 2002).
18 INTRODUCTION
forming all together the LINC (linker of nucleoskeleton and cytoskeleton) complex. So that, the most
well-known function of lamins is the maintenance of nuclear architecture, regulating also cell processes
as proliferation, migration, and differentiation (Schirmer E.C. & Foisner R., 2007). In addition, lamins
also interact with the nuclear pores complexes modulating molecular trafficking between cytoplasm and
nucleus. Moreover, lamins also interact with chromatin and transcription factors (TFs), acting as a
scaffold, modulating chromatin organization and epigenetic changes, and therefore, gene transcription
(Figure 1). These last features determines the great importance of the NL in cell biology, although it
has other essential functions as DNA synthesis and repair, signal transduction and cell cycle progression
(Andrés V. & González J.M., 2009).
There is little information about the regulation of LMNA expression. It has been described that
retinoic acid (RA), the acid form of vitamin A, can control lamin A/C expression. Lebel S. et al reported
in 1987, that RA induced lamin A/C expression in mouse embryonic carcinoma cells. However, Olins
A.L. et al published in 2001, that RA downregulates lamin A/C in the leukemic cell line HL-60. RA is
a potent regulator of cell proliferation and differentiation, being essential in embryonic development. It
acts through nuclear retinoic acid receptors known as RARα, RARβ, and RARγ. These RAR are bound
to DNA and retinoic X receptors (RXRα, RXRβ, and RXRγ) forming heterodimers that work as
transcriptional regulators (Germain P. et al, 2006). This regulatory regions in the DNA are called RA
response elements (RAREs). Interestingly, it has been described a RARE in the LMNA promoter
(Okumura K. et al, 2000). Therefore, RA seems to regulate LMNA transcription. Even though it has
been reported that A-type lamins also modulate the RA pathway, regulating RARγ nuclear translocation.
Moreover, lamin A/C transcription is mechano-regulated depending on the tissue stress and matrix
stiffness (Philip J.T. & Dahl K.N., 2008; Swift J. et al, 2013). Thus, LMNA expression is a complex
process that depends on the tissue environment, and in which RA seems to have an important role (Swift
J. et al, 2013). Hence, more research is needed to further decipher lamin A/C and RA feedback in
different cell-types and tissue environments.
Additionally, the research in A-type lamins has been quite relevant due to the discovery of several
spontaneous mutations in LMNA gen that cause mono-genetic rare diseases, some of them with similar
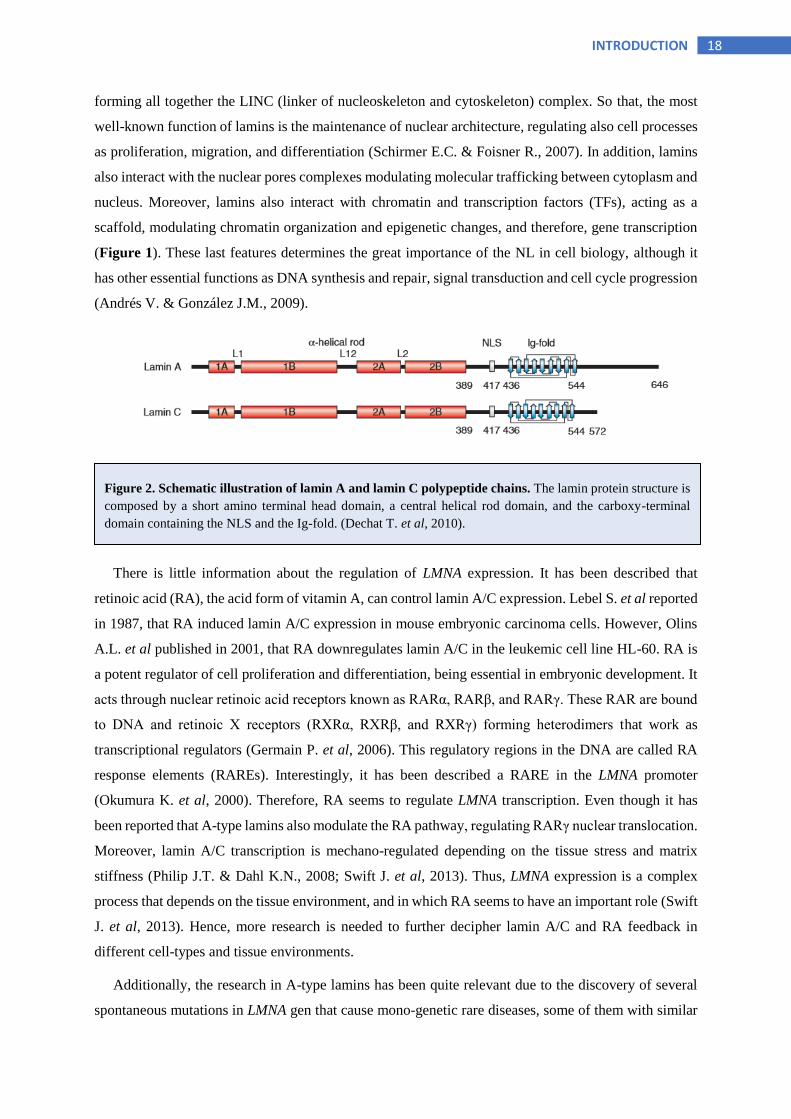
Figure 2. Schematic illustration of lamin A and lamin C polypeptide chains. The lamin protein structure is
composed by a short amino terminal head domain, a central helical rod domain, and the carboxy-terminal
domain containing the NLS and the Ig-fold. (Dechat T. et al, 2010).

19 INTRODUCTION
pathologic features: lipodystrophy, skeletal and muscular dystrophy, and dilated cardiomyopathy. For
this reason, almost all the scientific research related with lamin A/C is focused in the study of A-type
lamins in adipocytes (Lund E. & Collas P, 2013), stem cells (Espada J. et al, 2008; Dechat T. et al,
2010), cardiomyocytes (Afilalo J. et al, 2007), osteoblasts and muscle cells (Duque G. & Rivas D., 2006;
Akter R. et al, 2009; Rauner M. et al, 2009). Many of these disorders are commonly known as
laminopathies (Worman H.J., 2012). One of the most studied, is the Hutchinson-Gilford Progeria
Syndrome (HGPS), a premature aging disease that cause the death in children of only 14 years of age
(Merideth M.A. et al, 2008). Only one laminopathy has been reported with an immunologic defective
phenotype. This laminopathy is known as Pelger-Hüet anomaly and is characterized by a defect in
neutrophil differentiation because of mutations in lamin B receptor gene (LBR) (Worman H.J. & Bonnè
G., 2007). In addition, it has been described the repression of lamin A/C gene in B-cell lymphomas,
acute lymphoblastic leukemia, and non-Hodgkin’s lymphoma (Agrelo R. et al, 2005; Stadelmann B. et
al, 1990). Apart from these, there are few publications relating lamin A/C and immune cells. Hence, the
role and the molecular mechanism that regulate the expression of lamin A/C in the immune system are
poorly understood.
3.2. The adaptive immune response.
The immune system comprises many different cell types and biological processes to protect the
organism against infections and diseases. These cell types and processes are classified in two types of
immune response: the innate and the adaptive immunity. The innate immunity is a generic response that
provides a rapid defense against pathogens or harmful circumstances for the body. On the other hand,
the adaptive immunity is a highly specific immune response, composed by complex mechanisms that
try to maintain the health state in the organism. The lymphocytes are main components of the adaptive
immune response. B-lymphocytes carry out the humoral response producing antibodies against
pathogens, and T-lymphocytes play the cell-mediated response (Delves P.J & Roitt I.M., 2000) (Figure
3).
To become active, naïve T-lymphocytes need to recognize through the TCR a peptide-charged MHC
of an antigen-presenting cell (APC), forming what is called the immune synapse (IS). The IS is a
transient cell-to-cell communication structure formed by a central supramolecular activation cluster
(cSMAC) that contains the TCR and associated molecules. This cSMAC is surrounded by the peripheral
SMAC (pSMAC) composed by adhesion molecules as integrins. Furthermore, there is a distal SMAC
(dSMAC) surrounding the latter, which contains phosphatases that can act as inhibitors of the IS
formation (Davis S.J. & van der Merwe P.A., 2006). The IS takes place in secondary lymphoid organs,
where activated APCs migrate to interact with the lymphocytes. Once this interaction has been
performed, T-cells will proliferate and differentiate towards different T-helper (Th) phenotypes in the
case of CD4+ T-lymphocytes, or towards a cytotoxic phenotype in the case of CD8+ T-lymphocytes
(Delves P.J. & Roitt I.M., 2000) (Figure 3). Th cells are called helpers because they promote B-cell

20 INTRODUCTION
antibody production and they are also required for the generation of cytotoxic response of CD8+ T-cells.
Moreover, CD4+ T-cells control the expansion and recruitment of other components of the innate
immune response. CD4+ T-cells can be considered the main guardians of the correct behavior of immune
system (Zhu J. et al, 2010).
3.3. A-type lamins and the adaptive immune response.
The role of A-type lamins in the immune system has been poorly studied. The few studies published
about this topic before 2014, mainly report the lack of lamin A/C or a low expression in hematopoietic
cells and CD4+ T-cells (Guilly M.N. et al, 1987; Paulin-Levasseur M. et al, 1988; Guilly M.N. et al,
1990; Rober R.A. et al, 1990). However, since 2014, and thanks to J.M. González-Granado and
collaborators work, it is known that lamin A/C is transiently expressed in mouse and human CD4+ T-
cells upon TCR-dependent antigen recognition. Therefore, the expression of lamin A/C is promoted by
TCR activation, and it lasts for 3 days since antigen-recognition in CD4+ T-cells. This study describes
also the importance of lamin A/C in CD4+ T-cell activation by the upregulation of CD69 and CD25 (IL-
2R). Moreover, the lamin A/C modulates the IS dynamics, controlling the timing and the proper
conformation of the interaction with the APC. CD4+ T-cells lacking lamin A/C barely interact with
APCs, having smaller cSMAC diameters and reduced numbers of CD3-containing microclusters at the
Figure 3. Components of the immune system. The innate immunity is the first line of defense against
pathogens and is composed by several types of cells: granulocytes (basophils, eosinophils, and neutrophils),
DCs, macrophages, natural killer cells (NKs), mast cells and soluble factors as complement proteins. The
adaptive immunity acts later but in a more specific manner. It consists in CD4+ T-cells and CD8+ T-cells,
which compose the cellular response, and B-cells that are in charge of antibody production. NKs and γδ T-
cells are cytotoxic cells in the middle of innate and adaptive immunity (Dranoff G. et al, 2004).

21 INTRODUCTION
membrane contact area, compared with lamin A/C expressing T-cells. Furthermore, these lamin A/C-
dependent differences in T-cell activation are related also with changes in actin filaments (F-actin)
polymerization, and microtubule-organizing center (MTOC) translocation towards the IS. All these
processes are accompanied by changes in TCR signaling with increased amounts of phosphorylated
Vav1, myosin IIA (MIIA), and extracellular signal-regulated kinase 1 (ERK1) and ERK2 (ERK1/2) in
lamin A/C expressing T-cells (González-Granado J.M. et al, 2014). Therefore, the lamin A/C transient
expression in CD4+ T-cells upon antigen recognition is not a random event. On the contrary, it is an
essential step that rigorously coordinate the complex process of T-cell activation (Figure 4).
Figure 4. Lamin A/C modulates key points of TCR-dependent T-cell activation. Lamin A/C promotes an
increase in TCR/CD3 clusters at the cSMAC of the IS, promoting the phosphorylation of downstream
molecular targets as: ZAP-70 (ζ-Chain-associated protein of 70 kD), LAT (linker of activated T cells), SLP-
76 (SH2 domain-containing leukocyte protein of 76 kD), MIIA, and PLCγ1 (Phospholipase C gamma 1)
which enhances MTOC polarization towards the IS. A-type lamins also induce VAV-1 phosphorilation,
favoring the F-actin polymerization, a fundamental step in IS. Besides, lamin A/C enhances the membrane
expression of T-cell activation markers as CD69 and CD25 (IL-2R), depending on ERK1/2 phosphorylation
(Rocha-Perugini V. & González-Granado J.M., 2014).

22 INTRODUCTION
3.4. The Th differentiation: Th1 and Treg lymphocytes.
The Th differentiation depends on a strict program of signals that naïve CD4+ T-lymphocytes receive
from the microenvironment, among other factors. These signals are cytokines, growth factors, and
molecules released by DCs in the moment of the IS formation, which initiate downstream signaling
cascades responsible of the Th fate. The most studied effector CD4+ T-lymphocytes, have been Th1,
Th2, and Th17 phenotypes, controlling specific responses against different types of infections and
autoimmune diseases (Nakayama T. & Yamashita M., 2010). The interleukin (IL)-12 is the main
cytokine that promote Th1 differentiation inducing the expression of T-box transcription factor (T-bet).
T-bet is the master regulator of Th differentiation, enhancing interferon gamma (IFNγ) production, and
suppressing the development of Th2 and Th17 cells by the inhibition of GATA3 and RORγt respectively
(Figure 5). Other important TFs in the regulation of Th1 development are STAT1, STAT4, Eomes,
Runx3, and Hlx. (Luckheeram R.V. et al, 2012). Once T-cells are differentiated into Th1, they will carry
out their effector function. Th1 lymphocytes are responsible of the defense against intracellular
pathogens infections and of some autoimmune diseases. The majority of CD4+ T-cells that are generated
in response to viral infections are Th1-type and produce large amounts of IFNγ and express T-bet, as
vaccinia virus (VACV) infection (Matsui M. et al, 2005). In addition, Th1 cells are implicated in the
regulation of bacterial infections and other intracellular pathogens as the protozoon Leishmania major,
which strongly promotes a Th1 specific response (Biedermann T. et al, 2001). Furthermore, Th1
lymphocytes are also involved in some intestine inflammatory diseases as Crohn’s Disease (Neurath
M.F. et al, 2002).
Another type of CD4+ T-cells are the regulatory T-cells (Tregs), capable of regulating the
proliferation or differentiation of other immune populations as DCs, CD8+ and CD4+ T-cells, in order
to maintain the immune system homeostasis especially in inflammation contexts (Shevach E.M., 2011;
Bin L. & Song Guo Z., 2015). Regarding CD4+ T-cells, Treg lymphocytes are specialized in the
inhibition of exacerbated proliferation of Th1 and Th17 populations (Figure 5). Thus, Tregs are critical
for autoimmune pathologies, allergies, chronic inflammation contexts, and allograft rejection (Joller, N.
et al, 2014). The main specific marker of Tregs is the forkhead box P3 (Foxp3) TF, but also CD25 (IL-
2R) surface receptor is commonly used to determine Treg phenotype (Walker L.S., 2004). Tregs can be
categorized in two groups: natural Tregs (nTregs) and induced Tregs (iTregs). nTregs are
physiologically produced in the thymus and require cell-to-cell interaction to suppress the proliferation
and cytokine production of cell targets. However, iTregs are those generated in the periphery or in
culture, which only need to release soluble factors to apply their immunosuppressive function. The best
studied Treg subsets are: Treg 1 (Tr1), Th3, and CD4+ CD25+. Tr1 are CD4+ T-cells characterized by
high IL-10 production, and precisely, they are generated by chronic activation in the presence of IL-10.
Nonetheless, the Th3 Tregs are CD4+ and produce TGFβ, IL-4, and IL-10. They can be induced in vitro
or in vivo after the exposure of naïve T-cells to TGFβ. CD4+ CD25+ are the most widely known Tregs

23 INTRODUCTION
because of their role in autoimmunity protection (La Cava A., 2009; Joller N. et al, 2014). It has been
demonstrated that the upregulation of this Treg population regarding percentage or cell functionality, is
beneficial for the treatment of autoimmune diseases (Mottet C. et al, 2003). Nonetheless, the inhibition
of their function or proliferation results also helpful for immunity against tumors and pathogenic
microorganisms (Ward-Hartstonge K.A. & Kemp R.A., 2017). Thereby, a healthy organism is
characterized by an immune homeostasis state, based on a correct balance between effector T-cells
(Teff) and Tregs, being this balance the key of a proper immune response (Kondělková K. et al, 2010).
Figure 5. Phases of effector CD4+ T-cell response. To carry out their effector function, the CD4+ T-cells
need to pass through a serial steps: 1) activation through antigen recognition, interacting with the APC; 2)
clonal expansion or proliferation; 3) differentiation towards different Th phenotypes (Th1, Th2, Th17, iTreg)
depending on the microenvironment signals that they receive; and finally 4) development of their specific
function when it is needed in the organism. Th1, Th2, Th17 and iTregs are the main Th subsets. IFNγ, IL12,
and IL18 induce T-bet and STAT4 expression leading to Th1 differentiation. Th1 cells produce IL2 and IFNγ
to deal with intracellular pathogen infections. IL4 promotes GATA3 and STAT6 expression, which determines
Th2 fate. Th2 cells secret IL5 and IL13 and protect from multi-cellular parasite infections and allergic
inflammations. Th1 and Th2 inhibit each other releasing IFNγ and IL4 respectively. TGFβ, IL23, and IL6
induce Th17 differentiation and the master regulator gene of this process is RORγT. The function of Th17
cells is to defend against extracellular bacteria or fungi infections. They are also implicated in the response
against autoimmune diseases as well as Th1. The master regulator of iTregs is Foxp3. TGFβ promotes Foxp3
expression and it is released by iTregs in addition to IL10. iTregs are responsible of immune homeostasis,
being able to impede Th1 and Th17 proliferation.
24 INTRODUCTION
3.5. Vaccinia virus and Leishmania major infections.
Two intracellular pathogens that specifically induce Th1 response are VACV and Leishmania major.
VACV is a poxvirus that has been widely used in humans as a protective vaccine against smallpox.
Thanks to it, nowadays the smallpox is an eradicated disease in humans, and this virus is only still used
for research purposes (Ahmed C.M. et al, 2007). Tail scarification infection in mice has provided a
useful model to study complications derived from VACV immunization, since it is used as human
smallpox vaccination. VACV infection by tail scarification in C57BL/6 WT mice is localized and
controlled by the host immune system, since Mota B.E.F and collaborators (2011) described no signs of
weight loss and no viral load in internal organs. Nevertheless, the same model of infection in a T- and
B-cell immunodeficient mice (Rag1-/-) leads to a systemic disease, with a high dissemination of VACV
that finishes with the mortality of 100% of the mice 12 days after the infection. CD4+ T-cell adoptive
transfer extends lifespan by accelerating viral clearance at least in part through a mechanism mediated
by Th1 cells (Mota B.E.F. et al, 2011). Therefore, the adaptive immunity in poxvirus infection in mice
is a determining factor. Upon intraperitoneal (i.p.) infection a strong humoral response is needed to solve
the infection, and CD8+ T-cell cytotoxic response is only necessary when the antibody response is
abrogated (Bray M. & Wright M.E., 2003). It exists still controversy about which cell type is the main
responsible of VACV viral clearance. Some authors attribute the key role to T-cells (Freyschmidt E.J.
et al, 2007), and others to B-cells and antibodies (Worthington M., 2003; Fang M. & Sijal L.J, 2005).
Other studies using localized poxvirus inoculation, corroborates that Th1 response is critical for the
control of this infection (Xu R. et al, 2004). Tian T. and colleagues reported in 2009, that the in vivo
overexpression of the Th1 cytokine IL-1α, leads to a higher control of VACV viral replication in
comparison to WT mice.
Besides, Leishmania major is an obligated intracellular protozoon that also provokes a Th1 specific
response (Biedermann T. et al, 2001). This parasite is transmitted by the bite of an infected female sand
fly, causing a severe disease called leishmaniasis (Mougneau E. et al, 2011). The annual global
incidence is still of 0.2–0.4 million cases for visceral leishmaniasis, and 0.7–1.2 million cases for
cutaneous leishmaniasis (Okwor I. & Uzonna J., 2016). Most of the studies with Leishmania have been
carried out in mice. C57BL/6 WT mice develop self-healing skin lesions at the place of parasite
inoculation, while BALB/c mice cannot control parasite proliferation, and they finally die (Sacks D. &
Noben-Trauth N., 2002). The experimental model that mimic the natural transmission is based in the
inoculation of only 10–1000 parasites; however, supra-physiologic high doses have been widely used
(2×10⁵ – 2 ×10⁷). Independently of the inoculation dose, healing in cutaneous leishmaniasis is critically
Th1 immune response dependent (von Stebut E. & Udey M.C., 2004). If Th1 immunity fails to control
Leishmania infection, the disease progress until the death of the individual (Belkaid Y. et al, 2002). The
main responsible cell-types against this serious infection are CD4+ Th1 cells, but also CD8+ Tc1 cells
(Xu R. et al, 2004). Both T-cell populations produce high levels of IFNγ, which activates macrophages

25 INTRODUCTION
and induces them to produce nitric oxide. In the end, nitric oxide facilitates the elimination of the
intracellular amastigotes (Bogdan C. et al, 2000). Thus, it has been reported that BALB/c mice manifest
a more pro-Th2 immune response, which could suppress Th1 function, and because of that they cannot
resolve the infection (Sacks D. & Noben-Trauth N., 2002). Likewise, polarization of Th responses in
human cutaneous leishmaniasis has been reported to be towards Th1 or Th2 depending on the patient
(von Stebut E. & Udey M.C., 2004).
There is still no specific treatment for leishmaniasis, and the therapeutic drugs as rifampicin, dapsone,
intraconazole, and amphotericin B, among others, produce significant toxicity and they are not
completely effective (Faghihi G. & Tavakoli-kia R., 2003). In addition, leishmaniasis is spreading to
several non-endemic areas of the world due to co-infections with HIV. It has been characterized over
20 species of this protozoon. For this reason, it has been developed several vaccines against this
pathogen, but they do not protect completely against the disease (Okwor I. & Uzonna J., 2016).
Therefore, more research is needed to find a cure of this major public health problem worldwide.
Conversely, as it has been mentioned before, an exacerbated Th1 differentiation can cause
autoimmune diseases as multiple sclerosis, type I diabetes, and IBD, instead of being beneficial against
infections. These excess of Th1 cells induce chronic inflammation and tissue damaging, common
features of these autoimmune diseases (Dardalhon V. et al, 2008).
3.6. The inflammatory bowel disease.
The inflammatory bowel disease (IBD) is an autoimmune disease characterized by a chronic
inflammation of the intestine. The inflammatory process is caused by an autoreactive immune system
that attacks tissues of the digestive tract, causing lesions of different severity (Podolsky D.K., 1991).
Within this group are included the ulcerative colitis and Crohn’s disease. Both of them comprises
common features, but they have also some different symptomatic pathological patterns which suggests
distinct underlying pathogenic mechanisms (Podolsky D.K., 1991). There have been described several
risk factors that contribute to intestine inflammation. Environmental factors as pollution, changes in
diet, exposure to chemicals, smoking and lifestyle, have been related with IBD development. As well,
dietary habits and microbiota have been closely linked to this disease. Besides, family studies have
demonstrated that genetic factors can predispose to IBD, changing for example, the intestine barrier
permeability (Hanauer S.B., 2006). Furthermore, as other autoimmune diseases, the adaptive immune
response has a main role in the pathogenesis of this disease. As previously mentioned, an exacerbated
T-cell differentiation towards Th1, Th2 and Th17, promotes IBD development, while Treg lymphocytes
regulate the inflammatory process inhibiting Th functions (Neurath M.F. et al, 2002; Izcue A. et al,
2006) (Figure 6). Th1 population is highly increased in Crohn’s Disease, while Th2 population is more
abundant in ulcerative colitis. Th1 frequency can increase from a normal ∼20% level to a highly
increased level (∼70% of intestinal CD4+ T cells) in a severe Crohn’s Disease (Niessner M. & Volk
B.A., 1995; Kosiewicz M.M. et al, 2001; Kang S.G. et al, 2007).

26 INTRODUCTION
A well-stablished IBD mouse model that simulates human Crohn’s disease consists in the adoptive
transfer of CD45RBhi CD4+ CD25- T-cells into a T- and B-cell immunodeficient Rag1-/- (Morrissey P.J.
et al, 1993; Powrie F. et al, 1993). In this model, because of the absence of Treg population inhibitory
function in the colon, immune homeostasis breaks down and IFNγ- and TNFα-inflammatory responses,
involving Th1 and Th17 cells among others, are favored mainly in the gut because of the high bacterial
load. The intestinal microbiota induces a constant antigen-presentation process, which leads to a chronic
intestine inflammation in the absence of Treg cells (Kiesler P. et al, 2015). Other organs as spleen or
liver, characterized also by a high immune content and a constant antigen-presentation process, can
develop, as well, a chronic inflammation (Izcue A. et al, 2006). Therefore, this model represents a
systemic disease in which Treg, Th1 and Th17 are the main characters.
IBD pathologies have been related also with environmental factors, genetic susceptibility, and
changes in the microbiota populations. Moreover, IBD has a high prevalence and incidence in young
adults (20-39 years). It affects to 2.2 million people in Europe, while in Spain there are 181.4 cases per
100.000 habitants (Vanhove W. et al, 2016; Young C.E., 2016). Therefore, it is a global disease with an
increasing number of diagnosed patients every year. Nevertheless, the current treatments are far from
being completely effective. For this reason, this disease causes so much money expenditure in surgeries,
hospitalizations and ineffective treatments (Ernst & Young, 2016). In addition, almost all of these
treatments have serious side effects (De Souza H.S. et al, 2016; Kim D.H. et al, 2017); RA for example,
has been reported to downregulate inflammatory responses shifting the Treg/Th17 profile in human and
mice ulcerative colitis, however it produces several side effects (Bai A. et al, 2009; David M. et al,
Figure 6. Adaptive immune response in Crohn’s disease. The adaptive immune response has a main role
in the development of IBD. Treg lymphocytes differentiation and functionality is extremely important to
maintain the T-cell homeostasis in the gut. This is because Treg T-cells inhibits the exacerbated proliferation
and differentiation of Th1 and Th17 in Crohn’s Disease, thus protecting from inflammation (modified from
www.hycultbiotech.com).

27 INTRODUCTION
1988) so it is necessary to discover new therapeutic targets that improve the quality of life and reduce
the mortality of these patients.
3.7. Retinoic acid and immune homeostasis.
As it was mentioned before, RA (last metabolite of vitamin A pathway) controls lamin A/C
transcription (Okumura K. et al, 2000), and in addition, it is known to be a key regulator of Th
proliferation and differentiation (Olson I.L. et al, 1982; Ross A.C. et al, 2012; Reis B.S. et al, 2013).
Moreover RA synthesis is dynamically controlled at inflammatory scenarios, where RA signaling on T-
cells has been reported (Aoyama K. et al, 2013). The role of RA in immune homeostasis has been widely
study in several immune populations (monocytes, macrophages, DCs, B-cells and T-cells), since vitamin
A-deficient individuals show difficulties to control infectious diseases (Stephensen C.B., 2001).
Investigators have described three major roles of RA in cell-mediated immunity: impairment in Th1
polarization by blocking IFNγ and IL-12 secretion, reduced APC function, and enhanced Th2
differentiation. These results are consistent with lower expression levels of T-bet and IL-12R, and higher
expression levels of GATA-3 and IL-4R derived from RA effect. Additionally, RA also inhibits Th17
differentiation, producing a reduction in RORγT expression (Pino-Lagos K. et al, 2008). Furthermore,
RA is not only a transcriptional regulator, recent studies have
shown that RA-RAR drives epigenetic changes and chromatin
remodeling in embryonic stem cells (Kashyap V. et al, 2013;
Urvalek A.M. & Gudas L.J., 2014). Indeed, Brown C.C. et al
published in 2015, that RA signaling through RARα activates
Th1 enhancers and represses Th17-cell genes.
Additionally, several studies have demonstrated that RA
remarkably increases Treg differentiation and improves their
suppressor activity (Benson M.J. et al, 2007; Mucida D. et al,
2007; Schambach F. et al, 2007; Nolting J. et al, 2009). Thereby,
RA greatly enhances Foxp3 expression in CD4+ T-cells (Elias
K.M. et al, 2008; Xiao S. et al, 2008) and IL-10 secretion (Kang
B.Y. et al, 2000). Many of the studies about the role of RA on
Tregs development are focused on the gut. This is because RA
also enhances gut-homing markers expression as α4β7 and
CCR9 on T-cells. Hence, RA-treated CD4+ T-cells migrate
preferentially to the gut in comparison with untreated CD4+ T-
cells (Iwata M. et al, 2004). In line with this, it has been
previously reported that DCs from the gut, mesenteric lymph
nodes (MLN) and Peyer’s patches (PP), induce the same gut-
homing markers on T-cells, while DCs from peripheral lymph nodes (PeLN) do not (Mora J.R. et al,
Figure 7. RA promotes Foxp3+ Treg
polarization in the gut. The
specialized CD103+ DC population
produce RA and TGFβ in the gut.
Because of that, the CD4+ T-cells that
recognize an antigen presented by this
specific DC population are more
prone to be differentiated into Foxp3+
Treg (modified of von Boehmer H.,
2007).

28 INTRODUCTION
2003). Taking together all these results and the discovery that RA is released by DCs from the gut, MLN
and PP, and not by DCs from PeLN or spleen (Iwata M. et al, 2004), it seems clear that RA has a main
role in the Th phenotype and homing in the gut. Furthermore, the CD103+ DC population is specifically
responsible of this RA production in the gut, MLN and PP (Figure 7), whereas CD103- DCs do not
produce RA. Thus, CD103+ DCs are preferentially located in these intestinal regions, while CD103- DCs
are more abundant in PeLN and spleen (Coombes J.L et al, 2007; Esterházy D. et al, 2016).
The fact that RA promotes not only Treg differentiation, but also Treg immunosuppressive function,
determines that RA has been considered as a possible treatment for autoimmune diseases, and
particularly, for gut autoimmune diseases as Crohn’s disease (Pino-Lagos K. et al, 2008). RA treatment
has been tested in mice colitis models, showing a great amelioration of the symptoms (Klopcic B. et al,
2008; Hong K. et al, 2014). In addition, retinoids have been widely used in the last decade to treat
especially skin diseases. However, systemic administration of retinoids has been associated with
mucocutaneous side effects, liver toxicity and irregularities of serum lipid profiles, which might be
related to greater risk of suffering coronary heart disease (David M. et al, 1988). Therefore, it is needed
to further investigate the RA signaling in order to develop new therapeutic drugs for Crohn’s disease
and other autoimmune diseases.
3.8. Epigenetics, T-cell differentiation, and A-type lamins.
As it was mentioned before, the polarization towards the different subtypes of T-cells depends on a
strict program of gene expression regulated by various events, such as the microenvironment of
cytokines at the time of antigen recognition (Nakayama T. & Yamashita M., 2010). Another significant
element in T-cell differentiation commitment is the epigenetic regulation (Morinobu A. et al, 2004)
which causes modifications in chromatin involving the inheritance of phenotypes without alterations in
the DNA sequence (Hirahara K. et al, 2011). Several studies have demonstrated the relevance of these
modifications in differentiation towards Th lineages (Koyanagi M. et al, 2005; Mukasa R. et al, 2010)
(Figure 8).
The main structural unit of the chromatin is the nucleosome. So that, chromatin is a chain of
nucleosomes connected by a linker DNA. Every nucleosome comprises two replicas of histones H2A,
H2B, H3 and H4. N-terminal tails of these histone proteins can be covalently modified through
acetylation, methylation and phosphorylation, which determines the status of the chromatin. Thus,
histone modifications determine the condensed or relaxed chromatin status, which correlates with the
repressed or active transcription, respectively. The most well-known histone modifications are:
H3K4me3, H3K27me3, H3K27ac, H3K4me1, and H3K9me3. H3K4me3 is associated with active
transcription regions in promoters, while H3K27me3 is related with repressed gene expression H3K27ac
is a mark of active enhancers, as well as H3K4me1. H3K9me3 is always located in heterochromatin

29 INTRODUCTION
permanent repressed regions. DNA methylation is another modification that limits the accessibility of
transcription machinery, thereby affecting also the gene expression (Hirahara K. et al, 2011). These
epigenetic processes decisively control Th cell identity. Thus, during Th differentiation one set of genes
is going to be epigenetically activated while the others are going to be silenced (Ansel K.M. et al, 2003).
Accordingly, it has been shown the existence of H3K4me3 permissive marks in proximal promoters of
cytokine genes in their respective Th lineage (e.g. Ifng in Th1 cells), and H3K27me3 repressive marks
in other subsets (e.g. Ifng in Th2 cells) (Wei G. et al, 2009). Therefore, chromatin remodeling by histone
modifications is essential to promote Th phenotype stability (Figure 8).
A-type lamins have a major role in chromatin organization. Lamin A/C is not only present in the
nuclear lamina, it also localizes at the nucleoplasm forming oligomers that can cross-link chromatin
directly binding the DNA or interacting through H2A/H2B histone proteins (Bronshtein I. et al, 2015).
The chromatin interactions with A-type and B-type lamins have been called lamina-associated domains
(LADs). LADs cover more than one –third of mouse and human genome in individual cell types, making
LADs one of the most prominent features of the epigenome. In mammalian cells, there are cell-type
invariant LADs (constitutive LADs), and others that are present only in certain cell types (facultative
LADs) (van Steensel B. & Belmont A.S., 2017). LADs are generally gene poor and heterochromatic
regions; however, LADs may contain both inactive and active genic regions (Oldenburg A.R. & Collas
P., 2016). Thus, it has been described that lamin A/C also anchors euchromatin through lamina-
Figure 8. Epigenetic modifications in cytokine genes drive Th phenotype stability. TFs as STAT6, STAT4
and STAT3 are essential to promote Th2, Th1 and Th17 differentiation respectively, but also epigenetic
modifications determine the Th fate. H3K4me3 active transcription mark is denoted in red, and H3K27me3
repressive modification is denoted in blue. H3K4me3 is highly present in the Ifng promoter in Th1 cells, while
in Th2 and Th17 cells, the Ifng promoter only contains H3K27me3 modification. The same pattern is observed
in the Il-17a locus; it contains H3K4me3 in Th17 cells, and H3K27me3 mark in the other Th subsets (Hirahara
K. et al, 2011).

30 INTRODUCTION
associated polypeptide 2 alpha (LAP2α) (Gesson K. et al, 2016). Therefore, lamin A/C is vital in
chromatin structure maintenance, but it can also affect gene expression modulating epigenetics and
chromosome positioning. For example, in cells derived from patients suffering diseases caused by
LMNA mutations (e.g. fibroblast form HGPS patients), it has been observed a general loss of
heterochromatin accompanied by epigenetic changes as an overall decrease in H3K27me3 (Dechat T.
et al, 2009).
Moreover, lamin A/C interacts with Polycomb group (PcG) proteins, which are epigenetic repressors
that control a wide number of genes during differentiation processes. Thereby, lamin A/C regulates PcG
dynamics in the nucleus changing muscle cell differentiation pattern (Cesarini E. et al, 2015).
Summarizing lamin A/C is a key regulator of epigenetic changes and cell differentiation (Oldenburg A.,
2017), and epigenetic modifications are crucial in Th differentiation process (Morinobu A. et al, 2004).
Nevertheless, it remains unknown if lamin A/C has a role in epigenetic changes related with Th fate
commitment.

Objectives


33 OBJECTIVES
4. OBJECTIVES
In vitro results from our laboratory have shown that lamin A/C is involved in naïve CD4+ T-cell
activation. We have thus postulated that lamin A/C might have a role in proliferation and polarization
of naïve CD4+ T-cells, and in the development of immune responses against infection and inflammation.
To address our hypothesis, we have proposed the following objectives:
1) To assess the role of lamin A/C in CD4+ T-cell development and generation.
2) To analyze the function of lamin A/C in naïve CD4+ T-cell activation, proliferation, and
differentiation towards Th effector lineages.
3) To study the relevance of lamin A/C function in the regulation of immune responses against
infection and in inflammatory diseases.
4) To decipher the physiological mechanism that regulates lamin A/C expression in CD4+ T-cells
upon antigen-recognition.
5) To determine if lamin A/C produces epigenetic changes that compromise the Th phenotype fate.


Material & methods

37 MATERIAL & METHODS
5. MATERIAL AND METHODS
5.1. Mice.
Lmna-/- mice have been described previously (Sullivan T. et al, 1999). C57BL/6-Tg (TcraTcrb)
425Cbn/J mice (OTII mice) which express a TCR specific for the OVA peptide (amino acid residues
323 to 339) in the context of I-Ab, and CD4-CRE mice were obtained from the Jackson Laboratory
(stock number 004194 and 017336, respectively). C57BL/6J 129S7-Rag1tm1Mom/J (Rag1-/-) mice
which lack B and T lymphocytes, were purchased as well from Jackson Laboratory. Female mice of 8
to 12 weeks of age were used. C57BL/6-CD45.2+ Lmna-/- OTII mice were generated by crossing
C57BL/6-CD45.2+ OTII mice with C57BL/6-CD45.2+ Lmna-/- mice. C57BL/6-CD45.1+ CD45.2+ WT
mice were generated by crossing C57BL/6-CD45.2+ mice with C57BL/6-CD45.1+ mice. C57BL/6-
CD45.1+ and C57BL/6-CD45.1+ CD45.2+ WT mice were used as recipients for adoptive transfer.
C57BL/6-CD45.1+ CD45.2+/OTII WT mice were generated by crossing C57BL/6-CD45.2+ /OTII mice
with C57BL/6-CD45.1+ /OTII mice. Lmnaflox/flox mice were kindly provided by Y. Zheng (Kim Y. et al,
2013). C57BL/6 CD4-CRE- Lmnaflox/flox mice were generated by crossing C57BL/6-CD4-CRE with
C57BL/6-Lmnaflox/flox mice. Foxp3-IRES-mRFP (FIR) mice were obtained from Jackson Laboratory
(stock number 008374) and were crossed with the C57BL/6 CD4-CRE- Lmnaflox/flox mice. C57BL/6
transgenic β-actin DsRed mice (ACTB-DsRed*MST) 1Nagy/J; Jackson Laboratory) was also used. All
mice were bred in specific pathogen-free conditions at Centro Nacional de Investigaciones
Cardiovasculares (CNIC).
Animal experiments were approved by the local ethics committee and the Spanish Ministry of
Agriculture and Fisheries, Food and Environment. All animal procedures conformed to EU Directive
86/609/EEC and Recommendation 2007/526/EC regarding the protection of animals used for
experimental and other scientific purposes, enforced in Spanish law under Real Decreto 1201/2005.
5.2. Antibodies.
Anti-lamin-A/C (n-18), anti-p-Erk1/2, anti-PCNA, and PE-conjugated anti-lamin A/C were obtained
from Santa Cruz Biotechnology. Alexa Fluor 488-conjugated anti-lamin-A/C and Alexa Fluor
488-conjugated mouse immunoglobulin (Ig) G1 isotype control were obtained from Cell Signaling.
Anti-CD3, anti-CD28, FITC-conjugated-CD45.1, PerCPCy5.5- conjugated anti-CD45.1,
APC-conjugated anti-CD45.1, v450-conjugated anti-CD45.2, FITC-conjugated anti-CD45.2, PE-
conjugated anti-IFN, APC-conjugated anti-IFN, V450-conjugated anti-CD4, APC-conjugated anti-
CD25, V450-conjugated anti-CD45.1, and PerCPCy5.5-conjugated anti-CD45.2 were from Tonbo
Bioscience. PercpCy5.5-conjugated anti-CD64, PE-conjugated anti-CD103, and FITC-conjugated anti-
CD11c were from Biolegend. PECy5-conjugated anti-CD45.1, PECy7-conjugated anti-CD45.1, PE-
conjugated anti-Tbet, FITC-conjugate anti-CD8, PE-conjugated anti-CD4, FITC-conjugated anti-
Foxp3, FITC-conjugated anti-CD69, PE-conjugated anti-T-bet, FITC-conjugated anti-Ki67, PE-
38 MATERIAL & METHODS
conjugated anti-IL-4, and biotinylated antibodies against B220, CD19, MHCII, CD11c, CD11b, CD44,
CD49b, IgM CD25, and CD8, Alexa Fluor 488-conjugated anti-rabbit IgG were from BD Biosciences.
H3K4me3, H3K4me1, H3K27me3, H3K27ac were from Diagenode.
5.3. T-cell isolation, activation and polarization.
CD4+ CD25- T-cells from spleens were purified by negative selection on separation columns
(Miltenyi Biotec) after labeling the cells with a cocktail of biotinylated antibodies against B220, CD19,
MHCII, CD11c, CD11b, CD44, CD25, CD49b, IgM, and CD8 and a solution containing streptavidin-
bound magnetic microbeads (Miltenyi Biotec). For polarizing experiments, CD4+ CD25- T-cells from
WT/OTII and Lmna-/-/OTII mice were stimulated with irradiated autologous WT APCs previously
incubated with OVA peptide (10 μg/mL) for 30 min at 37ºC. CD4+ CD25- T-cells from WT and Lmna-
/- mice were stimulated with plate-bound anti-CD3 (10 μg/mL) and soluble anti-CD28 antibodies (2
μg/mL).
Polarizing conditions were as follows: IL-12 (10 ng/mL), anti-IL-4 (4 μg/mL), and IL-2 (10 ng/mL)
for Th1 polarization; IL-4 (10 ng/mL), anti-IFNγ (4 μg/mL), and IL-2 (10 ng/mL) for Th2 polarization;
TGFβ (20 ng/mL) and IL-2 (10 ng/mL) for Treg polarization; anti-IFNγ (4 μg/mL), anti-IL-4 (4 μg/mL),
TGFβ (20 ng/mL), IL-23 (10 ng/mL), IL-6 (20 ng/mL) for Th17 polarization. Antibodies and cytokines
were from BD bioscience and Tonbo Bioscience, respectively. Cells were cultured in RPMI-1640
medium (GIBCO) supplemented with 10% fetal bovine serum (FBS), 2 mM ethylenediaminetetra-acetic
acid (EDTA), 100 mg/mL penicillin, 100 mg/mL streptomycin, 20 mM 4-(2-hydroxyethyl)-1-
piperazineethanesulfonic acid (HEPES), 55 µM β-2-mercaptoethanol, 1 mM sodium pyruvate, and 2
mM L-glutamine for the indicated times.
5.4. Adoptive transfer.
Splenic CD4+ CD25- T-cells from CD45.2+ Lmna-/-, CD45.1+ CD45.2+ WT, or CD45.2+ WT mice
were isolated by negative selection on MACS separation columns (Miltenyi Biotec) after labeling the
cells with a cocktail of biotinylated antibodies against B220, CD19, MHCII, CD11c, CD11b, CD44,
CD25, CD49b, IgM, and CD8, as well as with a solution containing streptavidin-bound magnetic
microbeads (Miltenyi Biotec). Adoptive transfer experiments were performed by inoculating CD45.1+
or CD45.1+ CD45.2+ WT recipient mice with 1106 isolated CD4+ T-cells through the retro-orbital sinus.
In some experiments, CD45.1+ CD45.2+ WT recipient mice were inoculated with a 1:1 mix of 2106
CD25-CD4+ T-cells obtained from the spleens of CD45.2+ Lmna-/- and CD45.1+ WT mice. In VACV
experiments, adoptive cell transfer was performed 24 hours before inoculation with the VACV (Iborra
S. et al, 2016). Similar adoptive transfer was performed with CD4+ T-cells isolated from CD45.1+
CD45.2+ WT/OTII, CD45.1+ WT/OTII, or CD45.2+ Lmna-/- mice.

39 MATERIAL & METHODS
5.5. Bone marrow-derived DCs generation.
Bone marrow-derived DCs (BMDCs) were generated as described in (Rocha-Perugini V. et al,
2017). BMDCs were obtained from bone marrow cell suspensions after culture on non-treated cell
culture dishes in complete RPMI 1640 medium supplemented with 10% FBS, 2 mM L-glutamine, 100
mg/mL penicillin, 100 mg/mL streptomycin, 55 μM β-2-mercaptoethanol, and 20 ng/mL GM-CSF
(granulocyte macrophage colony-stimulating factor) (PeproTech, London, UK). Cells were collected at
day 9 and BMDCs were isolated as CD11c+ MHC-II+ Ly6G- cells. Maturation was induced after
overnight incubation with LPS from Escherichia coli O111:B4 (1 μg/mL; Sigma-Aldrich).
5.6. Bone marrow transplantation.
WT recipient mice received 13 Gy of total body irradiation administered in two treatments from a
137Cs source. Bone marrow (BM) cells from CD45.2+ WT or CD45.2+ Lmna-/- mice were transplanted
into CD45.1+ WT recipients by injection into the retro-orbital sinus immediately after irradiation. A mix
1:1 of bone marrow cells from CD45.1+ WT and CD45.2+ Lmna-/- mice were transplanted into CD45.1+
CD45.2+ WT recipients by injection into the retro-orbital sinus immediately after irradiation.
Approximately eight weeks after transplantation, the chimeric condition of the mice was assessed by
flow cytometric analysis of blood cells stained with a combination of fluorescently labeled anti-CD45.1
and anti-CD45.2 antibodies to detect T-cells from donor and from recipient mice, which confirmed that
more than 90% of the cells analyzed were derived from the transplanted BM cells.
5.7. Proliferation assays.
24 hours before the sacrifice of the mice, a single dose of 1 mg BrdU (5-bromo-2-deoxyuridine, BD
Pharmingen) was injected i.p.. To assess BrdU incorporation, MLN, peritoneal exudate and spleen were
stained for CD4, fixed and permeabilized using the BD BrdU Flow Kit (BD Pharmigen) according to
the manufacturer’s instructions. Cells were incubated at 37º C for 60 min in 30 µg of DNase, followed
by staining with anti-BrdU-FITC for 40 min, washed and analyzed by flow cytometry. Peritoneal
exudate and MLN cells were fixed and permeabilized using Foxp3 fixation/permeabilization buffer (BD
Pharmingen) and stained for PCNA-FITC and Ki67-FITC.
5.8. Vaccinia virus in vivo infection and viral titration.
The VACV strain Western Reserve (WR, ATCC number VR-1354) was a gift from Jonathan W.
Yewdell and Jack R. Bennink (NIH, Bethesda, Maryland, USA). VACV was propagated in BSC-40
cells and purified by sucrose gradient ultracentrifugation. WT or OVA-expressing VACV (1106
plaque-forming units) were administered by i.p. injection or intradermal (i.d.) injection in the footpad
(Iborra S., et al 2016).
Animals were anesthetized with an i.p. injection of Ketamine (100 mg/kg body weight) and Xylazine
(10 mg/kg) diluted in sterile phosphate buffered saline (PBS). Thirty 1 cm scarifications were made with
a 26 G syringe along the base of the tail, avoiding bleeding (Melamed S. et al, 2007). Then 10 ml of
40 MATERIAL & METHODS
PBS containing 107 VACV plaque forming units (p.f.u.) were added to the area and allowed to air dry.
For mock infection only PBS was added.
Animals were euthanized and the tail aseptically removed, weighed, frozen at -80ºC, and stored at -
80ºC until use. The samples were homogenized with a Tissue Ruptor (QIAGEN, USA) in 0.5 ml DMEM
containing 100 U/ml penicillin and 100 µg/ml streptomycin. The homogenates were sonicated for 3 min
at 40% amplitude, freeze-thawed twice (-80ºC/37ºC), sonicated again under the same conditions, and
then serially diluted in DMEM without FBS. To quantify p.f.u., the dilutions were added to monolayers
of CV-1 cells seeded on 24-well plates. The cells were preincubated for 1 day at 37ºC and 5% CO2, the
dilutions (0.2 ml) were added to each well, and the cells were further incubated under the same
conditions for 1 h. After this, 0.5 ml DMEM containing 0.5% FBS were added to each well. After 24 h,
the cells were stained for 5 min with crystal violet solution (0.5% crystal violet, 10% ethanol, and 1%
paraformaldehyde) and washed again. Viral plaques were counted and plaque number was multiplied
by the reciprocal of sample dilution and converted to p.f.u/g (Mota B.E. et al, 2011).
5.9. Leishmania major in vivo infection.
In vivo experiments were carried out using L. major Friedlin strain FV1 (MHOM/IL/80/Friedlin),
generously provided by Dr. D. Sacks (NIH). For Leishmania challenge, parasites were kept in a virulent
state by passage in mice. Parasites were cultured and differentiated as described Iborra S. and
collaborators (2005). Mice were infected by i.d. injection of 103 or 5×10⁴ metacyclic L. major
promastigotes into the dermis of both ears. Lesion size in the ear was determined with digital callipers
(Duratool) (Iborra S. et al, 2011). The limiting dilution assay was used to determine parasite number
(Iborra S. et al, 2005). Parasite load was expressed as the number of parasites in the whole organ.
5.10. Inflammatory bowel disease mouse model.
Intestine inflammation was induced by the inoculation of, at least, 5105 of CD4+ CD25- T-cells from
CD4-CRE+tg/wt- Lmnaflox/flox and CD4-CREwt/wt- Lmnaflox/flox mice into a T- and B-cell immunodeficient
Rag1-/- mice through the retro-orbital sinus (Powrie F. et al, 1993; Morrissey P.J. et al, 1993). Mice were
monitored during 8 weeks to assess colitis development. Body weight and symptomatology was checked
twice a week. Disease severity was considered according to a clinical score defined as follows:
Weightloss: 0 (no loss), 1 (1–5%), 2 (5–10%), 3 (10–20%), and 4 (>20%).
Stool consistency: 0 (normal), 2 (loose stool), and 4 (diarrhea).
Rectal prolapse: 0 (absent), 2 (low), and 4 (pronounced).
Rectal bleeding: 0 (absent), and 4 (present).
Spine curvature: 0 (absent), 2 (low), and 4 (pronounced).

41 MATERIAL & METHODS
5.11. Histopathological analysis.
After 8 weeks of IBD development, mouse colons were collected and fixed in 4 % paraformaldehyde
for 48 h, and transferred to 70% ethanol. Colons were cut into six portions of 5 mm approximately.
Three of these portions, a proximal one, a distal one, and one from the medial part, were dehydrated to
xylene, and embedded in paraffin. The leftover portions were used for mRNA expression analysis.
Transverse colon sections (5 µm) were cut and stained with hematoxylin-eosin to evaluate inflammation
severity. Images were obtained with an Olympus BX41 microscope. Two images of serial sections cut
with a 100-μm separation, were evaluated for each part of the colon (six images per mouse). Colitis
severity was assessed taking into account the following features: leukocyte infiltration, goblet cell
depletion, epithelial hyperplasia, crypt damage, and submucosal inflammation, with a score from 0 to 4.
Ulceration was also considered with a score defined as: 0 (absent), 2 (present), and 4 (prominent). Scores
were analyzed by two blinded observers, and they were summed to give a final histological score for
each parameter.
5.12. In vivo cytotoxicity assays.
Splenic CD45.2+ WT or CD45.2+ Lmna-/- CD4+/OTII T-cells were isolated as described in the
adoptive transfer section. Recipient Rag1-/- mice were inoculated intravenously with 2×10⁶ of either
naïve CD45.2/WT or CD45.2/Lmna-/- CD4+/OTII T-cells and infected with VACV-OVA i.p. After 5
days, splenocytes from CD45.2/WT/dsRED and CD45.1/WT mice were isolated and loaded or not with
OVA-OTII peptide, respectively. An approximately 1:1 mix of 5×10⁶ CD45.2/WT/dsRED and
CD45.1/WT splenocytes was inoculated intravenously in the recipient Rag1-/- mice, which were
previously inoculated and vaccinia infected. After 16 h, animals were analyzed to determine the killing
capacity of CD4/OTII cells in the spleen by flow cytometry. Killing capacity was determined as the
ratio between CD45.2/WT/dsRED/+OVA and CD45.1/WT/-OVA cells and the percentage of CD4/OTII
T-cells. Adoptively transferred mice with only CD4/OTII cells, and transferred mice with splenocytes
in the absence of CD4/OTII cells were used as controls.
5.13. In vitro Treg suppression assays.
CD4+ CD25- T-cells were isolated from CD4-CRE+tg/wt-Lmnaflox/flox and CD4-CREwt/wt-Lmnaflox/flox
mice spleens and polarized towards Treg phenotype as it is indicated in the 5.3 section. After 6 days of
in vitro differentiation, CD4+ CD25- T-cells were isolated from CD45.1/WT mice spleens and Treg
polarization was checked by flow cytometry. In vitro generated Tregs were stained with FITC-
conjugated anti-CD4, APC-conjugated anti-CD25, and 4',6-Diamidine-2'-phenylindole dihydrochloride
(DAPI) (ThermoFisher) and selected by fluorescence-activated cell sorting (FACS). CD45.1/WT CD4+
CD25- T-cells were stained with CellTrace Violet (ThermoFisher) following manufacturer’s
instructions. Then, the Treg:Tnaïve co-culture was performed in serial ratios (1:2, 1:4, 1:8, 1:16, 1:32,
0:1) in the presence of soluble anti-CD3 (10 μg/mL) and soluble anti-CD28 antibodies (2 μg/mL).

42 MATERIAL & METHODS
5.14. Retinoic acid treatment in vitro and in vivo.
RA powder (Sigma-Aldrich) was diluted in Dimethyl Sulfoxide (DMSO) and added to in vitro
cultures at day 0 in a final concentration of 10 nM. After 48 h of incubation, RA was washed. In parallel,
non-treated cells was cultured under the same conditions adding instead DMSO.
Mice IBD induced were i.p. injected with 30 μg/mL dose of RA diluted in Corn Oil (Sigma-Aldrich)
every day during the first two weeks of the disease mouse model.
5.15. Colon lymphocytes isolation.
Colons were extracted from IBD induced mice, and washed with HBSS buffer (ThermoFisher)
supplemented with 100 mg/mL penicillin and 100 mg/mL streptomycin. Then, colons were
longitudinally cut and included in HBSS with 100 mg/mL penicillin and 100 mg/mL streptomycin, and
5mM 1,4-Dithiothreitol (DTT) (Sigma-Aldrich), and incubated during 20 min at room temperature (RT)
to destroy the intestine mucus. After, colons were washed and incubated again with HBSS and 2mM
EDTA during 20 min at 37ºC to detach the intestinal epithelium. Then, colons were washed again, cut
into small pieces, and included in HBSS supplemented with 100 mg/mL penicillin, 100 mg/mL
streptomycin, 1% IV Collagenase (Roche), and 10 mM DNase I during 30 min at 37ºC (Sigma-Aldrich).
Colons were filtered through a 70-μm cell strainer, and the recovery was centrifuged at 1500 rpm for 5
min at 4 °C to obtain a cell pellet.
5.16. DCs and CD4+ T-cells in vitro co-cultures.
MLN and PeLN were isolated from CD45.2/WT mice. Then MLN and PeLN were cut into small
pieces and incubated during 10 min at 37ºC in HBSS with 1% Liberase TL (Roche) and1000 U/Ml of
DNase I. After the incubation, the cell suspension was filtered through a 70-µm cell strainer, and
centrifuged at 1800 rpm during 5 min at 4ºC. The cell pellet was stained with the following antibodies
and reagents: FITC conjugated anti-CD11c, PercpCy5.5 conjugated anti-CD64, PE conjugated anti-
CD103 and DAPI. Two DCs populations were selected by FACS: CD11c CD64- CD103+ and CD11c
CD64- CD103-. Naïve CD4+ T-cells were isolated as is indicated in 5.3 section from CD45.1/OTII/WT
mice spleens. At that point, co-cultures of DCs:T naïve were carried out with a 1:5 ratio respectively.
5.17. Chromatin immunoprecipitation- quantitative PCR.
CD4+ CD25- T-cells were isolated and incubated in vitro as is indicated in the 5.3 section. After 48
hours of in vitro activation, alive CD4+ T-cells were selected by FACS. Then, cell pellets were
crosslinked following the protocol previously described by Oldenburg A.R. and Collas P. (2016), and
snap frozen and preserved at -80ºC. Non-crosslinked cell pellets of each sample were also collected to
develop reverse transcription (RT) - quantitative polymerase chain reactions (qPCR) as a control. When
all the needed samples were collected, chromatin immunoprecipitation (ChIP)- qPCRs were carried out
with crosslinked pellets following the next steps of the protocol (Oldenburg A.R. & Collas, 2016).

43 MATERIAL AND METHODS
The conditions for amplification were: denaturation at 95°C for 3 min [95°C for 10 s, annealing at
60°C for 15 s, extension at 72°C for 20 s] (40 cycles), 95°C for 1 min. The primers were designed with
the NCBI Primer-designing tool, and gene sequences were obtained from NCBI database. Promoter
regions of the studied genes were selected from the transcription starting point (TSS) backwards until
the 5’ end of the gene sequence (Figure 9). The sequences were obtained from UCSC Genome Browser
database. RT-qPCR was developed as is described in the next 5.18 section, with non-crosslinked pellets.
Primers used for ChIP-qPCR are listed below in the Table 1. The expression of each studied gene was
analyzed by the comparative Ct method with Biogazelle qBasePLUS software using the housekeeping
5’
(-1000) (-75) (-35)
CAAT BOX TATA BOX TSS
Primer design region
Gene 5’-3’ Forward sequence 5’-3’ Reverse sequence
Cd69 promoter TCAGACAGCAGGGAAAACCC AATTTATGCTCCAGCGGCCT
Cd25 promoter CTGCCAAGAAGTGCTTGCTC TGGGCAGTGTTTGGTGAGAA
Il-2 promoter ATGCTTTCTGCCACACAGGT CTCTTCAGCATGGGAGGCAA
T-bet promoter CCGTAGTTATTGGAATAGAACAGC ATACCAACCGGTGTCTGTGT
Foxp3 promoter CCCAGGAGGCCATTAACAGG TTTGGCCCCATGCTATGGTT
Gata3 promoter AGAAATCTCAAGCGCTGCCT CCGGCTAACAAGAAGCTGGA
Rorγt promoter AGCTGCTTGGCTCAGCATAA TTGCCTGCGTCATTCTGACT
Ube2b promoter TCACGTGACCTGCTCTGATG GCATCCGGAGCCTGAGATTT
Gapdh promoter GTTGCACTGGCCTAGCAAAG GACCGGGATTCTTCACTCCG
Table 1. List of the primers used for ChIP-qPCR technique.
Figure 9. Schematic representation of the promoter region of a eukaryotic gene. The TSS (indicated with
an arrow) is the point in which the transcription of a gene starts. Upstream of the TSS, and closed to it, is where
is located the TATA box, in the -35 pb position (approximately). The TATA box is the TATAAA sequence,
where TATA-binding proteins bind the DNA helping the subsequent binding of the RNA polymerase. The
promoter region of eukaryotic genes are very complex and have other components, as the CAAT box located
in the -75 pb position (approximately), and regulatory elements as enhancers that can be around the -1000 pb
position. The promoter region used for the designing of primers for ChIP-qPCR is indicated.
Enhancer TATAAA GGNCAATCT Exon 1
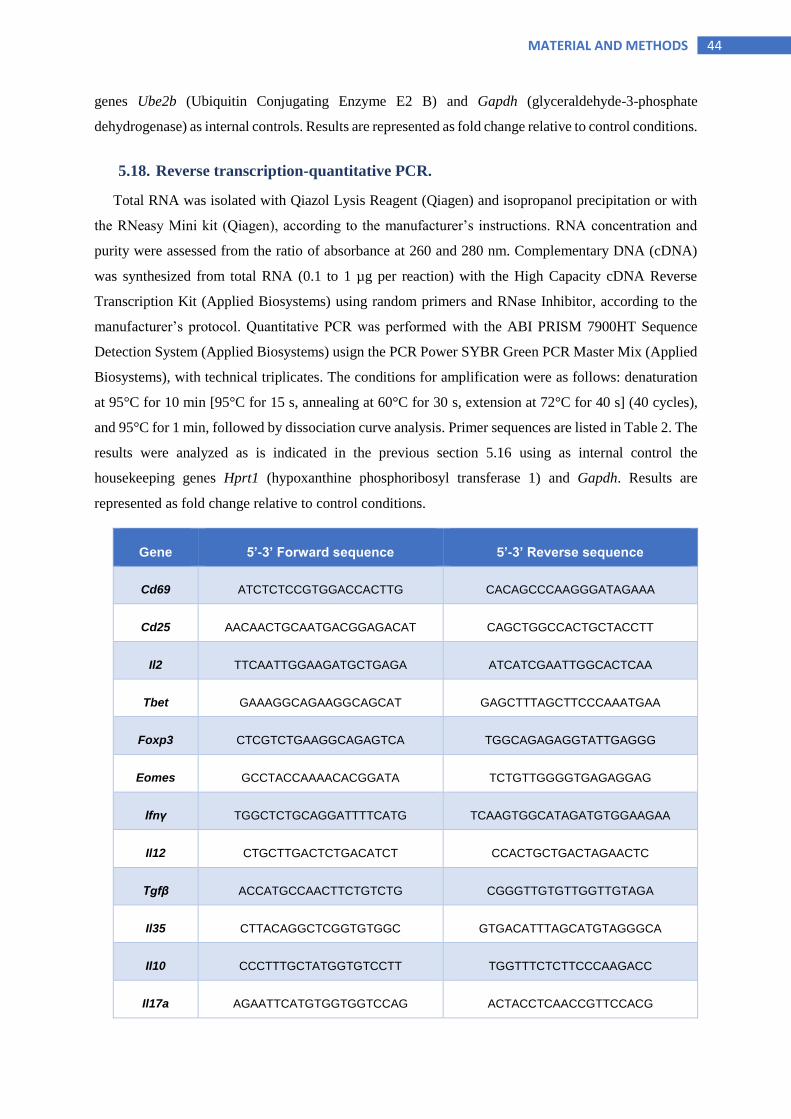
44 MATERIAL AND METHODS
genes Ube2b (Ubiquitin Conjugating Enzyme E2 B) and Gapdh (glyceraldehyde-3-phosphate
dehydrogenase) as internal controls. Results are represented as fold change relative to control conditions.
5.18. Reverse transcription-quantitative PCR.
Total RNA was isolated with Qiazol Lysis Reagent (Qiagen) and isopropanol precipitation or with
the RNeasy Mini kit (Qiagen), according to the manufacturer’s instructions. RNA concentration and
purity were assessed from the ratio of absorbance at 260 and 280 nm. Complementary DNA (cDNA)
was synthesized from total RNA (0.1 to 1 µg per reaction) with the High Capacity cDNA Reverse
Transcription Kit (Applied Biosystems) using random primers and RNase Inhibitor, according to the
manufacturer’s protocol. Quantitative PCR was performed with the ABI PRISM 7900HT Sequence
Detection System (Applied Biosystems) usign the PCR Power SYBR Green PCR Master Mix (Applied
Biosystems), with technical triplicates. The conditions for amplification were as follows: denaturation
at 95°C for 10 min [95°C for 15 s, annealing at 60°C for 30 s, extension at 72°C for 40 s] (40 cycles),
and 95°C for 1 min, followed by dissociation curve analysis. Primer sequences are listed in Table 2. The
results were analyzed as is indicated in the previous section 5.16 using as internal control the
housekeeping genes Hprt1 (hypoxanthine phosphoribosyl transferase 1) and Gapdh. Results are
represented as fold change relative to control conditions.
Gene 5’-3’ Forward sequence 5’-3’ Reverse sequence
Cd69 ATCTCTCCGTGGACCACTTG CACAGCCCAAGGGATAGAAA
Cd25 AACAACTGCAATGACGGAGACAT CAGCTGGCCACTGCTACCTT
Il2 TTCAATTGGAAGATGCTGAGA ATCATCGAATTGGCACTCAA
Tbet GAAAGGCAGAAGGCAGCAT GAGCTTTAGCTTCCCAAATGAA
Foxp3 CTCGTCTGAAGGCAGAGTCA TGGCAGAGAGGTATTGAGGG
Eomes GCCTACCAAAACACGGATA TCTGTTGGGGTGAGAGGAG
Ifnγ TGGCTCTGCAGGATTTTCATG TCAAGTGGCATAGATGTGGAAGAA
Il12 CTGCTTGACTCTGACATCT CCACTGCTGACTAGAACTC
Tgfβ ACCATGCCAACTTCTGTCTG CGGGTTGTGTTGGTTGTAGA
Il35 CTTACAGGCTCGGTGTGGC GTGACATTTAGCATGTAGGGCA
Il10 CCCTTTGCTATGGTGTCCTT TGGTTTCTCTTCCCAAGACC
Il17a AGAATTCATGTGGTGGTCCAG ACTACCTCAACCGTTCCACG

45 MATERIAL & METHODS
Rorγt GGTGACCAGCTACCAGAGGA AGCTCCATGAAGCCTGAAAG
Il23 CAACTTCACACCTCCCTAC CCACTGCTGACTAGAACT
Il6 GACAAAGCCAGAGTC CTTCAGAGA CTAGGTTTGCCGAGTAGATCTC
Il22 CCGAGGAGTCAGTGCTAAGG CATGTAGGGCTGGAACCTGT
Lmna TGAGTACAACCTGCGCTCAC TGACTAGGTTGTCCCCGAAG
Lmnb1 CAACTGACCTCATCTGGAAGAAC TAAGACTGTGCTTCTCTGAGC
Hprt1 CCTAAGATGAGCGCAAGTTGAA CCACAGGACTAGAACACCTGCTAA
Gapdh CTACACTGAGGACCAGGTTGTC GGTCTGGGATGGAAATTGTG
Gzma GACTGCTGCCCACTGTAACG TCAATATCTGTTGTTCTGGCTCCTTA
Gzmb TGTCTCTGGCCTCCAGGACAA CTCAGGCTGCTGATCCTTGATCGA
Prf1 GCGTCTCCAGTGAATACAAAG
CTCCAGTGAATACAAAG-
TACTTCGACGTGACGCT
Blimp1 ACACACAGGAGAGAAGCCACATGA TCGAAGGTGGGTCTTGAGATTGCT
Icos GCTCGGCCGATCATAGGATGT CCTCCACTAAGGTTCCTTTCTTG
Gitr CAAGGTTCAGAACGGAAGT GAAGATGACAGTCAAATG
Ctla4 GCTTCCTAGATTACCCCTTCTGC AGGTGCCCGTGCAGATGGAA
Pd1 CGTCCCTCAGTCAAGAGGAG GTCCCTAGAAGTGCCCAACA
Cd49b CCGGGTGCTACAAAAGTCAT GTCGGCCACATTGAAAAAGT
Lag3 TCACTGTTCTGGGTCTGGAG GGTAAAGTCGCCATTGTCTC
Rarα GGCGAACTCCACAGTCTTAATG
GCTGGGCAAGTACACTACGAAC
Rarβ GGGGTATACCTGGTACAAATTCTGA
CAGCTGGGTAAATACACCACGAA
Table 2. List of the primers used for RT-qPCR technique.
5.19. Flow cytometry.
CD4+ T-cells were stimulated with PMA (20 ng/ml) plus ionomycin (1μg/ml) for 6 hours. Brefeldin
A (Sigma-Aldrich) was added for the last two hours to allow intracellular cytokine accumulation.
Surface antigens were stained with antibodies, then fixed and made permeable with either a Cytofix/
46 MATERIAL AND METHODS
Cytoperm kit (BD Biosciences), and then intracellular cytokines and transcription factors in cells were
stained. For Foxp3 staining Mouse Foxp3 Buffer set (BD Biosciences) was used. For lamin A/C
intranuclear staining 0.5% Triton X-100 permeabilization was used during 5 min. The antibodies were
used following concentrations suggestions of manufacturers. Data were acquired on FACSCantoII or
LSRFortessa flow cytometers (BD Biosciences), and analyzed with BD FACSDIVA (BD Biosciences)
or FlowJo (Treestar Inc.) software.
5.20. Immunofluorescence and microscopy.
CD4+ T-cells were plated onto Poly-L-Lys-coated slides (50 µg/ml; Sigma-Aldrich) during 1 h at
37ºC. Next, samples were fixed with 4% paraformaldehyde and permeabilized with 0.5% Triton X-
100/PBS solution during 5 min at RT. Alexa488 conjugated anti-mouse lamin A/C (1:100, Cell
Signaling), and DAPI (1:500, ThermoFisher) were incubated during 1 hour at RT.
Samples were mounted in Fluoromount-G imaging medium, and immunofluorescence images were
acquired with a Zeiss LSM700 confocal microscope (Plan-Apochromat 631.4, 401.3, 251.2 oil
objective; Carl Zeiss, Oberkochen,Germany). Images were analyzed using ImageJ Fiji software and
Imaris software (Bitplane) by an observer blinded to genotype.
5.21. Retroviral production and transfection.
Plasmids pBABE-puro-GFP-wt-lamin A and pBABE-GFP were obtained from Addgene, and
Phoenix-Eco retrovirus producer cell line were kindly provided by Dr. Daniel Martín Pérez (Viral
Vector Unit of CNIC). The day before plasmid transfection, Phoenix-Eco cells were grown in DMEM
medium (GIBCO) supplemented with 10% FBS, 100 mg/mL penicillin, and 100 mg/mL streptomycin
(complete DMEM). The next morning, Phoenix-Eco cells were passed 1:5 adding 20 mL of complete
DMEM to each p150 plate. After 5-6 h of incubation at 37ºC and 5% CO2, 36.25 μg of each plasmid
was added separately to 75 μl of ClCa2 2.5 M and 1250 μl of HBS (Hepes-Buffered Saline) buffer 1X
(pH 7.1). The mix was vortexed 5 sec at 1600-1800 rpm, and incubated 20 min at RT. Next, each mix
was added slowly to the cells. After 16-18 h of incubation at 37ºC and 5% CO2, the cell medium was
changed to 12.5 mL of fresh complete DMEM and cells were incubated again at 37ºC and 5% CO2 for
48 h. Then, supernatants containing the retroviruses of interest were used to infect CD4+ T-cells,
previously activated with anti-CD3/anti-CD28 for 48 h. Activated T-lymphocytes were resuspended in
each supernatant in a concentration of 1106 of T-cells/mL, adding 6 µg/ml of Polybrene transfection
reagent (Merck), and centrifuging 90 min at 2200 rpm and RT. Then, T-lymphocytes were washed and
resuspended in fresh RPMI medium.
5.22. Quantitative proteomic analysis.
CD4+ T-cells were extracted and in vitro incubated during 48 hours as is described on 5.3 section.
The same FACS selection described before in 5.17 section was developed. For proteomics analysis,

47 MATERIAL AND METHODS
samples were treated with 50 mM Tris-HCl – 2% SDS – 10 mM TCEP (Tris-2-carboxyethyl) phosphine
hydrochloride, Pierce) for protein extraction. Protein concentration was determined by using a Direct
Detect IR spectrometer (Millipore). For the quantitative differential analysis by LC-MS/MS by using
isobaric tags (TMT 10-plex), about 100 µg of total proteins were digested. Samples were denatured by
adding 20% SDS to 0.2% SDS and 500 mM iodoacetamide (IAA) to 50 mM IAA and boiling 5 min.
After incubation at the dark for 30 min at RT, samples were diluted in 7 M urea in 0.1 M Tris-HCl
(pH8.5) (UA), and loaded onto 10 kDa centrifugal filter devices (NanoSep 10k Omega, Pall Life
Sciences). The buffer was replaced by washing filters with UA, and proteins were then reduced with 10
mM TCEP for 30 min, washed with Hepes buffer 50mM and alkylated using 50 mM MMTS (methyl
methanethiosulfonate, Pierce) in UA for 20 min in the dark. The excess of alkylating reagent was
eliminated by washing three times with UA and three additional times with 50 mM ammonium
bicarbonate. Proteins were digested overnight at 37ºC with modified trypsin (Promega) in 50 mM
ammonium bicarbonate at 30:1 protein:trypsin (w/w) ratio. The resulting peptides were eluted by
centrifugation with 50 mM ammonium bicarbonate (twice) and 0.5 M sodium chloride. Trifluoroacetic
acid (TFA) was added to a final concentration of 1% and the peptides were desalted onto C18 Oasis-
HLB cartridges and dried-down for further analysis. For stable isobaric labelling, the resulting tryptic
peptides were dissolved in 100 mM Triethylammonium bicarbonate (TEAB) buffer, and the peptide
concentration was determined by measuring amide bonds with the Direct Detect system (Millipore).
Equal amounts of each peptide sample were labelled using the 10-plex TMT Reagents (Thermo Fisher)
according to manufacturer's protocol. Peptides were labelled with TMT reagents previously
reconstituted with 70 μl of acetonitrile, and after incubation at RT for 2h, reaction was stopped with
0.5% TFA, incubated for 30 min, and peptides were combined. Samples were concentrated in a Speed
Vac, desalted onto C18 Oasis-HLB cartridges and dried-down for further analysis. For increasing
proteome coverage, TMT-labeled samples were fractionated by high-pH reverse phase chromatography
(High pH Reversed-Phase Peptide Fractionation Kit, Pierce) and concentrated as before.
Labelled peptides were analyzed by LC-MS/MS using a C-18 reversed phase nano-column (75 µm
I.D. x 50 cm, 2 µm particle size, Acclaim PepMap RSLC, 100 C18; Thermo Fisher Scientific) in a
continuous acetonitrile gradient consisting of 0-30% B in 360 min, 50-90% B in 3 min (A= 0.1% formic
acid; B=90% acetonitrile, 0.1% formic acid). A flow rate of 200 nL/min was used to elute peptides from
the nano-column to an emitter nanospray needle for real time ionization and peptide fragmentation on
an Orbitrap Fusion mass spectrometer (Thermo Fisher). An enhanced FT-resolution spectrum
(resolution=70,000) followed by the MS/MS spectra from the Nth most intense parent ions were
analyzed along the chromatographic run. Dynamic exclusion was set at 40s. For peptide identification,
all spectra were analyzed with Proteome Discoverer (version 2.1.0.81, Thermo Fisher Scientific) using
SEQUEST-HT (Thermo Fisher Scientific). For database searching at the Uniprot database containing
all sequences from human and contaminants (may 14, 2016; 70611 entries), the parameters were selected

48 MATERIAL AND METHODS
as follows: trypsin digestion with 2 maximum missed cleavage sites, precursor and fragment mass
tolerances of 2 Da and 0.02 Da, respectively, TMT modifications at N-terminal and Lys residues as
fixed modifications, and methionine oxidation, carbamidomethyl cysteine and MMTS modified-
cysteine as dynamic modification. Peptide identification was performed using the probability ratio
method and false discovery rate (FDR) was calculated using inverted databases, and the refined method
with an additional filtering for precursor mass tolerance of 15 ppm. Identified peptides had a FDR equal
or lower than 1% FDR. Only those peptides were used to quantify the relative abundance of each protein
from reporter ion intensities, and statistical analysis of quantitative data were performed using the WSPP
statistical model previously described. In this model proteilog2-ratios are expressed as standardized
variables, in units of standard deviation according to their estimated variances (Zq values).
Functional protein analysis of the whole set of quantified proteins was performed using a novel
algorithm, system biology triangle (SBT) developed specifically for the analysis of coordinated protein
responses in high-throughput quantitative proteomics experiments. This algorithm correlates the
performance of a group of proteins inside of a category (biological process) in terms of their quantitative
behavior (relative abundance); thus, changes can be detected in functional biological processes far
beyond individual protein responses. As a result of this coordinated behavior, a Z value is assigned to
each category. To identify the significant biological process altered in disease progressions, groups were
compared to the control group applying p< 0.01.Variations in the abundance of annotated functional
categories were visualized by comparing the cumulative frequency (sigmoid) plots of the standardized
variable with that of the normal distribution, as in previous works. Individual protein changes were also
considered for further analysis.
5.23. Statistical analysis.
Statistical analyses were performed with Prism GraphPad or Microsoft Office Excel. Unless
otherwise stated, statistical significance was calculated by two-tailed Student’s t-test. When specified,
one-way ANOVA or two-way ANOVA with Bonferroni’s post-hoc multiple comparison test was used.
Significance of differences was calculated as follows: *P<0.05, **P<0.01, ***P<0.001, and ****
P<0.0001.

Results


51 RESULTS
6. RESULTS
6.1. Analysis of lamin A/C deficiency effect in CD4+ T-cell development.
CD4-CREtg/wt- Lmnaflox/flox (CD4-Lmna-/- from now on) was generated in order to knockdown lamin
A/C specifically in CD4+ T-cells. Lamin A/C expression levels were analyzed by immunofluorescence
at 48 hours (h) in in vitro activated CD4+ T-cells with anti-CD3/CD28 antibodies (Figure 10A). Results
showed a significant decrease of lamin A/C expression in CD4+ T-cells from CD4-Lmna-/- mice in
comparison to CD4+ T-cells from CD4-CREwt/wt- Lmnaflox/flox (WT from now on) mice. Mean
fluorescence intensity (MFI) was also analyzed by flow cytometry (Figure 10B) showing as well a
significant decrease of lamin A/C expression per cell in Lmna-/- mice. However, lamin A/C knockdown
in CD4+ T-cells was not complete, and we observed some lamin A/C+ cells coming from Lmna-/- mice,
particularly in flow cytometry analysis (Figure 10B).
CD4-Lmna-/- mice showed the same physical appearance and body weight as WT mice (Figure 11A).
Additionally, organs of the immune system as spleen and thymus present the same size, weight and
morphology in CD4-Lmna-/-compared with WT mice (Figure 11B). Moreover, basal T-cell populations
were analyzed in thymus, spleen and lymph nodes (LN) in CD4-Lmna-/- and WT mice in order to
corroborate that lamin A/C downregulation does not affect T-cell development and selection in thymus.
No differences were observed in percentages of CD4+ CD8-, CD4- CD8+, and CD4+CD8+ populations in
any of the organs that were analyzed (Figure 12).
Not all the experiments were performed with CD4-Lmna-/- mice model, BM adoptive transfer
technique from full Lmna-/- knockout (Lmna-/- from now on) was also used to carry out several
experiments, in order to study the behavior of lamin A/C deficient CD4+ T-cells. To can guarantee that
this model is valid to perform in vitro, and particularly, in vivo experiments, we carried out immune
chimeras with CD45.2-Lmna-/- and CD45.1-WT BM in a 1:1 ratio, into a CD45.1/CD45.2 WT recipient
mice. One month after the adoptive transfer, the percentage of CD4+ and CD8+ T-cells from the two
genotypes was analyzed. Our results showed that BM reconstitution worked nicely, and that T-cells
population percentages were similar in Lmna-/- and WT adoptively transferred mice (Figure 13). This
experiment demonstrates that lamin A/C does not affect T-cell development.

52 RESULTS
Figure 10. Lamin A/C downregulation in CD4+ T-cells of CD4-CREtg/wt- Lmnaflox/flox (Lmna-/-) mice.
Naïve CD4 + T-cells were isolated from WT and Lmna-/- mice spleens, and stimulated with anti CD3/CD28
antibodies for 2 days. (A) Immunofluorescent labelling of the nuclear envelope protein lamin A/C (green) in
48 h-activated CD4+ T-cells counterstained with DAPI (blue). Merge of both colors is also shown. Scale bars
of 60 µm and 25 µm. Graph shows the percentage of lamin A/C expressing cells quantification. (B)
Representative histogram and graph of lamin A/C mean fluorescence intensity (MFI) analysis by flow
cytometry. (n=3 pool of 2 mice of each genotype). Data are means SEM of 6 samples per genotype analyzed
by unpaired Student’s t-test. *P<0.05; ***P<0.001.

53 RESULTS
Figure 11. CD4-CREtg/wt-
Lmnaflox/flox (Lmna-/-) mice show
same body weight and lymphoid
organs development as CD4-
CREwt/wt- Lmnaflox/flox (WT). Mice
were sacrificed at 6 weeks of age.
(A) Representative photograph and
graph of mice body weight (g). Data
are means SEM analyzed by
unpaired Student’s t-test. (B)
Representative photograph and
graph of thymus and spleen size
(mm) and weight (g). Scale bar of 12
mm (n=6 mice of each genotype).
Data are means SEM analyzed by
unpaired Student’s t-test. ns= not
significant.
Figure 12. CD4-CREtg/wt- Lmnaflox/flox (Lmna-/-) mice show same basal T-cell populations as CD4-
CREwt/wt- Lmnaflox/flox (WT). Mice were sacrified at 6 weeks of age, and T-cells from thymus, spleen and
lymph nodes (LN) were analyzed by flow cytometry. Representative plots and graphs of CD4+CD8- CD4-CD8+
CD4+CD8+ T-cell populations of thymus, spleen and LN (n=6 mice of each genotype) are shown. Data are
means SEM analyzed by one-way ANOVA with Bonferroni’s multiple comparison test.

54 RESULTS
6.2. Characterization of lamin A/C role in T-cell activation and proliferation.
6.2.1. Lamin A/C enhances CD4+ T-cell activation in vitro and in vivo.
Lamin A/C is an important regulator of CD4+ T-cell activation, facilitating IS formation and
upregulating CD69 and CD25 membrane receptors expression (González-Granado J.M., et al 2015).
Now, we have corroborated lamin A/C expression pattern in CD4+ T-cells isolated from mice spleen
and lymph nodes. As it was previously described (González-Granado JM, et al 2015), lamin A/C is
expressed upon TCR activation raising its maximum peak of expression after 48 h, and afterwards, lamin
A/C is downregulated again (Figure 14A). Moreover, we have corroborated in vitro and in vivo that
lamin A/C upregulates CD69 and CD25, surface markers of a proper T-cell activation. Cd69 and Cd25
expression were measured at mRNA level by RT-qPCR in CD4+ T-cells in vitro activated with anti-
CD3/CD28 antibodies during 48 h (Figure 14B). But also, its expression was analyzed at protein level
Figure 13. Bone marrow chimeras show that lamin A/C deficiency in immune cells does not affect to
CD4+ T-cell development. Irradiated WT CD45.1+/CD45.2+ recipient mice were adoptively transferred with
a 1:1 mix of bone marrow from CD45.1+/OTII WT and CD45.2+/OTII Lmna-/-(full knockout) mice. One month
after transplantation, chimerism in CD4+CD3+ and CD8+CD3+ T-cells was analyzed by flow cytometry using
anti CD45.1, CD45.2, CD4, CD8 and CD3 antibodies. Cells were isolated from bone marrow, spleen, lymph
nodes, and blood. Data are means SEM from two independent experiments analyzed by Student’s t-test (n=7
mice of each genotype). ns= not significant.
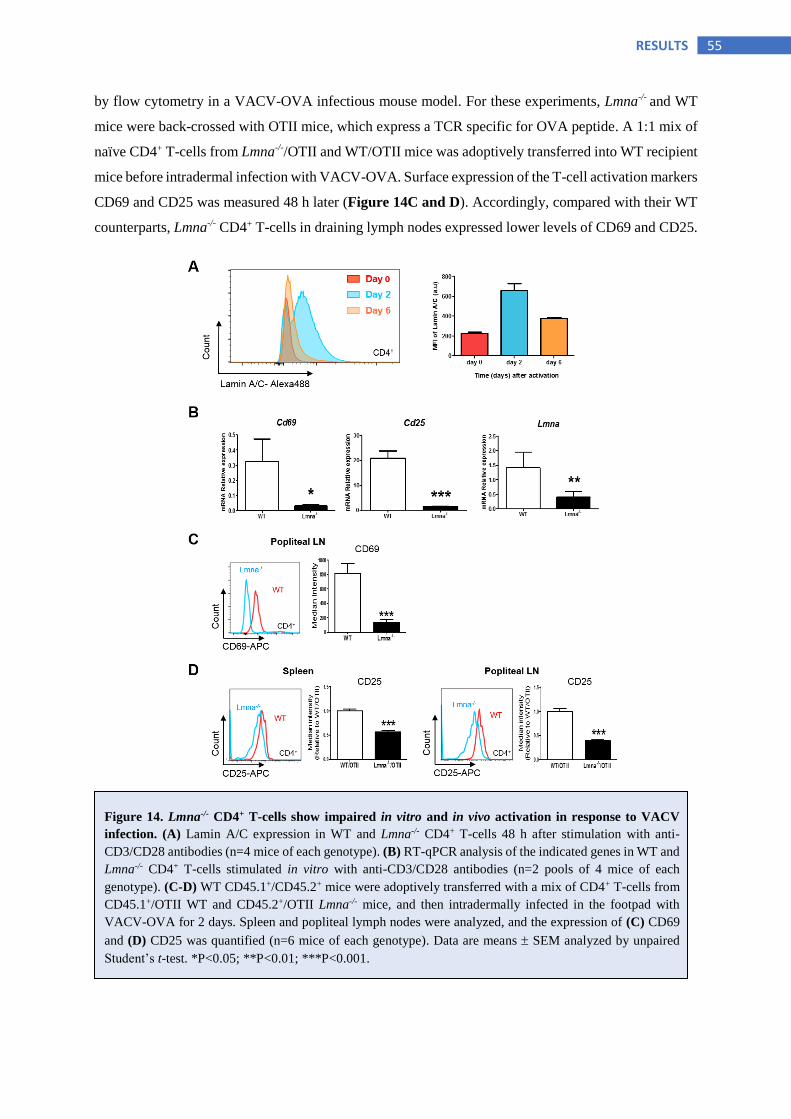
55 RESULTS
by flow cytometry in a VACV-OVA infectious mouse model. For these experiments, Lmna-/- and WT
mice were back-crossed with OTII mice, which express a TCR specific for OVA peptide. A 1:1 mix of
naïve CD4+ T-cells from Lmna-/-/OTII and WT/OTII mice was adoptively transferred into WT recipient
mice before intradermal infection with VACV-OVA. Surface expression of the T-cell activation markers
CD69 and CD25 was measured 48 h later (Figure 14C and D). Accordingly, compared with their WT
counterparts, Lmna-/- CD4+ T-cells in draining lymph nodes expressed lower levels of CD69 and CD25.
Figure 14. Lmna-/- CD4+ T-cells show impaired in vitro and in vivo activation in response to VACV
infection. (A) Lamin A/C expression in WT and Lmna-/- CD4+ T-cells 48 h after stimulation with anti-
CD3/CD28 antibodies (n=4 mice of each genotype). (B) RT-qPCR analysis of the indicated genes in WT and
Lmna-/- CD4+ T-cells stimulated in vitro with anti-CD3/CD28 antibodies (n=2 pools of 4 mice of each
genotype). (C-D) WT CD45.1+/CD45.2+ mice were adoptively transferred with a mix of CD4+ T-cells from
CD45.1+/OTII WT and CD45.2+/OTII Lmna-/- mice, and then intradermally infected in the footpad with
VACV-OVA for 2 days. Spleen and popliteal lymph nodes were analyzed, and the expression of (C) CD69
and (D) CD25 was quantified (n=6 mice of each genotype). Data are means SEM analyzed by unpaired
Student’s t-test. *P<0.05; **P<0.01; ***P<0.001.
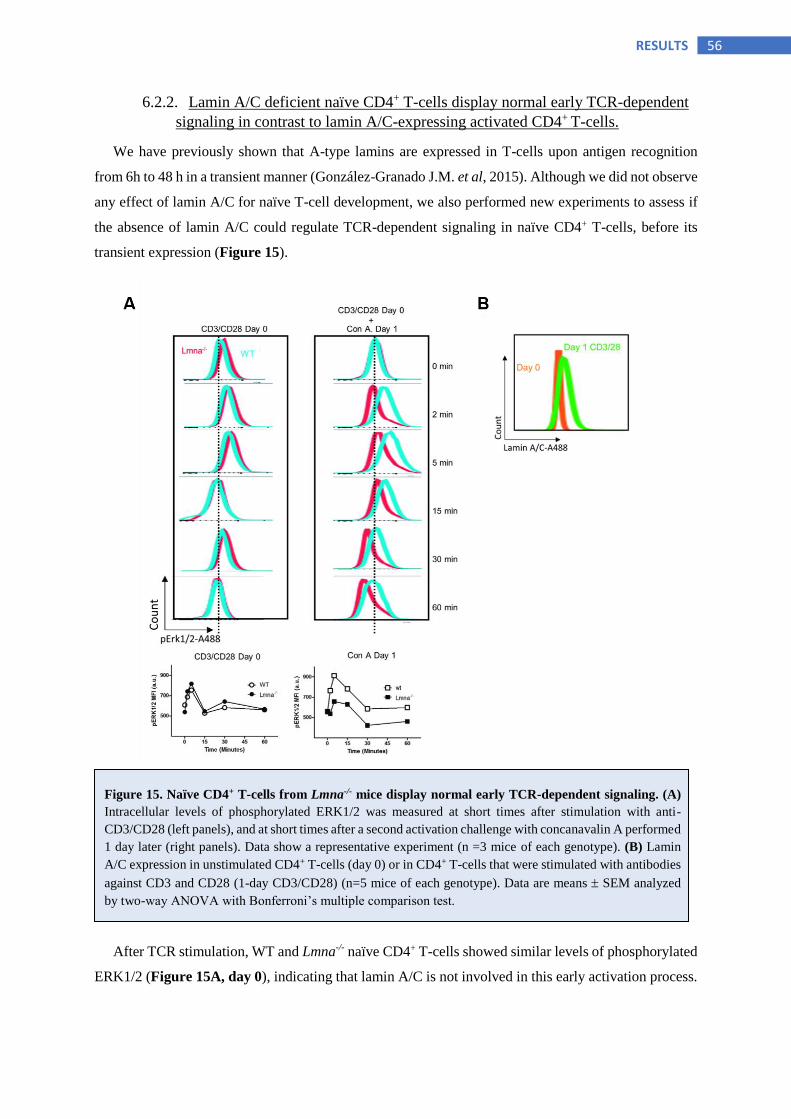
56 RESULTS
6.2.2. Lamin A/C deficient naïve CD4+ T-cells display normal early TCR-dependent
signaling in contrast to lamin A/C-expressing activated CD4+ T-cells.
We have previously shown that A-type lamins are expressed in T-cells upon antigen recognition
from 6h to 48 h in a transient manner (González-Granado J.M. et al, 2015). Although we did not observe
any effect of lamin A/C for naïve T-cell development, we also performed new experiments to assess if
the absence of lamin A/C could regulate TCR-dependent signaling in naïve CD4+ T-cells, before its
transient expression (Figure 15).
After TCR stimulation, WT and Lmna-/- naïve CD4+ T-cells showed similar levels of phosphorylated
ERK1/2 (Figure 15A, day 0), indicating that lamin A/C is not involved in this early activation process.
Figure 15. Naïve CD4+ T-cells from Lmna-/- mice display normal early TCR-dependent signaling. (A)
Intracellular levels of phosphorylated ERK1/2 was measured at short times after stimulation with anti-
CD3/CD28 (left panels), and at short times after a second activation challenge with concanavalin A performed
1 day later (right panels). Data show a representative experiment (n =3 mice of each genotype). (B) Lamin
A/C expression in unstimulated CD4+ T-cells (day 0) or in CD4+ T-cells that were stimulated with antibodies
against CD3 and CD28 (1-day CD3/CD28) (n=5 mice of each genotype). Data are means SEM analyzed
by two-way ANOVA with Bonferroni’s multiple comparison test.

57 RESULTS
A second TCR stimulation after 48 h was also induced, moment in which lamin A/C is already expressed
in WT CD4+ T-cells (Figure 15B). At this moment, levels of phosphorylated ERK1/2 were increased
in WT CD4+ T-cells. Phosphorylated ERK1/2 was induced also in Lmna-/- cells, but at lower level
compared with WT. So that, lamin A/C deficiency in activated CD4+ T-cells diminishes early TCR-
dependent signaling (Figure 15A, day 1).
6.2.3. Lamin A/C deficient CD4+ T-cells exhibit standard T-cell proliferation.
Next, we investigated if lamin A/C could regulate T-cell proliferation which occurs after antigen
recognition and activation. However, proliferation after in vitro activation with anti-CD3 and anti-CD28
antibodies for 48 h, was similar in Lmna-/- and WT CD4+ T-cells (Figure 16A). Moreover, Il2 expression
analyzed by RT-qPCR was alike between activated Lmna-/- and WT CD4+ T-cells (Figure 16B).

58 RESULTS
Similarly, after VACV infection, WT and Lmna-/- mice had similar levels of proliferating CD4+ T-
cells, as shown by Ki67 expression (Figure 16C), PCNA expression (Figure 16D), and BrDu
incorporation (Figure 16E-F). These experiments demonstrate that A-type lamins regulate T-cell
activation without affecting CD4+ T-cell proliferation.
6.3. Analysis of lamin A/C role in Th1 differentiation an effector function.
6.3.1. Lamin A/C regulates Th1 differentiation in vitro.
To analyze the role of A-type lamins in T-cell differentiation, naïve CD4+ T-cells were isolated from
Lmna-/-/OTII or WT/OTII mice and co-cultured with OVA-loaded WT APCs in the absence of
polarizing cytokines. Compared with WT CD4+ T-cells, fewer Lmna-/- CD4+ T-cells were IFNγ+,
indicating the importance of lamin A/C for Th1 differentiation (Figure 17A). This difference was not
abolished by addition of IL-2 (Figure 17B). We next directed Th1 or Th2 differentiation in vitro by
incubating WT and Lmna-/- CD4+ T-cells with anti-CD3 and anti-CD28 antibodies, polarizing cytokines,
and Th1 or Th2 blocking antibodies. Interestingly, Lmna-/- CD4+ T-cells produced fewer Th1-cells than
WT cells but similar numbers of Th2 cells (Figure 17C). Th1 differentiation triggered by co-culture
with OVA-loaded WT APCs in the presence of Th1 polarizing cytokines was also lower in CD4+ T-
cells from Lmna-/-/OTII mice than in WT/OTII T-cells (Figure 17D). These experiments suggest that
lamin A/C is an important intrinsic regulator of T-cell differentiation following TCR stimulation.
Figure 16. Lmna-/- CD4+ T-cells show similar in vitro and in vivo proliferation rate. (A) Splenocytes from
CD45.1+ WT/OTII and CD45.2+ Lmna-/-/OTII mice were mixed, stained with cell violet, and cultured in the
presence of OVA for 2 days. CD4+ T-cell proliferation was quantified and the number of cell divisions is
shown in the graph. Data are means SEM of six independent experiments analyzed by two-way ANOVA
with Bonferroni’s multiple comparison test. (B) RT-qPCR analysis of Il2 gene in WT and Lmna-/- CD4+ T-
cells stimulated in vitro with anti-CD3/CD28 antibodies (n=2 pools of 4 mice of each genotype). (C-D) CD4+
T-cells from CD45.1+ WT and CD45.2+ Lmna-/- mice were mixed 1:1 and adoptively transferred to
CD45.1/CD45.2 WT mice. Recipient mice were then intraperitoneally infected with VACV for 7 days. The
peritoneal exudates and mesenteric lymph nodes (LN) were analyzed, and the percentage of (C) Ki67+ or (D)
PCNA+ CD4+ T-cells was quantified (n=5 mice of each genotype from two independent experiments). Data
are means SEM analyzed by unpaired Student’s t-test. (E) CD45.1+ WT recipient mice were transplanted
with a 1:1 mix CD45.1+ WT and CD45.2+ Lmna-/- bone marrow and infected intraperitoneally with VACV.
Mice were injected with BrdU, and 24 h later the percentage of BrdU+ CD4+ T-cells was quantified in
mesenteric LN, peritoneal exudate, and spleen (n=3 mice of each genotype from one representative
experiment). Data are means SEM analyzed by paired Student’s t-test. (F) CD4+ T-cells from CD45.2+ WT
or CD45.2+ Lmna-/- mice were mixed 1:1 and adoptively transferred to CD45.1+/CD45.2+ WT mice. Recipient
mice were infected intraperitoneally with VACV for 6 days and injected with BrdU. After 24 h, the percentage
of BrdU+ CD4+ T-cells was quantified in the peritoneal exudate and mesenteric LN (n=5 mice of each
genotype). Data are means SEM analyzed by paired Student’s t-test.

59 RESULTS
6.3.2. Lamin A/C enhances Th1 responses in vivo.
To investigate the role of lamin A/C in Th1 differentiation in vivo, mice were infected with VACV,
which provokes a robust Th1 immune response in mice (Swain S.L. et al, 2012; Munier C.M. et al,
2016). At 3 days after i.p. VACV infection, the frequency of IFN+ CD4+ T-cells in MLN and peritoneal
exudate was lower in Lmna-/- mice than in WT mice (Figure 18A-B). To study the role of lamin A/C
specifically in the immune system, we reconstituted lethally irradiated WT CD45.1 mice with CD45.2
BM from WT or Lmna-/- mice for 2 months. Confirmation of bone marrow reconstitution with anti
CD45.1 and CD45.2 antibodies revealed no significant differences between genotypes. After i.p.
Figure 17. Impaired in vitro Th1 differentiation of CD4+ T-cells from Lmna-/- mice. Percentage of IFN+
and IL4+ CD4+ T-cells isolated from WT or Lmna-/- mice. (A) CD4+ T-cells from WT/OTII or Lmna-/-/OTII
mice were cocultured with OVA-loaded WT APCs for 4 days. Data are means SEM of at least three
independent experiments analyzed by unpaired Student’s t-test. (B) CD4+ T-cells were stimulated with anti-
CD3/CD28 antibodies for 4 days in the presence of IL-2. Data are means SEM of at least five independent
experiments analyzed by unpaired Student’s t-test. (C) CD4+ T-cells were stimulated with anti-CD3/CD28
antibodies for 4 days in the presence of cytokines and antibodies to trigger Th1 or Th2 differentiation in vitro.
Data are means SEM of at least four independent experiments analyzed by unpaired Student’s t-test. (D)
CD4+ T-cells from WT/OTII or Lmna-/-/OTII mice were cocultured with OVA-loaded WT APCs for 4 days in
the presence of cytokines and antibodies to trigger Th1 differentiation. Data are means SEM of three
independent experiments analyzed by unpaired Student’s t-test. **P<0.01; ***P<0.001.

60 RESULTS
infection with VACV, we analyzed the frequency of IFNγ+ and IL-4+ in CD4+ T-cells. Lmna-/--
reconstituted mice had proportionately fewer IFNγ+ T-cells, and similar numbers of IL4+ T-cells with
respect to WT-reconstituted mice, in both spleen and peritoneal exudate (Figure 18C). To trigger
antigen-specific Th1 responses in vivo, we reconstituted WT mice with either WT/OTII or Lmna-/-/OTII
bone marrow, and then, infected the mice i.p. with VACV-OVA. As before, the Lmna-/-/OTII-
reconstituted CD4+ population included a lower proportion of IFNγ+ cells than WT/OTII-derived CD4+
cells (Figure 18D).

61 RESULTS
Moreover, reconstitution with a mix of bone marrow from WT/OTII and Lmna-/-/OTII mice produced
a lower percentage of IFNγ+ CD4+ T-cells in Lmna-/-/OTII than in WT/OTII cells (Figure 18E). Our
results thus indicate that lamin A/C depletion in the hematopoietic compartment impairs Th1
differentiation in vitro and in vivo.
The observed phenotype could in principal be related to the absence of lamin A/C in any
radiosensitive immune cell. Therefore, to directly assess the importance for Th1 differentiation of lamin
A/C in CD4+ T-cells, we adoptively transferred WT mice with CD4+ T-cells from WT/OTII or Lmna-/-
/OTII mice. Th1 differentiation from Lmna-/- CD4+ T-cells was weaker than from their WT counterparts,
producing a lower percentage of IFNγ+ CD4+ T-cells (Figure 19A). Similar results were obtained when
WT recipient mice were transferred with a mix of CD4+ T-cells from WT/OTII and Lmna-/-/OTII mice
followed by VACV-OVA inoculation, either i.p. (Figure 19B) or subcutaneously in the footpad (Figure
19C). These results indicate that lamin A/C expression specifically regulates CD4+ T-cell differentiation
toward Th1 cells in vivo.
We next investigated whether the action of lamin A/C in CD4+ T-cell polarization was related to
antigen presentation by DCs. WT mice first received subcutaneous injections of LPS-matured OVA-
loaded BMDCs, which trigger Th1 differentiation (Sen D. et al, 2010), and 18 h later received
intravenous injections of WT/OTII or Lmna-/-/OTII CD4+ T-cells. After 7 days, Th1 differentiation of
adoptively transferred T-cells was analyzed in draining lymph nodes. Lmna-/-/OTII CD4+ T-cells
produced fewer IFNγ+ CD4+ T-cells in the presence of LPS-treated BMDCs than their WT/OTII
counterparts (Figure 19D). In other experiments, WT mice received subcutaneous injections of splenic
CD11c+ DCs incubated in medium containing LPS or papain for 4 h to potentiate antigen-dependent T-
cell differentiation to Th1 or Th2, respectively (Sen D. et al, 2010; Sokol C.L. et al, 2008). As before,
18h later, the mice received intravenous injections of WT/OTII or Lmna-/-/OTII CD4+ T-cells, and Th1
and Th2 differentiation was analyzed in draining lymph nodes after 7 days. Again, Lmna-/- CD4+ T-cells
produced fewer IFNγ+ CD4+ T-cells in the presence of LPS-treated BMDCs than their WT counterparts;
Figure 18. Impaired in vivo Th1 differentiation of naïve CD4+ T-cells from Lmna-/- mice. Percentage of
IFN+ or IL4+ CD4+ T-cells upon VACV infection. (A-B) WT and Lmna-/- mice were intraperitoneally infected
with VACV, and after 3 days mesenteric LN (A) and peritoneal exudate (B) were analyzed, (n=11 WT and 7
Lmna-/- mice). (C) Irradiated CD45.1+ WT mice were reconstituted with CD45.2+ WT or CD45.2+ Lmna-/-
bone marrow, and intraperitoneally infected with VACV. After 5 days, spleens and the peritoneal exudate
were analyzed by flow cytometry (n=8-11 mice from two independent experiments). (D) Irradiated CD45.1+
WT mice were reconstituted with CD45.2+ WT/OTII or CD45.2+ Lmna-/-/OTII bone marrow and infected
intraperitoneally with VACV-OVA. After 5 days, peritoneal exudate was analyzed (n=9 mice from two
independent experiments). (E) Irradiated CD45.1+/CD45.2+ WT mice were reconstituted with a mix of
CD45.1+ WT/OTII with CD45.2+ Lmna-/-/OTII BM. Five days after VACV-OVA i.d infection in the footpad,
popliteal lymph nodes were analyzed (n=9 mice from two independent experiments). Data are means SEM
analyzed by paired Student’s t-test. *P<0.05; **P<0.01; ***P<0.001.
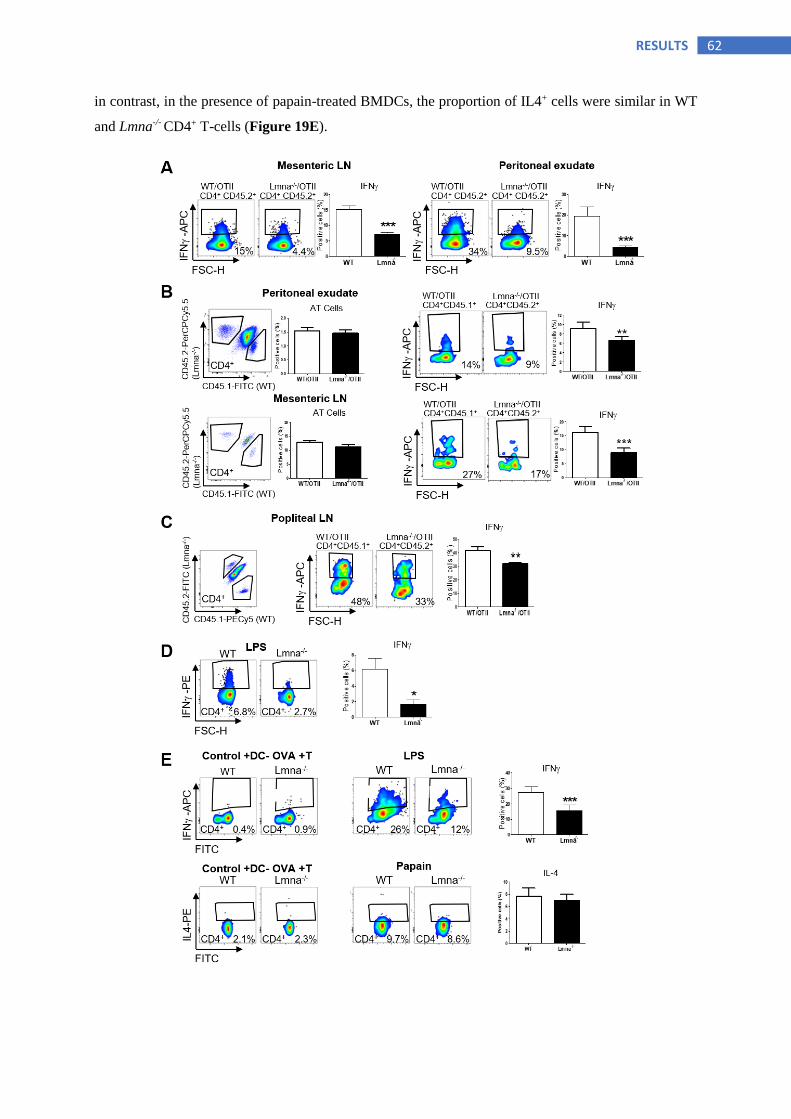
62 RESULTS
in contrast, in the presence of papain-treated BMDCs, the proportion of IL4+ cells were similar in WT
and Lmna-/- CD4+ T-cells (Figure 19E).

63 RESULTS
6.3.3. Lamin A/C enhances T-bet expression.
The master regulator of Th1 differentiation is T-bet. Analysis of T-bet expression in CD4+ T-cells
revealed that the absence of A-type lamins reduced both the percentage of T-bet+ cells and the T-bet
expression level in anti-CD3/CD28-stimulated CD4+ T-cells (Figure 20A and B). In agreement with
the effect on Th1 differentiation, lamin A/C deficiency also diminished the percentage of IFN+ CD4+
T-cells (Figure 20A). Similar results were obtained when cells were stimulated with anti-CD3/CD28
antibodies in the presence of Th1-differentiation cytokines (Figure 20C). Moreover, lamin A/C
expression was also important for T-bet expression in vivo after Th1 differentiation triggered by VACV
infection (Figure 20D). Low T-bet protein expression in Lmna-/- T-cells was accompanied by lower
mRNA expression in vitro (Figure 20E), suggesting regulation at the level of mRNA synthesis.
A-type lamins regulate TCR clustering and subsequent downstream signaling upon T-cell activation
(González-Granado J.M. et al, 2014). However, altered Th1 differentiation in the absence of lamin A/C
was not exclusively related to differences in TCR clustering, since the percentage of IFN+ and T-bet+
Lmna-/- CD4+ T-cells was also lower after TCR-independent T-cell stimulation with PMA and
ionomycin (Figure 20A).
Figure 19. Compromised in vivo Th1 differentiation of naïve CD4+ T-cells from Lmna-/- mice. Percentage
of IFN+ CD4+ T-cells. (A) Recipient CD45.1+ WT mice were adoptively transferred with CD45.2+ WT/OTII
or CD45.2+ Lmna-/-/OTII CD4+ T-cells. Five days after intraperitoneal VACV-OVA infection, mesenteric
lymph nodes and the peritoneal exudate were analyzed (n=10 WT and 9 Lmna-/- mice from two independent
experiments). Data are means SEM analyzed by unpaired Student’s t-test. (B) CD45.1+/CD45.2+ WT mice
were adoptively transferred with a mix of CD45.1+ WT/OTII and CD45.2+ Lmna-/-/OTII CD4+ T-cells and
infected intraperitoneally with VACV-OVA. After 5 days, peritoneal exudate and mesenteric lymph nodes
were analyzed (n=11 mice from two independent experiments). Data are means SEM analyzed by paired
Student’s t-test. (C) CD45.1+/CD45.2+ WT mice were adoptively transferred as in B, and after 5 days of
intradermal infection with VACV-OVA the popliteal lymph nodes were analyzed (n=6 mice from two
independent experiments). Data are means SEM analyzed by paired Student’s t-test. (D) OVA-loaded LPS-
matured BMDCs were adoptively transferred to WT recipient mice. After 18h, recipients received intravenous
injections of a mix of CD45.1+ WT and CD45.2+ Lmna-/-/OTII CD4+ naïve T-cells. Four days later, the
popliteal lymph nodes were analyzed (n=3 mice from one representative experiment out of two). Data are
means SEM analyzed by unpaired Student’s t-test. (E) Isolated splenic CD11c+ cells were incubated with
OVA and LPS or with OVA and papain for 4h, and then adoptively transferred to WT recipients. Control mice
were transferred with CD11c+ cells in the absence of OVA (DC-OVA). After 18h, recipients received
intravenous injections of a mix of CD45.1+ WT and CD45.2+ Lmna-/- CD4+ naïve T-cells. Four days later, the
popliteal lymph nodes were analyzed. The percentage of IL4+ CD4+ T-cells was also investigated (n=4 mice
from two independent experiments). Data are means SEM analyzed by unpaired Student’s t-test. *P< 0.05;
**P<0.01; ***P<0.001.

64 RESULTS
Figure 20. Lmna-/- CD4+ T-cells show impaired in vitro and in vivo T-bet expression. (A) Percentage of
IFN+ and T-bet+ cells after stimulation of CD4+ T-cells from WT and Lmna-/- mice with anti-CD3/CD28
antibodies, or PMA plus ionomycin for 4 days in the presence of IL-2. (B) T-bet and lamin A/C expression in
WT and Lmna-/- CD4+ T-cells 48 h after stimulation with anti-CD3/CD28 antibodies (n=12 mice). C)
Percentage of T-bet+ cells after stimulation of WT and Lmna-/- CD4+ T cells with anti-CD3/CD28 for 7 days
in the presence of Th1 polarizing antibodies and cytokines (n=6 mice from two independent experiments). (D)
Percentage of T-bet+ CD4+ T cells in peritoneal exudates and mesenteric LN of WT recipient mice
reconstituted with a 1:1 mix of WT and Lmna-/- bone marrow and intraperitoneally infected with VACV for 6
days (n=4 mice from two independent experiments). (E) RT-qPCR analysis of the indicated genes in WT and
Lmna-/- CD4+ T-cells stimulated in vitro with anti-CD3/CD28 antibodies for 48 h (n=3 pools of 3 mice). Data
are means SEM analyzed by one-way ANOVA with Bonferroni’s multiple comparison test (A and B), or
unpaired Student’s t-test (C, D and E) *P<0.05; **P<0.01; ***P<0.001.

65 RESULTS
6.3.4. Quantitative proteomic assays reveals that lamin A/C modifies the expression
of several epigenetic enzymes.
To further address the mechanism by which lamin A/C might modify Th commitment, we performed
a comparative proteomic analysis between 48-h activated CD4+ T-cells from WT and Lmna-/-mice. The
analysis quantified about 7180 proteins, of which 103 showed significant differences (p-value ≤ 0.05)
among WT and Lmna-/- CD4+ T-cells based on proteins quantified at least with 2 peptides, and Zq values
higher than ±2; of these, 51 were upregulated and 52 downregulated in Lmna-/- CD4+ T-cells compared
to WT. Within the 103 resulting proteins differentially expressed in Lmna-/- and WT T-cells, sixty-six
proteins were categorized in six functional groups according to UniProt Database information:
epigenetics, DNA machinery, immune system, metabolism, cytoskeleton, and vesicular transport
(Figure 21A). Interestingly, the categories with the highest number of differentially regulated proteins
between Lmna-/- and WT CD4 + T-cells were epigenetics and DNA machinery, with 16 and 15 proteins
respectively (Figure 21A). This suggests that lamin A/C may directly or indirectly regulates the
expression of several enzymes involved in epigenetic and transcription processes in CD4+ T-cells.
Within the group of enzymes responsible of epigenetic modifications we found: three histone
Figure 21. Lamin A/C regulates the expression of several epigenetic enzymes at protein level. CD4+ T-
cells were isolated from WT and Lmna-/- mice spleens and lymph nodes and stimulated with anti CD3/CD28
antibodies for 2 days. At this time, alive cells were selected by FACS to carry out high throughput quantitative
proteomic analysis using isobaric labelling (TMT 10-Plex analysis). (A) Sixty-six proteins differentially
expressed between Lmna-/- and WT CD4 + T-cells are shown. They were categorized into six functional groups:
epigenetics, DNA machinery, immune system, metabolism, cytoskeleton, and vesicular transport. The
categories with the highest number of differentially regulated proteins were epigenetics and DNA machinery.
Upregulated and downregulated proteins in Lmna-/- CD4 + T-cells are indicated with a green arrow and a red
arrow respectively for each category. (B) Heat-map representing protein abundance changes in proteins from
epigenetics category. For each protein, gene name is displayed together with the corresponding Zq values
(standardized log2 ratio) in a color scale (red means upregulated and blue downregulated). Average difference
(Dif) between WT and Lmna-/- Zq values is also shown (n=4 pool of 5 mice). Data are means SEM analyzed
by Student´s t-test. All the proteins represented showed at least a p-value <0.05 or lower.

66 RESULTS
methyltransferases (EZH1, CARM1 and ASH2L), two histone acetyltransferases (B2RRD7 and
EP300), and two histone demethylases (PHF8 and KDM5B) (UniProt Database) (Figure 21B). In
addition, MBD3, a protein which binds to methyl-CpG domains (UniProt Database), was also
upregulated in Lmna-/- CD4 + T-cells, as well as LAP2α (Figure 21B).
6.3.5. Lamin A/C upregulates H3K4me1 epigenetic modification in Cd69 and Tbet
promoters.
Due to the results obtained by quantitative proteomic analysis, we postulated that lamin A/C could
be an epigenetic regulator determining the Th fate commitment of CD4+ T-cells. To investigate this
hypothesis, we performed chromatin immunoprecipitation-qPCR (ChIP-qPCR) assays with in vitro
activated with anti-CD3/CD28 antibodies for 48 h Lmna-/- and WT CD4+ T-cells. We studied H3K4me3,
H3K27me3, and H3K4me1 histone modifications in the following gene promoters: Cd69, Cd25, Il2,
Tbet, and Gata3 (Figure 22).
No differences were detected between Lmna-/- and WT CD4+ T-cells in any of the epigenetic
modifications studied for Il2, and Gata3 gene promoters. So that, lamin A/C did not seem to regulate
proliferation neither Th2 polarization by epigenetic changes. Likewise, H3K4me3 and H3K27me3 did
not exhibit any distinct result in Cd69 and Tbet gene promoters. However, H3K4me1 enhancer mark
Figure 22. Lamin A/C regulates epigenetics through H3K4me1 modification in Cd69 and Tbet genes.
Naïve CD4 + T-cells were isolated from WT and Lmna-/- mice spleens and lymph nodes and stimulated with
anti CD3/CD28 antibodies for 2 days. Alive cells were selected by FACS and crosslinked to develop ChIP-
qPCR analysis. Representative graphs of ChIP-qPCR analysis for the indicated gene promoters. Data are
shown as fold change relative to WT and normalized by the correspondent input (n=2-4 pool of 5 mice). Data
are means SEM of 2-4 independent experiments from a total of 6 analyzed by Student’s t-test.

67 RESULTS
was differentially present in Cd69 and Tbet, being less abundant in Lmna-/- T-cells compared with WT.
Cd25 promoter showed less H3K4me3 modification on Lmna-/- T-cells compared with WT, although
this variance was not significant (p= 0,13) (Figure 22).
6.3.6. Lamin A/C regulates Th1 immunity against pathogen infection.
T-bet and IFN play major roles during in vivo Th1 responses against pathogens (Sacks, D. & Noben-
Trauth, N., 2002; Mougneau E. et al, 2011; Swain S.L. et al, 2012). The low expression of these factors
in Lmna-/- CD4+ T-cells therefore prompted us to investigate the role of lamin A/C in Th1 mediated-
pathogen clearance in vivo. For this, Rag1-/- mice lacking T and B-cells were adoptively transferred with
naïve CD25- CD4+ T-cells from WT or Lmna-/- mice. In our experiments, Rag1-/- mice adoptively
transferred with CD25- CD4+ Lmna-/- T-cells were more susceptible to primary VACV infection, as
indicated by an elevated viral titer and a reduced Th1 response in the spleen (Figure 23A and B).
Moreover, Ifn and Tbet mRNA expression was reduced in adoptively transferred mice, whereas the
Th2 transcription factor Gata3 was unaffected (Figure 23C). We also analyzed the importance of lamin
A/C expression for Th1 responses against the intracellular parasite Leishmania major (Sacks, D. &
Noben-Trauth, N., 2002). Mice on the C57BL/6 background control L. major infection by developing a
protective Th1 response (Iborra S. et al, 2011). C57BL/6 mice lacking lamin A/C in the whole immune
system (Figure 23D-H) or specifically in T-cells (Figure 23I-K) developed progressively larger and
non-healing lesions (Figure 23D, E, I) after inoculation of the ear dermis with a low dose of L. major
parasites. This effect correlated with a higher parasite burden in the infection site and in draining lymph
nodes 3 weeks after infection (Figure 23F, J). At this time, Lmna-/- mice also showed reduced
percentages of IFN-producing CD4+ T-cells (Figure 23G, K) and diminished IFN production by this
cell population (Figure 23H). These results further support the role of lamin A/C in Th1 responses
against pathogens.

68 RESULTS
Figure 23. Lamin A/C deficiency enhances susceptibility to VACV and Leishmania major. (A-C) Rag1-/-
mice were inoculated intravenously with naive WT or Lmna-/- CD4+ T-cells and infected with VACV by tail
scarification. After 10 days, animals were analyzed to determine (A) the percentage of IFN+ CD4+ T-cells in
the spleen (n=5 mice), (B) the viral titers in the tail (n=5 mice), and (C) mRNA levels of T-bet (Tbx21), IFN,
and Gata-3 in the gut (n= 7 and 8 mice). (D-H) WT mice were adoptively transferred with WT or Lmna-/-
bone marrow. Two months after reconstitution, Leishmania major promastigotes were injected intradermally
in the ears (n=8-9 mice). Lesion size (D) and ear thickness (E) were quantified at the indicated times. (F)
Parasite burden in ears and draining lymph nodes was measured 3 and 10 weeks after infection. (G-H) The
percentages of (G) IFN+ CD4+ T-cells and (H) the CD4+ T-cell IFN content was quantified in the ears 3
weeks after infection. (I-K) WT and CD4-CRE Lmnaflox/flox mice were injected intradermally in the ears with
Leishmania major promastigotes (n=9). (I) Lesion size at the indicated times. (J) Parasite burden in the ears
and draining lymph nodes at 3 weeks post-infection. (K) Percentage of IFN+ CD4+ T-cells in the ears. Data
analysis in A-C, F-H, J-K: unpaired Student’s t-test; D-E, I: two-way ANOVA with Bonferroni’s post-hoc
multiple comparison test. *P<0.05; **P<0.01; ***P<0.001.

69 RESULTS
6.3.7. Lamin A/C enhances cytotoxic capacity of CD4+ T-cells.
Viral clearance requires the efficient coordination of multiple immune effector mechanisms. In
accordance with our studies, the role of lamin A/C in viral clearance seems to be CD4+ T-cell-dependent,
since only CD4+ T-cells were adoptively transferred to T and B-cell deficient Rag1-/- mice before mouse
infection with VACV. Effector CD4+ T-cells have been shown to respond to viral pathogens through 2
mechanisms: cytokine production (mostly IFNγ and TNF), and a direct cytolytic activity mediated by
perforin and FAS (also known as CD95) (Swain S.L. et al, 2012). It is known that the cytotoxic activity
of CD4+ T-cell effectors is dependent on the expression of the transcription factors T-bet, Eomesodermin
(Eomes) and Blimp-1, which are crucial for the development of cytotoxic CD4+ T-cells in vivo through
the induction of Granzyme B (Gzmb) and Perforin 1 (Prf1) (Qui, H. Z. et al, 2011). In addition to
increasing T-bet and IFN mRNA expression, we found that the presence of lamin A/C enhances the
mRNA expression of Eomes, Blimp1, Granzyme B (Gzmb), Perforin 1 (Prf1), but not Granzyme A
(Gzma) in CD4+ T-cells differentiated to Th1 in vitro (Figure 24A). Moreover, lamin A/C seems to play
a role in CD4+ T-cell cytotoxicity in vivo since VACV-OVA-generated Lmna-/- Th1 cells were deficient
for OVA-loaded B220+ MHCII+ B-cell killing after the adoptive transfer of these cells to Rag1-/- mice
(Figure 24B). In these experiments, Rag1-/- mice were inoculated intravenously with either naïve
CD45.2/WT or CD45.2/Lmna-/- CD4+/OTII T-cells and infected with VACV-OVA i.p. After 5 days,
splenocytes from CD45.2/WT/dsRED and CD45.1/WT mice were isolated and loaded or not with OVA-
OTII-peptide, respectively. A mix of 1:1 CD45.2/WT/dsRED and CD45.1/WT splenocytes were
inoculated intravenously in the previously inoculated and infected Rag1-/- mice. After 16 hours, animals
were analyzed to determine in the spleen by flow cytometry: (B) the killing capacity of CD4/OTII cells
of each genotype by calculating the ratio between CD45.2/WT/dsRED/+OVA and CD45.1/WT/-OVA
cells, and (C) the presence of CD4/OTII cells by the percentage of CD4/OTII T cells (Figure 24B-C).

70 RESULTS
Figure 24. Lamin A/C enhances cytotoxic capacity of CD4+ T-cells in vitro and in vivo. (A) CD4+CD25-
T-cells were isolated from spleens of WT and Lmna-/- mice and activated with anti-CD3/CD28 antibodies for
2 days. Some cells remained in culture with Th1 polarizing cytokines for additional 5 days. Graphs show the
mRNA levels of the indicated genes quantified by RT-qPCR at 7 days. Data are means SEM of at least two
independent experiments (n = 4 pools of 3 mice). (B-C) Rag1-/- mice were inoculated intravenously with either
naïve CD45.2/WT or CD45.2/Lmna-/- CD4+/OTII T-cells and infected with VACV-OVA intraperitoneally.
After 5 days, splenocytes from CD45.2/WT/dsRED and CD45.1/WT mice were isolated and loaded or not
with OVA, respectively. A mix of approximately 1:1 CD45.2/WT/dsRED and CD45.1/WT splenocytes were
inoculated intravenously in the previously inoculated and infected Rag1-/- mice. After 16 hours, animals were
analyzed to determine in the spleen by flow cytometry: (B) The killing capacity of CD4/OTII cells of each
genotype by calculating the ratio between CD45.2/WT/dsRED/+OVA and CD45.1/WT/-OVA cells and (C)
the presence of CD4/OTII cells by the percentage of CD4/OTII T cells. Mice adoptively transferred with
CD4/OTII cells but not splenocytes and, mice transferred with splenocytes without CD4/OTII were used as
controls (n=8 from two independent experiments). Data are means SEM analyzed by unpaired Student’s t-
test. * P<0.05.

71 RESULTS
6.4. Analysis of lamin A/C role in Treg polarization and suppressive function.
6.4.1. Lamin A/C deficiency in CD4+ T-cells enhances Treg differentiation in vitro.
Since we discovered that lamin A/C controls Th1 differentiation (Toribio-Fernández R. et al, 2018),
we decided to study if lamin A/C could regulate CD4+ T-cell differentiation towards other Th phenotypes
as Treg or Th17. To analyze that, naïve CD4+ T-cells were isolated from spleen and LN of WT and Lmna-
/- mice, and cultured in vitro with anti-CD3 and anti-CD28 antibodies, and Treg or Th17 polarizing
cytokines. Interestingly, Lmna-/- CD4+ T-cells produced significantly greater amount of iTreg-cells
(CD25+ Foxp3+) than WT cells in all the experiments developed. Moreover, Foxp3 MFI analysis by flow
cytometry showed that Lmna-/- CD4+ T-cells express higher levels of Foxp3 than WT CD4+ T-cells
(Figure 25A). However, Th17 differentiation was very variable between experiments, and no significant
differences were obtained between Lmna-/- and WT CD4+ T-cells in cell percentage neither in IL-17 MFI
(Figure 25B). These experiments demonstrate that lamin A/C impairs Treg differentiation in vitro by
modifying Foxp3 expression levels, and validate that lamin A/C is an important regulator of T-cell
differentiation following TCR stimulation.
Figure 25. Enhanced in vitro Treg differentiation and Foxp3 expression in CD4+ T-cells from Lmna-/-
mice. Naïve CD4+ T-cells were isolated from WT and Lmna-/- mice spleens and stimulated with antibodies
anti CD3/CD28 for 5 days in the presence of cytokines to trigger (A) Treg differentiation and (B) Th17
differentiation. Plots and graphs show the percentage of (A) Treg and (B) Th17 differentiated cells of the total
CD4+ T-cells (n=3-6, pools of at least 2 mice); and (A) Foxp3 mean fluorescence intensity (MFI) of Foxp3+
CD4+ T-cells, and (B) IL-17 MFI of IL-17+ CD4+ T-cells T-cells (n=7 pools of 2 mice). Data are means SEM
of at least three independent experiments analyzed by unpaired Student’s t-test. **P<0.01;***P<0.001.

72 RESULTS
6.4.2. Lamin A/C overexpression in CD4+ T-cells impairs Treg differentiation.
To demonstrate that lamin A/C impairs Treg differentiation, we decided to perform an in vitro
overexpression of lamin A/C by the transfection with a GFP-lamin A/C retrovirus. To do that, we
produced retrovirus in vitro with GFP-empty or GFP-lamin A/C vectors. In parallel, we isolated
splenocytes from CD45.1 WT/OTTI and CD45.2 Lmna-/-/OTII, and cultured them in the presence of
Figure 26. Lamin A/C overexpression impairs Treg differentiation. Splenocytes were isolated from spleen
of CD45.1 WT/OTII mice and CD45.2 Lmna-/-/OTII and in vitro cocultured in the presence of OVA-peptide
for 48 h. At this time, splenocytes were transfected with GFP or GFP-lamin A/C retrovirus and in vitro cultured
with cytokines to promote Treg differentiation (A) Representative micrographs of GFP or GFP-lamin A/C
retrovirus Phoenix-Eco producer cells. 10x magnification. (B) Plots of GFP+ transfected splenocytes and its
quantification graph (n=3 mice). Data are means SEM of one representative experiment from three by
Student’s t-test. (C) Percentage of CD25+ Foxp3+ cells by flow cytometry analysis. Representative plots are
shown (n=6 mice). Data are means SEM of two independent experiments by one-way ANOVA with
Bonferroni’s multiple comparison test. ns= not significant ; ***P<0.001.

73 RESULTS
OVA/OTII-peptide, which induced their activation. After 48 h, GFP expression was checked by
fluorescence microscopy in Phoenix-Eco cells (Figure 26A). Then, we infected splenocytes by
spinofection, and after 72 h, GFP expression levels was studied by flow cytometry in CD4+ T-cells. The
infection similarly worked with GFP-empty or GFP-lamin A/C viruses (Figure 26B). Additionally,
cytokines to promote Treg differentiation were added to splenocytes after the spinofection protocol, and
CD25+ Foxp3+ cell percentage was analyzed at day 5 of in vitro differentiation. GFP-lamin A/C
expressing CD4+ T-cells exhibited significantly lower Treg differentiation in comparison to GFP-empty
vector expressing cells. Even though, in the case of GFP-empty vector expressing CD4+ T-cells, Lmna-
/-/OTII showed significant upper Treg polarization than WT/OTII as was expected according our
previous results (Figure 26C).
6.4.3. Lamin A/C controls Foxp3 expression but does not modulate it epigenetically.
To study the mechanism by which lamin A/C intervenes in Treg differentiation, we analyzed by RT-
qPCR the mRNA expression levels of Foxp3 in in vitro activated Lmna-/- and WT T-cells with anti-
CD3/CD28 for 48 h. In parallel we also analyzed Rorγt expression to confirm that lamin A/C does not
regulate Th17 differentiation. Thus, lamin A/C deficient T-cells exhibited an enhanced Foxp3
expression at mRNA level, while Rorγt expression was the same in comparison whith WT T-cells
(Figure 27A).
Figure 27. Lamin A/C controls Foxp3 expression but does not promote any epigenetic modification in
Foxp3 promoter. CD4+ T-cells were isolated and activated in vitro with anti-CD3/CD28 for 48 h. (A) mRNA
expression of Foxp3 and Rorγt genes was measured by RT-qPCR (n=6 mice). (B) ChIP-qPCR analysis of the
indicated histone modifications in Foxp3 and Rorγt promoters. Data is shown as fold change relative to WT
and input sample (n=2 pool of 4 mice). Data are means SEM analyzed by unpaired Student’s t-test. * P<0.05,
ns= not significant.
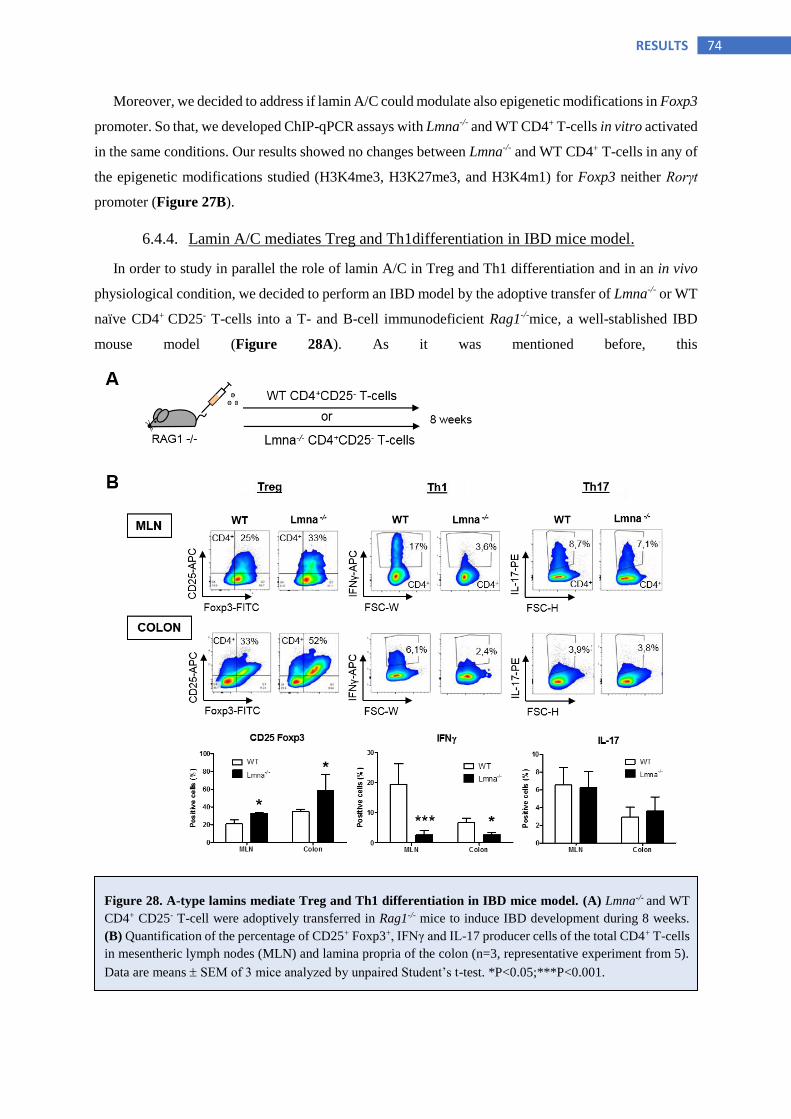
74 RESULTS
Moreover, we decided to address if lamin A/C could modulate also epigenetic modifications in Foxp3
promoter. So that, we developed ChIP-qPCR assays with Lmna-/- and WT CD4+ T-cells in vitro activated
in the same conditions. Our results showed no changes between Lmna-/- and WT CD4+ T-cells in any of
the epigenetic modifications studied (H3K4me3, H3K27me3, and H3K4m1) for Foxp3 neither Rorγt
promoter (Figure 27B).
6.4.4. Lamin A/C mediates Treg and Th1differentiation in IBD mice model.
In order to study in parallel the role of lamin A/C in Treg and Th1 differentiation and in an in vivo
physiological condition, we decided to perform an IBD model by the adoptive transfer of Lmna-/- or WT
naïve CD4+ CD25- T-cells into a T- and B-cell immunodeficient Rag1-/-mice, a well-stablished IBD
mouse model (Figure 28A). As it was mentioned before, this
Figure 28. A-type lamins mediate Treg and Th1 differentiation in IBD mice model. (A) Lmna-/- and WT
CD4+ CD25- T-cell were adoptively transferred in Rag1-/- mice to induce IBD development during 8 weeks.
(B) Quantification of the percentage of CD25+ Foxp3+, IFNγ and IL-17 producer cells of the total CD4+ T-cells
in mesentheric lymph nodes (MLN) and lamina propria of the colon (n=3, representative experiment from 5).
Data are means SEM of 3 mice analyzed by unpaired Student’s t-test. *P<0.05;***P<0.001.

75 RESULTS
model simulates human Crohn’s disease in which Treg and Th1 are main players of the immune response
(Powrie F. et al, 1993).
After 8 weeks of disease development, mice were sacrificed and Treg, Th1 and Th17 populations
were analyzed in MLN and colon by flow cytometry. As in the preceding experiments, CD25+ Foxp3+
T-cells were significantly increased in Lmna-/- CD4+ CD25- T-cells adoptively transferred mice,
compared with WT CD4+ CD25- T-cells adoptively transferred mice. As well, IFNγ levels revealed less
Th1 differentiation when lamin A/C was absent in T-cells. In addition, IL-17 was also measured to
analyzed Th17 differentiation, and no differences were found between Lmna-/- and WT CD4+ T-cells in
any of organs studied (Figure 28B).
In order to further study the Th populations and their functionality in vivo against the IBD, mRNA
expression levels were also evaluated in colon. Thus, results showed the same tendency that we have
observed before: an enhanced Treg differenciation, and on the contrary, a reduced Th1 differentiation
when Lmna-/- CD4+ CD25- T-cells were transferred to Rag1-/- mice. Consequently, Foxp3, Tgfβ, and Il35
mRNA expression levels were augmented, while Tbet, Ifnγ, and Il12 were diminished in Lmna-/- CD4+
CD25- T-cells adoptively transferred mice, in comparison to WT. Again, no differences were observed
Figure 29. mRNA expression levels confirm the role of A-type lamins in Treg and Th1 differentiation.
RT-qPCR analysis of indicated genes related with Treg (Foxp3, Tgfβ, and Il-35), Th1 (T-bet, Ifnγ, and Il-12)
and Th17 (Rorγt, Il-17a, and Il-23) differentiation in colon (n=6 mice from a representative experiment from
5). Data are means SEM of 3 mice analyzed by unpaired Student’s t-test. *P<0.05; **P<0.01.
76 RESULTS
in expression levels of the genes related with Th17 cells, Rorγt and Il17a. However, Il23 expression
levels were reduced in Lmna-/- CD4+ CD25- T-cells adoptively transferred mice, in comparison with WT,
although the obtained results were not significantly different (Figure 29).
6.4.5. Lamin A/C deficiency in CD4+ T-cells protects against IBD development.
Besides the analysis of Th and Treg populations described before, during the IBD mouse model
development, other measures were studied to define the inflammatory process expected for this colitis
model. Weightloss and symptoms were monitored twice a week, and revealed that mice adoptively
transferred with Lmna-/- CD4+ CD25- T-cells, developed a mild disease, showing less weightloss and
less symptomatology in comparison with WT CD4+ CD25- T-cells adoptively transferred mice. (Figure
30A).
Additionally, colon length was measured. This is a common feature of colitis that reveals the
inflammation and healing of the tissue (Lindebo Holm T. et al, 2012). Lmna-/- T-cells transferred mice
exhibited less shortening of the colon, which means less colon inflammation, compared with WT
(Figure 30B). To assess the anti-inflammatory phenotype of Lmna-/- CD4+ T-cells in IBD, IL-10, an
anti-inflammatory cytokine widely studied in this disease (Schreiber S. et al, 1995; Szkaradkiewicz A.
et al, 2009; Zhu L. et al, 2017), was quantified by flow cytometry in MLN (Figure 30C) and in colon
by RT-qPCR (Figure 30D). As we expected, IL-10 expression levels were augmented in mice that were
transferred with Lmna-/- T-cells, compared with mice transferred with WT T-cells. Other cytokines were
also analyzed by RT-qPCR in the colon of these mice. In line with the results described above,
expression levels of Il6, a pro-inflammatory cytokine (Szkaradkiewicz A et al, 2009), were diminished
in Lmna-/- T-cells transferred mice; and on the contrary, mRNA expression of Il22, another anti-
inflammatory cytokine (Sugimoto K et al, 2008; Leung J.M. et al, 2013; Mizoguchi A. et al, 2018), was
increased (Figure 30D).

77 RESULTS
Furthermore, histopathological analysis was performed in colon slices stained with hematoxylin-
eosin to assess the severity of colitis. The following features were taken into account for disease score
quantification: leukocyte infiltration, goblet cell depletion, epithelial hyperplasia, crypt damage, and
submucosal inflammation. Ulceration was also considered when it was present. Representative
micrographs clearly showed that mice transferred with Lmna-/- CD4+ T-cells, displayed a slight colitis
compared with mice transferred with WT CD4+ T-cells, which exhibited a severe colon inflammation
(Figure 31).
Figure 30. A-type lamins protect from IBD development in mouse. Rag1-/- mice were adoptively transferred
with WT or Lmna-/- CD4+ CD25- T-cells to generate IBD. Mice were sacrificed 8 weeks after T-cell transfer.
(A) Evolution of body weightloss and colitis symptoms during IBD development (n=6-7, at least 6 mice from
a representative experiment from 5). Data are means SEM of at least 6 mice analyzed by two-way ANOVA
with Bonferroni’s multiple comparison test. (B) Representative photograph of colons and measurement of
colon length (mm) after 8 weeks of IBD development (n=6-7, at least 6 mice from a representative experiment
from 5). Data are means SEM of at least 6 mice analyzed by one-way ANOVA with Bonferroni’s multiple
comparison test. (C) Quantification of IL-10 producer cells of the total CD4+ T-cells in mesenteric lymph nodes
(MLN) after 8 weeks of IBD development (D) RT-qPCR analysis of indicated genes related with inflammation
in the colon after 8 weeks of IBD development (n=7, at least 7 mice from a representative experiment from 5).
Data are means SEM of at least 6 mice analyzed by unpaired Student’s t-test.
*P<0.05; **P<0.01; ***P<0.001.

78 RESULTS
Figure 31. Histopathological examination of colon corroborates that lamin A/C deficiency in CD4+ T-
cells protects against IBD development. Representative micrographs of hematoxylin-eosin stained colon
sections (bars of 500 µm at 4x magnification, and 250 µm at 10x magnification). Graph shows disease score
(0-3) recapitulating markers of intestinal inflammation quantification indicated as follows: leukocyte
infiltration (1), goblet cell depletion (2), epithelial hyperplasia (3), crypt damage (4), and submucosal
inflammation (5) (n=6-7, at least 6 mice from a representative experiment from 5). Data are means SEM
analyzed by one-way ANOVA with Bonferroni’s multiple comparison test. *P<0.05;**P<0.01;***P<0.001.

79 RESULTS
6.4.6. Lamin A/C deficiency in CD4+ T-cells confers greater Treg suppressive
function.
Next, we decided to study if lamin A/C deficiency not only enhances Treg differentiation, but also
could improve Treg functionality. Naïve CD4+ CD25- T-cells were isolated from Lmna-/- and WT mice
and in vitro differentiated towards Treg phenotype. At 5 days of differentiation, CD25+ iTregs were
positively selected by antibody and magnetic bead binding (Figure 32A). The obtained iTregs were
characterized by RT-qPCR, analyzing mRNA expression levels of cytokines that are commonly released
by Treg cells (IL-10, TGFβ, and IL-35), Treg surface receptors of CD28 family (CTLA4, ICOS, PD-1),
and other characteristic Treg surface molecules (CD25, GITR, LAG-3, and CD49b). Il10, Tgfβ, Cd25,
Gitr and Pd1 mRNA expression was significantly upgraded in Tregs derived from Lmna-/- T-cells
(indicated as Lmna-/- Tregs), in comparison with those derived from WT T-cells (indicated as WT
Tregs). Additionally, Lag3 and Cd49b expression was also augmented in Tregs derived from Lmna-/- T-
cells, although the difference with WT was not so significant (Figure 32B). Moreover, we performed
an in vitro suppression assay in order to test the capacity of these Tregs to inhibit Th1 proliferation. This
experiment showed that Tregs derived from Lmna-/- T-cells exhibit greater suppressive capacity against
Th1 cells proliferation, than Tregs derived from WT T-cells (Figure 32C).
However, these experiments were performed with CD25+ iTregs, so that, to corroborate this data
with CD25+ Foxp3+ iTregs, we created a RFP-Foxp3 and Lmna-/- in CD4+ T-cells mice model. RFP-
Foxp3 permitted us to select by FACS the CD25+ Foxp3+ in vitro differentiated Tregs (iTregs) (Figure
33A), and perform again an in vitro suppressive assay over Th1 cells. Percentage of IFNγ+ cells were
measured by flow cytometry showing again that iTregs from Lmna-/- CD4+ T-cells have better
suppressive function than iTregs derived from WT (Figure 33B).

80 RESULTS
Figure 32. CD25+ Tregs derived from Lmna-/- CD4+ T-cells show better suppressive function than Tregs
derived from WT CD4+ T-cells. Naïve CD4 + T-cells were isolated from WT and Lmna-/- mice spleens,
stimulated with antibodies anti CD3/CD28, and polarized towards Treg in the presence of cytokines. (A) At day
5 of in vitro Treg differentiation, CD25+ Tregs were positively selected by magnetic columns. (B) RT-qPCR
analysis of indicated Treg-related genes; mRNA expression is show as fold change v.s WT (n=6-9, at least 6
pool of 2 mice). Data are means SEM of 6 pool of 2 mice analyzed by Student’s t-test. (C) Treg suppression
assay with in vitro differentiated CD25+ Tregs from CD45.2 WT and Lmna-/- mice, and naïve CD4+ T-cells
isolated from CD45.1 WT mice spleens. Tregs were cocultured in the indicated serial dilutions (1:2, 1:4, 1:8,
1:16, 1:32, 1:64, 1:0) v.s a constant naïve CD4+ T-cell concentration in the presence of IL-12, IL-2 and soluble
anti-CD3/CD28 antibodies. Naïve CD4+ T-cells were stained with Cell Violet to quantify the Th1 proliferation
rate. Representative plots of 1:4 and 1:8 Treg dilution are shown and percentage of proliferative cells is shown
in the graph (n=4 mice of a representative experiment of two). Data are means SEM of 4 mice analyzed by
two-way ANOVA with Bonferroni’s multiple comparison test. *P<0.05;**P<0.01;***P<0.001.
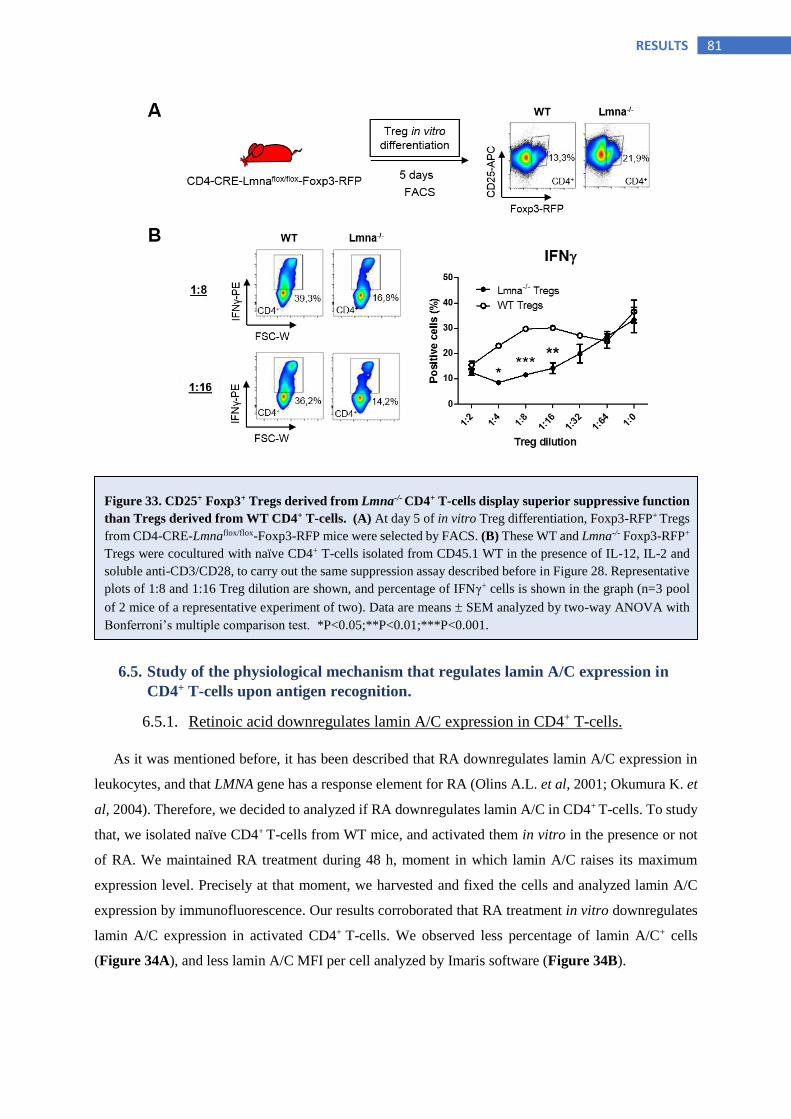
81 RESULTS
6.5. Study of the physiological mechanism that regulates lamin A/C expression in
CD4+ T-cells upon antigen recognition.
6.5.1. Retinoic acid downregulates lamin A/C expression in CD4+ T-cells.
As it was mentioned before, it has been described that RA downregulates lamin A/C expression in
leukocytes, and that LMNA gene has a response element for RA (Olins A.L. et al, 2001; Okumura K. et
al, 2004). Therefore, we decided to analyzed if RA downregulates lamin A/C in CD4+ T-cells. To study
that, we isolated naïve CD4+ T-cells from WT mice, and activated them in vitro in the presence or not
of RA. We maintained RA treatment during 48 h, moment in which lamin A/C raises its maximum
expression level. Precisely at that moment, we harvested and fixed the cells and analyzed lamin A/C
expression by immunofluorescence. Our results corroborated that RA treatment in vitro downregulates
lamin A/C expression in activated CD4+ T-cells. We observed less percentage of lamin A/C+ cells
(Figure 34A), and less lamin A/C MFI per cell analyzed by Imaris software (Figure 34B).
Figure 33. CD25+ Foxp3+ Tregs derived from Lmna-/- CD4+ T-cells display superior suppressive function
than Tregs derived from WT CD4+ T-cells. (A) At day 5 of in vitro Treg differentiation, Foxp3-RFP+ Tregs
from CD4-CRE-Lmnaflox/flox-Foxp3-RFP mice were selected by FACS. (B) These WT and Lmna-/- Foxp3-RFP+
Tregs were cocultured with naïve CD4+ T-cells isolated from CD45.1 WT in the presence of IL-12, IL-2 and
soluble anti-CD3/CD28, to carry out the same suppression assay described before in Figure 28. Representative
plots of 1:8 and 1:16 Treg dilution are shown, and percentage of IFNγ+ cells is shown in the graph (n=3 pool
of 2 mice of a representative experiment of two). Data are means SEM analyzed by two-way ANOVA with
Bonferroni’s multiple comparison test. *P<0.05;**P<0.01;***P<0.001.

82 RESULTS
Figure 34. Retinoic acid (RA) downregulates lamin A/C expression levels in CD4+ T-cells. Naïve CD4 +
T-cells were isolated from WT mice spleens and stimulated with anti CD3/CD28 antibodies for 2 days in the
presence of retinoic acid (RA), or its solvent as a control to compare with. (A) Immunofluorescent labelling
of the nuclear envelope protein lamin A/C (green) in 48 h-activated CD4+ T-cells counterstained with DAPI
(blue). Merge of both colors is also showed. Scale bars of 25 µm. Graph shows the percentage of lamin A/C
expressing cells quantification. (B) Representative figure of volume, intensity analysis with Imaris software
of lamin A/C staining, and MFI analysis expressed in arbitrary units of a Z-stack maximal projection (n=6
samples from 3 pool of 2 mice). Data are means SEM analyzed by unpaired Student’s t-test.
*P<0.05;***P<0.001.

83 RESULTS
6.5.2. Retinoic acid-producing CD103+ DCs from mesenteric lymph nodes regulate
physiologically lamin A/C expression in CD4+ T-cells.
To study if lamin A/C expression is physiologically regulated depending on the lymphoid organ, we
analyzed lamin A/C protein expression by flow cytometry in spleen, MLN, and PLN, upon VACV i.p.
infection (spleen and MLN analysis) or i.d infection in the footpad (PLN analysis) to promote CD4+ T-
cell activation. Six days post infection we observed that lamin A/C expression was decreased in CD4+
T-cells from spleen and MLN, but it was higher in CD4+ T-cells from PLN (Figure 35A).
Figure 35. CD103+ DC population is mostly present in mesentheric lymph nodes (MLN), and
downregulates lamin A/C expression in CD4+ T-cells. CD11c+ DCs were isolated from MLN or peripheral
lymph nodes (PeLN) of CD45.2 WT mice. (A) Lamin A/C MFI analysis by flow cytometry of CD4+CD69+
CD25+ T-cells upon intraperitoneal (spleen and MLN) and footpad (PLN) VACV infection (n=5 mice). (B)
Representative plots show the enrichment of MLN in CD11c +CD103 + DC v.s PeLN. Graph shows the
percentage of CD11c + CD103 + DC in MLN and PeLN (n=4 mice). (C) Coculture of OVA-loaded CD11c+
isolated from MLN or PeLN of CD45.2 WT mice and CD45.1 WT/OTII naïve CD4+ T-cells from spleen.
Plot and graphs show lamin A/C mean fluorescence intensity (MFI) and percentage of lamin A/C positive
CD4+ T-cells at 48 h of activation. Data are means SEM of a representative experiment from three analyzed
by one-way ANOVA (A) and unpaired Student’s t-test (B, C) *P<0.05;**P<0.01;***P<0.001.

84 RESULTS
Additionally, it is known that CD103+ DC population, mostly present in MLN, PP, and intestine,
produce RA, while CD103- DCs, preferentially located in spleen and PeLN, do not (Iwata M. et al, 2004;
Coombes J.L et al, 2007; Esterházy D. et al, 2016). To corroborate this, we isolated CD11c+ DCs from
MLN or PeLN, and analyzed the percentage of CD103+ and CD103- DC populations. As we expected,
CD103+ DC were highly present in MLN compared with PeLN (Figure 35B). Then, in order to relate
this information with our previous findings, we loaded CD11c+ DCs (CD45.2) from MLN or PeLN with
OVA, and cultured them with WT/OTII naïve CD4+ T-cells from spleen (CD45.1) for 48 h. After this
time, we checked lamin A/C levels in CD4+ T-cells by flow cytometry. CD11c+ DCs from MLN greatly
downregulated lamin A/C expression in CD4+ T-cells, compared with CD11c+ DCs from PeLN (Figure
35C).
6.5.3. Retinoic acid and lamin A/C deficiency in CD4+ T-cells enhance Treg
differentiation in vitro.
It has been described that RA augments Treg differentiation (Mucida D. et al, 2007; Benson M.J. et
al, 2007; Mucida D. et al, 2009). Likewise, we have demonstrated that lamin A/C deficiency in CD4+
T-cells enhances Treg differentiation in vitro and in vivo. Furthermore, our data showed that RA
Figure 36. Retinoic acid (RA) augments Treg differentiation in vitro as well as lamin A/C deficiency.
Naïve CD4 + T-cells were isolated from WT and Lmna-/- mice spleens and stimulated with antibodies anti
CD3/CD28 for 5 days in the presence of RA or its corresponding solvent for 48 h; moment in which RA was
washed and Treg cytokines were added. (A) At day 5, percentage of CD25+ Foxp3+ Tregs and Foxp3 MFI
were analyzed by flow cytometry. Representative plots and quantification data are shown (n=6 mice). Data
are means SEM of one representative experiment of three analyzed by two-way ANOVA with Bonferroni’s
multiple comparison test. (B) RT-qPCR analysis of RA receptor genes. mRNA expression is show as fold
change relative to WT (n=6-9, at least 6 pool of 2 mice). Data are means SEM analyzed by Student’s t-test.
*P<0.05; **P<0.01; ***P<0.001.

85 RESULTS
downregulates lamin A/C expression in CD4+ T-cells. So that, we decided to address if lamin A/C was
involved in the molecular mechanism of RA effect in Treg differentiation. Thereby, we performed in
vitro Treg differentiation assays with WT and Lmna-/- CD4+ T-cells, in the presence or not of RA during
48 h, and polarizing cytokines towards Treg fate added at 48 h till the end of the experiment. The
obtained results corroborated that RA and the lack of lamin A/C separately enhances in vitro Treg
differentiation. Thus, CD25+ Foxp3+ cell percentage of WT CD4+ T-cells treated with RA was
significantly higher than the obtained with WT CD4+ T-cells (treated with the solvent of RA as control).
Besides, CD25+ Foxp3+ cell percentage was again significantly greater in Lmna-/- CD4+ T-cells than in
WT (non treated cells); while Lmna-/- CD4+ T-cells treated with RA exhibited non-significant differences
in Treg percentage as non-treated Lmna-/- CD4+ T-cells. Foxp3 MFI of Foxp3+ CD4+ T-cells was also
measured showing the same tendency of results (Figure 36A). Moreover, to decipher lamin A/C role in
RA mechanism related with Treg differentiation, we analyzed the expression of two RA receptors, Rarα
and Rarβ, by RT-qPCR, in in vitro differentiated Tregs from Lmna-/- or WT CD4+ T-cells. Rarα mRNA
expression was significantly upregulated in Tregs derived from Lmna-/- CD4+ T-cells, while Rarβ
exhibited no differences compared with WT Tregs (Figure 36B).
6.5.4. Lamin A/C deficiency in CD4+ T-cells enhances Treg differentiation and
protects from IBD development in mouse at similar levels than retinoic acid
treatment.
To corroborate the in vitro previous results, and because it has been described that RA treatment
protects from IBD in mouse (Bai A. et al, 2009), we developed the same IBD mice model described
before, in which naïve Lmna-/- or WT CD4+ T-cells were adoptively transferred to Rag1-/- mice. During
the first two weeks after the adoptive transfer, we treated the mice with RA by an i.p. injection once a
day (Figure 37A). After 8 weeks, we sacrificed the mice and studied Treg cell percentage (CD25+
Foxp3+ population) and Foxp3 MFI of Foxp3+cells in MLN of the mice (Figure 37B). These data
corroborate the same results previously observed in vitro. Furthermore, we analyzed weightloss (Figure
37C) and colon shortening (Figure 37D) in order to assess the inflammation severity. Again, mice
transferred with Lmna-/- T-cells were protected from the disease, exhibiting less weightloss and larger
colon. Likewise, mice transferred with WT T-cells and treated with RA were similarly protected,
presenting less weightloss and less colon shortening in comparison with non-treated WT T-cell
adoptively transferred mice.

86 RESULTS
Figure 37. Retinoic acid (RA) augments Treg differentiation in vivo and protects from IBD as well as
lamin A/C deficiency in CD4+ T-cells. (A) Rag1-/- mice were adoptively transferred with WT or Lmna-/-
CD4+ CD25- T-cells to induce IBD development. During the first two weeks, mice were intraperitoneally
injected with RA once a day. Mice were sacrificed 8 weeks after the T-cell transfer. (B) Flow cytometry
analysis of CD25+ Foxp3+ cells percentage of the total CD4+ T-cells, and Foxp3 MFI of CD25+ Foxp3+ T-
cells in MLN is shown. (C) Weightloss evolution during IBD development. (D) Representative photograph
of colons and measurement of colon length (mm) after 8 weeks of IBD development (n=5-9, at least 5 mice
of a representative experiment of three). Data are means SEM analyzed by two-way ANOVA with
Bonferroni’s multiple comparison test. *P<0.05; ***P<0.001.

Discussion


89 DISCUSSION
7. DISCUSSION
7.1. Lamin A/C and T-cell development.
CD4-Lmna-/- mice were generated to knockdown lamin A/C specifically in CD4+ T-cells. Lamin A/C
expression levels in CD4-Lmna-/- mice were significantly downregulated in comparison with WT.
However, it seems that the CRE recombinase linked to the Cd4 gen promoter, was not 100% efficient,
since we observed some lamin A/C-expressing CD4+ T-cells coming from CD4-Lmna-/- mice. The
incomplete gene excision of floxed loci is one of the limitations of the cre-loxP system that has been
reported in other models (McLellan M.A. et al, 2017). This effect could be due to the fact that not all
the loci recombine equally, and by virtue of the fact that the size of the targeted gene within the floxed
loci can interfere in the gene excision efficiency (Zheng B. et al, 2000). Despite of our reduced
efficiency, our results show that this mice model can be very useful to study lamin A/C functionality in
CD4+ T-cells. It is important to take into account that CD4+ surface receptor is expressed in CD8+ T-
cells during their development in the thymus (Germain R.N., 2002). Therefore, in the experiments
performed with this CD4-CRE mice model, as the Leishmania major in vivo infections, the CD8+ T-cell
population also lacked lamin A/C. Except for these assays, we have always performed in vitro and in
vivo experiments with naïve CD4+ T-cells isolated by negative selection, including and anti-CD8
antibody, to avoid lamin A/C deficient CD8+ T-cell effect in our results.
As it was mentioned before, Hale J.S. et al described in 2010, that absence in lamin A/C in the
immune system does not affect lymphocyte development. They reported that the Lmna-/- (full knockout)
mice have an impairment in T and B-lymphocytes development only due to an indirect effect of lamin
expression loss in non-lymphoid cells. They showed that WT hosts transplanted with bone marrow from
Lmna-/- mice displayed a good engraftment of the thymus and a normal thymocyte development.
Furthermore, we have corroborated that the reconstitution of WT recipient mice with Lmna-/- bone
marrow drives normal T-cell development. Even so, we have generated the CD4-Lmna-/- mice and
evaluated the basal levels of CD4+ and CD8+ T-cell populations in lymphoid organs (spleen, thymus
and LN), body weight and lymphoid organ size. Our data demonstrate that lamin A/C downregulation
in CD4+ and CD8+ T-cells does not affect to mouse body weight, lymphoid organ size, nor lymphocyte
development in the thymus, raising the expected percentages for each population in spleen and LN.
7.2. Lamin A/C in T-cell activation and proliferation.
As it was mentioned previously, the first step in Th effector development is T-cell activation
promoted by antigen recognition. Then, T-cells will proliferate and differentiate towards different T-
helper (Th) phenotypes in the case of CD4+ T-lymphocytes, or towards cytotoxic phenotype in the case
of CD8+ T-lymphocytes (Delves P.J & Roitt I.M., 2000). Thanks to our laboratory previous work, it is
known that lamin A/C is expressed upon TCR stimulation, enhancing immune synapse formation and
T-cell activation (González-Granado J.M. et al, 2015). Now we have corroborated its expression in
90 DISCUSSION
CD4+ T-cells upon antigen recognition, and its function as a T-cell activation enhancer in mouse upon
VACV infection. Thereby, here we have confirmed that lamin A/C is an important regulator of T-cell
activation upregulating CD69 and CD25 surface receptors expression. CD69 is a receptor molecule
induced by antigen recognition in T-cells, thus it has been widely used to determine the degree of T-cell
activation (Rocha-Perugini V. et al, 2014; Cibrián D. & Sánchez-Madrid F., 2017). CD25, is also
induced by TCR stimulation, and it is known for being the alpha subunit of the IL-2 receptor (Kisielow
P & Von Boehmer H., 1995). IL-2 is a key growth factor promoting T-cell proliferation and survival
(Van Parijs L. et al, 1999), thereby since we observed that lamin A/C upregulates CD25 expression, we
decided to evaluate the role of lamin A/C in T-cell proliferation. However, our results show the contrary
of what we expected, lamin A/C does not seem to have a role in T-cell proliferation upon antigen
recognition, since no significant differences have been observed neither in in vitro nor in vivo assays. It
has been described that IL-2 is merely an accessory signal to promote T-cell clonal expansion. The
priming of naïve T-cells after the interaction with the APC, is enough to promote T-cell proliferation.
Thereby, it has been demonstrated that IL-2 is required for in vitro T-cell expansion, while in vivo, IL-
2 predominantly acts in Treg differentiation induction and maintenance (Reinhard O., 2015). So that,
CD25 upregulation by lamin A/C in activated T-cells does not imply that WT T-cells have to proliferate
more than lamin A/C deficient T-cells in our experiments. Moreover, T-cell expansion starts just after
T-cell activation, more or less 24-48 h after TCR stimulation. Precisely, lamin A/C peak of expression
in CD4+ T-cells lasts approximately 48 h from TCR activation. So that, when T-cell proliferation is
highly starting (at least 48 h after activation), lamin A/C levels are being decreased in the T-cell.
Therefore, this is the main elucidation that supports lamin A/C does not intervene in CD4+ T-cell
proliferation although CD25 levels are increased by lamin A/C upon T cell activation.
There is evidence that lamin A/C deficiency is involved in the G1/S transition step of the cell cycle,
and that lamin A/C deficiency lead to proliferative defects in fibroblasts and HeLa cells (Dechat T. et
al, 2007).Moreover, lamin A/C expression has been usually related with differentiated and non-
proliferating cells (Roeber R.A. et al, 1989), existing some previous investigations that have reported
that the absence of lamin A/C promotes growth of tumor cells and aggravates cancer dissemination
(Venables R.S. et al, 2001; Tilli C.M. et al, 2003). Fibroblasts are supposed to express lamin A/C
constantly (Dechat T. et al, 2007) unlike T-cells, in which we have observed a transient expression, and
tumor cells in which lamin A/C expression varies depending on the cancer subtype (Willis N.D. et al,
2008; Wang Y. et al, 2009; Capo-chichi C.D. et al, 2011; Maresca G. et al, 2012). This variability in
lamin A/C expression indicates that lamin A/C does not have the same behavior of expression in all cell
types. This could explain why we have not observed defects in proliferation of lamin A/C deficient T-
cells.

91 DISCUSSION
Besides, it has been widely demonstrated that lamin A/C deficient cells migrate easily (Denais C.M.
et al, 2016). This finding supports the idea that lamin A/C downregulation 48 h after TCR stimulation,
gives to lymphocytes the opportunity to proliferate and migrate easily through lymphatic circulation
towards the infected or/and inflamed tissues. It would be of great interest to confirm this hypothesis by
in vivo microscopy techniques in future experiments. Furthermore we could further study if lamin A/C
affect to T-cell proliferation and migration, promoting a steady overexpression of lamin A/C in CD4+
T-cells. Moreover, it is still necessary to further investigate the role of A-type lamins in cell-migration
and proliferation, since it seems that lamin A/C expression is very variable depending on the cell type,
a fact that could have functional consequences in the behavior of the T cell.
7.3. Lamin A/C and Th1 response.
Interestingly, it is known that A-type lamins are expressed only in differentiated cells while B-type
lamins are expressed ubiquitously, even in stem cells (Dechat T. et al, 2010). So that, the role of lamin
A/C in cell differentiation has been widely studied in other non-immunological cell types as adipocytes
(Lund E. & Collas P, 2013), osteoblasts (Akter R. et al, 2009; Rauner M. et al, 2009), and stem cells
(Espada J. et al, 2008). Here, we have corroborated in vivo that lamin A/C expression in CD4+ T-cells
is transient, peaking 24 h-48 h after antigen recognition. However, we need to further study lamin A/C
expression in Th differentiated CD4+ T-cells. We have observed that lamin A/C expression in CD4+ T-
cells 6 days after in vitro activation, is lower than the peak of expression at 48 h after TCR activation.
This observation suggests that lamin A/C expression is required some hours after antigen recognition to
enhance T-cell activation, but afterwards lamin A/C is no longer required. Nevertheless, it would be
interesting to deeply analyzed lamin A/C expression once T-lymphocytes are already polarized into
different Th phenotypes. Maybe lamin A/C is differentially expressed depending on the Th-cell type or
the degree of diferentiation/specialization. In line with this, memory T-cells display a second antigen
recognition (MacLeod M.K.L. et al, 2010), thus lamin A/C could be expressed again to control this
second round of T-cell activation. Therefore, it would be exciting to decipher if lamin A/C is expressed
in memory T-cells, regulating its activation and effector function.
The Th fate of antigen-engaged T-cells depends on many factors, including the type of antigen
encountered, the TCR signal intensity, the duration of antigen presentation, and the local cytokine milieu
(Constant S.L. & Bottomly K., 1997; Szabo S.J. et al, 2000; O'Shea J.J. & Paul W.E., 2010; Zhu J. et
al, 2010). Th1 differentiation is favored by stronger T-cell activation signals and longer T-DC cell-cell
interactions (van Panhuys, N., 2014 and 2016). Lamin A/C enhances T-cell activation by increasing
TCR signal strength and promoting T-DC interaction (González-Granado J.M. et al, 2015). Weaker
TCR signal intensity in the absence of lamin A/C could also account for the observed reduction in CD4+
T-cell activation triggered by VACV infection. Regarding T-cell differentiation driven by the cytokine
milieu, IL-2, IL-12 and IFNγ are known to facilitate Th1 differentiation, whereas IL-4 favors Th2
differentiation. Moreover, some cytokines promote differentiation to a specific Th phenotype without

92 DISCUSSION
affecting other phenotypes. For example, IL-33 enhances Th1 but not Th2 polarization in the presence
of IL-12 (Komai-Koma M. et al, 2016). Lamin A/C expression could also thus regulate the production
and release of cytokines and the surface receptors expression that are important for the Th1 phenotype.
In this regard, we found that lamin A/C deficiency reduces membrane expression of the alpha chain of
the IL-2 receptor CD25 in CD4+ T-cells activated by in vivo infection with VACV. Moreover, incubation
of CD4+ T-cells with IL-2 or Th1 polarizing cytokines during in vitro differentiation experiments did
not rescue the impaired Th1 differentiation of Lmna-/- cells, indicating that the intracellular signals drive
by the nuclear envelope protein lamin A/C are which directly regulate Th1 differentiation. Our in vitro
and in vivo results clearly identify lamin A/C as a crucial driver of Th1 polarization enhancing T-bet
expression. Strikingly, this effect is not counterbalanced by an increase in Th2 differentiation. Distinct
signaling pathways can drive cell differentiation toward Th1 or Th2. In response to TCR activation and
mTOR costimulation, Akt modulates transcription of T-bet but not Gata3, thus affecting Th1 but not
Th2 differentiation. In contrast, PKC-θ activation yields the opposite result (Lee K. et al, 2010).
Additionally, Lmna-/- mice exhibit an elevated mTOR (C1) signaling with a chronic Akt activation
(Ramos F.J. et al, 2012). Therefore, it would be ideal to address mTOR and Akt regulation by lamin
A/C in CD4+ T-cells. Indeed, previous work of our laboratory demonstrated that lamin A/C binds to
Erk1/2 and c-Fos, regulating AP-1 transcription-factor target genes in fibroblasts (Ivorra C. et al, 2006;
González J.M. et al, 2008), and that lamin A/C controls CD4+ T-cell activation through ERK1/2
signaling (González-Granado J.M. et al, 2014). Here, we have demonstrated again that lamin A/C
regulates pERK 1/2 levels, therefore affecting T-cell activation. Interestingly, the formation of c-Fos/c-
Jun dimers can potentiate Th1 differentiation (van Panhuys, N., 2016). So that, it would be interesting
to check if lamin A/C potentiate the dimerization of c-Fos and c-Jun. Moreover, lamin A/C is known
for its role in chromatin organization, interacting directly with DNA, forming what is called lamin
associated domains (LADS) (van Steensel B. & Belmont A.S., 2017). This maps of lamin interactions
are reorganized during cell differentiation, depending on the cell type (Peric-Hupkes D. et al, 2010).
Because of that, we postulate that lamin A/C is capable of regulating specifically the transcription of
genes that are related with Th1 but not with Th2 differentiation. Furthermore, it has been reported that
lamin A/C gets to control cell-differentiation by modulating epigenetic changes (Oldenburg A. et al,
2017). Additionally, one key factor of T-cell differentiation commitment is the epigenetic regulation
(Morinobu A. et al, 2004). There have been described several histone modifications in Th master
regulator genes and lineage-specific cytokine genes, that determines the Th fate (Hirahara K. et al,
2011). In line with this, we have demonstrated that lamin A/C deficiency downregulates the expression
of T-bet, diminishing H3K4me1 epigenetic modification in T-bet promoter, while in Gata-3, Foxp3 and
RorγT promoters lamin A/C does not alter any of the studied epigenetic modifications (H3K4me3,
H3K27me3, and H3K4me1). So that, one mechanism by which lamin A/C regulates specifically Th1
differentiation, consists in the upregulation of the enhancer mark H3K4me1 in T-bet gene promoter,
what facilitates T-bet transcription and therefore Th1 differentiation. The role of lamin A/C in Th

93 DISCUSSION
differentiation epigenetics was, until now, completely unknown, thus, our work reveals that lamin A/C
is a key epigenetic modulator of Th1 differentiation. Additionally, there are already known many of the
responsible enzymes of chromatin histone modifications (Dimitrova E. et al, 2015). Interestingly, the
histone demethylase JmjD3 interacts with T-bet transcription factor affecting Th1 differentiation and
cytokine expression (Li Q. et al, 2014). This demethylase was one of our candidates to be modulated by
lamin A/C, however our high throughput proteomic study has not showed significant differences at
protein level for this enzyme. Nevertheless, our results showed other lysine demethylases as PHF8 and
KDM5B that were significantly downregulated in lamin A/C deficient CD4+ T-cells. Remarkably,
KDM5B demethylates Lys-4 of histone H3, being responsible of the H3K4me1 modification, which is
downregulated in T-bet promoter of Lmna-/- CD4+ T-cells according to our studies. Our data also expose
significant changes in methyltransferases as EZH1, CARM1, and ASH2L, and acetyltransferases as
B2RRD7, and Ep300. Therefore, it would be of interest to study the histone modifications written by
these enzymes in Lmna-/- CD4+ T-cells compared to WT. EED PcG protein downregulation in Lmna-/-
CD4+ T-cells also stands out among the quantitative proteomic results. This could be related with the
fact that lamin A/C interacts with PcG proteins (Cesarini E. et al, 2015), which are epigenetic repressors
that control a wide number of genes during differentiation processes (Prezioso C. & Orlando V., 2011).
But PcG proteins and lamin A/C have not yet been jointly related with Th differentiation. Hence, our
findings invite to explore further this research path in the future, being extremely interesting to perform
ChIP-seq assays for H3K4me1 and other histone modifications, according to our proteomic results.
Furthermore, it has been described that the concentration of histone modifications enzymes at the
cytoplasm and nucleus is dynamically and tightly controlled at protein level in response to
environmental changes during pathophysiological processes (Zou C. & Mallampalli R.K., 2014).
Accordingly, we have seen that lamin A/C expression in CD4+ T-cells is also very dynamic depending
on the environment in which they are confined. Moreover, we have demonstrated that lamin A/C seems
to be an important regulator of histone modifications enzymes at protein level.
Apart from the role of lamin A/C in CD4+ T-cell epigenetics, our quantitative proteomic analysis has
also revealed that lamin A/C regulates the expression of several proteins related with DNA machinery,
immune system, metabolism, cytoskeleton and vesicular transport. The role of lamin A/C in gene
expression has been already reported (Brohnstein L. et al, 2018). As well, it is known the physical
connection between A-type lamins and cytoskeleton through nesprins and SUN domain proteins
(Schrimer E.C. & Foisner R., 2007). Moreover, our laboratory has previously described lamin A/C
relation with cytoskeleton dynamics, reporting that lamin A/C increases the polymerization of actin
filaments and the translocation of MTOC, thus enhancing T-cell activation (González-Granado J.M., et
al 2015). Thereby, our proteomic data confirms these previous findings. Besides, all this project
demonstrates a key function of lamin A/C in CD4+ T-cells activation and differentiation, however it
would be interesting to study if lamin A/C expression is also important for other immune cell types. The
94 DISCUSSION
role of lamin A/C in T-cell metabolism has not been explored yet. What is known is that metabolism is
another factor closely related with T-cell proliferation and differentiation. Once a T-cell is activated, a
metabolic reprogramming starts after TCR stimulation accompanied by signals from co-stimulatory
molecules as CD28, or cytokines as IL2, which induce the activation of phosphatidylinositol 3’-kinase
(PI3K)-Akt signaling pathway, leading to a rapid increase in the glucose uptake and glycolysis (Coe
D.J. et al, 2014). Other molecules downstream of TCR/CD28, as P38 and ERK, are also linked with the
induction of glycolysis after T-cell stimulation (Marko A.J. et al, 2010). Furthermore, it is known that
effector Th cells as Th1 uses glycolysis and glutamine energy sources, while Treg, memory and naïve
T-cells rely on fatty acids oxidation to generate ATP (Almeida L. et al, 2016). Therefore, it would be
really interesting to explore if lamin A/C deficient CD4+ T-cells exhibit a diminished glycolysis and an
augmented fatty acids oxidation, which would fit with our results in T-cell activation, and Th1 and Treg
differentiation. Vesicular transport also seems to be regulated by lamin A/C in CD4+ T-cells according
to our proteomic results. It has been reported that vesicular trafficking during IS formation is extremely
important for surface receptors recycling in T-cells, to can recognize properly the APC (Onnis A. et al,
2016). Besides, exosomes secretion is a key communication channel between T-cell and APC, affecting
to T-cell activation dynamics (Bustos-Morán E. et al, 2017; Torralba D. et al, 2018). Thereby, this could
be another mechanism regulated by lamin A/C to be studied in the future.
Viral clearance requires the efficient coordination of multiple immune effector mechanisms (Swain
S.L. et al, 2012). Our work shows that lamin A/C deficiency in CD4+ T-cells results in a defective T-
cell differentiation towards Th1 phenotype, impairing the response against VACV and delaying viral
clearance. These results suggest that lamin A/C is an essential component of the immune response
against cytopathic viruses. Remarkably, lamin A/C expression in CD4+ T-cells seem to be enough to
regulate the viral clearance, since only CD4+ T-cells were adoptively transferred to T- and B-cell
deficient Rag1-/- mice before mouse infection with VACV in our experiments. Accordingly, in humans,
CD4+ T-cells are critical for anti-viral immunity and the control of VACV replication (Munier C.M. et
al, 2016). CD4+ T-cells can also regulate innate immune responses that mediate viral clearance (Swain
S.L. et al, 2012). This viral clearance is independent on B-cells and CD8+ T-cells, and might be
important for appropriate CD4+ T-cell dependent responses to VACV (Mota B.E.F. et al, 2011). Effector
CD4+ T-cells have been shown to respond to viral pathogens through two mechanisms: cytokine
production (mostly IFNγ and TNFα) and a direct cytolytic activity mediated by perforin and FAS (also
known as CD95) (Swain S.L. et al, 2012). The cytotoxic activity of CD4+ T-cell effectors does not
require Th1 cell polarization or T-bet expression but is dependent on the expression of the transcription
factor Eomesodermin (Eomes), which is crucial for the development of cytotoxic CD4+ T-cells in vivo
through the induction of granzyme B (Qui H.Z. et al, 2011). In addition to increasing T-bet and Ifnγ
mRNA expression, we find that the presence of lamin A/C enhances the expression of Eomes, Blimp-1,
Prf1, and granzyme B mRNA in CD4+ T-cells in vitro differentiated to Th1. Thereby, we have

95 DISCUSSION
demonstrated that lamin A/C is a key regulator of Th1 effector response directly affecting to IFNγ
production, and CD4+ lymphocytes cytotoxic activity. This finding could be applied for improving the
immune response of immunocompromised individuals against pathogen infections. Thus, lamin A/C is
a potential therapeutic target for infectious and immune diseases.
As it was mentioned before, the protozoan parasite Leishmania major cause cutaneus leishmaniasis
which consists in skin lesions in humans that self-heal; however, the parasite can cause prolonged non-
healing skin ulcers with extensive tissue destruction and become systemically distributed (Reithinger R.
et al, 2007). C57BL/6 mice develop a protective immune response against L. major. We show that WT
recipient C57BL/6 mice reconstituted with Lmna-/- bone marrow develop poorer Th1 responses against
L. major infection, with worse clearance of the pathogen than recipients of WT cells. The immune
response against L. major involves multiple cell types, and Lmna-/--reconstituted mice lack lamin A/C
throughout the immune system. Therefore, to define the defective response to L. major to the lack of
lamin A/C specifically in T-cells, we inoculated the ears of WT and Lmna-/--CD4-CRE mice. Healing
was impaired in the ears of this mice lacking lamin A/C in T-cells. C57BL/6 mice develop a Th1-type
response to L. major, and lesions heal in the absence of CD8+ T-cells following a high L. major dose
(Belkaid Y. et al, 2002; Uzonna J.E. et al, 2004). Moreover, cytolytic CD8+ T-cells are pathogenic when
recruited to Leishmania lesions in large numbers (Novais F.O. et al, 2013). Therefore, the deficient
response observed in Lmna-/--CD4-CRE mice is likely associated with the lack of lamin A/C in CD4+T-
cells. The early immune response determines whether L. major skin infection will be self-healing or
chronic. C57BL/6 mice develop CD4+ Th1 cell-mediated resistance upon L. major infection, whereas
other mouse strains develop a CD4+ Th2-type response and are extremely susceptible to infection (Scott
P. & Novais, F.O., 2016). Therefore CD4+ Th1 cells are crucial for reducing Leishmania infection
producing IFNγ, IL-2, and TNFα locally at the cutaneous lesion, and leading to macrophage activation
and parasite elimination (Iborra S. et al, 2016). Our experiments show a diminished percentage of IFNγ-
producing CD4+ T-cells and reduced IFNγ production in Lmna-/- mice. IFNγ secretion by CD4+ T-cells
induces macrophages to produce nitric-oxide (NO) and tumor necrosis factor (TNF), thus controlling L.
major infection (Scott P. et al, 1988; Scott P. & Novais, F.O., 2016). Downregulated IFNγ production
in Lmna-/- CD4+ T-cells could thus lead to impaired macrophage NO production, explaining the
diminished pathogen clearance observed in the absence of lamin A/C. Importantly, we show that lamin
A/C in CD4+ T-cell is an important mediator of the immune control against this pathogen. Our study
reveals a novel role for lamin A/C as a regulator of T-cell differentiation, controlling the maintenance
of Th1 populations in response to pathogen infections. These data contribute to the understanding of the
molecular mechanisms driving CD4+ T-cell responses and suggest strategies to modulate T-cell
function, which could provide a route toward therapeutic immunization and long-lasting protection.
96 DISCUSSION
7.4. Lamin A/C and Treg response.
According to our in vitro and in vivo results, lamin A/C not only regulates Th1 differentiation, but
also modulates Treg polarization. Lamin A/C deficient T-cells upregulate Foxp3 expression, which
correlates with an enhanced Treg differentiation in vitro. Therefore, lamin A/C impairs Treg polarization
directly diminishing Foxp3 expression. Besides, our experiments with retroviruses promoting lamin A/C
overexpression in CD4+ T-cells, clearly supports that lamin A/C regulates Foxp3 expression and Treg
differentiation. However, as it has been discussed before, our data indicates that the mechanism through
which lamin A/C modulates Foxp3 is not based on epigenetics, since we did not observed any significant
difference in H3K4me3, H3K27me3 and H3K4me1 modifications in Foxp3 promoter. It is certain that
we have only studied three histone modifications, so more research is needed to assure that this is not
the mechanism through which lamin A/C controls Foxp3 expression. It is known that Foxp3 expression
in naïve peripheral T-cells in in vitro and in vivo systems, depends on TGFβ signaling (Chen W. et al,
2003). Interestingly, A-type lamins have been shown to interact with the receptor regulated SMAD
(rSMAD) at the INM antagonizing TGFβ signaling (Lin F. et al, 2001; Van Berlo J.H. et al, 2005). In
line with this, we have observed by high throughput proteomics analysis that lamin A/C deficient CD4+
T-cells display TGFβ signaling upregulation compared to WT. We have not included this result on this
work, because we need to further validate it by western blot. Foxp3 expression can be also induced by
TCR signals and IL-2. TCR activation promote the binding of TFs as NFAT, CREB, AP-1 and ATF
promoter (Merkenschlager M. & von Boehmer H., 2010). We have observed that lamin A/C is also
induced by TCR activation, and some studies have demonstrated that lamin A/C can interact with TFs
modulating gene expression and even affecting cell differentiation (Dreuillet C. et al, 2002; Lloyd D.J.
et al, 2002). Moreover, the molecular connection between lamin A/C and these TFs has not been studied
yet, therefore it is an interesting question to address. Thus, lamin A/C could negatively modulate the
expression of TGFβ and other genes related with Treg differentiation. Regarding IL-2, we have not
observed a connexion between lamin A/C and IL-2 expression, although CD25 (or alpha chain of IL-2
receptor) is clearly upregulated by lamin A/C in CD4+ T-cells 48 h after antigen recognition. CD25
expression is maintained by Treg cells after T-cell activation, so that CD25 is a surface marker
commonly used to study Tregs (Curotto de Lafaille M.A et al, 2004). For this reason, we have used not
only Foxp3 but also CD25 to gate Treg cells by flow cytometry. Nevertheless, we have observed higher
percentage of CD25+ Foxp3+ population in Lmna-/- CD4+ T-cells. Moreover, we have found that lamin
A/C epigenetically regulates CD25 expression after 48 h of T-cell activation, enhancing its expression
as well as CD69. CD69 is also expressed by a specific population of Treg cells, which is characterized
by the expression of GITR, CTLA-4, ICOS and CD38 (Cortés J.R. et al, 2014). Although we have not
analyzed CD69 in Lmna-/- Tregs, we have checked Gitr, Ctla-4, and Icos mRNA levels, and the
expression of Gitr was significantly increased in Lmna-/- Tregs. For this reason, it would be interesting
to analyzed also CD69+ Treg population derived from Lmna-/- CD4+ T-cells. So that, it seems that lamin
A/C dynamically regulates CD25. This is not a trivial explanation due to the high plasticity of epigenetic

97 DISCUSSION
changes depending on the signals coming from the environment (Ho S. et al, 2012). However, we need
to better characterize by time-course experiments the lamin A/C modulation of CD25 and CD69
expression in CD4+ T-cells. Interestingly, all these molecules, CD25, CD69, TGFβ and IL-2 are part of
PI3K-Akt-mTOR signaling (Merkenschlager M. & von Boehmer H., 2010), thus Treg and Th1
differentiation processes share this molecular pathway. Furthermore, it is known that mTOR is an
important regulator of CD4+ T-cell differentiation that promotes Th differentiation, since mTOR
deficient mice showed a severely impairment in Th1, Th2 and Th17 polarization. Furthermore, it has
been reported that the mTOR suppression in CD4+ T-cells promotes Treg differentiation (Delgoffe G.M.
et al, 2009). Moreover, mTOR altered signaling has been associated with LMNA mutations (Liao C.Y.
et al, 2016). Therefore, we postulate that lamin A/C could also affect mTOR expression, being this an
interesting hypothesis to study in the future. The mTOR upregulation by lamin A/C expression after
TCR stimulation would be a plausible mechanism to explain how lamin A/C has an opposite dual role
in Th1 and Treg differentiation. Nevertheless, this hypothesis would not explain our observations in Th2
and Th17 differentiation therefore, alternative mechanisms may be accounting for these results. The T-
cell transfer model of IBD has permitted us to corroborate our previous in vitro results regarding naïve
CD4 T cell differentiation. In fact, with this model of colitis, we have been able to observe, an
enhancement of Treg and an impairment of Th1 polarization due to the absence of lamin A/C in naïve
CD4+ T-cells. Th17 cells are also main players in IBD promoting inflammation (Ueno A. et al, 2018).
However, the model of naïve CD4+ CD25- T-cells transfer into immunodeficient mice, which we have
performed, leads to a Th1-mediated colitis (Coombes J.L. et al, 2005). Maybe, this is the reason why
we have not obtained any significant difference in Th17-expressing cells percentages related with the
lack of lamin A/C in CD4+ T-cells. It would be interesting to check if we can reproduce these
observations in alternative mouse model of colitis, for example in the Dextran Sodium Sulfate (DSS)
induced chronic colitis mouse model. Nevertheless, our in vitro differentiation assays towards Th17
phenotype, shows the same appreciation; lamin A/C does not modulate Th17 polarization. Thus, lamin
A/C seems to control specifically Th1 and Treg responses, and not Th2 nor Th17. These findings are
also very interesting because almost all the literature related with Th populations, is always based on
Th1/Th2 paradigm against infections (Romagnani S., 1997), and Th17/Treg balance in autoimmune
diseases (Noack M. & Miossec P., 2014). For this reason, our work introduces a novel concept, the
functional Th1/Treg balance in IBD. This work shows how Th1 and Treg populations are functionally
counter-regulated by different mechanims. This balance between Th1 and Treg cells, has not been
described in dept yet, although Crohn’s disease has been associated with Th1 cytokine profile, and Tregs
are the cells in charge of controlling this Th imbalance to solve colon inflammation (Brand S., 2009). In
line with this, our results show how Lmna-/- CD4+ T-cells protect against IBD development in mouse,
by the upregulation of Treg population and detriment of Th1. Thus, the transfer of naïve Lmna-/- CD4+
T-cells remarkably provokes less inflammation in the colon compared with WT CD4+ T-cells, at least,
in Crohn’s disease mouse model. In contrast with Crohn’s disease, ulcerative colitis is characterized by

98 DISCUSSION
a Th2 cytokine profile (Brand S., 2009). Since we know that lamin A/C does not affect to Th2
differentiation, it would be interesting to investigate how can affect lamin A/C deficiency in CD4+ T-
cells in the development of ulcerative colitis in mouse. It is necessary to confirm if our findings are
fulfilled in all IBD scenarios, in order to strengthen the lamin A/C as a therapeutic target against these
autoimmune pathologies.
The IBD is a multifactorial disease that have been related with environmental factors, genetic
susceptibility, and changes in the microbiota populations (Vanhove W. et al, 2016; Young C.E., 2016).
The microbiota is an indispensable factor in the colitis development (Guarner F., 2008; Sartor R.B.,
2008). Prove of that is the finding that IL-10 knockout mice, a well-known mouse model of IBD,
cohoused under germ-free conditions do not develop colon inflammation at all (Kuhl A.A. et al, 2007).
In addition, it has been clinically observed that some patients respond to antibiotic treatment (Khan K.J.
et al, 2011). Therefore, in order to avoid microbiota heterogeneity, we have always performed our IBD
mouse experiments under cohousing conditions (Laukens D. et al, 2016). Thus, our results cannot be
attributed to the microbiota component of mice.
The protection from IBD development in lamin A/C deficient CD4+ T-cells transferred Rag1-/- mice
could be due to an increase in Treg differentiation or to a Treg better immunosuppressive response.
Thereby, we decided to study the suppressive activity of Tregs coming from Lmna-/- CD4+ T-cells
(Lmna-/- Tregs from now on) in comparison to WT (WT Tregs from now on). Additionally, it is known
that Tregs must express CD25 at some point of their life to display their suppressive activity (Curotto
de Lafaille MA et al, 2004). Hence, we have analyzed the expression of surface molecules that have
been related with Treg activity in CD25+ Tregs in vitro differentiated from Lmna-/- and WT CD4+ T-
cells. Our results show that Lmna-/- Tregs express higher levels of IL-10 and TGFβ and upregulate PD-
1 and CD25 markers compared to WT Tregs. These data mean that Lmna-/- Tregs have better suppressive
function compared to WT, since it is known that IL-10 and TGFβ are immunosuppressive cytokines
released by Tregs (Schmidt A. et al, 2012) and CD25 and PD-1 expression is needed to exert the Treg
functionality (Curotto de Lafaille MA et al, 2004; ). In addition, GITR has been reported to be a marker
of active Tregs (Ronchetti S. et al, 2015), and we have also observed higher levels of Gitr expression in
Lmna-/- Tregs compared to WT. The surface molecule CTLA-4 has been suggested to intervene in Treg
suppressive activity in vivo, due to the finding that CTLA-4 deficient or knockout mice exhibit
spontaneous autoimmunity with a Treg amelioration (Bachmann M.F. et al, 1999; Takahashi T. et al,
2000). Regarding this information, it is true that we have not obtained significant results that show that
Lmna-/- Tregs express higher levels of CTLA-4. However, it has been described that CTLA-4 deficient
Tregs could display the immunosuppressive activity through compensatory mechanisms related with
IL-10 and TGFβ (Tang Q. et al, 2004; Read S. et al, 2006). So that, it seems that IL-10 and TGFβ are
the key players of Treg immunosuppressive activity. Furthermore, we have functionally demonstrated
that Lmna-/- Tregs have higher suppressive power than WT Tregs, carrying out Treg in vitro suppressive

99 DISCUSSION
assays against Th1 proliferation. Hence, we have robustly confirmed that lamin A/C deficiency in CD4+
T-cells not only improves Treg differentiation also enhances the Treg immunosuppressive function,
being these the explanation why we have observed less IBD development in lamin A/C deficient CD4+
T-cells transferred mice compared to WT transferred mice and have better suppressive power against
Th1 proliferation. Although CD25 is a surface marker that has been commonly used to study Tregs, not
all the Treg populations express CD25 (Curotto de Lafaille MA et al, 2004). However, the TF Foxp3,
is constitutively expressed by Tregs and is considered to confer their suppressive ability to block colitis
and other autoimmune diseases. Because of that, Foxp3 has been used as a more specific marker for
Tregs (Hori S. & Sakaguchi S., 2004; Zheng Y. et al, 2010). For these reasons, we have studied the
suppressive function of CD25+ Foxp3+ Treg cells differentiated from naïve Lmna-/- CD4+ T-cells in
comparison to WT. Hence, we have observed that like CD25+ TregsCD25+ Foxp3+ Tregs derived from
lamin A/C deficient CD4+ T-cells have better suppressive function against Th1 differentiation compared
to CD25+ Foxp3+ Tregs derived from WT CD4+ T-cells. In line with these observations, it has been
demonstrated that the transfer of CD4+ CD25+ Tregs can not only prevent the IBD, but can also revert
the established inflammation in mouse (Uhlig H.H. et al, 2006). So that, our work suggests that the
transfer of Lmna-/- CD25+ or Lmna-/- CD25+ Foxp3+ Treg cells could be a promising cell therapy against
IBD, because it would suppress in a more efficient manner the intestine inflammation provoked by an
upregulation of Th1 and Th17 populations.
Supporting our data, it has been previously described that lamin A/C is a risk biomarker in colorectal
cancer (Willis N.D. et al, 2008). Moreover, it is known that patients with Crohn's disease have a higher
risk to suffer gastrointestinal tract and hematopoietic system cancers, compared with the general
population. The presence of IBD, especially if it is long standing, promotes the development of
malignancies (Stidham R.W. & Higgins P.D.R., 2018). Thereby, it seems clear that lamin A/C regulation
has an important role in the intestine health. Hence, it would be interesting to analyze lamin A/C
expression levels in human colonic samples from IBD patients, to address if lamin A/C could be a risk
biomarker not only in colorectal cancer, but also in IBD. Additionally, we could investigate in the future,
if lamin A/C deficiency in CD4+ T-cells protects from colorectal cancer development in mouse models.
7.5. Physiological regulation of lamin A/C by retinoic acid.
As it was previously mentioned, there is almost no information about the regulation of A-type lamins
expression in immune cells. It has been described that there is a RA responsive element in the LMNA
promoter (Okumura K. et al, 2004), and that RA downregulates lamin A/C expression in leukocytes
(Olins A.L. et al, 2001). Now, we have demonstrated in vitro that RA downregulates antigen-
recognition-induced lamin A/C expression in CD4+ T-cells. Additionally, we have observed that lamin
A/C expression in CD4+ T-cells depends on the environment in which T-cells are confined in vivo. Thus,
lamin A/C is highly expressed in activated CD4+ T-cells that are localized in PLN, while in MLN and
spleen, activated CD4+ T-cells express significantly lower levels of lamin A/C. Therefore, it seems that

100 DISCUSSION
some molecule differentially released or expressed in membrane depending on the lymphoid organ, is
capable of modulating lamin A/C expression. In accordance to this, it is known that RA is present at
different levels depending on the tissue microenvironment. Tissues such as intestine, liver, and eyes,
present high levels of RA, while in blood, RA is present at low quantity (Pino-Lagos K. et al, 2008).
RA is a key molecule in the intestine due to its role promoting gut-homing (Iwata et al, 2004). In the
intestine, RA is produce by epithelial cells, DCs and macrophages. DCs can release RA for T-cells
undergoing activation, and RA released by intestinal epithelial cells can also affect T-cells in the
intraepithelial compartment (Coombes J.L et al, 2007). It has been described the specific DCs
populations in charge of RA release. CD103+ DCs are known to be responsible of this RA production
in the gut, MLN and PP, whereas CD103- DCs do not produce RA. Hence, CD103+ DCs are
preferentially located in intestinal regions, while CD103- DCs are more abundant in PeLN and spleen
(Esterházy D. et al, 2016). Accordingly, our data confirm that MLN contain higher quantity of CD103+
DCs compared with PeLN. In addition, we have shown how CD11C+ DCs from MLN downregulates
significantly lamin A/C expression levels in CD4+ T-cells, in comparison to CD11C+ DCs from PeLN,
which do not greatly downregulate lamin A/C. Regarding that CD103+ are the DC population which
predominantly produces RA, our results clearly indicate that RA is one of the molecules that
physiologically regulates lamin A/C expression in T-cells, depending on the immunological
compartment in the organism.
RA levels can also change the phenotype of DCs and macrophages to indirectly affect T-cell
activation, differentiation and function. Thus, in general, RA at high concentrations generate DCs with
a low T-cell activation capacity, inducing Foxp3+ Tregs; while low levels of RA are required for optimal
activation of T-cells and induction of effector T-cells (Kim C.H., 2013). Thereby, RA may have a double
effect on lamin A/C expression: a direct one on the LMNA promoter, and another one that may affects
DCs indirectly changing lamin A/C expression upon antigen-recognition. Additionally, RA has an s
effect on Th1/Th2 polarization. In vitamin A deficient mice, Th1 cells are increased (Cantorna M.T. et
al, 1995), and in the “pinkie” mice where RA receptors function is insufficient, Th1 response is
augmented (Spilianakis C.G. et al, 2005). However, RA is not a direct polarizing agent, it acts on other
cells to indirectly regulate the Th response (Kim C.H., 2013). Thereby, until now, the mechanism for
RA effects in Th differentiation was unclear. Interestingly, all this information perfectly fits with our
findings about lamin A/C role in T-cell activation and differentiation, and taking into account our data
that confirms lamin A/C downregulation by RA. Furthermore, several studies have reported the RA
capacity to induce Treg differentiation from naïve T-cells. Hence, RA induces Foxp3 expression when
is added during naïve CD4+ T-cell activation (Sun C.M. et al, 2007). It is known that this process can
be dependent on TGFβ expression (Coombes J.L. et al, 2007; Mucida D. et al, 2010); nevertheless, how
RA affect Foxp3 gene expression is not clearly understood yet (Benson M.J. et al, 2007; Mucida D. et
al, 2007). We have corroborated these data, observing as well that RA augments naïve Treg

101 DISCUSSION
differentiation. Similarly, we have observed that lamin A/C downregulation during CD4+ T-cell
activation has the same effect, an enhancement of Treg polarization. Moreover, it has been described
that the expression of RA receptors alfa-type (RARα) is enhanced in T-cells by the presence of RA
(Halevy O. et al, 1994). Accordingly, our data shows that Tregs polarized from lamin A/C deficient
CD4+ T-cells upregulate RARα mRNA expression. However, the role of RA in Th17 differentiation is
not clear. Some authors point out that RA promotes Treg and Th17 polarization reciprocally (Mucida
D. et al, 2007), while others defend that RA inhibits Th17 differentiation (Schambach F. et al, 2007;
Elias K.M. et al, 2008). Again, this discrepancy coincide with our results, as we have not obtained clear
results about the effect of lamin A/C on Th17 differentiation.
In addition, as it was briefly mentioned in the introduction, RA or vitamin A have been used in mouse
models to ameliorate colon inflammation (Bai A. et al, 2009). We have corroborated this effect in
parallel to the same appreciation for lamin A/C deficiency in CD4+ T-cells. Therefore, our results point
out that lamin A/C downregulation in CD4+ T-cells ameliorates the symptoms derived from IBD as well
as RA treatment, through the enhancement of Treg differentiation and impairment of Th1 differentiation.
However, RA effect is a multi-target treatment for IBD, while lamin A/C downregulation in CD4+ T-
cells can specifically solve the Th population misbalance characteristic of the IBD. Furthermore, the
use of retinoids to treat various types of dermatoses as psoriasis, has brought to light its multiple side
effects. Systemic administration of these compounds has been frequently associated with liver toxicity,
mucocutaneous adverse effects, and abnormalities of serum lipid profiles, which might be related to an
increased risk of coronary heart disease. Even, retinoids have been classified as teratogenic, and long-
term treatments have shown also skeletal abnormalities, so they cannot been prescribe for pregnant
women or children (David M. et al, 1988). For these reasons, lamin A/C downregulation may be a
potential and specific therapeutic approach to take into account for IBD. To give greater relevance to
this idea, we want to develop, in the near future, molecular techniques as lentivirus or CRISPR CAS9
technology, to downregulate lamin A/C specifically in CD4+ T-cells, and thus treat Crohn’s disease in
addition or not to other treatments.
7.6. Proposed model.
All together our results suggest that antigen recognition-induced lamin A/C expression in CD4+ T-
cells is physiologically regulated by APC’s RA release at the moment of IS formation by
microenvironmental factors. TCR activation induces lamin A/C expression which enhances T-cell
activation by the upregulation of CD69 and CD25 surface markers among other mechanisms 48 h after
T-cell activation. Likewise, H3K4me1 epigenetic modification is upregulated in T-bet gene promoter
by lamin A/C expression, which augments T-bet TF expression and determines Th1 fate commitment.
Furthermore, thanks to lamin A/C expression, this Th1 differentiated cells display better effector
function against infections, due to their greater cytotoxicity and quantity (Figure 38A).

102 DISCUSSION
Figure 38. Schematic representation of lamin A/C role in Th differentiation and adaptive immune
response. (A) Peripheral lymph nodes (PeLN) and spleen are enriched in CD103- DCs that produce low
amounts of retinoic acid (RA) among other molecules. This low amount of RA permits high lamin A/C
expression levels which is induce by TCR activation after antigen recognition. Lamin A/C epigenetically
enhances CD69 and T-bet expression by the upregulation of H3K4me1 modification in their gene promoters.
Likewise, lamin A/C augments CD25 expression, thus improving T-cell activation. The upregulation of the
Th1 master regulator T-bet determines that CD4+ T-cells polarize towards Th1 phenotype. Moreover, lamin
A/C determines that these Th1 cells display a more efficient immune response against intracellular infections,
improving their cytotoxicity through the upregulation of Interferon γ (IFNγ), Perforin 1 (Prf1), Granzyme B
(GzmB), and the transcription factors Eomes and Blimp-1. (B) On the contrary, in mesenteric lymph nodes
(MLN) and intestine, CD103+ is the main DC population which produce high amounts of RA. RA
downregulates lamin A/C expression in CD4+ T-cells during the interaction DC-T-cell. Lamin A/C
downregulation determines a mild T-cell activation through the downregulation of CD69 and CD25.
However, lamin A/C downregulation does not affect T-cell proliferation, but modifies the Th fate,
downregulating T-bet and upregulating the master regulator of Treg cells Foxp3, and other Treg surface
markers as Cd25, Rarα, and Pd-1. Therefore, lamin A/C downregulation enhances Treg differentiation, and
improves Treg suppressive function also by the upregulation of TGFβ, IL-10, implying and advantage against
inflammatory chronic diseases as IBD.
.
103 DISCUSSION
However, if lamin A/C is downregulated due to RA release by the APCs, T-cell activation will not
be so strong, and Foxp3 expression will be enhanced leading T-cell differentiation towards Treg
phenotype. As well, lamin A/C downregulation determines that these Treg cells have greater suppressive
function, being an advantage against IBD development (Figure 38B).
In conclusion, this work set A-type lamins as key regulators of Th1 and Treg differentiation, being
for this reason a potential therapeutic target for infectious diseases and IBD.
7.7. Final recapitulation and future perspectives.
The immune system is one of the most dynamics systems of our organism, having to deal with a
great variety of infections, chronic inflammatory diseases, and tumors. Because of that, immune
homeostasis supposes a constant challenge for immune cells. This feature determines the complexity of
immune mechanisms (Huntington N.D. & Gray D.H.D., 2018). Many of the specific mechanisms exert
by immune cells are already known, however, from my point of view, there is a lack of information
about how immune response integrates with other systems of the body, and about immune response
regulation depending on the environment. In line with this, it has been investigated the relationship
between psychological stress and physical vulnerability with the adaptive immune response (Segerstrom
S.C. & Miller G.E., 2004; Dhabhar F.S., 2014). Furthermore, it has been known for a long time the
increased susceptibility of aged people to infections, but it is not known the signaling pathways
responsible of this connection (Gardner I.D., 1980). Additionally, the effectiveness of vaccines, overcoat
the ones against influenza viruses, have a reduced efficacy and depends on the individual (Osterholm
M.T. et al, 2012). Interestingly, it has been described that lamin A/C expression is gradually lost with
aging in osteoblasts and cardiomyocytes (Duque G. & Rivas D., 2006; Afilalo J. et al, 2007).
Accordingly, Xin L. and collaborators described in 2015 that accelerated aging LmnaDhe mice mimicked
the infection susceptibility to pathogens, and exhibited a systemic expansion of suppressive Foxp3+
Tregs. Our works robustly demonstrates that lamin A/C is regulated by micro environmental immune
changes in CD4+ T-cells, being a key regulator of T-cell activation and Th differentiation, augmenting
Th1 and blocking Treg, through epigenetic and/or transcription changes of T-cell key genes. Thus, we
suggest that lamin A/C upregulation could be a specific therapy to improve the immune response against
different pathologic situations. Besides, we have shown how a nuclear protein can be responsible of the
adaptive immune response depending on micro-environmental changes.
The importance of the immune system in the development or origin of several non-immune diseases
has been underestimated, and in the last years, the immune diseases are spreading out in the population.
For this reason, immune system is currently becoming more important, and the immunotherapy is living
a golden age. For example the well-known anti-TNFα antibody treatments are being used for many
autoimmune diseases as rheumatoid arthritis, IBD, psoriasis and ankylosing spondylitis (Monaco C. et
al, 2015). The immunotherapy against cancer is taking also relevance as anti-PD-1 antibody treatments

104 DISCUSSION
(Topalian S.L. et al, 2012). However, these treatments are not specific and are far from getting a 100%
effectiveness in all the diagnosed patients. Therefore, it is necessary to find new signaling molecules
that regulate the adaptive immune response. Our results point out that lamin A/C is an important
regulator of Th1/Treg adaptive immunity protecting from Crohn’s Disease development when it is
downregulated in CD4+ T-cells. Moreover, our data demonstrate that lamin A/C downregulation in
CD4+ T-cells improves directly Treg suppressive activity. Therefore, a cell therapy with Tregs derived
from Lmna-/- would target specifically the immune misbalance characteristic of IBD, being a plausible
treatment with no expected side effects. This therapy could replace or improve the current treatments
for IBD. Moreover, this work brings to light the important role of lamin A/C in T-cell mediated immune
not only in IBD, but also in infectious scenarios. So, in conclusion, lamin A/C could be a new therapeutic
target not only for IBD and autoimmune pathologies, but also for other diseases caused by an immune
dysregulation as infectious diseases, HIV, cancer, or atherosclerosis.

Conclusions

107 CONCLUSIONS
8. CONCLUSIONS
The obtained conclusions from this project are listed as follows:
1) Lamin A/C deficiency does not affect CD4+ T-cell development.
2) Lamin A/C participates in CD4+ T-cell activation by upregulating CD69 and CD25 through
epigenetic mechanisms, but does not affect T-cell proliferation.
3) Lamin A/C favors Th1 differentiation of CD4+ T-cells, without affecting Th2 differentiation,
through H3K4me1 epigenetic modification of T-bet gene promoter, thus facilitating T-bet
transcription factor expression.
4) Lamin A/C controls CD4+ T cell cytotoxic capacity by the enhanced transcription of Ifn, GzmB,
Prf1, Eomes, and Blimp-1, and regulates Th1 effector response against vaccinia virus and
Leishmania major infections.
5) Lamin A/C depletion in CD4+ T-cells facilitates Treg differentiation by upregulation of Foxp3
transcription factor expression, without affecting Th17 differentiation.
6) Lamin A/C deficiency in CD4+ T-cells protects from IBD development in mice through
increased Treg differentiation and reduced Th1 differentiation.
7) Lamin A/C deficiency in CD4+ T-cells increases Treg suppressive function by upregulating
Tgfβ, and Il10 transcription levels.
8) Retinoic acid released by CD103+ DCs in mesenteric lymph nodes, downregulates lamin A/C
expression in CD4+ T-cells upon antigen recognition.

108 CONCLUSIONS
CONCLUSIONES
Las conclusiones obtenidas de este trabajo se encuentran enumeradas a continuación:
1) La falta de expresión de lamina A/C no afecta al desarrollo de células T CD4+.
2) La lamina A/C participa en la activación de la célula T CD4+, subiendo la expresión de CD69 y
CD25 mediante mecanismos epigenéticos, sin afectar a la proliferación de la célula T.
3) La lamina A/C favorece la diferenciación a Th1 de las células T CD4+, sin afectar a la
diferenciación Th2, mediante la modificación epigenética H3K4me1 en el promotor del gen T-
bet, facilitando así, la expresión del factor de transcripción T-bet.
4) La lamina A/C controla la capacidad citotóxica de las células T CD4+ facilitando la
transcripción de de Ifn, GzmB, Prf1, Eomes, y Blimp-1, y regula la respuesta efectora Th1 frente
a las infecciones del virus vacuna y Leishmania major.
5) La depleción de la expresión de lamina A/C en las células T CD4+, facilita la diferenciación a
células T reguladoras mediante el aumento en la expresión del factor de transcripción Foxp3,
sin afectar a la diferenciación Th17.
6) La falta de expresión de lamina A/C en las células T CD4+, protege frente al desarrollo de
enfermedad inflamatoria intestinal en ratón, mediante el aumento de la diferenciación T
reguladora y la disminución de la diferenciación Th1.
7) La falta de expresión de lamina A/C en las células T CD4+, aumenta la función supresora T
reguladora, subiendo los niveles de transcripción de Tgfβ y Il10 en estas células.
8) El ácido retinoico liberado por las células dendríticas CD103+ en los ganglios mesentéricos,
disminuye la expresión de la lamina A/C en las células T CD4+ que se produce tras el
reconocimiento antigénico.

References

111 REFERENCES
9. REFERENCES
9.1. Journal articles.
Afilalo, J., Sebag, I. A., Chalifour, L. E., Rivas, D., Akter, R., Sharma, K., & Duque, G. (2007). Age-
related changes in lamin A/C expression in cardiomyocytes. Am J Physiol Heart Circ Physiol,
293(3), H1451-1456.
Agrelo, R., Setien, F., Espada, J., Artiga, M. J., Rodriguez, M., Sanchez-aguilera, A., …Piris, M. A.
(2018). Inactivation of the Lamin A / C Gene by CpG Island Promoter Hypermethylation in
Hematologic Malignancies , and Its Association With Poor Survival in Nodal Diffuse Large
B-Cell Lymphoma. Journal of Clinical Oncology, 23(17), 3940–3947.
Ahmed, C. M., Martin, J. P., & Johnson, H. M. (2007). IFN mimetic as a therapeutic for lethal vaccinia
virus infection: possible effects on innate and adaptive immune responses. Jorunal of
Immunology, 178(7), 4576-83.
Akter, R., Rivas, D., Geneau, G., Drissi, H., & Duque, G. (2009). Effect of lamin A/C knockdown on
osteoblast differentiation and function. Journal of Bone and Mineral Research, 24(2), 283-93.
Almeida, L., Lochner, M., Berod, L., & Sparwasser, T. (2016). Metabolic pathways in T cell activation
and lineage differentiation.Seminars in Immunology, 28(5), 514-524.
Ansel, K. M., Lee, D. U., & Rao, A. (2003). An epigenetic view of helper T cell differentiation. Nature
Immunology, 4(7), 616–623.
Aoyama, K., Saha, A., Tolar, J., Riddle, M. J., Veenstra, R. G., Taylor, P. A., …Blazar, B. R. (2013).
Inhibiting retinoic acid signaling ameliorates graft-versus-host disease by modifying T-cell
differentiation and intestinal migration. Blood, 122(12), 2125-34.
Bai, A., Lu, N., Guo, Y., Liu, Z., Chen, J., & Peng, Z. (2009). All-trans retinoic acid down-regulates
inflammatory responses by shifting the Treg / Th17 profile in human ulcerative and murine
colitis. Journal of Leukocyte Biology, 86, 959–969.
Bachmann, M. F., Köhler, G., Ecabert, B., Mak, T. W., & Kopf, M. (1999). Cutting edge:
lymphoproliferative disease in the absence of CTLA-4 is not T cell autonomous. Journal of
Immunology, 163(3), 1128-1131.
Belkaid, Y., Piccirillo, C. A., & Mendez, S. (2002). CD4+ CD25+ regulatory T cells control Leishmania
major persistence and immunity. Nature, 420, 633–637.
Benson, M. J., Pino-Lagos, K., Rosemblatt, M., & Noelle, R. J. (2007). All-trans retinoic acid mediates
enhanced T reg cell growth , diff erentiation , and gut homing in the face of high levels of co-
112 REFERENCES
stimulation. The Journal of Experimental Medicine, 204(8), 1765–1774.
Biedermann, T., Zimmermann, S., Himmelrich, H., Gumy, A., Egeter, O., Sakrauski, A. K., …Röcken,
M. (2001). IL-4 instructs TH1 responses and resistance to Leishmania major in susceptible
BALB/c mice. Nature Immunology, 2(11), 1054-60.
Bogdan, C. (2000). The function of type I interferons in antimicrobial immunity.Current Opinion in
Immunology, 12(4), 419-24.
Brand, S. (2009). Crohn’ s disease : Th1 , Th17 or both? The change of a paradigm : new immunological
and genetic insights implicate Th17 cells in the pathogenesis of Crohn’ s disease. Gut, 58,
1152–1167.
Bray, M., & Wright, M. E. (2003). Progressive Vaccinia. Clinical Infectious Diseases, 36, 766–774.
Briand, N., & Collas, P. (2018). Laminopathy-causing lamin A mutations reconfigure lamina-
associated domains and local spatial chromatin conformation. Nucleus, 9(1), 216–226.
Bronshtein, I., Kepten, E., Kanter, I., Berezin, S., Lindner, M., Redwood, A. B., …Garini, Y. (2015).
Loss of lamin A function increases chromatin dynamics in the nuclear interior. Nature
Communications, 6, 1–9.
Brown, C. C., Esterhazy, D., Sarde, A., London, M., Pullabhatla, V., Osma-Garcia I., …Noelle R. J.
(2015). Retinoic acid is essential for Th1 cell lineage stability and prevents transition to a Th17
cell program. Immunity, 42(3), 499-511.
Bustos-Morán, E., Blas-Rus, N., Martin-Cófreces, N. B., & Sánchez-Madrid, F. (2017). Microtubule-
associated protein-4 controls nanovesicle dynamics and T cell activation. Journal of Cell
Science, 130(7), 1217-1223.
Cantorna, M. T., Nashold, F. E., & Hayes, C. E. (1995). Vitamin A deficiency results in a priming
environment conducive for Thl cell development. European Journal of Immunology, 25,
1673–1679.
Capo-chichi, C. D., Cai, K. Q., Smedberg, J., Azar, P. G.-A., Godwin, A. K., & Xu, X. X. (2011). Loss
of lamin A/C in breast cancer nuclear deformation and aneuploidy. Chinese Journal of Cancer,
30(6), 415–425.
Cesarini, E., Mozzetta, C., Marullo, F., Gregoretti, F., Gargiulo, A., Columbaro, M., …Lanzuolo, C.
(2015). Lamin A / C sustains PcG protein architecture , maintaining transcriptional repression
at target genes. The Journal of Cell Biology, 211(3), 533–551.
Chen, W., Jin, W., Hardegen, N., Lei, K. J., Li, L., Marinos, N., …Wahl, S. M. (2003). Conversion of
peripheral CD4+CD25- naive T cells to CD4+CD25+ regulatory T cells by TGF-beta

113 REFERENCES
induction of transcription factor Foxp3. The Journal of Experimental Medicine, 198(12):1875-
86.
Cibrián, D., & Sánchez-Madrid, F. (2017). CD69: from activation marker to metabolic gatekeeper.
European Journal of Immunology, 47(6), 946-953.
Coe, D. J., Kishore, M., & Marelli-Berg, F. (2014). Metabolic regulation of regulatory T cell
development and function. Frontiers in Immunology, 18(5), 590.
Constant, S. L., & Bottomly, K. (1997). Induction of Th1 and Th2 CD4+ T Cell Responses: The
Alternative Approaches. Annual Review of Immunology, 15, 297–322.
Coombes, J. L., Robinson, N. J., Maloy, K. J., & Powrie, F. (2005). Regulatory T cells and intestinal
homeostasis. Immunological Reviews, 204, 184–194.
Coombes, J. L., Siddiqui, K. R. R., Arancibia-, C. V, Hall, J., Sun, C., Belkaid, Y., & Powrie, F. (2007).
A functionally specialized population of mucosal CD103+ DCs induces Foxp3+ regulatory T
cells via a TGF-β- and retinoic acid- dependent mechanism. The Journal of Experimental
Medicine, 204(8), 1757–1764.
Cortés, J. R., Sánchez-Díaz, R., Bovolenta, E. R., Barreiro, O., Lasarte, S., Matesanz-Marín, A.,
…Martín, P. (2014). Maintenance of immune tolerance by Foxp3+ regulatory T cells requires
CD69 expression. Journal of Autoimmunity, 55, 51-62.
Curotto de Lafaille, M. A., Lino, A. C., Kutchukhidze, N., & Lafaille, J. J. (2004). CD25- T cells
generate CD25+Foxp3+ regulatory T cells by peripheral expansion. Journal of Immunology,
173(12), 7259-68.
Dardalhon, V., Awasthi, A., Kwon, H., Galileos, G., Gao, W., Sobel, R. A., …Alto, P. (2008).
Interleukin 4 inhibits TGF-β-induced-Foxp3+ T cells and generates, in combination with TGF-
β, Foxp3-effector T cells that produce interleukins 9 and 10. Nature Immunology, 9(12), 1347–
1355.
David, M., Hodak, E., & Lowe, N. J. (1988). Adverse effects of retinoids. Medical Toxicology and
Adverse Drug Experience, 13(4), 273-88.
Davis, S. J., & van Der Merwe, P. A. (2006). The kinetic-segregation model : TCR triggering and
beyond. Nature Immunology, 7(8), 803–809.
Dechat, T., Shimi, T., Adam, S. A., Rusinol, A. E., Andres, D. A., Spielmann, H. P., Sinensky, M. S.,
& Goldman, R. D. (2007). Alterations in mitosis and cell cycle progression caused by a mutant
lamin A known to accelerate human aging. Proc Natl Acad Sci USA., 104(12), 4955-4960.
Dechat, T., Adam, S. A., & Goldman, R. D. (2009). Nuclear lamins and chromatin : When structure

114 REFERENCES
meets function. Advances in Enzyme Regulation, 49, 157–166.
Dechat, T., Adam, S. A., Taimen, P., Shimi, T., & Goldman, R. D. (2010). Nuclear Lamins. Cold Spring
Harbor Perspectives in Biology, 2, 1–22.
Delgoffe, G. M., Kole, T. P., Zheng, Y., Zarek, P. E., Matthews, K. L., Xiao, B., …Powell, J. D. (2009).
The mTOR kinase differentially regulates effector and regulatory T cell lineage commitment.
Immunity, 30(6), 832-44.
Delves, P. J., & Roitt, I. M. (2000). The immune system. First of two parts. The New England Journal
of Medicine, 343(1), 37-49.
Denais, C. M., Gilbert, R. M., Isermann, P., Mcgregor, A. L., Lindert, M., Weigelin, B., …Lammerding,
J. (2016). Nuclear envelope rupture and repair during cancer cell migration. Cell Biology,
352(6283), 353–358.
De Souza, H. S., & Fiocchi, C. (2016). Immunopathogenesis of IBD: current state of the art. Nature
Reviews Gastroenterology & Hepatology, 13(1), 13-27.
Dhabhar, F. S. (2014). Effects of stress on immune function: the good, the bad, and the beautiful.
Immunologic Research, 58(2-3), 193-210.
Dimitrova, E., Turberfield, A. H., & Klose, R. J. (2015). Histone demethylases in chromatin biology
and beyond. EMBO Reports, 16(12), 1620-39.
Dorado, B., & Andres, V. (2017). A-type lamins and cardiovascular disease in premature aging
syndromes. Current Opinion in Cell Biology, 46(2), 17–25.
Dranoff, G. (2004). Cytokines in Cancer Pathogenesis and Cancer Theraphy. Nature Reviews Cancer,
4(1), 11–22.
Dreuillet, C., Tillit, J., Kress, M., & Ernoult-Lange, M. (2002). In vivo and in vitro interaction between
human transcription factor MOK2 and nuclear lamin A/C. Nucleic Acids Research, 30(21),
4634-42.
Duque, G., & Rivas, D. (2006). Age-related changes in lamin A/C expression in the osteoarticular
system: laminopathies as a potential new aging mechanism. Mechanisms of Ageing and
Development, 127(4), 378-383.
Elias, K. M., Laurence, A., Davidson, T. S., Stephens, G., Kanno, Y., Ethan, M., …O’Shea, J. J. (2008).
Retinoic acid inhibits Th17 polarization and enhances FoxP3 expression through a Stat-3 /
Stat-5 independent signaling pathway. Blood, 111, 1013–1020.
Espada, J., Varela, I., Flores, I., Ugalde, A. P., Cadiñanos, J., Pendás, A. M., Stewart, C. L., Tryggvason,

115 REFERENCES
K., Blasco, M. A., Freije, J. M., & López-Otín, C. (2008). Nuclear envelope defects cause stem
cell dysfunction in premature-aging mice. The Journal of Cell Biology, 181(1), 27-35.
Esterházy, D., Loschko, J., London, M., Jove, V., Oliveira, T. Y., & Mucida, D. (2016). Classical
dendritic cells are required for dietary antigen – mediated inductio n of peripheral T reg cells
and tolerance. Nature Immunology, 17, 545–557.
Faghihi, G., & Tavakoli-kia, R. (2003). Treatment of cutaneous leishmaniasis with either topical
paromomycin or intralesional meglumine antimoniate. Clinical Dermatology, 28, 13–16.
Fang, M., & Sigal, L. J. (2018). Antibodies and CD8+ T Cells Are Complementary and Essential for
Natural Resistance to a Highly Lethal Cytopathic Virus. The Journal of Immunology, 175,
6829–6836.
Freyschmidt, E., Mathias, C. B., & Macarthur, D. H. (2007). Skin inflammation in RelB -/- mice leads
to defective immunity and impaired clearance of vaccinia virus. Mechanisms of Asthma and
Allergic Inflammation, 119, 671–679.
Gardner I.D. (1980). The Effect of Aging on Susceptibility to Infection. Reviews of Infectious Diseases,
2(5), 801–810.
Germain, P., Chambon, P., Eichele, G., Evans, R. M., Lazar, M. A., Leid, M., …Gronemeyer, H.
(2006a). International Union of Pharmacology. LX. Retinoic acid receptors. Pharmacological
Reviews, 58, 712–725.
Germain, R. N. (2002). T-cell development and the CD4-CD8 lineage decision. Nature Reviews.
Immunology, 2(5), 309-22.
Gesson, K., Rescheneder, P., Skoruppa, M. P., Haeseler, A. Von, Dechat, T., & Foisner, R. (2016). A-
type lamins bind both hetero- and euchromatin , the latter being regulated by lamina-associated
polypeptide 2 alpha. Genome Research, 26, 462–473.
González-Granado, J. M., Silvestre-roig, C., Rocha-perugini, V., Cibrián, D., Morlino, G., Blanco-
berrocal, M., …Sánchez-Madrid, F. (2015). Nuclear Envelope Lamin-A Couples Actin
Dynamics with Immunological Synapse Architecture and T Cell Activation. Science
Signaling, 7(322), ra37.
González, J. M., Navarro-puche, A., Casar, B., & Crespo, P. (2008). Fast regulation of AP-1 activity
through interaction of lamin A/C, ERK1/2, and c-Fos at the nuclear envelope. The Journal of
Cell Biology, 183(4), 653–666.
Guarner, F. (2008). What is the role of the enteric commensal flora in IBD? Inflammatory Bowel
Disease, 14 (Suppl 2), S83-4.
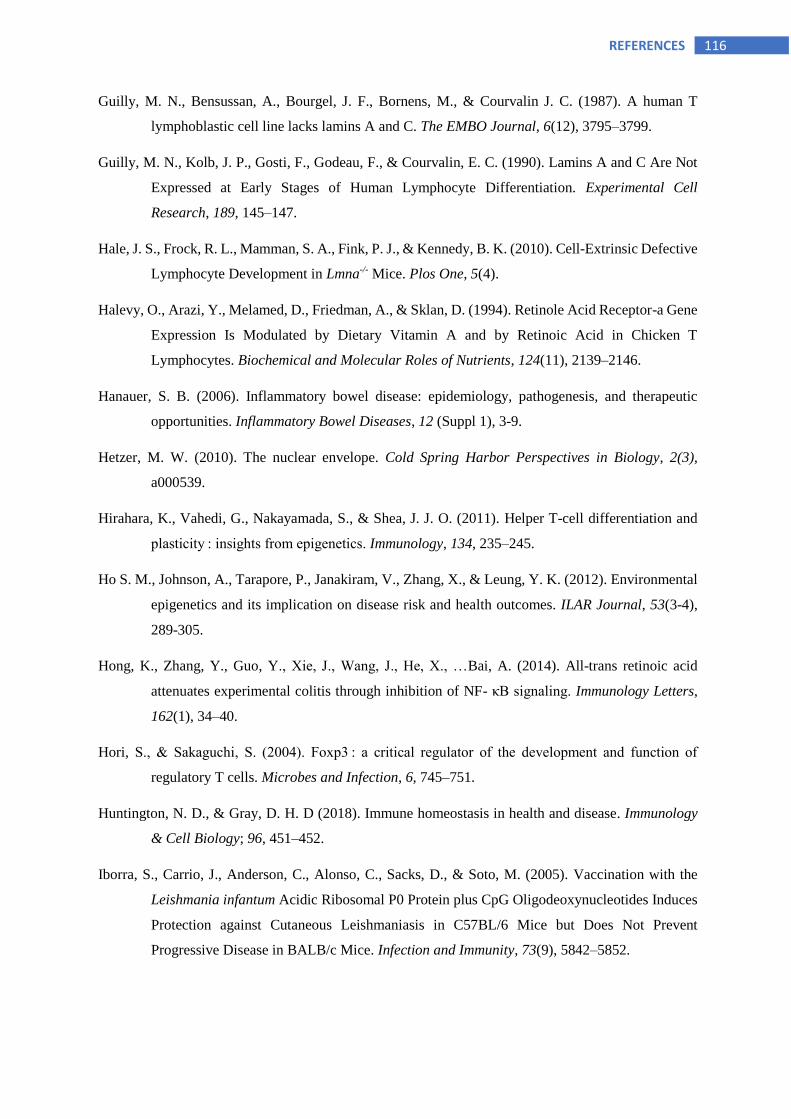
116 REFERENCES
Guilly, M. N., Bensussan, A., Bourgel, J. F., Bornens, M., & Courvalin J. C. (1987). A human T
lymphoblastic cell line lacks lamins A and C. The EMBO Journal, 6(12), 3795–3799.
Guilly, M. N., Kolb, J. P., Gosti, F., Godeau, F., & Courvalin, E. C. (1990). Lamins A and C Are Not
Expressed at Early Stages of Human Lymphocyte Differentiation. Experimental Cell
Research, 189, 145–147.
Hale, J. S., Frock, R. L., Mamman, S. A., Fink, P. J., & Kennedy, B. K. (2010). Cell-Extrinsic Defective
Lymphocyte Development in Lmna-/- Mice. Plos One, 5(4).
Halevy, O., Arazi, Y., Melamed, D., Friedman, A., & Sklan, D. (1994). Retinole Acid Receptor-a Gene
Expression Is Modulated by Dietary Vitamin A and by Retinoic Acid in Chicken T
Lymphocytes. Biochemical and Molecular Roles of Nutrients, 124(11), 2139–2146.
Hanauer, S. B. (2006). Inflammatory bowel disease: epidemiology, pathogenesis, and therapeutic
opportunities. Inflammatory Bowel Diseases, 12 (Suppl 1), 3-9.
Hetzer, M. W. (2010). The nuclear envelope. Cold Spring Harbor Perspectives in Biology, 2(3),
a000539.
Hirahara, K., Vahedi, G., Nakayamada, S., & Shea, J. J. O. (2011). Helper T-cell differentiation and
plasticity : insights from epigenetics. Immunology, 134, 235–245.
Ho S. M., Johnson, A., Tarapore, P., Janakiram, V., Zhang, X., & Leung, Y. K. (2012). Environmental
epigenetics and its implication on disease risk and health outcomes. ILAR Journal, 53(3-4),
289-305.
Hong, K., Zhang, Y., Guo, Y., Xie, J., Wang, J., He, X., …Bai, A. (2014). All-trans retinoic acid
attenuates experimental colitis through inhibition of NF- κB signaling. Immunology Letters,
162(1), 34–40.
Hori, S., & Sakaguchi, S. (2004). Foxp3 : a critical regulator of the development and function of
regulatory T cells. Microbes and Infection, 6, 745–751.
Huntington, N. D., & Gray, D. H. D (2018). Immune homeostasis in health and disease. Immunology
& Cell Biology; 96, 451–452.
Iborra, S., Carrio, J., Anderson, C., Alonso, C., Sacks, D., & Soto, M. (2005). Vaccination with the
Leishmania infantum Acidic Ribosomal P0 Protein plus CpG Oligodeoxynucleotides Induces
Protection against Cutaneous Leishmaniasis in C57BL/6 Mice but Does Not Prevent
Progressive Disease in BALB/c Mice. Infection and Immunity, 73(9), 5842–5852.
117 REFERENCES
Iborra, S., Soto, M., Stark-aroeira, L., Castellano, E., Alarco, B., Alonso, C., …Ferna, E. (2011). H-ras
and N-ras are dispensable for T-cell development and activation but critical for protective Th1
immunity. Immunobiology, 117(19), 5102–5112.
Iborra, S., Martínez-lópez, M., Khouili, S. C., Enamorado, M., Cueto, J., Conde-garrosa, R., …Sancho,
D. (2016). Optimal generation of tissue-resident but not circulating memory T cells during
viral infection requires crosspriming by DNGR-1+ dendritic cells. Immunity, 45(4), 847–860.
Ivorra, C., Kubicek, M., González, J. M., Sanz-gonzález, S. M., Álvarez-barrientos, A., Connor, J. O.,
…Andrés, V. (2006). A mechanism of AP-1 suppression through interaction of c-Fos with
lamin A/C. Genes & Development, 20, 307–320.
Iwata, M., Hirakiyama, A., Eshima, Y., Kagechika, H., Kato, C., & Song, S. (2004). Retinoic Acid
Imprints Gut-Homing Specificity on T Cells. Immunity, 21, 527–538.
Izcue, A., Coombes, J. L., & Powrie, F. (2006). Regulatory T cells suppress systemic and mucosal
immune activation to control intestinal inflammation. Immunological Reviews, 212, 256–271.
Joller, N., Lozano, E., Burkett, P. R., Patel, B., Xiao, S., Zhu, C., … Kuchroo, V. K. (2014). Treg cells
expressing the co-inhibitory molecule TIGIT selectively inhibit pro-inflammatory Th1 and
Th17 cell responses. Immunity, 40(4), 569–581.
Kang, B. Y., Chung, S. W., Kim, S. H., Kang, S. N., Choe, Y. K., & Kim, T. S. (2000). Retinoid-
mediated inhibition of interleukin-12 production in mouse macrophages suppresses Th1
cytokine profile in CD4(+) T cells. British Journal of Pharmacology, 130(3), 581-586.
Kashyap, V., Laursen, K. B., Brenet, F., Viale, A. J., Scandura, J. M., & Gudas L. J. (2013). RARγ is
essential for retinoic acid induced chromatin remodeling and transcriptional activation in
embryonic stem cells. Journal of Cell Science, 126(Pt 4), 999-1008.
Khan, K. J., Ullman, T. A., Ford, A. C., Abreu, M. T., Abadir, A., Marshall, J. K., …Moayyedi, P.
(2011). Antibiotic therapy in inflammatory bowel disease: a systematic review and meta-
analysis. Am J Gastroenterol, 106(4):661-673.
Kim, C. H. (2013). Host and microbial factors in regulation of T cells in the intestine. Frontiers in
Immunology, 4, 1–11.
Kim, D. H., & Cheon, J. H. (2017). Pathogenesis of Inflammatory Bowel Disease and Recent Advances
in Biologic Therapies. Immune Network, 17(1), 25–40.
Kisielow, P., & von Boehmer, H. (1995). Development and selection of T cells: facts and puzzles.
Advances in Immunology, 58, 87-209.
Klopcic, B., Appelbee, A., Raye, W., Lloyd, F., Jooste, J. C. I., Heather, C., …Lawrance, C. (2008).
118 REFERENCES
Indomethacin and Retinoic Acid Modify Mouse Intestinal Inflammation and Fibrosis : A Role
for SPARC. Digestive Diseases and Science, 53, 1553–1563.
Komai-Koma, M., Wang, E., Kurowska-stolarska, M., Li, D., Mcsharry, C., & Xu, D. (2016).
Interleukin-33 promoting Th1 lymphocyte differentiation dependents on IL-12.
Immunobiology, 221, 412–417.
Kondělková, K., Vokurková, D., Krejsek, J., Borská, L., Fiala, Z., & Andrýs, C. (2010). Regulatory T
cells ( TREG ) and their roles in immune system with respect to immunopathological
disorders. Acta Medica, 53(2), 73–77.
Kosiewicz, M. M., Kozaiwa, K., Cominelli, F., Kosiewicz, M. M., Nast, C. C., Krishnan, A.,
…Cominelli, F. (2001). Th1-type responses mediate spontaneous ileitis in a novel murine
model of Crohn’ s disease. The Journal of Clinical Investigation, 107(6), 695–702.
Koyanagi, M., Baguet, A., Martens, J., Margueron, R., Jenuwein, T., & Bix, M. (2005). EZH2 and
Histone 3 Trimethyl Lysine 27 Associated with Il4 and Il13 Gene Silencing in TH1 Cells. The
Journal of Biological Chemistry, 280(36), 31470–31477.
Kühl, A. A., Kakirman, H., Janotta, M., Dreher, S., Cremer, P., Pawlowski, N. N., …Hoffmann, J. C.
(2007). Aggravation of different types of experimental colitis by depletion or adhesion
blockade of neutrophils. Gastroenterology. 133(6):1882-1892.
La Cava, A. (2009). Natural Tregs and autoimmunity. Frontiers in Bioscience, 14, 333–343.
Laukens, D., Brinkman, B. M., Raes, J., De Vos, M., & Vandenabeele, P. (2016). Heterogeneity of the
gut microbiome in mice: guidelines for optimizing experimental design. FEMS Microbiology
Reviews, 40(1), 117-132.
Lebel S, Lampron C, Royal A, & R. Y. (1987). Differentiation of Mouse Embryonal Carcinoma Cells.
The Journal of Cell Biology, 105, 1099–1104.
Leung, J. M., Davenport, M., Wolff, M. J., Wiens, K. E., Abidi, W. M., Poles, M. A., …Loke, P. (2014).
IL-22-producing CD4+ cells are depleted in actively inflamed colitis tissue. Mucosal
Immunology, 7(1), 124-133.
Lee, K., Gudapati, P., Dragovic, S., Spencer, C., Joyce, S., Killeen, N., …Boothby, M. (2010).
Mammalian Target of Rapamycin Protein Complex 2 Regulates Differentiation of Th1 and
Th2 Cell Subsets via Distinct Signaling Pathways. Immunity, 32(6), 743–753.
Li, B., & Zheng, S. G. (2015). How regulatory T cells sense and adapt to inflammation. Cellular &
Molecular Immunology, 12, 519–520.
Li, Q., Zou, J., Wang, M., Ding, X., Chepelev, I., Zhou, X., …Wang, R. (2014). Critical role of histone

119 REFERENCES
demethylase Jmjd3 in the regulation of CD4+ T-cell differentiation. Nature Communications,
5, 1–15.
Liao, C. Y., Anderson, S. S., Chicoine, N. H., Mayfield, J. R., Academia, E. C., Wilson, J. A.,
…Kennedy BK2. (2016). Rapamycin Reverses Metabolic Deficits in Lamin A/C-Deficient
Mice. Cell Reports, 17(10), 2542-2552.
Lindebo Holm, T., Poulsen, S. S., Markholst, H., & Reedtz-Runge, S. (2012). Pharmacological
Evaluation of the SCID T Cell Transfer Model of Colitis: As a Model of Crohn's Disease.
International Journal of Inflammation, 2012, 412178.
Lloyd, D. J., Trembath, R. C., & Shackleton S. (2002). A novel interaction between lamin A and
SREBP1: implications for partial lipodystrophy and other laminopathies. Human Molecular
Genetics, 11(7):769-77.
Luckheeram, R. V., Zhou, R., Verma, A. D., & Xia, B. (2012). CD4+ T Cells : Differentiation and
Functions. Clinical and Developmental Immunology, 2012(925135).
Lund, E., & Collas, P. (2013). Nuclear lamins, Making contacts with promoters. Nucleus, 4(6), 424–
430.
Maidment, S. L., & Ellis, J. A. (2002). Muscular dystrophies, dilated cardiomyopathy, lipodystrophy
and neuropathy : the nuclear connection discussion of the functions of these proteins is. Expert
Reviews in Molecular Medicine in Molecular Medicine, 44, 1–21.
Maresca, G., Natoli, M., Nardella, M., Arisi, I., Trisciuoglio, D., Desideri, M., …Agnano, I. D. (2012).
LMNA Knock-Down Affects Differentiation and Progression of Human Neuroblastoma Cells.
Plos One, 7(9), 1–14.
Marko, A. J., Miller, R. A., & Kelman, A., & Frauwirth, K. A. (2010). Induction of glucose metabolism
in stimulated T lymphocytes is regulated by mitogen-activated protein kinase signaling. PLoS
One, 5(11), e15425.
Matsui M., Moriya, O., Yoshimoto, T., & Akatsuka. T. (2005). T-bet Is Required for Protection against
Vaccinia Virus Infection. Journal of Virology, 79(20), 12798–12806.
McLellan M. A., Rosenthal N. A., & Pinto, A. R. (2017). Cre-loxP-Mediated Recombination: General
Principles and Experimental Considerations. Current Protocols in Mouse Biology, 7(1), 1-12.
MacLeod, M. K., Kappler, J. W., & Marrack, P. (2010). Memory CD4 T cells: generation, reactivation
and re-assignment. Immunology, 130(1), 10-5.
Melamed, S., Paran, N., Katz, L., Ben-Nathan, D., Israely, T., Schneider, P., …Lustig, S. (2007). Tail
scarification with Vaccinia virus Lister as a model for evaluation of smallpox vaccine potency

120 REFERENCES
in mice. Vaccine, 25(45),7743-53.
Merideth, M. A., Gordon, L. B., Clauss, S., Sachdev, V., Smith, A. C., Perry, M. B., …Introne, W. J.
(2008). Phenotype and course of Hutchinson-Gilford progeria syndrome. The New England
Journal of Medicine, 358(6), 592-604.
Merkenschlager, M., & von Boehmer, H. (2010). PI3 kinase signalling blocks Foxp3 expression by
sequestering Foxo factors. The Journal of Experimental Medicine, 207(7), 1347-50.
Mizoguchi, A., Yano, A., Himuro, H., Ezaki, Y., Sadanaga, T., & Mizoguchi E. (2018). Clinical
importance of IL-22 cascade in IBD. Journal of Gastroenterology, 53(4), 465-474.
Moir, R. D., Yoon, M., Khuon, S., & Goldman, R. D. (2000). Nuclear lamins A and B1: different
pathways of assembly during nuclear envelope formation in living cells. The Journal of Cell
Biology, 151(6),1155-1168.
Monaco, C., Nanchahal, J., Taylor, P., & Feldmann, M. (2015). Anti-TNF therapy: past, present and
future. International Immunology, 27, 55-62.
Mora, J. R., Bono, M. R., & Manjunath, N. (2003). Selective imprinting of gut-homing T cells by Peyer’
s patch dendritic cells. Nature, 424, 7–12.
Morinobu, A., Kanno, Y., & Shea, J. J. O. (2004). Discrete Roles for Histone Acetylation in Human T
Helper 1 Cell-specific Gene Expression. The Journal of Biological Chemistry, 279(39),
40640–40646.
Morrissey, P. J., Charrier, K., Braddy, S., Liggitt, D., & Watson, J. D. (1993). CD4+ T Cells That
Express High Levels of CD45RB Induce Wasting Disease When Transferred into Congenic
Severe Combined Immunodeficient Mice. Disease Development Is Prevented by Cotransfer
of Purified CD4 + T Cells. Journal of Experimental Medicine, 178, 237–244.
Mota, B. E. F., Gallardo-romero, N., Trindade, G., Keckler, M. S., Karem, K., Fonseca, G., … Kroon,
E. G. (2011). Adverse Events Post Smallpox-Vaccination : Insights from Tail Scarification
Infection in Mice with Vaccinia virus. Plos One, 6(4), e18924.
Mottet, C., Uhlig, H. H., & Powrie, F. (2003). Cutting edge: cure of colitis by CD4+CD25+ regulatory
T cells. Journal of Immunology, 170(8), 3939-43.
Mougneau, E., Bihl, F., & Glaichenhaus, N. (2011). Cell biology and immunology of Leishmania.
Immunological Reviews, 240, 286–296.
Mucida, D., Park, Y., Kim, G., Turovskaya, O., Scott, I., Kronenberg, M., & Cheroutre, H. (2007).
Reciprocal TH17 and Regulatory T Cell Differentiation Mediated by Retinoic Acid. Science,
317, 4–9.

121 REFERENCES
Mucida, D., Pino-lagos, K., Kim, G., Nowak, E., Benson, M. J., Kronenberg, M., …Cheroutre, H.
(2009). Retinoic Acid Can Directly Promote TGF-β-Mediated Foxp3+ Treg Cell Conversion
of Naive T Cells. Immunity, 30(4), 471–473.
Munier, C. M. L., van Bockel, D., Bailey, M., Ip, S., Xu, Y., Alcantara, S., …Kelleher, A. D. (2016).
The primary immune response to Vaccinia virus vaccination includes cells with a distinct
cytotoxic effector CD4+ T-cell phenotype. Vaccine, 34(44), 5251–5261.
Nakayama, T., & Yamashita, M. (2010a). The TCR-mediated signaling pathways that control the
direction of helper T cell differentiation. Seminars in Immunology, 22, 303–309.
Nakayama, T., & Yamashita, M. (2010b). The TCR-mediated signaling pathways that control the
direction of helper T cell differentiation. Seminars in Immunology, 22(5), 303–309.
Neurath, M. F., Weigmann, B., Finotto, S., Glickman, J., Nieuwenhuis, E., Iijima, H., … Blumberg, R.
S. (2002). The Transcription Factor T-bet Regulates Mucosal T Cell Activation in
Experimental Colitis and Crohn’s Disease. Journal of Experimental Medicine, 195(9), 1129–
1143.
Niessner, M., & Volk, B. (1995). Altered Thl/Th2 cytokine profiles in the intestinal mucosa of patients
with inflammatory bowel disease as assessed by quantitative reversed transcribed polymerase
chain reaction (RT-PCR). Clinical and Exprimental Immunology, 101, 428–435.
Noack, M., & Miossec, P. (2014). Th17 and regulatory T cell balance in autoimmune and inflammatory
diseases. Autoimmunity Reviews, 13(6), 668–677.
Nolting, J., Daniel, C., Reuter, S., Stuelten, C., Li, P., Sucov, H., … Boehmer, H. Von. (2009). Retinoic
acid can enhance conversion of naive into regulatory T cells independently of secreted
cytokines. The Journal of Experimental Medicine, 206(10), 2131–2139.
Novais, F. O., Carvalho, L. P., Graff, J. W., Beiting, D. P., Ruthel, G., Roos, D. S., … Scott, P. (2013).
Cytotoxic T Cells Mediate Pathology and Metastasis in Cutaneous Leishmaniasis. Plos
Pathogens, 9(7), e1003504.
O’Shea, J. J., & Paul, W. E. (2010). Mechanisms underlying lineage commitment and plasticity of
helper CD4+ T cells. Science, 327(5969), 1098–1102.
Obst, R. (2015). The timing of T cell priming and cycling. Frontiers in Immunology, 6, 1–10.
Okumura, K., Nakamachi, K., Hosoe, Y., & Nakajima, N. (2000). Identification of a Novel Retinoic
Acid-Responsive Element within the Lamin A/C Promoter. Biochemical and Biophysical
Research Communications, 269, 197–202.
Okwor, I., & Uzonna, J. (2016). Social and Economic Burden of Human Leishmaniasis. American

122 REFERENCES
Journal of Tropical Medicine and Hygiene, 94(3), 489–493.
Oldenburg, A., Briand, N., Sørensen, A. L., Cahyani, I., Shah, A., Moskaug, J. Ø., & Collas, P. (2017).
A lipodystrophy-causing lamin A mutant alters conformation and epigenetic regulation of the
anti-adipogenic MIR335 locus. The Journal of Cell Biology, 216(9), 2731–2743.
Olins, A. L., Herrmann, H., Lichter, P., Kratzmeier, M., Doenecke, D., & Olins, D. E. (2001). Nuclear
Envelope and Chromatin Compositional Differences Comparing Undifferentiated and
Retinoic Acid- and Phorbol Ester-Treated HL-60 Cells. Experimental Cell Research, 268,
115–127.
Onnis, A., Finetti, F., & Baldari, C. T. (2016). Vesicular Trafficking to the Immune Synapse: How to
Assemble Receptor-Tailored Pathways from a Basic Building Set. Frontiers in Immunology,
7, 50.
Onodera, A., & Nakayama, T. (2015). Epigenetics of T cells regulated by Polycomb/Trithorax
molecules. Trends in Molecular Medicine, 21(5), 330–340.
Osterholm, M. T., Kelley, N. S., Sommer, A., & Belongia, E. A. (2012). Efficacy and effectiveness of
influenza vaccines: a systematic review and meta-analysis. The Lancet Infectious Diseases,
12(1), 36-44.
Park, J. H., Wyk, H. Van, Roxburgh, C. S. D., Horgan, P. G., Edwards, J., & Mcmillan, D. C. (2017).
Tumour invasiveness , the local and systemic environment and the basis of staging systems in
colorectal cancer. British Journal of Cancer, 116, 1444–1450.
Paulin-Levasseur, M., Scherbarth, A., Traub, U., Traub, P. (1988). Lack of lamins A and C in
mammalian hemopoietic cell lines devoid of intermediate filament proteins. European Journal
of Cell Biology, 47(1), 121-131.
Philip, J. T., & Dahl, K. N. (2008). Nuclear mechanotransduction: Response of the lamina to
extracellular stress with implications in aging. Journal of Biomechanics, 41, 3164–3170.
Pino-lagos, K., Benson, M. J., & Noelle, R. J. (2008). Retinoic Acid in the Immune System. Annals of
the New York Academy of Sciences, 1143, 1–19.
Podolsky, D. K. (1991). Inflammatory bowel disease (1). The New England Journal of Medicine,
325(13), 928-37
Powrie, F., Leach, M. W., Mauze, S., Caddie, L. B., & Coffman, R. L. (1993). Phenotypically distinct
subsets of CD4+ T cells induce or protect from chronic intestinal inflammation in C . B-17 scid
mice. International Immunology, 5(11), 1461–1471.
Prezioso, C., & Orlando, V. (2011). Polycomb proteins in mammalian cell differentiation and plasticity.

123 REFERENCES
FEBS Letters, 585(13), 2067-2077.
Qui, H. Z., Hagymasi, A. T., Bandyopadhyay, S., Rose, M. C., Ramanarasimhaiah, A. M. R., Mittler,R.
S., …Adler, A. J. (2011). CD134 Plus CD137 Dual Costimulation Induces Eomesodermin in
CD4+ T Cells to Program Cytotoxic Th1 Differentiation. Journal of Immunology, 187(7),
3555–3564.
Ramos, F. J., Chen, S. C., Garelick, M. G., Dai, D. F., Liao, C. Y., Schreiber, K. H., …Kennedy BK.
(2012). Rapamycin reverses elevated mTORC1 signaling in lamin A/C-deficient mice, rescues
cardiac and skeletal muscle function, and extends survival. Science Translational Medicine,
4(144), 144ra103.
Rauner, M., Sipos, W., Goettsch, C., Wutzl, A., Foisner, R., Pietschmann, P., & Hofbauer, L. C. (2009).
Inhibition of lamin A/C attenuates osteoblast differentiation and enhances RANKL-dependent
osteoclastogenesis. Journal of Bone and Mineral Research, 24(1), 78-86.
Read, S., Greenwald, R., Izcue, A., Robinson, N., Mandelbrot, D., Francisco, L., …Powrie F. (2006).
Blockade of CTLA-4 on CD4+CD25+ regulatory T cells abrogates their function in vivo.
Journal of Immunology, 177(7),4376-4383.
Reinhard, O. (2015). The Timing of T Cell Priming and Cycling. Frontiers in Immunology, 6, 563.
Reithinger, R., Dujardin, J. C., Louzir, H., Pirmez, C., Alexander, B., Brooker, S., … Leopold, P.
(2007). Cutaneous leishmaniasis. The Lancet Infectious Diseases, 7(9), 581–596.
Röber, R., Sauter, H., Weber, K., & Osborn, M. (1990). Cells of the cellular immune and hemopoietic
system of the mouse lack lamins A/C : distinction versus other somatic cells. Journal of Cell
Science, 95, 587–598.
Röber, R. A., Weber, K., & Osborn, M. (1989). Differential timing of nuclear lamin A/C expression in
the various organs of the mouse embryo and the young animal: a developmental study.
Development, 105(2), 365-78.
Rocha-Perugini, V., & González-Granado, J. M. (2014). Nuclear envelope lamin-A as a coordinator of
T cell activation. Nucleus, 5(5), 396–401. European Journal of Immunology, 44(7), 1967-
1975.
Rocha-Perugini, V., González-Granado, J. M., Tejera, E., López-Martín, S., Yañez-Mó, M., & Sánchez-
Madrid, F. (2014). Tetraspanins CD9 and CD151 at the immune synapse support T-cell
integrin signaling. European Journal of Immunology 44(7), 1967-1975.
Rocha-Perugini, V., Martínez Del Hoyo, G., González-Granado, J. M., Ramírez-Huesca, M., Zorita,
V., Rubinstein, E., …Sánchez-Madrid, F. (2017). CD9 Regulates Major Histocompatibility
124 REFERENCES
Complex Class II Trafficking in Monocyte-Derived Dendritic Cells. Molecular and Cellular
Biology, 37(15).
Romagnani, S. (1997). The Th1/Th2 paradigm. Immunology Today, 18(6), 263-6.
Ronchetti, S., Ricci, E., Petrillo, M. G., Cari, L., Migliorati, G., Nocentini, G., & Riccardi, C. (2015).
Glucocorticoid-induced tumour necrosis factor receptor-related protein: a key marker of
functional regulatory T cells. Journal of Immunology Research, 2015, 171520.
Ross, A. C. (2012). Vitamin A and retinoic acid in T cell-related immunity. The American Journal of
clinical nutrition, 96(5), 1166S-1172.
Ryuta, M., Anand, B., Lee, Y. K., Whitley, S. K., Weaver, B. T., Shibata, Y., …Weaver, C. T. (2011).
Epigenetic Instability of Cytokine and Transcription Factor Gene Loci Underlies Plasticity of
the T helper 17 Cell Lineage. Immunity, 32(5), 616–627.
Sacks, D., & Noben-trauth, N. (2002). The immunology of susceptibility and resistance to Leishmania
major in mice. Nature Reviews Immunology, 2, 845–858.
Sartor, R. B. (2008). Microbial influences in inflammatory bowel diseases. Gastroenterology, 134(2),
577-594.
Schambach, F., Schupp, M., Lazar, M. A., & Reiner, S. L. (2007). Activation of retinoic acid receptor-
a favours regulatory T cell induction at the expense of IL-17-secreting T helper cell
differentiation. European Journal of Immunology, 37, 2396–2399.
Schirmer, E. C., & Foisner, R. (2007). Proteins that associate with lamins : Many faces, many functions.
Experimental Cell Research, 313, 2167–2179.
Schmidt, A., Oberle, N., & Krammer, P. H. (2012). Molecular mechanisms of treg-mediated T cell
suppression. Frontiers in Immunology, 3, 51.
Schreiber, S., Heinig, T., Thiele, H., & Raedler A. (1995). Immunoregulatory role of interleukin 10 in
patients with inflammatory bowel disease. Gastroenterology, 108, 5, 1434–1444.
Scott, P., Natovitz, P., Coffman, R. L., Pearce, E., & Sher, A. (1988). Immunoregulation of Cutaneous
Leishmaniasis. T Cell Lines that Transfer Protective Immunity or Exacerbation Belong to
Different T Helper Subsets and Respond to Distinct Parasite. Journal of Experimental
Medicine, 168, 1675–1684.
Scott, P., & Novais, F. O. (2016). Cutaneous leishmaniasis : immune responses in protection and
pathogenesis. Nature Reviews Immunology, 16, 581–592.
Segerstrom, S. C., & Miller, G. E. (2004). Psychological stress and the human immune system: a meta-

125 REFERENCES
analytic study of 30 years of inquiry. Psychological Bulletin, 130(4), 601-630.
Sen, D., Forrest, L., Kepler, T. B., Parker, I., & Cahalan, M. D. (2010). Selective and site-specific
mobilization of dermal dendritic cells and Langerhans cells by Th1- and Th2-polarizing
adjuvants. PNAS, 107(18), 8334–8339.
Sharon, M., Nir, P., Lior, K., David, B., Tomer, I., Paula, S., …Shlomo, L. (2007). Tail scarification
with Vaccinia virus Lister as a model for evaluation of smallpox vaccine potency in mice.
Vaccine, 25, 7743–7753.
Sokol, C. L., Barton, G. M., Farr, A. G., & Medzhitov, R. (2008). A Mechanism for the Initiation of
the Th2 Response by an Allergen. Nature Immunology, 9(3), 310–318.
Spilianakis, C. G., Lee, G. R., & Flavell, R. A. (2005). Twisting the Th1/Th2 immune response via the
retinoid X receptor : Lessons from a genetic approach. European Journal of Immunology, 35,
3400–3404.
Stadelmann, B., Khandjian, E., Hirt, A., Loth, A., Well, R., & Wagner, H. P. (1990). Repression of
nuclear lamin A and C gene expression in human acute lymphoblastic leukemia and non-
Hodgkin's lymphoma cells. Leukemia Research, 14(9), 815–821.
Stebut, E. Von, & Udey, M. C. (2004). Requirements for Th1-dependent immunity against infection
with Leishmania major. Microbes and Infection, 6, 1102–1109.
Stephensen, C. B. (2001). Vitamin A, infection, and immune function. Annual Review of Nutrition, 21,
167-192.
Stidham, R. W., & Higgins, P. D. R. (2018). Colorectal Cancer in Inflammatory Bowel Disease. Clinics
in Colon and Rectal Surgery, 31(3), 168–178.
Sugimoto, K., Ogawa, A., Mizoguchi, E., Shimomura, Y., Andoh, A., Bhan, A. K., …Mizoguchi
A.(2008). IL-22 ameliorates intestinal inflammation in a mouse model of ulcerative colitis.
The Journal of Clinical Investigation, 118(2), 534-544.
Sun, C., Hall, J. A., Blank, R. B., Bouladoux, N., Oukka, M., Mora, J. R., & Belkaid, Y. (2007). Small
intestine lamina propria dendritic cells promote de novo generation of Foxp3 T reg cells via
retinoic acid. The Journal of Experimental Medicine, 204(8), 1775–1785. Swain, S. L.,
Mckinstry, K. K., & Strutt, T. M. (2012). Expanding roles for CD4+ T cells in immunity to
viruses. Nature Reviews Immunology, 12(2), 136–148.
Swift, J., Ivanovska, I. L., Buxboim, A., Harada, T., Dave, P. C. P., Pinter, J., …Discher, D. E. (2014).
Nuclear Lamin-A Scales with Tissue Stiffness and Enhances Matrix-Directed Differentiation.
Science, 341(6149), 1–33.

126 REFERENCES
Szabo, S. J., Kim, S. T., Costa, G. L., Zhang, X., Fathman, C. G., Glimcher, L. H., & Carolina, S.
(2000). A Novel Transcription Factor , T-bet , Directs Th1 Lineage Commitment. Cell, 100,
55–669.
Szkaradkiewicz, A., Marciniak, R., Chudzicka-Strugała, I., Wasilewska, A., Drews, M., Majewski, P.,
…Zwoździak, B. (2009). Proinflammatory cytokines and IL-10 in inflammatory bowel disease
and colorectal cancer patients. Arch Immunol Ther Exp (Warsz), 57(4):291-294.
Takahashi, T., Tagami, T., Yamazaki, S., Uede, T., Shimizu, J., Sakaguchi, N., …Sakaguchi, S.
(Immunologic self-tolerance maintained by CD25(+)CD4(+) regulatory T cells constitutively
expressing cytotoxic T lymphocyte-associated antigen 4. The Journal of Experimental
Medicine, 192(2), 303-310.
Tang, Q., Henriksen, K. J., Bi, M., Finger, E. B., Szot, G., Ye, J., …Bluestone JA. (2004). In vitro-
expanded antigen-specific regulatory T cells suppress autoimmune diabetes. The Journal of
Experimental Medicine, 199(11),1455-1465.
Tian, T., Liu, L., Freyschmidt, E., Murphy, G. F., Kupper, T. S., & Fuhlbrigge, R. C. (2009).
Overexpression of IL-1a in Skin Differentially Modulates the Immune Response to
Scarification with Vaccinia Virus. Journal of Investigative Dermatology, 129(1), 70–78.
Tilgner, K., Wojciechowicz, K., Jahoda, C., Hutchison, C., & Markiewicz, E. (2009). Dynamic
complexes of A-type lamins and emerin influence adipogenic capacity of the cell via
nucleocytoplasmic distribution of β -catenin. Journal of Cell Science, 122(3), 401–413.
Tilli, C., Ramaekers, F., Broers, J., Hutchison, C., & Neumann, H. A. M. (2003). Lamin expression in
normal human skin , actinic keratosis , squamous cell carcinoma and basal cell carcinoma.
British Journal of Dermatology, 148, 102–109.
Topalian, S. L., Hodi, F. S. , Brahmer, J. R., Gettinger, S. N., Smith, D. C., McDermott, D. F., …Sznol,
M. (2012). Safety, activity, and immune correlates of anti-PD-1 antibody in cancer. The New
England Journal of Medicine, 366(26), 2443-2454.
Torralba, D., Baixauli, F., Villarroya-Beltri, C., Fernández-Delgado, I., Latorre-Pellicer, A., Acín-Pérez
R., …Sánchez-Madrid, F. (2018). Priming of dendritic cells by DNA-containing extracellular
vesicles from activated T cells through antigen-driven contacts. Nature Communications, 9(1),
2658.
Ueno, A., Jeffery, L., Kobayashi, T., Hibi, T., Ghosh, S., & Jijon, H. (2018). Th17 plasticity and its
relevance to inflammatory bowel disease. Journal of Autoimmunity, 87, 38-49.
Uhlig, H. H., Coombes, J., Mottet, C., Thompson, C., Fanger, A., Tannapfel, A., …Powrie, F. (2006).
Characterization of Foxp3+ CD4+ CD25+ and IL-10-Secreting CD4+ CD25+ T Cells during

127 REFERENCES
Cure of Colitis. The Journal of Immunology, 177, 5852–5860.
Urvalek, A. M., & Gudas, L. J. (2014). Retinoic acid and histone deacetylases regulate epigenetic
changes in embryonic stem cells. The Journal of Biological Chemistry, 289(28), 19519-19530.
Uzonna, J. E., Joyce, K. L., & Scott, P. (2004). Low Dose Leishmania major Promotes a Transient T
Helper Cell Type 2 Response That Is Down-regulated by Interferon – producing CD8+ T Cells.
The Journal of Experimental Medicine, 199(11), 1559–1566.
Van Berlo, J. H., Voncken, J. W., Kubben, N., Broers, J. L. V, Duisters, R., van Leeuwen, R. E. W.,
…Pinto, Y. M. (2005). A-type lamins are essential for TGF-β1 induced PP2A to
dephosphorylate transcription factors. Human Molecular Genetics, 14(19), 2839–2849.
van Panhuys, N. (2016). TCR Signal Strength Alters T–DC Activation and Interaction Times and
Directs the Outcome of Differentiation. Frontiers in Immunology, 7, 1–14.
van Panhuys, N. Van, Klauschen, F., & Germain, R. N. (2014). Article T-Cell-Receptor-Dependent
Signal Intensity Dominantly Controls CD4+ T Cell Polarization In Vivo. Immunity, 41(1), 63–
74.
Van Parijs, L., Refaeli, Y., Lord, J. D., Nelson, B. H., Abbas, A. K., & Baltimore, D. (2009). Retraction.
Uncoupling IL-2 signals that regulate T cell proliferation, survival, and Fas-mediated
activation-induced cell death. Immunity, 30(4), 611.
van Steensel B & Belmont AS. (2017). Review Lamina-Associated Domains : Links with
Chromosome. Cell, 169(5), 780–791.
Vanhove, W., Nys, K., & Vermeire, S. (2016). Therapeutic Innovations in Inflammatory Bowel
Diseases. Clinical Pharmacology & Therapeutics, 99(1), 49–58.
Venables, R. S., McLean, S., Luny, D., Moteleb, E., Morley, S., Quinlan, R. A., Lane, E. B., &
Hutchison, C. J. (2001). Expression of individual lamins in basal cell carcinomas of the skin.
British Journal of Cancer, 84(4), 512-9.
Walker L. S. K. (2004). CD4+ CD25+ Treg: divide and rule? Immunology, 111(2), 129–137.
Wang, Y., Wu, R., Cho, K. R., Thomas, D. G., Gossner, G., Liu, R., …David, M. (2009). Differential
Protein Mapping of Ovarian Serous Adenocarcinomas: Identification of Potential Markers for
Distinct Tumor Stage. Journal of Proteome Research, 8(3), 1452–1463.
Ward-Hartstonge, K. A., & Kemp, R. A. (2017). Regulatory T-cell heterogeneity and the cancer
immune response.Clinical & Translational Immunology, 6(9), e154
Wei, G., Wei, L., Zhu, J., Zang, C., Hu-li, J., Yao, Z., …Zhao, K. (2009). Global Mapping of H3K4me3

128 REFERENCES
and H3K27me3 Reveals Specificity and Plasticity in Lineage Fate Determination of
Differentiating CD4+ T Cells. Immunity, 30(1), 155–167.
Willis, N. D., Cox, T. R., Rahman-Casañs, S. F., Przyborski, S. A., Brandt, P. van den, Engeland, M.
van, …Hutchison1, C. J. (2008). Lamin A/C Is a Risk Biomarker in Colorectal Cancer. Plos
One, 3(8), e2988.
Worman, H. J. (2012). Nuclear lamins and laminopathies. Journal of Pathology, 226, 316–325.
Worman, H. J., & Bonne, G. (2007). “Laminopathies:” a wide spectrum of human diseases.
Experimental Cell Research, 313(10), 2121–2133.
Worthington, M. (2003). Clinical Infectious Diseases. Clinical Infectious Diseases, 37, 864–865.
Xiao, S., Jin, H., Korn, T., Liu, S. M., Oukka, M., Lim, B., & Kuchroo, V. K. (2008). Retinoic acid
increases Foxp3+ regulatory T cells and inhibits development of Th17 cells by enhancing TGF-
beta-driven Smad3 signaling and inhibiting IL-6 and IL-23 receptor expression. Journal of
Immunology, 181(4), 2277-2284.
Xin, L., Jiang T. T., Kinder, J. M., Ertelt, J. M., & Way, S. S. (2015). Infection susceptibility and
immune senescence with advancing age replicated in accelerated aging LmnaDhe mice. Aging
Cell, 14, 1122–1126.
Xu, R., Johnson, A. J., Liggitt, D., & Bevan, M. J. (2004). Cellular and Humoral Immunity against
Vaccinia Virus Infection of Mice. The Journal of Immunology, 172, 6265–6271.
Young, C. E., Boyle, F. M., & Mutch, A. J. (2016). Are care plans suitable for the management of
multiple conditions? Journal of Comorbidity, 6(2), 103–113.
Zheng, B., Sage, M., Sheppeard, E. A., Jurecic, V., & Bradley, A. (2000). Engineering mouse
chromosomes with Cre-loxP: range, efficiency, and somatic applications. Molecular and
cellular biology, 20(2), 648-55.
Zheng, Y., Josefowicz, S., Chaudhry, A., Peng, X. P., & Rudensky, A. Y. (2010). Role of conserved
non-coding DNA elements in the Foxp3 gene in regulatory T-cell fate. 463(7282), 808–812.
Zhu, J., Yamane, H., & Paul, W. E. (2012). Differentiation of Effector CD4+ T Cell Populations. Annual
Review of Immunology, 28, 445–489.
Zhu, L., Shi, T., Zhong, C., Wang, Y., Chang, M., & Liu, X. (2017). IL-10 and IL-10 Receptor
Mutations in Very Early Onset Inflammatory Bowel Disease. Gastroenterology Research,
10(2), 65-69.
Zou, C., & Mallampalli, R. K. (2014). Regulation of histone modifying enzymes by the ubiquitin-

129 REFERENCES
proteasome system. Biochimica et Biophysica Acta, 1843(4):694-702.
9.2. Books.
Oldenburg, A. R., & Collas, P. (2016). Mapping Nuclear Lamin-Genome Interactions by Chromatin
Immunoprecipitation of Nuclear Lamins. Methods in Molecular Biology, 1411, 315–324.
Shevach, E. M. (2011). Biological Functions of Regulatory T Cells. Advances in Immunology, 112,
137-176.
9.3. Web pages.
https://www.hycultbiotech.com/
https://www.ey.com/Publication/vwLUAssets/EY-informe-enfermedad-inflamatoria
intestinal/$FILE/EY-enfermedad-inflamatoria-intestinal-situacion-actual-y-retos-asistenciales.pdf


Annexes

ANNEXES 133
10. ANNEXES.
Publications derived from this Thesis:
Toribio-Fernández, R., Zorita, V., Rocha-perugini, V., Iborra, S., Martínez, G., Chevre, R.,
…González-Granado, J. M. (2018). Lamin A / C augments Th1 differentiation and response
against vaccinia virus and Leishmania major. Cell Death and Disease, 9(9), 1–15.
Toribio-Fernandez, R., Zorita, V., Herrero-Fernandez, B., & Gonzalez-Granado, J. M. (2018). An In
Vivo Mouse Model to Measure Naïve CD4 T Cell Activation, Proliferation and Th1
Differentiation Induced by Bone Marrow-derived Dendritic Cells. Journal of Visualized
Experiments.

Toribio-Fernández et al. Cell Death and Disease (2018) 9:9 DOI 10.1038/s41419-017-0007-6 Cell Death & Disease
ART ICLE Open Ac ce s s
Lamin A/C augments Th1 differentiationand response against vaccinia virus andLeishmania majorRaquel Toribio-Fernández1, Virginia Zorita1, Vera Rocha-Perugini1,2, Salvador Iborra1, Gloria Martínez del Hoyo1,Raphael Chevre1, Beatriz Dorado1, David Sancho1, Francisco Sanchez-Madrid1,2,3, Vicente Andrés1,3 andJose-Maria Gonzalez-Granado1,3,4
AbstractDifferentiation of naive CD4+ T-cells into functionally distinct T helper (Th) subsets is critical to immunity againstpathogen infection. Little is known about the role of signals emanating from the nuclear envelope for T-celldifferentiation. The nuclear envelope protein lamin A/C is induced in naive CD4+ T-cells upon antigen recognition andacts as a link between the nucleus and the plasma membrane during T-cell activation. Here we demonstrate that theabsence of lamin A/C in naive T-cell reduces Th1 differentiation without affecting Th2 differentiation in vitro andin vivo. Moreover, Rag1−/− mice reconstituted with Lmna−/−CD4+CD25− T-cells and infected with vaccinia virus showweaker Th1 responses and viral removal than mice reconstituted with wild-type T-cells. Th1 responses and pathogenclearance upon Leishmania major infection were similarly diminished in mice lacking lamin A/C in the completeimmune system or selectively in T-cells. Lamin A/C mediates Th1 polarization by a mechanism involving T-bet andIFNγ production. Our results reveal a novel role for lamin A/C as key regulator of Th1 differentiation in response to viraland intracellular parasite infections.
IntroductionThe nuclear envelope is composed of nuclear pore
complexes, the outer and inner nuclear membranes, andthe nuclear lamina. The nuclear lamina is a filamentousprotein layer mainly composed of A- and B-type laminsand provide mechanical stability to the inner nuclearmembrane, regulating nucleus positioning, chromatinstructure, nuclear pore complex organization, nuclearenvelope breakdown and reassembly during mitosis, DNAreplication, DNA damage responses, cell-cycle progres-sion, cell differentiation, cell polarization during cellmigration, and transcription1,2. We have previouslyshown that lamin A expression is triggered in naive T-
cells upon antigen recognition and enhances T-cell acti-vation by coupling actin dynamics and immunologicalsynapse formation3.T-cells orchestrate the protection against microbial
pathogens4. In peripheral lymphoid organs, antigen-presenting cells (APCs) stimulate cognate CD4+ T-cells,which proliferate and undergo differentiation into distinctspecialized effector T helper (Th) cells that are essentialfor the development of adaptive immune responses5.Tight control of naive T-cell differentiation is crucial foreliciting an appropriate host defense, triggering immune-mediated inflammation without deleterious tissuedamage. Th subsets are defined by the differentialexpression of surface markers, transcription factors, andeffector cytokines and play essential and distinct roles inmediating or directing the nature of the response topathogens, commensals, and vaccines. T-cell differentia-tion in diverse Th subsets depends on the type of antigenencountered, the TCR signal intensity, and the local
© The Author(s) 2018OpenAccessThis article is licensedunder aCreativeCommonsAttribution 4.0 International License,whichpermits use, sharing, adaptation, distribution and reproductionin any medium or format, as long as you give appropriate credit to the original author(s) and the source, provide a link to the Creative Commons license, and indicate if
changesweremade. The images or other third partymaterial in this article are included in the article’s Creative Commons license, unless indicated otherwise in a credit line to thematerial. Ifmaterial is not included in the article’s Creative Commons license and your intended use is not permitted by statutory regulation or exceeds the permitted use, you will need to obtainpermission directly from the copyright holder. To view a copy of this license, visit http://creativecommons.org/licenses/by/4.0/.
Correspondence: J-M. Gonzalez-Granado ([email protected])1Centro Nacional de Investigaciones Cardiovasculares Carlos III (CNIC), Madrid,Spain2Servicio de Inmunología, Hospital de la Princesa, Instituto de InvestigaciónSanitaria La Princesa (IIS Princesa), Madrid, SpainFull list of author information is available at the end of the article
Official journal of the Cell Death Differentiation Association
1234
5678
9012
3456
7890
cytokine milieu4,6–8. Indeed, Th1 differentiation, which isrequired for host defense against intracellular pathogens,involves interferon-γ (IFNγ) production in an interleukin(IL)-2-dependent manner by the transcription factor T-bet6. Th2 differentiation is triggered by extracellularpathogens or allergens through the induction of GATA-3and the activation of IL-4-dependent signal transducerand activator of transcription factor 6 (Stat-6)9. Signalsemanating from the nuclear interior may also conditionnaive T-cell polarization. Here we show that lamin A/Cexpression augments CD4+ T-cell Th1 differentiation inresponse to pathogen infection by regulating T-bet tran-scription factor expression and IFNγ production.
ResultsLamin A/C regulates Th1 differentiationTo analyze the role of A-type lamins in antigen-
dependent T-cell differentiation, Lmna−/− and wild-type(WT) mice were back-crossed with OTII mice, whichexpress a TCR (T-cell receptor) specific for ovalbumin(OVA) peptide. Naive CD4+ T-cells were isolated fromLmna−/−/OTII or WT/OTII mice and co-cultured withOVA-loaded WT APCs in the absence of polarizingcytokines. Compared with WT CD4+ T-cells, fewerLmna−/− CD4+ T-cells were IFNγ+, indicating theimportance of lamin A/C for antigen-dependent Th1differentiation (Fig. 1a). This difference was not abolishedby addition of IL-2 (Fig. 1b). We next directed Th1 or Th2differentiation in vitro by incubating WT and Lmna−/−
CD4+ T-cells with anti-CD3 and anti-CD28 antibodiesand Th1 or Th2 polarizing cytokines. Interestingly,Lmna−/− CD4+ T-cells produced fewer Th1 cells thanWT cells but similar numbers of Th2 cells (Fig. 1c). Th1differentiation triggered by co-culture with OVA-loadedWT APCs in the presence of Th1 polarizing cytokines wasalso lower in CD4+ T-cells from Lmna−/−/OTII micethan in WT/OTII T-cells (Fig. 1d). These experimentssuggest that lamin A/C is an important intrinsic regulatorof T-cell differentiation following TCR stimulation.
Lamin A/C enhances Th1 responses in vivoIt has been previously shown that intrinsic lamin A/C
does not affect T-cell development10. Moreover, we didnot observe any role for lamin A/C in very early T-cellactivation. Indeed, TCR stimulation triggered similar levelsof extracellular signal–regulated kinase 1/2 (ERK1/2)phosphorylation in WT and Lmna−/− CD4 T-cells (Fig-ure S1a, day 0), indicating that lamin A/C is not involvedin T-cell development and early TCR activation. We havepreviously shown that lamin A/C is transiently expressedin CD4+ T-cells upon antigen recognition3. Confirmingour previous observation, levels of pERK1/2 wereincreased in WT lamin A/C-expressing cells but not inLmna−/− CD4 T-cells after a second TCR stimulation,
when lamin A/C is already expressed in WT CD4 T-cells(ref. 3; and Figure S1b), (Figure S1a, day 1).To investigate the role of lamin A/C in Th1 differ-
entiation in vivo, mice were infected with vaccinia virus(VACV), which provokes a robust Th1 immune responsein mice11,12. VACV infection induces transient expressionof lamin A/C, peaking at 1 day after infection in draininglymph nodes (Figure S2). At 3 days after intraperitonealVACV infection, the frequency of IFNγ+CD4+ T-cells inmesenteric lymph nodes and peritoneal exudate waslower in Lmna−/− mice than in WT mice (Fig. 2a, b). Tostudy the role of lamin A/C specifically in the immunesystem, we reconstituted lethally irradiated WT CD45.1mice with WT or Lmna−/− CD45.2 bone marrow for2 months. Confirmation of bone marrow reconstitutionwith anti CD45.1 and CD45.2 antibodies revealed nosignificant differences between genotypes. After intra-peritoneal infection with VACV, we analyzed the fre-quency of IFNγ+ and IL-4+ in CD4+ T-cells. Lmna−/
−-reconstituted mice had proportionately fewer IFNγ+ T-cells, and similar numbers of IL4+ T-cells with respect toWT-reconstituted mice, in both spleen and peritonealexudate (Fig. 2c). To trigger antigen-specific Th1responses in vivo, we reconstituted WT mice with eitherWT/OTII or Lmna−/−/OTII bone marrow and theninfected the mice intraperitoneally with VACV-OVA. Asbefore, the Lmna−/−/OTII-reconstituted CD4+ popula-tion included a lower proportion of IFNγ+ cells than didWT/OTII-derived CD4+ cells (Fig. 2d). Moreover,reconstitution with a mix of bone marrow fromWT/OTIIand Lmna−/−/OTII mice produced a lower percentage ofIFNγ+CD4+ T-cells in Lmna−/−/OTII than in WT/OTIIcells (Fig. 2e). Our results indicate that lamin A/Cdepletion in the hematopoietic compartment impairs Th1differentiation in vitro and in vivo. To directly assess theimportance for Th1 differentiation of lamin A/C in CD4+
T-cells, we adoptively transferred WT mice with CD4+ T-cells from WT/OTII or Lmna−/−/OTII mice. Th1 dif-ferentiation from Lmna−/− CD4+ T-cells was weakerthan from their WT counterparts, producing a lowerpercentage of IFNγ+CD4+ T-cells (Fig. 3a). Similar resultswere obtained when WT recipient mice were transferredwith a mix of WT/OTII and Lmna−/−/OTII CD4+ T-cellsfollowed by VACV-OVA inoculation, either intraper-itoneally (Fig. 3b) or subcutaneously in the footpad(Fig. 3c). These results indicate that lamin A/C expressionspecifically regulates CD4+ T-cell differentiation towardTh1 cells in vivo.We next investigated whether the action of lamin A/C
in CD4+ T-cell polarization was related to antigen pre-sentation by dendritic cells (DC). WT mice receivedsubcutaneous injections of lipopolysaccharide (LPS)-matured OVA-loaded bone marrow-derived DCs(BMDCs), which trigger Th1 differentiation13, and 18 h
Toribio-Fernández et al. Cell Death and Disease (2018) 9:9 Page 2 of 15
Official journal of the Cell Death Differentiation Association

later received intravenous injections of WT/OTII orLmna−/−/OTII CD4+ T-cells. After 7 days, Th1 differ-entiation of adoptively transferred T-cells was analyzed indraining lymph nodes. Lmna−/−/OTII CD4+ T-cellsproduced fewer IFNγ+CD4+ T-cells in the presence ofLPS-treated BMDCs than WT/OTII cells (Fig. 3d). Inother experiments, WT mice received subcutaneousinjections of splenic CD11c+ DCs incubated 4 h in med-ium containing LPS or papain to potentiate antigen-dependent T-cell differentiation to Th1 or Th2, res-pectively13,14. As before, 18 h later the mice receivedintravenous injections of WT/OTII or Lmna−/−/OTIICD4+ T-cells, and Th1 and Th2 differentiation was ana-lyzed in draining lymph nodes after 7 days. Lmna−/−
CD4+ T-cells produced fewer IFNγ+CD4+ T-cells in the
presence of LPS-treated BMDCs than their WT coun-terparts; in contrast, in the presence of papain-treatedBMDCs the proportion of IL4+ cells was similar in WTand Lmna−/− CD4+ T-cells (Fig. 3e). These results indi-cate that lamin A/C expression specifically regulatesCD4+ T-cell differentiation toward Th1 cells in vivo.
Lamin A/C enhances T-cell activation but is not essentialfor T-cell proliferationReduced Th1 cell polarization from Lmna−/− CD4+ T-
cells could be due to impaired T-cell activation, which isenhanced by lamin A in vitro3. We therefore analyzedCD4+ T-cell activation in response to VACV infection inthe absence of lamin A/C expression. A 1:1 mix of naiveCD4+ T-cells from Lmna−/−/OTII and WT/OTII mice
Fig. 1 Impaired in vitro Th1 differentiation of CD4+ T-cells from Lmna−/− mice. Percentage of IFNγ+ and IL4+ CD4+ T-cells isolated from WT orLmna−/− mice. a CD4+ T-cells from WT/OTII or Lmna−/−/OTII mice were cocultured with OVA-loaded WT APCs for 4 days. Data are means±SEM of atleast three independent experiments analyzed by unpaired Student’s t-test. b CD4+ T-cells were stimulated with anti-CD3/CD28 antibodies for 4 daysin the presence of IL-2. Data are means±SEM of at least five independent experiments analyzed by unpaired Student’s t-test. c CD4+ T-cells werestimulated with anti-CD3/CD28 antibodies for 4 days in the presence of cytokines and antibodies to trigger Th1 or Th2 differentiation in vitro. Dataare means±SEM of at least four independent experiments analyzed by unpaired Student’s t-test. d CD4+ T-cells from WT/OTII or Lmna−/−/OTII micewere cocultured with OVA-loaded WT APCs for 4 days in the presence of cytokines and antibodies to trigger Th1 differentiation. Data are means±SEMof three independent experiments analyzed by unpaired Student’s t-test. **P < 0.01; ***P < 0.001
Toribio-Fernández et al. Cell Death and Disease (2018) 9:9 Page 3 of 15
Official journal of the Cell Death Differentiation Association
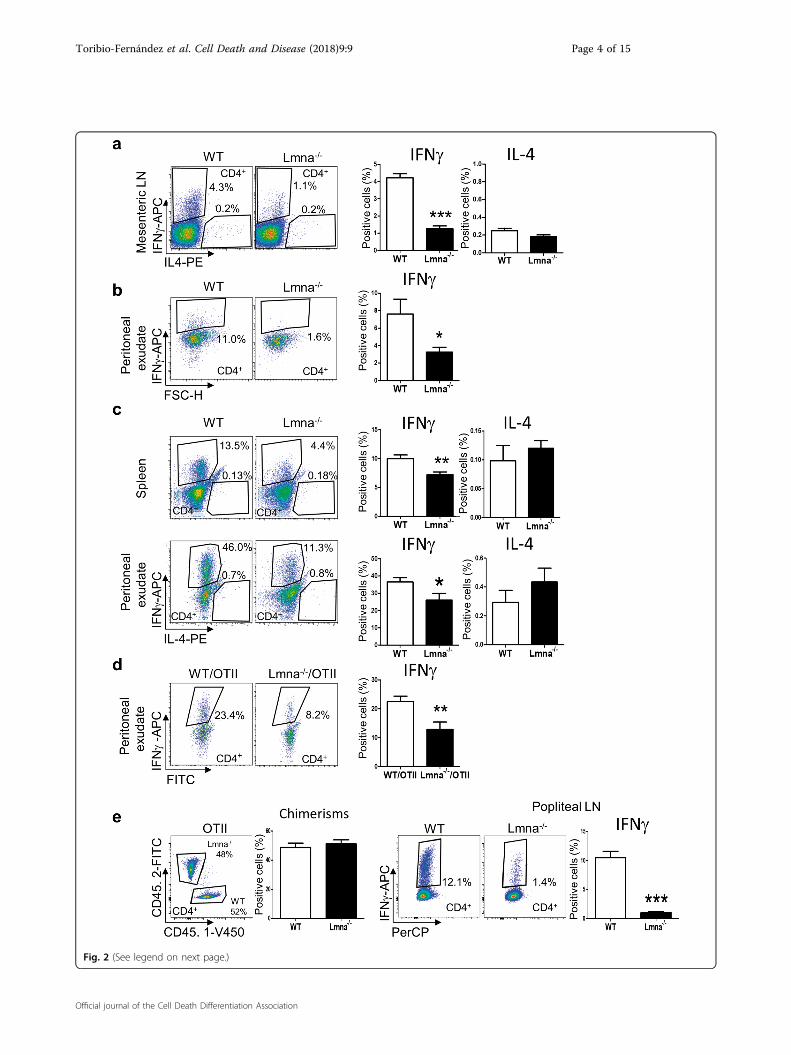
Fig. 2 (See legend on next page.)
Toribio-Fernández et al. Cell Death and Disease (2018) 9:9 Page 4 of 15
Official journal of the Cell Death Differentiation Association
was adoptively transferred into WT recipient mice beforeintradermal infection with VACV-OVA. Surface expres-sion of the T-cell activation markers CD25 and CD69 wasmeasured 48 h later (Fig. 4a, b). Accordingly, comparedwith WT cells, Lmna−/− CD4+ T-cells in draining lymphnodes expressed less CD25 and CD69.Next, we investigated whether lamin A/C could regulate
T-cell proliferation, which occurs after antigen recogni-tion and activation. However, proliferation after in vitroactivation with anti-CD3 and anti-CD28 was similar inLmna−/− and WT CD4+ T-cells (Fig. 4c). Similarly, afterVACV infection, WT and Lmna−/− mice had similarlevels of proliferating CD4+ T-cells, as shown by Ki67expression (Fig. 4d), proliferating cell nuclear antigen(PCNA) expression (Fig. 4e), and 5-bromo-2-deoxyuridine (BrdU) incorporation (Fig. 4f–g). Theseexperiments show that A-type lamins regulate T-cellactivation without affecting cell proliferation.
Lamin A/C enhances T-bet levelsThe master regulator of Th1 differentiation is T-bet.
Analysis of T-bet expression in CD4+ T-cells revealedthat deficiency in A-type lamins reduced both the per-centage of T-bet+ cells and T-bet expression levels inanti-CD3/CD28-stimulated CD4+ T-cells (Fig. 5a, b). Inagreement with the effect on Th1 differentiation, lamin A/C deficiency also diminished the percentage ofIFNγ+CD4+ T-cells (Fig. 5a). Similar results wereobtained after stimulation with anti-CD3/CD28 anti-bodies in the presence of Th1-differentiation cytokines(Fig. 5c). Moreover, lamin A/C expression was alsoimportant for T-bet expression in vivo after Th1 differ-entiation triggered by VACV infection (Fig. 5d). Low T-bet protein expression in Lmna−/− T-cells was accom-panied by lower mRNA expression in vitro (Fig. 5e),suggesting regulation at the level of mRNA synthesis.A-type lamins regulate TCR clustering and subsequent
downstream signaling upon T-cell activation3. However,altered Th1 differentiation in the absence of lamin A/Cwas not exclusively related to differences in TCR clus-tering, since the percentage of IFNγ+ and T-bet+ Lmna−/
− CD4+ T-cells was also lower after TCR-independent T-
cell stimulation with phorbol myristate acetate (PMA) andionomycin (Fig. 5a).
Lamin A/C regulates Th1 immunity against pathogeninfectionT-bet and IFNγ play major roles during in vivo Th1
responses against pathogens11,15,16. The low expression ofthese factors in Lmna−/− CD4+ T-cells prompted us toinvestigate the role of lamin A/C in Th1-mediatedpathogen clearance in vivo. Rag1−/−mice lacking T- andB-cells were adoptively transferred with naiveCD25-CD4+ T-cells from WT or Lmna−/− mice. Micewere infected with VACV by tail scarification. WithoutCD4+ T-cell adoptive transfer, 100% of Rag1−/− mice die12 days after VACV infection; CD4+ T-cell adoptivetransfer extends lifespan by accelerating viral clearance atleast in part through a mechanism mediated byTh1 cells17. In our experiments, Rag1−/− mice adoptivelytransferred with CD25-CD4+ Lmna−/− T-cells were moresusceptible to primary VACV infection, as indicated by anelevated viral titer and a reduced Th1 response in thespleen (Fig. 6a, b). Moreover, IFNγ and T-bet mRNAexpression was reduced in adoptively transferred mice,whereas the Th2 transcription factor GATA3 was unaf-fected (Fig. 6c). Viral clearance requires the efficientcoordination of multiple immune effector mechanisms11.The role of lamin A/C in viral clearance seems to beCD4+ T-cell dependent, since only CD4+ T-cells wereadoptively transferred to Rag1−/− mice before VACVinfection. Effector CD4+ T-cells have been shown torespond to viral pathogens through two mechanisms:cytokine production (mostly IFNγ and tumor necrosisfactor-α (TNFα)) and a direct cytolytic activity mediatedby perforin and FAS (also known as CD95)11. CD4+ T-cellcytotoxic activity does not require Th1 cell polarizationbut is dependent on the expression of the transcriptionfactors T-bet, eomesodermin (Eomes), and Blimp-1,which are crucial for their development in vivo throughthe induction of granzyme B (GzmB) and perforin 1(Prf1)18,19. Interestingly, Rag1−/− mice adoptively trans-ferred with Lmna−/− CD4+ T-cells and scarified withVACV had lower levels of IFNγ mRNA in the large
(see figure on previous page)Fig. 2 Impaired in vivo Th1 differentiation of naive CD4+ T-cells from Lmna−/− mice. Percentage of IFNγ+ or IL4+ CD4+ T-cells upon VACVinfection. a, bWT and Lmna−/− mice were intraperitoneally infected with VACV, and after 3 days mesenteric lymph nodes a and peritoneal exudate bwere analyzed, (n = 11 WT and 7 Lmna−/− mice). Data are means±SEM analyzed by unpaired Student’s t-test. c Irradiated CD45.1+ WT mice werereconstituted with CD45.2+ WT or CD45.2+ Lmna−/− bone marrow and infected intraperitoneally with VACV. After 5 days, spleens and the peritonealexudate were analyzed by flow cytometry (n = 7 and 8–11 mice from two independent experiments). Data are means±SEM analyzed by unpairedStudent’s t-test d Irradiated CD45.1+ WT mice were reconstituted with CD45.2+ WT/OTII or CD45.2+ Lmna−/−/OTII bone marrow and infectedintraperitoneally with VACV-OVA. After 5 days, peritoneal exudate was analyzed (n = 9 and 6 mice from 2 independent experiments). Data are means±SEM analyzed by unpaired Student’s t-test. e Irradiated CD45.1+/CD45.2+ WT mice were reconstituted with a mix of CD45.1+ WT/OTII with CD45.2+
Lmna−/−/OTII bone marrow. Five days after VACV-OVA intradermal infection in the footpad, popliteal lymph nodes were analyzed (n = 9 and 9 micefrom 2 independent experiments). Data are means±SEM analyzed by paired Student’s t-test. *P < 0.05; **P < 0.01; ***P < 0.001
Toribio-Fernández et al. Cell Death and Disease (2018) 9:9 Page 5 of 15
Official journal of the Cell Death Differentiation Association

Fig. 3 (See legend on next page.)
Toribio-Fernández et al. Cell Death and Disease (2018) 9:9 Page 6 of 15
Official journal of the Cell Death Differentiation Association

intestine than mice receiving WT CD4+ T-cells (Fig. 6c).In addition, we found that lamin A/C expression in CD4+
T-cells differentiated to Th1 in vitro positively regulatesthe mRNA expression of eomes, Blimp1, GzmB, and Prf1but not granzyme A (GzmA) (Figure S3). Lamin A/C alsoregulates CD4+ T-cell cytoxicity in vivo, since VACV-OVA-generated Lmna−/− Th1 cells were less efficient tokill OVA-loaded B220+MHCII+ B cells, after beingadoptively transferred to Rag1−/− mice (Figure S4).We also analyzed the importance of lamin A/C
expression for Th1 responses against the intracellularparasite L. major16. Mice on the C57BL/6 backgroundcontrol L. major infection by developing a protective Th1response20. C57BL/6 mice lacking lamin A/C in the wholeimmune system (Fig. 6d–h) or specifically in T-cells(Fig. 6i–k) developed progressively larger and non-healinglesions (Fig. 6d, e, i) after inoculation of the ear dermiswith a low dose of L. major parasites. This effect corre-lated with a higher parasite burden in the infection siteand in draining lymph nodes after 3 weeks (Fig. 6f, j). Atthis time, Lmna−/− mice showed a reduced percentage ofIFNγ+ CD4+ T-cells (Fig. 6g, k), with less IFNγ produc-tion (Fig. 6h). These results further support the role oflamin A/C in Th1 responses against pathogens.
DiscussionThe role of nuclear envelope proteins in the regulation
of immune homeostasis remains largely unknown21.Similarly, little is known about the molecular signals thatswitch immune function from protective to tissue dama-ging. Adaptive immunity is finely regulated by the inter-play between immune regulatory mechanisms andeffector T-cell responses. T-cells play central roles inorchestrating the protection against diverse microbialpathogens4. Many studies have investigated membranemediators important for T-cell fate decision, while othershave assessed the role of cytoplasmic proteins; however,the importance of nuclear envelope proteins for naive T-cell differentiation remained overlooked. Despite studies
characterizing signaling pathways from the membrane tothe nucleus, there is a lack of information about signalsarising in the nuclear interior and the role of nuclearproteins in mediating the transmission of information tothe cytoplasm. It has been previously shown that intrinsiclamin A/C deficiency does not affect T- and B-celldevelopment, driving the generation of functional andself-MHC-restricted CD4+ and CD8+ T-cells10. We pre-viously demonstrated that transient lamin A/C expressionin CD4+ T-cells after antigen recognition contributes toT-cell activation3. In the present study, we have identifiedthe nuclear envelope protein lamin A/C as a crucial driverof Th1 polarization, both in vitro and in vivo.Lamin A/C is expressed upon T-cell activation, and its
deficiency downregulates the transcription factor T-bet,thereby impairing naive CD4+ T-cell differentiation towardthe Th1 phenotype. Strikingly, this effect is not counter-balanced by an increase in Th2 differentiation. Distinctsignaling pathways can drive T-cell differentiation22. Inresponse to TCR activation and mTOR costimulation, Aktmodulates transcription of T-bet but not Gata3, thusaffecting Th1 but not Th2 differentiation. In contrast, PKC-θ activation yields the opposite result22. Lamin A/C is animportant regulator of gene transcription during adiposetissue differentiation23 and controls the phosphorylation ofsignaling molecules in other cellular contexts1,24. Indeed,we previously showed that lamin A/C binds to ERK1/2 andc-Fos, regulating AP-1 transcription factor target genes24,25
and that lamin A/C controls CD4+ T-cell activationthrough ERK1/2 signaling3. Interestingly, the formation ofc-Fos/c-Jun dimers can potentiate Th1 differentiation26.Lamin A/C thus seems to specifically regulate pathwaysinvolved in Th1 differentiation, directly modulating thetranscription of Th1-related genes. This process occurs in aTCR-dependent manner, although lamin A/C can alsoregulate signaling downstream the TCR, as observed afterstimulation with PMA plus ionomycin.The Th fate of antigen-engaged T-cells depends on
many factors, including the type of antigen encountered,
(see figure on previous page)Fig. 3 Compromised in vivo Th1 differentiation of naive CD4+ T-cells from Lmna−/− mice. Percentage of IFNγ+ CD4+ T-cells. a RecipientCD45.1+ WT mice were adoptively transferred with CD45.2+ WT/OTII or CD45.2+ Lmna−/−/OTII CD4+ T-cells. Five days after intraperitoneal VACV-OVAinfection, mesenteric lymph nodes and the peritoneal exudate were analyzed (n = 10 WT and 9 Lmna−/− mice from 2 independent experiments).Data are means±SEM analyzed by unpaired Student’s t-test. b CD45.1+/CD45.2+ WT mice were adoptively transferred (AT) with a mix of CD45.1+ WT/OTII and CD45.2+ Lmna−/−/OTII CD4+ T-cells and infected intraperitoneally with VACV-OVA. After 5 days, peritoneal exudate and mesenteric lymphnodes were analyzed (n = 11 and 11 mice from 2 independent experiments) Data are means±SEM analyzed by paired Student’s t-test. c CD45.1+/CD45.2+ WT mice were AT as in b, and after 5 days of intradermal infection with VACV-OVA the popliteal lymph nodes were analyzed (n = 6 and 6mice from 2 independent experiments). Data are means±SEM analyzed by paired Student’s t-test d OVA-loaded LPS-matured BMDCs were AT to WTrecipient mice. After 18 h, recipients received intravenous injections of a mix of CD45.1+ WT and CD45.2+ Lmna−/−/OTII CD4+ naive T-cells. Four dayslater, the popliteal lymph nodes were analyzed (n = 3 and 3 mice from 1 representative experiment out of 2). Data are means±SEM analyzed byunpaired Student’s t-test e Isolated splenic CD11c+ cells were incubated with OVA and LPS or with OVA and papain for 4 h and then AT to WTrecipients. Control mice were transferred with CD11c+ cells in the absence of OVA (DC-OVA). After 18 h, recipients received intravenous injections of amix of CD45.1+ WT and CD45.2+ Lmna−/− CD4+ naive T-cells. Four days later, the popliteal lymph nodes were analyzed. The percentage of IL4+ CD4+
T-cells was also investigated (n = 4 and 4 mice from 2 independent experiments). Data are means±SEM analyzed by unpaired Student’s t-test. *P <0.05; **P < 0.01; ***P < 0.001
Toribio-Fernández et al. Cell Death and Disease (2018) 9:9 Page 7 of 15
Official journal of the Cell Death Differentiation Association

Fig. 4 (See legend on next page.)
Toribio-Fernández et al. Cell Death and Disease (2018) 9:9 Page 8 of 15
Official journal of the Cell Death Differentiation Association

the TCR signal intensity, the duration of antigen pre-sentation, and the local cytokine milieu4,6–8,26,27. Th1differentiation is favored by stronger T-cell activationsignals and longer T–DC cell–cell interactions8,26. LaminA/C enhances T-cell activation by increasing TCR signalstrength and promoting T–DC interaction3. Weaker TCRsignal intensity in the absence of lamin A/C could accountfor the observed reduction in CD4+ T-cell activationtriggered by VACV infection. However, this cannot fullyexplain the differences in Th1 vs. Th2 differentiation inlamin A/C-deficient T-cells, indicating that additionalfactors are involved. Regarding the cytokine milieu, IL-2,IL-12, and IFNγ are known to facilitate Th1 differentia-tion, whereas IL-4 favors Th2 differentiation. Moreover,some cytokines promote differentiation to a specific Thphenotype without affecting others. For example, IL-33enhances Th1 but not Th2 polarization in the presence ofIL-1228. Lamin A/C expression could regulate the pro-duction and release of cytokines important for Th1 phe-notype. In this regard, we find that lamin A/C deficiencyreduces membrane expression of the IL-2 receptor CD25in CD4+ T-cells activated by VACV infection in vivo.Incubation of CD4+ T-cells with IL-2 or Th1 polarizingcytokines during in vitro differentiation did not rescue theimpaired Lmna−/− Th1 differentiation, indicating thatintracellular signals driven by the nuclear envelope pro-tein lamin A/C directly regulate Th1 differentiation.Viral clearance requires the efficient coordination of
multiple immune effector mechanisms11. We show thatlamin A/C deficiency in CD4+ T-cells results in a defec-tive Th1 differentiation, impairing the response againstVACV and delaying viral clearance. These results suggestthat lamin A/C is an essential component of the immuneresponse against cytopathic viruses. Remarkably, the roleof lamin A/C in viral clearance seems to be CD4+ T-celldependent, since only CD4+ T-cells were adoptivelytransferred to T- and B-cell-deficient Rag1−/− micebefore mouse infection with VACV. Accordingly, inhumans CD4+ T-cells are critical for antiviral immunity
and control of VACV replication12. CD4+ T-cells can alsoregulate innate immune responses that mediate viralclearance11, which is independent on B-cells and CD8+ T-cells, and might be important for appropriate CD4+ T-cellresponses against VACV17. Interestingly, Lmna−/− CD4+
T-cells show reduced cytotoxic activity in vivo andimpaired in vitro mRNA expression of transcription fac-tors involved in the regulation of CD4+ T-cell cytotoxi-city, like eomes, Blimp1, GzmB, and Prf1.The protozoan parasite L. major cause cutaneous
leishmaniasis29, usually provoking local self-healing skinlesions in humans. However, the parasite can cause pro-longed non-healing skin ulcers with extensive tissuedestruction and become systemically distributed29.C57BL/6 mice develop protective immune responsesagainst L. major. We show that WT recipient C57BL/6mice reconstituted with Lmna−/− bone marrow developpoorer Th1 responses against this parasite, with worsepathogen clearance than recipients of WT cells. Theimmune response against L. major involves multiple celltypes. Importantly, our results clearly demonstrate thatlack of lamin A/C specifically in T-cells impaired healingof ear lesions. C57BL/6 mice develop Th1-dependentresponses to L. major, and following a high L. major dosethe lesions heal in the absence of CD8+ T-cells30,31.Moreover, cytolytic CD8+ T-cells are pathogenic whenrecruited to Leishmania lesions in large numbers32.Therefore, impaired responses observed in Lmnaflox/flox×CD4-CRE mice likely associate with lamin A/C-deficient CD4+ T-cells. The early immune responsedetermines whether L. major skin lesions will be self-healing or chronic. C57BL/6 mice develop CD4+ Th1cell-mediated resistance, whereas other mouse strainsdevelop CD4+ Th2 responses and are extremely suscep-tible to infection33. Therefore, CD4+ Th1 cells are crucialfor reducing Leishmania infection34, producing IFNγ, IL-2, and TNFα locally and leading to macrophage activationand parasite elimination. Our experiments show adiminished percentage of IFNγ-producing CD4+ T-cells
(see figure on previous page)Fig. 4 Lmna−/− CD4+ T-cells show impaired in vivo and in vitro activation in response to VACV infection. a, bWT CD45.1+/CD45.2+ mice wereadoptively transferred with a mix of CD4+ T-cells from CD45.1+/OTII WT and CD45.2+/OTII Lmna−/− mice and then intradermally infected in thefootpad with VACV-OVA for 2 days. Spleen and popliteal lymph nodes were analyzed, and the expression of a CD25 and b CD69 was quantified (n =6 mice). Data are means±SEM analyzed by unpaired Student’s t-test c Splenocytes from CD45.1+ WT/OTII and CD45.2+ Lmna−/−/OTII mice weremixed, stained with cell violet, and cultured in the presence of OVA for 2 days. CD4+ T-cell proliferation was quantified and the number of celldivisions is shown in the graph. Data are means±SEM of six independent experiments analyzed by two-way ANOVA with Bonferroni’s multiplecomparison test. d, e CD4+ T-cells from CD45.1+ WT and CD45.2+ Lmna−/− mice were mixed 1:1 and adoptively transferred to CD45.1/CD45.2 WTmice. Recipient mice were then intraperitoneally infected with VACV for 7 days. The peritoneal exudates and mesenteric lymph nodes were analyzed,and the percentage of d Ki67+ or e PCNA+ CD4+ T-cells was quantified (n = 5 mice from 2 independent experiments) Data are means±SEM analyzedby unpaired Student’s t-test. f CD45.1+ WT recipient mice were transplanted with a 1:1 mix CD45.1+ WT and CD45.2+ Lmna−/− bone marrow andinfected intraperitoneally with VACV. Mice were injected with BrdU, and 24 h later the percentage of BrdU+ CD4+ T-cells was quantified in mesentericlymph nodes, peritoneal exudate, and spleen (n = 3 mice from 1 representative experiment) Data are means±SEM analyzed by paired Student’s t-test.g CD4+ T-cells from CD45.2+ WT or CD45.2+ Lmna−/− mice were mixed 1:1 and adoptively transferred to CD45.1+/CD45.2+ WT mice. Recipient micewere infected intraperitoneally with VACV for 6 days and injected with BrdU. After 24 h, the percentage of BrdU+ CD4+ T-cells was quantified in theperitoneal exudate and mesenteric lymph nodes (n = 5 and 5 mice). Data are means±SEM analyzed by paired Student’s t-test. ***P < 0.001
Toribio-Fernández et al. Cell Death and Disease (2018) 9:9 Page 9 of 15
Official journal of the Cell Death Differentiation Association

and reduced IFNγ production in Lmna−/− mice. IFNγsecretion by CD4+ T-cells induces macrophages to pro-duce nitric oxide and TNF, thus controlling L. major
infection33,35. This mechanism could explain the dimin-ished pathogen clearance observed in the absence oflamin A/C. Importantly, we show that lamin A/C in CD4+
Fig. 5 (See legend on next page.)
Toribio-Fernández et al. Cell Death and Disease (2018) 9:9 Page 10 of 15
Official journal of the Cell Death Differentiation Association
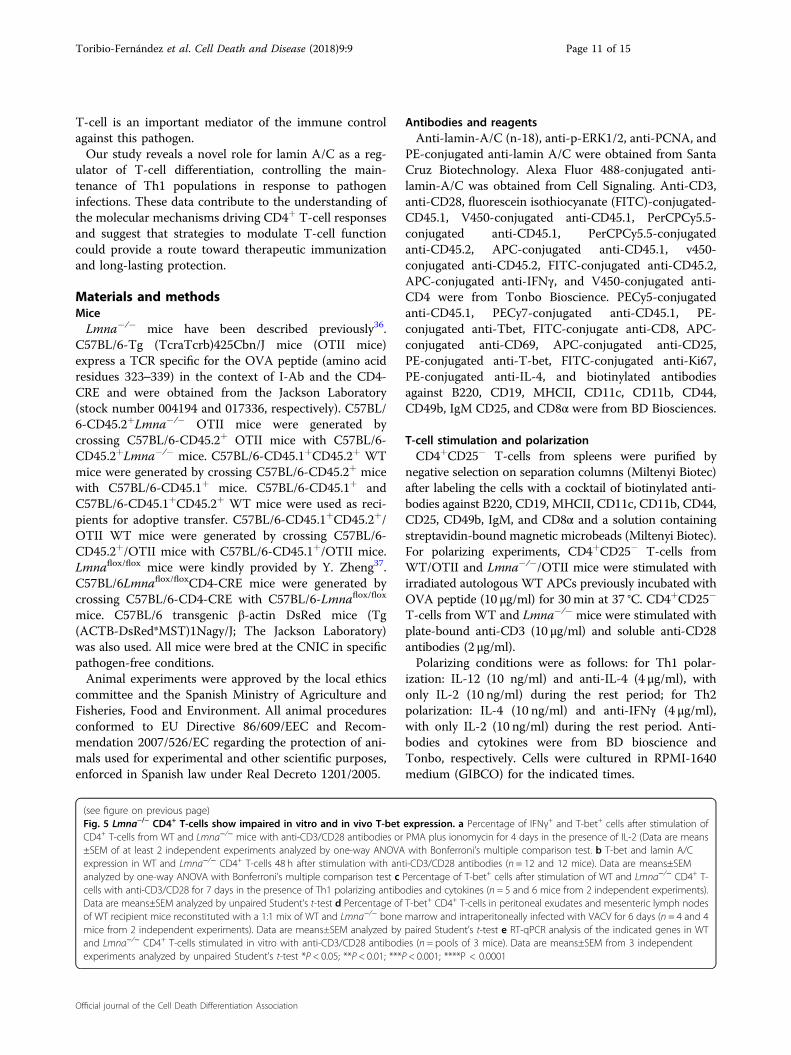
T-cell is an important mediator of the immune controlagainst this pathogen.Our study reveals a novel role for lamin A/C as a reg-
ulator of T-cell differentiation, controlling the main-tenance of Th1 populations in response to pathogeninfections. These data contribute to the understanding ofthe molecular mechanisms driving CD4+ T-cell responsesand suggest that strategies to modulate T-cell functioncould provide a route toward therapeutic immunizationand long-lasting protection.
Materials and methodsMiceLmna−/− mice have been described previously36.
C57BL/6-Tg (TcraTcrb)425Cbn/J mice (OTII mice)express a TCR specific for the OVA peptide (amino acidresidues 323–339) in the context of I-Ab and the CD4-CRE and were obtained from the Jackson Laboratory(stock number 004194 and 017336, respectively). C57BL/6-CD45.2+Lmna−/− OTII mice were generated bycrossing C57BL/6-CD45.2+ OTII mice with C57BL/6-CD45.2+Lmna−/− mice. C57BL/6-CD45.1+CD45.2+ WTmice were generated by crossing C57BL/6-CD45.2+ micewith C57BL/6-CD45.1+ mice. C57BL/6-CD45.1+ andC57BL/6-CD45.1+CD45.2+ WT mice were used as reci-pients for adoptive transfer. C57BL/6-CD45.1+CD45.2+/OTII WT mice were generated by crossing C57BL/6-CD45.2+/OTII mice with C57BL/6-CD45.1+/OTII mice.Lmnaflox/flox mice were kindly provided by Y. Zheng37.C57BL/6Lmnaflox/floxCD4-CRE mice were generated bycrossing C57BL/6-CD4-CRE with C57BL/6-Lmnaflox/flox
mice. C57BL/6 transgenic β-actin DsRed mice (Tg(ACTB-DsRed*MST)1Nagy/J; The Jackson Laboratory)was also used. All mice were bred at the CNIC in specificpathogen-free conditions.Animal experiments were approved by the local ethics
committee and the Spanish Ministry of Agriculture andFisheries, Food and Environment. All animal proceduresconformed to EU Directive 86/609/EEC and Recom-mendation 2007/526/EC regarding the protection of ani-mals used for experimental and other scientific purposes,enforced in Spanish law under Real Decreto 1201/2005.
Antibodies and reagentsAnti-lamin-A/C (n-18), anti-p-ERK1/2, anti-PCNA, and
PE-conjugated anti-lamin A/C were obtained from SantaCruz Biotechnology. Alexa Fluor 488-conjugated anti-lamin-A/C was obtained from Cell Signaling. Anti-CD3,anti-CD28, fluorescein isothiocyanate (FITC)-conjugated-CD45.1, V450-conjugated anti-CD45.1, PerCPCy5.5-conjugated anti-CD45.1, PerCPCy5.5-conjugatedanti-CD45.2, APC-conjugated anti-CD45.1, v450-conjugated anti-CD45.2, FITC-conjugated anti-CD45.2,APC-conjugated anti-IFNγ, and V450-conjugated anti-CD4 were from Tonbo Bioscience. PECy5-conjugatedanti-CD45.1, PECy7-conjugated anti-CD45.1, PE-conjugated anti-Tbet, FITC-conjugate anti-CD8, APC-conjugated anti-CD69, APC-conjugated anti-CD25,PE-conjugated anti-T-bet, FITC-conjugated anti-Ki67,PE-conjugated anti-IL-4, and biotinylated antibodiesagainst B220, CD19, MHCII, CD11c, CD11b, CD44,CD49b, IgM CD25, and CD8α were from BD Biosciences.
T-cell stimulation and polarizationCD4+CD25− T-cells from spleens were purified by
negative selection on separation columns (Miltenyi Biotec)after labeling the cells with a cocktail of biotinylated anti-bodies against B220, CD19, MHCII, CD11c, CD11b, CD44,CD25, CD49b, IgM, and CD8α and a solution containingstreptavidin-bound magnetic microbeads (Miltenyi Biotec).For polarizing experiments, CD4+CD25− T-cells fromWT/OTII and Lmna−/−/OTII mice were stimulated withirradiated autologous WT APCs previously incubated withOVA peptide (10 μg/ml) for 30min at 37 °C. CD4+CD25−
T-cells from WT and Lmna−/− mice were stimulated withplate-bound anti-CD3 (10 μg/ml) and soluble anti-CD28antibodies (2 μg/ml).Polarizing conditions were as follows: for Th1 polar-
ization: IL-12 (10 ng/ml) and anti-IL-4 (4 μg/ml), withonly IL-2 (10 ng/ml) during the rest period; for Th2polarization: IL-4 (10 ng/ml) and anti-IFNγ (4 μg/ml),with only IL-2 (10 ng/ml) during the rest period. Anti-bodies and cytokines were from BD bioscience andTonbo, respectively. Cells were cultured in RPMI-1640medium (GIBCO) for the indicated times.
(see figure on previous page)Fig. 5 Lmna−/− CD4+ T-cells show impaired in vitro and in vivo T-bet expression. a Percentage of IFNγ+ and T-bet+ cells after stimulation ofCD4+ T-cells from WT and Lmna−/− mice with anti-CD3/CD28 antibodies or PMA plus ionomycin for 4 days in the presence of IL-2 (Data are means±SEM of at least 2 independent experiments analyzed by one-way ANOVA with Bonferroni’s multiple comparison test. b T-bet and lamin A/Cexpression in WT and Lmna−/− CD4+ T-cells 48 h after stimulation with anti-CD3/CD28 antibodies (n = 12 and 12 mice). Data are means±SEManalyzed by one-way ANOVA with Bonferroni’s multiple comparison test c Percentage of T-bet+ cells after stimulation of WT and Lmna−/− CD4+ T-cells with anti-CD3/CD28 for 7 days in the presence of Th1 polarizing antibodies and cytokines (n = 5 and 6 mice from 2 independent experiments).Data are means±SEM analyzed by unpaired Student’s t-test d Percentage of T-bet+ CD4+ T-cells in peritoneal exudates and mesenteric lymph nodesof WT recipient mice reconstituted with a 1:1 mix of WT and Lmna−/− bone marrow and intraperitoneally infected with VACV for 6 days (n = 4 and 4mice from 2 independent experiments). Data are means±SEM analyzed by paired Student’s t-test e RT-qPCR analysis of the indicated genes in WTand Lmna−/− CD4+ T-cells stimulated in vitro with anti-CD3/CD28 antibodies (n = pools of 3 mice). Data are means±SEM from 3 independentexperiments analyzed by unpaired Student’s t-test *P < 0.05; **P < 0.01; ***P < 0.001; ****P < 0.0001
Toribio-Fernández et al. Cell Death and Disease (2018) 9:9 Page 11 of 15
Official journal of the Cell Death Differentiation Association

Adoptive transferSplenic CD4+CD25- T-cells from CD45.2+ Lmna−/−,
CD45.1+CD45.2+ WT, or CD45.2+ WT mice were iso-lated by negative selection on MACS separation columns(Miltenyi Biotec) after labeling the cells with a cocktail ofbiotinylated antibodies against B220, CD19, MHCII,CD11c, CD11b, CD44, CD25, CD49b, IgM, and CD8α, as
well as with a solution containing streptavidin-boundmagnetic microbeads (Miltenyi Biotec). Adoptive transferexperiments were performed by inoculating CD45.1+ orCD45.1+CD45.2+ WT recipient mice with 1×10⁶ isolatedCD4+ T-cells. In some experiments, CD45.1+CD45.2+
WT recipient mice were inoculated with a 1:1 mix of 2×10⁶ CD25−CD4+ T-cells obtained from the spleens of
Fig. 6 Lamin A/C deficiency enhances susceptibility to VACV and Leishmania major. a–c Rag1−/− mice were inoculated intravenously withnaive WT or Lmna−/− CD4+ T-cells and infected with VACV by tail scarification. After 10 days, animals were analyzed to determine a the percentage ofIFNγ+ CD4+ T-cells in the spleen (n = 7 and 5 mice), b the viral titers in the tail (n = 5 and 5 mice), and c the mRNA levels of T-bet (Tbx21), IFNγ, andGata3 in the gut (n = 7 and 8 mice). d–h WT mice were adoptively transferred with WT or Lmna−/− bone marrow. Two months after reconstitution,Leishmania major promastigotes were injected intradermally in the ears (n = 8–9 mice). Lesion size d and ear thickness e were quantified at theindicated times. f Parasite burden in ears and draining lymph nodes was measured 3 and 10 weeks after infection. g, h The percentages of g IFNγ+
CD4+ T-cells and h the CD4+ T-cell IFNγ content were quantified in the ears 3 weeks after infection. i–k WT and CD4-CRE Lmnaflox/flox mice wereinjected intradermally in the ears with Leishmania major promastigotes (n = 9 and 9 mice). i Lesion size at the indicated times. j Parasite burden in theears and draining lymph nodes at 3 weeks postinfection. k Percentage of IFNγ+ CD4+ T-cells in the ears. Data analysis in a–c, f–h, k: unpairedStudent’s t-test; d–e, i: two-way ANOVA with Bonferroni’s post-hoc multiple comparison test. *P < 0.05; **P < 0.01; ***P < 0.001
Toribio-Fernández et al. Cell Death and Disease (2018) 9:9 Page 12 of 15
Official journal of the Cell Death Differentiation Association
CD45.2+ Lmna−/− and CD45.1+ WT mice. In VACVexperiments, adoptive cell transfer was performed 24 hbefore inoculation with the VACV virus38. Similar adop-tive transfers were performed with CD4+ T-cells isolatedfrom CD45.1+CD45.2+ WT/OTII, CD45.1+ WT/OTII, orCD45.2+ Lmna−/− mice.
Generation of BMDCsBMDCs were generated as described in ref. 39. BMDCs
were obtained from bone marrow cell suspensions afterculture on non-treated cell culture dishes in completeRPMI 1640 medium supplemented with 10% fetal bovineserum (FBS), 2 mM L-glutamine, 100mg/ml penicillin,100mg/ml streptomycin, 50 mM 2-ME, and 20 ng/mlGM-CSF (PeproTech, London, UK). Cells were collectedat day 9 and BMDCs were isolated as CD11c+ MHC-II+Ly6G− cells. Maturation was induced after overnightincubation with LPS from Escherichia coli O111:B4 (1 μg/ml; Sigma-Aldrich).
Vaccinia virus, scarification assays, and viral titration inorgansThe VACV strain Western Reserve (WR, ATCC num-
ber VR-1354) was a gift from Jonathan W. Yewdell andJack R. Bennink (NIH, Bethesda, Maryland, USA). VACVwas propagated in BSC-40 cells and purified by sucrosegradient ultracentrifugation. WT or OVA-expressingVACV (1× 10⁶ plaque-forming units) were adminis-tered by intraperitoneal injection or intradermal injectionin the footpad38.Animals were anesthetized with an intraperitoneal
injection of Ketamine (100 mg/kg body weight) andXylazine (10 mg/kg) diluted in sterile phosphate-bufferedsaline (PBS). Thirty 1 cm scarifications were made with a26 G syringe along the base of the tail, avoiding bleed-ing40. Then 10ml of PBS containing 107 VACV plaque-forming units (p.f.u.) were added to the area and allowedto air dry. For mock infection only, PBS was added.Animals were euthanized and the tail aseptically
removed, weighed, frozen at −80 °C, and stored at −80 °Cuntil use. The samples were homogenized with a TissueRuptor (QIAGEN, USA) in 0.5 ml Dulbecco’s modifiedEagle’s medium (DMEM) containing 100 U/ml penicillinand 100 µg/ml streptomycin. The homogenates weresonicated for 3 min at 40% amplitude, freeze-thawed twice(−80 °C/37 °C), sonicated again under the same condi-tions, and then serially diluted in DMEM without FBS. Toquantify p.f.u., the dilutions were added to monolayers ofCV-1 cells seeded on 24-well plates. The cells were pre-incubated for 1 day at 37 °C and 5% CO2, the dilutions(0.2 ml) were added to each well, and the cells were fur-ther incubated under the same conditions for 1 h. Afterthis, 0.5 ml DMEM containing 0.5% FBS were added toeach well. After 24 h, the cells were stained for 5 min with
crystal violet solution (0.5% crystal violet, 10% ethanol,and 1% paraformaldehyde) and washed again. Viral pla-ques were counted and plaque number was multiplied bythe reciprocal of sample dilution and converted to p.f.u./g.17
Leishmania parasites, preparation, inoculation, andquantificationIn vivo experiments were carried out using L. major
Friedlin strain FV1 (MHOM/IL/80/Friedlin), generouslyprovided by Dr. D. Sacks (NIH)20. For Leishmania chal-lenge, parasites were kept in a virulent state by passage inmice. Parasites were cultured and differentiated as descri-bed41. Mice were infected by i.d. injection of 103 or 5× 10⁴
metacyclic L. major promastigotes into the dermis of bothears. Lesion size in the ear was determined with digitalcallipers (Duratool)20. The limiting dilution assay was usedto determine parasite number41. Parasite load was expres-sed as the number of parasites in the whole organ.
Bone marrow transplantationWT recipient mice received 13 Gy of total body irradia-
tion administered in two treatments from a 137Cs source.Bone marrow cells from CD45.2+ WT or CD45.2+ Lmna−/
− mice were transplanted into CD45.1+ WT recipients byinjection into the retro-orbital sinus immediately afterirradiation. A mix 1:1 of bone marrow cells from CD45.1+
WT and CD45.2+ Lmna−/− mice were transplanted intoCD45.1+CD45.2+ WT recipients by injection into theretro-orbital sinus immediately after irradiation. Approxi-mately 8 weeks after transplantation, the chimeric condi-tion of the mice was assessed by flow cytometric analysis ofblood cells stained with a combination of fluorescentlylabeled anti-CD45.1 and anti-CD45.2 antibodies to detectT-cells from donor and from recipient mice, which con-firmed that >90% of the cells analyzed were derived fromthe transplanted bone marrow cells
Flow cytometryCD4+ T-cells were stimulated with PMA (20 ng/ml)
(Sigma Aldrich) plus ionomycin (1 μg/ml) (Sigma Aldrich)for 6 h. Brefeldin A (Sigma Aldrich) was added for the last2 h to allow intracellular cytokine accumulation. Surfaceantigens were stained with antibodies, then fixed andmade permeable with either a Cytofix/Cytoperm kit (BDPharmingen), then intracellular cytokines and transcrip-tion factors in cells were stained. Data were acquired onFACSCantoII or LSRFortessa flow cytometers (BD Bios-ciences) and analyzed with the BD FACSDIVA (BDBiosciences) or FlowJo (Treestar Inc) software.
Reverse transcription–quantitative PCRTotal RNA was isolated with Qiazol Lysis Reagent
(Qiagen) and isopropanol precipitation or with the
Toribio-Fernández et al. Cell Death and Disease (2018) 9:9 Page 13 of 15
Official journal of the Cell Death Differentiation Association

RNeasy Mini kit (Qiagen), according to the manu-facturer’s instructions. RNA concentration and puritywere assessed from the ratio of absorbances at 260 and280 nm. Complementary DNA (cDNA) was synthesizedfrom total RNA (0.1–1 µg per reaction) with the HighCapacity cDNA Reverse Transcription Kit (Applied Bio-systems) using random primers and RNase Inhibitor,according to the manufacturer’s protocol. QuantitativePCR was performed with the ABI PRISM 7900HTSequence Detection System (Applied Biosystems) usingthe PCR Power SYBR Green PCR Master Mix (AppliedBiosystems), with technical triplicates.The sequences of RT-qPCR primers were as follows:
T-Bet-Forward 5′-GAAAGGCAGAAGGCAGCAT-3′;T-Bet-Reverse 5′-GAGCTTTAGCTTCCCAAATGAA-3′;Hprt1-Forward 5′-CCTAAGATGAGCGCAAGTTGAA-3′ and Hprt1-Reverse 5′-CCACAGGACTAGAACACCTGCTAA-3′; GzmA-Forward 5′-GACTGCTGCCCACTG-TAACG-3′; GzmA-Reverse 5′-TCAATATCTGTTGTTCTGGCTCCTTA-3′; GzmB-Forward 5′-TGTCTCTGGCCTCCAGGACAA-3′; GzmB-Reverse 5′- CTCAGGCTGCTGATCCTTGATCGA-3′; Prf1-Forward 5′- GCGTCTCCAGTGAATACAAAG-3′; Prf1-Reverse 5′- TACTTCGACGTGACGCT-3′; Eomes-Forward 5′-GCCTAC-CAAAACACGGATA-3′; Eomes-Reverse 5′-TCTGTTGGGGTGAGAGGAG-3′; Ifng-Forward 5′- TGGCTCTGCAGGATTTTCATG-3′; Ifng-Reverse 5′- TCAAGTGGCATAGATGTGGAAGAA-3′; Blimp-1-Forward 5′-ACACACAGGAGAGAAGCCACATGA-3′; Blimp-1-Reverse 5′- TCGAAGGTGGGTCTTGAGATTGCT-3′;gapdh-Forward 5′-CTACACTGAGGACCAGGTTGTC-3′; gapdh-Reverse 5′-GGTCTGGGATGGAAATTGTG-3′. Lmnb1-Forward 5′-CAACTGACCTCATCTGGAA-GAAC 3′; Lmnb1-Reverse 5′-TAAGACTGTGCTTCTCTGAGC-3′; Lmna-Forward-5′-TGAGTACAACCTGCGCTCAC-3′; and Lmna-Reverse: 5′-TGACTAGGTTGTCCCCGAAG-3′. The extent of expression of a geneof interest was analyzed by the comparative Ct methodwith the Biogazelle qBasePLUS software using as internalcontrol the housekeeping genes GAPDH (glyceraldehyde-3-phosphate dehydrogenase) and HPRT1 (hypoxanthinephosphoribosyltransferase 1). Results are represented asfold change relative to control conditions.
Proliferation assaysTwenty-four hours before the sacrifice of the mice, a
single dose of 1 mg BrdU (BD Pharmingen) was injectedintraperitoneally (i.p.). To assess BrdU incorporation,mesenteric lymph nodes, peritoneal exudate, and spleenwere stained for CD4, fixed, and permeabilized using theBD BrdU Flow Kit (BD Pharmigen) according to themanufacturer’s instructions. Cells were incubated at 37 °Cfor 60 min in 30 µg of DNase, followed by staining withanti-BrdU-FITC for 40min, washed, and analyzed by flow
cytometry. Peritoneal exudate and mesenteric lymph nodecells were fixed and permeabilized using Foxp3 fixation/permeabilization buffer (BD Pharmingen) and stained forPCNA-FITC and Ki67-FITC.
In vivo cytotoxicity assaysSplenic CD45.2+WT or CD45.2+Lmna−/− CD4+/OTII
T-cells were isolated as described in the adoptive transfersection. Recipient Rag1−/− mice were inoculated intra-venously with 2× 10⁶ of either naive CD45.2/WT orCD45.2/Lmna−/− CD4+/OTII T-cells and infected withVACV-OVA i.p. After 5 days, splenocytes from CD45.2/WT/dsRED and CD45.1/WT mice were isolated andloaded or not with OVA OTII peptide, respectively. Anapproximately 1:1 mix of 5× 10⁶ CD45.2/WT/dsRED andCD45.1/WT splenocytes was inoculated intravenously inthe recipient Rag1−/− mice, which were previouslyinoculated and vaccinia infected. After 16 h, animals wereanalyzed to determine the killing capacity of CD4/OTIIcells in the spleen by flow cytometry. Killing capacity wasdetermined as the ratio between CD45.2/WT/dsRED/+OVA and CD45.1/WT/-OVA cells and the percentageof CD4/OTII T-cells. Mice adoptively transferred withCD4/OTII cells only and mice transferred with spleno-cytes in the absence of CD4/OTII cells were used ascontrols.
Statistical analysisStatistical analyses were performed with Prism Graph-
Pad or Microsoft Office Excel. Unless otherwise stated,statistical significance was calculated by two-tailed Stu-dent’s t-test. When specified, one-way analysis of variance(ANOVA) or two-way ANOVA with Bonferroni’s post-hoc multiple comparison test was used. Significance ofdifferences was calculated as follows: *P< 0.05, **P< 0.01,***P< 0.001, and **** P> 0.0001.
AcknowledgementsThe authors thank J. Mateos, I. Fernández-López, and M.J. Andrés-Manzano fortechnical assistance and S. Bartlett for English editing. This study wassupported by grants to J.-M.G.-G. from Instituto de Salud Carlos III (ISCIII) (PI14/00526, PI17/01395, CP11/00145, CPII16/00022), the Miguel Servet Program, andFundación Ramón Aréces; to V.A. (RD12/0042/0028 SAF2013-46663-R,SAF2016-79490-R); to F.S.-M. (SAF2014-55579-R, INDISNET-S2011/BMD-2332,ERC-2011-AdG 294340-GENTRIS, and PIE13/00041); and to D.S. (SAF-2013-42920R, SAF2016-79040-R, and Fondation ACTERIA) with co-funding from theFondo Europeo de Desarrollo Regional (FEDER). The CNIC is supported by theMinistry of Economy, Industry and Competitiveness (MEIC) and the Pro CNICFoundation and is a Severo Ochoa Center of Excellence (SEV-2015-0505). S.I. isfunded by grant SAF2015-74561-JIN, R.T.-F. by the Fundación Ramón Aréces, V.Z. by ISCIII, and J.-M.G.-G. by the ISCIII Miguel Servet Program and the Institutode Investigación Sanitaria Hospital 12 de Octubre (imas12).
Author contributionsR.T.-F., V.Z., S.I., V.R.-P., and J.-M.G.-G. conceived and designed research. R.T.-F., V.Z., and S.I. performed experimental work. G.M.d.H., R.C., B.D., D.S., F.S.-M., and V.A. provided scientific input. D.S., F.S.-M., V.A., and J.-M.G.-G. acquired funding. V.R.-P. and J.-M.G.-G. wrote the manuscript. J.-M.G.-G. supervised the project. Allauthors revised the manuscript and approved its final version
Toribio-Fernández et al. Cell Death and Disease (2018) 9:9 Page 14 of 15
Official journal of the Cell Death Differentiation Association

Author details1Centro Nacional de Investigaciones Cardiovasculares Carlos III (CNIC), Madrid,Spain. 2Servicio de Inmunología, Hospital de la Princesa, Instituto deInvestigación Sanitaria La Princesa (IIS Princesa), Madrid, Spain. 3CIBER deEnfermedades Cardiovasculares, Madrid, Spain. 4Instituto de InvestigaciónSanitaria Hospital 12 de Octubre (imas12), Madrid, Spain
Conflict of interestThe authors declare that they have no competing interests.
Publisher's noteSpringer Nature remains neutral with regard to jurisdictional claims inpublished maps and institutional affiliations.
Supplementary informationThe online version of this article (https://doi.org/10.1038/s41419-017-0007-6)contains supplementary material.
Received: 2 July 2017 Revised: 18 September 2017 Accepted: 19 September2017
References1. Andres, V. & Gonzalez, J. M. Role of A-type lamins in signaling, transcription,
and chromatin organization. J. Cell Biol. 187, 945–957 (2009).2. Broers, J. L., Ramaekers, F. C., Bonne, G., Yaou, R. B. & Hutchison, C. J. Nuclear
lamins: laminopathies and their role in premature ageing. Physiol. Rev. 86,967–1008 (2006).
3. Gonzalez-Granado, J. M. et al. Nuclear envelope lamin-A couples actindynamics with immunological synapse architecture and T cell activation. Sci.Signal. 7, ra37 (2014).
4. Zhu, J., Yamane, H. & Paul, W. E. Differentiation of effector CD4 T cell popu-lations (*). Annu. Rev. Immunol. 28, 445–489 (2010).
5. Kaech, S. M., Wherry, E. J. & Ahmed, R. Effector and memory T-cell differ-entiation: implications for vaccine development. Nat. Rev. Immunol. 2, 251–262(2002).
6. Szabo, S. J. et al. A novel transcription factor, T-bet, directs Th1 lineagecommitment. Cell 100, 655–669 (2000).
7. O’Shea, J. J. & Paul, W. E. Mechanisms underlying lineage commitment andplasticity of helper CD4+ T cells. Science 327, 1098–1102 (2010).
8. van Panhuys, N., Klauschen, F. & Germain, R. N. T-cell-receptor-dependentsignal intensity dominantly controls CD4(+) T cell polarization in vivo.Immunity 41, 63–74 (2014).
9. Zheng, W. & Flavell, R. A. The transcription factor GATA-3 is necessary andsufficient for Th2 cytokine gene expression in CD4 T cells. Cell 89, 587–596(1997).
10. Hale, J. S., Frock, R. L., Mamman, S. A., Fink, P. J. & Kennedy, B. K. Cell-extrinsicdefective lymphocyte development in Lmna(-/-) mice. PLoS ONE 5, e10127(2010).
11. Swain, S. L., McKinstry, K. K. & Strutt, T. M. Expanding roles for CD4(+) T cells inimmunity to viruses. Nat. Rev. Immunol. 12, 136–148 (2012).
12. Munier, C. M. et al. The primary immune response to Vaccinia virus vaccinationincludes cells with a distinct cytotoxic effector CD4 T-cell phenotype. Vaccine34, 5251–5261 (2016).
13. Sen, D., Forrest, L., Kepler, T. B., Parker, I. & Cahalan, M. D. Selective and site-specific mobilization of dermal dendritic cells and Langerhans cells by Th1-and Th2-polarizing adjuvants. Proc. Natl. Acad. Sci. USA 107, 8334–8339 (2010).
14. Sokol, C. L., Barton, G. M., Farr, A. G. & Medzhitov, R. A mechanism for theinitiation of allergen-induced T helper type 2 responses. Nat. Immunol. 9,310–318 (2008).
15. Mougneau, E., Bihl, F. & Glaichenhaus, N. Cell biology and immunology ofLeishmania. Immunol. Rev. 240, 286–296 (2011).
16. Sacks, D. & Noben-Trauth, N. The immunology of susceptibility and resistanceto Leishmania major in mice. Nat. Rev. Immunol. 2, 845–858 (2002).
17. Mota, B. E. et al. Adverse events post smallpox-vaccination: insights from tailscarification infection in mice with Vaccinia virus. PLoS ONE 6, e18924 (2011).
18. Qui, H. Z. et al. CD134 plus CD137 dual costimulation induces Eomesoderminin CD4 T cells to program cytotoxic Th1 differentiation. J. Immunol. 187,3555–3564 (2011).
19. Juno, J. A. et al. Cytotoxic CD4 T cells-friend or foe during viral infection? Front.Immunol. 8, 19 (2017).
20. Iborra, S. et al. H-ras and N-ras are dispensable for T-cell development andactivation but critical for protective Th1 immunity. Blood 117, 5102–5111(2011).
21. Rocha-Perugini, V. & Gonzalez-Granado, J. M. Nuclear envelope lamin-A as acoordinator of T cell activation. Nucleus 5, 396–401 (2014).
22. Lee, K. et al. Mammalian target of rapamycin protein complex 2 regulatesdifferentiation of Th1 and Th2 cell subsets via distinct signaling pathways.Immunity 32, 743–753 (2010).
23. Lund, E. & Collas, P. Nuclear lamins: making contacts with promoters. Nucleus4, 424–430 (2013).
24. Gonzalez, J. M., Navarro-Puche, A., Casar, B., Crespo, P. & Andres, V. Fast reg-ulation of AP-1 activity through interaction of lamin A/C, ERK1/2, and c-Fos atthe nuclear envelope. J. Cell Biol. 183, 653–666 (2008).
25. Ivorra, C. et al. A mechanism of AP-1 suppression through interaction of c-Foswith lamin A/C. Genes Dev. 20, 307–320 (2006).
26. van Panhuys, N. TCR signal strength alters T-DC activation and interactiontimes and directs the outcome of differentiation. Front. Immunol. 7, 6 (2016).
27. Constant, S. L. & Bottomly, K. Induction of Th1 and Th2 CD4+ T cell responses:the alternative approaches. Annu. Rev. Immunol. 15, 297–322 (1997).
28. Komai-Koma, M. et al. Interleukin-33 promoting Th1 lymphocyte differentia-tion dependents on IL-12. Immunobiology 221, 412–417 (2016).
29. Reithinger, R. et al. Cutaneous leishmaniasis. Lancet Infect. Dis. 7, 581–596(2007).
30. Belkaid, Y. et al. CD8+ T cells are required for primary immunity in C57BL/6mice following low-dose, intradermal challenge with Leishmania major. J.Immunol. 168, 3992–4000 (2002).
31. Uzonna, J. E., Joyce, K. L. & Scott, P. Low dose Leishmania major promotes atransient T helper cell type 2 response that is down-regulated by interferongamma-producing CD8+T cells. J. Exp. Med. 199, 1559–1566 (2004).
32. Novais, F. O. et al. Cytotoxic T cells mediate pathology and metastasis incutaneous leishmaniasis. PLoS Pathog. 9, e1003504 (2013).
33. Scott, P. & Novais, F. O. Cutaneous leishmaniasis: immune responses in pro-tection and pathogenesis. Nat. Rev. Immunol. 16, 581–592 (2016).
34. Iborra, S. et al. Leishmania uses mincle to target an inhibitory ITAM signalingpathway in dendritic cells that dampens adaptive immunity to infection.Immunity 45, 788–801 (2016).
35. Scott, P., Natovitz, P., Coffman, R. L., Pearce, E. & Sher, A. Immunoregulation ofcutaneous leishmaniasis. T cell lines that transfer protective immunity orexacerbation belong to different T helper subsets and respond to distinctparasite antigens. J. Exp. Med. 168, 1675–1684 (1988).
36. Sullivan, T. et al. Loss of A-type lamin expression compromises nuclearenvelope integrity leading to muscular dystrophy. J. Cell Biol. 147, 913–920(1999).
37. Kim, Y., Zheng, X. & Zheng, Y. Proliferation and differentiation of mouseembryonic stem cells lacking all lamins. Cell Res. 23, 1420–1423 (2013).
38. Iborra, S. et al. Optimal generation of tissue-resident but not circulatingmemory T cells during viral infection requires crosspriming by DNGR-1+dendritic cells. Immunity 45, 847–860 (2016).
39. Rocha-Perugini, V. et al. CD9 regulates MHC-II trafficking in monocyte-deriveddendritic cells. Mol. Cell. Biol. 37, pii: e00202–17 (2017).
40. Melamed, S. et al. Tail scarification with Vaccinia virus Lister as a model forevaluation of smallpox vaccine potency in mice. Vaccine 25, 7743–7753 (2007).
41. Iborra, S. et al. Vaccination with the Leishmania infantum acidic ribosomal P0protein plus CpG oligodeoxynucleotides induces protection against cuta-neous leishmaniasis in C57BL/6 mice but does not prevent progressive dis-ease in BALB/c mice. Infect. Immun. 73, 5842–5852 (2005).
Toribio-Fernández et al. Cell Death and Disease (2018) 9:9 Page 15 of 15
Official journal of the Cell Death Differentiation Association