biogen inc (nas) qqqqq
TRANSCRIPT
Morningstar Equity Research
© Morningstar 2016. All Rights Reserved. Unless otherwise provided in a separate agreement, you may use this report only in the country in which its original distributor is based. The information, data, analyses and opinions presented herein do not constituteinvestment advice; are provided solely for informational purposes and therefore are not an offer to buy or sell a security; and are not warranted to be correct, complete or accurate. The opinions expressed are as of the date written and are subject to change withoutnotice. Except as otherwise required by law, Morningstar shall not be responsible for any trading decisions, damages or other losses resulting from, or related to, the information, data, analyses or opinions or their use. The information contained herein is theproprietary property of Morningstar and may not be reproduced, in whole or in part, or used in any manner, without the prior written consent of Morningstar. To order reprints, call +1 312-696-6100. To license the research, call +1 312-696-6869. Please see importantdisclosures at the end of this report.
Last Price Fair Value Consider Buy Consider Sell Uncertainty Economic Moat™ Moat Trend™ Stewardship Industry Group
273.27 USD 400.00 USD 280.00 USD 540.00 USD Medium Wide Stable Standard Biotechnology
Biogen Inc BIIB (NAS) | QQQQQ
Market Cap (USD Mil) 59,757
52-Week High (USD) 480.18
52-Week Low (USD) 254.00
52-Week Total Return % -30.1
YTD Total Return % -10.8
Last Fiscal Year End 31 Dec 2015
5-Yr Forward Revenue CAGR % 4.6
5-Yr Forward EPS CAGR % 8.1
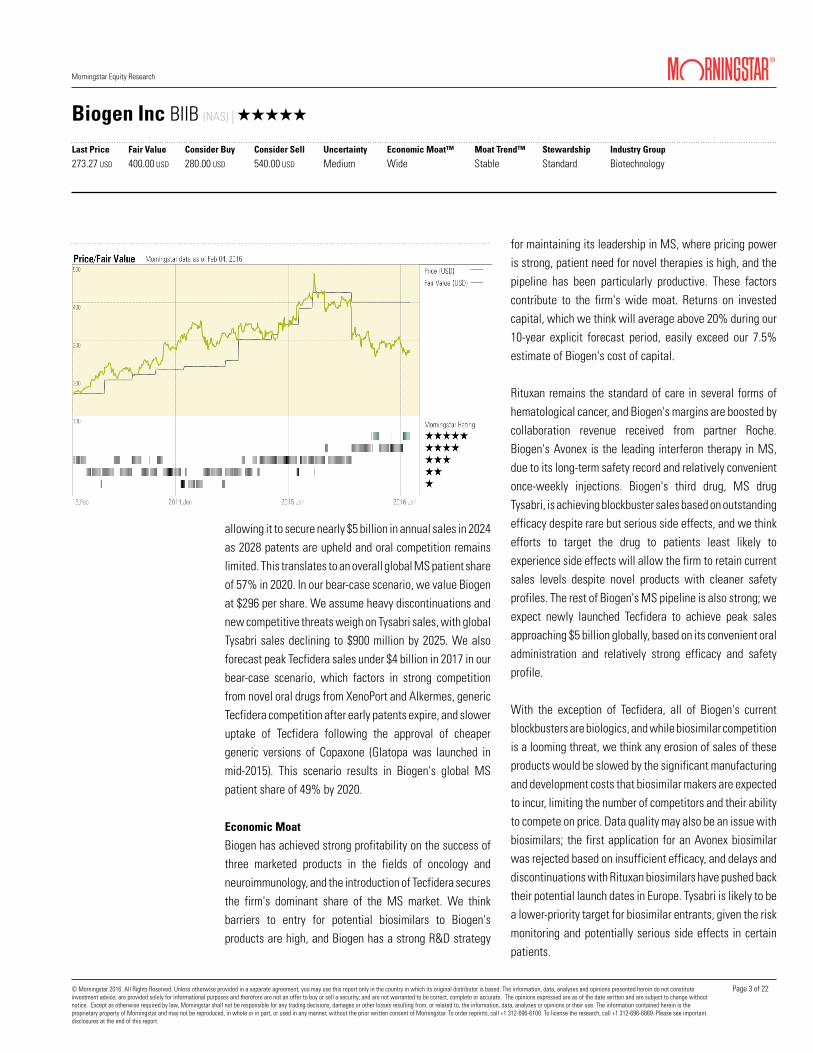
Price/Fair Value 0.68
2014 2015 2016(E) 2017(E)
Price/Earnings 24.5 18.0 14.6 13.5EV/EBITDA 14.4 13.7 10.6 10.1EV/EBIT 16.9 15.6 11.7 11.0Free Cash Flow Yield % 4.0 4.4 6.0 6.4Dividend Yield % — — — —
2014 2015 2016(E) 2017(E)
Revenue 9,704 10,765 11,233 11,745
Revenue YoY % 40.0 10.9 4.4 4.6
EBIT 3,917 5,016 5,379 5,692
EBIT YoY % 57.3 28.1 7.2 5.8
Net Income, Adjusted 3,282 3,936 4,087 4,306
Net Income YoY % 53.6 19.9 3.8 5.4
Diluted EPS 13.84 17.02 18.66 20.21
Diluted EPS YoY % 54.3 23.0 9.6 8.3
Free Cash Flow 1,273 3,142 2,431 2,641
Free Cash Flow YoY % 104.0 146.9 -22.6 8.6
Biogen's multiple sclerosis market dominance and expansiveneurology pipeline support its wide moat.Updated Forecasts and Estimates from 01 Feb 2016
Karen Andersen, [email protected]+1 (312) 384-4826
Damien Conover, CFASector [email protected]+1 (312) 696-6052
Research as of 01 Feb 2016Estimates as of 01 Feb 2016Pricing data through 04 Feb 2016Rating updated as of 04 Feb 2016
Investment Thesis 30 Nov 2015
Biogen enjoys growing profitability from several multiple sclerosis
products and cancer drug Rituxan. We think Biogen's
specialty-market-focused drug portfolio and pipeline create a wide
economic moat, and Tecfidera increases the firm's dominance in
MS.
Biogen's strategy has its roots in the 2003 merger of Biogen
(Avonex) and Idec (Rituxan). Rituxan's market penetration is already
high, and patents in the United States (where Biogen derives its
profit share from Roche) expire in 2018. However, we think a
subcutaneous Rituxan as well as novel antibody Gazyva will allow
for extended oncology revenue growth. Avonex generates $3 billion
in annual sales and remains the leading MS interferon therapy.
Biogen acquired full rights to MS antibody Tysabri from partner
Elan, and sales reached almost $2 billion in 2014. A diagnostic test
can isolate patients with the lowest progressive multifocal
leukoencephalopathy risk, offering superior efficacy for the 50%
of patients who have not been exposed to the JC virus.
Based on a strong launch and solid safety and efficacy data, we
expect oral MS drug Tecfidera to see peak sales north of $4 billion.
Two recent cases of PML and European pricing pressure have
weighed on Tecfidera's growth. However, we think Tecfidera's
pricing power will remain strong in the U.S., while older products
like Avonex could see pricing power erode now that generic
Copaxone has launched. We're less enthusiastic about sales
potential for a long-acting version of Avonex (Plegridy), approved
in 2014, and high-efficacy product Zinbryta (which has significant
side effects, but could reach the market in 2017).
Outside of MS, we see more uncertainty, but potential to offset
MS pressure. Eloctate and Alprolix in hemophilia A and B launched
in 2014; the $6 billion hemophilia A market looks lucrative, but we
expect entrenched competitors like Baxalta's Advate to limit
potential. However, the spinal muscular atrophy program with Isis
looks likely to reach $1 billion in peak sales. Biogen's LINGO
program (reversal of disability in MS) and Aducanumab
(Alzheimer's) could both see multibillion-dollar peak sales, but risk
of failure is high.
Biogen and Idec merged in 2003, combining forces to market Biogen'smultiple sclerosis drug Avonex and Idec's leading cancer drug Rituxan.Today, Rituxan and next-generation antibody Gazyva are marketed via acollaboration with Roche. Biogen markets novel MS drugs Tysabri andTecfidera independently, and newly approved hemophilia therapies Eloctateand Alprolix with partner SOBI. Biogen has several drug candidates in phase3 trials in the fields of immunology and neurology.
Profile
Vital Statistics
Valuation Summary and Forecasts
Financial Summary and Forecasts
The primary analyst covering this companydoes not own its stock.
Currency amounts expressed with "$" are inU.S. dollars (USD) unless otherwise denoted.
Historical/forecast data sources are Morningstar Estimates and may reflect adjustments.
(USD Mil)
Contents
Investment Thesis
Morningstar Analysis
Analyst Note
Valuation, Growth and Profitability
Scenario Analysis
Economic Moat
Moat Trend
Bulls Say/Bears Say
Financial Health
Enterprise Risk
Management & Ownership
Analyst Note Archive
Additional Information
Morningstar Analyst Forecasts
Comparable Company Analysis
Methodology for Valuing Companies
Fiscal Year:
Fiscal Year:
1
-
2
2
3
4
5
6
6
8
9
-
12
16
18
Page 1 of 22
Morningstar Equity Research
© Morningstar 2016. All Rights Reserved. Unless otherwise provided in a separate agreement, you may use this report only in the country in which its original distributor is based. The information, data, analyses and opinions presented herein do not constituteinvestment advice; are provided solely for informational purposes and therefore are not an offer to buy or sell a security; and are not warranted to be correct, complete or accurate. The opinions expressed are as of the date written and are subject to change withoutnotice. Except as otherwise required by law, Morningstar shall not be responsible for any trading decisions, damages or other losses resulting from, or related to, the information, data, analyses or opinions or their use. The information contained herein is theproprietary property of Morningstar and may not be reproduced, in whole or in part, or used in any manner, without the prior written consent of Morningstar. To order reprints, call +1 312-696-6100. To license the research, call +1 312-696-6869. Please see importantdisclosures at the end of this report.
Last Price Fair Value Consider Buy Consider Sell Uncertainty Economic Moat™ Moat Trend™ Stewardship Industry Group
273.27 USD 400.00 USD 280.00 USD 540.00 USD Medium Wide Stable Standard Biotechnology
Biogen Inc BIIB (NAS) | QQQQQ
Morningstar Analysis
Valuation, Growth and Profitability 01 Feb 2016
Our fair value estimate for Biogen stands at $400 per share,as slightly lower assumptions for Gazyva and Lingo arecountered by higher estimates for ocrelizumab.
We think global Tecfidera sales will peak at $4.4 billion in2018 before the entry of new oral competition. BeyondTecfidera, we think combined global sales of Avonex andPlegridy will continue to fall in 2016, with mid- tohigh-single-digit declines annually because of newcompetition. We expect Tysabri to decline from $1.9 billionin 2016 to $1.1 billion by the end of our 10-year forecast, asJCV-positive patients switch to other effective therapieslike ocrelizumab. We include higher sales for ocrelizumab,with a 90% probability of sales hitting $5 billion by 2023(we assume Biogen sees roughly 13% of global sales). Opticneuritis data for the anti-Lingo program in January 2015was mixed, and we assume a 30% probability of sales forthe drug in MS surpassing $6 billion by year 10 of ourforecast.
Outside of MS, we assume Biogen's profit share on Rituxanand Gazyva slides from $1.3 billion in 2016 to $700 millionin 10 years, as oral competition in blood cancer intensifies.We think Biogen could recognize $500 million in sales atpeak for Alprolix in hemophilia B and $500 million at peakfor Eloctate in hemophilia A. For ISIS-SMNRx, we include$1.5 billion in sales by 2025 using a 65% probability ofapproval ($2.8 billion in potential sales). After positive phase1 data for Alzheimer's drug Aducanumab in December 2014,Biogen's decision to move the product to phase 3, and thecollaboration with Eisai on BAN2401 and E2609, we nowinclude more than $3 billion in probability-weightedAlzheimer's sales to Biogen by 2025 (implying total salesexceeding $15 billion if all products are approved). Weinclude $1 billion in 2025 sales for all biosimilar and genetherapy products, combined.
We see non-GAAP operating margins growing from 50% in
2014 to 52.5% in 2020, as the launch of Tecfidera hasboosted operating leverage. Overall, we think Biogen'stop-line growth will average 5% during the next five years,and share-repurchase activity as well as operating leverageshould enable the firm to achieve average earnings pershare growth of 8% during this same period.
We still rate the systematic risk surrounding Biogen sharesas below average, and we use a 7.5% cost-of-equityassumption to align our capital cost assumptions with thereturns equity investors are likely to demand over the longrun.
Scenario Analysis
We assign Biogen Idec a medium uncertainty rating, asdemand is relatively inelastic for Biogen's portfolio of MStreatments, but revenue remains focused on one therapeuticarea and increasingly on one product (Tecfidera). In ourbase-case scenario, we expect Tecfidera's peak sales tosurpass $4 billion, as the drug's safety and efficacy profilestill look strong despite two recent cases of PML. We alsoassume that Tysabri sales peak at $1.9 billion in 2016, aswe think new patient adds (from patients testingseronegative for the JC virus antibody) and U.S. pricingpower may not be able to counter the impact ofdiscontinuations from seropositive patients or newalternative regimens (ocrelizumab) in the long run. Overall,this scenario assumes Biogen's global patient share in MSgrows from 40% in 2015 to 53% in 2020, includingocrelizumab patients. In this scenario, we think operatingmargins will expand to 53% during the next five years,thanks to operating leverage from manufacturing and sellingcosts.
In our bull-case scenario--valuing Biogen at $493 pershare--Tysabri sales stay flat around $1.9 billion annuallyduring our 10-year explicit forecast period. We also assumethat Tecfidera becomes the dominant player in the MSmarket despite a high price tag and recent safety concerns,
Page 2 of 22
Morningstar Equity Research
© Morningstar 2016. All Rights Reserved. Unless otherwise provided in a separate agreement, you may use this report only in the country in which its original distributor is based. The information, data, analyses and opinions presented herein do not constituteinvestment advice; are provided solely for informational purposes and therefore are not an offer to buy or sell a security; and are not warranted to be correct, complete or accurate. The opinions expressed are as of the date written and are subject to change withoutnotice. Except as otherwise required by law, Morningstar shall not be responsible for any trading decisions, damages or other losses resulting from, or related to, the information, data, analyses or opinions or their use. The information contained herein is theproprietary property of Morningstar and may not be reproduced, in whole or in part, or used in any manner, without the prior written consent of Morningstar. To order reprints, call +1 312-696-6100. To license the research, call +1 312-696-6869. Please see importantdisclosures at the end of this report.
Last Price Fair Value Consider Buy Consider Sell Uncertainty Economic Moat™ Moat Trend™ Stewardship Industry Group
273.27 USD 400.00 USD 280.00 USD 540.00 USD Medium Wide Stable Standard Biotechnology
Biogen Inc BIIB (NAS) | QQQQQ
allowing it to secure nearly $5 billion in annual sales in 2024as 2028 patents are upheld and oral competition remainslimited. This translates to an overall global MS patient shareof 57% in 2020. In our bear-case scenario, we value Biogenat $296 per share. We assume heavy discontinuations andnew competitive threats weigh on Tysabri sales, with globalTysabri sales declining to $900 million by 2025. We alsoforecast peak Tecfidera sales under $4 billion in 2017 in ourbear-case scenario, which factors in strong competitionfrom novel oral drugs from XenoPort and Alkermes, genericTecfidera competition after early patents expire, and sloweruptake of Tecfidera following the approval of cheapergeneric versions of Copaxone (Glatopa was launched inmid-2015). This scenario results in Biogen's global MSpatient share of 49% by 2020.
Economic Moat
Biogen has achieved strong profitability on the success ofthree marketed products in the fields of oncology andneuroimmunology, and the introduction of Tecfidera securesthe firm's dominant share of the MS market. We thinkbarriers to entry for potential biosimilars to Biogen'sproducts are high, and Biogen has a strong R&D strategy
for maintaining its leadership in MS, where pricing poweris strong, patient need for novel therapies is high, and thepipeline has been particularly productive. These factorscontribute to the firm's wide moat. Returns on investedcapital, which we think will average above 20% during our10-year explicit forecast period, easily exceed our 7.5%estimate of Biogen's cost of capital.
Rituxan remains the standard of care in several forms ofhematological cancer, and Biogen's margins are boosted bycollaboration revenue received from partner Roche.Biogen's Avonex is the leading interferon therapy in MS,due to its long-term safety record and relatively convenientonce-weekly injections. Biogen's third drug, MS drugTysabri, is achieving blockbuster sales based on outstandingefficacy despite rare but serious side effects, and we thinkefforts to target the drug to patients least likely toexperience side effects will allow the firm to retain currentsales levels despite novel products with cleaner safetyprofiles. The rest of Biogen's MS pipeline is also strong; weexpect newly launched Tecfidera to achieve peak salesapproaching $5 billion globally, based on its convenient oraladministration and relatively strong efficacy and safetyprofile.
With the exception of Tecfidera, all of Biogen's currentblockbusters are biologics, and while biosimilar competitionis a looming threat, we think any erosion of sales of theseproducts would be slowed by the significant manufacturingand development costs that biosimilar makers are expectedto incur, limiting the number of competitors and their abilityto compete on price. Data quality may also be an issue withbiosimilars; the first application for an Avonex biosimilarwas rejected based on insufficient efficacy, and delays anddiscontinuations with Rituxan biosimilars have pushed backtheir potential launch dates in Europe. Tysabri is likely to bea lower-priority target for biosimilar entrants, given the riskmonitoring and potentially serious side effects in certainpatients.
Page 3 of 22

Morningstar Equity Research
© Morningstar 2016. All Rights Reserved. Unless otherwise provided in a separate agreement, you may use this report only in the country in which its original distributor is based. The information, data, analyses and opinions presented herein do not constituteinvestment advice; are provided solely for informational purposes and therefore are not an offer to buy or sell a security; and are not warranted to be correct, complete or accurate. The opinions expressed are as of the date written and are subject to change withoutnotice. Except as otherwise required by law, Morningstar shall not be responsible for any trading decisions, damages or other losses resulting from, or related to, the information, data, analyses or opinions or their use. The information contained herein is theproprietary property of Morningstar and may not be reproduced, in whole or in part, or used in any manner, without the prior written consent of Morningstar. To order reprints, call +1 312-696-6100. To license the research, call +1 312-696-6869. Please see importantdisclosures at the end of this report.
Last Price Fair Value Consider Buy Consider Sell Uncertainty Economic Moat™ Moat Trend™ Stewardship Industry Group
273.27 USD 400.00 USD 280.00 USD 540.00 USD Medium Wide Stable Standard Biotechnology
Biogen Inc BIIB (NAS) | QQQQQ
Moat Trend
We see Biogen's moat trend as stable, as we think newcompetition for established drugs should be offset by theintroduction of new products from the firm's growinglate-stage pipeline.
Competition and pricing pressure in MS and oncology areincreasing. We think strong efficacy of oral MS therapies(Biogen’s Tecfidera and Novartis’ Gilenya) and injectabletherapies (Roche is poised to launch ocrelizumab in late2016) is making it less likely that new patients will start onolder injectables like Avonex or Tysabri. In addition, payershave more leverage in pricing negotiations, and while weassume that Biogen has been able to take Avonex priceincreases of roughly 10% annually on a net basis over thepast several years in the U.S., we think future price changesin the U.S. are likely to be flat to negative. Biogen’s recentlylaunched, more convenient interferon therapy Plegridyshould do little to change this trend, in our opinion, and wedon’t model growth for combined Avonex/Plegridy or forTysabri going forward. In addition, Biogen's reportedrevenue for cancer therapy Rituxan is maturing as its patentexpiration in the U.S. (2018) draws closer.
However, we think Biogen’s pipeline will allow the firm tomaintain MS and oncology sales. Roche plans to file forapproval of novel and effective antibody therapyocrelizumab in 2016, in both relapsing MS (where Biogencompetes) and primary progressive MS (where there are noapproved treatments and little off-label use of Biogen’scurrent drugs). While we noted that this adds to thecompetitive landscape, it also benefits Biogen, due to theroughly 20% royalty on U.S. sales (the U.S. is two thirds ofthe global $20 billion MS market) and exposure to the newPPMS indication. Biogen’s anti-LINGO drug candidate(generating phase 2 data in mid-2016) is a key part of itsMS pipeline; the drug could help repair the myelin sheath
that coats neurons, giving it a novel mechanism of actionand the potential to allow patients to regain lost function.In oncology, we expect Biogen and partner Roche to extendoncology profit streams through subcutaneous Rituxan andalso next-generation drug Gazyva, which has launched inleukemia as a product with a superior efficacy profile toRituxan, and is beginning to generate strong data in thelarge lymphoma market.
While individual odds of approval are mixed, we’re bullishon Biogen’s novel, broader neurology and rare diseasepipeline, which includes several products with high risk buthigh reward prospects. The firm recently launched twolong-acting hemophilia drugs, Eloctate and Alprolix,marking the firm's entry into this rare-disease market. Spinalmuscular atrophy drug nusinersen should have phase 3 datain 2017, and the lack of treatment options for this rare,deadly disease could create a $1 billion-plus market. Biogenhas the broadest exposure to Alzheimer’s of the large drugfirms, with two lead beta-amyloid antibodies (from Eisai andNeurimmune), and a BACE inhibitor (Eisai). The initial datafor aducanumab—now in phase 3 trials—was impressiveenough that it could be clinically significant if replicated inphase 3, and we think ARIA-E (edema) side effects will bemanageable. We assign a 50% probability of approval toaducanumab, with probability-weighted sales of more than$3 billion by 2024. Overall, we think Biogen’s Alzheimer’sdrugs could see $6 billion in sales by 2024, with Biogenrecognizing half of these economics.
Page 4 of 22
Morningstar Equity Research
© Morningstar 2016. All Rights Reserved. Unless otherwise provided in a separate agreement, you may use this report only in the country in which its original distributor is based. The information, data, analyses and opinions presented herein do not constituteinvestment advice; are provided solely for informational purposes and therefore are not an offer to buy or sell a security; and are not warranted to be correct, complete or accurate. The opinions expressed are as of the date written and are subject to change withoutnotice. Except as otherwise required by law, Morningstar shall not be responsible for any trading decisions, damages or other losses resulting from, or related to, the information, data, analyses or opinions or their use. The information contained herein is theproprietary property of Morningstar and may not be reproduced, in whole or in part, or used in any manner, without the prior written consent of Morningstar. To order reprints, call +1 312-696-6100. To license the research, call +1 312-696-6869. Please see importantdisclosures at the end of this report.
Last Price Fair Value Consider Buy Consider Sell Uncertainty Economic Moat™ Moat Trend™ Stewardship Industry Group
273.27 USD 400.00 USD 280.00 USD 540.00 USD Medium Wide Stable Standard Biotechnology
Biogen Inc BIIB (NAS) | QQQQQ
Bulls Say/Bears Say
Bulls Say Bears Say
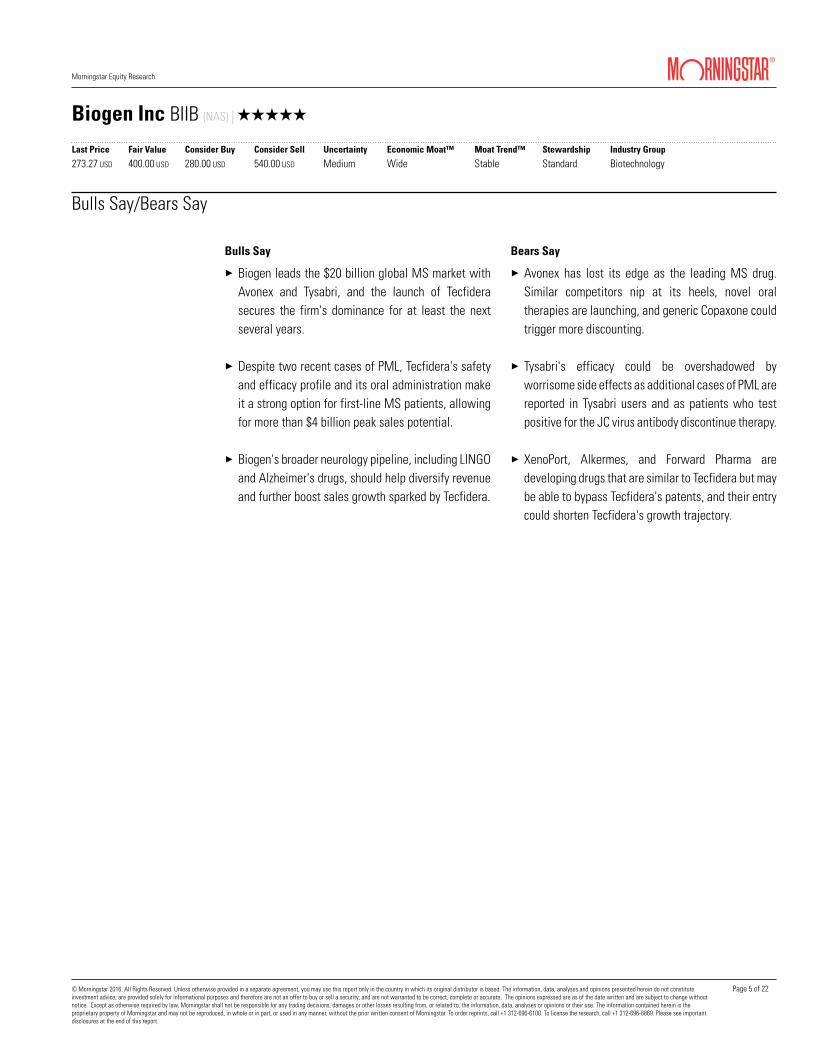
3 Biogen leads the $20 billion global MS market withAvonex and Tysabri, and the launch of Tecfiderasecures the firm's dominance for at least the nextseveral years.
3 Despite two recent cases of PML, Tecfidera's safetyand efficacy profile and its oral administration makeit a strong option for first-line MS patients, allowingfor more than $4 billion peak sales potential.
3 Biogen's broader neurology pipeline, including LINGOand Alzheimer's drugs, should help diversify revenueand further boost sales growth sparked by Tecfidera.
3 Avonex has lost its edge as the leading MS drug.Similar competitors nip at its heels, novel oraltherapies are launching, and generic Copaxone couldtrigger more discounting.
3 Tysabri's efficacy could be overshadowed byworrisome side effects as additional cases of PML arereported in Tysabri users and as patients who testpositive for the JC virus antibody discontinue therapy.
3 XenoPort, Alkermes, and Forward Pharma aredeveloping drugs that are similar to Tecfidera but maybe able to bypass Tecfidera's patents, and their entrycould shorten Tecfidera's growth trajectory.
Page 5 of 22
Morningstar Equity Research
© Morningstar 2016. All Rights Reserved. Unless otherwise provided in a separate agreement, you may use this report only in the country in which its original distributor is based. The information, data, analyses and opinions presented herein do not constituteinvestment advice; are provided solely for informational purposes and therefore are not an offer to buy or sell a security; and are not warranted to be correct, complete or accurate. The opinions expressed are as of the date written and are subject to change withoutnotice. Except as otherwise required by law, Morningstar shall not be responsible for any trading decisions, damages or other losses resulting from, or related to, the information, data, analyses or opinions or their use. The information contained herein is theproprietary property of Morningstar and may not be reproduced, in whole or in part, or used in any manner, without the prior written consent of Morningstar. To order reprints, call +1 312-696-6100. To license the research, call +1 312-696-6869. Please see importantdisclosures at the end of this report.
Last Price Fair Value Consider Buy Consider Sell Uncertainty Economic Moat™ Moat Trend™ Stewardship Industry Group
273.27 USD 400.00 USD 280.00 USD 540.00 USD Medium Wide Stable Standard Biotechnology
Biogen Inc BIIB (NAS) | QQQQQ
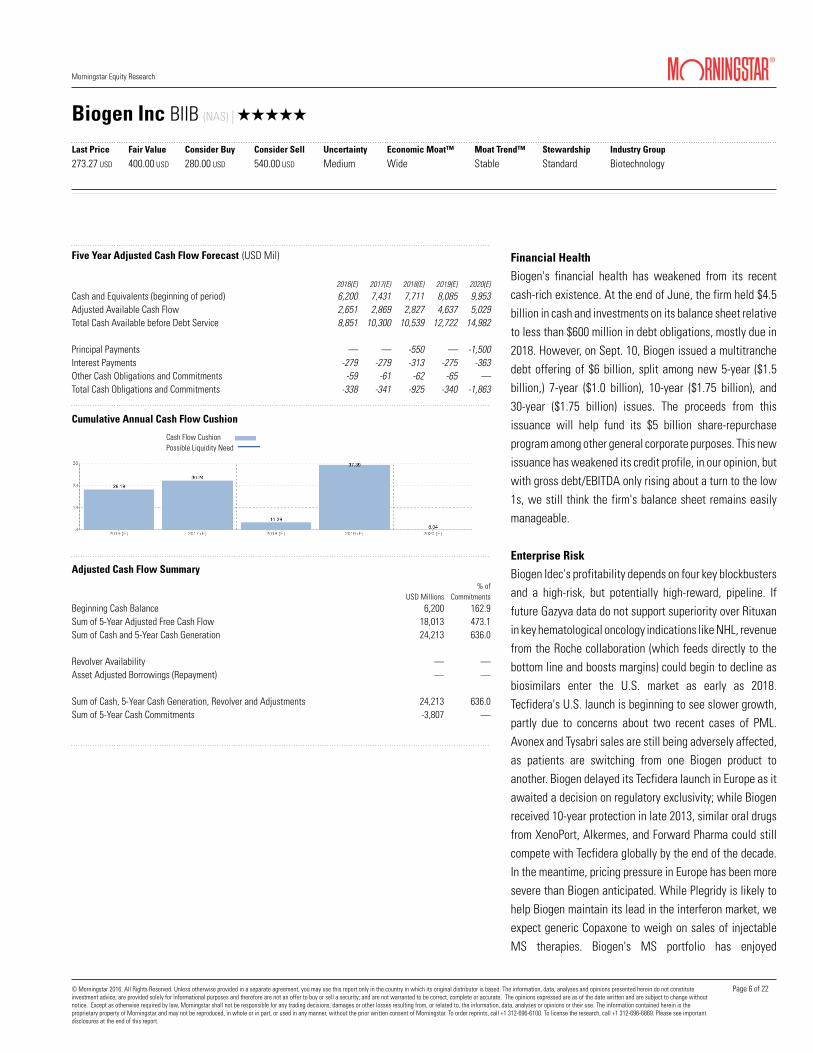
2016(E) 2017(E) 2018(E) 2019(E) 2020(E)
Cash and Equivalents (beginning of period) 6,200 7,431 7,711 8,085 9,953Adjusted Available Cash Flow 2,651 2,869 2,827 4,637 5,029Total Cash Available before Debt Service 8,851 10,300 10,539 12,722 14,982
Principal Payments — — -550 — -1,500Interest Payments -279 -279 -313 -275 -363Other Cash Obligations and Commitments -59 -61 -62 -65 —Total Cash Obligations and Commitments -338 -341 -925 -340 -1,863
USD Millions% of
Commitments
Beginning Cash Balance 6,200 162.9Sum of 5-Year Adjusted Free Cash Flow 18,013 473.1Sum of Cash and 5-Year Cash Generation 24,213 636.0
Revolver Availability — —Asset Adjusted Borrowings (Repayment) — —
Sum of Cash, 5-Year Cash Generation, Revolver and Adjustments 24,213 636.0Sum of 5-Year Cash Commitments -3,807 —
Five Year Adjusted Cash Flow Forecast (USD Mil)
Cumulative Annual Cash Flow Cushion
Cash Flow CushionPossible Liquidity Need
Adjusted Cash Flow Summary
Financial Health
Biogen's financial health has weakened from its recentcash-rich existence. At the end of June, the firm held $4.5billion in cash and investments on its balance sheet relativeto less than $600 million in debt obligations, mostly due in2018. However, on Sept. 10, Biogen issued a multitranchedebt offering of $6 billion, split among new 5-year ($1.5billion,) 7-year ($1.0 billion), 10-year ($1.75 billion), and30-year ($1.75 billion) issues. The proceeds from thisissuance will help fund its $5 billion share-repurchaseprogram among other general corporate purposes. This newissuance has weakened its credit profile, in our opinion, butwith gross debt/EBITDA only rising about a turn to the low1s, we still think the firm's balance sheet remains easilymanageable.
Enterprise Risk
Biogen Idec's profitability depends on four key blockbustersand a high-risk, but potentially high-reward, pipeline. Iffuture Gazyva data do not support superiority over Rituxanin key hematological oncology indications like NHL, revenuefrom the Roche collaboration (which feeds directly to thebottom line and boosts margins) could begin to decline asbiosimilars enter the U.S. market as early as 2018.Tecfidera's U.S. launch is beginning to see slower growth,partly due to concerns about two recent cases of PML.Avonex and Tysabri sales are still being adversely affected,as patients are switching from one Biogen product toanother. Biogen delayed its Tecfidera launch in Europe as itawaited a decision on regulatory exclusivity; while Biogenreceived 10-year protection in late 2013, similar oral drugsfrom XenoPort, Alkermes, and Forward Pharma could stillcompete with Tecfidera globally by the end of the decade.In the meantime, pricing pressure in Europe has been moresevere than Biogen anticipated. While Plegridy is likely tohelp Biogen maintain its lead in the interferon market, weexpect generic Copaxone to weigh on sales of injectableMS therapies. Biogen's MS portfolio has enjoyed
Page 6 of 22
Morningstar Equity Research
© Morningstar 2016. All Rights Reserved. Unless otherwise provided in a separate agreement, you may use this report only in the country in which its original distributor is based. The information, data, analyses and opinions presented herein do not constituteinvestment advice; are provided solely for informational purposes and therefore are not an offer to buy or sell a security; and are not warranted to be correct, complete or accurate. The opinions expressed are as of the date written and are subject to change withoutnotice. Except as otherwise required by law, Morningstar shall not be responsible for any trading decisions, damages or other losses resulting from, or related to, the information, data, analyses or opinions or their use. The information contained herein is theproprietary property of Morningstar and may not be reproduced, in whole or in part, or used in any manner, without the prior written consent of Morningstar. To order reprints, call +1 312-696-6100. To license the research, call +1 312-696-6869. Please see importantdisclosures at the end of this report.
Last Price Fair Value Consider Buy Consider Sell Uncertainty Economic Moat™ Moat Trend™ Stewardship Industry Group
273.27 USD 400.00 USD 280.00 USD 540.00 USD Medium Wide Stable Standard Biotechnology
Biogen Inc BIIB (NAS) | QQQQQ
tremendous pricing power in the United States, and insurerscould begin to find ways to put pressure on future priceincreases as more competitors reach the market (Avonexand Plegridy are excluded from the CVS national formularyfor 2016).
Page 7 of 22
Morningstar Equity Research
© Morningstar 2016. All Rights Reserved. Unless otherwise provided in a separate agreement, you may use this report only in the country in which its original distributor is based. The information, data, analyses and opinions presented herein do not constituteinvestment advice; are provided solely for informational purposes and therefore are not an offer to buy or sell a security; and are not warranted to be correct, complete or accurate. The opinions expressed are as of the date written and are subject to change withoutnotice. Except as otherwise required by law, Morningstar shall not be responsible for any trading decisions, damages or other losses resulting from, or related to, the information, data, analyses or opinions or their use. The information contained herein is theproprietary property of Morningstar and may not be reproduced, in whole or in part, or used in any manner, without the prior written consent of Morningstar. To order reprints, call +1 312-696-6100. To license the research, call +1 312-696-6869. Please see importantdisclosures at the end of this report.
Last Price Fair Value Consider Buy Consider Sell Uncertainty Economic Moat™ Moat Trend™ Stewardship Industry Group
273.27 USD 400.00 USD 280.00 USD 540.00 USD Medium Wide Stable Standard Biotechnology
Biogen Inc BIIB (NAS) | QQQQQ
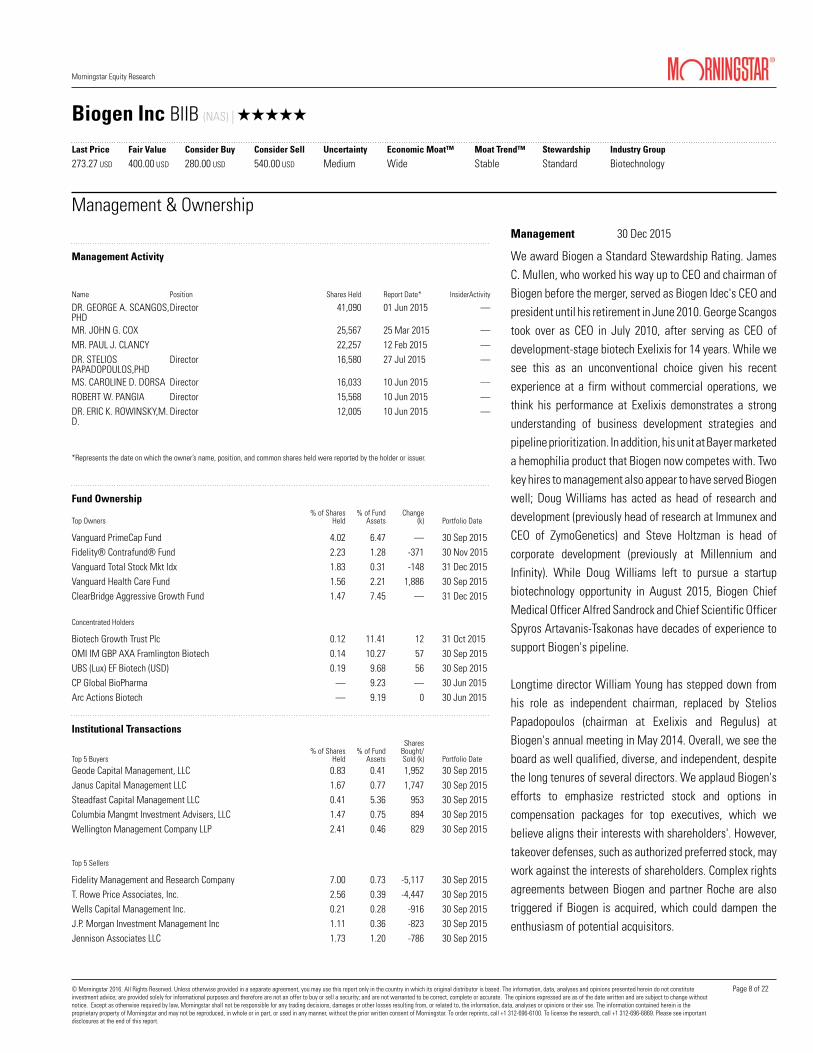
Name Position Shares Held Report Date* InsiderActivity
DR. GEORGE A. SCANGOS,PHD
Director 41,090 01 Jun 2015 —
MR. JOHN G. COX 25,567 25 Mar 2015 —MR. PAUL J. CLANCY 22,257 12 Feb 2015 —DR. STELIOSPAPADOPOULOS,PHD
Director 16,580 27 Jul 2015 —
MS. CAROLINE D. DORSA Director 16,033 10 Jun 2015 —ROBERT W. PANGIA Director 15,568 10 Jun 2015 —DR. ERIC K. ROWINSKY,M.D.
Director 12,005 10 Jun 2015 —
Top Owners% of Shares
Held% of Fund
AssetsChange
(k) Portfolio Date
Vanguard PrimeCap Fund 4.02 6.47 — 30 Sep 2015Fidelity® Contrafund® Fund 2.23 1.28 -371 30 Nov 2015Vanguard Total Stock Mkt Idx 1.83 0.31 -148 31 Dec 2015Vanguard Health Care Fund 1.56 2.21 1,886 30 Sep 2015ClearBridge Aggressive Growth Fund 1.47 7.45 — 31 Dec 2015
Concentrated Holders
Biotech Growth Trust Plc 0.12 11.41 12 31 Oct 2015OMI IM GBP AXA Framlington Biotech 0.14 10.27 57 30 Sep 2015UBS (Lux) EF Biotech (USD) 0.19 9.68 56 30 Sep 2015CP Global BioPharma — 9.23 — 30 Jun 2015Arc Actions Biotech — 9.19 0 30 Jun 2015
Top 5 Buyers% of Shares
Held% of Fund
Assets
SharesBought/Sold (k) Portfolio Date
Geode Capital Management, LLC 0.83 0.41 1,952 30 Sep 2015Janus Capital Management LLC 1.67 0.77 1,747 30 Sep 2015Steadfast Capital Management LLC 0.41 5.36 953 30 Sep 2015Columbia Mangmt Investment Advisers, LLC 1.47 0.75 894 30 Sep 2015Wellington Management Company LLP 2.41 0.46 829 30 Sep 2015
Top 5 Sellers
Fidelity Management and Research Company 7.00 0.73 -5,117 30 Sep 2015T. Rowe Price Associates, Inc. 2.56 0.39 -4,447 30 Sep 2015Wells Capital Management Inc. 0.21 0.28 -916 30 Sep 2015J.P. Morgan Investment Management Inc 1.11 0.36 -823 30 Sep 2015Jennison Associates LLC 1.73 1.20 -786 30 Sep 2015
Management 30 Dec 2015
Management & Ownership
Management Activity
Fund Ownership
Institutional Transactions
*Represents the date on which the owner’s name, position, and common shares held were reported by the holder or issuer.
We award Biogen a Standard Stewardship Rating. JamesC. Mullen, who worked his way up to CEO and chairman ofBiogen before the merger, served as Biogen Idec's CEO andpresident until his retirement in June 2010. George Scangostook over as CEO in July 2010, after serving as CEO ofdevelopment-stage biotech Exelixis for 14 years. While wesee this as an unconventional choice given his recentexperience at a firm without commercial operations, wethink his performance at Exelixis demonstrates a strongunderstanding of business development strategies andpipeline prioritization. In addition, his unit at Bayer marketeda hemophilia product that Biogen now competes with. Twokey hires to management also appear to have served Biogenwell; Doug Williams has acted as head of research anddevelopment (previously head of research at Immunex andCEO of ZymoGenetics) and Steve Holtzman is head ofcorporate development (previously at Millennium andInfinity). While Doug Williams left to pursue a startupbiotechnology opportunity in August 2015, Biogen ChiefMedical Officer Alfred Sandrock and Chief Scientific OfficerSpyros Artavanis-Tsakonas have decades of experience tosupport Biogen's pipeline.
Longtime director William Young has stepped down fromhis role as independent chairman, replaced by SteliosPapadopoulos (chairman at Exelixis and Regulus) atBiogen's annual meeting in May 2014. Overall, we see theboard as well qualified, diverse, and independent, despitethe long tenures of several directors. We applaud Biogen'sefforts to emphasize restricted stock and options incompensation packages for top executives, which webelieve aligns their interests with shareholders'. However,takeover defenses, such as authorized preferred stock, maywork against the interests of shareholders. Complex rightsagreements between Biogen and partner Roche are alsotriggered if Biogen is acquired, which could dampen theenthusiasm of potential acquisitors.
Page 8 of 22
Morningstar Equity Research
© Morningstar 2016. All Rights Reserved. Unless otherwise provided in a separate agreement, you may use this report only in the country in which its original distributor is based. The information, data, analyses and opinions presented herein do not constituteinvestment advice; are provided solely for informational purposes and therefore are not an offer to buy or sell a security; and are not warranted to be correct, complete or accurate. The opinions expressed are as of the date written and are subject to change withoutnotice. Except as otherwise required by law, Morningstar shall not be responsible for any trading decisions, damages or other losses resulting from, or related to, the information, data, analyses or opinions or their use. The information contained herein is theproprietary property of Morningstar and may not be reproduced, in whole or in part, or used in any manner, without the prior written consent of Morningstar. To order reprints, call +1 312-696-6100. To license the research, call +1 312-696-6869. Please see importantdisclosures at the end of this report.
Last Price Fair Value Consider Buy Consider Sell Uncertainty Economic Moat™ Moat Trend™ Stewardship Industry Group
273.27 USD 400.00 USD 280.00 USD 540.00 USD Medium Wide Stable Standard Biotechnology
Biogen Inc BIIB (NAS) | QQQQQ
Analyst Notes
Biogen's Tecfidera Strength Boosts Q4 Results:
Maintaining FVE Ahead of Key 2016 Pipeline Data 27 Jan
2016
Biogen reported fourth-quarter results that were ahead ofour expectations on the top and bottom line, largely owingto Tecfidera’s strong 8% global growth in the fourth quarter.However, our forecast of $11.3 billion in revenue and $18.40non-GAAP EPS for 2016 is in line with the firm’s guidance($11.1 billion-$11.3 billion and $18.30-$18.60, respectively),and we’re making no significant changes to our $400 fairvalue estimate. Shares of this wide-moat biotech remainsignificantly undervalued, and the firm’s dominance in thefield of MS and innovative research and developmentstrategy in neurology provide it with long-term competitiveadvantages.
Biogen’s performance in 2015 hinged on Tecfidera, and wethink U.S. stabilization and European growth put Tecfideraon track to achieve our estimates. 2016 guidance stillimplies high-single-digit U.S. Tecfidera growth and low-double-digit international Tecfidera growth, driven largelyby demand. While Biogen did take a list price increase ofroughly 4% at the end of 2015, not all of this translates toa net price increase, and Biogen does not anticipate furtherprice increases for the remainder of the year.
Beyond Tecfidera, we expect Biogen shares will be drivenby business development and data readouts in 2016. Biogenhas completed its $5 billion share-buyback program, and wethink the firm wants to remain flexible with its $6.2 billioncash balance, given the biotech pullback and the potentialfor better partnering or acquisition terms. Biogen’s LINGOprogram in MS will have Phase II data in mid-2016 that weexpect to significantly boost the stock, if positive—wecurrently assume a 30% probability of approval, given themixed data in optic neuritis and the novelty of the target.Several data readouts in Alzheimer’s will affect Biogen aswell, and we think titration data from the Phase I PRIME
study of Biogen's leading Alzheimer's drug candidateaducanumab (second-half 2016) could alleviate side-effectconcerns.
As we discussed in our December Healthcare Observer,“Wide-Moat Firms in Alzheimer’s Disease,” we think themarket is undervaluing Biogen’s opportunity in this market,putting short-term Tecfidera uncertainty ahead of the long-term neurology promise of its pipeline. Data from the Eisaicollaboration in Alzheimer's—safety data for BACEinhibitor E2609 and safety and efficacy for beta amyloidantibody BAN2401—could come later this quarter. Whilewe still assign relatively low probabilities of approval tothese compounds, positive data for either program wouldlikely boost our estimates. Finally, we think the market tiesthe prospects of Biogen’s Alzheimer’s program together withthose of Lilly’s phase 3 solanezumab program, which shouldhave data by the end of the year. However, becauseaducanumab and solanezumab have very differentmechanisms of action, we would not expect to change ourBiogen valuation on this data.Cost Cuts Balance Tysabri Failure in Our Biogen
Valuation; Current Price Doesn't Value Pipeline 21 Oct
2015
Biogen’s cost-cutting plans and heavy share repurchases atdiscounted prices counter the impact of Tysabri’s failure insecondary progressive multiple sclerosis and thediscontinuation of early programs in immunology andfibrosis on our valuation, and we’re maintaining our $400fair value estimate. Biogen is facing near-term weakness inits current MS franchise, with growth from Tecfidera andocrelizumab (Biogen sees roughly 20% royalties from Rocheon U.S. sales) likely to be weighed down by interferon andTysabri declines. However, we still think the firm is capableof 6% average top-line growth and 11% average bottom-line growth over the next five years.
While threats to Biogen’s older products are well-known,
Page 9 of 22
Morningstar Equity Research
© Morningstar 2016. All Rights Reserved. Unless otherwise provided in a separate agreement, you may use this report only in the country in which its original distributor is based. The information, data, analyses and opinions presented herein do not constituteinvestment advice; are provided solely for informational purposes and therefore are not an offer to buy or sell a security; and are not warranted to be correct, complete or accurate. The opinions expressed are as of the date written and are subject to change withoutnotice. Except as otherwise required by law, Morningstar shall not be responsible for any trading decisions, damages or other losses resulting from, or related to, the information, data, analyses or opinions or their use. The information contained herein is theproprietary property of Morningstar and may not be reproduced, in whole or in part, or used in any manner, without the prior written consent of Morningstar. To order reprints, call +1 312-696-6100. To license the research, call +1 312-696-6869. Please see importantdisclosures at the end of this report.
Last Price Fair Value Consider Buy Consider Sell Uncertainty Economic Moat™ Moat Trend™ Stewardship Industry Group
273.27 USD 400.00 USD 280.00 USD 540.00 USD Medium Wide Stable Standard Biotechnology
Biogen Inc BIIB (NAS) | QQQQQ
Analyst Notes
we think the market doesn’t assign enough value to Biogen’spipeline, and we’re encouraged that management is furtherfocusing on its competitive advantages and wide moat inneurology with the new restructuring plan. While eachindividual neurology program has risk, we think this strategysupports Biogen’s ability to demonstrate value. The Lingoprogram could be among Biogen's biggest opportunities(data mid-2016 in MS), but we're most bullish on Biogen’spartnership with Isis (a spinal muscular atrophy programshould have data in late 2016), and the Neurimmunecollaboration in Alzheimer's/Parkinson's (aducanumab isnow in phase 3 trials in Alzheimer’s). We think the recentdeal for MT-1303 could allow Biogen to not only hedgeagainst threats to its MS franchise, but to also expand intonew indications.
We’re increasing our top- and bottom-line expectations for2015 and remain at the high end of new guidance, as weassume 9% revenue growth and non-GAAP EPS of $16.53(new range from $16.20-$16.50, up from $15.50-$15.95).Biogen has repurchased 13 million shares of its stock in2015, and at an average price of $300 per share, this lookslike a smart use of cash. Biogen’s recent $6 billion debt raisealso adds cash that could be put toward acquisitions.
Diving deeper into Biogen's MS portfolio, Tecfidera has thebest prospects for growth through 2019, and we thinkBiogen’s new advertising campaigns could draw morepatients to therapy. In addition, Roche’s positiveocrelizumab data looks neutral to Biogen’s earningsprospects, as royalties will go directly to the firm’s bottomline. We think rapid uptake in primary progressive diseasewill have minimal impact on sales of Biogen’s therapies (notapproved or heavily used off-label in this indication), anduptake among relapsing MS patients—Biogen’s focus—will be slower. Tysabri could be the hardest hit by Roche’socrelizumab launch (expected in late 2016), particularlygiven its failure in secondary progressive MS; we currently
assume slow but steady Tysabri declines as current patientsremain on therapy but fewer patients initiate treatment.Interferon sales are poised to decline; combined sales ofBiogen’s interferon therapies Avonex and Plegridy grew 5%to $785 million in the quarter, true growth (after accountingfor foreign-exchange headwinds, and stocking and ordertiming tailwinds), was closer to 1%.Pricing Concerns in Pharma and Biotech Industries
Creates Some Buying Opportunities 29 Sep 2015
The pharma and biotech sectors have recently facedsignificant market weakness, largely because of recentheadlines about price-gouging, strong policy positions frompresidential candidates, notably Hillary Clinton, andcongressional investigations into drug pricing. Overall, thisechoes a previous industry sell-off in the spring of 2014when some members of Congress questioned the pricing ofGilead’s Sovaldi. Valeant Pharmaceuticals received querieson Sept. 28 from politicians about the company’s drugpricing on a handful of recently acquired products. Whilecertain components of policy proposals span from highlyunlikely (mandating research and development levels atdrug developers) to possible (shortening the exclusivityperiod for biologics), our moat methodology, uncertaintyratings, debt ratings, and fair value estimates attempt tocapture a particular company’s risks to a variety of issuesbeyond drug pricing. Based on current information, we don’tsee any particular reason to adjust our fair value estimatesfor the drug companies we cover at this time. Lawsuits,changes to Medicare pricing, new tax rules, or other policysuggestions remain mostly speculative at this point, and inour view the pullback has created some opportunities.
Merck remains our most undervalued Big Pharma idea,because we believe the company’s immuno-oncologyfranchise is underappreciated and the current valuationalready appears to have taken into account the competitivethreats to its top drug Januvia from the SGLT2 class.
Page 10 of 22
Morningstar Equity Research
© Morningstar 2016. All Rights Reserved. Unless otherwise provided in a separate agreement, you may use this report only in the country in which its original distributor is based. The information, data, analyses and opinions presented herein do not constituteinvestment advice; are provided solely for informational purposes and therefore are not an offer to buy or sell a security; and are not warranted to be correct, complete or accurate. The opinions expressed are as of the date written and are subject to change withoutnotice. Except as otherwise required by law, Morningstar shall not be responsible for any trading decisions, damages or other losses resulting from, or related to, the information, data, analyses or opinions or their use. The information contained herein is theproprietary property of Morningstar and may not be reproduced, in whole or in part, or used in any manner, without the prior written consent of Morningstar. To order reprints, call +1 312-696-6100. To license the research, call +1 312-696-6869. Please see importantdisclosures at the end of this report.
Last Price Fair Value Consider Buy Consider Sell Uncertainty Economic Moat™ Moat Trend™ Stewardship Industry Group
273.27 USD 400.00 USD 280.00 USD 540.00 USD Medium Wide Stable Standard Biotechnology
Biogen Inc BIIB (NAS) | QQQQQ
Analyst Notes
Our favorite names in biotech remain wide-moat Amgen andBiogen (both on our Best Ideas list) because of theirdiversified portfolios and innovative pipelines. In addition,narrow-moat Biomarin, which has sold off particularly hard,probably because of its high-priced drugs, is an attractivevalue since it is still well-protected from competition in therare-disease space and has a compelling pipeline.
Page 11 of 22
Morningstar Equity Research
© Morningstar 2016. All Rights Reserved. Unless otherwise provided in a separate agreement, you may use this report only in the country in which its original distributor is based. The information, data, analyses and opinions presented herein do not constituteinvestment advice; are provided solely for informational purposes and therefore are not an offer to buy or sell a security; and are not warranted to be correct, complete or accurate. The opinions expressed are as of the date written and are subject to change withoutnotice. Except as otherwise required by law, Morningstar shall not be responsible for any trading decisions, damages or other losses resulting from, or related to, the information, data, analyses or opinions or their use. The information contained herein is theproprietary property of Morningstar and may not be reproduced, in whole or in part, or used in any manner, without the prior written consent of Morningstar. To order reprints, call +1 312-696-6100. To license the research, call +1 312-696-6869. Please see importantdisclosures at the end of this report.
Last Price Fair Value Consider Buy Consider Sell Uncertainty Economic Moat™ Moat Trend™ Stewardship Industry Group
273.27 USD 400.00 USD 280.00 USD 540.00 USD Medium Wide Stable Standard Biotechnology
Biogen Inc BIIB (NAS) | QQQQQ
Growth (% YoY)3-Year
Hist. CAGR 2013 2014 2015 2016 20175-Year
Proj. CAGR
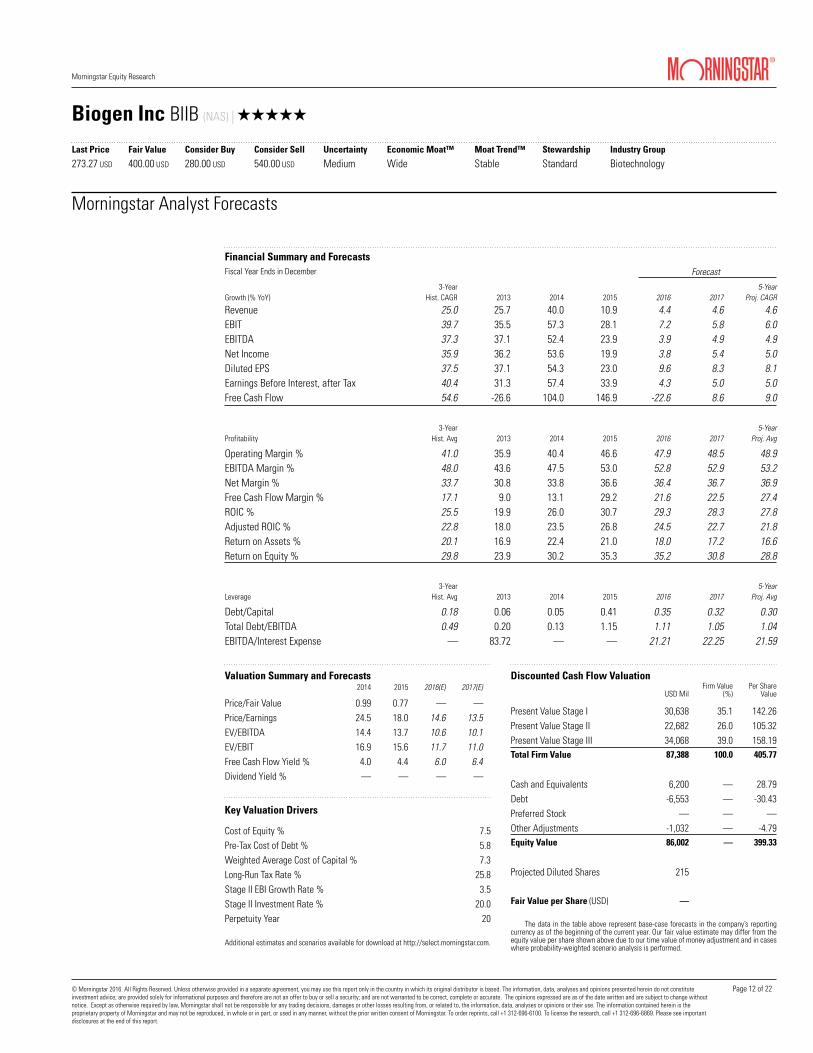
Revenue 25.0 25.7 40.0 10.9 4.4 4.6 4.6EBIT 39.7 35.5 57.3 28.1 7.2 5.8 6.0EBITDA 37.3 37.1 52.4 23.9 3.9 4.9 4.9Net Income 35.9 36.2 53.6 19.9 3.8 5.4 5.0Diluted EPS 37.5 37.1 54.3 23.0 9.6 8.3 8.1Earnings Before Interest, after Tax 40.4 31.3 57.4 33.9 4.3 5.0 5.0Free Cash Flow 54.6 -26.6 104.0 146.9 -22.6 8.6 9.0
Profitability3-Year
Hist. Avg 2013 2014 2015 2016 20175-Year
Proj. Avg
Operating Margin % 41.0 35.9 40.4 46.6 47.9 48.5 48.9EBITDA Margin % 48.0 43.6 47.5 53.0 52.8 52.9 53.2Net Margin % 33.7 30.8 33.8 36.6 36.4 36.7 36.9Free Cash Flow Margin % 17.1 9.0 13.1 29.2 21.6 22.5 27.4ROIC % 25.5 19.9 26.0 30.7 29.3 28.3 27.8Adjusted ROIC % 22.8 18.0 23.5 26.8 24.5 22.7 21.8Return on Assets % 20.1 16.9 22.4 21.0 18.0 17.2 16.6Return on Equity % 29.8 23.9 30.2 35.3 35.2 30.8 28.8
Leverage3-Year
Hist. Avg 2013 2014 2015 2016 20175-Year
Proj. Avg
Debt/Capital 0.18 0.06 0.05 0.41 0.35 0.32 0.30Total Debt/EBITDA 0.49 0.20 0.13 1.15 1.11 1.05 1.04EBITDA/Interest Expense — 83.72 — — 21.21 22.25 21.59
2014 2015 2016(E) 2017(E)
Price/Fair Value 0.99 0.77 — —Price/Earnings 24.5 18.0 14.6 13.5EV/EBITDA 14.4 13.7 10.6 10.1EV/EBIT 16.9 15.6 11.7 11.0Free Cash Flow Yield % 4.0 4.4 6.0 6.4Dividend Yield % — — — —
Cost of Equity % 7.5Pre-Tax Cost of Debt % 5.8Weighted Average Cost of Capital % 7.3Long-Run Tax Rate % 25.8Stage II EBI Growth Rate % 3.5Stage II Investment Rate % 20.0Perpetuity Year 20
USD MilFirm Value
(%)Per Share
Value
Present Value Stage I 30,638 35.1 142.26Present Value Stage II 22,682 26.0 105.32Present Value Stage III 34,068 39.0 158.19Total Firm Value 87,388 100.0 405.77
Cash and Equivalents 6,200 — 28.79Debt -6,553 — -30.43Preferred Stock — — —Other Adjustments -1,032 — -4.79Equity Value 86,002 — 399.33
Projected Diluted Shares 215
Fair Value per Share —
Morningstar Analyst Forecasts
ForecastFiscal Year Ends in December
Financial Summary and Forecasts
Valuation Summary and Forecasts
Key Valuation Drivers
Discounted Cash Flow Valuation
Additional estimates and scenarios available for download at http://select.morningstar.com.
The data in the table above represent base-case forecasts in the company’s reportingcurrency as of the beginning of the current year. Our fair value estimate may differ from theequity value per share shown above due to our time value of money adjustment and in caseswhere probability-weighted scenario analysis is performed.
(USD)
Page 12 of 22
Morningstar Equity Research
© Morningstar 2016. All Rights Reserved. Unless otherwise provided in a separate agreement, you may use this report only in the country in which its original distributor is based. The information, data, analyses and opinions presented herein do not constituteinvestment advice; are provided solely for informational purposes and therefore are not an offer to buy or sell a security; and are not warranted to be correct, complete or accurate. The opinions expressed are as of the date written and are subject to change withoutnotice. Except as otherwise required by law, Morningstar shall not be responsible for any trading decisions, damages or other losses resulting from, or related to, the information, data, analyses or opinions or their use. The information contained herein is theproprietary property of Morningstar and may not be reproduced, in whole or in part, or used in any manner, without the prior written consent of Morningstar. To order reprints, call +1 312-696-6100. To license the research, call +1 312-696-6869. Please see importantdisclosures at the end of this report.
Last Price Fair Value Consider Buy Consider Sell Uncertainty Economic Moat™ Moat Trend™ Stewardship Industry Group
273.27 USD 400.00 USD 280.00 USD 540.00 USD Medium Wide Stable Standard Biotechnology
Biogen Inc BIIB (NAS) | QQQQQ
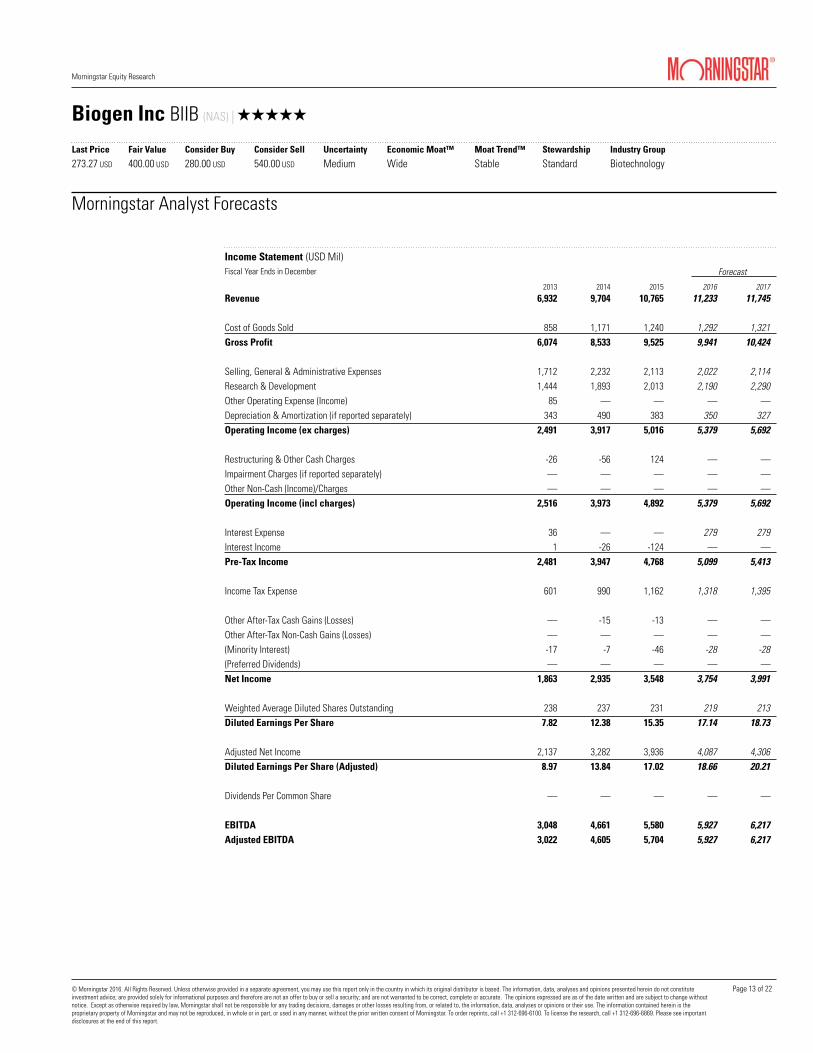
2013 2014 2015 2016 2017Revenue 6,932 9,704 10,765 11,233 11,745
Cost of Goods Sold 858 1,171 1,240 1,292 1,321Gross Profit 6,074 8,533 9,525 9,941 10,424
Selling, General & Administrative Expenses 1,712 2,232 2,113 2,022 2,114Research & Development 1,444 1,893 2,013 2,190 2,290Other Operating Expense (Income) 85 — — — —Depreciation & Amortization (if reported separately) 343 490 383 350 327Operating Income (ex charges) 2,491 3,917 5,016 5,379 5,692
Restructuring & Other Cash Charges -26 -56 124 — —Impairment Charges (if reported separately) — — — — —Other Non-Cash (Income)/Charges — — — — —Operating Income (incl charges) 2,516 3,973 4,892 5,379 5,692
Interest Expense 36 — — 279 279Interest Income 1 -26 -124 — —Pre-Tax Income 2,481 3,947 4,768 5,099 5,413
Income Tax Expense 601 990 1,162 1,318 1,395
Other After-Tax Cash Gains (Losses) — -15 -13 — —Other After-Tax Non-Cash Gains (Losses) — — — — —(Minority Interest) -17 -7 -46 -28 -28(Preferred Dividends) — — — — —Net Income 1,863 2,935 3,548 3,754 3,991
Weighted Average Diluted Shares Outstanding 238 237 231 219 213Diluted Earnings Per Share 7.82 12.38 15.35 17.14 18.73
Adjusted Net Income 2,137 3,282 3,936 4,087 4,306Diluted Earnings Per Share (Adjusted) 8.97 13.84 17.02 18.66 20.21
Dividends Per Common Share — — — — —
EBITDA 3,048 4,661 5,580 5,927 6,217Adjusted EBITDA 3,022 4,605 5,704 5,927 6,217
Morningstar Analyst Forecasts
Income Statement (USD Mil)Fiscal Year Ends in December Forecast
Page 13 of 22

Morningstar Equity Research
© Morningstar 2016. All Rights Reserved. Unless otherwise provided in a separate agreement, you may use this report only in the country in which its original distributor is based. The information, data, analyses and opinions presented herein do not constituteinvestment advice; are provided solely for informational purposes and therefore are not an offer to buy or sell a security; and are not warranted to be correct, complete or accurate. The opinions expressed are as of the date written and are subject to change withoutnotice. Except as otherwise required by law, Morningstar shall not be responsible for any trading decisions, damages or other losses resulting from, or related to, the information, data, analyses or opinions or their use. The information contained herein is theproprietary property of Morningstar and may not be reproduced, in whole or in part, or used in any manner, without the prior written consent of Morningstar. To order reprints, call +1 312-696-6100. To license the research, call +1 312-696-6869. Please see importantdisclosures at the end of this report.
Last Price Fair Value Consider Buy Consider Sell Uncertainty Economic Moat™ Moat Trend™ Stewardship Industry Group
273.27 USD 400.00 USD 280.00 USD 540.00 USD Medium Wide Stable Standard Biotechnology
Biogen Inc BIIB (NAS) | QQQQQ
2013 2014 2015 2016 2017
Cash and Equivalents 1,849 3,316 6,200 7,431 7,711Investments — — — — —Accounts Receivable 824 1,575 1,227 1,280 1,339Inventory 659 804 893 930 951Deferred Tax Assets (Current) — — — — —Other Short Term Assets 479 447 1,151 1,151 1,151Current Assets 3,811 6,142 9,471 10,792 11,152
Net Property Plant, and Equipment 1,751 1,766 2,188 2,790 3,402Goodwill 1,233 1,760 2,664 3,864 5,064Other Intangibles 4,475 4,029 4,085 3,735 3,408Deferred Tax Assets (Long-Term) — — — — —Other Long-Term Operating Assets 594 619 1,108 1,108 1,108Long-Term Non-Operating Assets — — — — —Total Assets 11,863 14,316 19,516 22,289 24,134
Accounts Payable 220 229 300 312 320Short-Term Debt 3 3 3 — 550Deferred Tax Liabilities (Current) — 168 300 300 300Other Short-Term Liabilities 1,535 1,819 2,000 2,000 2,000Current Liabilities 1,758 2,219 2,603 2,612 3,170
Long-Term Debt 592 582 6,550 6,550 6,000Deferred Tax Liabilities (Long-Term) 233 51 51 51 51Other Long-Term Operating Liabilities 659 650 1,030 1,030 1,030Long-Term Non-Operating Liabilities — — — — —Total Liabilities 3,242 3,502 10,234 10,243 10,251
Preferred Stock — — — — —Common Stock — — — — —Additional Paid-in Capital 4,024 4,196 4,196 4,196 4,196Retained Earnings (Deficit) 6,349 9,284 12,750 16,504 20,495(Treasury Stock) -1,725 -2,612 -7,600 -8,600 -10,753Other Equity -28 -59 -59 -59 -59Shareholder's Equity 8,620 10,809 9,287 12,041 13,879
Minority Interest 1 5 5 5 5Total Equity 8,621 10,814 9,292 12,046 13,884
Morningstar Analyst Forecasts
Balance Sheet (USD Mil)Fiscal Year Ends in December Forecast
Page 14 of 22

Morningstar Equity Research
© Morningstar 2016. All Rights Reserved. Unless otherwise provided in a separate agreement, you may use this report only in the country in which its original distributor is based. The information, data, analyses and opinions presented herein do not constituteinvestment advice; are provided solely for informational purposes and therefore are not an offer to buy or sell a security; and are not warranted to be correct, complete or accurate. The opinions expressed are as of the date written and are subject to change withoutnotice. Except as otherwise required by law, Morningstar shall not be responsible for any trading decisions, damages or other losses resulting from, or related to, the information, data, analyses or opinions or their use. The information contained herein is theproprietary property of Morningstar and may not be reproduced, in whole or in part, or used in any manner, without the prior written consent of Morningstar. To order reprints, call +1 312-696-6100. To license the research, call +1 312-696-6869. Please see importantdisclosures at the end of this report.
Last Price Fair Value Consider Buy Consider Sell Uncertainty Economic Moat™ Moat Trend™ Stewardship Industry Group
273.27 USD 400.00 USD 280.00 USD 540.00 USD Medium Wide Stable Standard Biotechnology
Biogen Inc BIIB (NAS) | QQQQQ
2013 2014 2015 2016 2017
Net Income 1,863 2,942 2,942 3,782 4,018
Depreciation 188 198 198 198 198Amortization 344 490 490 350 327Stock-Based Compensation 136 155 155 148 155Impairment of Goodwill — — — — —Impairment of Other Intangibles — — — — —Deferred Taxes -245 -308 — — —Other Non-Cash Adjustments -28 -50 — — —
(Increase) Decrease in Accounts Receivable -127 -512 — -53 -58(Increase) Decrease in Inventory -244 -186 — -37 -21Change in Other Short-Term Assets -160 -95 — — —Increase (Decrease) in Accounts Payable 284 244 — 12 7Change in Other Short-Term Liabilities 334 64 — — —Cash From Operations 2,346 2,942 3,785 4,400 4,626
(Capital Expenditures) -246 -288 -288 -800 -810Net (Acquisitions), Asset Sales, and Disposals -3,278 -375 -900 -1,200 -1,200Net Sales (Purchases) of Investments 7 -16 -16 — —Other Investing Cash Flows 1,912 -864 — — —Cash From Investing -1,605 -1,543 -1,204 -2,000 -2,010
Common Stock Issuance (or Repurchase) -334 -832 -4,000 -1,000 -2,153Common Stock (Dividends) — — — — —Short-Term Debt Issuance (or Retirement) — — — -3 550Long-Term Debt Issuance (or Retirement) -452 -3 -3 — -550Other Financing Cash Flows 69 78 78 -176 -183Cash From Financing -717 -757 -3,925 -1,179 -2,336
Exchange Rates, Discontinued Ops, etc. (net) 8 -41 -41 — —Net Change in Cash 33 601 -1,385 1,221 280
Morningstar Analyst Forecasts
Cash Flow (USD Mil)Fiscal Year Ends in December Forecast
Page 15 of 22

Morningstar Equity Research
© Morningstar 2016. All Rights Reserved. Unless otherwise provided in a separate agreement, you may use this report only in the country in which its original distributor is based. The information, data, analyses and opinions presented herein do not constituteinvestment advice; are provided solely for informational purposes and therefore are not an offer to buy or sell a security; and are not warranted to be correct, complete or accurate. The opinions expressed are as of the date written and are subject to change withoutnotice. Except as otherwise required by law, Morningstar shall not be responsible for any trading decisions, damages or other losses resulting from, or related to, the information, data, analyses or opinions or their use. The information contained herein is theproprietary property of Morningstar and may not be reproduced, in whole or in part, or used in any manner, without the prior written consent of Morningstar. To order reprints, call +1 312-696-6100. To license the research, call +1 312-696-6869. Please see importantdisclosures at the end of this report.
Last Price Fair Value Consider Buy Consider Sell Uncertainty Economic Moat™ Moat Trend™ Stewardship Industry Group
273.27 USD 400.00 USD 280.00 USD 540.00 USD Medium Wide Stable Standard Biotechnology
Biogen Inc BIIB (NAS) | QQQQQ
Company/TickerPrice/Fair
Value 2015 2016(E) 2017(E) 2015 2016(E) 2017(E) 2015 2016(E) 2017(E) 2015 2016(E) 2017(E) 2015 2016(E) 2017(E)
Roche Holding AG ROG CHE 0.82 20.5 17.2 15.5 12.2 11.2 10.3 19.5 20.1 17.6 10.9 8.1 6.5 4.8 4.2 3.9
Novartis AG NOVN CHE 0.81 17.6 15.8 15.0 15.0 12.5 12.1 21.6 14.7 15.4 2.7 2.3 2.4 4.1 3.6 3.5
Sanofi SA SAN FRA 0.75 13.1 12.7 12.2 9.5 9.3 8.9 21.4 16.1 15.1 1.7 1.7 1.6 2.5 2.5 2.4
Teva Pharmaceutical Industries Ltd 0.86 11.0 10.0 9.5 9.7 6.4 6.2 23.2 9.2 7.9 1.4 1.3 1.3 2.6 1.9 2.0
Average 15.6 13.9 13.1 11.6 9.9 9.4 21.4 15.0 14.0 4.2 3.4 3.0 3.5 3.1 3.0
Biogen Inc BIIB US 0.68 18.0 14.6 13.5 13.7 10.6 10.1 22.8 16.6 15.7 8.6 5.0 4.3 7.4 5.3 5.1
Company/TickerTotal Assets
(Mil) 2015 2016(E) 2017(E) 2015 2016(E) 2017(E) 2015 2016(E) 2017(E) 2015 2016(E) 2017(E) 2015 2016(E) 2017(E)Roche Holding AG ROG CHE 75,763 CHF 17.8 17.7 18.5 15.8 15.7 16.5 57.3 53.2 47.1 15.4 16.4 17.3 3.0 3.2 3.6
Novartis AG NOVN CHE 131,556 USD 15.6 15.4 17.3 10.9 10.8 12.0 24.1 10.5 11.7 13.8 6.1 6.8 3.2 3.8 3.9
Sanofi SA SAN FRA — EUR 9.9 10.1 11.3 20.8 20.9 23.3 8.6 9.5 10.3 5.1 5.7 6.4 3.9 3.9 4.1
Teva Pharmaceutical Industries Ltd — USD 24.7 23.3 16.9 13.2 12.8 9.4 6.7 8.6 10.5 3.8 4.3 4.5 2.3 2.9 3.0
Average 17.0 16.6 16.0 15.2 15.1 15.3 24.2 20.5 19.9 9.5 8.1 8.8 3.1 3.5 3.7
Biogen Inc BIIB US 19,516 USD 30.7 29.3 28.3 26.8 24.5 22.7 35.3 35.2 30.8 21.0 18.0 17.2 — — —
Company/TickerRevenue
(Mil) 2015 2016(E) 2017(E) 2015 2016(E) 2017(E) 2015 2016(E) 2017(E) 2015 2016(E) 2017(E) 2015 2016(E) 2017(E)Roche Holding AG ROG CHE 48,145 CHF 1.4 6.1 7.3 -0.5 5.1 8.9 -5.6 9.1 10.8 160.6 -2.4 12.6 2.5 1.4 10.8
Novartis AG NOVN CHE 50,387 USD -15.0 -3.1 3.2 -27.0 14.9 6.2 -4.4 -4.3 5.2 2.2 -6.0 -4.1 -1.2 1.0 5.2
Sanofi SA SAN FRA 37,582 EUR 10.2 0.2 3.8 9.2 9.2 10.5 6.3 2.6 4.5 7.0 37.1 4.2 1.1 2.6 4.5
Teva Pharmaceutical Industries Ltd 19,579 USD -3.4 34.2 -3.6 13.7 28.2 5.2 7.4 9.9 5.8 -105.8 NM -121.2 0.3 5.0 5.0
Average -1.7 9.4 2.7 -1.2 14.4 7.7 0.9 4.3 6.6 16.0 9.6 -27.1 0.7 2.5 6.4
Biogen Inc BIIB US 10,765 USD 10.9 4.4 4.6 28.1 7.2 5.8 23.0 9.6 8.3 146.9 -22.6 8.6 — — —
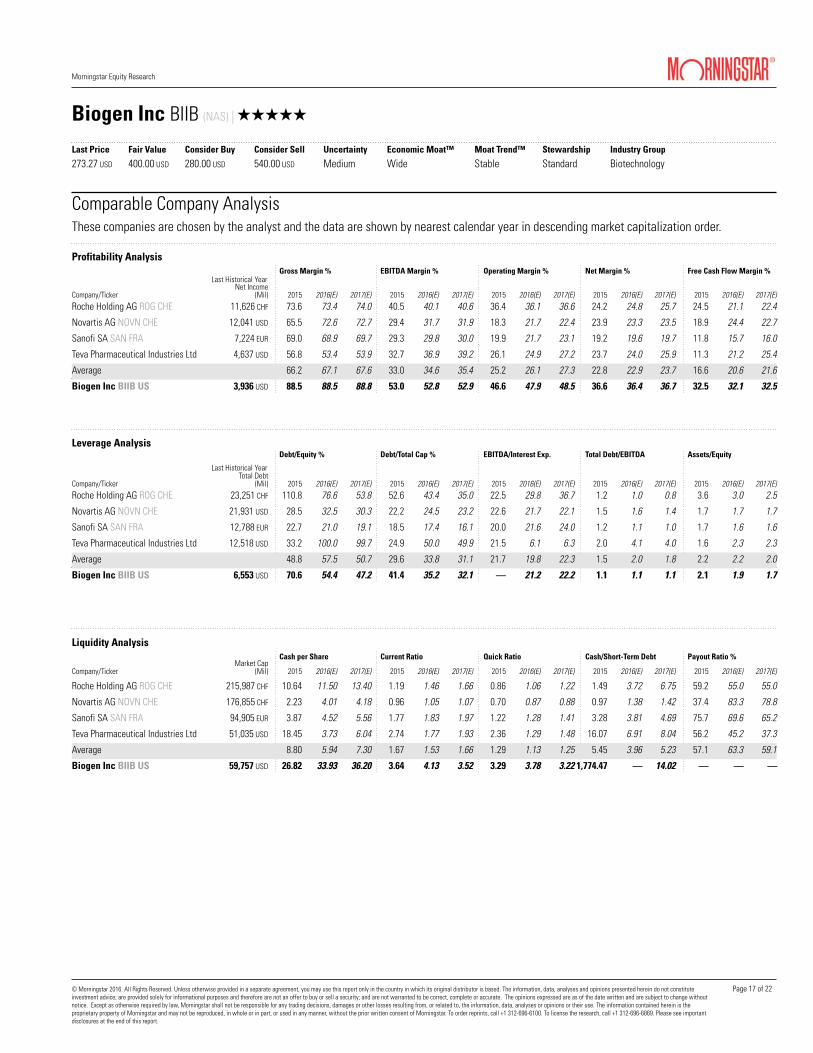
Comparable Company AnalysisThese companies are chosen by the analyst and the data are shown by nearest calendar year in descending market capitalization order.
Valuation Analysis
Returns Analysis
Growth Analysis
Price/Earnings EV/EBITDA Price/Free Cash Flow Price/Book Price/Sales
ROIC % Adjusted ROIC % Return on Equity % Return on Assets % Dividend Yield %
Revenue Growth % EBIT Growth % EPS Growth % Free Cash Flow Growth % Dividend/Share Growth %
Last Historical Year
Last Historical Year
Page 16 of 22
Morningstar Equity Research
© Morningstar 2016. All Rights Reserved. Unless otherwise provided in a separate agreement, you may use this report only in the country in which its original distributor is based. The information, data, analyses and opinions presented herein do not constituteinvestment advice; are provided solely for informational purposes and therefore are not an offer to buy or sell a security; and are not warranted to be correct, complete or accurate. The opinions expressed are as of the date written and are subject to change withoutnotice. Except as otherwise required by law, Morningstar shall not be responsible for any trading decisions, damages or other losses resulting from, or related to, the information, data, analyses or opinions or their use. The information contained herein is theproprietary property of Morningstar and may not be reproduced, in whole or in part, or used in any manner, without the prior written consent of Morningstar. To order reprints, call +1 312-696-6100. To license the research, call +1 312-696-6869. Please see importantdisclosures at the end of this report.
Last Price Fair Value Consider Buy Consider Sell Uncertainty Economic Moat™ Moat Trend™ Stewardship Industry Group
273.27 USD 400.00 USD 280.00 USD 540.00 USD Medium Wide Stable Standard Biotechnology
Biogen Inc BIIB (NAS) | QQQQQ
Company/TickerNet Income
(Mil) 2015 2016(E) 2017(E) 2015 2016(E) 2017(E) 2015 2016(E) 2017(E) 2015 2016(E) 2017(E) 2015 2016(E) 2017(E)Roche Holding AG ROG CHE 11,626 CHF 73.6 73.4 74.0 40.5 40.1 40.6 36.4 36.1 36.6 24.2 24.8 25.7 24.5 21.1 22.4
Novartis AG NOVN CHE 12,041 USD 65.5 72.6 72.7 29.4 31.7 31.9 18.3 21.7 22.4 23.9 23.3 23.5 18.9 24.4 22.7
Sanofi SA SAN FRA 7,224 EUR 69.0 68.9 69.7 29.3 29.8 30.0 19.9 21.7 23.1 19.2 19.6 19.7 11.8 15.7 16.0
Teva Pharmaceutical Industries Ltd 4,637 USD 56.8 53.4 53.9 32.7 36.9 39.2 26.1 24.9 27.2 23.7 24.0 25.9 11.3 21.2 25.4
Average 66.2 67.1 67.6 33.0 34.6 35.4 25.2 26.1 27.3 22.8 22.9 23.7 16.6 20.6 21.6
Biogen Inc BIIB US 3,936 USD 88.5 88.5 88.8 53.0 52.8 52.9 46.6 47.9 48.5 36.6 36.4 36.7 32.5 32.1 32.5
Company/TickerTotal Debt
(Mil) 2015 2016(E) 2017(E) 2015 2016(E) 2017(E) 2015 2016(E) 2017(E) 2015 2016(E) 2017(E) 2015 2016(E) 2017(E)Roche Holding AG ROG CHE 23,251 CHF 110.8 76.6 53.8 52.6 43.4 35.0 22.5 29.8 36.7 1.2 1.0 0.8 3.6 3.0 2.5
Novartis AG NOVN CHE 21,931 USD 28.5 32.5 30.3 22.2 24.5 23.2 22.6 21.7 22.1 1.5 1.6 1.4 1.7 1.7 1.7
Sanofi SA SAN FRA 12,788 EUR 22.7 21.0 19.1 18.5 17.4 16.1 20.0 21.6 24.0 1.2 1.1 1.0 1.7 1.6 1.6
Teva Pharmaceutical Industries Ltd 12,518 USD 33.2 100.0 99.7 24.9 50.0 49.9 21.5 6.1 6.3 2.0 4.1 4.0 1.6 2.3 2.3
Average 48.8 57.5 50.7 29.6 33.8 31.1 21.7 19.8 22.3 1.5 2.0 1.8 2.2 2.2 2.0
Biogen Inc BIIB US 6,553 USD 70.6 54.4 47.2 41.4 35.2 32.1 — 21.2 22.2 1.1 1.1 1.1 2.1 1.9 1.7
Company/TickerMarket Cap
(Mil) 2015 2016(E) 2017(E) 2015 2016(E) 2017(E) 2015 2016(E) 2017(E) 2015 2016(E) 2017(E) 2015 2016(E) 2017(E)
Roche Holding AG ROG CHE 215,987 CHF 10.64 11.50 13.40 1.19 1.46 1.66 0.86 1.06 1.22 1.49 3.72 6.75 59.2 55.0 55.0
Novartis AG NOVN CHE 176,855 CHF 2.23 4.01 4.18 0.96 1.05 1.07 0.70 0.87 0.88 0.97 1.38 1.42 37.4 83.3 78.8
Sanofi SA SAN FRA 94,905 EUR 3.87 4.52 5.56 1.77 1.83 1.97 1.22 1.28 1.41 3.28 3.81 4.69 75.7 69.6 65.2
Teva Pharmaceutical Industries Ltd 51,035 USD 18.45 3.73 6.04 2.74 1.77 1.93 2.36 1.29 1.48 16.07 6.91 8.04 56.2 45.2 37.3
Average 8.80 5.94 7.30 1.67 1.53 1.66 1.29 1.13 1.25 5.45 3.96 5.23 57.1 63.3 59.1
Biogen Inc BIIB US 59,757 USD 26.82 33.93 36.20 3.64 4.13 3.52 3.29 3.78 3.22 1,774.47 — 14.02 — — —
Comparable Company AnalysisThese companies are chosen by the analyst and the data are shown by nearest calendar year in descending market capitalization order.
Profitability Analysis
Leverage Analysis
Liquidity Analysis
Gross Margin % EBITDA Margin % Operating Margin % Net Margin % Free Cash Flow Margin %
Debt/Equity % Debt/Total Cap % EBITDA/Interest Exp. Total Debt/EBITDA Assets/Equity
Cash per Share Current Ratio Quick Ratio Cash/Short-Term Debt Payout Ratio %
Last Historical Year
Last Historical Year
Page 17 of 22
Research Methodology for Valuing CompaniesMorningstar Equity Research
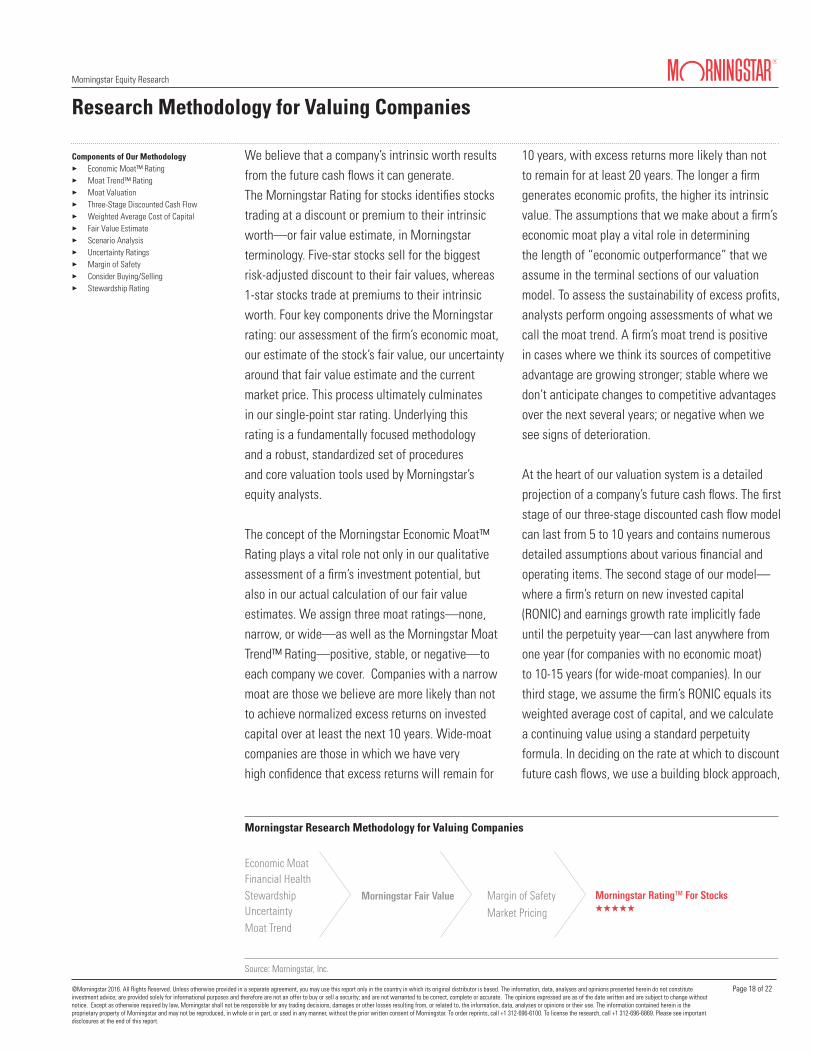
We believe that a company’s intrinsic worth results from the future cash flows it can generate. The Morningstar Rating for stocks identifies stocks trading at a discount or premium to their intrinsic worth—or fair value estimate, in Morningstar terminology. Five-star stocks sell for the biggest risk-adjusted discount to their fair values, whereas 1-star stocks trade at premiums to their intrinsic worth. Four key components drive the Morningstar rating: our assessment of the firm’s economic moat, our estimate of the stock’s fair value, our uncertainty around that fair value estimate and the current market price. This process ultimately culminates in our single-point star rating. Underlying this rating is a fundamentally focused methodology and a robust, standardized set of procedures and core valuation tools used by Morningstar’s equity analysts.
The concept of the Morningstar Economic Moat™ Rating plays a vital role not only in our qualitative assessment of a firm’s investment potential, but also in our actual calculation of our fair value estimates. We assign three moat ratings—none, narrow, or wide—as well as the Morningstar Moat Trend™ Rating—positive, stable, or negative—to each company we cover. Companies with a narrow moat are those we believe are more likely than not to achieve normalized excess returns on invested capital over at least the next 10 years. Wide-moat companies are those in which we have very high confidence that excess returns will remain for
10 years, with excess returns more likely than not to remain for at least 20 years. The longer a firm generates economic profits, the higher its intrinsic value. The assumptions that we make about a firm’s economic moat play a vital role in determining the length of “economic outperformance” that we assume in the terminal sections of our valuation model. To assess the sustainability of excess profits, analysts perform ongoing assessments of what we call the moat trend. A firm’s moat trend is positive in cases where we think its sources of competitive advantage are growing stronger; stable where we don’t anticipate changes to competitive advantages over the next several years; or negative when we see signs of deterioration.
At the heart of our valuation system is a detailed projection of a company’s future cash flows. The first stage of our three-stage discounted cash flow model can last from 5 to 10 years and contains numerous detailed assumptions about various financial and operating items. The second stage of our model—where a firm’s return on new invested capital (RONIC) and earnings growth rate implicitly fade until the perpetuity year—can last anywhere from one year (for companies with no economic moat) to 10-15 years (for wide-moat companies). In our third stage, we assume the firm’s RONIC equals its weighted average cost of capital, and we calculate a continuing value using a standard perpetuity formula. In deciding on the rate at which to discount future cash flows, we use a building block approach,
Margin of Safety
Market Pricing
Morningstar Fair Value Morningstar RatingTM For Stocks QQQQQ
StewardshipUncertainty
Economic MoatFinancial Health
Moat Trend
Morningstar Research Methodology for Valuing Companies
Source: Morningstar, Inc.
Components of Our Methodology 3Economic Moat™ Rating3Moat Trend™ Rating3Moat Valuation3Three-Stage Discounted Cash Flow3Weighted Average Cost of Capital3Fair Value Estimate3Scenario Analysis3Uncertainty Ratings3Margin of Safety3Consider Buying/Selling3Stewardship Rating
@Morningstar 2016. All Rights Reserved. Unless otherwise provided in a separate agreement, you may use this report only in the country in which its original distributor is based. The information, data, analyses and opinions presented herein do not constituteinvestment advice; are provided solely for informational purposes and therefore are not an offer to buy or sell a security; and are not warranted to be correct, complete or accurate. The opinions expressed are as of the date written and are subject to change withoutnotice. Except as otherwise required by law, Morningstar shall not be responsible for any trading decisions, damages or other losses resulting from, or related to, the information, data, analyses or opinions or their use. The information contained herein is theproprietary property of Morningstar and may not be reproduced, in whole or in part, or used in any manner, without the prior written consent of Morningstar. To order reprints, call +1 312-696-6100. To license the research, call +1 312-696-6869. Please see importantdisclosures at the end of this report.
Page 18 of 22
Morningstar Equity Research Research Methodology for Valuing Companies
which takes into account expectations for market real return, inflation, country risk premia, corporate credit spread, and any additional systematic risk.
We also employ a number of other tools to augment our valuation process, including scenario analysis, where we assess the likelihood and performance of a business under different economic and firm-specific conditions. Our analysts model three scenarios for each company we cover, stress-testing the model and examining the distribution of resulting fair values.
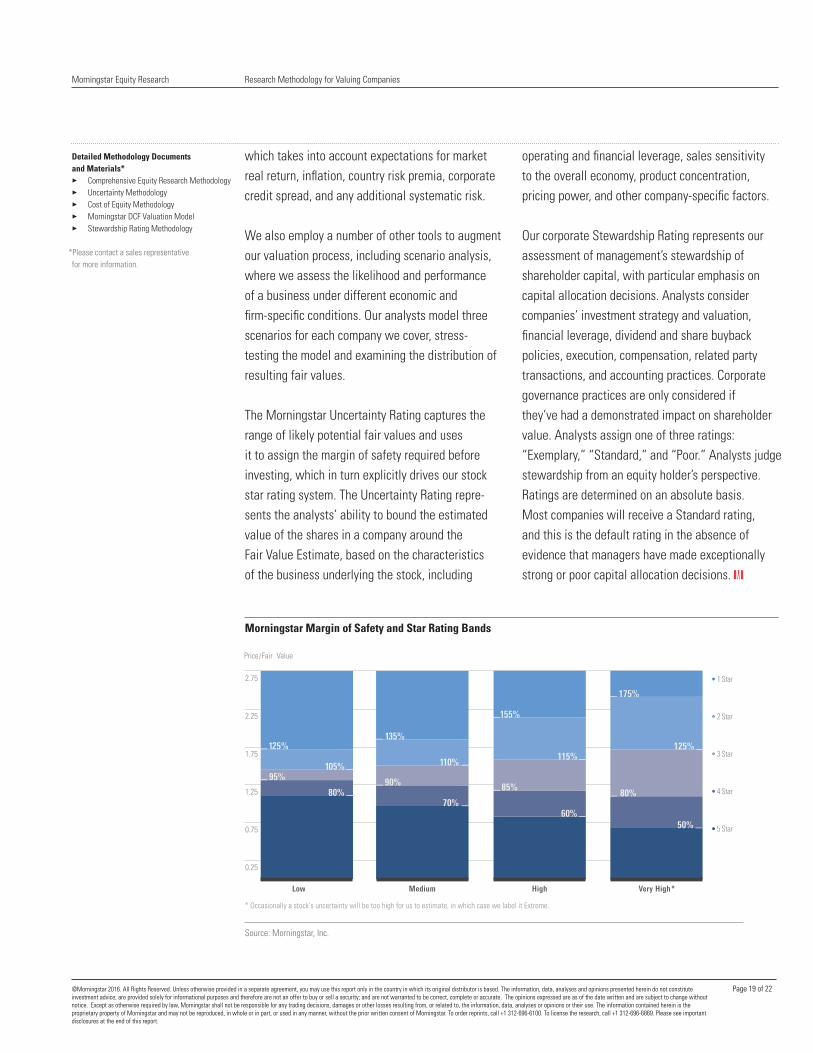
The Morningstar Uncertainty Rating captures the range of likely potential fair values and uses it to assign the margin of safety required before investing, which in turn explicitly drives our stock star rating system. The Uncertainty Rating repre-sents the analysts’ ability to bound the estimated value of the shares in a company around the Fair Value Estimate, based on the characteristics of the business underlying the stock, including
operating and financial leverage, sales sensitivity to the overall economy, product concentration, pricing power, and other company-specific factors.
Our corporate Stewardship Rating represents our assessment of management’s stewardship of shareholder capital, with particular emphasis on capital allocation decisions. Analysts consider companies’ investment strategy and valuation, financial leverage, dividend and share buyback policies, execution, compensation, related party transactions, and accounting practices. Corporate governance practices are only considered if they’ve had a demonstrated impact on shareholder value. Analysts assign one of three ratings: “Exemplary,” “Standard,” and “Poor.” Analysts judge stewardship from an equity holder’s perspective. Ratings are determined on an absolute basis. Most companies will receive a Standard rating, and this is the default rating in the absence of evidence that managers have made exceptionally strong or poor capital allocation decisions. K
Morningstar Margin of Safety and Star Rating Bands
Source: Morningstar, Inc.
Price/Fair Value
2.75
2.25
1.75
1.25
0.75
0.25
• 5 Star
• 4 Star
• 3 Star
• 2 Star
• 1 Star
Low
—
—
—
—
125%
105%95%
80%
—
—
Medium
—
—
—
135%
110%
90%
70%—
—
High
—
—
—
—
—
155%
115%
85%
60%
Very High*
175%
—
—
—
—
125%
80%
50%
* Occasionally a stock’s uncertainty will be too high for us to estimate, in which case we label it Extreme.
Detailed Methodology Documents and Materials* 3Comprehensive Equity Research Methodology 3 Uncertainty Methodology 3Cost of Equity Methodology 3Morningstar DCF Valuation Model 3Stewardship Rating Methodology *Please contact a sales representative for more information.
@Morningstar 2016. All Rights Reserved. Unless otherwise provided in a separate agreement, you may use this report only in the country in which its original distributor is based. The information, data, analyses and opinions presented herein do not constituteinvestment advice; are provided solely for informational purposes and therefore are not an offer to buy or sell a security; and are not warranted to be correct, complete or accurate. The opinions expressed are as of the date written and are subject to change withoutnotice. Except as otherwise required by law, Morningstar shall not be responsible for any trading decisions, damages or other losses resulting from, or related to, the information, data, analyses or opinions or their use. The information contained herein is theproprietary property of Morningstar and may not be reproduced, in whole or in part, or used in any manner, without the prior written consent of Morningstar. To order reprints, call +1 312-696-6100. To license the research, call +1 312-696-6869. Please see importantdisclosures at the end of this report.
Page 19 of 22
Morningstar Equity Research
© Morningstar 2016. All Rights Reserved. Unless otherwise provided in a separate agreement, you may use this report only in the country in which its original distributor is based. The information, data, analyses and opinions presented herein do not constituteinvestment advice; are provided solely for informational purposes and therefore are not an offer to buy or sell a security; and are not warranted to be correct, complete or accurate. The opinions expressed are as of the date written and are subject to change withoutnotice. Except as otherwise required by law, Morningstar shall not be responsible for any trading decisions, damages or other losses resulting from, or related to, the information, data, analyses or opinions or their use. The information contained herein is theproprietary property of Morningstar and may not be reproduced, in whole or in part, or used in any manner, without the prior written consent of Morningstar. To order reprints, call +1 312-696-6100. To license the research, call +1 312-696-6869.
Last Price Fair Value Consider Buy Consider Sell Uncertainty Economic Moat™ Moat Trend™ Stewardship Industry Group
273.27 USD 400.00 USD 280.00 USD 540.00 USD Medium Wide Stable Standard Biotechnology
Biogen Inc BIIB (NAS) | QQQQQ
Unless stated otherwise, this Research Report wasprepared by the person(s) noted in their capacity as EquityAnalysts employed by Morningstar, Inc., or one of itsaffiliates. This Report has not been made available to theissuer of the relevant financial products prior to publication.
The Morningstar Rating for stocks identifies stocks tradingat a discount or premium to their intrinsic value. Five-starstocks sell for the biggest risk-adjusted discount whereasone-star stocks trade at premiums to their intrinsic value.Based on a fundamentally focused methodology and arobust, standardized set of procedures and core valuationtools used by Morningstar's Equity Analysts, four keycomponents drive the Morningstar Rating: 1. Assessmentof the firm's economic moat, 2. Estimate of the stock's fairvalue, 3. Uncertainty around that fair value estimate, and 4.Current market price. Further information on Morningstar'smethodology is available from http://global.morningstar.com/equitydisclosures.
This Report is current as of the date on the Report until it isreplaced, updated or withdrawn. This Report may bewithdrawn or changed at any time as other informationbecomes available to us. This Report will be updated ifevents affecting the Report materially change.
Conflicts of Interest:
-No material interests are held by Morningstar or the EquityAnalyst in the financial products that are the subject of theReports.
-Equity Analysts are required to comply with the CFAInstitute's Code of Ethics and Standards of ProfessionalConduct.
-Equity Analysts’ compensation is derived fromMorningstar's overall earnings and consists of salary, bonusand in some cases restricted stock.
-Equity Analysts do not have authority over Morningstar'sinvestment management group's business arrangementsnor allow employees from the investment managementgroup to participate or influence the analysis or opinionprepared by them. Morningstar will not receive any directbenefit from the publication of this Report.
- Morningstar does not receive commissions for providingresearch and does not charge companies to be rated.
-Equity Analysts use publicly available information.
Page 20 of 22

Morningstar Equity Research
© Morningstar 2016. All Rights Reserved. Unless otherwise provided in a separate agreement, you may use this report only in the country in which its original distributor is based. The information, data, analyses and opinions presented herein do not constituteinvestment advice; are provided solely for informational purposes and therefore are not an offer to buy or sell a security; and are not warranted to be correct, complete or accurate. The opinions expressed are as of the date written and are subject to change withoutnotice. Except as otherwise required by law, Morningstar shall not be responsible for any trading decisions, damages or other losses resulting from, or related to, the information, data, analyses or opinions or their use. The information contained herein is theproprietary property of Morningstar and may not be reproduced, in whole or in part, or used in any manner, without the prior written consent of Morningstar. To order reprints, call +1 312-696-6100. To license the research, call +1 312-696-6869.
Last Price Fair Value Consider Buy Consider Sell Uncertainty Economic Moat™ Moat Trend™ Stewardship Industry Group
273.27 USD 400.00 USD 280.00 USD 540.00 USD Medium Wide Stable Standard Biotechnology
Biogen Inc BIIB (NAS) | QQQQQ
-Morningstar may provide the product issuer or its relatedentities with services or products for a fee and on an arms’length basis including software products and licenses,research and consulting services, data services, licenses torepublish our ratings and research in their promotionalmaterial, event sponsorship and website advertising.
-Further information on Morningstar's conflict of interestpolicies is available from http://global.morningstar.com/equitydisclosures.
If you wish to obtain further information regarding previousReports and recommendations and our services, pleasecontact your local Morningstar office.
Unless otherwise provided in a separate agreement, youmay use this Report only in the country in which theMorningstar distributor is based. Unless stated otherwise,the original distributor of this document is Morningstar Inc.Redistribution, in any capacity, is prohibited withoutpermission. The information, data, analyses and opinionspresented herein do not constitute investment advice; areprovided solely for informational purposes and therefore arenot an offer to buy or sell a security; and are not warrantedto be correct, complete or accurate, nor may they beconstrued as a representation regarding the legality ofinvesting in the security/ies concerned, under the applicableinvestment or similar laws or regulations of any person orentity accessing this report. The opinions expressed are asof the date written and are subject to change without notice.Except as otherwise required by law, Morningstar, itsaffiliates, and their officers, directors and employees shallnot be responsible or liable for any trading decisions,damages or other losses resulting from, or related to, theinformation, data, analyses or opinions or their use. Youshould seek the advice of your financial, legal, tax, businessand/or other consultant, and read all relevant issuedocuments pertaining to the security/ies concerned,including without limitation, the detailed risks involved in
the investment, before making an investment decision.
Please note that investments in securities are subject tomarket and other risks and there is no assurance orguarantee that the intended investment objectives will beachieved. Past performance of a security may or may not besustained in future and is no indication of futureperformance. As the price / value / interest rate of a securityfluctuates, the value of your investments in the said security,and in the income, if any, derived therefrom may go up ordown.
For Recipients in Australia: This report has been authorizedby the Head of Equity and Credit Research, Asia Pacific,Morningstar Australasia Pty Limited and is circulatedpursuant to RG 79.26(f) as a full restatement of an originalreport (by the named Morningstar analyst) which hasalready been broadly distributed. To the extent the reportcontains general advice it has been prepared withoutreference to your objectives, financial situation or needs.You should consider the advice in light of these matters and,if applicable, the relevant Product Disclosure Statementbefore making any decision to invest. Refer to our FinancialServices Guide (FSG) for more information at www.morningstar.com.au/fsg.pdf.
For Recipients in Hong Kong: The research is distributed byMorningstar Investment Management Asia Limited, whichis regulated by the Hong Kong Securities and FuturesCommission to provide services to professional investorsonly. Neither Morningstar Investment Management AsiaLimited, nor its representatives, are acting or will be deemedto be acting as an investment advisor to any recipients ofthis information unless expressly agreed to by MorningstarInvestment Management Asia Limited. For enquiriesregarding this research, please contact a MorningstarInvestment Management Asia Limited Licensed Representativeat http://global.morningstar.com/equitydisclosures.
Page 21 of 22
Morningstar Equity Research
© Morningstar 2016. All Rights Reserved. Unless otherwise provided in a separate agreement, you may use this report only in the country in which its original distributor is based. The information, data, analyses and opinions presented herein do not constituteinvestment advice; are provided solely for informational purposes and therefore are not an offer to buy or sell a security; and are not warranted to be correct, complete or accurate. The opinions expressed are as of the date written and are subject to change withoutnotice. Except as otherwise required by law, Morningstar shall not be responsible for any trading decisions, damages or other losses resulting from, or related to, the information, data, analyses or opinions or their use. The information contained herein is theproprietary property of Morningstar and may not be reproduced, in whole or in part, or used in any manner, without the prior written consent of Morningstar. To order reprints, call +1 312-696-6100. To license the research, call +1 312-696-6869.
Last Price Fair Value Consider Buy Consider Sell Uncertainty Economic Moat™ Moat Trend™ Stewardship Industry Group
273.27 USD 400.00 USD 280.00 USD 540.00 USD Medium Wide Stable Standard Biotechnology
Biogen Inc BIIB (NAS) | QQQQQ
For Recipients in India: This research on securities [asdefined in clause (h) of Section 2 of the Securities Contracts(Regulation) Act, 1956], such research being referred to forthe purpose of this document as “Investment Research”, isissued by Morningstar Investment Adviser India PrivateLimited.
Morningstar Investment Adviser India Private Limited isregistered with the Securities and Exchange Board of Indiaunder the SEBI (Investment Advisers) Regulations, 2013,vide Registration number INA000001357, dated March 27,2014, and in compliance of the aforesaid regulations andthe SEBI (Research Analysts) Regulations, 2014, it carrieson the business activities of investment advice andresearch. Morningstar Investment Adviser India PrivateLimited has not been the subject of any disciplinary actionby SEBI or any other legal/regulatory body. MorningstarInvestment Adviser India Private Limited is a wholly ownedsubsidiary of Morningstar Associates LLC, which is a partof the Morningstar Investment Management group ofMorningstar, Inc., and Morningstar, Inc. is a leading providerof independent investment research that offers an extensiveline of products and services for individual investors,financial advisors, asset managers, and retirement planproviders and sponsors. In India, Morningstar InvestmentAdviser India Private Limited has only one associate, viz.,Morningstar India Private Limited, and this companypredominantly carries on the business activities of providingdata input, data transmission and other data relatedservices, financial data analysis, software development etc.
The author/creator of this Investment Research (“ResearchAnalyst”) or his/her associates or his/her relatives does/donot have (i) any financial interest in the subject company;(ii) any actual/beneficial ownership of one per cent or moresecurities of the subject company, at the end of the monthimmediately preceding the date of publication of thisInvestment Research; and (iii) any other material conflict ofinterest at the time of publication of this Investment
Research.
The Research Analyst or his/her associates or his/herrelatives has/have not received any (i) compensation fromthe subject company in the past twelve months; (ii)compensation for products or services from the subjectcompany in the past twelve months; and (iii) compensationor other material benefits from the subject company or thirdparty in connection with this Investment Research. Also, theResearch Analyst has not served as an officer, director oremployee of the subject company.
The terms and conditions on which Morningstar InvestmentAdviser India Private Limited offers Investment Research toclients, varies from client to client, and are spelt out in detailin the respective client agreement.
Page 22 of 22