biogen, inc. biotechnology - credit suisse
TRANSCRIPT

DISCLOSURE APPENDIX AT THE BACK OF THIS REPORT CONTAINS IMPORTANT DISCLOSURES, ANALYST CERTIFICATIONS, AND THE STATUS OF NON-US ANALYSTS. US Disclosure: Credit Suisse does and seeks to do business with companies covered in its research reports. As a result, investors should be aware that the Firm may have a conflict of interest that could affect the objectivity of this report. Investors should consider this report as only a single factor in making their investment decision.
CREDIT SUISSE SECURITIES RESEARCH & ANALYTICS BEYOND INFORMATION®
Client-Driven Solutions, Insights, and Access
19 January 2016Americas/United States
Equity ResearchBiotechnology
Biogen, Inc. (BIIB)
INITIATION Rating NEUTRALPrice (15-Jan-16,US$) 273.33Target price (US$) 322.0052-week price range 475.98 - 256.04Market cap (US$ m) 60,926.11Enterprise value (US$ m) 60,770.06*Stock ratings are relative to the coverage universe in each analyst's or each team's respective sector.¹Target price is for 12 months.
Research AnalystsAlethia Young
212 538 [email protected]
Eliana Merle212 538 0678
Grant Hesser212 325 2587
Cautious Pipeline Optimism Is Not Enough■ We are initiating coverage of Biogen with a Neutral rating and a $322 target
price target. We think their base businesses continue to have headwinds and that its pipeline is the big upside driver. We think the level of credit we give to anti-LINGO1 and Alzheimer's is appropriate based on what we will learn this year, but we find it hard to get enough conviction to see upside at this point.
■ Cautious on Base Business: We expect competition from new regimens to affect base business growth in the long term. Our 2016 rev and EPS estimates are $11.13B and $17.75 vs. the Street of $11.24B and $18.55. We are ~$400M and $600M under 2017 and 2018 estimates due to MS and haemophilia competitive headwinds.
■ Some Pipeline Is Baked into Shares: Even with significant pipeline credit baked in based on what we know about Alzheimer's, Lingo, and SMA, our DCF valuation is $284/share. We assume 40%, 25%, and 65%, respectively.
■ Catalysts; Pipeline Focused: Catalysts include (1) synergy MS study anti-LINGO1 data in mid-2016 (2) BAN2401 top-line data in AD, (3) E2609 BACE safety look, (4) Solanezumab (Lilly) Ph3 data in the October 2016 read-through, and (5) adacanumab titration updates on the PRIME AD study.
■ Valuation: Our TP is a 50/50 split of DCF and P/E multiple. Our DCF is $284/sh based on an 8% discount rate and 2% terminal growth, which is in-line with peers. Our P/E valuation is $360/sh. We assign a 20.3x multiple to 2016 EPS of $17.75, which is a 5% premium to the large-cap sector ex-GILD and a 23% premium to the S&P 500. We believe that this multiple is justified based on Biogen's base business and pipeline profile. Upside risks include robust pipeline data and stronger base business results. Downside risks include pipeline failure and weaker base business results.
Share price performance
BIIB.O Q S& P 5 0 0 IN D EX
A p r - 1 5 Ju l - 1 5 O ct - 1 5 Jan - 1 52 0 0
3 0 0
4 0 0
5 0 0
On 15-Jan-2016 the S&P 500 INDEX closed at 1880.33Daily Jan16, 2015 - Jan15, 2016, 01/16/15 = US$352.75
Quarterly EPS Q1 Q2 Q3 Q42014A 2.02 3.05 3.61 3.742015E 3.48 3.92 4.38 3.602016E 4.14 4.00 4.13 4.22
Financial and valuation metricsYear 12/14A 12/15E 12/16E 12/17EEPS (CS adj.) (US$) 13.83 16.76 17.75 19.43Prev. EPS (US$) - - - -P/E (x) 19.8 16.3 15.4 14.1P/E rel. (%) 110.8 92.0 92.9 95.7Revenue (US$ m) 9,703.3 10,682.8 11,136.7 11,686.7EBITDA (US$ m) 4,660.6 5,408.9 5,622.7 5,945.7OCFPS (US$) 12.40 16.64 18.69 19.81P/OCF (x) 27.4 16.4 14.6 13.8EV/EBITDA (current) 12.9 11.2 10.7 9.9Net debt (US$ m) -620 -156 -537 -1,925ROIC (%) 29.19 33.28 31.21 30.47
Number of shares (m) 222.90 IC (current, US$ m) 10,194.31Net debt (Next Qtr., US$ m) - EV/IC (x) -Net debt/tot eq (Next Qtr.,%) - Dividend (current, US$) -Source: Company data, Thomson Reuters, Credit Suisse estimates

19 January 2016
Biogen, Inc. (BIIB) 2
Biogen, Inc. (BIIB)Price (15 Jan 2016): US$273.3; Rating: NEUTRAL; Target Price: US$322Income Statement 12/14A 12/15E 12/16E 12/17ERevenue (US$ m) 9,703.3 10,682.8 11,136.7 11,686.7EBITDA 4,661 5,409 5,623 5,946Depr. & amort. (688) (542) (517) (495)EBIT (US$) 3,972 4,867 5,106 5,451Net interest exp (17) (62) (191) (151)Associates 0 0 0 0Other adj. (8) (31) 0 0PBT (US$) 3,947 4,773 4,915 5,300Income taxes (990) (1,180) (1,229) (1,325)Profit after tax 2,957 3,593 3,687 3,975Minorities - - - -Preferred dividends - - - -Associates & other (22) (62) 0 0Net profit (US$) 2,935 3,531 3,687 3,975Other NPAT adjustments 7 49 0 0Reported net income 2,942 3,580 3,687 3,975Cash Flow 12/14A 12/15E 12/16E 12/17EEBIT 3,972 4,867 5,106 5,451Net interest (17) (62) (191) (151)Cash taxes paid - - - -Change in working capital (484) (257) (28) (130)Other cash & non-cash items (529) (682) (712) (830)Cash flow from operations 2,942 3,866 4,175 4,340CAPEX (288) (250) (250) (250)Free cashflow to the firm 2,654 3,616 3,925 4,090Aquisitions 0 0 0 0Divestments - - - -Other investment/(outflows) (1,255) (850) (1,500) (1,260)Cash flow from investments (1,543) (1,100) (1,750) (1,510)Net share issue(/repurchase) (832) (3,230) (2,044) (1,442)Dividends paid 0 0 0 0Issuance (retirement) of debt (3) 5,926 (16) (16)Other 89 (5,926) 16 16Cashflow from financing activities (745) (3,230) (2,044) (1,442)Effect of exchange rates (41) 0 0 0Changes in Net Cash/Debt 613 (464) 381 1,388Net debt at start (7) (620) (156) (537)Change in net debt (613) 464 (381) (1,388)Net debt at end (620) (156) (537) (1,925)Balance Sheet (US$) 12/14A 12/15E 12/16E 12/17EAssetsCash & cash equivalents 1,205 6,667 7,032 8,404Account receivables 1,292 1,423 1,483 1,557Inventory 804 851 918 963Other current assets 1,371 1,445 1,479 1,521Total current assets 4,673 10,386 10,912 12,444Total fixed assets 1,766 1,818 1,864 1,906Intangible assets and goodwill 5,789 6,294 7,481 8,455Investment securities - - - -Other assets 2,089 2,089 2,089 2,089Total assets 14,317 20,588 22,347 24,895LiabilitiesAccounts payables 229 243 262 274Short-term debt 0 0 0 0Other short term liabilities 1,991 1,974 2,088 2,641Total current liabilities 2,220 2,216 2,349 2,915Long-term debt 582 6,506 6,490 5,938Other liabilities 701 701 701 701Total liabilities 3,503 9,423 9,540 9,554Shareholder equity 10,814 11,165 12,807 15,340Minority interests - - - -Total liabilities and equity 14,317 20,588 22,347 24,895Net debt (620) (156) (537) (1,925)
Per share 12/14A 12/15E 12/16E 12/17ENo. of shares (wtd avg) 237 232 223 219CS adj. EPS 13.83 16.76 17.75 19.43Prev. EPS (US$)Dividend (US$) 0.00 0.00 0.00 0.00Dividend payout ratio 0.00 0.00 0.00 0.00Free cash flow per share 11.19 15.57 17.57 18.67Earnings 12/14A 12/15E 12/16E 12/17ESales growth (%) 40.0 10.1 4.2 4.9EBIT growth (%) 57.9 22.5 4.9 6.8Net profit growth (%) 57.6 20.3 4.4 7.8EPS growth (%) 54.3 21.1 6.0 9.4EBITDA margin (%) 48.0 50.6 50.5 50.9EBIT margin (%) 40.9 45.6 45.8 46.6Pretax margin (%) 40.7 44.7 44.1 45.4Net margin (%) 30.2 33.1 33.1 34.0Valuation 12/14A 12/15E 12/16E 12/17EEV/Sales (x) 6.22 5.69 5.42 5.05EV/EBITDA (x) 12.9 11.2 10.7 9.9EV/EBIT (x) 15.2 12.5 11.8 10.8P/E (x) 19.8 16.3 15.4 14.1Price to book (x) 6.0 5.6 4.8 3.9Asset turnover 0.7 0.5 0.5 0.5Returns 12/14A 12/15E 12/16E 12/17EROE stated-return on (%) 30.3 32.6 30.8 28.2ROIC (%) 0.3 0.3 0.3 0.3Interest burden (%) 0.99 0.98 0.96 0.97Tax rate (%) 25.1 24.7 25.0 25.0Financial leverage (%) 0.05 0.58 0.51 0.42Gearing 12/14A 12/15E 12/16E 12/17ENet debt/equity (%) (5.7) (1.4) (4.2) (12.5)Net Debt to EBITDA (x) Net
CashNet
CashNet
CashNet
CashInterest coverage ratio (X) 229.6 78.1 26.8 36.2Quarterly EPS Q1 Q2 Q3 Q42014A 2.02 3.05 3.61 3.742015E 3.48 3.92 4.38 3.602016E 4.14 4.00 4.13 4.22
Share price performance
BIIB.O Q S& P 5 0 0 IN D EX
A p r - 1 5 Ju l - 1 5 O ct - 1 5 Jan - 1 62 0 0
3 0 0
4 0 0
5 0 0
On 15-Jan-2016 the S&P 500 INDEX closed at 1880.33Daily Jan16, 2015 - Jan15, 2016, 01/16/15 = US$352.75
Source: Company data, Thomson Reuters, Credit Suisse estimates
19 January 2016
Biogen, Inc. (BIIB) 3
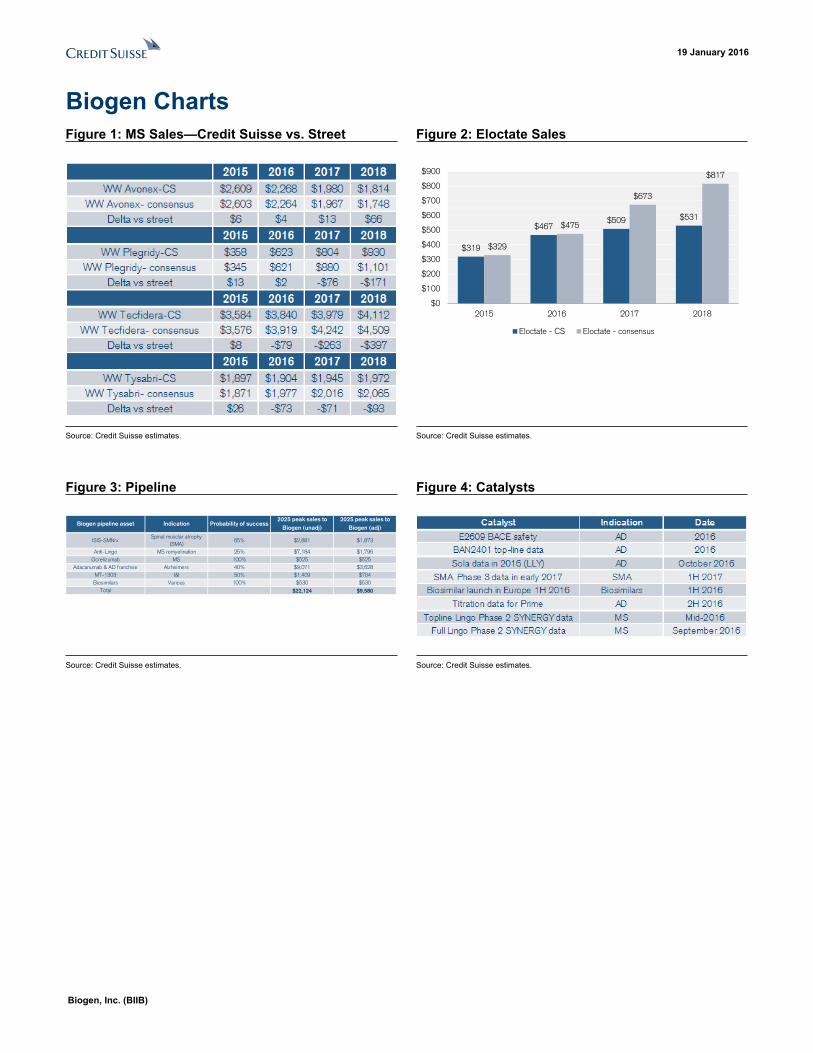
Biogen ChartsFigure 1: MS Sales—Credit Suisse vs. Street Figure 2: Eloctate Sales
$319
$467$509 $531
$329
$475
$673
$817
$0
$100
$200
$300
$400
$500
$600
$700
$800
$900
2015 2016 2017 2018
Eloctate - CS Eloctate - consensus
Source: Credit Suisse estimates. Source: Credit Suisse estimates.
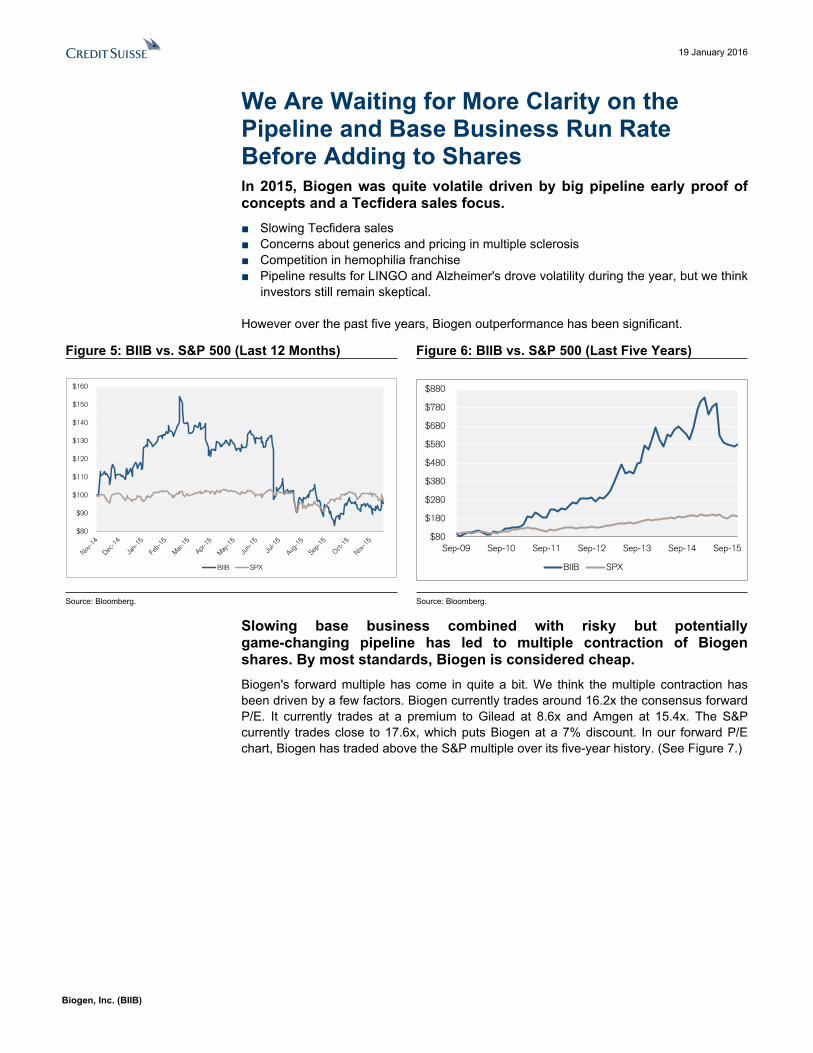
Figure 3: Pipeline Figure 4: Catalysts
Biogen pipeline asset Indication Probability of success2025 peak sales to
Biogen (unadj)2025 peak sales to
Biogen (adj)
ISIS-SMNrxSpinal musclar atrophy
(SMA)65% $2,881 $1,873
Anti-Lingo MS remyelination 25% $7,184 $1,796 Ocrelizumab MS 100% $525 $525
Adacanumab & AD franchise Alzheimers 40% $9,071 $3,628 MT-1303 I&I 50% $1,409 $704 Biosimilars Various 100% $530 $530
Total $22,124 $9,580
Source: Credit Suisse estimates. Source: Credit Suisse estimates.
19 January 2016
Biogen, Inc. (BIIB) 4
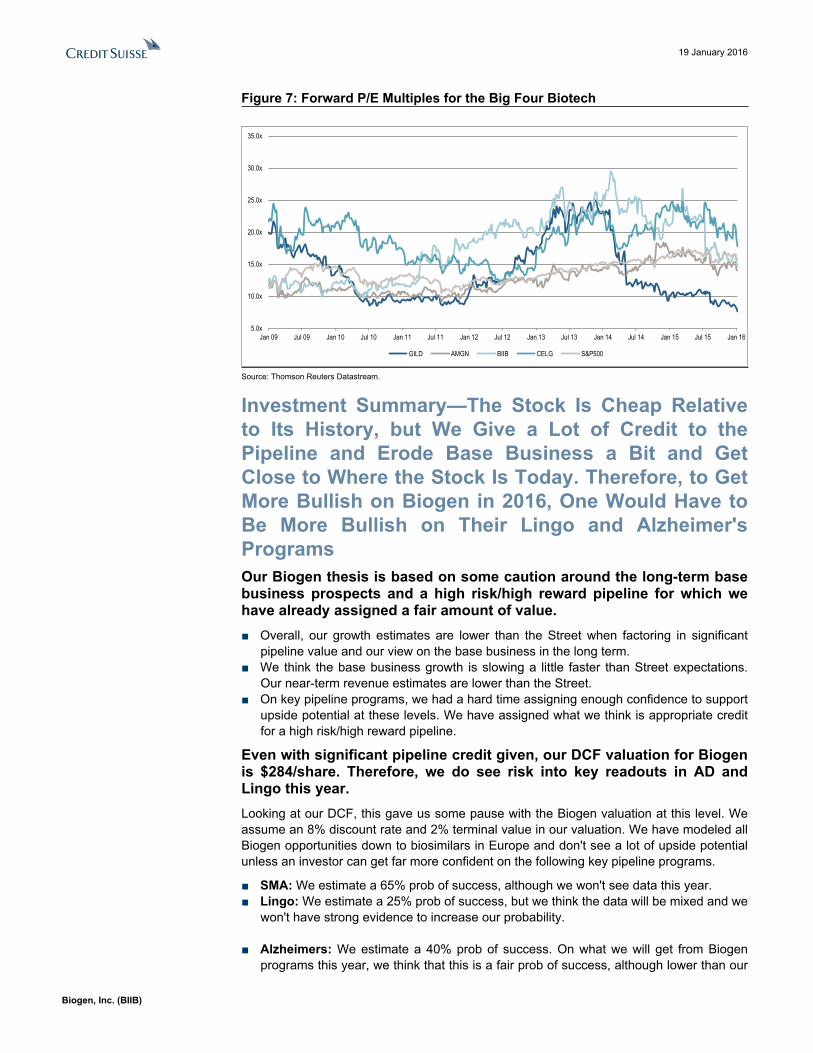
We Are Waiting for More Clarity on the Pipeline and Base Business Run Rate Before Adding to SharesIn 2015, Biogen was quite volatile driven by big pipeline early proof of concepts and a Tecfidera sales focus. ■ Slowing Tecfidera sales■ Concerns about generics and pricing in multiple sclerosis■ Competition in hemophilia franchise■ Pipeline results for LINGO and Alzheimer's drove volatility during the year, but we think
investors still remain skeptical.
However over the past five years, Biogen outperformance has been significant.
Figure 5: BIIB vs. S&P 500 (Last 12 Months) Figure 6: BIIB vs. S&P 500 (Last Five Years)
$80
$90
$100
$110
$120
$130
$140
$150
$160
BIIB SPX
$80
$180
$280
$380
$480
$580
$680
$780
$880
Sep-09 Sep-10 Sep-11 Sep-12 Sep-13 Sep-14 Sep-15
BIIB SPX
Source: Bloomberg. Source: Bloomberg.
Slowing base business combined with risky but potentially game-changing pipeline has led to multiple contraction of Biogen shares. By most standards, Biogen is considered cheap.Biogen's forward multiple has come in quite a bit. We think the multiple contraction has been driven by a few factors. Biogen currently trades around 16.2x the consensus forward P/E. It currently trades at a premium to Gilead at 8.6x and Amgen at 15.4x. The S&P currently trades close to 17.6x, which puts Biogen at a 7% discount. In our forward P/E chart, Biogen has traded above the S&P multiple over its five-year history. (See Figure 7.)
19 January 2016
Biogen, Inc. (BIIB) 5
Figure 7: Forward P/E Multiples for the Big Four Biotech
5.0x
10.0x
15.0x
20.0x
25.0x
30.0x
35.0x
Jan 09 Jul 09 Jan 10 Jul 10 Jan 11 Jul 11 Jan 12 Jul 12 Jan 13 Jul 13 Jan 14 Jul 14 Jan 15 Jul 15 Jan 16
GILD AMGN BIIB CELG S&P500
Source: Thomson Reuters Datastream.
Investment Summary—The Stock Is Cheap Relative to Its History, but We Give a Lot of Credit to the Pipeline and Erode Base Business a Bit and Get Close to Where the Stock Is Today. Therefore, to Get More Bullish on Biogen in 2016, One Would Have to Be More Bullish on Their Lingo and Alzheimer's Programs Our Biogen thesis is based on some caution around the long-term base business prospects and a high risk/high reward pipeline for which we have already assigned a fair amount of value.■ Overall, our growth estimates are lower than the Street when factoring in significant
pipeline value and our view on the base business in the long term.■ We think the base business growth is slowing a little faster than Street expectations.
Our near-term revenue estimates are lower than the Street. ■ On key pipeline programs, we had a hard time assigning enough confidence to support
upside potential at these levels. We have assigned what we think is appropriate credit for a high risk/high reward pipeline.
Even with significant pipeline credit given, our DCF valuation for Biogen is $284/share. Therefore, we do see risk into key readouts in AD and Lingo this year.Looking at our DCF, this gave us some pause with the Biogen valuation at this level. We assume an 8% discount rate and 2% terminal value in our valuation. We have modeled all Biogen opportunities down to biosimilars in Europe and don't see a lot of upside potential unless an investor can get far more confident on the following key pipeline programs.
■ SMA: We estimate a 65% prob of success, although we won't see data this year.■ Lingo: We estimate a 25% prob of success, but we think the data will be mixed and we
won't have strong evidence to increase our probability.
■ Alzheimers: We estimate a 40% prob of success. On what we will get from Biogen programs this year, we think that this is a fair prob of success, although lower than our
19 January 2016
Biogen, Inc. (BIIB) 6
typical 65-75% for a Phase 3 program. However, Lilly Solanezumab data is a big catalyst in October since there is a likely read-through to be made.
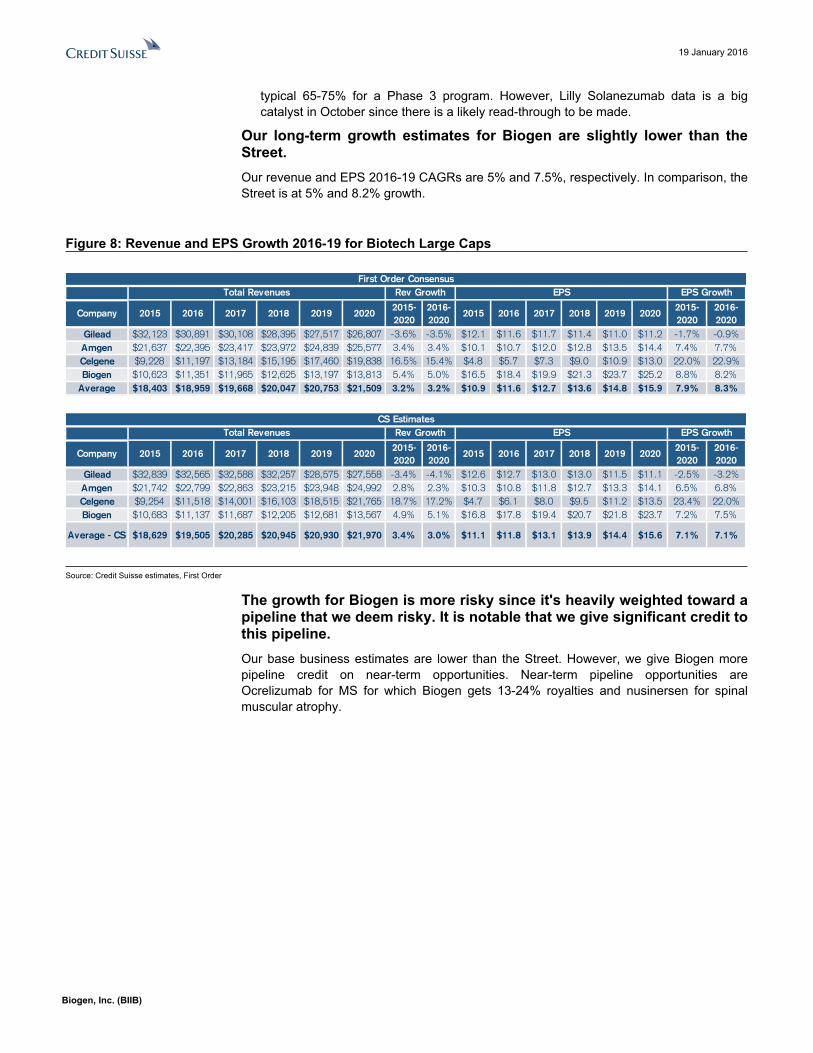
Our long-term growth estimates for Biogen are slightly lower than the Street.Our revenue and EPS 2016-19 CAGRs are 5% and 7.5%, respectively. In comparison, the Street is at 5% and 8.2% growth.
Figure 8: Revenue and EPS Growth 2016-19 for Biotech Large Caps
Company 2015 2016 2017 2018 2019 20202015-2020
2016-2020
2015 2016 2017 2018 2019 20202015-2020
2016-2020
Gilead $32,123 $30,891 $30,108 $28,395 $27,517 $26,807 -3.6% -3.5% $12.1 $11.6 $11.7 $11.4 $11.0 $11.2 -1.7% -0.9%Amgen $21,637 $22,395 $23,417 $23,972 $24,839 $25,577 3.4% 3.4% $10.1 $10.7 $12.0 $12.8 $13.5 $14.4 7.4% 7.7%Celgene $9,228 $11,197 $13,184 $15,195 $17,460 $19,838 16.5% 15.4% $4.8 $5.7 $7.3 $9.0 $10.9 $13.0 22.0% 22.9%Biogen $10,623 $11,351 $11,965 $12,625 $13,197 $13,813 5.4% 5.0% $16.5 $18.4 $19.9 $21.3 $23.7 $25.2 8.8% 8.2%
Average $18,403 $18,959 $19,668 $20,047 $20,753 $21,509 3.2% 3.2% $10.9 $11.6 $12.7 $13.6 $14.8 $15.9 7.9% 8.3%
EPSRev Growth EPS GrowthTotal RevenuesFirst Order Consensus
Company 2015 2016 2017 2018 2019 20202015-2020
2016-2020
2015 2016 2017 2018 2019 20202015-2020
2016-2020
Gilead $32,839 $32,565 $32,588 $32,257 $28,575 $27,558 -3.4% -4.1% $12.6 $12.7 $13.0 $13.0 $11.5 $11.1 -2.5% -3.2%Amgen $21,742 $22,799 $22,863 $23,215 $23,948 $24,992 2.8% 2.3% $10.3 $10.8 $11.8 $12.7 $13.3 $14.1 6.5% 6.8%Celgene $9,254 $11,518 $14,001 $16,103 $18,515 $21,765 18.7% 17.2% $4.7 $6.1 $8.0 $9.5 $11.2 $13.5 23.4% 22.0%Biogen $10,683 $11,137 $11,687 $12,205 $12,681 $13,567 4.9% 5.1% $16.8 $17.8 $19.4 $20.7 $21.8 $23.7 7.2% 7.5%
Average - CS $18,629 $19,505 $20,285 $20,945 $20,930 $21,970 3.4% 3.0% $11.1 $11.8 $13.1 $13.9 $14.4 $15.6 7.1% 7.1%
CS EstimatesTotal Revenues EPSRev Growth EPS Growth
Source: Credit Suisse estimates, First Order
The growth for Biogen is more risky since it's heavily weighted toward a pipeline that we deem risky. It is notable that we give significant credit to this pipeline.Our base business estimates are lower than the Street. However, we give Biogen more pipeline credit on near-term opportunities. Near-term pipeline opportunities are Ocrelizumab for MS for which Biogen gets 13-24% royalties and nusinersen for spinal muscular atrophy.
19 January 2016
Biogen, Inc. (BIIB) 7
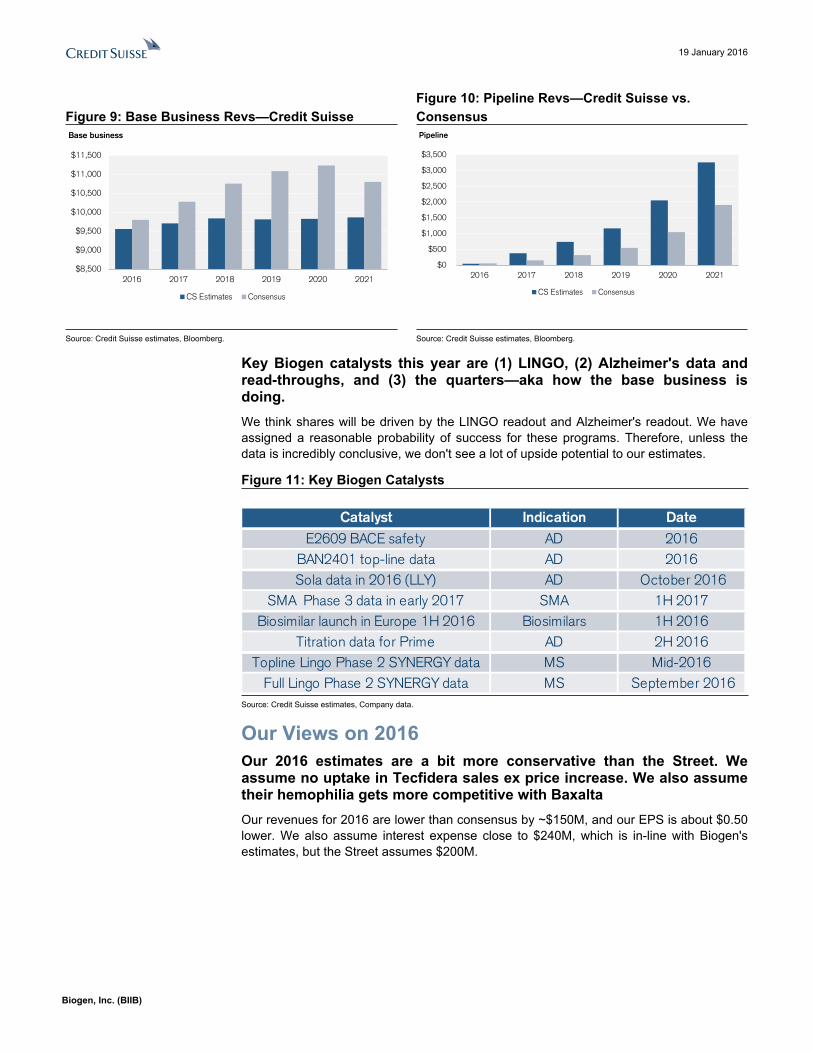
Figure 9: Base Business Revs—Credit Suisse Figure 10: Pipeline Revs—Credit Suisse vs. Consensus
$8,500
$9,000
$9,500
$10,000
$10,500
$11,000
$11,500
2016 2017 2018 2019 2020 2021
Base business
CS Estimates Consensus
$0
$500
$1,000
$1,500
$2,000
$2,500
$3,000
$3,500
2016 2017 2018 2019 2020 2021
Pipeline
CS Estimates Consensus
Source: Credit Suisse estimates, Bloomberg. Source: Credit Suisse estimates, Bloomberg.
Key Biogen catalysts this year are (1) LINGO, (2) Alzheimer's data and read-throughs, and (3) the quarters—aka how the base business is doing.We think shares will be driven by the LINGO readout and Alzheimer's readout. We have assigned a reasonable probability of success for these programs. Therefore, unless the data is incredibly conclusive, we don't see a lot of upside potential to our estimates.
Figure 11: Key Biogen Catalysts
Catalyst Indication DateE2609 BACE safety AD 2016
BAN2401 top-line data AD 2016Sola data in 2016 (LLY) AD October 2016
SMA Phase 3 data in early 2017 SMA 1H 2017Biosimilar launch in Europe 1H 2016 Biosimilars 1H 2016
Titration data for Prime AD 2H 2016Topline Lingo Phase 2 SYNERGY data MS Mid-2016
Full Lingo Phase 2 SYNERGY data MS September 2016Source: Credit Suisse estimates, Company data.
Our Views on 2016Our 2016 estimates are a bit more conservative than the Street. We assume no uptake in Tecfidera sales ex price increase. We also assume their hemophilia gets more competitive with BaxaltaOur revenues for 2016 are lower than consensus by ~$150M, and our EPS is about $0.50 lower. We also assume interest expense close to $240M, which is in-line with Biogen's estimates, but the Street assumes $200M.

19 January 2016
Biogen, Inc. (BIIB) 8
Figure 12: Total Revs—Credit Suisse vs. Consensus Figure 13: EPS—Credit Suisse vs. Consensus
$2,777
$2,738
$2,791
$2,831
$2,736
$2,808
$2,852
$2,888
$2,650
$2,700
$2,750
$2,800
$2,850
$2,900
1Q16E 2Q16E 3Q16E 4Q16E
Total revenues- CS Total revenues- consensus
$4.46
$4.32
$4.45
$4.54
$4.34$4.39
$4.58
$4.71
$4.10
$4.20
$4.30
$4.40
$4.50
$4.60
$4.70
$4.80
1Q16E 2Q16E 3Q16E 4Q16E
EPS - CS EPS- Consensus
Source: Credit Suisse estimates, Bloomberg. Source: Credit Suisse estimates, Bloomberg.
We still remain cautious on Biogen's core multiple sclerosis (MS) business over the next 12 months. Biogen's MS franchise still makes up 75% of revenues, so weaker-than-expected MS franchise sales is meaningful for Biogen shares.
We think that Street expectations may be too high for Tecfidera and Tysabri.■ Slower Tecfidera Growth than the Street: Biogen is making a significant investment
into direct-to-consumer campaigns to re-energize patient interest in Tecfidera following the new FDA label that contains a PML warning. We have been looking at IMS scripts, which have historically been a good predictor of Tecfidera oral pill trends. We have not seen an increase so far, although we note the holidays. We are about $260-400M under Street estimates in 2017 and 2018.
■ Slower Tysabri Growth than the Street: We expect Roche will file for Ocrelizumab in early 2016, which would set up for an early 2017 approval at the worst case. From our checks, doctors are very excited (as with many new MS) about Ocrelizumab. It is an IV therapy for MS. We think that Tysabri will experience competition from excitement around this launch starting in 2017. If the approval happens earlier than expected, there could be pressures on Tysabri earlier than expected.
19 January 2016
Biogen, Inc. (BIIB) 9
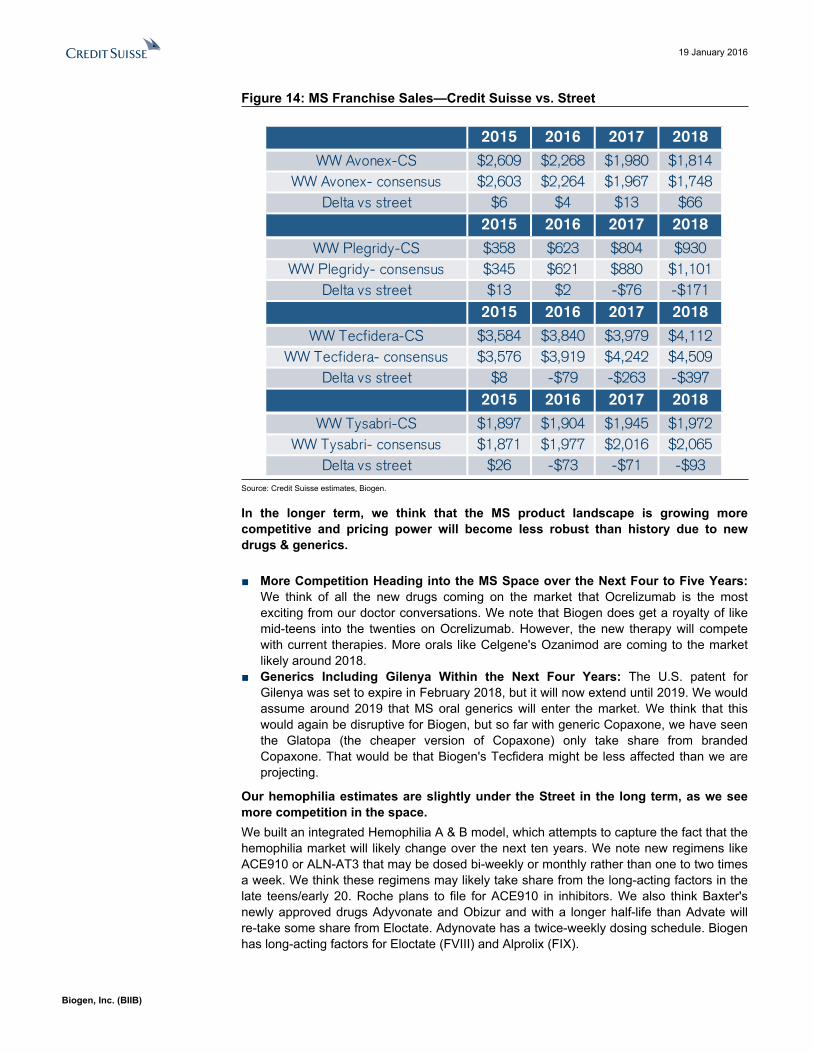
Figure 14: MS Franchise Sales—Credit Suisse vs. Street
2015 2016 2017 2018
WW Avonex-CS $2,609 $2,268 $1,980 $1,814WW Avonex- consensus $2,603 $2,264 $1,967 $1,748
Delta vs street $6 $4 $13 $662015 2016 2017 2018
WW Plegridy-CS $358 $623 $804 $930WW Plegridy- consensus $345 $621 $880 $1,101
Delta vs street $13 $2 -$76 -$1712015 2016 2017 2018
WW Tecfidera-CS $3,584 $3,840 $3,979 $4,112WW Tecfidera- consensus $3,576 $3,919 $4,242 $4,509
Delta vs street $8 -$79 -$263 -$3972015 2016 2017 2018
WW Tysabri-CS $1,897 $1,904 $1,945 $1,972WW Tysabri- consensus $1,871 $1,977 $2,016 $2,065
Delta vs street $26 -$73 -$71 -$93Source: Credit Suisse estimates, Biogen.
In the longer term, we think that the MS product landscape is growing more competitive and pricing power will become less robust than history due to new drugs & generics.
■ More Competition Heading into the MS Space over the Next Four to Five Years: We think of all the new drugs coming on the market that Ocrelizumab is the most exciting from our doctor conversations. We note that Biogen does get a royalty of like mid-teens into the twenties on Ocrelizumab. However, the new therapy will compete with current therapies. More orals like Celgene's Ozanimod are coming to the market likely around 2018.
■ Generics Including Gilenya Within the Next Four Years: The U.S. patent for Gilenya was set to expire in February 2018, but it will now extend until 2019. We would assume around 2019 that MS oral generics will enter the market. We think that this would again be disruptive for Biogen, but so far with generic Copaxone, we have seen the Glatopa (the cheaper version of Copaxone) only take share from branded Copaxone. That would be that Biogen's Tecfidera might be less affected than we are projecting.
Our hemophilia estimates are slightly under the Street in the long term, as we see more competition in the space.We built an integrated Hemophilia A & B model, which attempts to capture the fact that the hemophilia market will likely change over the next ten years. We note new regimens like ACE910 or ALN-AT3 that may be dosed bi-weekly or monthly rather than one to two times a week. We think these regimens may likely take share from the long-acting factors in the late teens/early 20. Roche plans to file for ACE910 in inhibitors. We also think Baxter's newly approved drugs Adyvonate and Obizur and with a longer half-life than Advate will re-take some share from Eloctate. Adynovate has a twice-weekly dosing schedule. Biogen has long-acting factors for Eloctate (FVIII) and Alprolix (FIX).

19 January 2016
Biogen, Inc. (BIIB) 10
Figure 15: Eloctate Revs—Credit Suisse vs. Consensus Figure 16: Alprolix—Credit Suisse vs. Consensus
$319
$467$509 $531
$329
$475
$673
$817
$0
$100
$200
$300
$400
$500
$600
$700
$800
$900
2015 2016 2017 2018
Eloctate - CS Eloctate - consensus
$236
$315$345 $336
$238
$313
$363$402
$0
$50
$100
$150
$200
$250
$300
$350
$400
$450
2015 2016 2017 2018
Alprolix - CS Alprolix - consensus
Source: Credit Suisse estimates, Biogen. Source: Credit Suisse estimates, Biogen.
Biogen's Pipeline—We Are Skeptical, So It's Hard for Us to Be More Bullish Here on Biogen SharesOur pipeline assumptions add $134/share to our Biogen DCF.We think the pipeline is very risky, and ultimately, we think to be bullish on Biogen shares here, we would need to assign more probability of success to many of their big market opportunities in Alzheimer's and Lingo. We currently assign value to their SMA program; Ocrelizumab; MT-1303, their S1P1 drug; and biosimilars in Europe.
Figure 17: Biogen Pipeline Assumptions—Credit Suisse
Biogen pipeline asset Indication Probability of success2025 peak sales to
Biogen (unadj)2025 peak sales to
Biogen (adj)
ISIS-SMNrxSpinal musclar atrophy
(SMA)65% $2,881 $1,873
Anti-Lingo MS remyelination 25% $7,184 $1,796 Ocrelizumab MS 100% $525 $525
Adacanumab & AD franchise Alzheimers 40% $9,071 $3,628 MT-1303 I&I 50% $1,409 $704 Biosimilars Various 100% $530 $530
Total $22,124 $9,580
Source: Credit Suisse estimates.
Biogen's two lead pipeline opportunities are the Alzheimer's franchise and the anti-Lingo franchise. In our DCF valuation, we have $100/share baked in for Lingo and Alzheimers. We would say the pipeline is mostly a free call option.We would slightly disagree with the statement that Biogen's pipeline is a completely free call option. We think investors likely have a ~25% probability assigned to these two programs, which could conceptually be over $5B products. We definitely think there is downside risk to shares if the MS Lingo program does not move forward. Based on us assigning a 25% probability of success, perhaps if the MS Lingo study is wildly successful, investors would assign 40-50%. We think it would be hard to be over 50% confident moving into Phase 3 of this program.

19 January 2016
Biogen, Inc. (BIIB) 11
We assume Lingo and the Alzheimer's franchises are worth ~$8B and ~$9B in 2025. These are the company's two biggest shots on goal, hence all the attention from the Street and investors.We assume a 25% probability of success on $7B peak revenues for Lingo and 40% probability of success on $7B peak revenues for the Alzheimer's (AD) franchise. If we assumed 100% success to Lingo and Alzheimers, our Biogen valuation is $488/share.
Figure 18: Lingo Sales—Credit Suisse Figure 19: AD Franchise Sales—Credit Suisse
$432$1,229
$2,221
$3,737
$5,355
$7,184$7,966$8,242$8,528$8,822$9,126
$0
$1,000
$2,000
$3,000
$4,000
$5,000
$6,000
$7,000
$8,000
$9,000
$10,000
2020 2021 2022 2023 2024 2025 2026 2027 2028 2029 2030
BIIB-33 revenues
$0
$2,000
$4,000
$6,000
$8,000
$10,000
$12,000
$14,000
$16,000
2020
2021
2022
2023
2024
2025
2026
2027
2028
2029
AD US AD-ex-US
Source: Credit Suisse estimates. Source: Credit Suisse estimates.
For Alzheimer's, it was hard for us to assign a typical Ph3 probability of success like 65-75%. We assign 40%, but read-through on Sola may increase probability if that works. Alzheimer's Program: Biogen's lead asset is aducanumab (an anti-amyloid Beta agent). We think the data that has emerged so far from the Prime study for aducanumab is encouraging that the drug has activity. We think it looks potentially to be the most potent. Our checks agreed with our view. Lilly Phase 3 data on Solanezumab (another anti-Amyloid Beta) could also drive some Biogen upside if that data works.
For Lingo, we assign a 25% probability of success. We are not sure if Synergy is going to show the definitive evidence, but we believe the programs continue forward after Synergy.Biogen has a pivotal moment on the Lingo program in 2016 with the Synergy program in MS patients. They are studying in a Phase 2 program Anti-Lingo1 with Avonex. Our checks have been skeptical about the program working on its primary endpoint, which is disability reduction. We could see some hints when considering the totality of the evidence. We think 25% fairly accounts for what we expect to be some progress this year with the Lingo program but not definitive evidence.
Data for nusinersen likely reads out in early 2017. We don't think that the drug gets approved by the FDA earlier than mid-2H 2017. SMA is worth ~$50/share at 100% success (we assume 65%)We know that IONS and Biogen are working with the regulators to see if nusinersen might be able to get to market faster for such a devastating disease as SMA. We are assuming that the drug comes to market in early 2017, so a faster outcome is upside to our estimates. We think there is clear proof of biology and concept with the Phase 1&2 study. The biggest risk is clinical for this program and showing a benefit in Phase 3. We do wonder (from looking at DMD) if there might be a clinical path if the Phase 3 studies fail. For now, we assume a 65% probability of success on ~$3B sales to Biogen in 2025.

19 January 2016
Biogen, Inc. (BIIB) 12
Biogen Valuation Our target price is $322 for Biogen. Like all four of our large caps, we are valuing Biogen shares using a DCF and a P/E multiple. We assign 50% to the DCF valuation and 50% to the P/E multiple valuation.
DCF: Our DCF valuation for Biogen is $284/share.We model cash flows out to 2029. We assign a 2% terminal growth rate, which is in-line with large-cap biotech companies with sustainable franchises. We assume an 8% discount rate, which is in-line with its large-cap peers (Gilead, Celgene, and Amgen).
P/E Multiple: Our forward P/E multiple valuation is $360/share. We estimate 2016 EPS of $17.75 (vs. consensus of $18.50). We assign a multiple of 20.3x to our 2016 EPS estimate. This multiple represents a 5% premium to the large-cap sector ex-Gilead and a 23% premium to the S&P 500. We believe that this multiple is justified due to Biogen's base business stability and several pipeline opportunities.
Risks to Our Neutral RatingKey Upside Risks■ Success (meaning hitting primary endpoint) on the anti-Lingo program in mid-2016■ Positive data that provides greater confidence around BAN2401 (anti-amyloid Beta
antibody)■ Tecfidera sales reaccelerate■ Hemophilia assets continue to take share in spite of competition■ SMA program gets to market earlier than our expectations through surprise regulatory
approval
Key Downside Risks ■ Anti-Lingo1 program discontinues after failure in Ph2 Synergy study■ Efficacy or safety concern with aducanumab Ph3 program■ Worse-than-expected MS and haemophilia sales during 2016■ SMA program has a surprise efficacy or safety failure in Ph3

19 January 2016
Biogen, Inc. (BIIB) 13
We Think There Are More Headwinds than Tailwinds When We Consider Biogen's MS FranchiseWe Built a Detailed Integrated MS Market Model for the U.S. and ROW That Captures All New and Current PlayersWe are more cautious on multiple sclerosis in the next years than the Street currently projects for the class. Our estimates are $150-600M under Street estimates over the next three years.We will discuss throughout this report many reasons why are cautious on the multiple sclerosis space. Since Biogen is a big player in the MS space, we are under Street estimates for many products. In particular, we are under estimates on Tecfidera and Tysabri. We think Avonex share does not erode as fast and are above consensus.
Figure 20: WW MS Sales—Credit Suisse Figure 21: Total MS Sales vs. Consensus
$0
$1,000
$2,000
$3,000
$4,000
$5,000
$6,000
$7,000
$8,000
$9,000
$10,000
2012
2013
2014
2015
2016
2017
2018
2019
2020
2021
2022
2023
2024
2025
WW Avonex -CS WW Plegridy- CS WW Tecfidera- CS WW Tysabri- CS
$8,635$8,708
$8,828$8,781
$9,105
$9,423
$8,200
$8,400
$8,600
$8,800
$9,000
$9,200
$9,400
$9,600
2016 2017 2018
WW sales Tecfidera, Tysabri, Avonex, and Plegridy
WW Biogen MS franchise- CS WW Biogen MS franchise- Consensus
Source: Credit Suisse estimates. Source: Credit Suisse estimates, Biogen.
By Far, the Most Exciting New Drug Is Ocrelizumab in Speaking to the Doctor CommunityWe do think Ocrelizumab is a blockbuster with peak sales of $4B, but Biogen gets a royalty.Biogen gets a royalty from that program of 13-25% on U.S. sales only. We start off with a 14% royalty, and our peak rate is 22%. We may learn more from Biogen in 2016 about royalty rates in more detail. We would view royalty rates as potentially material to Biogen sales, and it sounds like the company views it the same way.

19 January 2016
Biogen, Inc. (BIIB) 14
Figure 22: Ocrelizumab Sales Figure 23: Royalties Paid to Biogen
$0
$500
$1,000
$1,500
$2,000
$2,500
$3,000
2016 2017 2018 2019 2020 2021 2022 2023 2024 2025 2026 2027 2028
Ocrelizumab sales
Ocrelizumab US
$8
$84
$219
$326 $380
$452 $487 $499 $512 $525 $538 $551 $564
$0
$100
$200
$300
$400
$500
$600
2016 2017 2018 2019 2020 2021 2022 2023 2024 2025 2026 2027 2028
Ocra royalties to BIIB
Ocrelizumab Royalties to Biogen
Source: Credit Suisse estimates. Source: Credit Suisse estimates.
We think MS overall is becoming more competitive, which creates challenges for Biogen, given it still has a significant portion of revenues coming from multiple sclerosis. Over the next few years, we think the MS landscape will become more competitive with many new agents potentially coming to market
Figure 24: Key MS Drugs on Market or in Development
Injectables Orals Intravenous
Avonex Aubagio TysabriBetaseron/Betaferon Gilenya Lemtrada
Copaxone Tecfidera OcrelizumabRebif Laquinimod Zinbryta (daclizumab)
Extavia OzanimodPlegridy MT-1303
Glatopa (generic Copaxone) siponimod (BAF312)
Source: Credit Suisse, Company data.
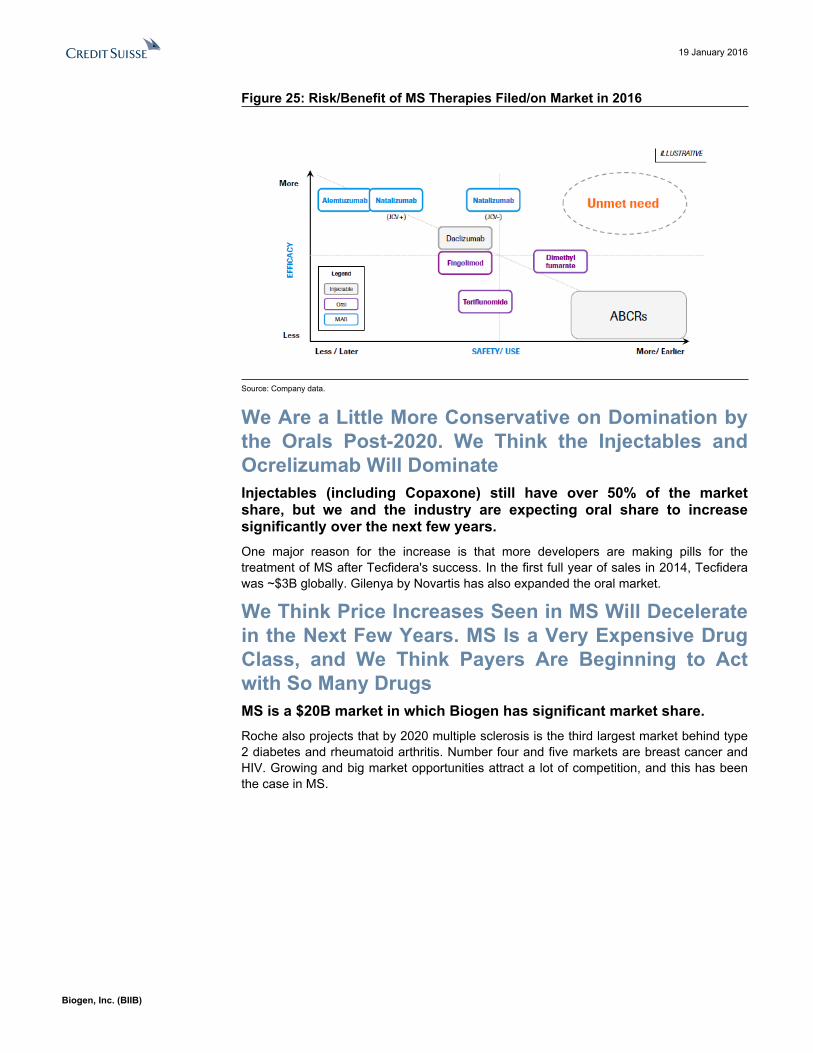
Our sense is that decision making for MS patients is very doctor/patient specific.Many of the potent drugs like Tysabri have less safety. Some of the injectables like Avonex are deemed to have less efficacy but more safety. Roche recently showed a diagram of the MS market and where each drug fell on the risk/benefit profile.
19 January 2016
Biogen, Inc. (BIIB) 15
Figure 25: Risk/Benefit of MS Therapies Filed/on Market in 2016
Source: Company data.
We Are a Little More Conservative on Domination by the Orals Post-2020. We Think the Injectables and Ocrelizumab Will DominateInjectables (including Copaxone) still have over 50% of the market share, but we and the industry are expecting oral share to increase significantly over the next few years.One major reason for the increase is that more developers are making pills for the treatment of MS after Tecfidera's success. In the first full year of sales in 2014, Tecfidera was ~$3B globally. Gilenya by Novartis has also expanded the oral market.
We Think Price Increases Seen in MS Will Decelerate in the Next Few Years. MS Is a Very Expensive Drug Class, and We Think Payers Are Beginning to Act with So Many DrugsMS is a $20B market in which Biogen has significant market share.Roche also projects that by 2020 multiple sclerosis is the third largest market behind type 2 diabetes and rheumatoid arthritis. Number four and five markets are breast cancer and HIV. Growing and big market opportunities attract a lot of competition, and this has been the case in MS.
19 January 2016
Biogen, Inc. (BIIB) 16
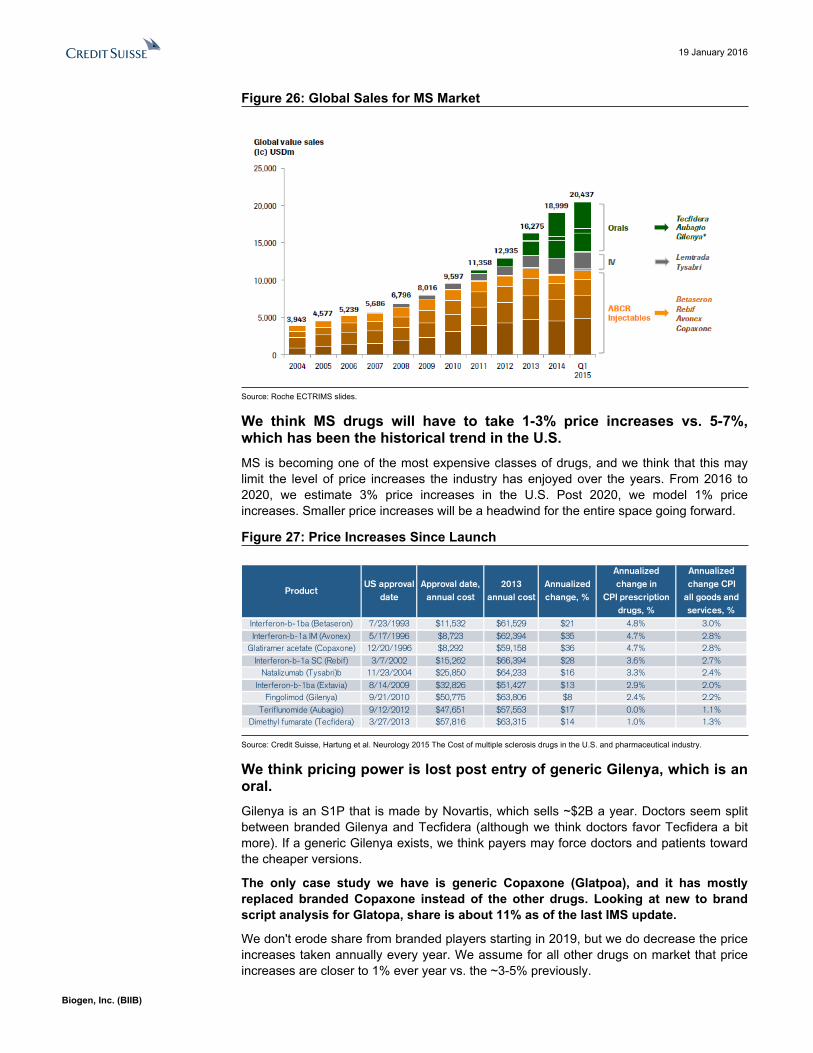
Figure 26: Global Sales for MS Market
Source: Roche ECTRIMS slides.
We think MS drugs will have to take 1-3% price increases vs. 5-7%, which has been the historical trend in the U.S.MS is becoming one of the most expensive classes of drugs, and we think that this may limit the level of price increases the industry has enjoyed over the years. From 2016 to 2020, we estimate 3% price increases in the U.S. Post 2020, we model 1% price increases. Smaller price increases will be a headwind for the entire space going forward.
Figure 27: Price Increases Since Launch
ProductUS approval
dateApproval date,
annual cost2013
annual costAnnualized change, %
Annualized change in
CPI prescription drugs, %
Annualized change CPI
all goods and services, %
Interferon-b-1ba (Betaseron) 7/23/1993 $11,532 $61,529 $21 4.8% 3.0%Interferon-b-1a IM (Avonex) 5/17/1996 $8,723 $62,394 $35 4.7% 2.8%
Glatiramer acetate (Copaxone) 12/20/1996 $8,292 $59,158 $36 4.7% 2.8%Interferon-b-1a SC (Rebif) 3/7/2002 $15,262 $66,394 $28 3.6% 2.7%
Natalizumab (Tysabri)b 11/23/2004 $25,850 $64,233 $16 3.3% 2.4%Interferon-b-1ba (Extavia) 8/14/2009 $32,826 $51,427 $13 2.9% 2.0%
Fingolimod (Gilenya) 9/21/2010 $50,775 $63,806 $8 2.4% 2.2%Teriflunomide (Aubagio) 9/12/2012 $47,651 $57,553 $17 0.0% 1.1%
Dimethyl fumarate (Tecfidera) 3/27/2013 $57,816 $63,315 $14 1.0% 1.3%
Source: Credit Suisse, Hartung et al. Neurology 2015 The Cost of multiple sclerosis drugs in the U.S. and pharmaceutical industry.
We think pricing power is lost post entry of generic Gilenya, which is an oral.Gilenya is an S1P that is made by Novartis, which sells ~$2B a year. Doctors seem split between branded Gilenya and Tecfidera (although we think doctors favor Tecfidera a bit more). If a generic Gilenya exists, we think payers may force doctors and patients toward the cheaper versions.
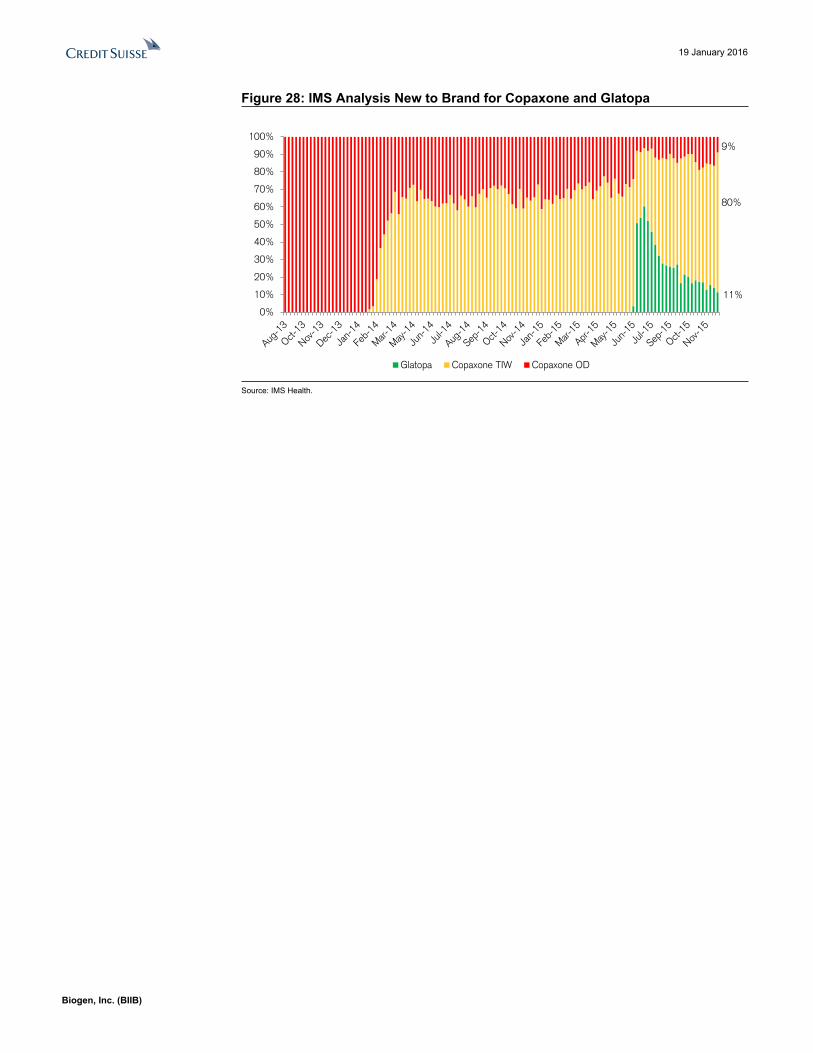
The only case study we have is generic Copaxone (Glatpoa), and it has mostly replaced branded Copaxone instead of the other drugs. Looking at new to brand script analysis for Glatopa, share is about 11% as of the last IMS update.
We don't erode share from branded players starting in 2019, but we do decrease the price increases taken annually every year. We assume for all other drugs on market that price increases are closer to 1% ever year vs. the ~3-5% previously.
19 January 2016
Biogen, Inc. (BIIB) 17
Figure 28: IMS Analysis New to Brand for Copaxone and Glatopa
0%
10%
20%
30%
40%
50%
60%
70%
80%
90%
100%
Glatopa Copaxone TIW Copaxone OD
9%
80%
11%
Source: IMS Health.

19 January 2016
Biogen, Inc. (BIIB) 18
We Think Tecfidera Is Stable for the Next Couple Years at ~$4B, but We Don't See Meaningful Share UptakeWe think Tecfidera sales grow mostly from price increases in the U.S going forwardWe assume market shares were at their highest in 2015 and start to come down in the coming years. In the U.S., we think there are some pricing pressures that are starting to emerge around MS. We think Street numbers still need to come down a little bit over the near- and long-term
Figure 29: Tecfidera Sales—Credit Suisse Figure 30: Tecfidera Annual Market Share
$0
$500
$1,000
$1,500
$2,000
$2,500
$3,000
$3,500
$4,000
$4,500
2013
2014
2015
2016
2017
2018
2019
2020
2021
2022
2023
2024
2025
2026
2027
2028
Total Tecfidera revs -CS
$3,840 $3,979 $4,112 $4,098 $4,224$3,919
$4,242$4,509 $4,584 $4,617
$0
$500
$1,000
$1,500
$2,000
$2,500
$3,000
$3,500
$4,000
$4,500
$5,000
2016 2017 2018 2019 2020
Global Tecfidera Revs
WW Tecfidera revenues -CS WW Tecfidera - Consensus
Source: Credit Suisse estimates. Source: Credit Suisse estimates.
We assume Tecfidera has a flat market share in 2016 but remains the dominant oral regimen during the branded era.From looking at IMS scripts, we think share is remaining consistent at 19-20% for Tecfidera.
Figure 31: Weekly Trx Market Share Since Tecfidera Launch
0%
10%
20%
30%
40%
50%
60%
70%
80%
90%
100%Tecfidera
Aubagio
Gilenya
Tysabri
Lemtrada
Rebif
Plegridy
Extavia
Betaseron
Avonex
Glatopa
Copaxone OD
11%
6%
23%
7%
9%
20%
13%
2%
2%
ABCRs60%
Orals37%
88%
12%
4%
Source: IMS Health.

19 January 2016
Biogen, Inc. (BIIB) 19
We estimate that Biogen pays ~$1B in cash for 2016, 2017, and 2018 to Fumapharm for Tecfidera salesIn speaking to Biogen, roughly every $1B in Tecfidera sales is about $300M in cash paid to Fumapharma. Cash is paid to Fumapharma until Tecfidera sells a cumulative $20B globally. We estimate that happens in 2019. This cash outflow is subtracted from our discounted cash flow analysis.
Why We Are More Conservative on Tecfidera? Doc Checks and ScriptsOur doc checks around Tecfidera suggested similar trends that we are modeling. Two main issues are GI and worries about PML.Our doc checks support our modeling assumption that market share likely peaked in 1H 2015. In the general community prescriber mind, we think that GI issues and PML still worry doctors.
Gastrointestinal (GI):
Tecfidera is an oral dimethyl fumerate, which has been used in psoriasis in Germany for well over ten years. GI side effects are known of the class and were seen in Biogen's Phase 3 clinical trials.
PML Cases:
We have seen some cases of PML with Tecfidera, which led to the FDA updating the label in late November 2014. From our doc checks, we think that this issue remains a concern for non-academic treating MS doctors. Even with the academic KOLs, they are certain more PML cases will emerge, which does not bother them unless the PML was seen in patients that did not have severe lymphopenia.
Figure 32: History of PML Tecfidera Cases
Date EventOctober 22, 2014 First case of PML reported
November 25, 2014FDA releases safety announcement
about 1st PML case, and subsequent label change, with Tecfidera
July 16th, 2015Second PML case reported in patient
with severe lymphopenia
September 21st, 2015Third PML case reported in patient with
severe lymphopenia
November 11th, 2015Fourth PML case reported in patient
with moderate lymphopeniaSource: Credit Suisse, Company data.
From looking at scripts for Tecfidera, we don't see much acceleration yet, although November and December are holiday months.Biogen is running a pretty robust direct-to-consumer campaign. We think the best way to see if Biogen is getting results is to just track the weekly scripts.

19 January 2016
Biogen, Inc. (BIIB) 20
Figure 33: Weekly Trx Ramp for Key MS Drugs Post Launch
0
2,000
4,000
6,000
8,000
10,000
12,000
1 5 9 13 17 21 25 29 33 37 41 45 49 53 57 61 65 69 73 77 81 85 89 93 97 101
105
109
113
117
121
125
129
133
137
141
Tecfidera Gilenya Aubagio Plegridy Glatopa Copaxone TIW
8,989
3,404
2,380
965759
10,273
Source: Credit Suisse, IMS Health.
IMS analysis suggests loss of share in new to brand, both from less switches and a lower share of new starts. NBRx (new to brand) measures the scripts of patients that are first-time users of the drug. Since this measures the patients at the margin (those switching drugs or new starts), we view NBRx as an important leading indicator for scripts.
Conclusions of Our Analysis:■ Declining NBRx share, both from declining share of new starts (NTS) and switches ■ TRx volumes flattening out as a result of declining share in new patients
Figure 34: NBRx Weekly Tecfidera Share
0%
10%
20%
30%
40%
50%
60%
70%
80%
90%
100%
2013
/11/
29…
2013
/12/
20…
2014
/01/
10…
2014
/01/
31…
2014
/02/
21…
2014
/03/
14…
2014
/04/
04…
2014
/04/
25…
2014
/05/
16…
2014
/06/
06…
2014
/06/
27…
2014
/07/
18…
2014
/08/
08…
2014
/08/
29…
2014
/09/
19…
2014
/10/
10…
2014
/10/
31…
2014
/11/
21…
2014
/12/
12…
2015
/01/
02…
2015
/01/
23…
2015
/02/
13…
2015
/03/
06…
2015
/03/
27…
2015
/04/
17…
2015
/05/
08…
2015
/05/
29…
2015
/06/
19…
2015
/07/
10…
2015
/07/
31…
2015
/08/
21…
2015
/09/
11…
2015
/10/
02…
2015
/10/
23…
2015
/11/
13…
2015
/12/
04…
NBRx Market Share
Tecfidera Gilenya Aubagio
Source: IMS.
19 January 2016
Biogen, Inc. (BIIB) 21
Figure 35: Switch Market Share Figure 36: NTS Market Share
0%
10%
20%
30%
40%
50%
60%
70%
80%
90%
100%
2013
/11/
29…
2013
/12/
13…
2013
/12/
27…
2014
/01/
10…
2014
/01/
24…
2014
/02/
07…
2014
/02/
21…
2014
/03/
07…
2014
/03/
21…
2014
/04/
04…
2014
/04/
18…
2014
/05/
02…
2014
/05/
16…
2014
/05/
30…
2014
/06/
13…
2014
/06/
27…
2014
/07/
11…
2014
/07/
25…
2014
/08/
08…
2014
/08/
22…
2014
/09/
05…
2014
/09/
19…
2014
/10/
03…
2014
/10/
17…
2014
/10/
31…
2014
/11/
14…
2014
/11/
28…
2014
/12/
12…
2014
/12/
26…
2015
/01/
09…
2015
/01/
23…
2015
/02/
06…
2015
/02/
20…
2015
/03/
06…
2015
/03/
20…
2015
/04/
03…
2015
/04/
17…
2015
/05/
01…
2015
/05/
15…
2015
/05/
29…
2015
/06/
12…
2015
/06/
26…
2015
/07/
10…
2015
/07/
24…
2015
/08/
07…
2015
/08/
21…
2015
/09/
04…
2015
/09/
18…
2015
/10/
02…
2015
/10/
16…
2015
/10/
30…
2015
/11/
13…
2015
/11/
27…
Switch / Add Rx Market Share
Tecfidera Gilenya Aubagio
0%
10%
20%
30%
40%
50%
60%
70%
80%
90%
100%
2013
/11/
29…
2013
/12/
20…
2014
/01/
10…
2014
/01/
31…
2014
/02/
21…
2014
/03/
14…
2014
/04/
04…
2014
/04/
25…
2014
/05/
16…
2014
/06/
06…
2014
/06/
27…
2014
/07/
18…
2014
/08/
08…
2014
/08/
29…
2014
/09/
19…
2014
/10/
10…
2014
/10/
31…
2014
/11/
21…
2014
/12/
12…
2015
/01/
02…
2015
/01/
23…
2015
/02/
13…
2015
/03/
06…
2015
/03/
27…
2015
/04/
17…
2015
/05/
08…
2015
/05/
29…
2015
/06/
19…
2015
/07/
10…
2015
/07/
31…
2015
/08/
21…
2015
/09/
11…
2015
/10/
02…
2015
/10/
23…
2015
/11/
13…
2015
/12/
04…
NTSRx Market Share
Tecfidera Gilenya Aubagio
Source: IMS Health. Source: IMS Health.
Figure 37: Week Tecfidera TRx
2,000
4,000
6,000
8,000
10,000
12,000
2013
/11/
29…
2013
/12/
20…
2014
/01/
10…
2014
/01/
31…
2014
/02/
21…
2014
/03/
14…
2014
/04/
04…
2014
/04/
25…
2014
/05/
16…
2014
/06/
06…
2014
/06/
27…
2014
/07/
18…
2014
/08/
08…
2014
/08/
29…
2014
/09/
19…
2014
/10/
10…
2014
/10/
31…
2014
/11/
21…
2014
/12/
12…
2015
/01/
02…
2015
/01/
23…
2015
/02/
13…
2015
/03/
06…
2015
/03/
27…
2015
/04/
17…
2015
/05/
08…
2015
/05/
29…
2015
/06/
19…
2015
/07/
10…
2015
/07/
31…
2015
/08/
21…
2015
/09/
11…
2015
/10/
02…
2015
/10/
23…
2015
/11/
13…
2015
/12/
04…
Tecfidera TRx Weekly
Source: IMS Health.
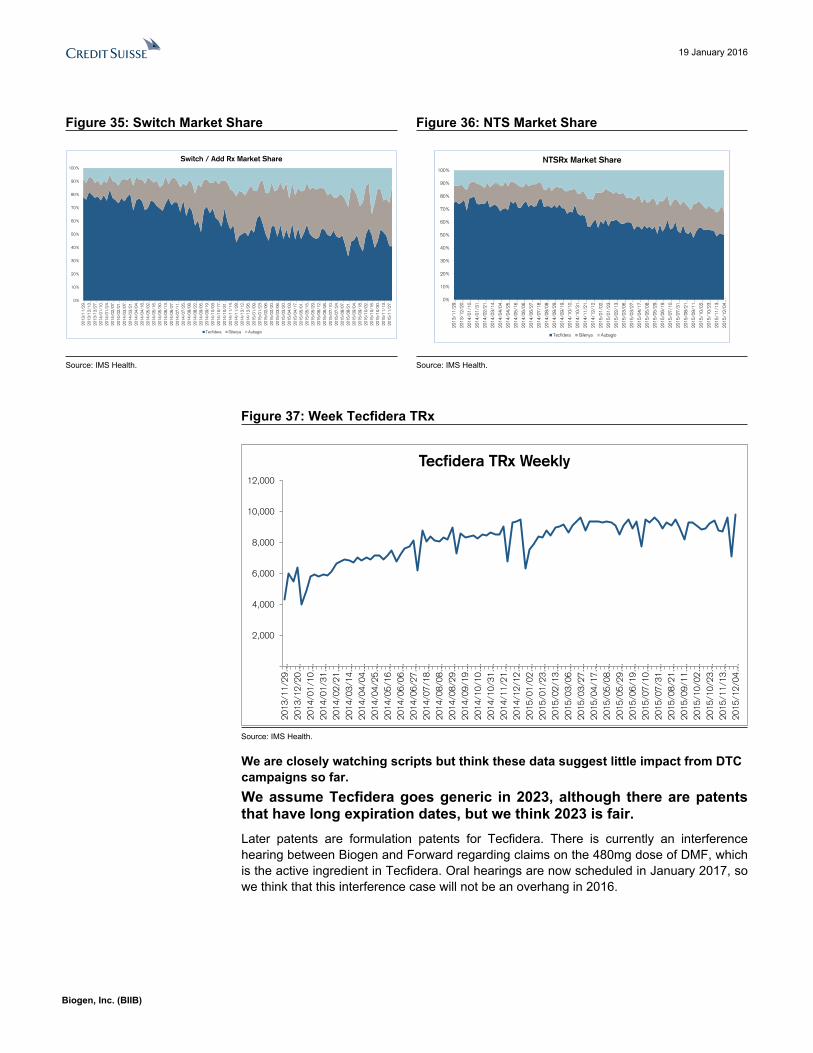
We are closely watching scripts but think these data suggest little impact from DTC campaigns so far. We assume Tecfidera goes generic in 2023, although there are patents that have long expiration dates, but we think 2023 is fair.Later patents are formulation patents for Tecfidera. There is currently an interference hearing between Biogen and Forward regarding claims on the 480mg dose of DMF, which is the active ingredient in Tecfidera. Oral hearings are now scheduled in January 2017, so we think that this interference case will not be an overhang in 2016.

19 January 2016
Biogen, Inc. (BIIB) 22
MT-1303—S1P1 Similar to Ozanimod Moving into Phase 3 for UC and Crohn'sWe assign a 50% probability to $1.4B sales in 2025; we think the big year for this program isn't really until 2018.MT-1303 is partnered with Mitsubishi (worldwide rights to Biogen, Asia rights to Mitsubishi). MT-1303 has the same target as Ozanimod (Phase 3) and Gilenya (marketed in MS). Biogen has not yet decided if it will pursue MT-1303 in MS, so for now the focus is the Crohn's and Ulcerative Colitis (UC) Phase 3 programs beginning in the second half of 2016.
Preclinical and clinical comparisons of S1P1 modulators suggest MT-1303 could have higher specificity, but all eyes on Ozanimod and MT-1303 Phase 3.
Figure 38: BIIB's Comparison of S1P1 Assets
Source: Company data.
Phase 2 data in MS suggests early hints of better efficacy than other S1P1 modulators, but we have yet to see efficacy data in UC and Crohn's, which are what Biogen is studying in Phase 3.So far, we have seen data from a placebo-controlled Phase 2 study in MS. Early data suggest we may see greater activity than with other S1P1 inhibitors, Ozanimod (Phase 3), and Gilenya (marketed).
Multiple Sclerosis data takes:
■ Overall: Comparable or better lymphocyte count reduction, reduction in cumulative Gd +T1 lesions and reduction in annual relapse rates with Ozanimod and Gilenya (not head to head)
■ Better ARR reduction in early studies could pan out to show higher efficacy in Phase 3: Higher reduction in annual relapse rates (ARR) in the highest dose cohort (.4mg) of 82% vs. 53% for Ozanimod and 54% for Gilenya suggests early hints of better efficacy.

19 January 2016
Biogen, Inc. (BIIB) 23
Phase 3 programs will begin in 2016 in UC and Crohn's. Biogen plans to run two Phase 3s for each program: a placebo-controlled ten-week induction followed by a 52-week placebo-controlled maintenance study. The first patient is anticipated in 2H16. We think we could potentially get ten-week data in 2017 but won't really learn more from these studies until 2018.
Mitsubishi is running a Phase 2 study in Crohn's that could potentially read out in the second half of 2016 or 2017. We note that on clinicaltrials.gov (NCT02378688), Mitsubishi (Biogen's partner) is running a Phase 2 trial in Crohn's that could potentially read out in the second half of 2016 or early 2017. We do not know the status of this trial, but if Misubishi releases the data, we think it would be a meaningful catalyst for the program.

19 January 2016
Biogen, Inc. (BIIB) 24
We See Increased Competition Coming Back to the Hemophilia Market in 2016 and BeyondWe expect a significant change in the hemophilia market over time due to therapies, which lead to longer dosing frequency to facilitate clotting.When Eloctate was approved for Hemophilia A, it was the only longer-acting factor on the market. However, Baxalta has been approved for a new longer-acting factor that is dosed bi-weekly. Bayer will soon have a longer-acting product on the market as well. In the longer term, we see real threats to the market from bi-weekly to monthly products for hemophilia. Currently, Alnylam and Roche both have therapies in Ph2 moving into Phase 3 that could be real category killers
Figure 39: New Hemophilia Therapies
Agent Developer Prophylaxis Dosing Status
Eloctate Biogen Every 3-5 days On marketAdynovate (BAX 855) Baxter Twice a week On market NovoEight/Zonovate Novo Nordisk 3-4 times a week On market
Advate Biogen 3-4 times a week On marketKogenate Bayer 3-4 times a week On market
Kovaltry (BAY 81-8973) Bayer Twice a week Application FiledACE910 Roche Biweekly-monthly Phase 2ALN-AT3 Alnylam Monthly - quarterly Phase 2
Source: Company data, Credit Suisse estimates.
We Have Built an Integrated Model That Includes Factor Therapies, Newer Targeted Therapies (Like ACE910 & ALN-AT3), and Gene Therapy. Our Takes from the ModelWe estimate that ~50% of the market is long-term factor market by 2023.We estimate that new longer-acting therapies take market starting around 2019-2022.
Figure 40: Estimated Timelines for Longer-Acting Agents
Market Agent Phase III Timeline Estimated Readout Estimated Launch
ACE910 Initiated December 2015 Mid 2017 Late 2018ALN-AT3 Initiate in Mid 2016 Late 2017 Early 2019ACE910 Initiate in 2016 Mid 2018 Late 2019ALN-AT3 Initiate in Mid 2016 Mid 2018 Late 2019
Factor IX ALN-AT3 Initiate in Mid 2016 Mid 2018 Late 2019
Inhibitors
Factor VIII
Source: Credit Suisse estimates, Company data.
Figure 41 shows the output from our integrated model around how the overall shares do change for the hemophilia market in the U.S. starting as early as 2020.

19 January 2016
Biogen, Inc. (BIIB) 25
Figure 41: U.S. Hemophilia A Market by Class of Therapy
0.0%10.0%20.0%30.0%40.0%50.0%60.0%70.0%80.0%90.0%
100.0%
2016
2017
2018
2019
2020
2021
2022
2023
2024
2025
2026
2027
2028
2029
Long acting factors ACE910 & ALN-AT3 Gene therapy
Source: Credit Suisse estimates.
By 2020, we do model some share taken by gene therapy products. There is no data so far in Hemophilia A; however, BioMarin may have early proof-of-concept data in 2016.We have attempted to capture all the key programs for treatment of Hemophilia A and B. We decided to build an integrated model to make sure that we were not giving any one hemophilia therapy or class too much market share.
Figure 42: U.S. Integrated Hemophilia Model
0%
10%
20%
30%
40%
50%
60%
70%
80%
90%
100%
2016 2017 2018 2019 2020 2021 2022 2023 2024 2025 2026 2027 2028 2029
Advate/Recombinate - Baxter Refacto - Pfizer Kogenate - Bayer
Helixate - CSL Eloctate - Biogen ACE910- Roche
ALN-AT3 - Alnylam BMN-270- BioMarin Other Gene therapy options
Source: Credit Suisse estimates.
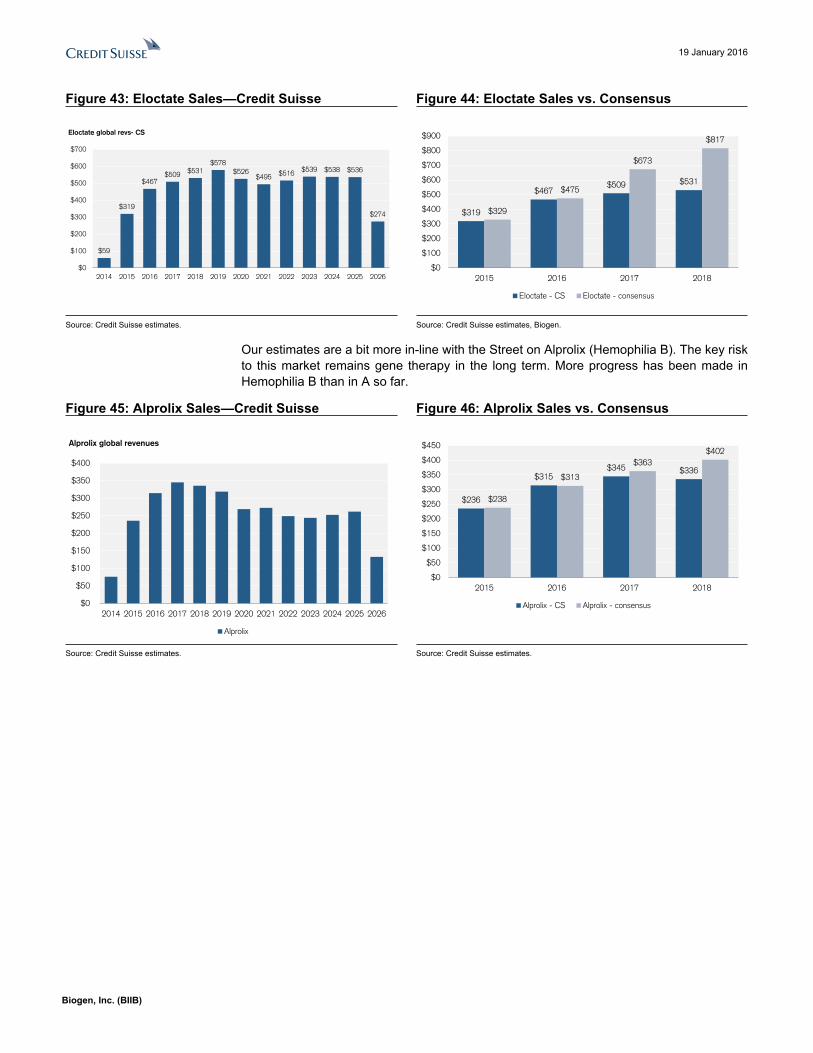
We assume a sustainable long-term share for Eloctate of 15% from our integrated market model. Our peak sales for Eloctate globally is $531M vs. consensus of $817M in 2018.We model more competition from new therapies starting in 2018. Therefore, our Eloctate estimates are well below consensus estimates in 2018.
19 January 2016
Biogen, Inc. (BIIB) 26
Figure 43: Eloctate Sales—Credit Suisse Figure 44: Eloctate Sales vs. Consensus
$59
$319
$467$509 $531
$578$526
$495 $516 $539 $538 $536
$274
$0
$100
$200
$300
$400
$500
$600
$700
2014 2015 2016 2017 2018 2019 2020 2021 2022 2023 2024 2025 2026
Eloctate global revs- CS
$319
$467$509 $531
$329
$475
$673
$817
$0
$100
$200
$300
$400
$500
$600
$700
$800
$900
2015 2016 2017 2018
Eloctate - CS Eloctate - consensus
Source: Credit Suisse estimates. Source: Credit Suisse estimates, Biogen.
Our estimates are a bit more in-line with the Street on Alprolix (Hemophilia B). The key risk to this market remains gene therapy in the long term. More progress has been made in Hemophilia B than in A so far.
Figure 45: Alprolix Sales—Credit Suisse Figure 46: Alprolix Sales vs. Consensus
$0
$50
$100
$150
$200
$250
$300
$350
$400
2014 2015 2016 2017 2018 2019 2020 2021 2022 2023 2024 2025 2026
Alprolix global revenues
Alprolix
$236
$315$345 $336
$238
$313
$363$402
$0
$50
$100
$150
$200
$250
$300
$350
$400
$450
2015 2016 2017 2018
Alprolix - CS Alprolix - consensus
Source: Credit Suisse estimates. Source: Credit Suisse estimates.

19 January 2016
Biogen, Inc. (BIIB) 27
We Are Still Cautious on LINGO, but We Do Give the Program Some Credit in Our ValuationBiogen Is Going for the Holy Grail of MS Treatment with Anti-LINGO Therapy to Promote Re-Myelination Re-myelination is a concept that is clearly distinct from immune modulation, and we know demyelination is the key pathological feature of MS.Multiple sclerosis (MS) is an immune mediated disease involving the central nervous system in which lymphocytes invade and attack myelin. This leads to de-myelination and the neurons being degraded. MS is currently treated with drugs that dampen an overactive immune response to lower disease activity. Remyelination is an endogenous repair mechanism that restores functions of axons that have lost their coating, and it also delays their deterioration.
Figure 47: Re-Myelination vs. Immune Modulation
Source: Company data, Credit Suisse.
Anti-LINGO would be absolutely revolutionary in the world of MS, and it would be used on top of current MS drugs. Anti-LINGO is Biogen's fully humanized antibody that is currently in Phase 2. The IP is robust with protection out to the late 2020s. LINGO-1 is a protein on the cell surface that controls the axons' (nerve fibers) ability to meyelinate and regenerate.
The company also has an oral pill (BIIB061) for re-meylination that is Phase 2 ready.
There is clear scientific evidence that anti-LINGO is involved with remyelination, but this protein is not the only one involved.Myelination is the coating of fat around axons that allows for more efficient nerve impulse conduction. When anti-LINGO is activated, it is a brake on normal nerve functioning. When the break is lifted with an anti-LINGO antibody, normal nerve functioning should resume.
19 January 2016
Biogen, Inc. (BIIB) 28
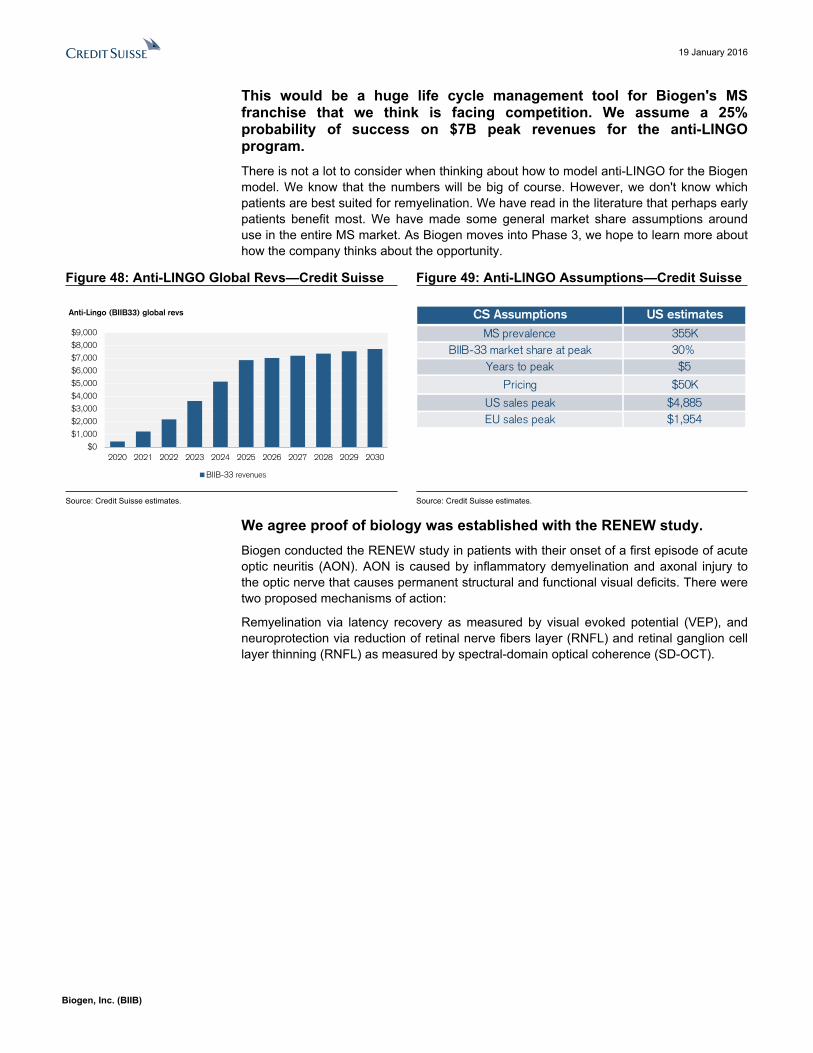
This would be a huge life cycle management tool for Biogen's MS franchise that we think is facing competition. We assume a 25% probability of success on $7B peak revenues for the anti-LINGO program.There is not a lot to consider when thinking about how to model anti-LINGO for the Biogen model. We know that the numbers will be big of course. However, we don't know which patients are best suited for remyelination. We have read in the literature that perhaps early patients benefit most. We have made some general market share assumptions around use in the entire MS market. As Biogen moves into Phase 3, we hope to learn more about how the company thinks about the opportunity.
Figure 48: Anti-LINGO Global Revs—Credit Suisse Figure 49: Anti-LINGO Assumptions—Credit Suisse
$0
$1,000
$2,000
$3,000
$4,000
$5,000
$6,000
$7,000
$8,000
$9,000
2020 2021 2022 2023 2024 2025 2026 2027 2028 2029 2030
Anti-Lingo (BIIB33) global revs
BIIB-33 revenues
CS Assumptions US estimates
MS prevalence 355KBIIB-33 market share at peak 30%
Years to peak $5
Pricing $50K
US sales peak $4,885EU sales peak $1,954
Source: Credit Suisse estimates. Source: Credit Suisse estimates.
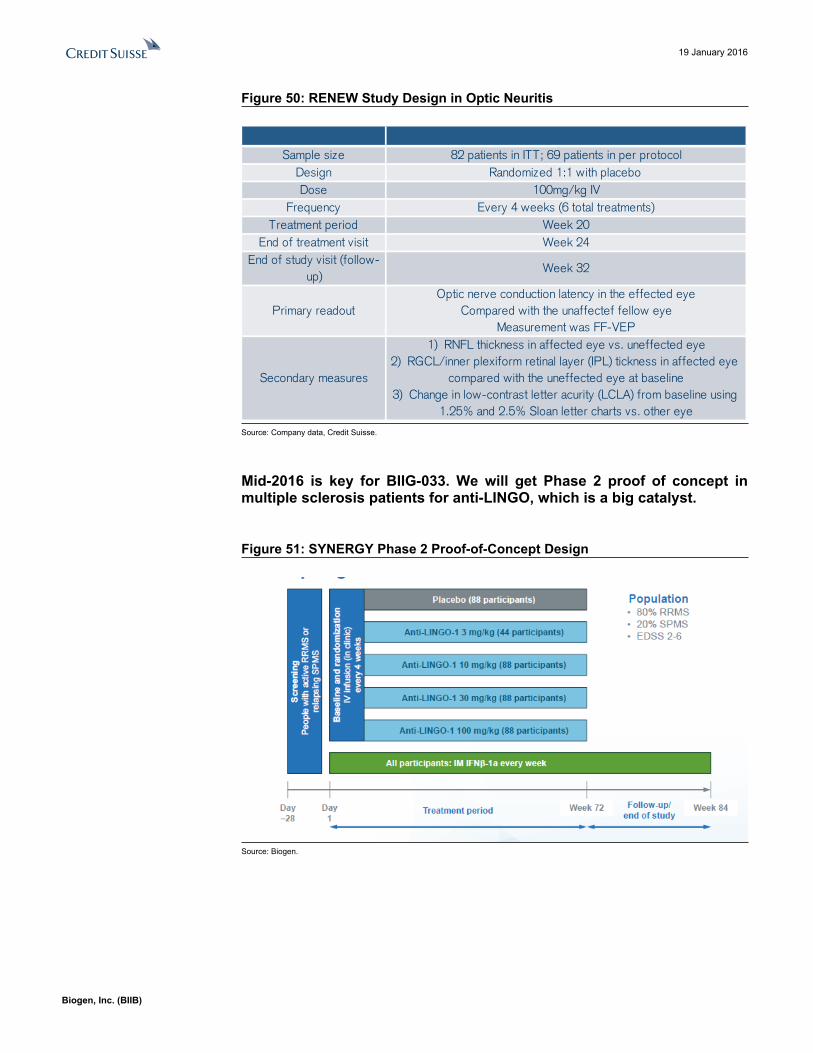
We agree proof of biology was established with the RENEW study.Biogen conducted the RENEW study in patients with their onset of a first episode of acute optic neuritis (AON). AON is caused by inflammatory demyelination and axonal injury to the optic nerve that causes permanent structural and functional visual deficits. There were two proposed mechanisms of action:
Remyelination via latency recovery as measured by visual evoked potential (VEP), and neuroprotection via reduction of retinal nerve fibers layer (RNFL) and retinal ganglion cell layer thinning (RNFL) as measured by spectral-domain optical coherence (SD-OCT).
19 January 2016
Biogen, Inc. (BIIB) 29
Figure 50: RENEW Study Design in Optic Neuritis
Sample size 82 patients in ITT; 69 patients in per protocolDesign Randomized 1:1 with placeboDose 100mg/kg IV
Frequency Every 4 weeks (6 total treatments)Treatment period Week 20
End of treatment visit Week 24End of study visit (follow-
up)Week 32
Primary readoutOptic nerve conduction latency in the effected eye
Compared with the unaffectef fellow eyeMeasurement was FF-VEP
Secondary measures
1) RNFL thickness in affected eye vs. uneffected eye2) RGCL/inner plexiform retinal layer (IPL) tickness in affected eye
compared with the uneffected eye at baseline3) Change in low-contrast letter acurity (LCLA) from baseline using
1.25% and 2.5% Sloan letter charts vs. other eye
Source: Company data, Credit Suisse.
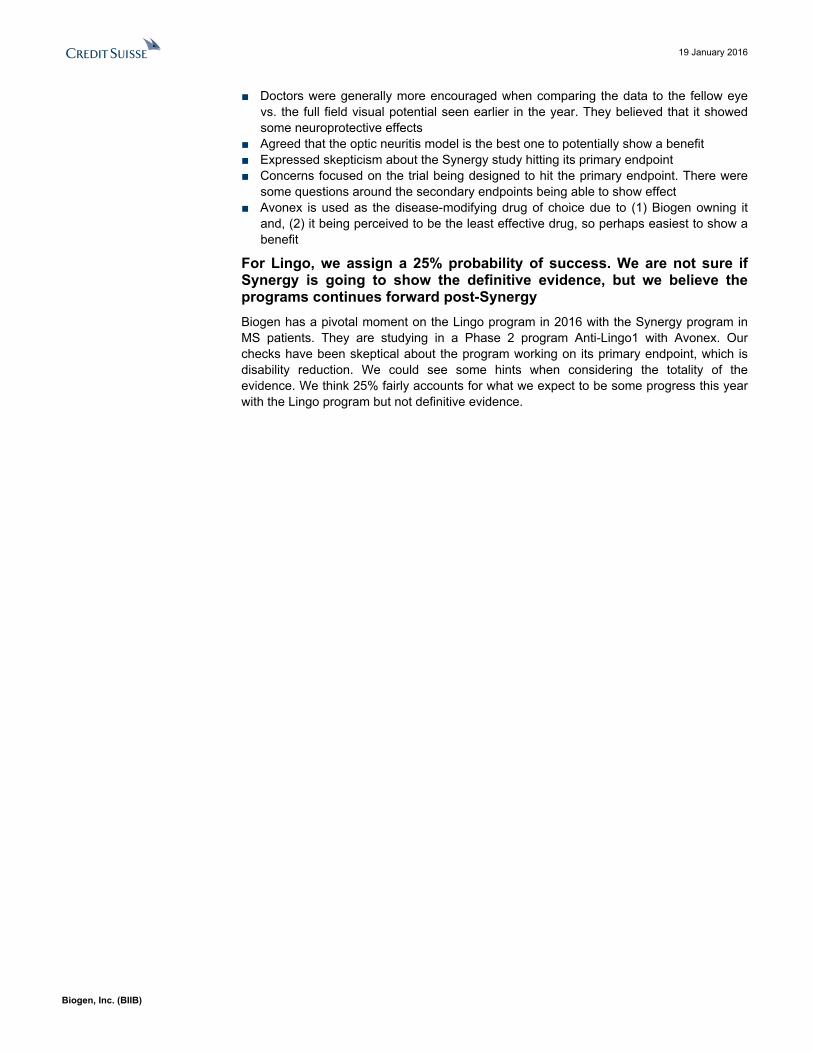
Mid-2016 is key for BIIG-033. We will get Phase 2 proof of concept in multiple sclerosis patients for anti-LINGO, which is a big catalyst.
Figure 51: SYNERGY Phase 2 Proof-of-Concept Design
Source: Biogen.

19 January 2016
Biogen, Inc. (BIIB) 30
Figure 52: SYNERGY Key Criteria
Locations US and Ex-USPatientPopulation
Includes RRMS or SPMS with ongoing disease activity within 12 months of enrollment Excludes RRMS patients with history of inadequate response to interferon β treatments Excludes patients who experienced a relapse within 90 days prior to Day 1/Baseline or have not been stabilized
from a previous relapse prior to ScreeningPrimary EndP Percentage of patients with confirmed improvement of neuro-physical and/or cognitive function and/or disabilityKey Secondary Endpoint(s)
Percentage of patients with confirmed worsening of neuro-physical and/or cognitive function and/or disability Advanced MRI analyses Safety (up to 84 weeks); Pharmacokinetic assessment (up to 84 weeks)
Readout Topline PII data expected in Mid-2016
Source: Company data, Credit Suisse.
Synergy study is a 400 patient study with RRMS and SPMS patients, with 68% of patients coming from Eastern Europe.Here are the key design points of the synergy study.
■ Four doses are being studied: 3, 10, 30, and 100mg/kg every 4 weeks via IV■ Placebo controlled■ Avonex is given weekly■ Patients are dosed for 72 weeks and then followed for another 12 weeks■ 533 patients were screened, and 418 patients were randomized and received at least
one dose of study medication■ Includes 330 RRMS patients and 88 SPMS patients■ Mean age is 40, and SPMS patients were a bit older■ 69% of patients had two or more relapses in two years■ 72 sites in 12 countries■ 68% of the patients are from Eastern Europe, with about 15% from the U.S.
The design has many different endpoints to fully understand the potential benefit of the anti-LINGO one. In speaking to Biogen, we might expect a top-line readout and then full data perhaps at a medical meeting. (We would guess ECTRIMS.)The primary endpoint in Synergy is a composite one based on disability measured by EDSS, cognitive function, physical function including timed walking, and upper limit function. MRI relevant endpoints in this study are a change in brain volumes, change in magnetization transfer, and change in lesion diffusivity
Exploratory endpoints include:
■ Changes in cognition as measured using the MS-COG, a composite cognitive endpoint of two tests of processing speed (two- and three-second PASAT and Symbol Digit Modality Test [SDMT]) and two tests of memory and learning (Selective Reminding Test [SRT] and Brief Visuospatial Memory Test-Revised [BVMT-R])
■ Severity of clinical relapses measured by Scripps Neurological Rating Scale ■ Worsening from baseline in six-minute walk (6MW) – ■ Analysis of diverse MRI endpoints, including the magnetization transfer ratio (MTR)
and diffusion tensor imaging (DTI)
Our most interesting findings came from the doctors, but they still expressed skepticism in the study achieving its primary endpoint. In our view, the totality of the evidence will be the focus here.■ More encouraged by data seen at ECTRIMS in the fall of 2015 vs. what was seen at
the AAN medical meeting in April
19 January 2016
Biogen, Inc. (BIIB) 31
■ Doctors were generally more encouraged when comparing the data to the fellow eye vs. the full field visual potential seen earlier in the year. They believed that it showed some neuroprotective effects
■ Agreed that the optic neuritis model is the best one to potentially show a benefit■ Expressed skepticism about the Synergy study hitting its primary endpoint■ Concerns focused on the trial being designed to hit the primary endpoint. There were
some questions around the secondary endpoints being able to show effect■ Avonex is used as the disease-modifying drug of choice due to (1) Biogen owning it
and, (2) it being perceived to be the least effective drug, so perhaps easiest to show a benefit
For Lingo, we assign a 25% probability of success. We are not sure if Synergy is going to show the definitive evidence, but we believe the programs continues forward post-SynergyBiogen has a pivotal moment on the Lingo program in 2016 with the Synergy program in MS patients. They are studying in a Phase 2 program Anti-Lingo1 with Avonex. Our checks have been skeptical about the program working on its primary endpoint, which is disability reduction. We could see some hints when considering the totality of the evidence. We think 25% fairly accounts for what we expect to be some progress this year with the Lingo program but not definitive evidence.
19 January 2016
Biogen, Inc. (BIIB) 32
We Think Nusinersen (ISIS-SMNrx) Readout Is a 2017 CatalystSpinal muscular atrophy is a rare disease that leads to progressive muscle atrophy and loss of motor function.SMA is a rare and devastating disease that is the leading cause of deaths in infants. There are currently no approved therapies. Nusinersen is a therapy that targets the genetic flaw of SMA. There are four different types of SMA with type 1 being the most severe, and patients live under six months.
We think the Phase 2 multiple dose study (MAD) has provided evidence that the drug has activity and has shown effectiveness in UN-CONTROLLED Ph2 studies.IONS plans to update their data from the multiple dose study this year. The last update was mid-2015. In April, the median event free age of four patients in the 6mg arm had gone from 16.3 mos to 19.9 mos and from 11.6 mos to 16.7 mos in the 12 mg arm. Of infants in the original group, seven saw their median age increase from 9.6 mos to 21 mos at the April 2015 update. As of the June 2015, there were no new events.
Data for nusinersen likely read out early 2017. We don't think that the drug gets approved by the FDA earlier than mid-2H 2017. SMA is worth ~$50/share at 100% success. (We assume 65%.)We know that IONS and Biogen are working with the regulators to see if nusinersen might be able to get to market faster for such a devastating disease as SMA. We are assuming that the drug comes to market in early 2017, so a faster outcome is upside to our estimates. We think there is clear proof of biology and concept with the Phase 1&2 study. The biggest risk is clinical for this program and showing a benefit in Phase 3. We do wonder (from looking at DMD) if there might be a clinical path if the Phase 3 studies fail. For now, we assume a 65% probability of success on ~$3B sales to Biogen in 2025.
Our peak sales are $3B for nusinersen.We assume a 70% market share in Type 1. We assume 45% share in type 2 and 25% share in type 3. The type 3 patients typically live full lives but have compromised quality of life, whether it be loss of mobility, sclerosis, or respiratory illnesses. The literature says with palliative care that their life span can be similar.

19 January 2016
Biogen, Inc. (BIIB) 33
Figure 53: Nusinersen Sales by Type—Credit Suisse
$0.0
$500.0
$1,000.0
$1,500.0
$2,000.0
$2,500.0
$3,000.0
$3,500.0
$4,000.0
2017
2018
2019
2020
2021
2022
2023
2024
2025
2026
2027
2028
SMA Type 1 sales SMA Type 2 sales SMA Type 3 sales
Source: Credit Suisse estimates, Company data.
19 January 2016
Biogen, Inc. (BIIB) 34
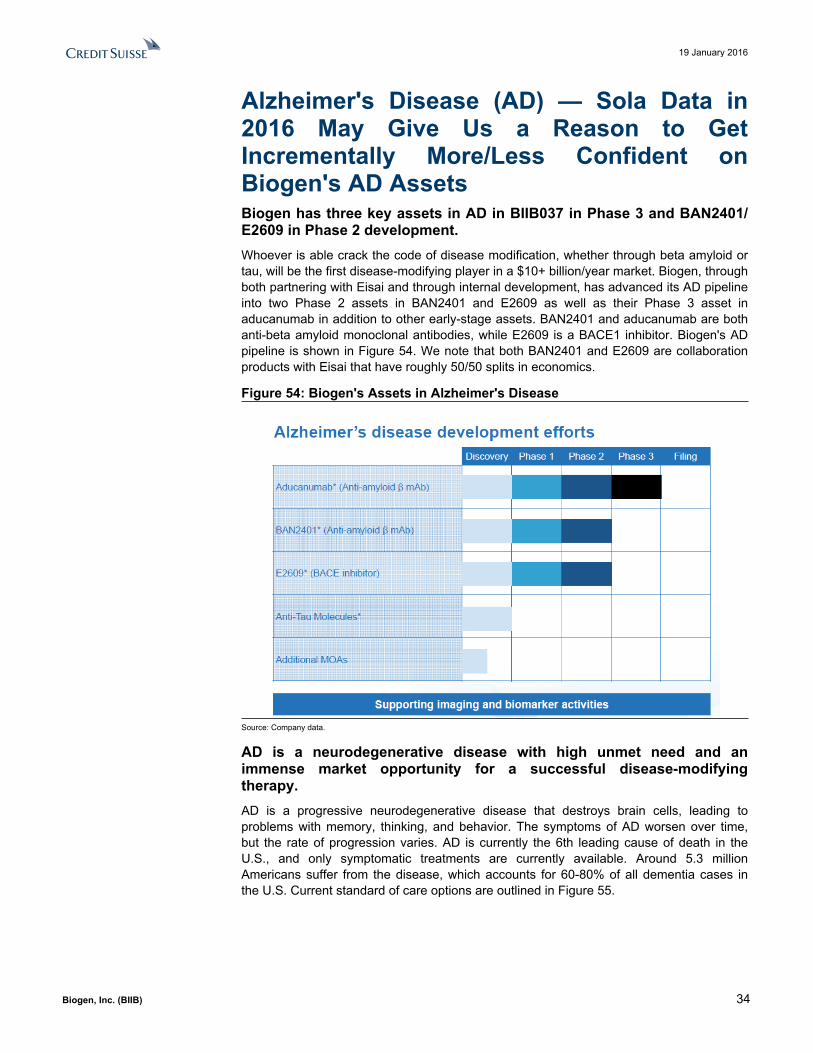
Alzheimer's Disease (AD) — Sola Data in 2016 May Give Us a Reason to Get Incrementally More/Less Confident on Biogen's AD AssetsBiogen has three key assets in AD in BIIB037 in Phase 3 and BAN2401/ E2609 in Phase 2 development.Whoever is able crack the code of disease modification, whether through beta amyloid or tau, will be the first disease-modifying player in a $10+ billion/year market. Biogen, through both partnering with Eisai and through internal development, has advanced its AD pipeline into two Phase 2 assets in BAN2401 and E2609 as well as their Phase 3 asset in aducanumab in addition to other early-stage assets. BAN2401 and aducanumab are both anti-beta amyloid monoclonal antibodies, while E2609 is a BACE1 inhibitor. Biogen's AD pipeline is shown in Figure 54. We note that both BAN2401 and E2609 are collaboration products with Eisai that have roughly 50/50 splits in economics.
Figure 54: Biogen's Assets in Alzheimer's Disease
Source: Company data.
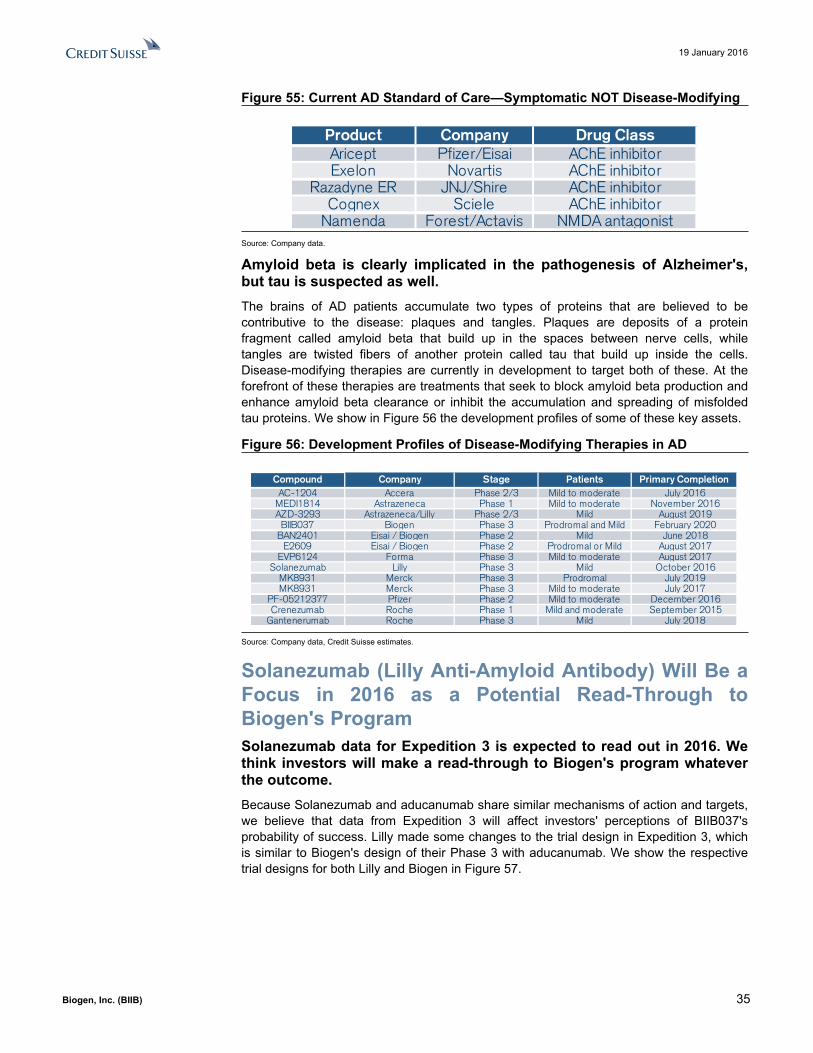
AD is a neurodegenerative disease with high unmet need and an immense market opportunity for a successful disease-modifying therapy.AD is a progressive neurodegenerative disease that destroys brain cells, leading to problems with memory, thinking, and behavior. The symptoms of AD worsen over time, but the rate of progression varies. AD is currently the 6th leading cause of death in the U.S., and only symptomatic treatments are currently available. Around 5.3 million Americans suffer from the disease, which accounts for 60-80% of all dementia cases in the U.S. Current standard of care options are outlined in Figure 55.
19 January 2016
Biogen, Inc. (BIIB) 35
Figure 55: Current AD Standard of Care—Symptomatic NOT Disease-Modifying
Product Company Drug ClassAricept Pfizer/Eisai AChE inhibitorExelon Novartis AChE inhibitor
Razadyne ER JNJ/Shire AChE inhibitorCognex Sciele AChE inhibitor
Namenda Forest/Actavis NMDA antagonistSource: Company data.
Amyloid beta is clearly implicated in the pathogenesis of Alzheimer's, but tau is suspected as well.The brains of AD patients accumulate two types of proteins that are believed to be contributive to the disease: plaques and tangles. Plaques are deposits of a protein fragment called amyloid beta that build up in the spaces between nerve cells, while tangles are twisted fibers of another protein called tau that build up inside the cells. Disease-modifying therapies are currently in development to target both of these. At the forefront of these therapies are treatments that seek to block amyloid beta production and enhance amyloid beta clearance or inhibit the accumulation and spreading of misfolded tau proteins. We show in Figure 56 the development profiles of some of these key assets.
Figure 56: Development Profiles of Disease-Modifying Therapies in AD
Compound Company Stage Patients Primary CompletionAC-1204 Accera Phase 2/3 Mild to moderate July 2016
MEDI1814 Astrazeneca Phase 1 Mild to moderate November 2016AZD-3293 Astrazeneca/Lilly Phase 2/3 Mild August 2019
BIIB037 Biogen Phase 3 Prodromal and Mild February 2020BAN2401 Eisai / Biogen Phase 2 Mild June 2018
E2609 Eisai / Biogen Phase 2 Prodromal or Mild August 2017EVP6124 Forma Phase 3 Mild to moderate August 2017
Solanezumab Lilly Phase 3 Mild October 2016MK8931 Merck Phase 3 Prodromal July 2019MK8931 Merck Phase 3 Mild to moderate July 2017
PF-05212377 Pfizer Phase 2 Mild to moderate December 2016Crenezumab Roche Phase 1 Mild and moderate September 2015
Gantenerumab Roche Phase 3 Mild July 2018
Source: Company data, Credit Suisse estimates.
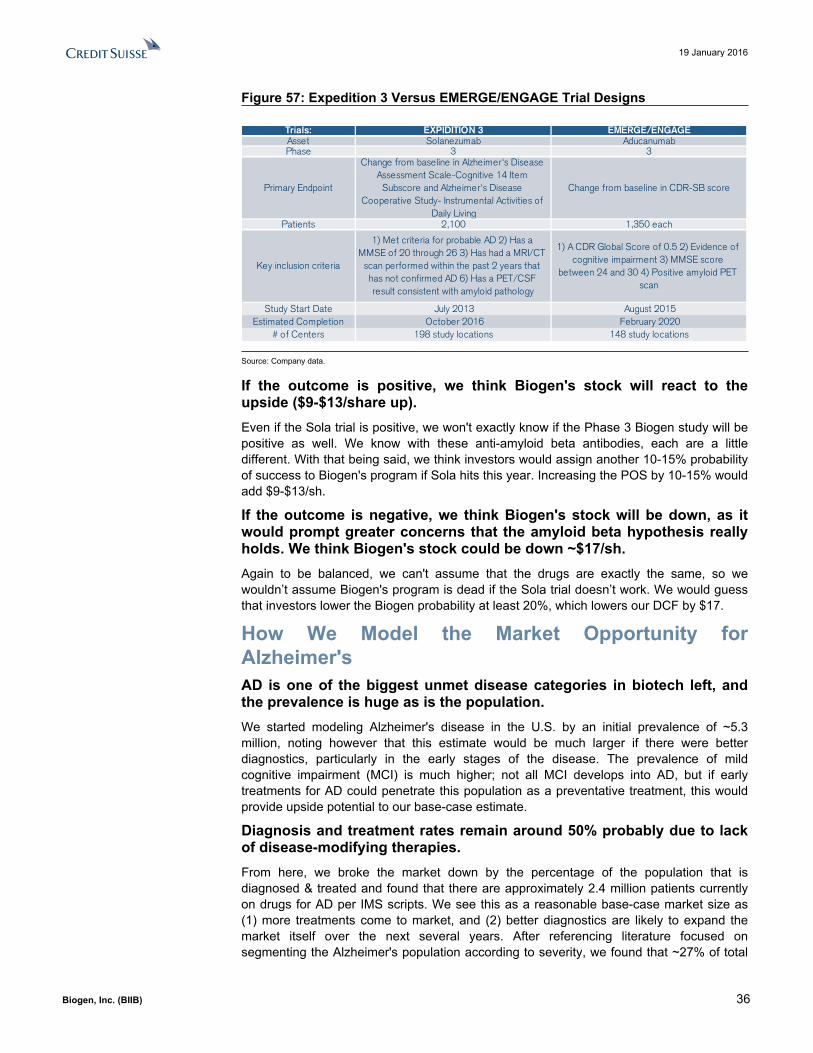
Solanezumab (Lilly Anti-Amyloid Antibody) Will Be a Focus in 2016 as a Potential Read-Through to Biogen's Program Solanezumab data for Expedition 3 is expected to read out in 2016. We think investors will make a read-through to Biogen's program whatever the outcome.Because Solanezumab and aducanumab share similar mechanisms of action and targets, we believe that data from Expedition 3 will affect investors' perceptions of BIIB037's probability of success. Lilly made some changes to the trial design in Expedition 3, which is similar to Biogen's design of their Phase 3 with aducanumab. We show the respective trial designs for both Lilly and Biogen in Figure 57.
19 January 2016
Biogen, Inc. (BIIB) 36
Figure 57: Expedition 3 Versus EMERGE/ENGAGE Trial Designs
Trials: EXPIDITION 3 EMERGE/ENGAGEAsset Solanezumab AducanumabPhase 3 3
Primary Endpoint
Change from baseline in Alzheimer's Disease Assessment Scale-Cognitive 14 Item
Subscore and Alzheimer's Disease Cooperative Study- Instrumental Activities of
Daily Living
Change from baseline in CDR-SB score
Patients 2,100 1,350 each
Key inclusion criteria
1) Met criteria for probable AD 2) Has a MMSE of 20 through 26 3) Has had a MRI/CT
scan performed within the past 2 years that has not confirmed AD 6) Has a PET/CSF result consistent with amyloid pathology
1) A CDR Global Score of 0.5 2) Evidence of cognitive impairment 3) MMSE score
between 24 and 30 4) Positive amyloid PET scan
Study Start Date July 2013 August 2015Estimated Completion October 2016 February 2020
# of Centers 198 study locations 148 study locations
Source: Company data.
If the outcome is positive, we think Biogen's stock will react to the upside ($9-$13/share up).Even if the Sola trial is positive, we won't exactly know if the Phase 3 Biogen study will be positive as well. We know with these anti-amyloid beta antibodies, each are a little different. With that being said, we think investors would assign another 10-15% probability of success to Biogen's program if Sola hits this year. Increasing the POS by 10-15% would add $9-$13/sh.
If the outcome is negative, we think Biogen's stock will be down, as it would prompt greater concerns that the amyloid beta hypothesis really holds. We think Biogen's stock could be down ~$17/sh.Again to be balanced, we can't assume that the drugs are exactly the same, so we wouldn’t assume Biogen's program is dead if the Sola trial doesn’t work. We would guess that investors lower the Biogen probability at least 20%, which lowers our DCF by $17.
How We Model the Market Opportunity for Alzheimer'sAD is one of the biggest unmet disease categories in biotech left, and the prevalence is huge as is the population.We started modeling Alzheimer's disease in the U.S. by an initial prevalence of ~5.3 million, noting however that this estimate would be much larger if there were better diagnostics, particularly in the early stages of the disease. The prevalence of mild cognitive impairment (MCI) is much higher; not all MCI develops into AD, but if early treatments for AD could penetrate this population as a preventative treatment, this would provide upside potential to our base-case estimate.
Diagnosis and treatment rates remain around 50% probably due to lack of disease-modifying therapies.From here, we broke the market down by the percentage of the population that is diagnosed & treated and found that there are approximately 2.4 million patients currently on drugs for AD per IMS scripts. We see this as a reasonable base-case market size as (1) more treatments come to market, and (2) better diagnostics are likely to expand the market itself over the next several years. After referencing literature focused on segmenting the Alzheimer's population according to severity, we found that ~27% of total

19 January 2016
Biogen, Inc. (BIIB) 37
diagnoses are classified as mild, which totaled ~650k. This was the first component of our addressable patient population.
We model the prodromal population separately and assume ~10% prodromal conversion rate annually to mild. This is a key assumption since it may be the case that these therapies work particularly well in this population.What is the prodromal population?Prodromal AD is a very early stage of the disease in which a person’s memory loss has become worse than what can be expected by the normal aging process alone but other areas of cognition and the daily living activities are not significantly affected.
Before seeing the Biogen slide, which showed the prodromal opportunity, we found many different estimates for the potential prodromal population.
We cited this population at ~3.8 million with approximately 10% of these patients eventually converting to the mild form of the disease. This was our second component of our patient population, which led us to a complete total slightly above 1M. We assumed similar market characteristics in the EU but with a higher initial prevalence of the disease at 8 million.
Figure 58: Biogen's Market Analysis on AD Based on Disease Course
Source: Company data.
In 2025 after a 2020 launch, we model Aducanumab sales of ~$9.1B, including both the U.S. and EUWe modeled a modest ramp across the market for Aducanumab in terms of share, taking eight years to reach a peak of 25%. We think the uptake will be slow for AD therapies due to (1) market size, (2) potential cost, and (3) efficacy seen. From a pricing perspective, we noted current standard of care annual pricing ~$3,000, but we believe an effective disease-modifying therapy could be priced ~13k after taking into account 25% gross-to-net discounting and a 70% compliance rate. We view this compliance rate as reasonable especially considering the more severe patients. We show in Figure 59 our key assumptions in both our U.S. and EU AD market models.

19 January 2016
Biogen, Inc. (BIIB) 38
Figure 59: Key Model Assumptions for U.S. and EU AD
AD Model Assumptions US EUAD Prevalence 5.3M 8.0M
Diagnosed and Treated % 45% 45%Mild % 27% 27%
Prodromal Patient Prevalence 3.8M 3.5MProdromal -to-Mild Conversion 10% 10%
Total Population 1.0M 1.3MLaunch Year 2020 2021
Years to Peak 8 8Peak Sales (2025) $5.4B $3.7B
Gross to net 25% 40%Compliance 70% 70%Net Price $13,125 $10,500
Source: Company data, Credit Suisse estimates.
Eisai Partnership Gives Biogen Two Additional Shots on Goal with ADIn March 2014, Biogen and Eisai entered into a collaboration agreement to develop and commercialize two AD assets in BAN2401 and E2609. The economics of the deal are roughly 50/50 expense and profit sharing.
E2609 is a beta-site amyloid precursor protein (APP) cleaving enzyme-1 (BACE1) inhibitor that seeks to block the production of beta-amyloid with the intent of slowing AD progression. BACE1 inhibitors have proven difficult for development in AD because of the complexity associated with designing an inhibitor that can pass through the blood–brain barrier. Figure 60 shows some of the key BACE programs currently in development.
Figure 60: Key BACE Programs Currently in Clinical Development
BACE Inhibitor Company Phase
AZD3293 Eli Lilly / Astrazeneca Phase 2/3CTS-21166 CoMentis Phase 1
E2609 Eisai / Biogen Phase 2LY2886721 Eli Lilly Phase 2 terminatedMK-8931 Merck Phase 2/3
PF-05297909 Pfizer Phase 1
Source: Company data, Credit Suisse estimates.
A multiple ascending dose Phase I for E2609 in healthies demonstrated target engagement and lowered amyloid-beta levels (as measured in cerebrospinal fluid) by >90%. The compound is currently in a Phase 2 study, with Biogen anticipating safety and tolerability data sometime in 2016.
BAN2401 is a humanized IgG1 monoclonal antibody that binds to species of beta-amyloid and removes and prevents it from aggregating into harmful plaques, which should slow the clinical progression of AD. This compound has a similar mechanism of action to aducanumab. BAN2401 has completed its Phase 1 study, demonstrating acceptable safety and tolerability, and is currently in an ongoing Phase 2 in subjects with early AD. Biogen anticipates top-line results of this Phase 2 study sometime in 2016. Figure 61 details the designs of both trials.

19 January 2016
Biogen, Inc. (BIIB) 39
Figure 61: BAN2401 and E2609 Trial Phase 2 Trial Designs
Phase 2 Designs E2609 BAN2401Phase 2 2Status Recruiting Recruiting
Primary Endpoint1) Change from baseline in the
derived ADCOMS at 18 months 2) Safety and tolerability
1) Change from baseline in the ADCOMS at 12 months 2) Safety and
tolerabilityPatients 700 800
Patient Population Mild/moderate Dementia due to AD Subjects With Early Alzheimer's Study Start Date November 2014 December 2012
Data readout 2016 (safety part 1 only) 2016Estimated Completion August 2017 June 2018
Source: Company data.
Note that we expect the data from these two assets will potentially be presented at either the Alzheimer's Association International Conference on July 24-28 or at CTAD on December 8-10.
19 January 2016
Biogen, Inc. (BIIB) 40
ManagementGeorge A. Scangos, Ph.D.—Chief Executive OfficerGeorge A. Scangos, Ph.D., is chief executive officer of Biogen and has served in this position and as a member of the board of directors since July 2010. From 1996 to July 2010, Dr. Scangos served as the president and chief executive officer of Exelixis, Inc., a drug discovery and development company, for which he continues to serve on the board. From 1993 to 1996, Dr. Scangos served as president of Bayer Biotechnology, for which he was responsible for research, business development, process development, manufacturing, engineering, and quality assurance of Bayer’s biological products.
Paul J. Clancy—Executive Vice President, Chief Financial OfficerPaul J. Clancy is Biogen's executive vice president, finance and chief financial officer and has served in these positions since August 2007. Mr. Clancy joined Biogen in 2001 and has held several senior executive positions with us, including vice president of business planning, portfolio management and U.S. marketing, and senior vice president of finance with responsibilities for leading the treasury, tax, investor relations and business planning groups.
Spyros Artavanis-Tsakonas, Ph.D.—Senior Vice President and Chief Scientific OfficerSpyros Artavanis-Tsakonas is senior vice president and chief scientific officer at Biogen, and has served in this position since May 2013. In 1998, Dr. Artavanis-Tsakonas joined the Harvard Faculty as professor of cell biology at the Harvard Medical School, for which, since 2015, he continues his affiliation as a professor emeritus of cell biology.
Susan Alexander — Executive Vice President, Chief Legal Officer and Corporate SecretarySusan H. Alexander is Biogen's executive vice president, chief legal officer and corporate secretary and has served in these positions since December 2011. Prior to that, from 2006 to December 2011, Ms. Alexander served as the executive vice president, general counsel, and corporate secretary.
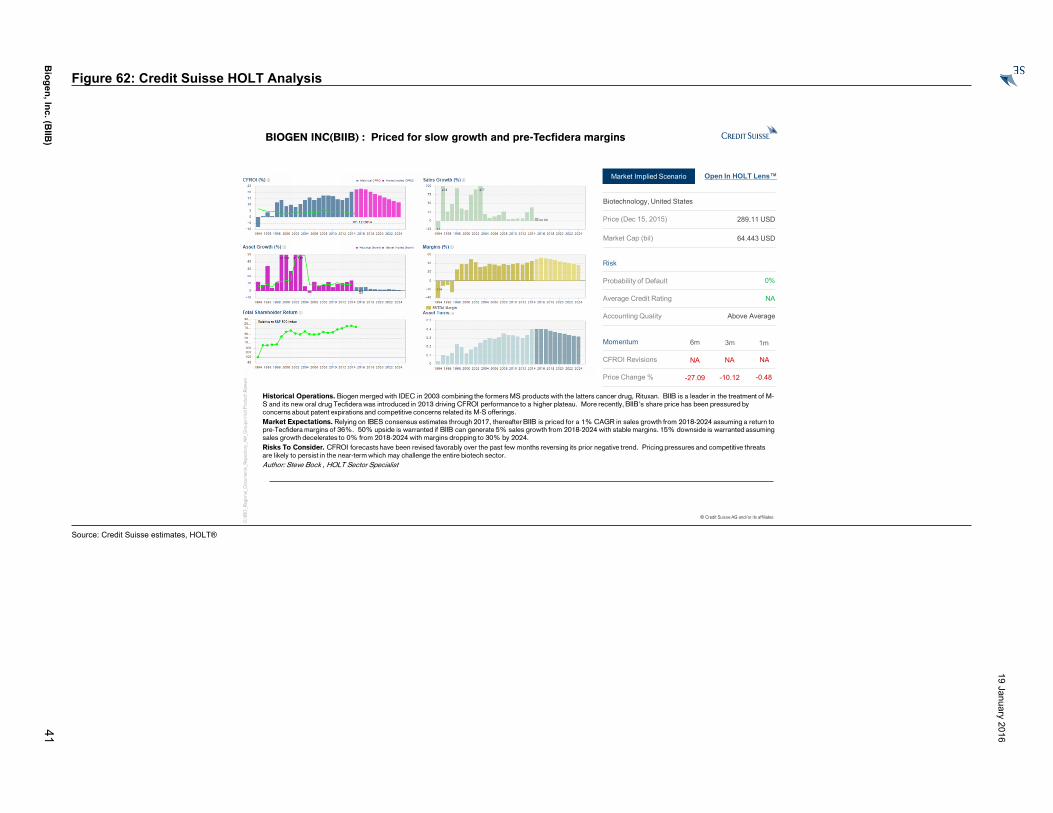
19 January 2016
Biogen, Inc. (B
IIB)
41
Figure 62: Credit Suisse HOLT Analysis
© Credit Suisse AG and/or its affiliates
Confidential
O:\
IBD
_Reg
iona
l_D
ocum
ents
_Rep
osito
ry_A
M_G
roup
s\H
olt P
rodu
ct\R
amam
urth
y\C
ampb
ell S
oup\
Cam
pbel
l Sou
p-v8
.ppt
x /
11/5
/201
5 /
12:5
1
BIOGEN INC(BIIB) : Priced for slow growth and pre-Tecfidera margins
Historical Operations. Biogen merged with IDEC in 2003 combining the formers MS products with the latters cancer drug, Rituxan. BIIB is a leader in the treatment of M-S and its new oral drug Tecfidera was introduced in 2013 driving CFROI performance to a higher plateau. More recently, BIIB's share price has been pressured by concerns about patent expirations and competitive concerns related its M-S offerings. Market Expectations. Relying on IBES consensus estimates through 2017, thereafter BIIB is priced for a 1% CAGR in sales growth from 2018-2024 assuming a return to pre-Tecfidera margins of 36%. 50% upside is warranted if BIIB can generate 5% sales growth from 2018-2024 with stable margins. 15% downside is warranted assuming sales growth decelerates to 0% from 2018-2024 with margins dropping to 30% by 2024.Risks To Consider. CFROI forecasts have been revised favorably over the past few months reversing its prior negative trend. Pricing pressures and competitive threats are likely to persist in the near-term which may challenge the entire biotech sector.Author: Steve Bock , HOLT Sector Specialist
Risk
Probability of Default
Average Credit Rating
Accounting Quality
Momentum
CFROI Revisions
Price Change %
Price (Dec 15, 2015)
Biotechnology, United States
289.11 USD
0%
NA
Above Average
NA NA NA
-27.09 -10.12 -0.48
6m 3m 1m
Market Implied Scenario Open In HOLT Lens™
Market Cap (bil) 64.443 USD
Source: Credit Suisse estimates, HOLT®
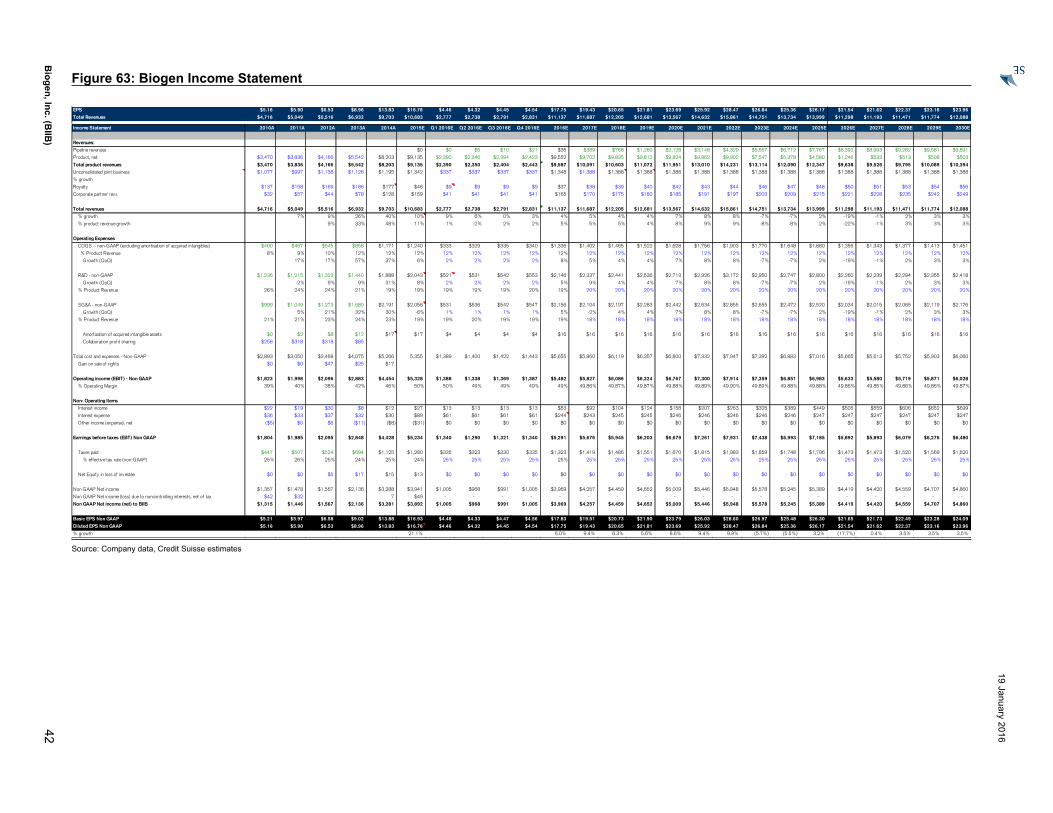
19 January 2016
Biogen, Inc. (B
IIB)
42
Figure 63: Biogen Income Statement
EPS $5.16 $5.90 $6.53 $8.96 $13.83 $16.76 $4.46 $4.32 $4.45 $4.54 $17.75 $19.43 $20.65 $21.81 $23.69 $25.92 $28.47 $26.84 $25.36 $26.17 $21.54 $21.62 $22.37 $23.16 $23.96
Total Revenues $4,716 $5,049 $5,516 $6,932 $9,703 $10,683 $2,777 $2,738 $2,791 $2,831 $11,137 $11,687 $12,205 $12,681 $13,567 $14,632 $15,861 $14,751 $13,734 $13,999 $11,298 $11,193 $11,471 $11,774 $12,088
Income Statement 2010A 2011A 2012A 2013A 2014A 2015E Q1 2016E Q2 2016E Q3 2016E Q4 2016E 2016E 2017E 2018E 2019E 2020E 2021E 2022E 2023E 2024E 2025E 2026E 2027E 2028E 2029E 2030E
Revenues:Pipeline revenues $0 $0 $5 $10 $21 $35 $389 $768 $1,260 $2,128 $3,148 $4,329 $5,567 $6,712 $7,767 $8,392 $8,993 $9,282 $9,581 $9,891
Product, net $3,470 $3,836 $4,166 $5,542 $8,203 $9,135 $2,390 $2,346 $2,394 $2,423 $9,552 $9,702 $9,835 $9,812 $9,824 $9,862 $9,902 $7,547 $5,378 $4,580 $1,246 $533 $513 $508 $503
Total product revenues $3,470 $3,836 $4,166 $5,542 $8,203 $9,135 $2,390 $2,350 $2,404 $2,443 $9,587 $10,091 $10,603 $11,072 $11,951 $13,010 $14,231 $13,114 $12,090 $12,347 $9,638 $9,526 $9,795 $10,089 $10,394Unconsolidated joint business $1,077 $997 $1,138 $1,126 $1,195 $1,342 $337 $337 $337 $337 $1,348 $1,388 $1,388 $1,388 $1,388 $1,388 $1,388 $1,388 $1,388 $1,388 $1,388 $1,388 $1,388 $1,388 $1,388
% growth
Royalty $137 $158 $169 $186 $177 $46 $9 $9 $9 $9 $37 $38 $39 $40 $42 $43 $44 $46 $47 $48 $50 $51 $53 $54 $56
Corporate partner revs $32 $57 $44 $78 $128 $159 $41 $41 $41 $41 $165 $170 $175 $180 $185 $191 $197 $203 $209 $215 $221 $228 $235 $242 $249
Total revenues $4,716 $5,049 $5,516 $6,932 $9,703 $10,683 $2,777 $2,738 $2,791 $2,831 $11,137 $11,687 $12,205 $12,681 $13,567 $14,632 $15,861 $14,751 $13,734 $13,999 $11,298 $11,193 $11,471 $11,774 $12,088% growth 7% 9% 26% 40% 10% 9% 6% 0% 3% 4% 5% 4% 4% 7% 8% 8% -7% -7% 2% -19% -1% 2% 3% 3%
% product revenue growth 9% 33% 48% 11% 1% -2% 2% 2% 5% 5% 5% 4% 8% 9% 9% -8% -8% 2% -22% -1% 3% 3% 3%
Operating ExpensesCOGS - non-GAAP (excluding amortisation of acquired intangibles) $400 $467 $545 $858 $1,171 $1,240 $333 $329 $335 $340 $1,336 $1,402 $1,465 $1,522 $1,628 $1,756 $1,903 $1,770 $1,648 $1,680 $1,356 $1,343 $1,377 $1,413 $1,451
% Product Revenue 8% 9% 10% 12% 12% 12% 12% 12% 12% 12% 12% 12% 12% 12% 12% 12% 12% 12% 12% 12% 12% 12% 12% 12% 12%
Growth (QoQ) 17% 17% 57% 37% 6% 2% 2% 2% 2% 8% 5% 4% 4% 7% 8% 8% -7% -7% 2% -19% -1% 2% 3% 3%
R&D - non-GAAP $1,236 $1,215 $1,323 $1,440 $1,888 $2,043 $521 $531 $542 $553 $2,146 $2,337 $2,441 $2,536 $2,713 $2,926 $3,172 $2,950 $2,747 $2,800 $2,260 $2,239 $2,294 $2,355 $2,418
Growth (QoQ) -2% 9% 9% 31% 8% 2% 2% 2% 2% 5% 9% 4% 4% 7% 8% 8% -7% -7% 2% -19% -1% 2% 3% 3%
% Product Revenue 26% 24% 24% 21% 19% 19% 19% 19% 19% 20% 19% 20% 20% 20% 20% 20% 20% 20% 20% 20% 20% 20% 20% 20% 20%
SG&A - non-GAAP $999 $1,049 $1,273 $1,680 $2,191 $2,056 $531 $536 $542 $547 $2,156 $2,104 $2,197 $2,283 $2,442 $2,634 $2,855 $2,655 $2,472 $2,520 $2,034 $2,015 $2,065 $2,119 $2,176
Growth (QoQ) 5% 21% 32% 30% -6% 1% 1% 1% 1% 5% -2% 4% 4% 7% 8% 8% -7% -7% 2% -19% -1% 2% 3% 3%
% Product Revenue 21% 21% 23% 24% 23% 19% 19% 20% 19% 19% 19% 18% 18% 18% 18% 18% 18% 18% 18% 18% 18% 18% 18% 18% 18%
Amortization of acquired intangible assets $0 $2 $8 $12 $17 $17 $4 $4 $4 $4 $16 $16 $16 $16 $16 $16 $16 $16 $16 $16 $16 $16 $16 $16 $16
Collaboration profit sharing $258 $318 $318 $85
Total cost and expenses - Non-GAAP $2,893 $3,050 $3,468 $4,075 $5,266 5,355 $1,389 $1,400 $1,422 $1,443 $5,655 $5,860 $6,119 $6,357 $6,800 $7,332 $7,947 $7,392 $6,883 $7,016 $5,665 $5,613 $5,752 $5,903 $6,060
Gain on sale of rights $0 $0 $47 $25 $17
Operating income (EBIT) - Non GAAP $1,823 $1,998 $2,096 $2,883 $4,454 $5,328 $1,388 $1,338 $1,369 $1,387 $5,482 $5,827 $6,086 $6,324 $6,767 $7,300 $7,914 $7,359 $6,851 $6,983 $5,633 $5,580 $5,719 $5,871 $6,028% Operating Margin 39% 40% 38% 42% 46% 50% 50% 49% 49% 49% 49% 49.86% 49.87% 49.87% 49.88% 49.89% 49.90% 49.89% 49.88% 49.88% 49.86% 49.85% 49.86% 49.86% 49.87%
Non- Operating ItemsInterest income $22 $19 $30 $8 $12 $27 $13 $13 $13 $13 $53 $92 $104 $124 $158 $207 $263 $325 $389 $449 $506 $559 $606 $652 $699
Interest expense $36 $33 $37 $32 $30 $89 $61 $61 $61 $61 $244 $243 $245 $245 $246 $246 $246 $246 $246 $247 $247 $247 $247 $247 $247
Other income (expense), net ($5) $0 $6 ($11) ($8) ($31) $0 $0 $0 $0 $0 $0 $0 $0 $0 $0 $0 $0 $0 $0 $0 $0 $0 $0 $0
Earnings before taxes (EBT) Non GAAP $1,804 $1,985 $2,095 $2,848 $4,428 $5,234 $1,340 $1,290 $1,321 $1,340 $5,291 $5,676 $5,945 $6,203 $6,679 $7,261 $7,931 $7,438 $6,993 $7,185 $5,892 $5,893 $6,079 $6,276 $6,480
Taxes paid $447 $507 $524 $694 $1,125 $1,280 $335 $323 $330 $335 $1,323 $1,419 $1,486 $1,551 $1,670 $1,815 $1,983 $1,859 $1,748 $1,796 $1,473 $1,473 $1,520 $1,569 $1,620
% effective tax rate (non-GAAP) 25% 26% 25% 24% 25% 24% 25% 25% 25% 25% 25% 25% 25% 25% 25% 25% 25% 25% 25% 25% 25% 25% 25% 25% 25%
Net Equity in loss of investee $0 $0 $5 $17 $15 $13 $0 $0 $0 $0 $0 $0 $0 $0 $0 $0 $0 $0 $0 $0 $0 $0 $0 $0 $0
Non GAAP Net income $1,357 $1,478 $1,567 $2,136 $3,288 $3,941 $1,005 $968 $991 $1,005 $3,969 $4,257 $4,459 $4,652 $5,009 $5,446 $5,948 $5,578 $5,245 $5,389 $4,419 $4,420 $4,559 $4,707 $4,860
Non GAAP Net income (loss) due to noncontrolling interests, net of tax $42 $32 7 $49 - - - - - - - - - - - - - - - - - - -
Non GAAP Net income (net) to BIIB $1,315 $1,446 $1,567 $2,136 $3,281 $3,892 $1,005 $968 $991 $1,005 $3,969 $4,257 $4,459 $4,652 $5,009 $5,446 $5,948 $5,578 $5,245 $5,389 $4,419 $4,420 $4,559 $4,707 $4,860
Basic EPS Non GAAP $5.21 $5.97 $6.58 $9.02 $13.88 $16.93 $4.48 $4.33 $4.47 $4.56 $17.83 $19.51 $20.73 $21.90 $23.79 $26.03 $28.60 $26.97 $25.48 $26.30 $21.65 $21.73 $22.49 $23.28 $24.09
Diluted EPS Non GAAP $5.16 $5.90 $6.53 $8.96 $13.83 $16.76 $4.46 $4.32 $4.45 $4.54 $17.75 $19.43 $20.65 $21.81 $23.69 $25.92 $28.47 $26.84 $25.36 $26.17 $21.54 $21.62 $22.37 $23.16 $23.96% growth 21.1% 6.0% 9.4% 6.3% 5.6% 8.6% 9.4% 9.9% (5.7%) (5.5%) 3.2% (17.7%) 0.4% 3.5% 3.5% 3.5%
Source: Company data, Credit Suisse estimates
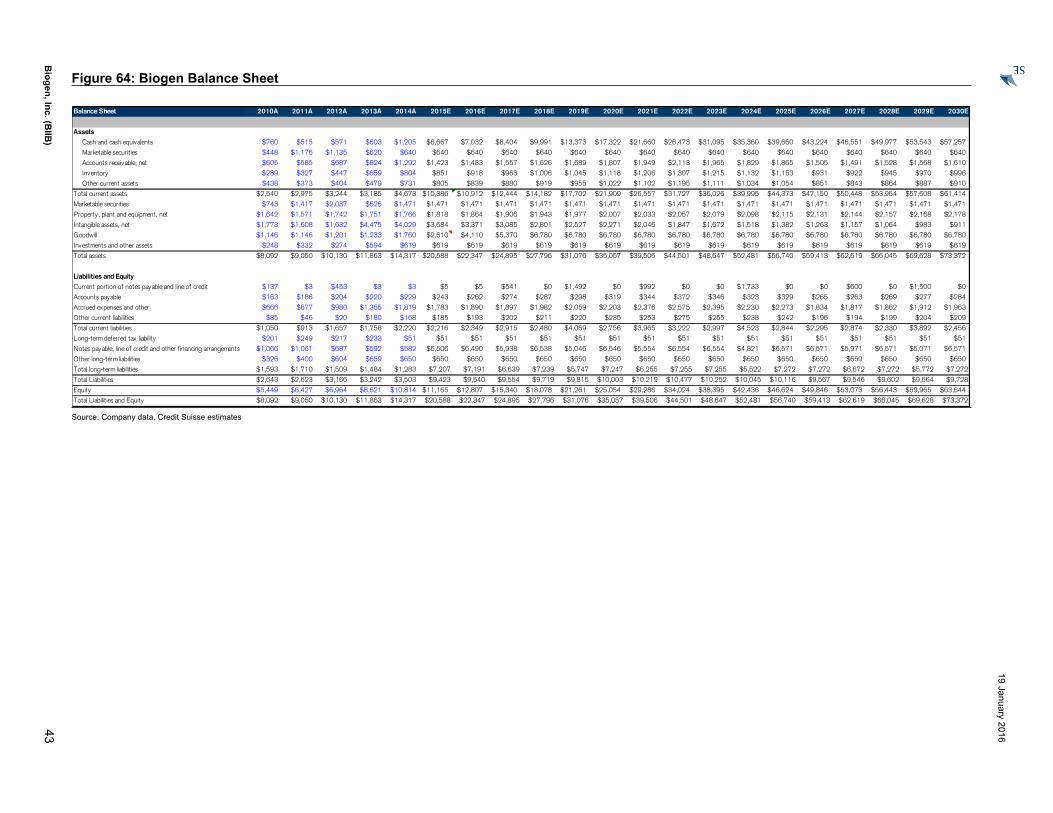
19 January 2016
Biogen, Inc. (B
IIB)
43
Figure 64: Biogen Balance Sheet
Balance Sheet 2010A 2011A 2012A 2013A 2014A 2015E 2016E 2017E 2018E 2019E 2020E 2021E 2022E 2023E 2024E 2025E 2026E 2027E 2028E 2029E 2030E
Assets Cash and cash equivalents $760 $515 $571 $603 $1,205 $6,667 $7,032 $8,404 $9,991 $13,373 $17,322 $21,660 $26,473 $31,095 $35,360 $39,660 $43,224 $46,551 $49,977 $53,543 $57,257
Marketable securities $448 $1,176 $1,135 $620 $640 $640 $640 $640 $640 $640 $640 $640 $640 $640 $640 $640 $640 $640 $640 $640 $640
Accounts receivable, net $605 $585 $687 $824 $1,292 $1,423 $1,483 $1,557 $1,626 $1,689 $1,807 $1,949 $2,113 $1,965 $1,829 $1,865 $1,505 $1,491 $1,528 $1,568 $1,610
Inventory $289 $327 $447 $659 $804 $851 $918 $963 $1,006 $1,045 $1,118 $1,206 $1,307 $1,215 $1,132 $1,153 $931 $922 $945 $970 $996
Other current assets $438 $373 $404 $479 $731 $805 $839 $880 $919 $955 $1,022 $1,102 $1,195 $1,111 $1,034 $1,054 $851 $843 $864 $887 $910
Total current assets $2,540 $2,975 $3,244 $3,185 $4,673 $10,386 $10,912 $12,444 $14,182 $17,702 $21,909 $26,557 $31,727 $36,026 $39,995 $44,373 $47,150 $50,448 $53,954 $57,608 $61,414
Marketable securities $743 $1,417 $2,037 $626 $1,471 $1,471 $1,471 $1,471 $1,471 $1,471 $1,471 $1,471 $1,471 $1,471 $1,471 $1,471 $1,471 $1,471 $1,471 $1,471 $1,471
Property, plant and equipment, net $1,642 $1,571 $1,742 $1,751 $1,766 $1,818 $1,864 $1,906 $1,943 $1,977 $2,007 $2,033 $2,057 $2,079 $2,098 $2,115 $2,131 $2,144 $2,157 $2,168 $2,178
Intangible assets, net $1,773 $1,608 $1,632 $4,475 $4,029 $3,684 $3,371 $3,085 $2,801 $2,527 $2,271 $2,046 $1,847 $1,672 $1,518 $1,382 $1,263 $1,157 $1,064 $983 $911
Goodwill $1,146 $1,146 $1,201 $1,233 $1,760 $2,610 $4,110 $5,370 $6,780 $6,780 $6,780 $6,780 $6,780 $6,780 $6,780 $6,780 $6,780 $6,780 $6,780 $6,780 $6,780
Investments and other assets $248 $332 $274 $594 $619 $619 $619 $619 $619 $619 $619 $619 $619 $619 $619 $619 $619 $619 $619 $619 $619
Total assets $8,092 $9,050 $10,130 $11,863 $14,317 $20,588 $22,347 $24,895 $27,796 $31,076 $35,057 $39,506 $44,501 $48,647 $52,481 $56,740 $59,413 $62,619 $66,045 $69,628 $73,372
Liabilities and EquityCurrent portion of notes payable and line of credit $137 $3 $453 $3 $3 $5 $5 $541 $0 $1,492 $0 $992 $0 $0 $1,733 $0 $0 $600 $0 $1,500 $0
Accounts payable $163 $186 $204 $220 $229 $243 $262 $274 $287 $298 $319 $344 $372 $346 $323 $329 $265 $263 $269 $277 $284
Accrued expenses and other $666 $677 $980 $1,355 $1,819 $1,783 $1,890 $1,897 $1,982 $2,059 $2,203 $2,376 $2,575 $2,395 $2,230 $2,273 $1,834 $1,817 $1,862 $1,912 $1,963
Other current liabilities $85 $46 $20 $180 $168 $185 $193 $202 $211 $220 $235 $253 $275 $255 $238 $242 $196 $194 $199 $204 $209
Total current liabilities $1,050 $913 $1,657 $1,758 $2,220 $2,216 $2,349 $2,915 $2,480 $4,069 $2,756 $3,965 $3,222 $2,997 $4,523 $2,844 $2,295 $2,874 $2,330 $3,892 $2,456
Long-term deferred tax liability $201 $249 $217 $233 $51 $51 $51 $51 $51 $51 $51 $51 $51 $51 $51 $51 $51 $51 $51 $51 $51
Notes payable, line of credit and other financing arrangements $1,066 $1,061 $687 $592 $582 $6,506 $6,490 $5,938 $6,538 $5,046 $6,546 $5,554 $6,554 $6,554 $4,821 $6,571 $6,571 $5,971 $6,571 $5,071 $6,571
Other long-term liabilities $326 $400 $604 $659 $650 $650 $650 $650 $650 $650 $650 $650 $650 $650 $650 $650 $650 $650 $650 $650 $650
Total long-term liabilities $1,593 $1,710 $1,509 $1,484 $1,283 $7,207 $7,191 $6,639 $7,239 $5,747 $7,247 $6,255 $7,255 $7,255 $5,522 $7,272 $7,272 $6,672 $7,272 $5,772 $7,272
Total Liabilities $2,643 $2,623 $3,166 $3,242 $3,503 $9,423 $9,540 $9,554 $9,719 $9,815 $10,003 $10,219 $10,477 $10,252 $10,045 $10,116 $9,567 $9,546 $9,602 $9,664 $9,728
Equity $5,449 $6,427 $6,964 $8,621 $10,814 $11,165 $12,807 $15,340 $18,078 $21,261 $25,054 $29,286 $34,024 $38,395 $42,436 $46,624 $49,846 $53,073 $56,443 $59,965 $63,644
Total Liabilities and Equity $8,092 $9,050 $10,130 $11,863 $14,317 $20,588 $22,347 $24,895 $27,796 $31,076 $35,057 $39,506 $44,501 $48,647 $52,481 $56,740 $59,413 $62,619 $66,045 $69,628 $73,372
Source: Company data, Credit Suisse estimates

19 January 2016
Biogen, Inc. (B
IIB)
44
Figure 65: Biogen Cash Flows
Cash Flow 2010A 2011A 2012A 2013A 2014A 2015E 2016E 2017E 2018E 2019E 2020E 2021E 2022E 2023E 2024E 2025E 2026E 2027E 2028E 2029E 2030E
CASH FLOW FROM OPERATIONS
Net Income $899 $1,267 $1,380 $1,862 $2,942 $3,580 $3,687 $3,975 $4,177 $4,370 $4,727 $5,164 $5,666 $5,296 $4,963 $5,107 $4,137 $4,138 $4,277 $4,425 $4,578Adjustments for non-operating items
Depreciation & Amortization $356 $359 $366 $532 $688 $542 $517 $495 $496 $490 $476 $449 $425 $404 $385 $369 $354 $342 $330 $321 $312
Other Adjustments $367 $287 $30 ($136) ($203) $0 $0 $0 $0 $0 $0 $0 $0 $0 $0 $0 $0 $0 $0 $0 $0
Changes in:
A/R ($99) ($73) $4 ($127) ($512) ($130) ($60) ($73) ($69) ($63) ($118) ($142) ($164) $148 $135 ($35) $360 $14 ($37) ($40) ($42)
Inventory ($5) ($59) ($140) ($244) ($186) ($47) ($66) ($45) ($43) ($39) ($73) ($88) ($101) $91 $84 ($22) $223 $9 ($23) ($25) ($26)
Other Current Assets ($13) ($43) ($27) ($160) ($95) ($74) ($34) ($41) ($39) ($36) ($67) ($80) ($93) $84 $77 ($20) $203 $8 ($21) ($23) ($24)
Payables, Accrued & Other current L. (excl notes payable) $131 $34 $273 $284 $244 ($23) $125 $21 $96 $88 $165 $198 $228 ($206) ($189) $49 ($502) ($19) $52 $56 $58
Other Liabilities $18 ($36) $34 $319 $95 $17 $8 $10 $9 $8 $15 $18 $21 ($19) ($18) $5 ($47) ($2) $5 $5 $5
Other ($29) ($6) ($40) $16 ($31)
Net Cash From Operations $1,625 $1,728 $1,880 $2,345 $2,942 $3,866 $4,175 $4,340 $4,628 $4,819 $5,126 $5,519 $5,983 $5,797 $5,437 $5,452 $4,728 $4,489 $4,583 $4,719 $4,862
CASH FLOW FROM INVESTINGAcquisition of intangible assets ($44) ($7) ($3,263) $0 $0 $0 $0 $0 $0 $0 $0 $0 $0 $0 $0 $0 $0 $0 $0
Acquisition of business ($157) ($5) ($72)
Capital Expenditures (PP&E) ($173) ($208) ($255) ($246) ($288) ($250) ($250) ($250) ($250) ($250) ($250) ($250) ($250) ($250) ($250) ($250) ($250) ($250) ($250) ($250) ($250)
Proceeds from sale and maturities of marketable securities $2,669 $2,277 $2,750 $5,190 $2,719 $0 $0 $0 $0 $0 $0 $0 $0 $0 $0 $0 $0 $0 $0 $0 $0
Purchase of marketable securities ($1,988) ($3,697) ($3,334) ($3,278) ($3,583)
Contingent consideration relates to Fumapharm AG ($15) ($375) ($850) ($1,500) ($1,260) ($1,410) $0 $0 $0 $0 $0 $0 $0 $0 $0 $0 $0 $0
Change in Other Investments ($4) $27 ($32) $7 ($16) $0 $0 $0 $0 $0 $0 $0 $0 $0 $0 $0 $0 $0 $0 $0 $0
Net Cash From Investing $345 ($1,650) ($950) ($1,605) ($1,543) ($1,100) ($1,750) ($1,510) ($1,660) ($250) ($250) ($250) ($250) ($250) ($250) ($250) ($250) ($250) ($250) ($250) ($250)
CASH FLOW FROM FINANCINGDebt Additions $0 $0 $0 $0 $0 $5,926 ($16) ($16) $59 ($0) $8 $0 $8 $0 ($0) $17 $0 $0 $0 $0 $0
Debt (Retirement) ($18) ($11) ($2) ($452) ($3)
Equity Additions $183 $315 $67 $67 $55 $69 $56 $58 $60 $63 $66 $69 $71 $75 $78 $81 $85 $89 $93 $97 $101
Equity (Re/purchase) ($2,078) ($498) ($985) ($400) ($887) ($3,298) ($2,100) ($1,500) ($1,500) ($1,250) ($1,000) ($1,000) ($1,000) ($1,000) ($1,000) ($1,000) ($1,000) ($1,000) ($1,000) ($1,000) ($1,000)
Other Financing $127 ($125) $42 $69 $79 $0 $0 $0 $0 $0 $0 $0 $0 $0 $0 $0 $0 $0 $0 $0 $0
Net Cash From Financing ($1,785) ($320) ($877) ($717) ($756) $2,696 ($2,060) ($1,458) ($1,381) ($1,187) ($927) ($931) ($920) ($925) ($922) ($902) ($915) ($911) ($907) ($903) ($899)
Change in Cash $185 ($242) $52 $24 $643 $5,462 $365 $1,372 $1,587 $3,382 $3,949 $4,338 $4,813 $4,622 $4,265 $4,300 $3,563 $3,328 $3,426 $3,566 $3,714
FX Impact ($7) ($3) $4 $8 ($41) $0 $0 $0 $0 $0 $0 $0 $0 $0 $0 $0 $0 $0 $0 $0 $0
Beginning Cash & CE $582 $760 $515 $571 $603 $1,205 $6,667 $7,032 $8,404 $9,991 $13,373 $17,322 $21,660 $26,473 $31,095 $35,360 $39,660 $43,224 $46,551 $49,977 $53,543
Ending Cash & CE $760 $515 $571 $603 $1,205 $6,667 $7,032 $8,404 $9,991 $13,373 $17,322 $21,660 $26,473 $31,095 $35,360 $39,660 $43,224 $46,551 $49,977 $53,543 $57,257
Ending Cash, CE & Short term Marketable Securities $760 $515 $571 $603 $1,205 $6,667 $7,032 $8,404 $9,991 $13,373 $17,322 $21,660 $26,473 $31,095 $35,360 $39,660 $43,224 $46,551 $49,977 $53,543 $57,257
Ending Cash, CE & Marketable Securities (short term and long term)$1,503 $1,931 $2,607 $1,228 $2,676 $8,138 $8,503 $9,875 $11,462 $14,844 $18,793 $23,130 $27,943 $32,565 $36,830 $41,131 $44,694 $48,022 $51,448 $55,013 $58,727
Free Cash Flow $1,452 $1,520 $1,625 $2,099 $2,654 $3,616 $3,925 $4,090 $4,378 $4,569 $4,876 $5,269 $5,733 $5,547 $5,187 $5,202 $4,478 $4,239 $4,333 $4,469 $4,612
Source: Company data, Credit Suisse estimates
19 January 2016
Biogen, Inc. (BIIB) 45
AcknowledgementThe author of this report, Alethia Young, wishes to acknowledge the contributions made by Ashitha John, employee of Irevna, a division of CRISIL limited, a third-party provider of offshore research support services to Credit Suisse.
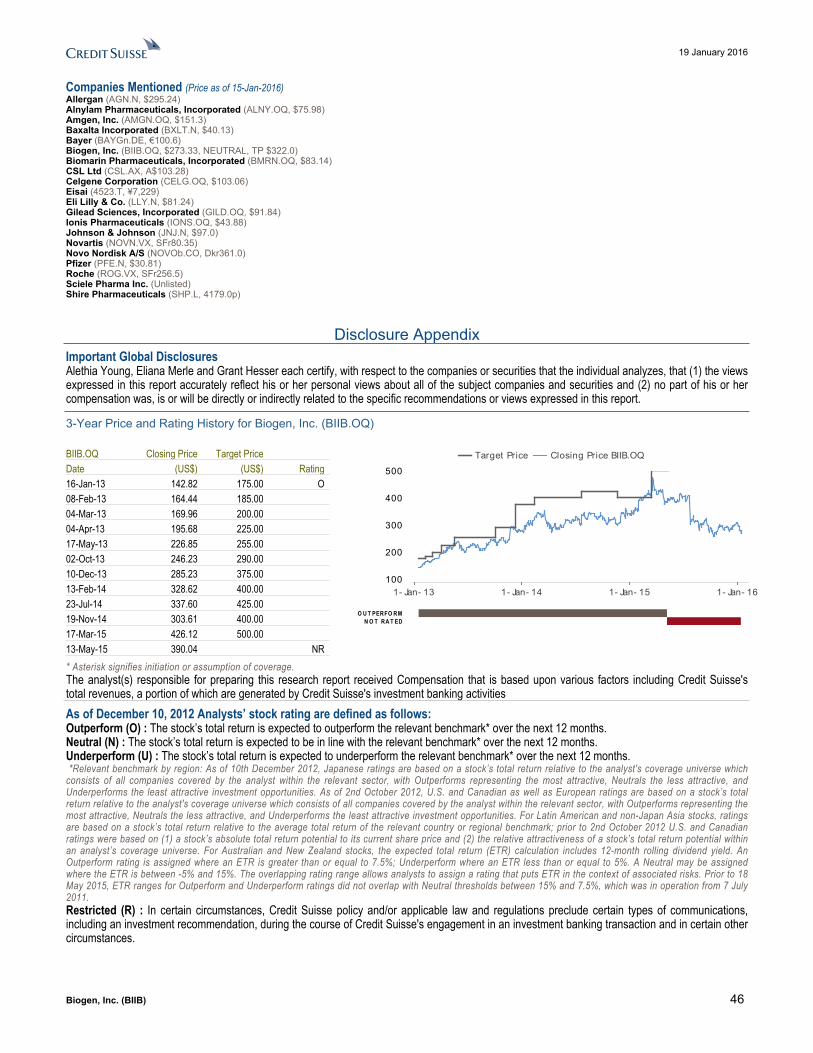
19 January 2016
Biogen, Inc. (BIIB) 46
Companies Mentioned (Price as of 15-Jan-2016)Allergan (AGN.N, $295.24)Alnylam Pharmaceuticals, Incorporated (ALNY.OQ, $75.98)Amgen, Inc. (AMGN.OQ, $151.3)Baxalta Incorporated (BXLT.N, $40.13)Bayer (BAYGn.DE, €100.6)Biogen, Inc. (BIIB.OQ, $273.33, NEUTRAL, TP $322.0)Biomarin Pharmaceuticals, Incorporated (BMRN.OQ, $83.14)CSL Ltd (CSL.AX, A$103.28)Celgene Corporation (CELG.OQ, $103.06)Eisai (4523.T, ¥7,229)Eli Lilly & Co. (LLY.N, $81.24)Gilead Sciences, Incorporated (GILD.OQ, $91.84)Ionis Pharmaceuticals (IONS.OQ, $43.88)Johnson & Johnson (JNJ.N, $97.0)Novartis (NOVN.VX, SFr80.35)Novo Nordisk A/S (NOVOb.CO, Dkr361.0)Pfizer (PFE.N, $30.81)Roche (ROG.VX, SFr256.5)Sciele Pharma Inc. (Unlisted)Shire Pharmaceuticals (SHP.L, 4179.0p)
Disclosure AppendixImportant Global Disclosures Alethia Young, Eliana Merle and Grant Hesser each certify, with respect to the companies or securities that the individual analyzes, that (1) the views expressed in this report accurately reflect his or her personal views about all of the subject companies and securities and (2) no part of his or her compensation was, is or will be directly or indirectly related to the specific recommendations or views expressed in this report.
3-Year Price and Rating History for Biogen, Inc. (BIIB.OQ)
BIIB.OQ Closing Price Target Price Date (US$) (US$) Rating 16-Jan-13 142.82 175.00 O 08-Feb-13 164.44 185.00 04-Mar-13 169.96 200.00 04-Apr-13 195.68 225.00 17-May-13 226.85 255.00 02-Oct-13 246.23 290.00 10-Dec-13 285.23 375.00 13-Feb-14 328.62 400.00 23-Jul-14 337.60 425.00 19-Nov-14 303.61 400.00 17-Mar-15 426.12 500.00 13-May-15 390.04 NR * Asterisk signifies initiation or assumption of coverage.
Target Price Closing Price BIIB.OQ
1- Jan- 13 1- Jan- 14 1- Jan- 15 1- Jan- 16100
200
300
400
500
O U T PERFO RMN O T RA T ED
The analyst(s) responsible for preparing this research report received Compensation that is based upon various factors including Credit Suisse's total revenues, a portion of which are generated by Credit Suisse's investment banking activitiesAs of December 10, 2012 Analysts’ stock rating are defined as follows:Outperform (O) : The stock’s total return is expected to outperform the relevant benchmark* over the next 12 months.Neutral (N) : The stock’s total return is expected to be in line with the relevant benchmark* over the next 12 months.Underperform (U) : The stock’s total return is expected to underperform the relevant benchmark* over the next 12 months. *Relevant benchmark by region: As of 10th December 2012, Japanese ratings are based on a stock’s total return relative to the analyst's coverage universe which consists of all companies covered by the analyst within the relevant sector, with Outperforms representing the most attractive, Neutrals the less attractive, and Underperforms the least attractive investment opportunities. As of 2nd October 2012, U.S. and Canadian as well as European ratings are based on a stock’s total return relative to the analyst's coverage universe which consists of all companies covered by the analyst within the relevant sector, with Outperforms representing the most attractive, Neutrals the less attractive, and Underperforms the least attractive investment opportunities. For Latin American and non-Japan Asia stocks, ratings are based on a stock’s total return relative to the average total return of the relevant country or regional benchmark; prior to 2nd October 2012 U.S. and Canadian ratings were based on (1) a stock’s absolute total return potential to its current share price and (2) the relative attractiveness of a stock’s total return potential within an analyst’s coverage universe. For Australian and New Zealand stocks, the expected total return (ETR) calculation includes 12-month rolling dividend yield. An Outperform rating is assigned where an ETR is greater than or equal to 7.5%; Underperform where an ETR less than or equal to 5%. A Neutral may be assigned where the ETR is between -5% and 15%. The overlapping rating range allows analysts to assign a rating that puts ETR in the context of associated risks. Prior to 18 May 2015, ETR ranges for Outperform and Underperform ratings did not overlap with Neutral thresholds between 15% and 7.5%, which was in operation from 7 July 2011.Restricted (R) : In certain circumstances, Credit Suisse policy and/or applicable law and regulations preclude certain types of communications, including an investment recommendation, during the course of Credit Suisse's engagement in an investment banking transaction and in certain other circumstances.

19 January 2016
Biogen, Inc. (BIIB) 47
Volatility Indicator [V] : A stock is defined as volatile if the stock price has moved up or down by 20% or more in a month in at least 8 of the past 24 months or the analyst expects significant volatility going forward.Analysts’ sector weightings are distinct from analysts’ stock ratings and are based on the analyst’s expectations for the fundamentals and/or valuation of the sector* relative to the group’s historic fundamentals and/or valuation:Overweight : The analyst’s expectation for the sector’s fundamentals and/or valuation is favorable over the next 12 months.Market Weight : The analyst’s expectation for the sector’s fundamentals and/or valuation is neutral over the next 12 months.Underweight : The analyst’s expectation for the sector’s fundamentals and/or valuation is cautious over the next 12 months. *An analyst’s coverage sector consists of all companies covered by the analyst within the relevant sector. An analyst may cover multiple sectors.
Credit Suisse's distribution of stock ratings (and banking clients) is:
Global Ratings DistributionRating Versus universe (%) Of which banking clients (%)Outperform/Buy* 56% (34% banking clients)Neutral/Hold* 31% (26% banking clients)Underperform/Sell* 12% (42% banking clients)Restricted 1%*For purposes of the NYSE and NASD ratings distribution disclosure requirements, our stock ratings of Outperform, Neutral, and Underperform most closely correspond to Buy, Hold, and Sell, respectively; however, the meanings are not the same, as our stock ratings are determined on a relative basis. (Please refer to definitions above.) An investor's decision to buy or sell a security should be based on investment objectives, current holdings, and other individual factors.
Credit Suisse’s policy is to update research reports as it deems appropriate, based on developments with the subject company, the sector or the market that may have a material impact on the research views or opinions stated herein. Credit Suisse's policy is only to publish investment research that is impartial, independent, clear, fair and not misleading. For more detail please refer to Credit Suisse's Policies for Managing Conflicts of Interest in connection with Investment Research: http://www.csfb.com/research-and-analytics/disclaimer/managing_conflicts_disclaimer.htmlCredit Suisse does not provide any tax advice. Any statement herein regarding any US federal tax is not intended or written to be used, and cannot be used, by any taxpayer for the purposes of avoiding any penalties.
Target Price and RatingValuation Methodology and Risks: (12 months) for Biogen, Inc. (BIIB.OQ)
Method: Our BIIB $322TP and Neutral rating is based on a 50/50 split of DCF and PE multiple. Our DCF is $284/sh based on an 8% discount rate & 2% terminal growth in-line with peers. Our PE valuation is $360/sh. We assign a 20x multiple to '16 EPS of $17.75/sh which is a 5% premium to the large cap sector ex-GILD and 23% premium to the S&P500. We believe that this multiple is justified based on Biogen's base business and pipeline profile.
Risk: Risks to our BIIB $322 TP and Neutral rating: Key upside risks: Success (meaning hitting primary endpoint) on the anti-Lingo program in mid-16, Positive data that provides greater confidence around BAN2401 (anti-amyloid Beta antibody), Tecfidera sales reaccelerate, Hemophilia assets continue to take share in spite of competition, SMA program gets to market earlier than our expectations through surprise regulatory approval. Key downside risks: Anti-Lingo1 program discontinues after failure in Ph2 Synergy study, Efficacy or safety concern with aducanumab Ph3 program, Worse than expected MS and hemophilia sales during 2016, SMA program has a surprise efficacy or safety failure in Ph3.
Please refer to the firm's disclosure website at https://rave.credit-suisse.com/disclosures for the definitions of abbreviations typically used in the target price method and risk sections. See the Companies Mentioned section for full company names The subject company (BIIB.OQ, ROG.VX, BXLT.N, BAYGn.DE, CELG.OQ, LLY.N, BMRN.OQ, CSL.AX, PFE.N, NOVN.VX, JNJ.N, AMGN.OQ) currently is, or was during the 12-month period preceding the date of distribution of this report, a client of Credit Suisse.Credit Suisse provided investment banking services to the subject company (BIIB.OQ, BXLT.N, BAYGn.DE, CELG.OQ, LLY.N, PFE.N, NOVN.VX, AMGN.OQ) within the past 12 months.Credit Suisse provided non-investment banking services to the subject company (ROG.VX) within the past 12 monthsCredit Suisse has managed or co-managed a public offering of securities for the subject company (BIIB.OQ, BXLT.N, BAYGn.DE, CELG.OQ, LLY.N, NOVN.VX, AMGN.OQ) within the past 12 months.Credit Suisse has received investment banking related compensation from the subject company (BIIB.OQ, BXLT.N, BAYGn.DE, CELG.OQ, LLY.N, PFE.N, NOVN.VX, AMGN.OQ) within the past 12 monthsCredit Suisse expects to receive or intends to seek investment banking related compensation from the subject company (BIIB.OQ, BXLT.N, BAYGn.DE, CELG.OQ, LLY.N, IONS.OQ, ALNY.OQ, BMRN.OQ, CSL.AX, PFE.N, 4523.T, NOVN.VX, JNJ.N, GILD.OQ, AMGN.OQ) within the next 3 months.Credit Suisse has received compensation for products and services other than investment banking services from the subject company (ROG.VX) within the past 12 monthsAs of the date of this report, Credit Suisse makes a market in the following subject companies (BIIB.OQ, CELG.OQ, LLY.N, ALNY.OQ, BMRN.OQ, PFE.N, JNJ.N, GILD.OQ, AMGN.OQ).As of the end of the preceding month, Credit Suisse beneficially own 1% or more of a class of common equity securities of (SHP.L).As of the end of the preceding month, Credit Suisse beneficially own between 1-3% of a class of common equity securities of (NOVN.VX).
19 January 2016
Biogen, Inc. (BIIB) 48
As of the date of this report, an analyst involved in the preparation of this report has the following material conflict of interest with the subject company (PFE.N). As of the date of this report, an analyst involved in the preparation of this report, Vamil Divan, has following material conflicts of interest with the subject company. The analyst or a member of the analyst's household has a long position in the common stock Pfizer (PFE.N). A member of the analyst's household is an employee of Pfizer (PFE.N).For other important disclosures concerning companies featured in this report, including price charts, please visit the website at https://rave.credit-suisse.com/disclosures or call +1 (877) 291-2683. Important Regional Disclosures Singapore recipients should contact Credit Suisse AG, Singapore Branch for any matters arising from this research report.The analyst(s) involved in the preparation of this report may participate in events hosted by the subject company, including site visits. Credit Suisse does not accept or permit analysts to accept payment or reimbursement for travel expenses associated with these events.Restrictions on certain Canadian securities are indicated by the following abbreviations: NVS--Non-Voting shares; RVS--Restricted Voting Shares; SVS--Subordinate Voting Shares.Individuals receiving this report from a Canadian investment dealer that is not affiliated with Credit Suisse should be advised that this report may not contain regulatory disclosures the non-affiliated Canadian investment dealer would be required to make if this were its own report.For Credit Suisse Securities (Canada), Inc.'s policies and procedures regarding the dissemination of equity research, please visit https://www.credit-suisse.com/sites/disclaimers-ib/en/canada-research-policy.html.Credit Suisse has acted as lead manager or syndicate member in a public offering of securities for the subject company (BIIB.OQ, BXLT.N, BAYGn.DE, CELG.OQ, LLY.N, PFE.N, NOVN.VX, AMGN.OQ) within the past 3 years.As of the date of this report, Credit Suisse acts as a market maker or liquidity provider in the equities securities that are the subject of this report.Principal is not guaranteed in the case of equities because equity prices are variable.Commission is the commission rate or the amount agreed with a customer when setting up an account or at any time after that.Important Credit Suisse HOLT Disclosures With respect to the analysis in this report based on the Credit Suisse HOLT methodology, Credit Suisse certifies that (1) the views expressed in this report accurately reflect the Credit Suisse HOLT methodology and (2) no part of the Firm’s compensation was, is, or will be directly related to the specific views disclosed in this report.The Credit Suisse HOLT methodology does not assign ratings to a security. It is an analytical tool that involves use of a set of proprietary quantitative algorithms and warranted value calculations, collectively called the Credit Suisse HOLT valuation model, that are consistently applied to all the companies included in its database. Third-party data (including consensus earnings estimates) are systematically translated into a number of default algorithms available in the Credit Suisse HOLT valuation model. The source financial statement, pricing, and earnings data provided by outside data vendors are subject to quality control and may also be adjusted to more closely measure the underlying economics of firm performance. The adjustments provide consistency when analyzing a single company across time, or analyzing multiple companies across industries or national borders. The default scenario that is produced by the Credit Suisse HOLT valuation model establishes the baseline valuation for a security, and a user then may adjust the default variables to produce alternative scenarios, any of which could occur.Additional information about the Credit Suisse HOLT methodology is available on request.The Credit Suisse HOLT methodology does not assign a price target to a security. The default scenario that is produced by the Credit Suisse HOLT valuation model establishes a warranted price for a security, and as the third-party data are updated, the warranted price may also change. The default variable may also be adjusted to produce alternative warranted prices, any of which could occur.CFROI®, HOLT, HOLTfolio, ValueSearch, AggreGator, Signal Flag and “Powered by HOLT” are trademarks or service marks or registered trademarks or registered service marks of Credit Suisse or its affiliates in the United States and other countries. HOLT is a corporate performance and valuation advisory service of Credit Suisse.For Credit Suisse disclosure information on other companies mentioned in this report, please visit the website at https://rave.credit-suisse.com/disclosures or call +1 (877) 291-2683.

19 January 2016
Biogen, Inc. (BIIB) 49
References in this report to Credit Suisse include all of the subsidiaries and affiliates of Credit Suisse operating under its investment banking division. For more information on our structure, please use the following link: https://www.credit-suisse.com/who-we-are This report may contain material that is not directed to, or intended for distribution to or use by, any person or entity who is a citizen or resident of or located in any locality, state, country or other jurisdiction where such distribution, publication, availability or use would be contrary to law or regulation or which would subject Credit Suisse AG or its affiliates ("CS") to any registration or licensing requirement within such jurisdiction. All material presented in this report, unless specifically indicated otherwise, is under copyright to CS. None of the material, nor its content, nor any copy of it, may be altered in any way, transmitted to, copied or distributed to any other party, without the prior express written permission of CS. All trademarks, service marks and logos used in this report are trademarks or service marks or registered trademarks or service marks of CS or its affiliates. The information, tools and material presented in this report are provided to you for information purposes only and are not to be used or considered as an offer or the solicitation of an offer to sell or to buy or subscribe for securities or other financial instruments. CS may not have taken any steps to ensure that the securities referred to in this report are suitable for any particular investor. CS will not treat recipients of this report as its customers by virtue of their receiving this report. The investments and services contained or referred to in this report may not be suitable for you and it is recommended that you consult an independent investment advisor if you are in doubt about such investments or investment services. Nothing in this report constitutes investment, legal, accounting or tax advice, or a representation that any investment or strategy is suitable or appropriate to your individual circumstances, or otherwise constitutes a personal recommendation to you. CS does not advise on the tax consequences of investments and you are advised to contact an independent tax adviser. Please note in particular that the bases and levels of taxation may change. Information and opinions presented in this report have been obtained or derived from sources believed by CS to be reliable, but CS makes no representation as to their accuracy or completeness. CS accepts no liability for loss arising from the use of the material presented in this report, except that this exclusion of liability does not apply to the extent that such liability arises under specific statutes or regulations applicable to CS. This report is not to be relied upon in substitution for the exercise of independent judgment. CS may have issued, and may in the future issue, other communications that are inconsistent with, and reach different conclusions from, the information presented in this report. Those communications reflect the different assumptions, views and analytical methods of the analysts who prepared them and CS is under no obligation to ensure that such other communications are brought to the attention of any recipient of this report. Some investments referred to in this report will be offered solely by a single entity and in the case of some investments solely by CS, or an associate of CS or CS may be the only market maker in such investments. Past performance should not be taken as an indication or guarantee of future performance, and no representation or warranty, express or implied, is made regarding future performance. Information, opinions and estimates contained in this report reflect a judgment at its original date of publication by CS and are subject to change without notice. The price, value of and income from any of the securities or financial instruments mentioned in this report can fall as well as rise. The value of securities and financial instruments is subject to exchange rate fluctuation that may have a positive or adverse effect on the price or income of such securities or financial instruments. Investors in securities such as ADR's, the values of which are influenced by currency volatility, effectively assume this risk. Structured securities are complex instruments, typically involve a high degree of risk and are intended for sale only to sophisticated investors who are capable of understanding and assuming the risks involved. The market value of any structured security may be affected by changes in economic, financial and political factors (including, but not limited to, spot and forward interest and exchange rates), time to maturity, market conditions and volatility, and the credit quality of any issuer or reference issuer. Any investor interested in purchasing a structured product should conduct their own investigation and analysis of the product and consult with their own professional advisers as to the risks involved in making such a purchase. Some investments discussed in this report may have a high level of volatility. High volatility investments may experience sudden and large falls in their value causing losses when that investment is realised. Those losses may equal your original investment. Indeed, in the case of some investments the potential losses may exceed the amount of initial investment and, in such circumstances, you may be required to pay more money to support those losses. Income yields from investments may fluctuate and, in consequence, initial capital paid to make the investment may be used as part of that income yield. Some investments may not be readily realisable and it may be difficult to sell or realise those investments, similarly it may prove difficult for you to obtain reliable information about the value, or risks, to which such an investment is exposed. This report may provide the addresses of, or contain hyperlinks to, websites. Except to the extent to which the report refers to website material of CS, CS has not reviewed any such site and takes no responsibility for the content contained therein. Such address or hyperlink (including addresses or hyperlinks to CS's own website material) is provided solely for your convenience and information and the content of any such website does not in any way form part of this document. Accessing such website or following such link through this report or CS's website shall be at your own risk. This report is issued and distributed in Europe (except Switzerland) by Credit Suisse Securities (Europe) Limited, One Cabot Square, London E14 4QJ, England, which is authorised by the Prudential Regulation Authority and regulated by the Financial Conduct Authority and the Prudential Regulation Authority. This report is issued and distributed in Europe (except Switzerland) by Credit Suisse International, One Cabot Square, London E14 4QJ, England, which is authorised by the Prudential Regulation Authority and regulated by the Financial Conduct Authority and the Prudential Regulation Authority. This report is being distributed in Germany by Credit Suisse Securities (Europe) Limited Niederlassung Frankfurt am Main regulated by the Bundesanstalt fuer Finanzdienstleistungsaufsicht ("BaFin"). This report is being distributed in the United States and Canada by Credit Suisse Securities (USA) LLC; in Switzerland by Credit Suisse AG; in Brazil by Banco de Investimentos Credit Suisse (Brasil) S.A or its affiliates; in Mexico by Banco Credit Suisse (México), S.A. (transactions related to the securities mentioned in this report will only be effected in compliance with applicable regulation); in Japan by Credit Suisse Securities (Japan) Limited, Financial Instruments Firm, Director-General of Kanto Local Finance Bureau (Kinsho) No. 66, a member of Japan Securities Dealers Association, The Financial Futures Association of Japan, Japan Investment Advisers Association, Type II Financial Instruments Firms Association; elsewhere in Asia/ Pacific by whichever of the following is the appropriately authorised entity in the relevant jurisdiction: Credit Suisse (Hong Kong) Limited, Credit Suisse Equities (Australia) Limited, Credit Suisse Securities (Thailand) Limited, regulated by the Office of the Securities and Exchange Commission, Thailand, having registered address at 990 Abdulrahim Place, 27th Floor, Unit 2701, Rama IV Road, Silom, Bangrak, Bangkok 10500, Thailand, Tel. +66 2614 6000, Credit Suisse Securities (Malaysia) Sdn Bhd, Credit Suisse AG, Singapore Branch, Credit Suisse Securities (India) Private Limited (CIN no. U67120MH1996PTC104392) regulated by the Securities and Exchange Board of India as Research Analyst (registration no. INH 000001030) and as Stock Broker (registration no. INB230970637; INF230970637; INB010970631; INF010970631), having registered address at 9th Floor, Ceejay House, Dr.A.B. Road, Worli, Mumbai - 18, India, T- +91-22 6777 3777, Credit Suisse Securities (Europe) Limited, Seoul Branch, Credit Suisse AG, Taipei Securities Branch, PT Credit Suisse Securities Indonesia, Credit Suisse Securities (Philippines ) Inc., and elsewhere in the world by the relevant authorised affiliate of the above. Research on Taiwanese securities produced by Credit Suisse AG, Taipei Securities Branch has been prepared by a registered Senior Business Person. Research provided to residents of Malaysia is authorised by the Head of Research for Credit Suisse Securities (Malaysia) Sdn Bhd, to whom they should direct any queries on +603 2723 2020. This report has been prepared and issued for distribution in Singapore to institutional investors, accredited investors and expert investors (each as defined under the Financial Advisers Regulations) only, and is also distributed by Credit Suisse AG, Singapore branch to overseas investors (as defined under the Financial Advisers Regulations). By virtue of your status as an institutional investor, accredited investor, expert investor or overseas investor, Credit Suisse AG, Singapore branch is exempted from complying with certain compliance requirements under the Financial Advisers Act, Chapter 110 of Singapore (the "FAA"), the Financial Advisers Regulations and the relevant Notices and Guidelines issued thereunder, in respect of any financial advisory service which Credit Suisse AG, Singapore branch may provide to you. This information is being distributed by Credit Suisse AG (DIFC Branch), duly licensed and regulated by the Dubai Financial Services Authority (“DFSA”). Related financial services or products are only made available to Professional Clients or Market Counterparties, as defined by the DFSA, and are not intended for any other persons. Credit Suisse AG (DIFC Branch) is located on Level 9 East, The Gate Building, DIFC, Dubai, United Arab Emirates. This research may not conform to Canadian disclosure requirements. In jurisdictions where CS is not already registered or licensed to trade in securities, transactions will only be effected in accordance with applicable securities legislation, which will vary from jurisdiction to jurisdiction and may require that the trade be made in accordance with applicable exemptions from registration or licensing requirements. Non-U.S. customers wishing to effect a transaction should contact a CS entity in their local jurisdiction unless governing law permits otherwise. U.S. customers wishing to effect a transaction should do so only by contacting a representative at Credit Suisse Securities (USA) LLC in the U.S. Please note that this research was originally prepared and issued by CS for distribution to their market professional and institutional investor customers. Recipients who are not market professional or institutional investor customers of CS should seek the advice of their independent financial advisor prior to taking any investment decision based on this report or for any necessary explanation of its contents. This research may relate to investments or services of a person outside of the UK or to other matters which are not authorised by the Prudential Regulation Authority and regulated by the Financial Conduct Authority and the Prudential Regulation Authority or in respect of which the protections of the Prudential Regulation Authority and Financial Conduct Authority for private customers and/or the UK compensation scheme may not be available, and further details as to where this may be the case are available upon request in respect of this report. CS may provide various services to US municipal entities or obligated persons ("municipalities"), including suggesting individual transactions or trades and entering into such transactions. Any services CS provides to municipalities are not viewed as "advice" within the meaning of Section 975 of the Dodd-Frank Wall Street Reform and Consumer Protection Act. CS is providing any such services and related information solely on an arm's length basis and not as an advisor or fiduciary to the municipality. In connection with the provision of the any such services, there is no agreement, direct or indirect, between any municipality (including the officials, management, employees or agents thereof) and CS for CS to provide advice to the municipality. Municipalities should consult with their financial, accounting and legal advisors regarding any such services provided by CS. In addition, CS is not acting for direct or indirect compensation to solicit the municipality on behalf of an unaffiliated broker, dealer, municipal securities dealer, municipal advisor, or investment adviser for the purpose of obtaining or retaining an engagement by the municipality for or in connection with Municipal Financial Products, the issuance of municipal securities, or of an investment adviser to provide investment advisory services to or on behalf of the municipality. If this report is being distributed by a financial institution other than Credit Suisse AG, or its affiliates, that financial institution is solely responsible for distribution. Clients of that institution should contact that institution to effect a transaction in the securities mentioned in this report or require further information. This report does not constitute investment advice by Credit Suisse to the clients of the distributing financial institution, and neither Credit Suisse AG, its affiliates, and their respective officers, directors and employees accept any liability whatsoever for any direct or consequential loss arising from their use of this report or its content. Principal is not guaranteed. Commission is the commission rate or the amount agreed with a customer when setting up an account or at any time after that.Copyright © 2016 CREDIT SUISSE AG and/or its affiliates. All rights reserved. Investment principal on bonds can be eroded depending on sale price or market price. In addition, there are bonds on which investment principal can be eroded due to changes in redemption amounts. Care is required when investing in such instruments. When you purchase non-listed Japanese fixed income securities (Japanese government bonds, Japanese municipal bonds, Japanese government guaranteed bonds, Japanese corporate bonds) from CS as a seller, you will be requested to pay the purchase price only.