bioenergy and food security rapid appraisal (befs ra) … · the chp (cogeneration) component...
TRANSCRIPT

BIOENERGY AND FOOD SECURITY
RAPID APPRAISAL (BEFS RA)
User Manual
CHP (Cogeneration)


BEFS Rapid Appraisal
Energy End Use Options Module
__________________________________
Heat and Power Sub-Module
Section 1: CHP (Cogeneration)
User Manual

Acknowledgements
The BEFS Rapid Appraisal was the result of a team effort to which the following authors, listed in alphabetical
order, contributed1: Giacomo Branca (Tuscia University, Viterbo), Luca Cacchiarelli (Tuscia University, Viterbo),
Carlos A. Cardona (National University of Colombia at Manizales), Erika Felix, Arturo Gianvenuti, Ana Kojakovic,
Irini Maltsoglou, Jutamanee Martchamadol, Luis Rincon, Andrea Rossi, Adriano Seghetti, Florian Steierer,
Heiner Thofern, Andreas Thulstrup, Michela Tolli, Monica Valencia (National University of Colombia at
Manizales) and Stefano Valle (Tuscia University, Viterbo).
Inputs and contributions were also received from Renato Cumani, Amir Kassam, Harinder Makkar, Walter
Kollert, Seth Meyer, Francesco Tubiello and his team, Alessio d’Amato (University of Rome, Tor Vergata) and
Luca Tasciotti.
We would like to thank the Bioenergy and Food Security Working Group in Malawi2 as well as the National
Biofuels Board3 and its Technical Working Group in the Philippines for their involvement in the pilot testing of
the BEFS Rapid Appraisal and the useful feedback provided. We also wish to extend our appreciation to Rex B.
Demafelis and his team from University of the Philippines Los Baños for their valuable support in the pilot
testing exercise.
The BEFS Rapid Appraisal benefited from feedback and comments provided at a peer review meeting held in
February 2014 in FAO Headquarters by Jonathan Agwe (International Fund for Agricultural Development),
Adam Brown (International Energy Agency), Michael Brüntrup (German Institute for Development Policy),
Tomislav Ivancic (European Commission), Gerry Ostheimer (UN Sustainable Energy for All), Klas Sander (The
World Bank), James Thurlow (International Food Policy Research Institute), Arnaldo Vieira de Carvalho (Inter-
American Development Bank), Jeremy Woods (Imperial College, University of London) and Felice Zaccheo
(European Commission). Useful feedback was also provided by Duška Šaša (Energy Institute Hrvoje Požar,
Zagreb).
Furthermore, we would like to express our sincere gratitude to Monique Motty, Valentina Hernandez, Hector
Forer and Ivonne Cerón Salazar for their assistance in finalizing the tools and documents.
The work was carried out in the context of the Bioenergy and Food Security Rapid Appraisal project
(GCP/GLO/357/GER) funded by the German Federal Ministry of Food and Agriculture (BMEL).
1 Unless otherwise specified, all authors were affiliated to FAO at the time of their contribution.
2 The BEFS working Group in Malawi comprises the following members: Ministry of Energy, Ministry of Lands, Housing, and Urban
Development, Ministry of Finance, Ministry of Agriculture and Food Security, Ministry of Environment and Climate Change and Department of Forestry, Ministry of Industry and Trade, Ministry of Economic Planning and Development, Ministry of Labour and Vocational Training, Ministry of Transport and Public Infrastructure, Ministry of Information and Civic Education, Ministry of Local Government and Rural Development.
3 The National Biofuels Board is chaired by the Secretary of Department of Energy and includes the following members: Department of
Trade and Industry, Department of Science and Technology, Department of Agriculture, Department of Finance, Department of Labor and Employment, Philippine Coconut Authority, Sugar Regulatory Administration.

BEFS RA User Manual Volumes
I. Introduction to the Approach and the Manuals
II. Country Status Module
III. Natural Resources Module
1. Crops
Section 1: Crop Production Tool
Section 2: Crop Budget Tool
2. Agricultural Residues
Crop Residues and Livestock Residues
3. Woodfuel and Wood Residues
Section 1: Forest Harvesting and Wood Processing Residues
Section 2: Woodfuel Plantation Budget
IV. Energy End Use Options Module
1. Intermediate or Final Products
Section 1: Briquettes
Section 2: Pellets
Section 3: Charcoal
2. Heating and Cooking
Biogas Community
3. Rural Electrification
Section 1: Gasification
Section 2: SVO
Section 3: Combustion
4. Heat and Power
Section 1: CHP (cogeneration)
Section 2: Biogas Industrial
5. Transport
Ethanol and Biodiesel
BEFS Rapid Appraisal – Cogeneration Component User Manual
1
Table of Contents
1 Overview of the Energy End Use Option (End Use) Module ........................................................................... 3
2 The Cogeneration Component ......................................................................................................................... 5
3 Terms and Definitions Used in the Cogeneration Component ........................................................................ 7
4 Scope and Objective of the Cogeneration Component ................................................................................... 8
5 Running the Cogeneration Component ........................................................................................................... 8
5.1 Step 1: Energy Demand ......................................................................................................................... 11
5.2 Step 2: Defining the Feedstock .............................................................................................................. 12
5.3 Step 3: Defining the energy price .......................................................................................................... 17
5.4 Step 4: Operation Mode of Cogeneration ............................................................................................. 17
5.5 Step 5: General inputs ........................................................................................................................... 18
5.6 Step 6: Calculation of the production cost of electricity ....................................................................... 20
6 Assumptions and Limitations of the Cogeneration Component .................................................................... 22
7 The Results of the Cogeneration Component ................................................................................................ 22
7.1 Overview of the production cost calculation (optional)........................................................................ 22
7.2 The summary results by feedstock ........................................................................................................ 24
7.3 The summary of comparative results .................................................................................................... 27
8 References ..................................................................................................................................................... 29

BEFS Rapid Appraisal – Cogeneration Component User Manual
2
List of Figures
Figure 1: The Structure of the Energy End Use Option Module .............................................................................. 3
Figure 2: Biomass Cogeneration System for Heat and Power at the Industrial Level ............................................. 5
Figure 3: Layout of the Cogeneration Results Sheets .............................................................................................. 6
Figure 4: Rapid Appraisal Tool Electricity and/or Heat ........................................................................................... 8
Figure 5: Cogeneration Component: Flow of Analysis and Inter-linkages with BEFS RA Modules and
Components ............................................................................................................................................. 10
Figure 6: Stand-Alone Energy Production ............................................................................................................. 11
Figure 7: Attached Production - Energy Demand .................................................................................................. 12
Figure 8: Feedstock Selection ................................................................................................................................ 13
Figure 9: Feedstock Price Calculation based on the Collection Method and Source ............................................ 14
Figure 10: Feedstock Storage Cost ........................................................................................................................ 16
Figure 11: Storage Calculator of Feedstock ........................................................................................................... 17
Figure 12: Energy Prices ........................................................................................................................................ 17
Figure 13: Operation Mode of Cogeneration - Stand-Alone Production .............................................................. 18
Figure 14: Operation Mode of Cogeneration – Attached Production ................................................................... 18
Figure 15: General Inputs ...................................................................................................................................... 18
Figure 16: Production Cost Calculation ................................................................................................................. 20
Figure 17: Processing Costs for Power Generation ............................................................................................... 20
Figure 18: Detail of Production Costs of Electricity and Steam by Cogeneration Technology .............................. 23
Figure 19: Production Cost and Investment Results ............................................................................................. 25
Figure 20: Financial Analysis Results ..................................................................................................................... 25
Figure 21: Technical and Operating Results .......................................................................................................... 26
Figure 22: Socio-economic Results ........................................................................................................................ 27
Figure 23: Layout of Comparative Results ............................................................................................................. 28
List of Tables
Table 1: Estimate Cost of Storage.......................................................................................................................... 15

BEFS Rapid Appraisal – Cogeneration Component User Manual
3
1 Overview of the Energy End Use Option (End Use) Module
As explained in the general introduction of the BEFS RA training manual, the Energy End Use Option module is
used to assess the techno-economic and socio-economic viability of different bioenergy production pathways.
The module is divided into five sections, these are: Intermediate or Final Products, Heating and Cooking, Rural
Electrification, Heat and Power and Transport. Each of the sub- modules includes a choice of components of
analysis to assess the production of specific biofuels based on particular processing technologies, as depicted
in Figure 1. This module builds up from the information generated in the Natural Resources modules in
relation to feedstock. For a more detailed description of the module, refer to the general introduction of the
training manual.
Figure 1: The Structure of the Energy End Use Option Module
A general description of each of the sub-modules and their respective components of analysis are presented
below. A more detailed discussion on each of the components of analysis will be provided in the respective
user manual.
The Intermediate or Final Products sub-module is used to assess the viability of producing briquettes, pellets
and charcoal. The Briquettes/Pellets components are used to evaluate the potential to develop the
production of biomass briquettes/pellets to supply energy for heating and cooking in rural and urban
households. The objective of the analysis is to generate information on production cost, biomass requirements
and financial viability and social parameters to help users in their decision to promote briquette/pellet
production in the country. The Charcoal component is used to compare existing charcoal production
technologies with improved and more efficient technologies. The aim of the analysis is to assess the required
upfront capital cost of the improved technologies, the financial viability from the standpoint of charcoal
producers and the social and environmental benefits that improved technologies can trigger when compared
to existing charcoal production technologies. The results generated by the analysis inform on potential barriers
for the uptake of the improved charcoal technologies by producers and help define how to effectively
disseminate their introduction.
BEFS Rapid Appraisal – Cogeneration Component User Manual
4
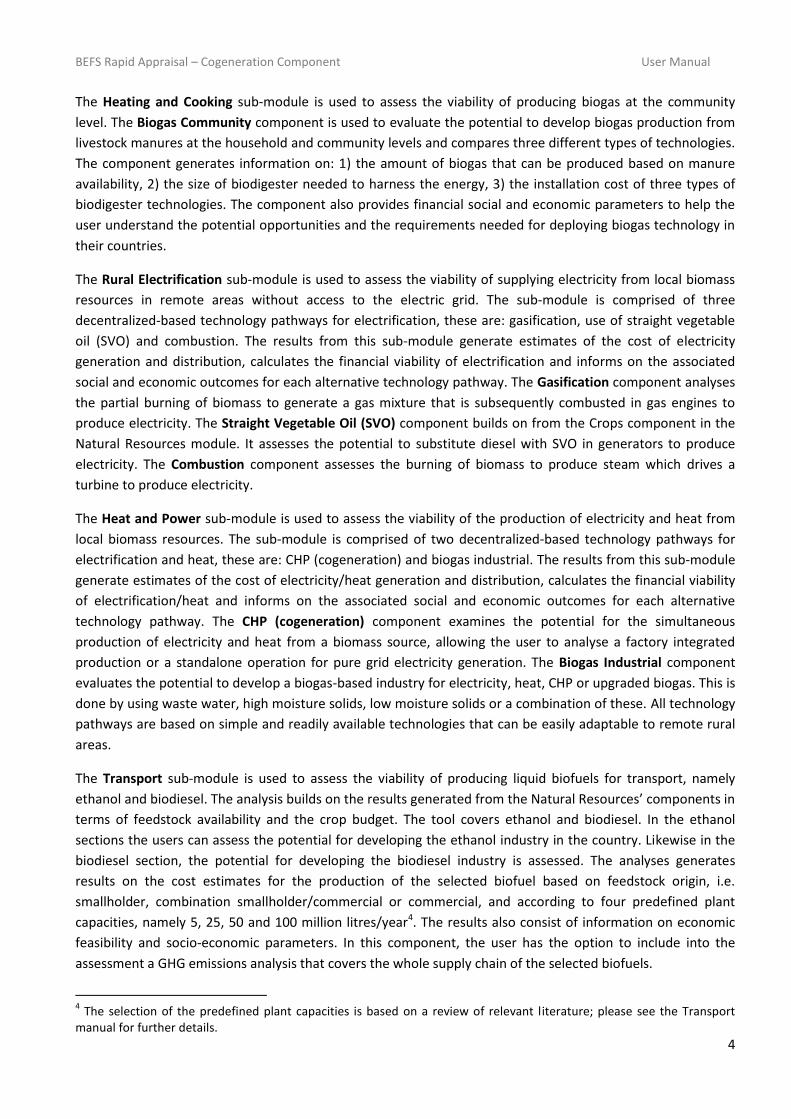
The Heating and Cooking sub-module is used to assess the viability of producing biogas at the community
level. The Biogas Community component is used to evaluate the potential to develop biogas production from
livestock manures at the household and community levels and compares three different types of technologies.
The component generates information on: 1) the amount of biogas that can be produced based on manure
availability, 2) the size of biodigester needed to harness the energy, 3) the installation cost of three types of
biodigester technologies. The component also provides financial social and economic parameters to help the
user understand the potential opportunities and the requirements needed for deploying biogas technology in
their countries.
The Rural Electrification sub-module is used to assess the viability of supplying electricity from local biomass
resources in remote areas without access to the electric grid. The sub-module is comprised of three
decentralized-based technology pathways for electrification, these are: gasification, use of straight vegetable
oil (SVO) and combustion. The results from this sub-module generate estimates of the cost of electricity
generation and distribution, calculates the financial viability of electrification and informs on the associated
social and economic outcomes for each alternative technology pathway. The Gasification component analyses
the partial burning of biomass to generate a gas mixture that is subsequently combusted in gas engines to
produce electricity. The Straight Vegetable Oil (SVO) component builds on from the Crops component in the
Natural Resources module. It assesses the potential to substitute diesel with SVO in generators to produce
electricity. The Combustion component assesses the burning of biomass to produce steam which drives a
turbine to produce electricity.
The Heat and Power sub-module is used to assess the viability of the production of electricity and heat from
local biomass resources. The sub-module is comprised of two decentralized-based technology pathways for
electrification and heat, these are: CHP (cogeneration) and biogas industrial. The results from this sub-module
generate estimates of the cost of electricity/heat generation and distribution, calculates the financial viability
of electrification/heat and informs on the associated social and economic outcomes for each alternative
technology pathway. The CHP (cogeneration) component examines the potential for the simultaneous
production of electricity and heat from a biomass source, allowing the user to analyse a factory integrated
production or a standalone operation for pure grid electricity generation. The Biogas Industrial component
evaluates the potential to develop a biogas-based industry for electricity, heat, CHP or upgraded biogas. This is
done by using waste water, high moisture solids, low moisture solids or a combination of these. All technology
pathways are based on simple and readily available technologies that can be easily adaptable to remote rural
areas.
The Transport sub-module is used to assess the viability of producing liquid biofuels for transport, namely
ethanol and biodiesel. The analysis builds on the results generated from the Natural Resources’ components in
terms of feedstock availability and the crop budget. The tool covers ethanol and biodiesel. In the ethanol
sections the users can assess the potential for developing the ethanol industry in the country. Likewise in the
biodiesel section, the potential for developing the biodiesel industry is assessed. The analyses generates
results on the cost estimates for the production of the selected biofuel based on feedstock origin, i.e.
smallholder, combination smallholder/commercial or commercial, and according to four predefined plant
capacities, namely 5, 25, 50 and 100 million litres/year4. The results also consist of information on economic
feasibility and socio-economic parameters. In this component, the user has the option to include into the
assessment a GHG emissions analysis that covers the whole supply chain of the selected biofuels.
4 The selection of the predefined plant capacities is based on a review of relevant literature; please see the Transport
manual for further details.

BEFS Rapid Appraisal – Cogeneration Component User Manual
5
Another option for the user is to utilise the Pretreatment Calculator prior to using the Energy End Use tools5.
This allows the user to calculate the additional costs of pre-processing the biomass selected in order to obtain
the specific conditions required for the final biomass conversion for energy end use.
2 The Cogeneration Component
The Cogeneration Component is designed to assist the user in evaluating the potential to develop biomass
cogeneration to supply electricity and/or heat at the industrial level. The boundary of the cogeneration
analysis is shown in Figure 2. The tool is based on extensive literature reviews. The detailed assumptions and
calculations used to develop the tool are provided in the Annex.
Figure 2: Biomass Cogeneration System for Heat and Power at the Industrial Level
After completing the analysis, the user will have an indication on: 1) the biomass consumption and area
required to set up the various technologies of biomass cogeneration plants; 2) the potential number of
biomass sustainable cogeneration plants that can be developed in the country; 3) the investment cost and
production cost per kWh and MJ for each technology; 4) the number of households that could be supplied
with electricity; and 5) the employment generation potential and financial viability associated to each
technology as shown in Figure 3. The user will also be able to compare across different biomass types
(feedstock) and cogeneration technologies to identify the most appropriate biomass sources based on a
number of factors, including physical availability, economic and social results.
5 The Pretreatment Calculator can be used prior to utilising the Energy End Use Tools. The exceptions are the Biogas
Community and Transport Tools, as these tools already include pretreatment.

BEFS Rapid Appraisal – Cogeneration Component User Manual
6
Figure 3: Layout of the Cogeneration Results Sheets

BEFS Rapid Appraisal – Cogeneration Component User Manual
7
3 Terms and Definitions Used in the Cogeneration Component
This section includes definitions of specific terms used in the Cogeneration Component. It is important
to anticipate these definitions and consider them throughout the analysis, as to be able to interpret
the results correctly.
Condensing turbine is a type of steam turbine where the steam is condensed below atmospheric
pressure so as to gain the maximum amount of energy from it. In condensing turbines, substantial
quantities of cooling water are required to carry away the heat released during condensation.
Condensing turbines can condense at pressures of 90 to 100 kilopascals (13 to 14.5 pounds per square
inch) below atmospheric pressure.
Back-pressure steam turbine (BST) can be counted among the most employed systems for
bioelectricity production. Biomass is first dried and then burned on a grate or furnace, fixed, moving,
or fluidized. In the combustion chamber, biomass exothermically reacts with excess air, leading to high
reaction rates and high released heat. From an energy generation point of view this reaction allows for
the conversion of the chemical energy stored in biomass into usable energy, which is used to generate
high pressure steam. This steam passes through a turbine connected to a generator, producing
electricity and low pressure steam (see Figure 2). Steam can be used to satisfy part of the heating
requirements of the facility (U.S. Department of Energy 2004).
Biomass Integrated Gasification Combined Cycle Technology (BIGCC): Basic elements of BIGCC
system include biomass dryer, gasification chamber, gas turbine and heat steam recovery generator
(HRSG). Gasification is a thermo-chemical conversion technology of carbonaceous materials (coal,
petroleum coke and biomass), to produce a mixture of gaseous products (CO, CO2, H2O, H2, CH4)
known as syngas added to small amounts of char and ash. Gasification temperatures range between
875-1275 K (Ahmed and Gupta 2011). The gas properties and composition of syngas changes
according to the gasifying agent used (air, steam, steam-oxygen, oxygen-enriched air), gasification
process and biomass properties (Ahmed and Gupta 2011). Syngas is useful for a broader range of
applications, including direct burning to produce heat and power or high quality fuels production or
chemical products such as methanol (Rincón, Hernandez, and Cardona 2014; Quintero, Rincón, and
Cardona 2011). A gas turbine is a rotator engine that extracts energy from a flow combustion gas. It is
able to produce power with an acceptable electrical efficiency, low emission and high reliability. The
gas turbine is composed by three main sections: compression (air pressure is increased, aimed to
improve combustion efficiency), combustion (adiabatic reaction of air and fuel to convert chemical
energy to heat) and expansion (obtained pressurized hot gas at high speed passing through a turbine
generating mechanical work) (Rincón, Hernandez, and Cardona 2014; Quintero, Rincón, and Cardona
2011). The HRSG is a high efficiency steam boiler that uses hot gases from a gas turbine or engine to
generate steam, in a thermodynamic Rankine Cycle. This system is able to generate steam at different
pressure levels. According to process requirements a HSRG system can use single, double or even
triple pressure levels.
Steam is technical name for vaporized water. Steam has different applications as a means for energy
transportation. Steam has the following advantages: low toxicity, ease of transportability, high
efficiency, high heat capacity, and relatively low costs. Steam holds a significant amount of energy on a
unit mass basis that can be extracted as mechanical work through a turbine or as heat for process use.
Since most of the heat content of steam is stored as latent heat, large quantities of heat can be
transferred efficiently at a constant temperature, which is a useful attribute in many process heating
applications (U.S. Department of Energy, 2004).
BEFS Rapid Appraisal – Cogeneration Component User Manual
8
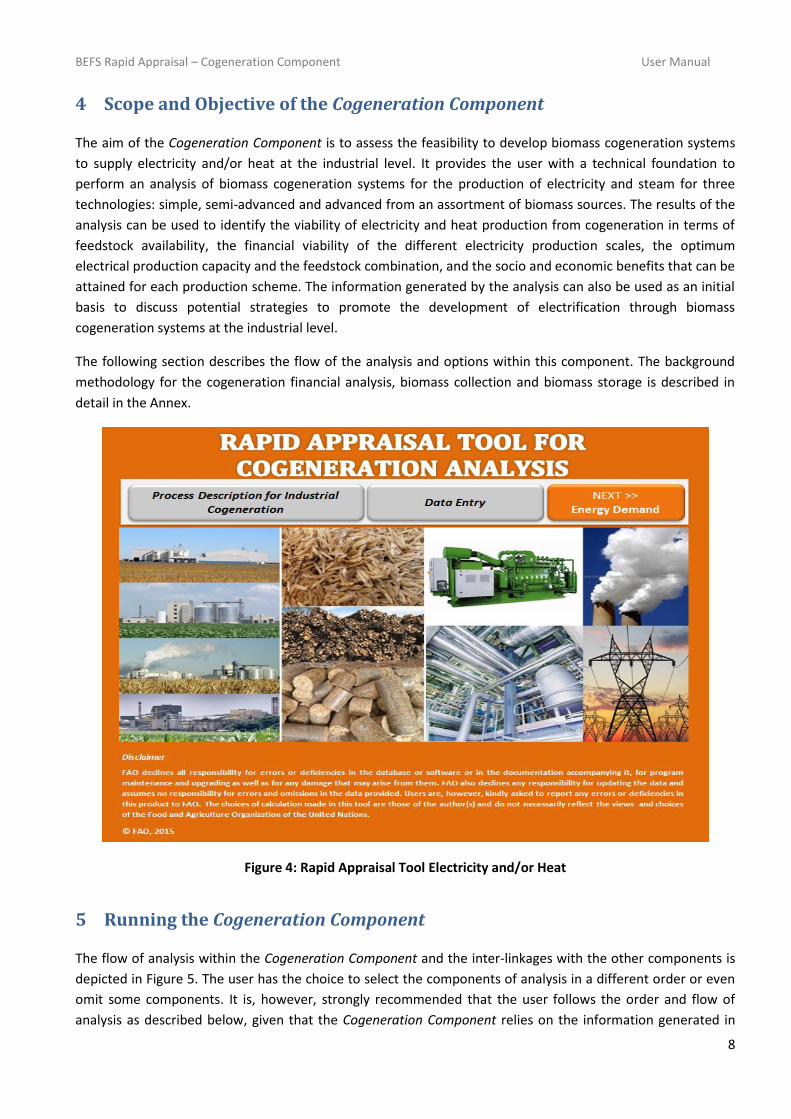
4 Scope and Objective of the Cogeneration Component
The aim of the Cogeneration Component is to assess the feasibility to develop biomass cogeneration systems
to supply electricity and/or heat at the industrial level. It provides the user with a technical foundation to
perform an analysis of biomass cogeneration systems for the production of electricity and steam for three
technologies: simple, semi-advanced and advanced from an assortment of biomass sources. The results of the
analysis can be used to identify the viability of electricity and heat production from cogeneration in terms of
feedstock availability, the financial viability of the different electricity production scales, the optimum
electrical production capacity and the feedstock combination, and the socio and economic benefits that can be
attained for each production scheme. The information generated by the analysis can also be used as an initial
basis to discuss potential strategies to promote the development of electrification through biomass
cogeneration systems at the industrial level.
The following section describes the flow of the analysis and options within this component. The background
methodology for the cogeneration financial analysis, biomass collection and biomass storage is described in
detail in the Annex.
Figure 4: Rapid Appraisal Tool Electricity and/or Heat
5 Running the Cogeneration Component
The flow of analysis within the Cogeneration Component and the inter-linkages with the other components is
depicted in Figure 5. The user has the choice to select the components of analysis in a different order or even
omit some components. It is, however, strongly recommended that the user follows the order and flow of
analysis as described below, given that the Cogeneration Component relies on the information generated in

BEFS Rapid Appraisal – Cogeneration Component User Manual
9
the Natural Resources module and information can be cross-reference with other modules to contextualize
the results of the analysis. The results of this component are essential for the comprehensiveness of the
analysis. When interpreting the results, the user should take into account all relevant factors, particularly
aspects related to food security, agricultural trade and the sustainable use of natural resources.

BEFS Rapid Appraisal – Cogeneration Component User Manual
10
Figure 5: Cogeneration Component: Flow of Analysis and Inter-linkages with BEFS RA Modules and Components

BEFS Rapid Appraisal – Cogeneration Component User Manual
11
The user navigates step by step through the options and is asked to input necessary data to obtain final
results. When the required data are limited or unavailable, then the default values provided by the tool can be
utilised. The navigation buttons are placed on the top and bottom of each sheet, indicating the next step with
the button “NEXT>>” and allowing the user to return to a previous section with the “<<BACK” button.
The following sub-chapters describe each step of the analysis, using an example from the Agriculture Residues
Component to feed the cogeneration system to generate electricity and heat for food processing industries
interested on self-supplying of energy and/or selling to central grid. All input parameters are based on a
generic situation.
5.1 Step 1: Energy Demand
Depending whether the cogeneration system is connected to a processing plant (attached production) or is
stand-alone, the user may or may not need to define the industrial energy demand.
In this tool, stand-alone refers to a cogeneration plant that produces energy to sell to clients. Therefore, the
user does not need to define the industrial energy demand, as the plant is not consuming heat or electricity
(Figure 6).
Figure 6: Stand-Alone Energy Production
For the case of a cogeneration system that is connected to a processing plant (attached production), the
electricity and heating consumption at the industrial level must be defined, as this type of plant supplies
energy for the industry first with any excess then being sold to clients (Figure 7).

BEFS Rapid Appraisal – Cogeneration Component User Manual
12
Figure 7: Attached Production - Energy Demand
5.2 Step 2: Defining the Feedstock
Before proceeding with the analysis, the user can choose to load the default values for running this component by
clicking on “Load Default Values” button as shown in Figure 8, label A.
Step 2.A Selection of the feedstock
The user will:
1. Select the crop(s) and the residue(s) from the dropdown menu associated with each processing plant. The
list includes 15 key food/cash crops, 2 types of wood processing residues and briquettes/pellets (Figure 8,
label 1). Up to four crop residues can be analysed at the same time.

BEFS Rapid Appraisal – Cogeneration Component User Manual
13
Figure 8: Feedstock Selection
2. Enter data on feedstock available (t/year) and yield (t/ha) of the selected crop residues (Figure 8, label 2).
This information is generated in the Natural Resources module.
3. Enter data on the heat cost (USD/t) of the selected crop residues (Figure 8, label 2).
4. Select the current fuel used in boilers for each selected feedstock (Figure 8, label 3).
Step 2.B Feedstock price (USD/t) The user has two options for determining the feedstock price:
A. If there is a current price in the country for this feedstock, the user clicks on the “Market Price
(transport excluded)” (Figure 8, label 4) and directly inputs the price of the selected feedstock (USD/t)
in the corresponding cell.
B. If there is no current price for this feedstock, the user can estimate the price by clicking on the “Use
Price Definition Calculator” and selecting
the “Price Calculator” (Figure 8, label 5).
The user will get a “warning” before
continuing with the use of the calculator,
and the user will need to enter:
1. The wage for both unskilled and skilled labour in “Labour” section in unit of USD per person-hour.
3
2
4
A
1
5
For this example the following were selected: Feedstock 1 “Sugarcane bagasse”, Feedstock 2 “Cassava
stalk”, Feedstock 3 “Coconut husk”, and Feedstock 4 “Coconut fronds” (Figure 8).

BEFS Rapid Appraisal – Cogeneration Component User Manual
14
Guidance: The collection method can
be identified based on similar practices
currently applied in the country.
2. The working hours and price of diesel in the corresponding lines under “Feedstock Collection”.
The “Price Calculator” (Figure 9) assists the user in estimating the potential feedstock price based on the
source and collection method of the feedstock.
Figure 9: Feedstock Price Calculation based on the Collection Method and Source
To run the price calculator, the user will need to:
1. Identify the biomass source from one of the following options (Figure 9, label 1):
- Agriculture residues spread in the field
- Agriculture residues collected from the field
- Agriculture residues from food processing plant
- Forestry
- Forestry and plantation residues
- Residues from wood industry
- Dedicated wood energy plantation
2. Select the biomass collection method (Figure 9,
label 2) from the following options:
- manual
- semi-mechanized
- mechanized
3
1 2

BEFS Rapid Appraisal – Cogeneration Component User Manual
15
Note: The type of labour and diesel required will depend on the collection method: manual, semi-mechanized and mechanized.
3. Enter the labour requirements (person-hour per
hectare) and the fuel needs (litres per hour)
associated with the selected biomass collection
method (Figure 9, label 3). To return to previous
section, the user must click on the “<<BACK Data
Entry” button.
The calculator will automatically generate a feedstock price (Figure 9, red box), and this value is transferred
to the “Data Entry Needs” worksheet for further calculation.
4. The user will need to carry out similar steps for each feedstock chosen.
Step 2.C: Feedstock storage cost (USD/t) Step 2.C.1 The user can enter the existing prices of storage of agricultural products in the country as a
proxy. The price should be entered in the respective cell for each feedstock (USD/tonne). If this
information is not available, then the user should go to the next step.
Step 2.C.2 The user can determine a proxy for this value. The user will need to do the following:
1. Identify a type of feedstock storage likely associated with conditions in his/her country from
the options presented in Table 1.
2. For the selected storage option, look up the global building cost provided in Table 1.
3. Enter the proxy value (USD/tonne) in the respective cell for each feedstock.
Table 1: Estimate Cost of Storage
Estimate Cost of Storage Unit Min Average Max
Enclosed structure with crushed rock floor USD/tonne 10 12.5 15
Open structure with crushed rock floor USD/tonne 6 7 8
Reusable tarp on crushed rock USD/tonne n/a 3 n/a
Outside unprotected on crushed rock USD/tonne n/a 1 n/a
Outside unprotected on ground USD/tonne n/a 0 n/a
Source: (EPA, 2007)
For this example, the selected Feedstock 2 “Cassava stalk” is assumed to be sourced from “agricultural residues
spread in the field” and the collection method is “semi-mechanized”. The number of person-hours for skilled
workers (machine operators) is 20 and for unskilled workers is 5, and the diesel consumption of the machine is
0.5 litres per hour. Using the information that manual labour works 8 hours per day and machinery works 16
hours and the diesel price is 1.20 USD per litre, a proxy price of feedstock is calculated at 2.64 USD/t (Figure 9).
For this example, all feedstock are stored on crushed rock and covered by a reusable tarp. Therefore, the cost of
storage is 3 USD/tonne. (User inputs the cost in the corresponding cells as shown in Figure 10, label 1).

BEFS Rapid Appraisal – Cogeneration Component User Manual
16
Figure 10: Feedstock Storage Cost
Step 2.C.3 In order to calculate the storage capacity needs, the user needs to click on the “Storage
Calculator” (Figure 10, label 2). This will take the user to the Biomass Storage Calculator (Figure 11). In
this worksheet, the user will need to:
1. Selects the harvesting month(s) of the crop (Figure 11, label 1).
2. Enter the biomass safety stock rate (%). This is the percentage of biomass needed to
secure continuous supply of feedstock to deal with uncertainty in production due to
seasonal availability, flood, drought, and other factors. This stock rate % is used to
estimate the storage capacity (Figure 11, label 2).
3. Click on “Calculate” (Figure 11, label 3) to automatically compute the amount of maximum
storage capacity required (tonnes) and the minimum safety storage (tonnes per month) for
each of the pre-defined capacities (Figure 11, label 4).
4. Clicks “OK” to return to the Data Entry Needs sheet (Figure 11, label 5).
5. Repeat the same steps for all feedstock.
1
2

BEFS Rapid Appraisal – Cogeneration Component User Manual
17
Figure 11: Storage Calculator of Feedstock
5.3 Step 3: Defining the energy price
The user needs to specify (Figure 12):
- Purchase Electricity Price
- Selling Electricity Price
- Country of Origin of Electricity
- Selling Heat Price
Figure 12: Energy Prices
5.4 Step 4: Operation Mode of Cogeneration
There are two modes of cogeneration: electricity tracking and thermal tracking. The user chooses one of these
two depending on his/her central economic and/or technical objective. If the user is mainly interested in
producing electricity, then he/she will select electricity tracking, whereas, if the user is primarily interested in
producing heating, then he/she will select thermal tracking. The plant sizes will adjust according to the tracking
option selected.
5
3
1 2 4
For this example, Feedstock 1 is harvested in 4 months: March, April, August, and September. As a result, the storage capacity required is 37160 tonnes for the first production capacity. The minimum safety feedstock to store is 368 tonnes per month. For other pre-defined capacities please see Figure 11.

BEFS Rapid Appraisal – Cogeneration Component User Manual
18
For stand-alone energy production, if electricity tracking is selected, electricity will be produced and heat
wastes will be used to generate additional electricity. If thermal tracking is selected, then plants will produce
heat, and heat wastes will again be used to generate electricity (Figure 13).
Figure 13: Operation Mode of Cogeneration - Stand-Alone Production
For attached production, if electricity tracking is selected, only electricity will be produced and there will be no
surplus as production is based on the specific demand of the processing plant. If thermal tracking is selected,
cogeneration plants will produce heat. For this option, if there is enough feedstock available, then heat surplus
might be obtained (Figure 14).
Figure 14: Operation Mode of Cogeneration – Attached Production
5.5 Step 5: General inputs
General inputs required to run the operations are shown in Figure 15. The user will need to provide data on:
Figure 15: General Inputs

BEFS Rapid Appraisal – Cogeneration Component User Manual
19
Guidance: If the method of transportation is by person or bike, then it is recommended that the user estimates the cost by using the
cost of labour per hour, working time, the amount of material that can be transported and the approximate kilometres that can be
travelled under the selected method as given in the following equation:
Transportation cost (USD/tonne/km)
= Hourly wages (USD/hour/person) x Working time (hours)
Transportation distance (km) x Feedstock transport (tonne/person)
Alternatively, the user can include this cost in the collection cost of feedstock by adding this to the number of workers in Step 2.B
(estimate price of feedstock) and then inputting zero cost for the transportation of feedstock from the collection point to the plant.
Guidance: This can be
based on unprocessed
agricultural goods
1. Labour cost (USD/person-hour): the labour rate for unskilled and skilled workers (USD per person per
hour). These parameters are required to calculate the feedstock price (as explained in Step 2.B) and the
labour cost of the cogeneration process.
2. Utilities cost: the price of water (USD/m3).
3. Feedstock collection: these parameters are required to calculate the feedstock price as explained in Step
2.B. The user enters the hours of labour required for manual labour, hours of labour required for running
the machinery and the price of diesel.
4. Transportation cost of feedstock (USD/t/km): cost of transportation of
feedstock from collection point to the cogeneration plant. The user will
need to:
- Identify the current methods of transportation to move agriculture
commodities within the country.
- Define the current transportation prices associated to the transportation method identified above
in unit of USD per tonne per km.
5. Other costs (%): The user enters the percentage of:
- General and administrative cost,
- Plant overhead,
- Maintenance cost and
- Miscellaneous cost.
These parameters are used to estimate the production cost of electricity.
6. Financial parameters: The user identifies the values for the following financial parameters:
- Discount rate (%),
- Loan ratio (%),
- Loan interest rate (%),
- Loan term (years) and
- Plant Cost Index.
The plant cost index data for equipment cost is obtained from technical literature and based on past technical
and economic conditions. Therefore, the Intratec Chemical Plant Construction Index (IC), a dimensionless
index used as a proxy to update the capital cost of a chemical plant, which accounts for price changes due to
inflation/deflation and economic conditions, is applied to the BEFS RA tool. This index is freely updated and
available on (http://base.intratec.us/home/ic-index).
For this example, the values shown in Figure 15 were used to carry out the analysis.

BEFS Rapid Appraisal – Cogeneration Component User Manual
20
Note: This section also shows the budgets
for calculating the processing cost. These
calculations are done automatically using the
information entered by the user in the
previous steps and can be reviewed if
needed (see section 7.1 for more details).
5.6 Step 6: Calculation of the production cost of electricity
After entering the data in Steps 1 to 5, the user can
click on any of the “Production Cost” buttons (Figure
16, label A).
Figure 16: Production Cost Calculation
This will take the user to the budget processing section for the selected feedstock (Figure 17).
Figure 17: Processing Costs for Power Generation
In this worksheet, the user will need to enter additional data in the white cells, specifically on:
A
1

BEFS Rapid Appraisal – Cogeneration Component User Manual
21
Guidance: The operating hours
should be related to electricity
demand in a given rural location. For
example, operate six hours per day in
the evening to meet the lighting
demand in rural area A.
Guidance: The power
loss in distribution from
the current electric grid
could be used as proxy.
1. Heat losses due to distribution (%): The user identifies the heat loss (%) in the distribution network.
These losses are assumed to be 5%. However, a parameter can be entered directly by the user (Figure 17,
label 1).
2. Power losses in distribution network (%): The user identifies the power
loss (%) in the distribution network. These losses are assumed to
be 5%. If this information is not readily available, the following
database can be used:
http://data.worldbank.org/indicator/EG.ELC.LOSS.ZS
(The Wold Bank, n.d.) (Figure 17, label 1).
3. Power – self use (%): This is the electricity used in the cogeneration plant to supply the energy
requirements. This value is assumed to be 15%. However, a parameter can be entered directly by the user
(Figure 17, label 1).
4. Operating hours per day: The user enters the operating hours per day to run the cogeneration system6.
The daily operating hours are used to compute the total annual
operating hours and the capacity factor, assuming the
cogeneration system runs 365 days per year (Figure 17, label 1).
5. The transportation distance of the feedstock to the
cogeneration plant: The user identifies an estimated distance, in
kilometres, that will be required to transport the feedstock. The transportation distance depends on the
availability of biomass in a particular area and the amount of biomass required for each production
capacity (Figure 17, label 1).
Once all data is entered, the user must click on “<<BACK Data Entry” to return to the Data Entry Needs sheet. The
user can repeat the same steps for all feedstock.
6 Nouni, Mullick, & Kandpal, 2007
For this example, the “Production Cost 2” is “Cassava stalk”. The values that were used to carry out the analysis are: Heat losses in distribution network (%): 5% Power losses in distribution network (%): 5% Power - self use (%): 10% Operating hours per day: 24 The transportation distance of feedstock to cogeneration plant: Distance to cogeneration plant: 10 These parameters are used for further analysis.

BEFS Rapid Appraisal – Cogeneration Component User Manual
22
6 Assumptions and Limitations of the Cogeneration Component
Before starting the analysis, the user should get familiar with the assumptions and limitations of the tool and
take them into consideration during the analysis and most especially when interpreting the results.
The limitations of the Cogeneration Component are:
1. Three cogeneration technologies are considered: Simple, Semi-advanced and Advanced.
2. The business lifetime is considered to be 20 years for the financial analysis.
3. Heat distribution for district heating is not considered.
4. No distinction between heat and electricity tracking is considered.
The details of key assumptions and calculation equations are presented in the Annex.
7 The Results of the Cogeneration Component
7.1 Overview of the production cost calculation (optional)
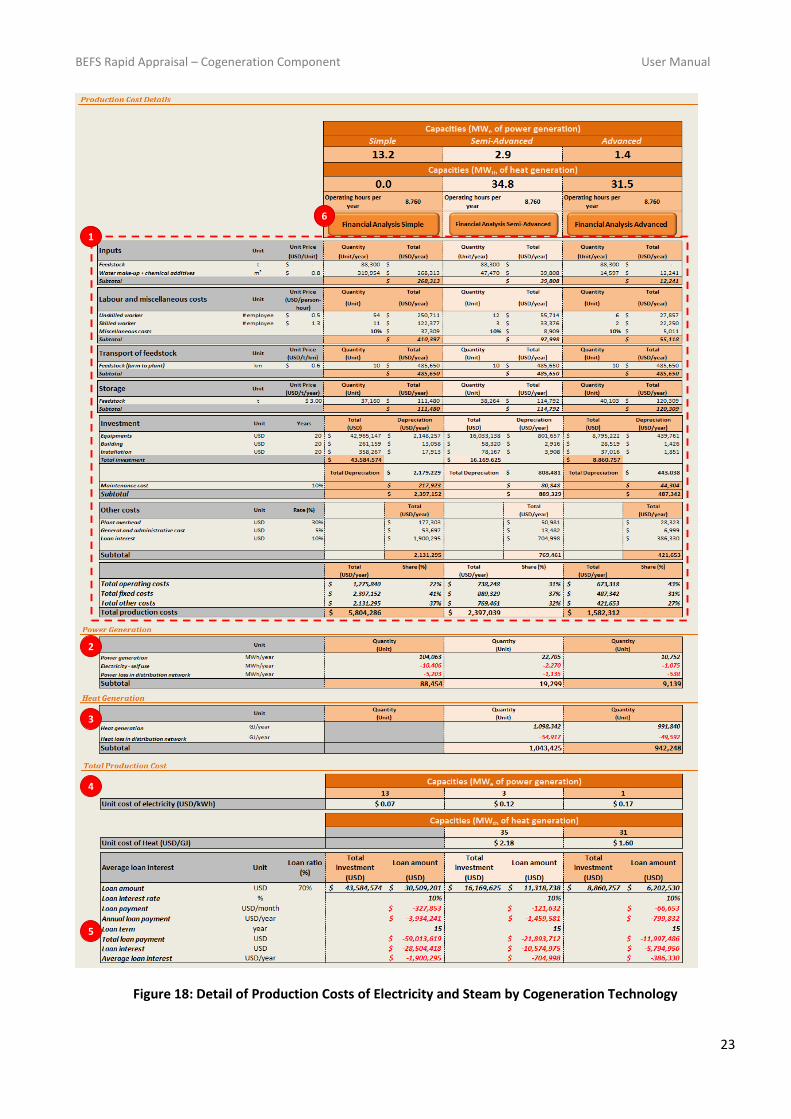
After user inputs all required data (Steps 1 to 6), then the user has the option to review the detailed
production cost as shown in Figure 18. There are five main sections in this worksheet as explained below.
- PART 1 (Figure 18, label 1) shows the distribution of production cost along the following categories:
inputs, labour, transportation of feedstock, storage, investment, plant overhead, general and
administrative cost, loan interest, and income tax. The total production costs (USD/year) of the three
cogeneration technologies (Simple, Semi-advanced and Advanced) are presented for comparative
analysis.
- PART 2 (Figure 18, label 2) shows the total power generation, electricity-self use and power loss in
distribution network in the unit of MWh per year. These values are used for calculating the revenue of
biomass cogeneration for the power generation system. The results are presented for all three
cogeneration technologies.
- PART 3 (Figure 18, label 3) shows the total heat generation and heat loss in distribution network in the
unit of GJ per year. These values are used for calculating the revenue of biomass cogeneration for the
heat generation system. The results are presented for all three cogeneration technologies.
- PART 4 (Figure 18, label 4) shows the unit cost of electricity (USD/kWh) and heat (USD/GJ) for all three
cogeneration technologies.
- PART 5 (Figure 18, label 5) summarizes the loan details e.g. loan amount, loan interest, annual loan
payment, etc., for financial analysis.
- PART 6 (Figure 18, label 6) the “Financial Analysis” buttons will open the worksheet with the details on
the financial analysis for each cogeneration technology.
BEFS Rapid Appraisal – Cogeneration Component User Manual
23
Figure 18: Detail of Production Costs of Electricity and Steam by Cogeneration Technology
3
4
6
1
2
5

BEFS Rapid Appraisal – Cogeneration Component User Manual
24
7.2 The summary results by feedstock
The information presented in this section aims to help the user in the decision making process to support the
development of biomass cogeneration for power and heat generation at the industrial level in his/her country.
The results aim to answer the following questions:
What are the investment and production costs per MWh and GJ for the various configuration
technologies and feedstock selections?
How much biomass and area are required to secure the supply of biomass for the development of
cogeneration systems?
How many potential cogeneration plants can be developed based on the availability of biomass?
How many jobs can be created through biomass cogeneration?
Which type of feedstock is more suitable and could be promoted for the cogeneration system?
What is the financial viability of the cogeneration system?
Results for the Cogeneration Component are divided along four main categories: Production Cost and
Investments; Financial Analysis; Technical and Operating Results; and Socio-economic Results.
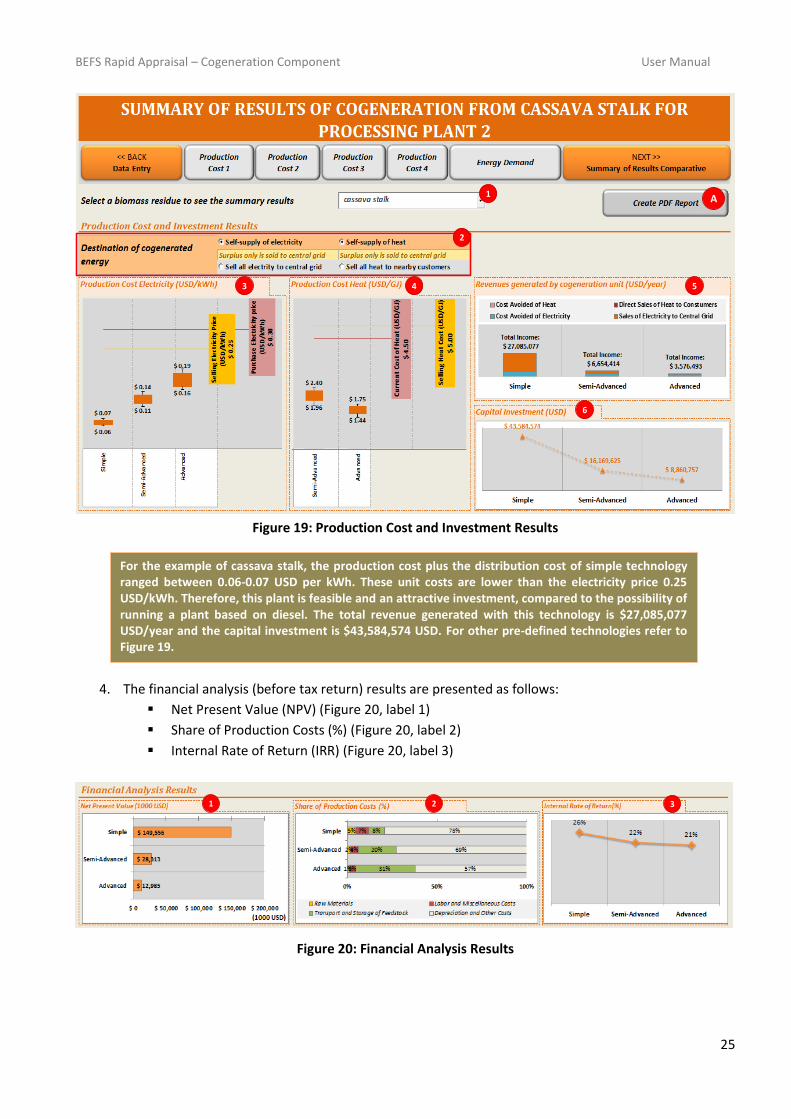
1. The user first selects the feedstock from the dropdown menu that he/she wants to review (Figure 19,
label 1). The results for that specific feedstock will be generated.
2. If the cogeneration system is connected to a processing plant (attached production), then the user
must select the destination of cogenerated energy. The tool provides various scenarios for final energy
use and the user must decide what is best for his/her objectives. If the user decides to self-supply
electricity and/or heat, then only the surplus will be sold to the central grid. On the other hand, the
user can decide to sell all electricity to the central grid and/or heat to nearby customers, but must
keep in mind that none of the energy generated will be supplied to the processing plant. In the
example presented in the results section, attached production with thermal tracking is selected. Then,
self-supply of electricity and heat is also selected as this is the standard method of cogeneration
(Figure 19, label 2).
3. The production cost and investments results are presented as follows:
Production cost of electricity (USD per kWh) (Figure 19, label 3)
Production cost of heat (USD per GJ) (Figure 19, label 4)
Revenues generated by the cogeneration unit (USD/year) (Figure 19, label 5)
Capital investment (USD) (Figure 19, label 6)
For this example, the total production cost of electricity by using cassava stalk for the simple cogeneration technology is 5,804,286 USD/year and the unit cost of electricity is 0.07 USD/kWh. Moreover, the total power generation is 88,454 kWh/year. For other pre-defined capacities are shown in Figure 15.
BEFS Rapid Appraisal – Cogeneration Component User Manual
25
Figure 19: Production Cost and Investment Results
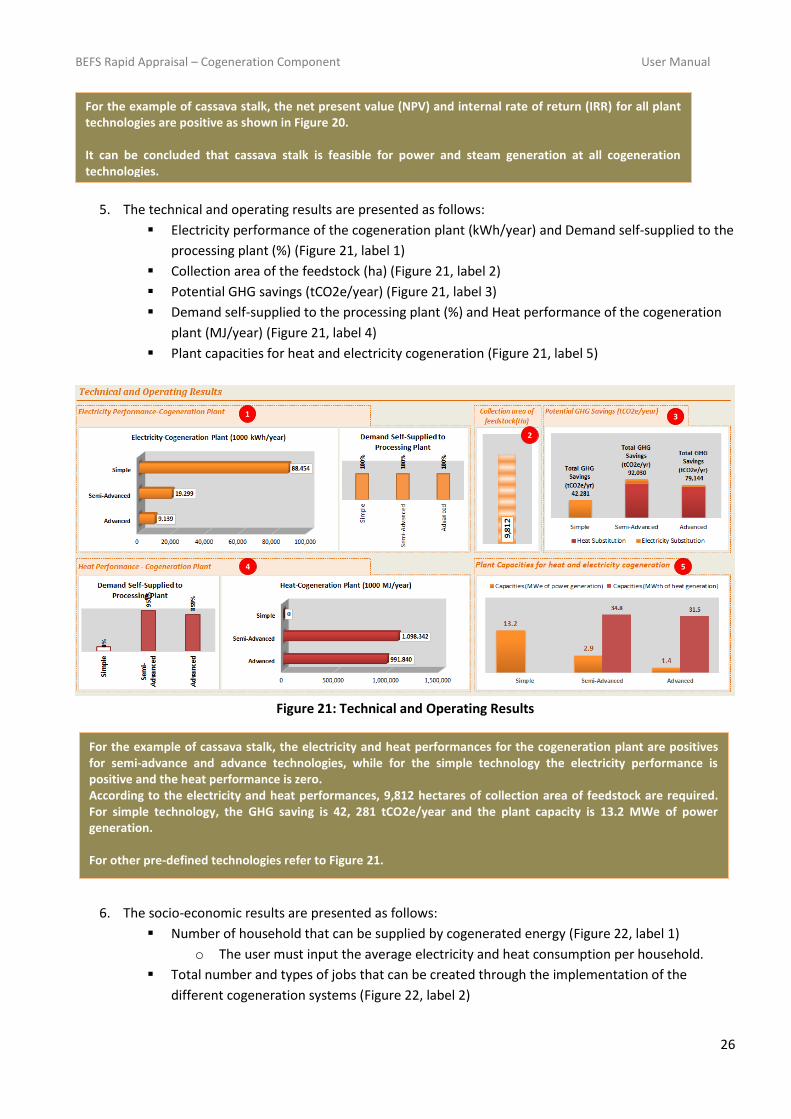
4. The financial analysis (before tax return) results are presented as follows:
Net Present Value (NPV) (Figure 20, label 1)
Share of Production Costs (%) (Figure 20, label 2)
Internal Rate of Return (IRR) (Figure 20, label 3)
Figure 20: Financial Analysis Results
6
1
2
53 4
A
321
For the example of cassava stalk, the production cost plus the distribution cost of simple technology ranged between 0.06-0.07 USD per kWh. These unit costs are lower than the electricity price 0.25 USD/kWh. Therefore, this plant is feasible and an attractive investment, compared to the possibility of running a plant based on diesel. The total revenue generated with this technology is $27,085,077 USD/year and the capital investment is $43,584,574 USD. For other pre-defined technologies refer to Figure 19.
BEFS Rapid Appraisal – Cogeneration Component User Manual
26
5. The technical and operating results are presented as follows:
Electricity performance of the cogeneration plant (kWh/year) and Demand self-supplied to the
processing plant (%) (Figure 21, label 1)
Collection area of the feedstock (ha) (Figure 21, label 2)
Potential GHG savings (tCO2e/year) (Figure 21, label 3)
Demand self-supplied to the processing plant (%) and Heat performance of the cogeneration
plant (MJ/year) (Figure 21, label 4)
Plant capacities for heat and electricity cogeneration (Figure 21, label 5)
Figure 21: Technical and Operating Results
6. The socio-economic results are presented as follows:
Number of household that can be supplied by cogenerated energy (Figure 22, label 1)
o The user must input the average electricity and heat consumption per household.
Total number and types of jobs that can be created through the implementation of the
different cogeneration systems (Figure 22, label 2)
54
3
2
1
For the example of cassava stalk, the net present value (NPV) and internal rate of return (IRR) for all plant technologies are positive as shown in Figure 20. It can be concluded that cassava stalk is feasible for power and steam generation at all cogeneration technologies.
For the example of cassava stalk, the electricity and heat performances for the cogeneration plant are positives for semi-advance and advance technologies, while for the simple technology the electricity performance is positive and the heat performance is zero. According to the electricity and heat performances, 9,812 hectares of collection area of feedstock are required. For simple technology, the GHG saving is 42, 281 tCO2e/year and the plant capacity is 13.2 MWe of power generation. For other pre-defined technologies refer to Figure 21.

BEFS Rapid Appraisal – Cogeneration Component User Manual
27
Guidance: These results can
help identify the type of
feedstock and electricity
production scale that is most
viable and should be
promoted for cogeneration
system.
Figure 22: Socio-economic Results
The user can save and print the results in PDF format by using “Create a PDF report” and following the
instructions (Figure 19, label A).
7.3 The summary of comparative results
The information presented in this section helps the user in the decision making process to develop biomass
cogeneration for power and heat generation at the industrial level. The user can compare the results across
the different feedstock selected in the analysis.
1. The user first selects the feedstock, by clicking on it, that he/she want to review. The results for that
specific feedstock will be generated.
2. Comparison results are presented on:
Production costs of electricity according to feedstock
(USD/kWh) (Figure 23, label 1)
Production costs of heat according to feedstock (USD/GJ)
(Figure 23, label 2)
Collection area (ha) (Figure 23, label 3)
Energy self-supply potentials (Figure 23, label 4)
Total number of jobs that can be created (Figure 23, label 5)
Total number of households that can be supplied (Figure 23, label 6)
Potential GHG savings (tCO2e/year) (Figure 23, label 7)
Comparison of NPV (before taxes) across the selected feedstock options (Figure 23, label 8)
Comparison IRR (before taxes) across the selected feedstock options (Figure 23, label 8)
The user can save and print the results in PDF format by using “Create a PDF report” and following the
instructions (Figure 23, label A).
21
For the example of cassava stalk, the number of households which can supplied by cogenerated electricity with simple technology is 22,967 if the average electricity consumption is 300 kWhe/month/household and for heat is 1000 kWth/month/household. In addition, the potential job creation from a cogeneration plant of simple technology is 65 jobs of processing. For other pre-defined technologies refer to Figure 22.

BEFS Rapid Appraisal – Cogeneration Component User Manual
28
Figure 23: Layout of Comparative Results
32
54
7
6
98
A
1
For this example, the production cost of heat for semi-advanced cogeneration technology is lowest using cassava stalk as feedstock. However, for advanced cogeneration technology it is lowest using coconut husk as feedstock. Importantly, all feedstock provide positive NPV and IRR as shown in Figure 23. It can be concluded that:
1. Sugarcane bagasse, cassava stalk, coconut husk and coconut fronds are feasible options and are available for power generation at all technologies.
2. Sugarcane bagasse, cassava stalk, coconut husk and coconut fronds are feasible options and are available for steam generation at semi-advanced and advanced technologies.
3. Given the electricity performance, a large number of plants based on cassava stalk or coconut husk can be created, impacting positively on the number of households supplied in the country.
4. From a job generation perspective cassava stalk is the best option.
BEFS Rapid Appraisal – CHP Component User Manual
29
8 References
Ahmed, I.I. and A.K. Gupta, Kinetics of woodchips char gasifiction with steam and carbon dioxide. Applied
Energy, 2011. 88(5): p. 1613-1619.
Buchholz, T., I. Da Silva, and J. Furtado, Electricity from wood-fired gasification in Uganda-a 250 and 10kW
case study. in Domestic Use of Energy Conference (DUE), 2012 Proceedings of the 20th. 2012. IEEE.
Bouffaron, P., F. Castagno, and S. Herold, Straight vegetable oil from Jatropha curcas L. for rural
electrification in Mali–A techno-economic assessment. Biomass and Bioenergy, 2012. 37: p. 298-308.
IRENA, Biomass for Power Generation. Renewable Energy Technologies: Cost Analysis Series, 2012. p. 60.
Nouni, M., S. Mullick, and T. Kandpal, Biomass gasifier projects for decentralized power supply in India: A
financial evaluation. Energy Policy, 2007. 35(2): p. 1373-1385.
Patel, B., B. Gami, and H. Bhimani, Improved fuel characteristics of cotton stalk, prosopis and sugarcane
bagasse through torrefaction. Energy for Sustainable Development, 2011. 15(4): p. 372–375.
Pinheiro, G., et al., Rural electrification for isolated consumers: Sustainable management model based on
residue biomass. Energy Policy, 2011. 39(10): p. 6211-6219.
Quaak, P., H. Knoef, and H.E. Stassen, Energy from biomass: a review of combustion and gasification
technologies. World Bank Publications, 1999. 23.
Quintero, J.A., L.E. Rincón, and C. A. Cardona, Chapter 11 - Production of bioethanol from agroindustrial
residues as feedstocks. Biofuels, 2011. p. 251-285.
Rincón, L.E., V. Hernández, and C.A. Cardona, Analysis of technological schemes for the efficient production
of added-value products from Colombian oleochemical feedstocks. Process Biochemistry, 2014. 49(3): p.
474-489.
U.S. Department of Energy’s (DOE) and Advanced Manufacturing Office (AMO), Improving Steam System
Performance: A Sourcebook for Industry, 2004. p. 64.
U.S. Department of Energy’s (DOE), Improve Your Boiler’s Combustion Efficiency, 2012a, Advance
Manufacturing Office. p. 2.
U.S. Department of Energy’s (DOE), Consider Steam Turbine Drives for Rotating Equipment, 2012b, Advance
Manufacturing Office. p. 2.
U.S. Department of Energy’s (DOE), Use Feedwater Economizers for Waste Heat Recovery, 2012c, Advance
Manufacturing Office. p. 2.
U.S. Department of Energy’s (DOE), Return Condensate to the Boiler, 2012d, Advance Manufacturing Office.
p. 2.
U.S. Department of Energy’s (DOE), Benchmark the Fuel Cost of Steam Generation, 2012e, Advance
Manufacturing Office. p. 2.
BEFS Rapid Appraisal – CHP Component User Manual
30
U.S. Department of Energy’s (DOE), Minimize Boiler Short Cycling Losses, 2012f, Advance Manufacturing
Office. p. 2.
U.S. Department of Energy’s (DOE), Replace Pressure-Reducing Valves with Backpressure Turbogenerators,
2012g, Advance Manufacturing Office. p. 2.
U.S. Department of Energy’s (DOE), Consider Steam Turbine Drives for Rotating Equipment, 2012h, Advance
Manufacturing Office. p. 2.
U.S. Department of Energy’s (DOE), Considerations When Selecting a Condensing Economizer, 2012i,
Advance Manufacturing Office. p. 3.
U.S. Department of Energy’s (DOE), Consider Installing High-Pressure Boilers with Backpressure Turbine-
Generators, 2012j, Advance Manufacturing Office. p. 3.
Wiskerke, W., et al., Cost/benefit analysis of biomass energy supply options for rural smallholders in the
semi-arid eastern part of Shinyanga Region in Tanzania. Renewable and Sustainable Energy Reviews, 2010.
14(1): p. 148-165.