bioactive compounds from saponin-rich extracts and their
TRANSCRIPT

foods
Article
Chemical Characterization and Bioaccessibility ofBioactive Compounds from Saponin-Rich Extractsand Their Acid-Hydrolysates Obtained fromFenugreek and Quinoa
Joaquín Navarro del Hierro 1,2, Guillermo Reglero 1,2,3 and Diana Martin 1,2,*1 Departamento de Producción y Caracterización de Nuevos Alimentos, Instituto de Investigación en Ciencias
de la Alimentación (CIAL) (CSIC–UAM), 28049 Madrid, Spain; [email protected] (J.N.d.H.);[email protected] (G.R.)
2 Sección Departamental de Ciencias de la Alimentación, Facultad de Ciencias,Universidad Autónoma de Madrid, 28049 Madrid, Spain
3 Imdea-Food Institute, CEI UAM+CSIC, 28049 Madrid, Spain* Correspondence: [email protected]; Tel.: +34-910-017-930
Received: 21 July 2020; Accepted: 20 August 2020; Published: 21 August 2020�����������������
Abstract: Saponin-rich extracts from edible seeds have gained increasing interest and their hydrolysisto sapogenin-rich extracts may be an effective strategy to enhance their potential bioactivity. However,it remains necessary to study the resulting chemical modifications of the extracts after hydrolysisas well as their impact on the subsequent bioaccessibility of bioactive compounds. The chemicalcomposition of non-hydrolyzed and hydrolyzed extracts from fenugreek (FE, HFE) and quinoa(QE, HQE), and the bioaccessibility of saponins, sapogenins and other bioactive compounds afteran in vitro gastrointestinal digestion was assessed. In general, FE mainly contained saponins (31%),amino acids (6%) and glycerides (5.9%), followed by carbohydrates (3.4%), fatty acids (FFA) (2.3%),phytosterols (0.8%), tocols (0.1%) and phenolics (0.05%). HFE consisted of FFA (35%), sapogenins(8%) and partial glycerides (7%), and were richer in phytosterols (1.9%) and tocols (0.3%). QE mainlycontained glycerides (33%), FFA (19%), carbohydrates (16%) and saponins (7.9%), and to a lesserextent alkylresorcinols (1.8%), phytosterols (1.5%), amino acids (1.1%), tocols (0.5%) and phenolics(0.5%). HQE mainly consisted of FFA (57%), partial glycerides (23%) and sapogenins (5.4%),were richer in phytosterols (2.4%), phenolics (1.2%) and tocols (0.7%) but poorer in alkylresorcinols(1%). After in vitro digestion, saponins from FE and QE were fully bioaccessible, sapogenins from HFEdisplayed a good bioaccessibility (76%) and the sapogenin from HQE was moderately bioaccesible(38%). Digestion of saponin and sapogenin standards suggested that other components of the extractswere enhancing the bioaccessibility. Other minor bioactive compounds (phytosterols, alkylresorcinols,tocols and some phenolics) also displayed optimal bioaccessibility values (70–100%).
Keywords: fenugreek; quinoa; saponins; diosgenin; oleanolic acid; alkylresorcinols; hydrolysis;in vitro digestion; bioaccessibility; co-excipient foods
1. Introduction
Fenugreek (Trigonella foenum-graecum L.) and quinoa (Chenopodium quinoa Willd.) are annual cropswhose edible seeds have gained special interest in the past decade due to their increasing worldwideproduction. As an example, fenugreek production in India increased from 116,000 tonnes in 2011to 247,000 tonnes in 2016, whereas 80,000 tonnes of quinoa were produced worldwide in 2010 andnearly 160,000 tonnes in 2018 [1,2]. While fenugreek is believed to be a legume native of the Eastern
Foods 2020, 9, 1159; doi:10.3390/foods9091159 www.mdpi.com/journal/foods

Foods 2020, 9, 1159 2 of 24
Mediterranean region and the Indian subcontinent, the pseudocereal quinoa is an indigenous plantof the Andean region of South America [3,4]. Along with their increased production, the gradualintroduction of these seeds in Western cuisine has promoted their growing consumption, to thepoint where these foods nowadays enjoy great consumer acceptance across Europe, North Americaand other parts of the world [5,6]. Fenugreek seeds, eaten raw, cooked or sprouted, are bitterto the taste and commonly used as spices in food, as a flavoring in curry powder, infused or assupplements [5]. Quinoa, both sweet and bitter varieties, can be eaten boiled in water and as a ricereplacement, popped like popcorn, ground to be used as flour and even sprouted [7]. Together withtheir corresponding macronutrients, mainly proteins, carbohydrates and lipids, both seeds are sourcesof minor bioactive phytochemicals, including saponins, phenolic compounds, phytosterols, carotenoids,alkaloids, tocopherols, and they are also rich in essential fatty acids, amino acids, minerals and somevitamins, among many other constituents [8,9]. Due to this composition, current interest in these seedsis focused not only on their culinary and nutritional properties, but also on the obtention of extractsrich in bioactive compounds to be used as nutraceuticals or functional ingredients.
Within these compounds, saponin-rich extracts from fenugreek and quinoa seeds are ofincreasing popularity. Saponins are a large group of high molecular weight glycosidic compounds,that consist of a hydrophobic triterpenoid or steroid aglycone, known as sapogenin, attached to one ormore hydrophilic sugar moieties through an ether or ester glycosidic linkage [10]. Fenugreek isknown for containing steroid saponins, while those from quinoa have been described to betriterpenoid-like. The interest on these bioactive compounds is due to the increasing number ofevidences demonstrating their bioactive properties, such as immunostimulatory, hypocholesterolemic,antitumor, antiinflammatory, antibacterial, antiviral, antifungal, and antiparasitic, among others [11–13].
Concerning the production of saponin-rich extracts, ultrasound-assisted extraction (UAE) hasgained special relevance due to significantly reduced energy consumption and extraction times,together with a higher extraction efficiency [14]. The obtention of saponin-rich extracts from fenugreek,quinoa and other seeds by UAE has been effectively performed very recently [15–17]. Additionally,as we already demonstrated, other bioactive or interesting compounds can be co-extracted duringthe production of saponin-rich extracts from fenugreek and quinoa, such as phenolic compounds orlipids [15].
In any case, in addition to the own saponin interest per se, one of the aims of producing extractswith a relevant saponin content is to further transform them to sapogenin-rich extracts. This is due tothe fact that it has been proven that many aglycones exert enhanced bioactivities when compared totheir former saponin [18]. In this sense, the most common process described in the literature and alsoused at industrial scale for the transformation of saponins to sapogenins is the acid hydrolysis [19].As an example of superior bioactivity of sapogenins, Zhang et al. [20] have recently demonstratedthat sapogenins obtained from the acid hydrolyzed products of fenugreek had a greater α-glucosidaseinhibitory activity than the saponins as a whole. Similarly, Di Liberto et al. [21] demonstrated that theacid hydrolysate of a saponin-rich extract from Phytolacca dioica L. berries showed promising antifungalpotency against Candida albicans and Cryptococcus neoformans, whereas the non-hydrolyzed extractshowed low or negligible activity. However, concerning the superior bioactivity of hydrolyzed extractsof saponins, it is interesting to remark that the hydrolysis process itself also leads to the transformation ofthe whole extracts to yield other bioactive compounds together with sapogenins. Such transformationsmight also contribute to the whole improved bioactivity. As an example, we recently demonstrated thatphytosterols or tocopherols were also increased together with sapogenins after the acid hydrolysis offenugreek and quinoa extracts [22]. Therefore, a further deep chemical characterization of hydrolyzedsaponin-rich extracts would be of great interest in order to understand the behavior and transformationof certain other components when submitted to hydrolysis. The characterization of both extracts mayallow a complete understanding of the subsequent bioactivity.
Regardless of the effect of the hydrolysis process on the composition of the extracts, their bioactivityis closely related to their intestinal bioaccessibility [18]. This term refers to the amount of a compound

Foods 2020, 9, 1159 3 of 24
that is released from its matrix in the gastrointestinal tract and thus becomes available for intestinalabsorption [23]. In other words, it may be defined as the fraction of a total ingested given compoundthat remains solubilized and stable before cell absorption. In the specific case of saponins from differentseed extracts, such as fenugreek, quinoa, lentil, soybean or lupin, a wide range of bioaccessibilities hasbeen recently described [15]. These values varied between 13 and 83% for aqueous ethanol extracts,although the bioaccessibility of saponins contained in ethanolic extracts was almost complete in allcases. Several factors were related to such variability, being the co-extracted compounds a relevant one.Thus, it was found that the total phenolic content limited the bioaccessibility of saponins, whereas thefat content or the saponin/fat content ratio enhanced this parameter [15]. Hence, it is important tobear in mind that the characterization of co-existing compounds in the extracts and the study of theirbioaccessibility may help to understand the whole gastrointestinal behavior of the extracts and theirfurther potential bioactivity.
While the available literature regarding the bioaccessibility of saponins is relatively scarce,the studies focusing on the bioaccessibility of sapogenins are, to the best of our knowledge, evenmore limited than for saponins [18,24,25]. Nevertheless, the bioavailability of sapogenins has beenmore deeply studied and very low values have been described. This suggests that the poor intestinalabsorption of aglycones is consequence of a relatively poor bioaccessibility, due to their low aqueoussolubility as non-polar compounds [26]. It is important to remark, however, that the poor bioaccessibilityexpected for sapogenins may be linked to the aglycones when consumed alone. This is because certaincomponents of the extracts or the co-digestion with certain food excipients of lipid nature may beconsiderably enhancing the solubility of these compounds in the intestinal tract, and hence theirbioaccessibility [25,27]. Therefore, the study of the bioaccessibility of sapogenins as part of a wholeextract would be of interest before to generally stating that these compounds would have a poorbioaccessibility. This same hypothesis may be considered for the bioaccessibility of other bioactivecompounds contained in the hydrolyzed saponin-rich extracts, such as phytosterols, tocols or phenoliccompounds, among others.
The aims of this study were: (1) to tentatively study the modification of the chemical compositionof saponin-rich extracts obtained from fenugreek and quinoa seeds after their acid hydrolysis, analyzingchanges in the saponin and sapogenin content, as well as the modification in the composition of otherco-existing compounds in the extracts; and (2) to assess the bioaccessibility of saponins, sapogenins andother co-existing bioactive compounds of the extracts after the in vitro simulation of the gastrointestinaldigestion. Furthermore, the bioaccessibility of individual saponin and sapogenin standards, namelydioscin, diosgenin and oleanolic acid, was also evaluated for comparative purposes with the extracts.
2. Materials and Methods
2.1. Reagents and Materials
Commercial seeds of fenugreek (Trigonella foenum-graecum L.) were purchased from Murciana deHerboristeria (Murcia, Spain) and seeds of red quinoa (Chenopodium quinoa Willd.) were purchasedfrom Hijo de Macario Marcos (Salamanca, Spain). Trizma base, maleic acid, sodium chloride, calciumchloride, HCl, Amano lipase A from Aspergillus niger, pepsin, pancreatin from porcine pancreas,bile salts, phosphatidyl choline from egg yolk, β-sitosterol (≥70%), oleic acid, lysine, 1,3-diolein,1-oleoyl-rac-glycerol, myo-inositol, d-glucose, quercetin, diosgenin, hederagenin, protocatechuic acid,squalane, and N,O-bis-(trimethylsilyl)trifluoroacetamide (BSTFA) were from Sigma-Aldrich ChemieGmbH (Steinheim, Germany). Sucrose was from Panreac (Barcelona, Spain). Dioscin, protodioscin,5-pentadecylresorcinol and oleanolic acid were from Cymit Quimica S.L (Barcelona, Spain). Methanol,hexane, 1-butanol, chloroform were from Macron (Gliwice, Poland).

Foods 2020, 9, 1159 4 of 24
2.2. Obtention of the Saponin-Rich Extracts by Ultrasound-Assisted Extraction (UAE)
Seeds were ground in a knife mill (Grindomix GM200, Retsch, Haan, Germany) at 10,000 rpm for1 min and the resulting powder was sieved in a vertical sieve (CISA Cedacería Industrial, Barcelona,Spain) until obtaining fractions with a particle size between >100 µm and ≤250. The subsequentextraction was based on Navarro del Hierro et al. [27]. Samples were extracted with methanol ata ratio of sample to solvent of 1:10 (w/v) for 15 min by direct sonication (Branson SFX250 DigitalSonifier, Branson Ultrasonics, Danbury, CT, USA) with an ultrasonic probe (1/2” diameter, outputsonication amplitude of 60%) at 20 kHz in a glass vial. Then, the mixture was centrifuged at 3400× gfor 15 min. The supernatant was defatted with hexane at a ratio of 1:1 (v/v) by vortex agitation for 1min and centrifuged at 2688× g for 10 min. The top hexane phase was removed with a pipette andthe methanolic phase was collected and rotary evaporated under vacuum (Valor Hei-VAP, HeidolphInstruments, Schwabach, Germany). In order to achieve a further enrichment in the compounds ofinterest, the dried residue was extracted with water and 1-butanol in Falcon tubes. Briefly, milliQwater was added to the dried residue at a ratio of sample to solvent of 1:20 (w/v). Once solubilized,1-butanol was added to the mixture at a ratio of water to 1-butanol of 1:2 (v/v), vortexed for 1 min andcentrifuged at 2688× g for 10 min. The top phase was collected and the bottom phase was extractedagain under the same proportions and conditions. Both collected phases were dried under vacuum,extraction yield (EY) was estimated and the resulting extracts (fenugreek extract, FE; quinoa extract,QE) were stored at −20 ◦C until further use. This process was performed at least in quintuplicate.
2.3. Preparation of the Sapogenin-Rich Extracts
The previously obtained saponin-rich extracts were mixed to obtain a single extract to beacid-hydrolyzed as described by Navarro del Hierro et al. [27]. Briefly, the saponin-rich extracts wereheated at 100 ◦C (Stuart™ Block Heater, Cole-Parmer, Staffordshire, UK) with HCl solution (2 mol L−1)at a ratio of sample to acid solution of 1:50 (w/v) for 1 h in glass vials. After, the mixture was ice-cooledfor 5 min and liquid-liquid extracted with ethyl acetate at a ratio of 1:1 (v/v) by vortex agitation for1 min and centrifuged at 3400× g for 5 min. The top phase was collected and the bottom phase wasextracted again with the same volume of ethyl acetate under the described conditions. Both collectedphases were dried under N2 stream, EY was estimated and the resulting extracts (hydrolyzed fenugreekextract, HFE; hydrolyzed quinoa extract, HQE) were stored at −20 ◦C until further use. This procedurewas performed at least in triplicate and once the EY was estimated, all replicates were mixed to obtaina single extract.
2.4. Characterization of the Extracts by High Performance Liquid Chromatography-Diode Array Detection
Saponins were tentatively characterized on a LC-2030C 3D Plus system (Shimadzu, Kyoto, Japan),following the method described by Herrera et al. [22]. The system was equipped with a quaternarypump and a DAD. Separation of compounds was carried out on an ACE 3 C18-AR column (150 mm ×4.6 mm, 3 µm particle size) protected by a guard column (Advanced Chromatography TechnologiesLtd, Aberdeen, Scotland). A gradient elution was performed using water with 0.05% TFA (phase A),and acetonitrile with 0.05% TFA (phase B). The method was as follows: 0–20 min, 95–5% A; 20–45 min:5% A; 45–46 min: 5–95% A; 46–50 min 95% A. The flow rate was constant at 0.4 mL/min, and thecolumn temperature was kept at 25 ◦C. The injection volume was 20 µL, and UV-Visible spectra wererecorded from 190 to 700 nm, whereas the chromatograms were registered at 210 nm. Quantification ofsaponins was performed by calibration curves obtained from hederacoside C for saponins from quinoaand protodioscin for saponins from fenugreek. Both calibration curves were prepared at 0.12, 0.24,0.48, 0.72 and 0.97 mg/mL.

Foods 2020, 9, 1159 5 of 24
2.5. Characterization of the Extracts by Gas Chromatography-Mass Spectrometry
Prior to characterization, 10 mg of sample was derivatized with 1 mL of BSTFA by heating at75 ◦C for 1 h in a block heater (Stuart™ Block Heater). Then, extracts were tentatively characterizedaccording to Herrera et al. [22], the derivatized samples were analyzed by GC-MS (Agilent 7890A,Agilent Technologies, Santa Clara, CA, USA) comprising a split/splitless injector, an electronic pressurecontrol, a G4513A autoinjector, and a 5975C triple-axis mass spectrometer detector. The column usedwas an Agilent HP-5MS capillary column (30 m × 0.25 mm i.d., 0.25 µm phase thickness). Helium wasused as carrier gas at 2 mL/min. The injector temperature was 260 ◦C, and the mass spectrometerion source and interface temperatures were 230 and 280 ◦C, respectively. The sample injections(1 µL) were performed in splitless mode. The oven temperature was initiated at 50 ◦C, held for3 min and increased at a rate of 15 ◦C/min to 310 ◦C, then held for 25 min. The mass spectra wereobtained by electronic impact at 70 eV. The scan rate was 1.6 scans/s at a mass range of 30–700 amu.Identification of compounds was performed by the NIST MS Data library, the mass spectra accordingto literature, or according to those of pure commercial compounds whenever possible. Quantificationof compounds was performed by calibration curves obtained from commercial standards wheneverpossible. The commercial standards oleanolic acid and hederagenin were used for the quantification ofsapogenins from quinoa, while diosgenin was used for the quantification of those from fenugreek.For other additional compounds of the extracts, oleic acid was used for the quantification of FFA,1,3-diolein was used for diacylglycerides (DAG), 1-oleoyl-rac-glycerol was used for monoacylglycerides(MAG), lysine was used for amino acids, d-glucose was used for monosaccharides, myo-inositolwas used for sugar alcohols, sucrose was used for disaccharides, protocatheccuic acid was used forphenolic compounds, quercetin was used for itself, 5-pentadecylresorcinol was used for alkylresorcinols,β-sitosterol was used for the quantification of both phytosterols and tocopherol, and finally squalanewas used for squalene.
2.6. In Vitro Gastrointestinal Digestion
The in vitro digestion model was based on Navarro del Hierro et al. [15] with slight modifications.In this study, the whole process of digestion was performed in 50 mL Falcon tubes to allow the directcentrifugation at the end of digestion for the bioaccessibility determination, as explained in Section 2.7.For gastric digestion, 1.1 mL of a gastric solution at pH 2.5 (150 mM NaCl, 6 mM CaCl2 and 0.1 mMHCl) were added to 12.5 mg of the extracts, to reach a concentration of 5 mg/mL at the end of thedigestion. For the assays with commercial standards and for comparative purposes, the initial digestedamount was equal to the amount of saponins or sapogenins contained in 5 mg/mL of either FE, HFEor HQE at the end of the digestion, that is, 3.9 mg for dioscin, 1 mg for diosgenin and 0.70 mg foroleanolic acid, respectively. Then, the mixture was gently stirred at 250 rpm in an orbital incubator(Titramax 1000 package, 177 Heidolph Instruments) at 37 ◦C for 1 min to allow the dispersion of thecomponents. The gastric digestion started after the addition of 0.225 mL of a fresh extract of gastricenzymes containing gastric lipase (16 mg/mL) and pepsin (5 mg/mL) in gastric solution previouslystirred for 10 min. The gastric digestion was performed for 45 min and 250 rpm. Then, for the intestinaldigestion, 0.95 mL of a solution simulating a biliary secretion (50 mg of lecithin and 125 mg of bile saltsin 0.25 mL of 325 mM CaCl2 solution, 0.75 mL of 3.25 M NaCl solution, and 5 mL of Trizma-maleatebuffer 100 mM pH 7.5) were added. After the addition of the biliary secretion, the whole mediumwas stirred for 1 min at 37 ◦C. The intestinal digestion was initiated by the addition of 0.225 mL ofthe supernatant of a fresh pancreatin extract at 15.6 mg/mL in trizma-maleate buffer, which had beenpreviously stirred for 10 min and centrifuged at 2688× g for 15 min. The reaction was performed for60 min at 250 rpm. Digestions were prepared at least in duplicate.

Foods 2020, 9, 1159 6 of 24
2.7. Determination of the Bioaccessibility of Bioactive Compounds
For the determination of the bioaccessibility of saponins, the digestion medium was submittedto centrifugation at 2688 × g for 40 min in order to obtain the micellar phase. This phase containedthe solubilized or bioaccessible saponins. Hence, aliquots from both the digestion medium and themicellar phase were directly analyzed as described in Section 2.4 by HPLC-DAD, but in this case,the chromatograms were registered at 317 nm (for fenugreek saponins) and 323 nm (for quinoasaponins), to avoid the interference of the chromatographic signal derived from the digestion medium.
For the determination of the bioaccessibility of sapogenins and the rest of bioactive compounds,two sets of digestions were prepared in duplicate. One, which was the whole digestion medium andthe second one, the isolated micellar phase. Then, according to Navarro del Hierro et al. [27], each ofthe digestions were vortex-extracted for 1 min with ethyl acetate at a ratio of 1:1 and centrifuged for10 min at 2688× g. The top phase was collected and the bottom phase was extracted again with thesame volume of ethyl acetate under the described conditions. Both collected phases were dried underN2 and the resulting residue was derivatized and analyzed by GC-MS as described in Section 2.5.
The bioaccessibility of all compounds was calculated as follows:
Bioaccessibility (%) = (weight of compound in micellar phase/x weight of compound in
digestion medium) × 100
2.8. Statistical Analysis
Statistical analyses were performed by means of the general linear model procedure of the SPSS26.0 statistical package (SPSS Inc., Chicago, IL, USA) by one-way analysis of variance. Differences wereconsidered significant at p ≤ 0.05.
3. Results & Discussion
3.1. Extraction Yield
The first parameter analyzed prior to the characterization of each of the extracts was the EY, definedas the weight of crude dried extract obtained respect to the weight of ground seed used for extraction,expressed as percentage. In general, the UAE extraction using methanol and the further concentrationwith butanol in order to obtain extracts with an increased saponin content led to differences in theEY between the two studied seeds. The EY of the FE was 5.57 ± 0.59%, whereas that from QE was2.12 ± 0.10% (p < 0.001). These values, and specially that from quinoa, are considerably lower than theones previously described for ethanolic extracts from these same seeds (9.35% for fenugreek and 14.8%for quinoa), likely due to the fact that such extracts were obtained with a less polar solvent, were notdeffated and were not further concentrated with butanol, but these operations did not favor a higherenrichment in saponins [15].
When the acid hydrolysis was performed for the obtention of sapogenin-rich extracts, differencesbetween the two types of extracts (non-hydrolyzed/hydrolyzed) and the two seeds were also observed(p < 0.001). Specifically, the EY of the HFE was 2.90 ± 0.08% and that from HQE was 1.41 ± 0.04%,which was similar to the 0.9% EY recently described for an acid-hydrolyzed Hedera helix L. extract richin hederagenin, a triterpenoid aglycone also occurring in quinoa seeds [28].
Therefore, from the EY point of view, and taking into account the economical relevance of thisparameter, the fenugreek seeds are more interesting than quinoa seeds to obtain either saponin-richextracts and sapogenin-rich extracts.
3.2. Saponin and Sapogenin Content on the Extracts
The saponin and sapogenin content of the non-hydrolyzed and hydrolyzed extracts from fenugreekand quinoa is shown in Table 1 and their chromatograms are shown as Figures S1 and S2. It should
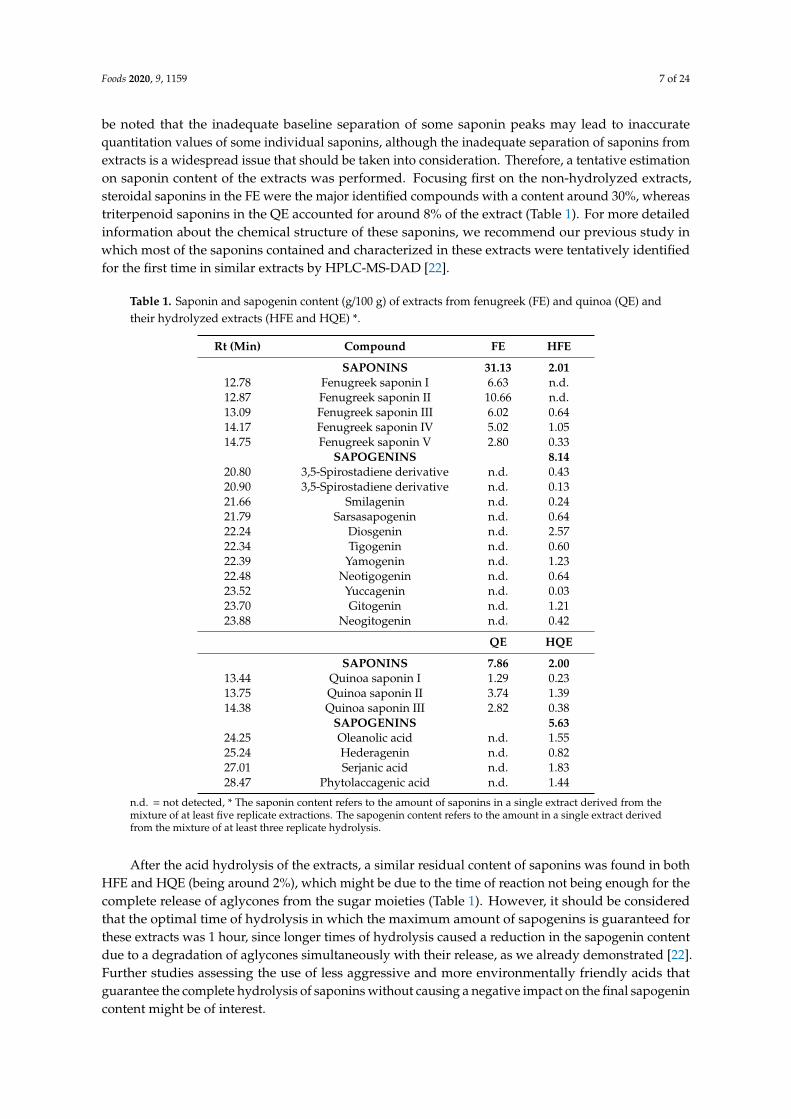
Foods 2020, 9, 1159 7 of 24
be noted that the inadequate baseline separation of some saponin peaks may lead to inaccuratequantitation values of some individual saponins, although the inadequate separation of saponins fromextracts is a widespread issue that should be taken into consideration. Therefore, a tentative estimationon saponin content of the extracts was performed. Focusing first on the non-hydrolyzed extracts,steroidal saponins in the FE were the major identified compounds with a content around 30%, whereastriterpenoid saponins in the QE accounted for around 8% of the extract (Table 1). For more detailedinformation about the chemical structure of these saponins, we recommend our previous study inwhich most of the saponins contained and characterized in these extracts were tentatively identifiedfor the first time in similar extracts by HPLC-MS-DAD [22].
Table 1. Saponin and sapogenin content (g/100 g) of extracts from fenugreek (FE) and quinoa (QE) andtheir hydrolyzed extracts (HFE and HQE) *.
Rt (Min) Compound FE HFE
SAPONINS 31.13 2.0112.78 Fenugreek saponin I 6.63 n.d.12.87 Fenugreek saponin II 10.66 n.d.13.09 Fenugreek saponin III 6.02 0.6414.17 Fenugreek saponin IV 5.02 1.0514.75 Fenugreek saponin V 2.80 0.33
SAPOGENINS 8.1420.80 3,5-Spirostadiene derivative n.d. 0.4320.90 3,5-Spirostadiene derivative n.d. 0.1321.66 Smilagenin n.d. 0.2421.79 Sarsasapogenin n.d. 0.6422.24 Diosgenin n.d. 2.5722.34 Tigogenin n.d. 0.6022.39 Yamogenin n.d. 1.2322.48 Neotigogenin n.d. 0.6423.52 Yuccagenin n.d. 0.0323.70 Gitogenin n.d. 1.2123.88 Neogitogenin n.d. 0.42
QE HQE
SAPONINS 7.86 2.0013.44 Quinoa saponin I 1.29 0.2313.75 Quinoa saponin II 3.74 1.3914.38 Quinoa saponin III 2.82 0.38
SAPOGENINS 5.6324.25 Oleanolic acid n.d. 1.5525.24 Hederagenin n.d. 0.8227.01 Serjanic acid n.d. 1.8328.47 Phytolaccagenic acid n.d. 1.44
n.d. = not detected, * The saponin content refers to the amount of saponins in a single extract derived from themixture of at least five replicate extractions. The sapogenin content refers to the amount in a single extract derivedfrom the mixture of at least three replicate hydrolysis.
After the acid hydrolysis of the extracts, a similar residual content of saponins was found in bothHFE and HQE (being around 2%), which might be due to the time of reaction not being enough for thecomplete release of aglycones from the sugar moieties (Table 1). However, it should be consideredthat the optimal time of hydrolysis in which the maximum amount of sapogenins is guaranteed forthese extracts was 1 hour, since longer times of hydrolysis caused a reduction in the sapogenin contentdue to a degradation of aglycones simultaneously with their release, as we already demonstrated [22].Further studies assessing the use of less aggressive and more environmentally friendly acids thatguarantee the complete hydrolysis of saponins without causing a negative impact on the final sapogenincontent might be of interest.

Foods 2020, 9, 1159 8 of 24
Concerning sapogenins, the deglycosylation of saponins led to a HFE with a sapogenin content ofaround 8% (Table 1). Among the identified steroidal sapogenins, diosgenin was the major aglycone(close to 3%), followed by its epimer yamogenin and gitogenin. Sarsasapogenin, tigogenin and its 25Sisomer neotigogenin were found in very similar concentrations each. The aglycones neogitogenin,smilagenin and yuccagenin were the least concentrated ones. Two spirostadienes were also identifiedand they accounted for only around 5% of the total sapogenin profile of the HFE. These last compoundsare artefacts generated by dehydration reactions of diosgenin and yamogenin in presence of hydrochloricacid [29].
The sapogenin content of the HQE was close to 5% (Table 1). The main four identifiedaglycones, in decreasing order of content, were serjanic acid, oleanolic acid, phytolaccagenic acid andhederagenin. This same sapogenin profile has been recently described for a large number of quinoavarieties, the sapogenin content widely varying between samples [30]. In addition, the presence ofphytolaccagenic acid may be an indicator of bitter quinoa cultivars, as it has been suggested that sweetvarieties have no detectable amounts of this aglycone [31].
Therefore, fenugreek seeds seem to be more interesting than quinoa seeds from the point of viewof a higher enrichment in saponins after extraction and sapogenins after the hydrolysis of such extracts.Nevertheless, the hydrolyzed extracts from fenugreek and quinoa would be of interest as rich sourcesof different types of sapogenins, namely steroid and triterpenoid sapogenins, whose bioactive interestmight also be different. Further studies considering a higher number of replicates of extracts would beof interest in order to confirm these evidences.
Foods 2020, 9, x FOR PEER REVIEW 8 of 24
varieties, the sapogenin content widely varying between samples [30]. In addition, the presence of
phytolaccagenic acid may be an indicator of bitter quinoa cultivars, as it has been suggested that
sweet varieties have no detectable amounts of this aglycone [31].
Therefore, fenugreek seeds seem to be more interesting than quinoa seeds from the point of view
of a higher enrichment in saponins after extraction and sapogenins after the hydrolysis of such
extracts. Nevertheless, the hydrolyzed extracts from fenugreek and quinoa would be of interest as
rich sources of different types of sapogenins, namely steroid and triterpenoid sapogenins, whose
bioactive interest might also be different. Further studies considering a higher number of replicates
of extracts would be of interest in order to confirm these evidences.
3.3. Characterization of Other Compounds in the Extracts
A general and preliminary characterization of the four different extracts from fenugreek and quinoa
was performed by GC-MS previous formation of trimethylsilyl derivatives of all those less volatile
compounds containing carboxyl or hydroxyl functional groups. This method allowed to tentatively
identify up to 27 compounds in the FE, 33 compounds in the HFE, 80 compounds in the QE and 66
compounds in the HQE different to saponins and sapogenins (Tables 2 and 3). Compounds were
categorized into 12 (for fenugreek) or 13 (for quinoa) sub-groups depending on their principal chemical
family, being mainly lipids (fatty acids and glycerides), nitrogen compounds (amino acids and derivatives
and non-protein nitrogen compounds), phenolic compounds, organic compounds, carbohydrates and
derivatives (sugars and sugar alcohols), tocols, physterols, other organic acids and alkylresorcinols (only
in quinoa). In addition to Tables 2 and 3, in order to enhance the comparison between the non-hydrolyzed
and the hydrolyzed extracts of each seed, and to show a general illustration of the complex composition
of the extracts, the total content of each major chemical group, including saponins and sapogenins, from
fenugreek and quinoa is shown in Figure 1A,B, respectively.
0
10
20
30
40
50
60
FE HFE
Co
nte
nt
(%)
Phenolics
Sapogenins
Saponins
Phytosterols
Tocols
Carbohydrates
Amino acids
Glycerides
Fatty acids
A
Figure 1. Cont.

Foods 2020, 9, 1159 9 of 24Foods 2020, 9, x FOR PEER REVIEW 9 of 24
Figure 1. Concentration (%) of each characterized family of compounds from (A) non-hydrolyzed
(FE) and hydrolyzed extracts (HFE) from fenugreek; and (B) non-hydrolyzed (QE) and hydrolyzed
(HQE) extracts from quinoa.
3.3.1. Fenugreek Extracts
First, regarding the total amount of quantitated compounds in each of the extracts, around 50%
of the FE was tentatively characterized and quantitated, while in the case of the HFE, such value
slightly increased up to a 54%.
While in the FE the majority of the extract corresponded to saponins (around 30%), nearly 35%
of the HFE corresponded to FFA (Figure 1A), whereas FFA accounted for only 2% in the FE before
hydrolysis. This relevant increase in FFA would be mainly due to their release from residual lipids
of the extracts during the acid hydrolysis. In this sense, the total initial triacylglycerides (TAG)
content for FE was close to 6%, as already reported [27], being also included in Figure 1A under
glycerides. Among the FFA, linoleic and oleic acids were the most abundant ones in both extracts
(Table 2). Other FFA in the HFE were the palmitic and stearic acids. Other interesting health-related
FFA found in the HFE were α-linolenic and azelaic acids.
The hydrolysis of lipids from the extracts after acid reaction to yield FFA could also explain the
presence of partial glycerides, as DAG and MAG in case of the HFE (Table 2). The DAG accounted
for the majority of partial glycerides (6%), while the most abundant MAG was 1-monoolein. Partial
glycerides have widely proven their beneficial effects as emulsifiers and absorption enhancers, very
important aspects to be considered for the subsequent intestinal absorption of lipophilic bioactive
compounds such as sapogenins in the case of sapogenin-rich extracts [32].
Therefore, considering these results, it is important to remark that the hydrolysis process of
saponin-rich extracts from fenugreek and the subsequent purification to extract sapogenins to
produce a sapogenin-rich extract, seems to lead to a final extract especially rich in lipids under the
form of FFA and partial glycerides. This might be explained by the hydrolysis of residual lipids and
the later purification process of sapogenins with ethyl acetate, causing a selective extraction of non-
polar compounds of the hydrolysed saponin-rich extract.
This purification process by ethyl acetate might also explain why other macronutrients such as amino
acids and sugars were only found in the FE (Table 2 and Figure 1A), as the extraction with the organic
0
10
20
30
40
50
60
70
80
90
100
QE HQE
Co
nte
nt
(%)
Other organic compounds
Phenolics
Sapogenins
Saponins
Phytosterols
Alkylresorcinols
Tocols
Carbohydrates
Amino acids
Glycerides
Fatty acids
B
Figure 1. Concentration (%) of each characterized family of compounds from (A) non-hydrolyzed (FE)and hydrolyzed extracts (HFE) from fenugreek; and (B) non-hydrolyzed (QE) and hydrolyzed (HQE)extracts from quinoa.
3.3. Characterization of Other Compounds in the Extracts
A general and preliminary characterization of the four different extracts from fenugreek andquinoa was performed by GC-MS previous formation of trimethylsilyl derivatives of all those lessvolatile compounds containing carboxyl or hydroxyl functional groups. This method allowed totentatively identify up to 27 compounds in the FE, 33 compounds in the HFE, 80 compounds in the QEand 66 compounds in the HQE different to saponins and sapogenins (Tables 2 and 3). Compounds werecategorized into 12 (for fenugreek) or 13 (for quinoa) sub-groups depending on their principalchemical family, being mainly lipids (fatty acids and glycerides), nitrogen compounds (amino acidsand derivatives and non-protein nitrogen compounds), phenolic compounds, organic compounds,carbohydrates and derivatives (sugars and sugar alcohols), tocols, physterols, other organic acids andalkylresorcinols (only in quinoa). In addition to Tables 2 and 3, in order to enhance the comparisonbetween the non-hydrolyzed and the hydrolyzed extracts of each seed, and to show a general illustrationof the complex composition of the extracts, the total content of each major chemical group, includingsaponins and sapogenins, from fenugreek and quinoa is shown in Figure 1A,B, respectively.
3.3.1. Fenugreek Extracts
First, regarding the total amount of quantitated compounds in each of the extracts, around 50% ofthe FE was tentatively characterized and quantitated, while in the case of the HFE, such value slightlyincreased up to a 54%.
While in the FE the majority of the extract corresponded to saponins (around 30%), nearly 35%of the HFE corresponded to FFA (Figure 1A), whereas FFA accounted for only 2% in the FE beforehydrolysis. This relevant increase in FFA would be mainly due to their release from residual lipids ofthe extracts during the acid hydrolysis. In this sense, the total initial triacylglycerides (TAG) contentfor FE was close to 6%, as already reported [27], being also included in Figure 1A under glycerides.Among the FFA, linoleic and oleic acids were the most abundant ones in both extracts (Table 2).Other FFA in the HFE were the palmitic and stearic acids. Other interesting health-related FFA foundin the HFE were α-linolenic and azelaic acids.

Foods 2020, 9, 1159 10 of 24
The hydrolysis of lipids from the extracts after acid reaction to yield FFA could also explain thepresence of partial glycerides, as DAG and MAG in case of the HFE (Table 2). The DAG accounted for themajority of partial glycerides (6%), while the most abundant MAG was 1-monoolein. Partial glycerideshave widely proven their beneficial effects as emulsifiers and absorption enhancers, very importantaspects to be considered for the subsequent intestinal absorption of lipophilic bioactive compoundssuch as sapogenins in the case of sapogenin-rich extracts [32].
Therefore, considering these results, it is important to remark that the hydrolysis process ofsaponin-rich extracts from fenugreek and the subsequent purification to extract sapogenins to producea sapogenin-rich extract, seems to lead to a final extract especially rich in lipids under the form ofFFA and partial glycerides. This might be explained by the hydrolysis of residual lipids and thelater purification process of sapogenins with ethyl acetate, causing a selective extraction of non-polarcompounds of the hydrolysed saponin-rich extract.
This purification process by ethyl acetate might also explain why other macronutrients such asamino acids and sugars were only found in the FE (Table 2 and Figure 1A), as the extraction with theorganic solvent after the acid hydrolysis caused the more polar compounds to remain in the aqueousphase of the reaction medium. Concerning these more polar compounds of the FE, the major identifiedamino acid was glutamic acid (nearly 5%) and three other structurally similar derivatives, followed byphenylalanine, l-tyrosine and l-valine (Table 2). This amino acid profile in the FE is in accordance withprevious determinations of the amino acid composition of fenugreek seeds, especially consideringthe high abundance of glutamic acid [33]. On the other hand, the major detected carbohydrateswere sugar alcohols (close to 2%), followed by sucrose and other disaccharides. Despite most ofthese carbohydrates could not be clearly identified by the used analytical procedure, very recently,Lahuta et al. [34] found that the most abundant sugar alcohols in fenugreek seeds were d-pinitol andα-d-galactosides of d-pinitol, as well as galactosides of myo-inositol.
Regarding the presence of bioactive compounds other than saponins and sapogenins, the acidhydrolysis of the FE caused interesting differences between both extracts. The concentration of identifiedphytosterols increased by more than two folds in the HFE with respect to the FE and a similar result wasobserved for the concentration of α-tocopherol (Table 2). In addition, β-hydroxy-β-methylglutaric acid,or meglutol, known for its hypolipidemic properties and commonly found as a complexed compoundin lignans from flaxseeds [35,36], was only detected in the HFE (Table 2). Its presence in fenugreek hasnot been described before, however, considering that this compound may be conjugated with phenoliccompounds [37], its appearance in the HFE could be due to its release after the hydrolysis.
Table 2. GC-MS Characterization of Extracts from Fenugreek (Trigonella foenum-graecum L.) *.
Rt (Min) Compound FE HFE
LIPIDS Area g/100 g Area g/100 gFatty acids 2.30 35.21
12.69 Fatty acid n.i. n.d. n.d. 327,178 0.1313.76 Azelaic acid n.d. n.d. 976,973 n.q.14.09 Tetradecanoic acid n.d. n.d. 335,623 0.1414.74 n-Pentadecanoic acid n.d. n.d. 643,202 0.1815.43 Palmitic acid 2,556,971 0.47 42,547,201 6.5015.84 cis-10-Heptadecenoic acid n.d. n.d. 873,397 0.2215.97 Heptadecanoic acid n.d. n.d. 1,616,500 0.3316.49 Linoleic acid + oleic acid 8,443,651 1.44 165,223,256 25.0016.60 Stearic acid 1,976,029 0.38 10,112,280 1.6117.41 α-Linolenic acid n.d. n.d. 1,386,960 0.2917.50 Fatty acid n.i. n.d. n.d. 578,427 0.1717.63 Arachidic acid n.d. n.d. 780,182 0.2018.64 Docosanoic acid n.d. n.d. 498,225 0.1619.11 Fatty acid n.i. n.d. n.d. 414,082 0.1519.57 Tetracosanoic acid n.d. n.d. 244,503 0.12

Foods 2020, 9, 1159 11 of 24
Table 2. Cont.
Rt (Min) Compound FE HFE
Glycerides 0.38 7.0818.26 2-Monopalmitin n.d. n.d. 312,684 0.0918.43 1-Monopalmitin 660,615 0.22 749,955 0.2519.08 2-Monoolein n.d. n.d. 519,155 0.1719.25 1-Monoolein n.d. n.d. 1,333,086 0.4519.35 2-Monostearin 493,752 0.16 236,519 0.0631.22 Diglyceride n.i. n.d. n.d. 326,190 1.3232.15 Diglyceride n.i. n.d. n.d. 495,677 1.7935.98 Diglyceride n.i. n.d. n.d. 305,674 1.2737.32 Diglyceride n.i. n.d. n.d. 453,921 1.67
NITROGEN COMPOUNDSAmino acids and derivatives 5.96
9.08 l-Valine 74,446 0.02 n.d. n.d.11.59 Glutamic acid derivative n.i. 1,157,128 0.27 n.d. n.d.11.67 Glutamic acid 21,256,096 4.97 n.d. n.d.11.77 Glutamic acid derivative n.i. 1,508,906 0.35 n.d. n.d.11.83 Glutamic acid derivative n.i. 705,448 0.17 n.d. n.d.12.58 Phenylalanine 485,697 0.11 n.d. n.d.14.78 l-Tyrosine 283,205 0.07 n.d. n.d.
Nitrogen compounds, non-protein18.75 Adenosine 252,644 n.q. n.d. n.d.
PHENOLIC COMPOUNDS12.56 4-Hydroxybenzoic acid n.d. n.d. 320,566 0.0312.56 Phenolic compound n.i. 599,743 0.05 n.d. n.d.
ORGANIC ACIDS8.27 Levulinic acid n.d. n.d. 1,064,940 n.q.
12.40 β-Hydroxy-β-methylglutaric acid n.d. n.d. 288,134 n.q.CARBOHYDRATES AND DERIVATIVES
Sugars 1.7316.55 Monosaccharide n.i. 2,779,858 0.09 n.d. n.d.18.93 Sucrose 5,189,844 1.09 n.d. n.d.19.30 Disaccharide n.i. 1,134,911 0.24 n.d. n.d.19.53 Disaccharide n.i. 1,129,958 0.24 n.d. n.d.19.90 Disaccharide n.i. 199,114 0.04 n.d. n.d.21.24 Disaccharide n.i. 88,523 0.03 n.d. n.d.
Sugar alcohols 1.7014.18 Sugar alcohol n.i. 2,851,411 1.55 n.d. n.d.15.85 Sugar alcohol n.i. 279,870 0.15 n.d. n.d.
TOCOLS21.07 α-Tocopherol 122,692 0.10 330,911 0.26
PHYTOSTEROLS 0.82 1.8621.81 Campesterol 152,569 0.12 332,792 0.2622.38 β-Sitosterol 673,182 0.49 2,230,012 1.3122.85 Cycloartenol 262,446 0.21 382,728 0.29
OTHER ORGANIC COMPOUNDS9.96 5-(Hydroxymethyl)furfural n.d. n.d. 794,089 n.q.
NON-IDENTIFIED COMPOUNDS9.53 n.i. n.d. n.d. 272,457 n.d.9.96 n.i. 379,413 n.d. n.d. n.d.
10.07 n.i. 640,401 n.d. n.d. n.d.15.64 n.i. 679,227 n.d. n.d. n.d.15.93 n.i. 613,602 n.d. n.d. n.d.16.95 n.i. 1,047,810 n.d. n.d. n.d.
n.q. = not quantitated; n.i. = not identified; n.d. = not detected. * The content of each compound refers to theiramount in a single extract derived from the mixture of at least five replicate extractions (FE) or three replicatehydrolysis (HFE).
Only two phenolic compounds were detected by GC in the fenugreek extracts. While 4-hydroxybenzoicacid was found only in the HFE, a non-identified phenolic compound was detected in the FE at a similarconcentration (Table 2). Phenolic compounds from fenugreek have been described to be acylated andnon-acylated flavonoids with apigenin, luteolin and kaempferol as aglycons [38]. The high molecularweight of these compounds do not make GC the most suitable tool for their analysis, hence furtherstudies about the phenolic composition of the extracts by other analytical techniques might be worthto be performed.
Finally, it was also detected the presence of 5-(hydroxymethyl)furfural (HMF) only in the HFE,a compound which likely resulted from the Maillard and caramelization reactions during the acidhydrolysis of the saponin-rich extracts, probably due to the amino acid and carbohydrate content.
Foods 2020, 9, 1159 12 of 24
Even though the toxicity of HMF has been generally assumed and its daily intake has been wellestablished, controversial conclusions on the biological effects of this furanic compound have beendrawn, as its antioxidant, antiproliferative and antiischemic activities have been confirmed [39].
Therefore, as summary, and considering the sum of all the remarked bioactive compounds ofthe extracts different to saponins and sapogenins (tocopherol, phytosterol and phenolic compounds),this general and preliminary characterization shows that the hydrolysis process of FE seems to leadto a relevant enrichment of these compounds, varying from around 1% of the FE to around 2% forthe HFE, in addition to the 8% sapogenin content. However, it would be necessary to carry out moreanalysis of a greater number of replicates of extracts to confirm these evidences.
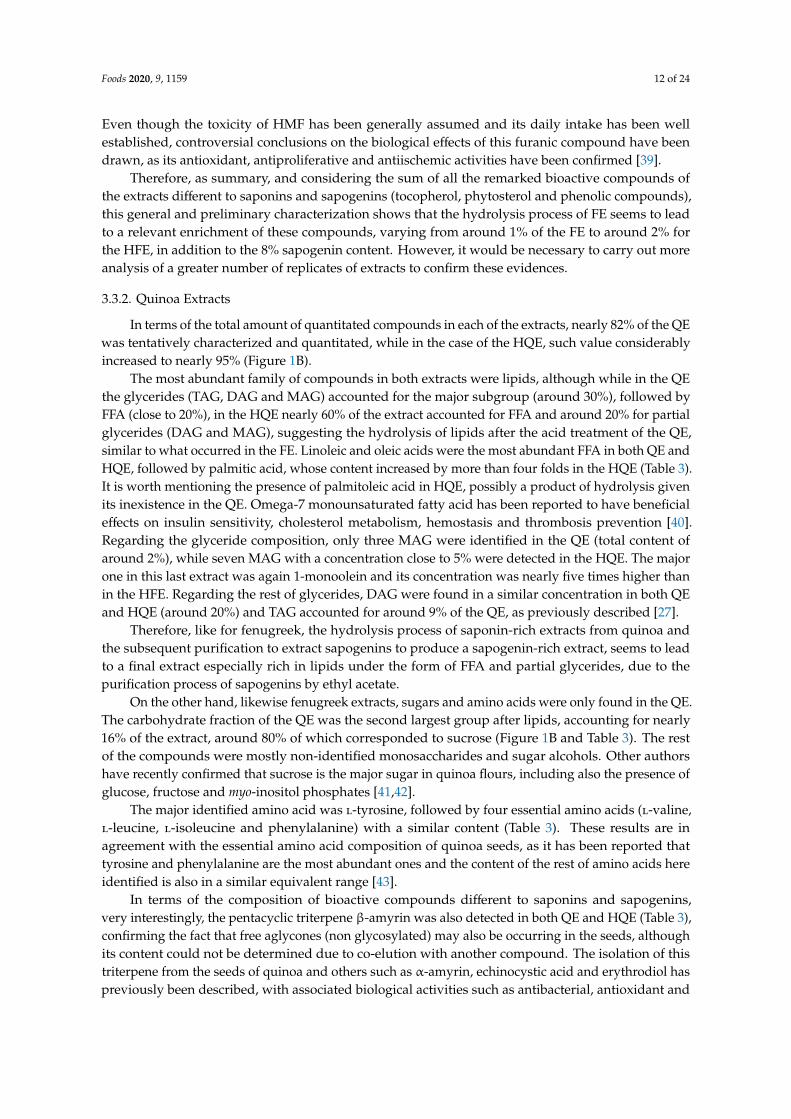
3.3.2. Quinoa Extracts
In terms of the total amount of quantitated compounds in each of the extracts, nearly 82% of the QEwas tentatively characterized and quantitated, while in the case of the HQE, such value considerablyincreased to nearly 95% (Figure 1B).
The most abundant family of compounds in both extracts were lipids, although while in the QEthe glycerides (TAG, DAG and MAG) accounted for the major subgroup (around 30%), followed byFFA (close to 20%), in the HQE nearly 60% of the extract accounted for FFA and around 20% for partialglycerides (DAG and MAG), suggesting the hydrolysis of lipids after the acid treatment of the QE,similar to what occurred in the FE. Linoleic and oleic acids were the most abundant FFA in both QE andHQE, followed by palmitic acid, whose content increased by more than four folds in the HQE (Table 3).It is worth mentioning the presence of palmitoleic acid in HQE, possibly a product of hydrolysis givenits inexistence in the QE. Omega-7 monounsaturated fatty acid has been reported to have beneficialeffects on insulin sensitivity, cholesterol metabolism, hemostasis and thrombosis prevention [40].Regarding the glyceride composition, only three MAG were identified in the QE (total content ofaround 2%), while seven MAG with a concentration close to 5% were detected in the HQE. The majorone in this last extract was again 1-monoolein and its concentration was nearly five times higher thanin the HFE. Regarding the rest of glycerides, DAG were found in a similar concentration in both QEand HQE (around 20%) and TAG accounted for around 9% of the QE, as previously described [27].
Therefore, like for fenugreek, the hydrolysis process of saponin-rich extracts from quinoa andthe subsequent purification to extract sapogenins to produce a sapogenin-rich extract, seems to leadto a final extract especially rich in lipids under the form of FFA and partial glycerides, due to thepurification process of sapogenins by ethyl acetate.
On the other hand, likewise fenugreek extracts, sugars and amino acids were only found in the QE.The carbohydrate fraction of the QE was the second largest group after lipids, accounting for nearly16% of the extract, around 80% of which corresponded to sucrose (Figure 1B and Table 3). The restof the compounds were mostly non-identified monosaccharides and sugar alcohols. Other authorshave recently confirmed that sucrose is the major sugar in quinoa flours, including also the presence ofglucose, fructose and myo-inositol phosphates [41,42].
The major identified amino acid was l-tyrosine, followed by four essential amino acids (l-valine,l-leucine, l-isoleucine and phenylalanine) with a similar content (Table 3). These results are inagreement with the essential amino acid composition of quinoa seeds, as it has been reported thattyrosine and phenylalanine are the most abundant ones and the content of the rest of amino acids hereidentified is also in a similar equivalent range [43].
In terms of the composition of bioactive compounds different to saponins and sapogenins,very interestingly, the pentacyclic triterpene β-amyrin was also detected in both QE and HQE (Table 3),confirming the fact that free aglycones (non glycosylated) may also be occurring in the seeds, althoughits content could not be determined due to co-elution with another compound. The isolation of thistriterpene from the seeds of quinoa and others such as α-amyrin, echinocystic acid and erythrodiol haspreviously been described, with associated biological activities such as antibacterial, antioxidant and

Foods 2020, 9, 1159 13 of 24
antiproliferative [44]. Regarding the presence of other bioactive compounds, three phytosterols witha total content lower than 2% were identified in the QE (Table 3).
Table 3. GC-MS Characterization of Extracts from Quinoa (Chenopodium quinoa Willd.) *.
Rt (Min) Compound QE HQE
LIPIDS Area g/100 g Area g/100 gFatty acids 18.67 57.37
10.81 Fatty acid n.i. 450,537 0.15 105,632 0.1013.74 Azelaic acid 295,429 n.q. 624,302 n.q.14.09 Tetradecanoic acid n.d. n.d. 967,829 0.2314.60 Palmitic acid, methyl ester n.d. n.d. 564,801 0.1714.74 n-Pentadecanoic acid n.d. n.d. 436,759 0.1515.24 Palmitoleic acid n.d. n.d. 1,594,816 0.3315.40 Palmitic acid 21,585,329 2.57 63,448,504 9.6515.67 Linoleic acid methyl ester 709,965 0.19 1,460,352 0.3115.79 Heptadecanoic acid 645,089 0.18 n.d. n.d.16.46 Linoleic acid + Oleic acid 112,939,760 13.82 292,989,296 44.2616.57 Stearic acid 2,598,181 0.48 5,188,940 0.8716.80 cis-10-Nonadecenoic acid 573,992 0.17 1,192,260 0.2716.95 Nonadecanoic acid 717,759 0.19 n.d. n.d.17.11 Branched chain fatty acid n.i. 558,659 0.17 n.d. n.d.17.49 Fatty acid n.i. 1,977,879 0.38 2,625,371 0.4817.62 Eicosanoic acid 388,780 0.14 664,297 0.1918.52 cis-13-Docosenoic acid 834,878 0.21 1,910,933 0.37
Glycerides 23.39 23.1518.26 2-Monopalmitin n.d. n.d. 1,026,164 0.3518.43 1-Monopalmitin 2,554,881 0.85 2,241,608 0.7518.64 Monoglyceride n.i. n.d. n.d. 2,122,285 0.7119.08 2-Monoolein n.d. n.d. 1,797,832 0.6119.26 1-Monoolein n.d. n.d. 5,789,486 1.8119.25 Monoglyceride n.i. 2,419,864 0.81 625,561 0.2119.36 2-Monostearin 1,504,555 0.51 885,292 0.3031.22 Diglyceride n.i. 1,711,567 5.09 892,885 2.8732.15 Diglyceride n.i. 1,210,341 3.73 1,589,691 4.7635.98 Diglyceride n.i. 1,895,510 5.59 1,322,477 4.0337.33 Diglyceride n.i. 2,338,224 6.80 2,321,607 6.75
NITROGEN COMPOUNDSAmino acids and derivatives 1.07
9.09 l-Valine 520,768 0.12 n.d. n.d.9.65 l-Leucine 593,774 0.14 n.d. n.d.9.82 l-Isoleucine 573,058 0.13 n.d. n.d.9.84 l-Proline 310,659 0.07 n.d. n.d.
12.58 Phenylalanine 755,735 0.18 n.d. n.d.14.79 l-Tyrosine 1,841,249 0.43 n.d. n.d.
Nitrogen compounds, non-protein18.76 Adenosine 859,568 n.q n.d. n.d.19.03 Nucleoside n.i. 2,105,901 n.q n.d. n.d.
PHENOLIC COMPOUNDS 0.49 1.2011.91 Phenolic compound n.i. 301,007 0.03 352,057 0.0312.50 3-Hydroxybenzoic acid 277,150 0.02 228,709 0.0212.55 4-Hydroxybenzoic acid 316,918 0.03 742,472 0.0613.56 Vanillic acid 658,070 0.06 2,287,118 0.1913.97 Protocatechuic acid 1,574,802 0.13 1,100,106 0.0915.70 Isoferulic acid 770,448 0.07 1,178,230 0.1015.82 Phenolic compound n.i. n.d. n.d. 4,209,075 0.3621.39 Quercetin 529,905 0.16 1,889,147 0.35
ORGANIC ACIDS8.31 Levulinic acid n.d. n.d. 6,678,331 n.q.
CARBOHYDRATES AND DERIVATIVESSugars 15.04
13.50 Monosaccharide n.i. 334,468 0.05 n.d. n.d.14.02 Monosaccharide n.i. 800,569 0.11 n.d. n.d.14.08 Monosaccharide n.i. 869,500 0.12 n.d. n.d.14.57 Monosaccharide n.i. 1,341,584 0.18 n.d. n.d.15.13 Monosaccharide n.i. 1,725,857 0.23 n.d. n.d.17.32 Monosaccharide n.i. 621,039 0.08 n.d. n.d.18.16 Monosaccharide n.i. 608,507 0.08 n.d. n.d.18.91 Disaccharide n.i. 761,289 1.67 n.d. n.d.18.99 Sucrose 70,842,522 12.52 n.d. n.d.

Foods 2020, 9, 1159 14 of 24
Table 3. Cont.
Rt (Min) Compound QE HQE
Sugar alcohols 0.8813.37 Sugar alcohol n.i. 219,799 0.12 n.d. n.d.13.41 Sugar alcohol n.i. 310,261 0.17 n.d. n.d.14.89 Sugar alcohol n.i. 1,089,958 0.59 n.d. n.d.
TOCOLS20.38 β-Tocopherol 710,062 0.51 987,442 0.68
21.09 α-Tocopherol + Branched chainalkylresorcinol C20:0 504,040 n.q. 494,045 n.q.
ALKYLRESORCINOLS 1 1.79 1.0420.57 Branched chain alkylresorcinol C19:0 301,095 0.10 131,551 0.0420.73 Alkylresorcinol C19:0 157,677 0.05 91,436 0.0320.86 Methyl alkylresorcinol C19:0 a 162,491 0.05 174,353 0.0621.04 Methyl alkylresorcinol C19:0 b 89,956 0.03 105,698 0.0321.22 Alkylresorcinol C20:0 63,163 0.02 66,606 0.0221.44 Methyl alkylresorcinol C20:0 465,052 0.15 713,693 n.q.21.56 Branched chain alkylresorcinol C21:0 632,613 0.21 341,593 0.1121.66 Alkenylresorcinol C21:1 345,020 0.11 199,108 0.0721.77 Alkylresorcinol C21:0 404,519 0.13 198,851 0.0721.94 Methyl alkylresorcinol C21:0 a 363,033 0.12 355,126 0.1222.05 Methyl alkenylresorcinol C21:1 89,517 0.03 84,248 0.0322.10 Alkenylresorcinol C22:1 44,641 0.01 n.d. n.d.22.18 Methyl alkylresorcinol C21:0 b 135,872 0.04 198,437 0.0722.24 Branched chain alkylresorcinol C22:0 588,653 0.19 376,310 0.1222.53 Methyl alkenylresorcinol C22:1 + β-Amyrin 111,487 n.q. 157,275 n.q.22.69 Methyl alkylresorcinol C22:0 372,702 0.12 327,208 0.1122.84 Branched chain alkylresorcinol C23:0 a 294,763 0.10 n.d. n.d.22.99 Alkenylresorcinol C23:1 115,112 0.04 48,642 0.0223.38 Methyl alkylresorcinol C23:0 a 185,482 0.06 165,900 0.0523.77 Branched chain alkylresorcinol C24:0 238,231 0.08 93,178 0.0324.41 Methyl alkylresorcinol C24:0 145,075 0.05 105,472 0.0324.60 Branched chain alkylresorcinol C25:0 149,488 0.05 44,779 0.0125.35 Methyl alkylresorcinol C25:0 41,486 0.01 34,293 0.0125.89 Branched chain alkylresorcinol C26:0 43,240 0.01 n.d. n.d.
PHYTOSTEROLS 1.47 2.3521.82 Campesterol n.d. n.d. 93,024 0.0821.99 Stigmasterol 129,590 0.10 270,847 0.2122.39 β-Sitosterol 847,328 0.60 1,629,923 1.0222.81 ∆7-Stigmastenol 1,143,706 0.77 1,663,885 1.04
OTHER ORGANIC COMPOUNDS9.96 5-(Hydroxymethyl)furfural n.d. n.d. 4,142,040 n.q.
19.56 Squalene 2,151,321 0.97 3,244,348 1.40NON-IDENTIFIED COMPOUNDS
10.68 n.i. n.d. n.d. 145,243 n.q.11.87 n.i. 530,418 n.q. n.d. n.d.13.11 n.i. 199,292 n.q. n.d. n.d.13.61 n.i. 387,038 n.q. n.d. n.d.14.53 n.i. 5,992,880 n.q. n.d. n.d.14.68 n.i. 4,571,935 n.q. n.d. n.d.16.57 n.i. 3,652,082 n.q. n.d. n.d.17.59 n.i. n.d. n.d. 731,295 n.q.
1 MARs with a methyl group at the n-2 carbon have been labelled with an “a” and those with a methyl group at then-3 carbon with a “b”. In bcARs, such categorization corresponds to a different position of a methyl group alongthe alkyl chain, as proposed by Ross et al. [45]. n.q. = not quantitated; n.i. = not identified; n.d. = not detected.* The content of each compound refers to their amount in a single extract derived from the mixture of at leastfive replicate extractions (QE) or three replicate hydrolysis (HQE).
In contrast to fenugreek, between seven and eight phenolic compounds were detected in bothQE and HQE, respectively (Table 3). The enrichment observed in the hydrolyzed extract was mainlydue to the concentration effect of vanillic acid and quercetin, and the appearance of a non-identifiedphenolic compound. All the phenolics detected have been previously confirmed to occur in quinoaseeds [46,47]. In any case, the analysis of QE and HQE by other analytical techniques might also be ofinterest in order to precisely determine the phenolic profile of the extracts.
Regarding the presence of other organic compounds, the HQE also contained HMF, although itshould be noted that, considering its chromatographic area, its presence in the HQE was more than5 times higher than in the HFE, possibly due to the considerably richer content in carbohydrates thatmay interact with aminoacids during the hydrolysis process. The unsaturated open-chain triterpene

Foods 2020, 9, 1159 15 of 24
squalene was also detected in both quinoa extracts, although its concentration in the HQE was nearly1.5 times higher than in the QE.
Lastly, 5-n alkylresorcinols (ARs), which are a very interesting and novel family oflong-chain phenolic lipids, were identified in both extracts (Table 3). Specifically, even and oddARs, methylalkylresorcinols (MARs) and branched-chain alkylresorcinols (bcARs) were detected.Their content in the HQE was lower than in the QE and the concentration of these compounds waslower than 1%. It is worth highlighting that, as far as we are concerned, the identification in quinoa ofunsaturated ARs has not been reported in the literature before, although Ross et al. [45] did identifyunsaturated MARs, together with an exhaustive characterization of other phenolic lipids. In our work,the novel identified unsaturated ARs were C21:1 (m/z 268, M+
· 546), C22:1 (m/z 268, M+· 560) and
C23:1 (m/z 268, M+· 574). The relevance of phenolic lipids lies in the fact that even-numbered ARs
seem to be exclusively found in this seed, hence being useful as biomarkers of quinoa intake [45].Despite their novelty, multiple bioactivities linked to ARs have been already described, such asantitumor, antibacterial, antioxidant and inhibition of relevant enzymes [48]. As a contribution of thecurrent study to the field of ARs, it is shown that saponin and sapogenin-rich extracts of quinoa mightbe interesting sources of ARs, but these compounds seem to be labile to the acid hydrolysis processes,taking into account the observed decrease in the sapogenin-rich extract.
Therefore, considering the sum of all the bioactive compounds of the extracts different to saponinsand sapogenins (tocopherol, phytosterols, phenolic compounds, squalene, and alkylresorcinols),this general and preliminary characterization shows that the hydrolysis process of QE seems to lead toa slight enrichment, varying from around 5% of the QE to around 7% for the HQE, in addition to thesapogenin content close to 6%. Compared to fenugreek, the diversity and amount of these bioactivecompounds was superior for quinoa, although it should be considered that nearly half of the fenugreekextracts remain uncharacterized. In any case, the total sum of bioactive compounds in the hydrolyzedextracts from both seeds, including sapogenins, was similar (10% for fenugreek and 12% for quinoa).Further studies considering a more exhaustive characterization, and assessing the relevance of thismodified composition in bioactive compounds after the acid treatment on different biological activitieswould be of interest. Additionally, given that a single quantitation of the extracts has been performedfrom a mixture of different extractions and hydrolysis, a larger number of replicates to be furtherquantitated should be considered in future works.
3.4. Bioaccessibility of Bioactive Compounds
3.4.1. Saponins
After the in vitro gastrointestinal digestion of FE and QE, the bioaccessibility of total saponinsfrom each extract was determined by HPLC-DAD, as shown in Figure 2. The saponins from bothFE and QE were completely bioaccessible, meaning that the entire saponin fraction was adequatelysolubilized and dispersed in the micellar phase and no precipitation of the compounds occurred.
In order to understand if the high bioaccessibilities observed were either a consequence of theamphiphilic nature of saponins or the dispersion-enhancer effect of other compounds contained inthe extracts, the gastrointestinal digestion of dioscin (DC), a commercial steroid saponin similar tothose found in fenugreek, was performed. Only a standard of steroid saponin was studied because thecommercial standard of triterpenoid saponins (hederacoside C) similar to those detected in quinoaco-eluted with digestion components. Interestingly, around 84% of DC was bioaccessible, but hada significantly lower bioaccessibility than saponins from FE (p < 0.001) and QE (p = 0.002), suggestingthat the superior bioaccessibility observed for saponins in the extracts may be achieved when containedin the extracts. This outcome of co-extracted enhancer compounds has been previously confirmed inethanolic and aqueous ethanolic extracts obtained from fenugreek, quinoa and other seeds, in whichthe bioaccessibility of saponins, spectrophotometrically determined, positively correlated with both thefat content and the saponin/fat ratio, but negatively correlated with the phenolic content [15]. In such

Foods 2020, 9, 1159 16 of 24
study, we evidenced that a ratio of saponins/fat superior to 1 caused a poor bioaccessibility (<40%),whereas those samples with a ratio lower than 1 showed bioaccessibilities >60%. In the current study,in the case of QE, its saponin/total fat content ratio was estimated to be around 0.15, which would be inagreement with an optimal value for the high bioaccessibility of saponins. However, in the case ofFE, the saponin/fat ratio was estimated to be >3 and, hence, a low bioaccessibility of saponins wouldbe expected. As this was not the outcome, its possible phenolic content, which has been suggestedas a bioaccessibility-limiting component, and the fact that such extract was obtained by a differentprocedure than our previous study [15], may be explaining the high bioaccessibility of saponins fromFE. In addition, as nearly 50% of the FE remains uncharacterized (Figure 1A), other compounds thathave not been identified yet may be enhancing the bioaccessibility of the saponins.
Foods 2020, 9, x FOR PEER REVIEW 16 of 24
3.4. Bioaccessibility of Bioactive Compounds
3.4.1. Saponins
After the in vitro gastrointestinal digestion of FE and QE, the bioaccessibility of total saponins
from each extract was determined by HPLC-DAD, as shown in Figure 2. The saponins from both FE
and QE were completely bioaccessible, meaning that the entire saponin fraction was adequately
solubilized and dispersed in the micellar phase and no precipitation of the compounds occurred.
Figure 2. Bioaccessibility (%) of the standard dioscin (DC), fenugreek saponins (FE) and quinoa
saponins (QE) after their in vitro gastrointestinal digestion. Mean values of FE and QE are
significantly different to DC if p ≤ 0.01 (**) or p ≤ 0.001 (***).
In order to understand if the high bioaccessibilities observed were either a consequence of the
amphiphilic nature of saponins or the dispersion-enhancer effect of other compounds contained in
the extracts, the gastrointestinal digestion of dioscin (DC), a commercial steroid saponin similar to
those found in fenugreek, was performed. Only a standard of steroid saponin was studied because
the commercial standard of triterpenoid saponins (hederacoside C) similar to those detected in
quinoa co-eluted with digestion components. Interestingly, around 84% of DC was bioaccessible, but
had a significantly lower bioaccessibility than saponins from FE (p < 0.001) and QE (p = 0.002),
suggesting that the superior bioaccessibility observed for saponins in the extracts may be achieved
when contained in the extracts. This outcome of co-extracted enhancer compounds has been
previously confirmed in ethanolic and aqueous ethanolic extracts obtained from fenugreek, quinoa
and other seeds, in which the bioaccessibility of saponins, spectrophotometrically determined,
positively correlated with both the fat content and the saponin/fat ratio, but negatively correlated
with the phenolic content [15]. In such study, we evidenced that a ratio of saponins/fat superior to 1
caused a poor bioaccessibility (<40%), whereas those samples with a ratio lower than 1 showed
bioaccessibilities >60%. In the current study, in the case of QE, its saponin/total fat content ratio was
estimated to be around 0.15, which would be in agreement with an optimal value for the high
bioaccessibility of saponins. However, in the case of FE, the saponin/fat ratio was estimated to be >3
and, hence, a low bioaccessibility of saponins would be expected. As this was not the outcome, its
possible phenolic content, which has been suggested as a bioaccessibility-limiting component, and
the fact that such extract was obtained by a different procedure than our previous study11, may be
explaining the high bioaccessibility of saponins from FE. In addition, as nearly 50% of the FE remains
uncharacterized (Figure 1A), other compounds that have not been identified yet may be enhancing
the bioaccessibility of the saponins.
In any case, the reported bioaccessibilities in this work are in agreement with other values
described in the scarce literature. Triterpenoid saponins from chickpea and soy contained in bread
0
20
40
60
80
100
120
DC FE QE
Bio
accessib
ilit
y o
f sap
on
ins (
%)
*****
Figure 2. Bioaccessibility (%) of the standard dioscin (DC), fenugreek saponins (FE) and quinoasaponins (QE) after their in vitro gastrointestinal digestion. Mean values of FE and QE are significantlydifferent to DC if p ≤ 0.01 (**) or p ≤ 0.001 (***).
In any case, the reported bioaccessibilities in this work are in agreement with other valuesdescribed in the scarce literature. Triterpenoid saponins from chickpea and soy contained in breadhave shown high bioaccessibilities (above 85%) after in vitro digestion [49]. In addition, the stability ofsaponins, but not the bioaccessibility, has been recently assessed with steroid saponins from asparagusand recoveries between 89 and 94% were achieved, although these values refer to the amount ofsaponins in the whole digestion medium and not in the micellar phase [50].
Therefore, the obtained evidences suggest that saponins contained in saponin-rich extracts fromfenugreek and quinoa seeds have a high bioaccessibility, which is likely favoured by the co-existenceof other compounds in the extracts. Nevertheless, further studies should be considered in which moredigestion replicates are performed, in order to confirm the bioaccessibility values observed for DC andsaponins from fenugreek and quinoa.
3.4.2. Sapogenins
The bioaccessibility of the sapogenins contained in HFE and HQE was assessed by GC-MS-FIDprevious trimethylsilylation of the compounds extracted from both the digestion medium and themicellar phase.
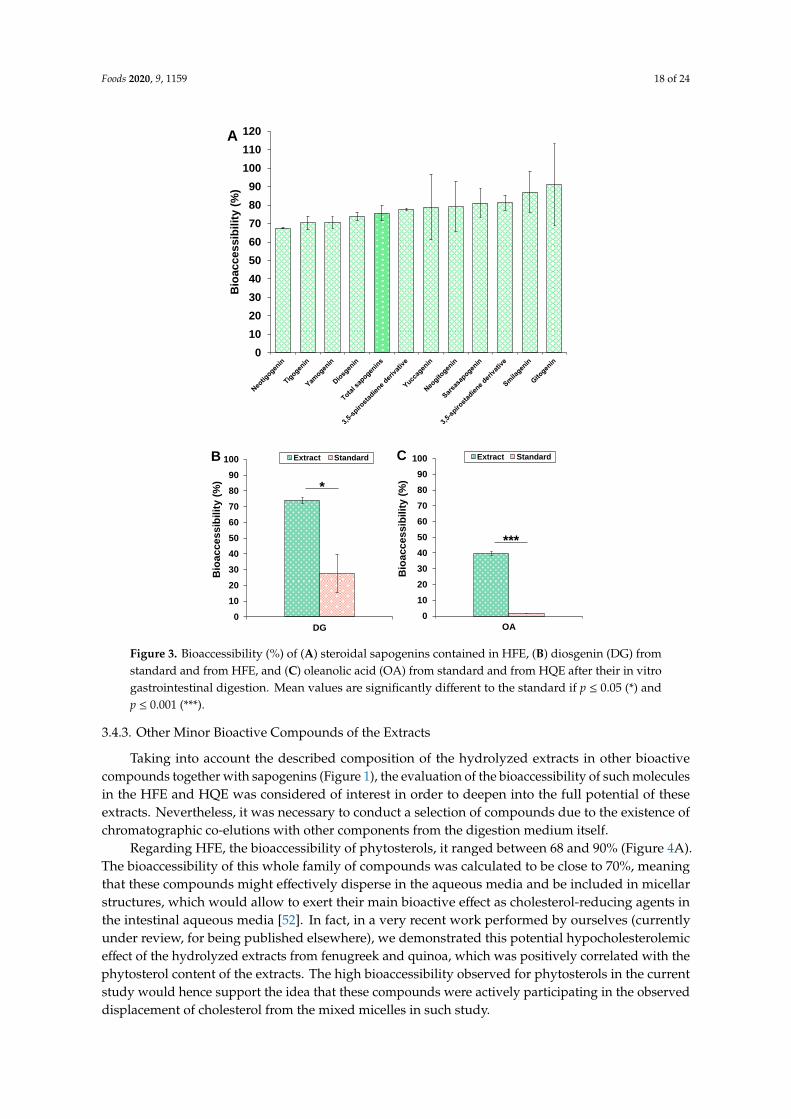
The bioaccessibilities of the eleven identified steroidal sapogenins in the HFE are shownin Figure 3A. In general terms, it can be observed that all sapogenins exhibited good bioaccessibilities,which were above 70%. Diosgenin, the most abundant sapogenin in the extract and the most studiedaglycone from fenugreek, presented a good bioaccessibility (around 74%), which was very similar to

Foods 2020, 9, 1159 17 of 24
that of its epimer yamogenin (close to 70%). Two aglycones, smilagenin and gitogenin, appeared tohave bioaccessibilities around 90%. Considering the sum of total sapogenins it was estimated that totalsteroidal sapogenins from fenugreek exhibited a bioaccessibility of 76%. Therefore, despite the factthat the bioaccessibility of sapogenins from HFE was high, such value was lower than that of saponins(Figure 2), being in agreement with the general idea about the better bioaccessibility of saponins respectto sapogenins.
As performed with saponins, the evaluation of the bioaccessibility of a commercial standard ofdiosgenin (DG) was assessed in order to understand to what extent would be these steroidal sapogeninsbioaccessible when digested alone (Figure 3B). Interestingly, it was found that the DG standardexhibited a low bioaccessibility (27%) when compared to this same compound contained in the HFE(p = 0.03), which confirmed the fact that other components of the extract were actively enhancingthe solubility and dispersion of DG and other steroidal aglycones in the digestion medium. In thissense, pentacyclic triterpenes from a Calendula officinalis extract also showed enhanced bioaccessibilitieswhen co-digested with olive oil, which was explained by an increase in the micellar surface due tolipid digestion products, as FFA and partial glycerides, compared to the absence of oil. This favouredthe formation of available micellar structures for inclusion of hydrophobic compounds present in theaqueous media [25]. The solubility-enhancement effects of lipid products have been also recentlyproposed as a mechanism that assures a high intestinal permeability of DG [27]. Therefore, in thecurrent study, the high lipid content of the HFE under the form of FFA and partial glycerides (Table 2and Figure 1A) might act as solubility-enhancer by increasing the micellar surface for hydrophobic DGto be included and dispersed in the aqueous media. To the best of our knowledge, this is the first workthat has assessed the bioaccessibility of diosgenin and other structurally similar steroidal sapogenins.
Regarding the bioaccessibility of the triterpenoid sapogenins in the HQE, only oleanolic acid(OA) was detected by the analytical tool employed, since the rest of sapogenins were not detectedneither in the micellar phase nor in the whole digestion media. The bioaccessibilities of OA afterdigestion of both its own standard and the HQE are shown in Figure 3C. Similar to what occurred toDG, significant differences were found for OA when digested alone or when contained in the extract(p < 0.001). While the standard exhibited an extremely poor bioaccessibility (lower than 2%), likelydue to its poor solubility, the compound contained in the HQE showed an intermediate bioaccessibilityclose to 40%.
Very recently, Zhao et al. [24] described that the bioaccessibility of OA contained in a methanolicextract from Crataegus pinnatifida was almost identical (38.4%) to the bioaccessible fraction of OA inthis work. Therefore, even though the bioaccessibility of OA in the present work was not as high as thevalues described for the sapogenins in the HFE, it is evidenced once again the bioaccessibility-enhancingproperties of the co-extracted components in the extract, probably lipid components, given that 80% ofthe HQE accounted for FFA, MAG and DAG. Hence, both results show the relevance of considering therole of co-extracted compounds in the improvement of the bioaccessibility of target bioactive moleculesfrom natural extracts, such as sapogenins. Additionally, these results also suggest the possible interestof assessing the effect of the co-digestion of this and similar extracts with oily “excipient foods”such as healthy or functional vegetable oils [25,51], considering that acceptable bioaccessibilities maybe achieved without the need of developing complex and costly formulations for the oral deliveryof lipophilic compounds, as sapogenins might be. Nevertheless, in order to confirm the differentbioaccessibility values observed for the different sapogenins detected, a larger amount of digestionreplicates should be performed in further works.
Foods 2020, 9, 1159 18 of 24Foods 2020, 9, x FOR PEER REVIEW 18 of 24
Figure 3. Bioaccessibility (%) of (A) steroidal sapogenins contained in HFE, (B) diosgenin (DG) from
standard and from HFE, and (C) oleanolic acid (OA) from standard and from HQE after their in vitro
gastrointestinal digestion. Mean values are significantly different to the standard if p ≤ 0.05 (*) and p
≤ 0.001 (***).
Very recently, Zhao et al. [24] described that the bioaccessibility of OA contained in a methanolic
extract from Crataegus pinnatifida was almost identical (38.4%) to the bioaccessible fraction of OA in this
work. Therefore, even though the bioaccessibility of OA in the present work was not as high as the values
described for the sapogenins in the HFE, it is evidenced once again the bioaccessibility-enhancing
properties of the co-extracted components in the extract, probably lipid components, given that 80% of
the HQE accounted for FFA, MAG and DAG. Hence, both results show the relevance of considering the
role of co-extracted compounds in the improvement of the bioaccessibility of target bioactive molecules
from natural extracts, such as sapogenins. Additionally, these results also suggest the possible interest of
assessing the effect of the co-digestion of this and similar extracts with oily “excipient foods” such as
healthy or functional vegetable oils [25,51], considering that acceptable bioaccessibilities may be achieved
0
10
20
30
40
50
60
70
80
90
100
110
120
Bio
accessib
ilit
y (
%)
A
0
10
20
30
40
50
60
70
80
90
100
OA
Bio
accessib
ilit
y (
%)
Extract Standard
***
C
0
10
20
30
40
50
60
70
80
90
100
DG
Bio
accessib
ilit
y (
%)
Extract Standard
*
B
Figure 3. Bioaccessibility (%) of (A) steroidal sapogenins contained in HFE, (B) diosgenin (DG) fromstandard and from HFE, and (C) oleanolic acid (OA) from standard and from HQE after their in vitrogastrointestinal digestion. Mean values are significantly different to the standard if p ≤ 0.05 (*) andp ≤ 0.001 (***).
3.4.3. Other Minor Bioactive Compounds of the Extracts
Taking into account the described composition of the hydrolyzed extracts in other bioactivecompounds together with sapogenins (Figure 1), the evaluation of the bioaccessibility of such moleculesin the HFE and HQE was considered of interest in order to deepen into the full potential of theseextracts. Nevertheless, it was necessary to conduct a selection of compounds due to the existence ofchromatographic co-elutions with other components from the digestion medium itself.
Regarding HFE, the bioaccessibility of phytosterols, it ranged between 68 and 90% (Figure 4A).The bioaccessibility of this whole family of compounds was calculated to be close to 70%, meaningthat these compounds might effectively disperse in the aqueous media and be included in micellarstructures, which would allow to exert their main bioactive effect as cholesterol-reducing agents inthe intestinal aqueous media [52]. In fact, in a very recent work performed by ourselves (currentlyunder review, for being published elsewhere), we demonstrated this potential hypocholesterolemiceffect of the hydrolyzed extracts from fenugreek and quinoa, which was positively correlated with thephytosterol content of the extracts. The high bioaccessibility observed for phytosterols in the currentstudy would hence support the idea that these compounds were actively participating in the observeddisplacement of cholesterol from the mixed micelles in such study.

Foods 2020, 9, 1159 19 of 24
Foods 2020, 9, x FOR PEER REVIEW 19 of 24
without the need of developing complex and costly formulations for the oral delivery of lipophilic
compounds, as sapogenins might be. Nevertheless, in order to confirm the different bioaccessibility values
observed for the different sapogenins detected, a larger amount of digestion replicates should be
performed in further works.
3.4.3. Other Minor Bioactive Compounds of the Extracts
Taking into account the described composition of the hydrolyzed extracts in other bioactive
compounds together with sapogenins (Figure 1), the evaluation of the bioaccessibility of such
molecules in the HFE and HQE was considered of interest in order to deepen into the full potential
of these extracts. Nevertheless, it was necessary to conduct a selection of compounds due to the
existence of chromatographic co-elutions with other components from the digestion medium itself.
Regarding HFE, the bioaccessibility of phytosterols, it ranged between 68 and 90% (Figure 4A).
The bioaccessibility of this whole family of compounds was calculated to be close to 70%, meaning
that these compounds might effectively disperse in the aqueous media and be included in micellar
structures, which would allow to exert their main bioactive effect as cholesterol-reducing agents in
the intestinal aqueous media [52]. In fact, in a very recent work performed by ourselves (currently
under review, for being published elsewhere), we demonstrated this potential hypocholesterolemic
effect of the hydrolyzed extracts from fenugreek and quinoa, which was positively correlated with
the phytosterol content of the extracts. The high bioaccessibility observed for phytosterols in the
current study would hence support the idea that these compounds were actively participating in the
observed displacement of cholesterol from the mixed micelles in such study.
The bioactive compound α-tocopherol was also detected in the digested samples of HFE and its
bioaccessibility was high (around 80%, Figure 4A). It has been proposed that the bioaccessibility of
vitamin E is quite variable, being highly dependent on the food matrix in which it is contained.
However, Nagao et al. [53] found consistent high bioaccessibilites of α-tocopherol (around 80%)
when contained in different vegetables such as pumpkin and carrot, with no significant effects of
soybean oil when co-digested.
0
10
20
30
40
50
60
70
80
90
100
110
Bio
accessib
ilit
y (
%)
A
Foods 2020, 9, x FOR PEER REVIEW 20 of 24
Figure 4. Bioaccessibility (%) of other bioactive compounds from (A) HFE and (B) HQE after their in
vitro gastrointestinal digestion.
Finally, the bioaccessibility of 5-hydroxymethylfurfural (HMF) was also assessed. The
previously described duality of this compound, either as potentially toxic and/or bioactive, motivated
the inclusion of this compound in the bioaccessibility analysis. Nearly all the HMF contained in the
HFE was bioaccessible (around 90%) and, in fact, out of all the compounds studied in this extract,
HMF was the one with the highest bioaccessibility, probably due to its easy solubilization in the
aqueous media. Quite variable values of bioaccessibility for HMF contained in different dried fruits
have been described, being as high as 95% for berries and as low as 8% for plums [54]. In any case, in
the current study, it can be confirmed that this compound contained in the HFE would be highly
available for its potential intestinal absorption, though its toxicity/bioactivity when contained in the
hydrolyzed extracts would need to be further elucidated.
With regard to the bioaccessibility of bioactives in HQE (Figure 4B), 18 compounds were
detected in the digested samples, being mainly phenolic compounds, ARs and phytosterols. The
bioaccessibilities of phenolic compounds were quite variable, since those from vanillic acid,
protocatechuic acid and 4-hydroxybenzoic acid were moderate in general (between 30–40%), but
those from 3-hydroxybenzoic acid and quercetin were considerably higher (close to 80%). It is worth
mentioning that quercetin, a flavonoid with multiple health-related bioactivities, has been generally
considered to have a very poor water solubility and bioavailability [55]. In fact, Chen et al [56]
recently demonstrated an increase in the bioaccessibility of quercetin from around 10% in an aqueous
solution to as high as 74% in an excipient emulsion stabilized by casein. Here, we demonstrated that
the hydrolysis process of saponin-rich extracts from quinoa might be an efficient and inexpensive
process for obtaining extracts whose particular composition, probably lipid compounds, guarantees
a high bioaccessibility for other co-extracted poor water soluble compounds, such as quercetin.
Regarding the bioaccessibility of ARs, all eight identified phenolic lipids showed high
bioaccessibilities, which ranged between 70 and 100% (Figure 4B). The elevated lipophilicity of these
compounds suggests that very low bioaccessibilities in the intestinal aqueous medium would be expected
from ARs. However, it was observed the opposite outcome, suggesting again that the lipophilic nature of
the HQE assures in general very adequate bioaccessibilities of poor soluble compounds, including ARs.
As far as we are aware, this is the first work that has described the bioaccessibility of ARs, including bcARs
and MARs. In this sense, Ross et al. [45] confirmed the detection of some ARs in fasting human plasma,
0
10
20
30
40
50
60
70
80
90
100
110
120
Bio
accessib
ilit
y (
%)
B
Figure 4. Bioaccessibility (%) of other bioactive compounds from (A) HFE and (B) HQE after theirin vitro gastrointestinal digestion.
The bioactive compound α-tocopherol was also detected in the digested samples of HFE andits bioaccessibility was high (around 80%, Figure 4A). It has been proposed that the bioaccessibilityof vitamin E is quite variable, being highly dependent on the food matrix in which it is contained.However, Nagao et al. [53] found consistent high bioaccessibilites of α-tocopherol (around 80%) whencontained in different vegetables such as pumpkin and carrot, with no significant effects of soybean oilwhen co-digested.
Finally, the bioaccessibility of 5-hydroxymethylfurfural (HMF) was also assessed. The previouslydescribed duality of this compound, either as potentially toxic and/or bioactive, motivated the inclusionof this compound in the bioaccessibility analysis. Nearly all the HMF contained in the HFE wasbioaccessible (around 90%) and, in fact, out of all the compounds studied in this extract, HMF was
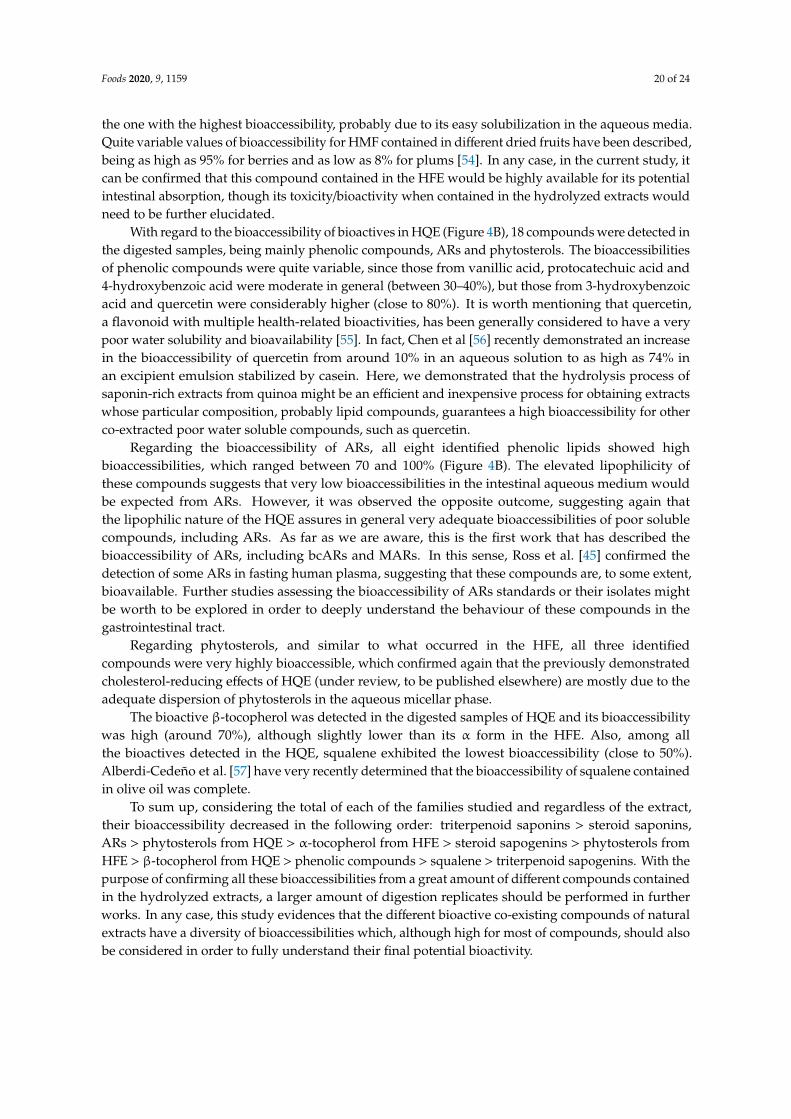
Foods 2020, 9, 1159 20 of 24
the one with the highest bioaccessibility, probably due to its easy solubilization in the aqueous media.Quite variable values of bioaccessibility for HMF contained in different dried fruits have been described,being as high as 95% for berries and as low as 8% for plums [54]. In any case, in the current study, itcan be confirmed that this compound contained in the HFE would be highly available for its potentialintestinal absorption, though its toxicity/bioactivity when contained in the hydrolyzed extracts wouldneed to be further elucidated.
With regard to the bioaccessibility of bioactives in HQE (Figure 4B), 18 compounds were detected inthe digested samples, being mainly phenolic compounds, ARs and phytosterols. The bioaccessibilitiesof phenolic compounds were quite variable, since those from vanillic acid, protocatechuic acid and4-hydroxybenzoic acid were moderate in general (between 30–40%), but those from 3-hydroxybenzoicacid and quercetin were considerably higher (close to 80%). It is worth mentioning that quercetin,a flavonoid with multiple health-related bioactivities, has been generally considered to have a verypoor water solubility and bioavailability [55]. In fact, Chen et al [56] recently demonstrated an increasein the bioaccessibility of quercetin from around 10% in an aqueous solution to as high as 74% inan excipient emulsion stabilized by casein. Here, we demonstrated that the hydrolysis process ofsaponin-rich extracts from quinoa might be an efficient and inexpensive process for obtaining extractswhose particular composition, probably lipid compounds, guarantees a high bioaccessibility for otherco-extracted poor water soluble compounds, such as quercetin.
Regarding the bioaccessibility of ARs, all eight identified phenolic lipids showed highbioaccessibilities, which ranged between 70 and 100% (Figure 4B). The elevated lipophilicity ofthese compounds suggests that very low bioaccessibilities in the intestinal aqueous medium wouldbe expected from ARs. However, it was observed the opposite outcome, suggesting again thatthe lipophilic nature of the HQE assures in general very adequate bioaccessibilities of poor solublecompounds, including ARs. As far as we are aware, this is the first work that has described thebioaccessibility of ARs, including bcARs and MARs. In this sense, Ross et al. [45] confirmed thedetection of some ARs in fasting human plasma, suggesting that these compounds are, to some extent,bioavailable. Further studies assessing the bioaccessibility of ARs standards or their isolates mightbe worth to be explored in order to deeply understand the behaviour of these compounds in thegastrointestinal tract.
Regarding phytosterols, and similar to what occurred in the HFE, all three identifiedcompounds were very highly bioaccessible, which confirmed again that the previously demonstratedcholesterol-reducing effects of HQE (under review, to be published elsewhere) are mostly due to theadequate dispersion of phytosterols in the aqueous micellar phase.
The bioactive β-tocopherol was detected in the digested samples of HQE and its bioaccessibilitywas high (around 70%), although slightly lower than its α form in the HFE. Also, among allthe bioactives detected in the HQE, squalene exhibited the lowest bioaccessibility (close to 50%).Alberdi-Cedeño et al. [57] have very recently determined that the bioaccessibility of squalene containedin olive oil was complete.
To sum up, considering the total of each of the families studied and regardless of the extract,their bioaccessibility decreased in the following order: triterpenoid saponins > steroid saponins,ARs > phytosterols from HQE > α-tocopherol from HFE > steroid sapogenins > phytosterols fromHFE > β-tocopherol from HQE > phenolic compounds > squalene > triterpenoid sapogenins. With thepurpose of confirming all these bioaccessibilities from a great amount of different compounds containedin the hydrolyzed extracts, a larger amount of digestion replicates should be performed in furtherworks. In any case, this study evidences that the different bioactive co-existing compounds of naturalextracts have a diversity of bioaccessibilities which, although high for most of compounds, should alsobe considered in order to fully understand their final potential bioactivity.

Foods 2020, 9, 1159 21 of 24
Supplementary Materials: The following are available online at http://www.mdpi.com/2304-8158/9/9/1159/s1,Figure S1: (A) HPLC-DAD chromatogram showing the identified saponins in FE and (B) GC-MS chromatogramshowing the identified sapogenins in HFE. Figure S2: (A) HPLC-DAD chromatogram showing the identifiedsaponins in QE and (B) GC-MS chromatogram showing the identified sapogenins in HQE.
Author Contributions: Conceptualization, D.M. and J.N.d.H.; Methodology, D.M. and J.N.d.H.; Formal Analysis,J.N.d.H. and D.M.; Investigation, J.N.d.H.; Data Curation, J.N.d.H.; Writing–Original Draft Preparation, J.N.d.H.and D.M.; Writing–Review & Editing, D.M. and J.N.d.H.; Visualization, D.M. and J.N.d.H.; Supervision, D.M.;Project Administration, G.R.; Funding Acquisition, G.R. All authors have read and agreed to the published versionof the manuscript.
Funding: This research was funded by the Ministerio de Economía y Competitividad, Spain(AGL2016-76736-C3-1-R) and the Community of Madrid, Spain (ALIBIRD-CM S2013/ABI-2728).
Acknowledgments: Joaquín Navarro del Hierro thanks the Ministerio de Educación, Cultura y Deporte forfunding his research with a FPU predoctoral contract (FPU 15/04236).
Conflicts of Interest: The authors declare no conflict of interest.
References
1. Faostat-Crops. Available online: http://www.fao.org/faostat/en/#data/QC (accessed on 29 July 2020).2. Indian Production of Fenugreek. Available online: http://agriexchange.apeda.gov.in/indiaproduction/India_
Productions.aspx?cat=Spices&hscode=1105 (accessed on 29 July 2020).3. El Hazzam, K.; Hafsa, J.; Sobeh, M.; Mhada, M.; Taourirte, M.; El Kacimi, K.; Yasri, A. An Insight into Saponins
from Quinoa (Chenopodium quinoa Willd): A Review. Molecules 2020, 25, 1059. [CrossRef] [PubMed]4. Basu, T.K.; Srichamroen, A. Health benefits of fenugreek (Trigonella foenum-graecum leguminosse).
In Bioactive Foods in Promoting Health, 1st ed.; Watson, R., Preedy, V., Eds.; Elsevier: Amsterdam,The Netherlands, 2010; pp. 425–435. [CrossRef]
5. Yao, D.; Zhang, B.; Zhu, J.; Zhang, Q.; Hu, Y.; Wang, S.; Wang, Y.; Cao, H.; Xiao, J. Advances on applicationof fenugreek seeds as functional foods: Pharmacology, clinical application, products, patents and market.Crit. Rev. Food Sci. Nutr. 2019, 60, 1–11. [CrossRef] [PubMed]
6. Ballester-Sánchez, J.; Millán-Linares, M.C.; Fernández-Espinar, M.T.; Haros, C.M. Development of Healthy,Nutritious Bakery Products by Incorporation of Quinoa. Foods 2019, 8, 379. [CrossRef] [PubMed]
7. Valencia-Chamorro, S.A. Quinoa. In Reference Module in Food Science; Elsevier: Amsterdam, The Netherlands, 2016.8. Aasim, M.; Baloch, F.S.; Nadeem, M.A.; Bakhsh, A.; Sameeullah, M.; Day, S. Fenugreek
(Trigonella foenum-graecum L.): An Underutilized Edible Plant of Modern World. In Global Perspectiveson Underutilized Crops; Ozturk, M., Hakeem, K.R., Ashraf, M., Ahmad, M.S.A., Eds.; Springer InternationalPublishing: Cham, Switzerland, 2018; pp. 381–408. [CrossRef]
9. Hernández-Ledesma, B. Quinoa (Chenopodium quinoa Willd.) as source of bioactive compounds: A review.Bioact. Compd. Health Dis. 2019, 2, 27. [CrossRef]
10. Güçlü-Üstündag, Ö.; Mazza, G. Saponins: Properties, applications and processing. Crit. Rev. Food Sci. Nutr.2007, 47, 231–258. [CrossRef] [PubMed]
11. Rao, V.; Gurfinkel, D.M. The bioactivity of saponins: Triterpenoid and steroidal glycosides. Drug Metabol.Drug Interact. 2000, 17, 211–235. [CrossRef]
12. Francis, G.; Kerem, Z.; Makkar, H.P.S.; Becker, K. The biological action of saponins in animal systems:A review. Br. J. Nutr. 2002, 88, 587–605. [CrossRef]
13. Sparg, S.G.; Light, M.E.; van Staden, J. Biological activities and distribution of plant saponins. J. Ethnopharmacol.2004, 94, 219–243. [CrossRef]
14. Wen, C.; Zhang, J.; Zhang, H.; Dzah, C.S.; Zandile, M.; Duan, Y.; Ma, H.; Luo, X. Advances in ultrasoundassisted extraction of bioactive compounds from cash crops–A review. Ultrason. Sonochem. 2018, 48, 538–549.[CrossRef]
15. Navarro del Hierro, J.; Herrera, T.; García-Risco, M.R.; Fornari, T.; Reglero, G.; Martin, D. Ultrasound-assistedextraction and bioaccessibility of saponins from edible seeds: Quinoa, lentil, fenugreek, soybean and lupin.Food Res. Int. 2018, 109, 440–447. [CrossRef]
16. Hadidi, M.; Ibarz, A.; Pagan, J. Optimisation and kinetic study of the ultrasonic-assisted extraction of totalsaponins from alfalfa (Medicago sativa) and its bioaccessibility using the response surface methodology.Food Chem. 2020, 309, 125786. [CrossRef] [PubMed]

Foods 2020, 9, 1159 22 of 24
17. Pham, H.N.T.; Van Vuong, Q.; Bowyer, M.C.; Scarlett, C.J. Ultrasound-assisted extraction of Catharanthusroseus (L.) G. Don (Patricia White cultivar) stem for maximizing saponin yield and antioxidant capacity.J. Food Process. Preserv. 2018, 42, e13597. [CrossRef]
18. Navarro del Hierro, J.; Herrera, T.; Fornari, T.; Reglero, G.; Martin, D. The gastrointestinal behavior ofsaponins and its significance for their bioavailability and bioactivities. J. Funct. Foods 2018, 40, 484–497.[CrossRef]
19. Zhang, X.; Jin, M.; Tadesse, N.; Zhan, G.; Zhang, H.; Dang, J.; Wang, S.; Guo, Z.; Ito, Y. Methods to treat theindustrial wastewater in diosgenin enterprises produced from Diosorea zingiberensis CH Wright. J. Clean.Prod. 2018, 186, 34–44. [CrossRef]
20. Zhang, H.; Xu, J.; Wang, M.; Xia, X.; Dai, R.; Zhao, Y. Steroidal saponins and sapogenins from fenugreek andtheir inhibitory activity against α-glucosidase. Steroids 2020, 161, 108690. [CrossRef]
21. Di Liberto, M.; Svetaz, L.; Furlán, R.L.E.; Zacchino, S.A.; Delporte, C.; Novoa, M.A.; Asencio, M.; Cassels, B.K.Antifungal activity of saponin-rich extracts of Phytolacca dioica and of the sapogenins obtained throughhydrolysis. Nat. Prod. Commun. 2010, 5, 1013–1018. [CrossRef]
22. Herrera, T.; Navarro del Hierro, J.; Fornari, T.; Reglero, G.; Martin, D. Acid hydrolysis of saponin-rich extractsof quinoa, lentil, fenugreek and soybean to yield sapogenin-rich extracts and other bioactive compounds.J. Sci. Food Agric. 2019, 99, 3157–3167. [CrossRef]
23. Fernández-García, E.; Carvajal-Lérida, I.; Pérez-Gálvez, A. In vitro bioaccessibility assessment as a predictiontool of nutritional efficiency. Nutr. Res. 2009, 29, 751–760. [CrossRef]
24. Zhao, C.; Miao, J.; Li, X.; Chen, X.; Mao, X.; Wang, Y.; Hua, X.; Gao, W. Impact of in vitro simulateddigestion on the chemical composition and potential health benefits of Chaenomeles speciosa and Crataeguspinnatifida. Food Biosci. 2020, 35, 100511. [CrossRef]
25. Martin, D.; Navarro del Hierro, J.; Villanueva Bermejo, D.; Fernández-Ruiz, R.; Fornari, T.; Reglero, G.Bioaccessibility and antioxidant activity of Calendula officinalis supercritical extract as affected by in vitrocodigestion with olive oil. J. Agric. Food Chem. 2016, 64, 8828–8837. [CrossRef]
26. Furtado, N.; Pirson, L.; Edelberg, H.M.; Miranda, L.; Loira-Pastoriza, C.; Preat, V.; Larondelle, Y.; André, C.Pentacyclic triterpene bioavailability: An overview of in vitro and in vivo studies. Molecules 2017, 22, 400.[CrossRef]
27. Navarro del Hierro, J.; Piazzini, V.; Reglero, G.; Martin, D.; Bergonzi, M.C. In Vitro Permeability of Saponinsand Sapogenins from Seed Extracts by the Parallel Artificial Membrane Permeability Assay: Effect of in VitroGastrointestinal Digestion. J. Agric. Food Chem. 2020, 68, 1297–1305. [CrossRef] [PubMed]
28. Tatia, R.; Zalaru, C.; Tarcomnicu, I.; Moldovan, L.; Craciunescu, O.; Calinescu, I. Isolation and characterizationof hederagenin from Hedera helix L. Extract with antitumor activity. Rev. Chim. 2019, 70, 1157–1161.[CrossRef]
29. Bedour, M.S.; El-Munajjed, D.; Fayez, M.B.E.; Girgis, A.N. Steroid sapogenins VII. Identification and originof 25d-spirosta-3, 5-diene among the fenugreek sapogenins. J. Pharm. Sci. 1964, 53, 1276–1278. [CrossRef][PubMed]
30. Medina-Meza, I.G.; Aluwi, N.A.; Saunders, S.R.; Ganjyal, G.M. GC–MS Profiling of Triterpenoid Saponinsfrom 28 Quinoa Varieties (Chenopodium quinoa Willd.) Grown in Washington State. J. Agric. Food Chem.2016, 64, 8583–8591. [CrossRef] [PubMed]
31. Ng, K.G.; Price, K.R.; Fenwick, G.R. A TLC method for the analysis of quinoa (Chenopodium quinoa) saponins.Food Chem. 1994, 49, 311–315. [CrossRef]
32. Ganem-Quintanar, A.; Quintanar-Guerrero, D.; Buri, P. Monoolein: A review of the pharmaceuticalapplications. Drug Dev. Ind. Pharm. 2000, 26, 809–820. [CrossRef]
33. Nour, A.A.M.; Magboul, B.I. Chemical and amino acid composition of fenugreek seeds grown in Sudan.Food Chem. 1986, 22, 1–5. [CrossRef]
34. Lahuta, L.B.; Szablinska, J.; Ciak, M.; Górecki, R.J. The occurrence and accumulation of d-pinitol in fenugreek(Trigonella foenum graecum L.). Acta Physiol. Plant. 2018, 40, 1–11. [CrossRef]
35. Lupien, P.; Moorjani, S.; Brun, D.; Bielmann, P. Effects of 3-Hydroxy-3-methylglutaric Acid on Plasma andLow-Density Lipoprotein Cholesterol Levels in Familial Hypercholesterolemia. J. Clin. Pharmacol. 1979, 19,120–126. [CrossRef]
Foods 2020, 9, 1159 23 of 24
36. Mukker, J.K.; Singh, R.S.P.; Muir, A.D.; Krol, E.S.; Alcorn, J. Comparative pharmacokinetics of purifiedflaxseed and associated mammalian lignans in male Wistar rats. Br. J. Nutr. 2015, 113, 749–757. [CrossRef][PubMed]
37. Tahir, N.I.; Shaari, K.; Abas, F.; Parveez, G.K.A.; Ishak, Z.; Ramli, U.S. Characterization of apigenin andluteolin derivatives from oil palm (Elaeis guineensis Jacq.) Leaf using LC-ESI-MS/MS. J. Agric. Food Chem.2012, 60, 11201–11210. [CrossRef] [PubMed]
38. Benayad, Z.; Gómez-Cordovés, C.; Es-Safi, N. Characterization of Flavonoid Glycosides from Fenugreek(Trigonella foenum-graecum) Crude Seeds by HPLC–DAD–ESI/MS Analysis. Int. J. Mol. Sci. 2014, 15,20668–20685. [CrossRef] [PubMed]
39. Zhao, L.; Chen, J.; Su, J.; Li, L.; Hu, S.; Li, B.; Zhang, X.; Xu, Z.; Chen, T. In vitro antioxidant and antiproliferativeactivities of 5-hydroxymethylfurfural. J. Agric. Food Chem. 2013, 61, 10604–10611. [CrossRef] [PubMed]
40. Hernandez, E.M. Specialty Oils: Functional and Nutraceutical Properties. In Functional Dietary Lipids: FoodFormulation, Consumer Issues and Innovation for Health, 1st ed.; Sanders, T.A.B., Ed.; Elsevier: Amsterdam,The Netherlands, 2015; pp. 69–101.
41. Pellegrini, M.; Lucas-Gonzales, R.; Ricci, A.; Fontecha, J.; Fernández-López, J.; Pérez-Álvarez, J.A.;Viuda-Martos, M. Chemical, fatty acid, polyphenolic profile, techno-functional and antioxidant properties offlours obtained from quinoa (Chenopodium quinoa Willd) seeds. Ind. Crops Prod. 2018, 111, 38–46. [CrossRef]
42. Dulinski, R.; Starzynska-Janiszewska, A.; Byczynski, Ł.; Błaszczyk, U. Myo-inositol phosphates profile ofbuckwheat and quinoa seeds: Effects of hydrothermal processing and solid-state fermentation with Rhizopusoligosporus. Int. J. Food Prop. 2017, 20, 2088–2095. [CrossRef]
43. Ahamed, N.T.; Singhal, R.S.; Kulkarni, P.R.; Pal, M. A Lesser-Known Grain, Chenopodium Quinoa: Review ofthe Chemical Composition of its Edible Parts. Food Nutr. Bull. 1998, 19, 61–70. [CrossRef]
44. Lin, M.; Han, P.; Li, Y.; Wang, W.; Lai, D.; Zhou, L. Quinoa Secondary Metabolites and Their BiologicalActivities or Functions. Molecules 2019, 24, 2512. [CrossRef]
45. Ross, A.B.; Svelander, C.; Karlsson, G.; Savolainen, O.I. Identification and quantification of even andodd chained 5-n alkylresorcinols, branched chain-alkylresorcinols and methylalkylresorcinols in Quinoa(Chenopodium quinoa). Food Chem. 2017, 220, 344–351. [CrossRef]
46. Tang, Y.; Li, X.; Zhang, B.; Chen, P.X.; Liu, R.; Tsao, R. Characterisation of phenolics, betanins and antioxidantactivities in seeds of three Chenopodium quinoa Willd. genotypes. Food Chem. 2015, 166, 380–388. [CrossRef]
47. Souza, S.P.; Roos, A.A.; Gindri, A.L.; Domingues, V.O.; Ascari, J.; Guerra, G.P. Neuroprotective effectof red quinoa seeds extract on scopolamine-induced declarative memory deficits in mice: The role ofacetylcholinesterase and oxidative stress. J. Funct. Foods 2020, 69, 103958. [CrossRef]
48. Tian, S.; Sun, Y.; Chen, Z.; Zhao, R. Bioavailability and Bioactivity of Alkylresorcinols from Different CerealProducts. J. Food Qual. 2020, 2020, 1–6. [CrossRef]
49. Serventi, L.; Chitchumroonchokchai, C.; Riedl, K.M.; Kerem, Z.; Berhow, M.A.; Vodovotz, Y.; Schwartz, S.J.;Failla, M.L. Saponins from soy and chickpea: Stability during beadmaking and in vitro bioaccessibility.J. Agric. Food Chem. 2013, 61, 6703–6710. [CrossRef]
50. Jaramillo, S.; Muriana, F.J.G.; Guillen, R.; Jimenez-Araujo, A.; Rodriguez-Arcos, R.; Lopez, S. Saponins fromedible spears of wild asparagus inhibit AKT, p70S6K, and ERK signalling, and induce apoptosis throughG0/G1 cell cycle arrest in human colon cancer HCT-116 cells. J. Funct. Foods 2016, 26, 1–10. [CrossRef]
51. McClements, D.J.; Zou, L.; Zhang, R.; Salvia-Trujillo, L.; Kumosani, T.; Xiao, H. Enhancing nutraceuticalperformance using excipient foods: designing food structures and compositions to increase bioavailability.Compr. Rev. Food Sci. Food Saf. 2015, 14, 824–847. [CrossRef]
52. Patch, C.S.; Tapsell, L.C.; Williams, P.G.; Gordon, M. Plant sterols as dietary adjuvants in the reduction ofcardiovascular risk: theory and evidence. Vasc. Health Risk Manag. 2006, 2, 157–162. [CrossRef] [PubMed]
53. Nagao, A.; Kotake-Nara, E.; Hase, M. Effects of fats and oils on the bioaccessibility of carotenoids and vitaminE in vegetables. Biosci. Biotechnol. Biochem. 2013, 77, 1055–1060. [CrossRef] [PubMed]
54. Rahimzadeh, N.; Alizadeh, M.; Ghaemmaghami Hezaveh, S.J. Estimated Bioaccessibility to5-hydroxymethylfurfural from Frequently Consumed Dried Fruits in Iran. J. Chem. Health Risks 2018,4, 15–23. [CrossRef]
55. Cai, X.; Fang, Z.; Dou, J.; Yu, A.; Zhai, G. Bioavailability of Quercetin: Problems and Promises. Curr. Med.Chem. 2013, 20, 2572–2582. [CrossRef]

Foods 2020, 9, 1159 24 of 24
56. Chen, X.; McClements, D.J.; Zhu, Y.; Chen, Y.; Zou, L.; Liu, W.; Cheng, C.; Fu, D.; Liu, C. Enhancement of thesolubility, stability and bioaccessibility of quercetin using protein-based excipient emulsions. Food Res. Int.2018, 114, 30–37. [CrossRef]
57. Alberdi-Cedeño, J.; Ibargoitia, M.L.; Guillén, M.D. Study of the In Vitro Digestion of Olive Oil Enriched orNot with Antioxidant Phenolic Compounds. Relationships between Bioaccessibility of Main Components ofDifferent Oils and Their Composition. Antioxidants 2020, 9, 543. [CrossRef] [PubMed]
© 2020 by the authors. Licensee MDPI, Basel, Switzerland. This article is an open accessarticle distributed under the terms and conditions of the Creative Commons Attribution(CC BY) license (http://creativecommons.org/licenses/by/4.0/).