bimb securities research market insight … · barakah wins sabah sarawak gas pipeline contract ......
TRANSCRIPT
Go to https://www.bisonline.com.my/
| 1
PP16795/03/2013(031743)
Bursa Malaysia
Bursa Malaysia Close Change +/- Change %
FBMKLCI 1,669.24 -2.76 -0.17
FBMEMAS 11,639.02 -16.87 -0.14
FBM100 11,318.55 -18.53 -0.16
FBMEMAS Shariah 12,549.39 -24.15 -0.19
FBM Hijrah Shariah 14,147.18 -33.05 -0.23
Volume (mn) 1,781.47 -6.78 -0.38
Value (RMmn) 1,684.58 -56.72 -3.26
FBMKLCI YTD Chg -5.22
Scoreboard
Close Change+/- (+/- %)
Gainers 393 -68 -14.75
Losers 425 66 18.38
Unchanged 342 -10 -2.84
Regional Indices
Close Change (+/-)
Change (+/- %)
YTD Chg (%)
DJIA 17,568.00 -162.51 -0.92 -1.43
NASDAQ 5,098.24 -3.57 -0.07 7.65
S&P 500 2,063.59 -13.48 -0.65 0.23
FTSE 100 6,135.22 -88.30 -1.42 -6.56
Nikkei 225 19,492.60 -205.55 -1.04 11.70
HSI 21,905.13 -298.09 -1.34 -7.20
SHCOMP 3,470.07 -66.86 -1.89 7.28
KOSPI 1,949.04 -14.63 -0.75 1.75
TWSE 8,343.86 -110.41 -1.31 -10.35
STI 2,876.03 -24.89 -0.86 -14.53
JCI 4,464.18 -57.21 -1.27 -14.59
SET 1,306.98 -26.59 -1.99 -12.73
PSEi 6,838.42 -73.44 -1.06 -5.42 Market Valuation (PER)
FY15 FY16 5Y Average
FBMKLCI 15.74 15.05 15.70
SHCOMP 13.47 11.79 11.00
HSI 10.44 9.45 11.10 JCI 14.61 12.65 15.15 SET 12.68 11.30 13.68
STI 11.99 11.24 14.03
PSEi 16.51 14.99 17.40
The Research Team
03-26918887 ext 1735
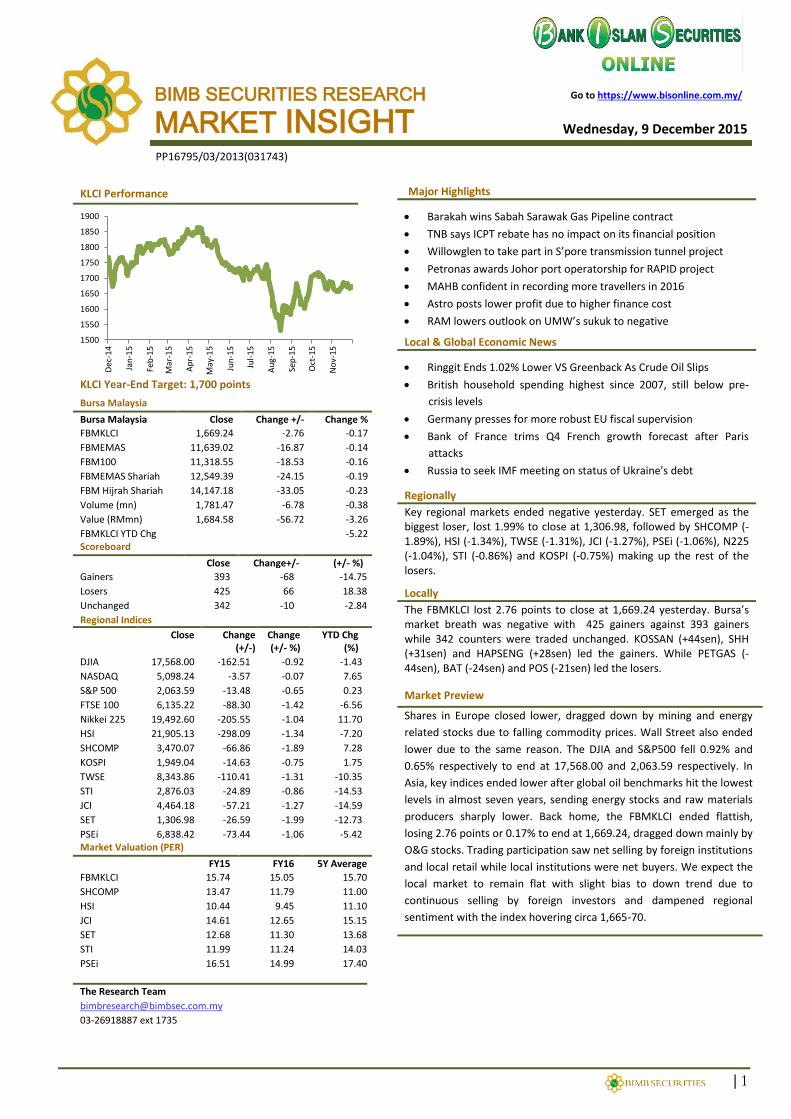
KLCI Performance
KLCI Year-End Target: 1,700 points
Major Highlights
Barakah wins Sabah Sarawak Gas Pipeline contract
TNB says ICPT rebate has no impact on its financial position
Willowglen to take part in S’pore transmission tunnel project
Petronas awards Johor port operatorship for RAPID project
MAHB confident in recording more travellers in 2016
Astro posts lower profit due to higher finance cost
RAM lowers outlook on UMW’s sukuk to negative
Local & Global Economic News
Ringgit Ends 1.02% Lower VS Greenback As Crude Oil Slips
British household spending highest since 2007, still below pre-
crisis levels
Germany presses for more robust EU fiscal supervision
Bank of France trims Q4 French growth forecast after Paris
attacks
Russia to seek IMF meeting on status of Ukraine's debt
Regionally
Key regional markets ended negative yesterday. SET emerged as the biggest loser, lost 1.99% to close at 1,306.98, followed by SHCOMP (-1.89%), HSI (-1.34%), TWSE (-1.31%), JCI (-1.27%), PSEi (-1.06%), N225 (-1.04%), STI (-0.86%) and KOSPI (-0.75%) making up the rest of the losers.
Locally The FBMKLCI lost 2.76 points to close at 1,669.24 yesterday. Bursa’s market breath was negative with 425 gainers against 393 gainers while 342 counters were traded unchanged. KOSSAN (+44sen), SHH (+31sen) and HAPSENG (+28sen) led the gainers. While PETGAS (-44sen), BAT (-24sen) and POS (-21sen) led the losers.
Market Preview
Shares in Europe closed lower, dragged down by mining and energy
related stocks due to falling commodity prices. Wall Street also ended
lower due to the same reason. The DJIA and S&P500 fell 0.92% and
0.65% respectively to end at 17,568.00 and 2,063.59 respectively. In
Asia, key indices ended lower after global oil benchmarks hit the lowest
levels in almost seven years, sending energy stocks and raw materials
producers sharply lower. Back home, the FBMKLCI ended flattish,
losing 2.76 points or 0.17% to end at 1,669.24, dragged down mainly by
O&G stocks. Trading participation saw net selling by foreign institutions
and local retail while local institutions were net buyers. We expect the
local market to remain flat with slight bias to down trend due to
continuous selling by foreign investors and dampened regional
sentiment with the index hovering circa 1,665-70.
1500
1550
1600
1650
1700
1750
1800
1850
1900
Dec
-14
Jan
-15
Feb
-15
Mar
-15
Ap
r-1
5
May
-15
Jun
-15
Jul-
15
Au
g-1
5
Sep
-15
Oct
-15
No
v-1
5
MARKET INSIGHT BIMB SECURITIES RESEARCH
Wednesday, 9 December 2015

www.bimbsec.com.my | 2
Market Insight
Sector Indices
Close Change+/- (+/- %)
Industrial 3,260.20 -17.96 -0.55
Consumer 586.35 -0.86 -0.15
Industrial Products 149.21 -0.25 -0.17
Construction 275.83 -0.09 -0.03
Finance 14,151.99 2.10 0.01
Property 1,189.81 -5.06 -0.42
Plantation 7,457.31 -1.14 -0.02
Technology 25.20 0.23 0.92
KLCI Futures
Contracts Nov-15 Dec-15
High 1,666.50 1,659.00
Low 1,655.50 1,649.50
Last 1,659.50 1,654.00
Volume 4,760.00 125.00
Commodities (Most Recent Close)
Close Change +/- (+/- %) % Brent Crude (USD/bbl) 40.73 -0.25 -0.61
WTI Crude (USD/bbl) 37.65 0.20 0.53
Gold (USD/ounce) 1,074.96 -0.05 0.00
CPO (RM/MT) 2,396.00 -40.00 -1.64
SMR 20 (sen/kg) 494.50 1.00 0.20
Latex (sen/kg) 363.50 0.50 0.14
Soybean Oil 31.70 0.23 0.73
Forex
(per USD1) Close Change +/- Change % MYR 4.2615 0.0373 0.88
JPY 122.9300 -0.4400 -0.36
EUR 0.9181 -0.0046 -0.50
SGD 1.4088 0.0026 0.18
Major Rates
KLIBOR 3-mth 3.80%
KLIBOR 6-mth 3.88%
KLIBOR 12-mth 3.94%
5-yr MGS 3.75%
10-yr MGS 4.23%
Active Stock
Close Change+/- (+/- %)
1 Utopia 0.05 0.00 0.00
Instacom 0.31 0.03 8.93
XOX 0.20 -0.01 -2.44
Genetec 0.30 -0.01 -3.28 Sumatec 0.13 -0.01 -3.70
Top Gainers
Close Change+/- (+/- %)
Kossan Rubber 8.79 0.44 5.27
SHH Resources 2.40 0.31 14.83
Hap Seng 6.48 0.28 4.52
Malaysian Pacific Industries 8.63 0.26 3.11
PIE Industrial 8.55 0.25 3.01
Top Losers
Close Change+/- (+/- %) British American Tobacco Bhd
PETRONAS GAS BHD
22.88 -0.44
Far East BRITISH AMERICAN TOBACCO BHD
56.80 -0.24
Petronas Dagangan POS MALAYSIA BERHAD
3.05 -0.21 Kumpulan H&L High-Tech Bhd
CARLSBERG BREWERY MALAYSIA B
11.50 -0.20
APM Automotive GUINNESS ANCHOR BHD
13.96 -0.17 Daily Participation
Participation
(%) Bought (RMm)
Sold (RMm)
Net (RMm)
Local Institution 56.2 1024.8 869.5 155.3
Local Retail 19.9 327.4 341.9 -14.5
Foreign 23.9 332.4 473.2 -140.8
Total 100.0 1,684.6 1,684.6 0.0
www.bimbsec.com.my | 3
Market Insight
LOCAL CORPORATE NEWS Barakah wins Sabah Sarawak Gas Pipeline contract Barakah Offshore Petroleum has received the letter of award from Petronas Gas (PGB) for the provision of repair and maintenance of Sabah Sarawak Gas Pipeline. Sabah Sarawak Gas Pipeline is a network of onshore pipeline that link Sabah Oil and Gas Terminal in Kimanis, Sabah and Petronas LNG Complex in Bintulu, Sarawak. The length of the pipeline is 503km. The scope of the contract includes inspection, testing, repair and maintenance of the pipes and related infrastructures to maintain the pipeline integrity. The contract is for 2 years from Dec 1, 2015 until Nov 30, 2017. PGB has the option to extend the contract for an additional year. The value of the contract will depend on the number of work programmes to be carried out for the duration of the contract based on unit rates specified in the contract. (Source: Star Biz) TNB says ICPT rebate has no impact on its financial position Tenaga responding to the Government’s announcement of an imbalance cost pass-through (ICPT) rebate to customers of 1.52 sen/kWh in the Jan-June 2016 period mentioned the impact of the rebate’s implementation is neutral on TNB and will have no effect on its business operations and financial position. The rebate will be applicable to all consumers except domestic consumers with monthly consumption of 300 kWh and below. On the RM762.03m net savings, savings came from savings in fuel and generation costs for the period from July to December this year and higher piped gas price effective from next month. (Source: Star Biz) Willowglen to take part in S’pore transmission tunnel project Willowglen MSC Bhd’s unit Willowglen Services has been awarded a RM6.938m contract by Incsys to do the integrated security and operation surveillance system (ISOSS) works for the Jurong Island-to-Pioneer transmission cable tunnel project in Singapore. ELV (extra low voltage) sub-contract’s period was from Oct 21, 2015 to Oct 30, 2017. The contract is not renewable. (Source: Star Biz) Petronas awards Johor port operatorship for RAPID project Petronas has awarded the Johor port operatorship for its RAPID project to Johor Port (JPB). Petronas subsidiary Petronas Refinery and Petrochemical Corp SB held a handover and commencement of operations ceremony for the material offloading facility (MOLF) Teluk Ramunia in Pengerang, Johor. The ceremony is the conclusion of a 4-year port operatorship contract for the MOLF at Teluk Ramunia. As the port operator, JPB will manage the operations and logistics functions at the MOLF for Petronas’ RAPID project in Pengerang. (Source: Star Biz) MAHB confident in recording more travellers in 2016 Malaysia Airports Holdings (MAHB) is optimistic of capturing a fair share of the travellers market in 2016, boosted by the government's effort to relax visa restriction process. Yhere were a lot of headwinds this year such as the haze, aftermath of the twin MAS tragedies (MH370 and MH17) and other air incidents. Going forward MAHB is already seeing a surge in travellers from China. For 2016, MAHB is optimistic as the government has announced that it will issue e-visa to China and India. (Source: Star Biz) Astro posts lower profit due to higher finance cost Astro Malaysia’s net profit slid 6.5% to RM106.01m for Q3 ended Oct 31, 2015 on unrealised forex impact, but it will maintain its dividend policy payout. It has declared a dividend of 2.75sen per share for the quarter under review. Lower net profit was due to a drop in EBITDA of RM16.1m, higher net finance costs by RM36.4m on unrealised forex impact arising from an unhedged finance lease liability of RM54.5m and unhedged vendor financing of RM8.8m. This was offset by a decrease in the discounting of the transponder’s deposit to its present value of RM22m. (Source: Star Biz) RAM lowers outlook on UMW’s sukuk to negative RAM Ratings has revised the outlook on the long-term ratings of UMW’s Islamic debt programmes to negative, while at the same time reaffirming the AAA and P1 ratings of the programmes. RAM had noted UMW’s weakening operating performance and financial profile, which may not recover to previous levels in the short term. UMW’s debts had grown to RM6.21bn as at end-Sept 2015, partially due to the weakened ringgit. As the company is expected to incur debt to fund additional capex, a new business venture and other investments, balanced off by repayment of some short term debts, its debt load is expected to stay escalated at year-end, although possibly reducing to about RM5.5bn next year (Source: Star Biz)
www.bimbsec.com.my | 4
Market Insight
LOCAL AND GLOBAL ECONOMIC NEWS Ringgit Ends 1.02% Lower VS Greenback As Crude Oil Slips The ringgit closed 1.02% lower to the US dollar today on a sell-off following another slip in global crude oil prices. At 5 pm, the local unit was quoted at 4.2550/2600 against the greenback from 4.2120/2180 yesterday. Ringgit faced renewed pressure due to tumbling global oil prices. The ringgit was also traded lower against a basket of major currencies as at 5 pm. It went down against the British pound to 6.3944/4032 from Monday's close of 6.3487/3586, and softened against the yen at 3.4574/4623 from 3.4136/4193. The ringgit was lower against the Singapore dollar at 3.0199/0239 from yesterday's close of 3.0000/0060, and weakened against the euro to 4.6222/6285 from 4.5574/5651. (Source: Bernama) British household spending highest since 2007, still below pre-crisis levels British weekly household spending rose in 2014 to its highest since before the global financial downturn but remained below pre-crisis level, official data showed on Tuesday. Households spent on average £531.30 (US$795.73) per week last year, which was 1.4% more than in 2013, adjusted for inflation. Average household spending was still below a peak of £538.70 in 2007, but had recovered from a 10-year low of £507.40 in 2012. Households spent a 1/5 of their income on average in 2014 on housing, bills and home improvements at £158.30 a week - although that understates the true cost, since it does not include rent funded by welfare payments and also covers households which own their home outright. (Source: Reuters) Germany presses for more robust EU fiscal supervision Political interference by EU members risks hampering the European Commission's role of overseeing budget rules. The supervision duties must be administered independently of political interests. The commission's role as guardian of European Union treaties should not be compromised by political interests or interference, the paper. (Source: Reuters) Bank of France trims Q4 French growth forecast after Paris attacks Bank of France cut its forecast for French economic growth to 0.3% on Tuesday, blaming in part the hit to hotel bookings and restaurant takings from Islamist militant attacks in Paris last month. The central bank gave its updated estimate for GDP in a monthly business sentiment survey which showed the index for morale in the service sector fell in November to 96 from a downwardly-revised 97 in October. (Source: Reuters) Russia to seek IMF meeting on status of Ukraine's debt Moscow would seek a meeting of the International Monetary Fund's board of directors to decide whether Ukraine's debt to Moscow should be considered official rather than commercial. IMF management has confirmed the official status of the debt and now Russia intend to initiate a meeting of the board of directors of the Fund for a formal confirmation of the status of the debt. (Source: Reuters)
www.bimbsec.com.my | 5
Market Insight
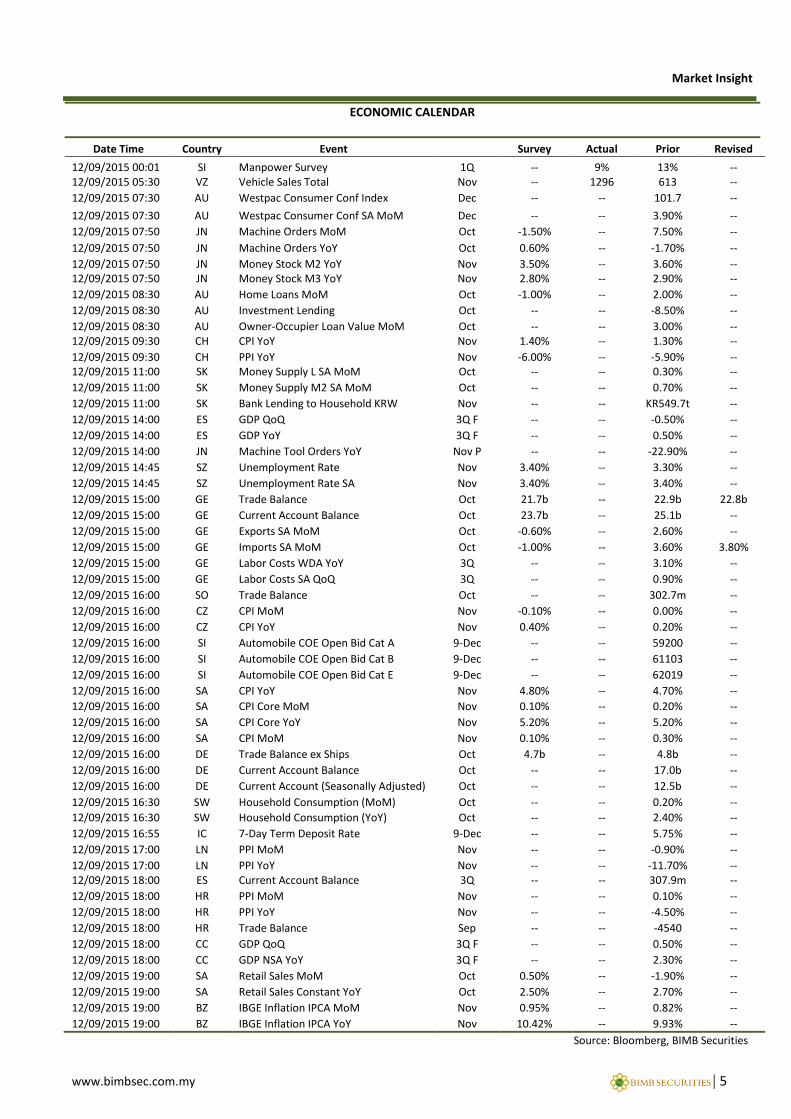
ECONOMIC CALENDAR
Date Time Country Event Survey Actual Prior Revised
12/09/2015 00:01 SI Manpower Survey 1Q -- 9% 13% -- 12/09/2015 05:30 VZ Vehicle Sales Total Nov -- 1296 613 --
12/09/2015 07:30 AU Westpac Consumer Conf Index Dec -- -- 101.7 --
12/09/2015 07:30 AU Westpac Consumer Conf SA MoM Dec -- -- 3.90% --
12/09/2015 07:50 JN Machine Orders MoM Oct -1.50% -- 7.50% --
12/09/2015 07:50 JN Machine Orders YoY Oct 0.60% -- -1.70% --
12/09/2015 07:50 JN Money Stock M2 YoY Nov 3.50% -- 3.60% -- 12/09/2015 07:50 JN Money Stock M3 YoY Nov 2.80% -- 2.90% --
12/09/2015 08:30 AU Home Loans MoM Oct -1.00% -- 2.00% --
12/09/2015 08:30 AU Investment Lending Oct -- -- -8.50% --
12/09/2015 08:30 AU Owner-Occupier Loan Value MoM Oct -- -- 3.00% -- 12/09/2015 09:30 CH CPI YoY Nov 1.40% -- 1.30% --
12/09/2015 09:30 CH PPI YoY Nov -6.00% -- -5.90% -- 12/09/2015 11:00 SK Money Supply L SA MoM Oct -- -- 0.30% --
12/09/2015 11:00 SK Money Supply M2 SA MoM Oct -- -- 0.70% --
12/09/2015 11:00 SK Bank Lending to Household KRW Nov -- -- KR549.7t --
12/09/2015 14:00 ES GDP QoQ 3Q F -- -- -0.50% --
12/09/2015 14:00 ES GDP YoY 3Q F -- -- 0.50% --
12/09/2015 14:00 JN Machine Tool Orders YoY Nov P -- -- -22.90% --
12/09/2015 14:45 SZ Unemployment Rate Nov 3.40% -- 3.30% --
12/09/2015 14:45 SZ Unemployment Rate SA Nov 3.40% -- 3.40% --
12/09/2015 15:00 GE Trade Balance Oct 21.7b -- 22.9b 22.8b
12/09/2015 15:00 GE Current Account Balance Oct 23.7b -- 25.1b --
12/09/2015 15:00 GE Exports SA MoM Oct -0.60% -- 2.60% --
12/09/2015 15:00 GE Imports SA MoM Oct -1.00% -- 3.60% 3.80%
12/09/2015 15:00 GE Labor Costs WDA YoY 3Q -- -- 3.10% --
12/09/2015 15:00 GE Labor Costs SA QoQ 3Q -- -- 0.90% --
12/09/2015 16:00 SO Trade Balance Oct -- -- 302.7m --
12/09/2015 16:00 CZ CPI MoM Nov -0.10% -- 0.00% --
12/09/2015 16:00 CZ CPI YoY Nov 0.40% -- 0.20% --
12/09/2015 16:00 SI Automobile COE Open Bid Cat A 9-Dec -- -- 59200 --
12/09/2015 16:00 SI Automobile COE Open Bid Cat B 9-Dec -- -- 61103 --
12/09/2015 16:00 SI Automobile COE Open Bid Cat E 9-Dec -- -- 62019 --
12/09/2015 16:00 SA CPI YoY Nov 4.80% -- 4.70% --
12/09/2015 16:00 SA CPI Core MoM Nov 0.10% -- 0.20% --
12/09/2015 16:00 SA CPI Core YoY Nov 5.20% -- 5.20% --
12/09/2015 16:00 SA CPI MoM Nov 0.10% -- 0.30% --
12/09/2015 16:00 DE Trade Balance ex Ships Oct 4.7b -- 4.8b --
12/09/2015 16:00 DE Current Account Balance Oct -- -- 17.0b --
12/09/2015 16:00 DE Current Account (Seasonally Adjusted) Oct -- -- 12.5b --
12/09/2015 16:30 SW Household Consumption (MoM) Oct -- -- 0.20% --
12/09/2015 16:30 SW Household Consumption (YoY) Oct -- -- 2.40% --
12/09/2015 16:55 IC 7-Day Term Deposit Rate 9-Dec -- -- 5.75% --
12/09/2015 17:00 LN PPI MoM Nov -- -- -0.90% --
12/09/2015 17:00 LN PPI YoY Nov -- -- -11.70% -- 12/09/2015 18:00 ES Current Account Balance 3Q -- -- 307.9m --
12/09/2015 18:00 HR PPI MoM Nov -- -- 0.10% --
12/09/2015 18:00 HR PPI YoY Nov -- -- -4.50% --
12/09/2015 18:00 HR Trade Balance Sep -- -- -4540 --
12/09/2015 18:00 CC GDP QoQ 3Q F -- -- 0.50% --
12/09/2015 18:00 CC GDP NSA YoY 3Q F -- -- 2.30% --
12/09/2015 19:00 SA Retail Sales MoM Oct 0.50% -- -1.90% --
12/09/2015 19:00 SA Retail Sales Constant YoY Oct 2.50% -- 2.70% --
12/09/2015 19:00 BZ IBGE Inflation IPCA MoM Nov 0.95% -- 0.82% --
12/09/2015 19:00 BZ IBGE Inflation IPCA YoY Nov 10.42% -- 9.93% --
Source: Bloomberg, BIMB Securities
www.bimbsec.com.my | 6
Market Insight
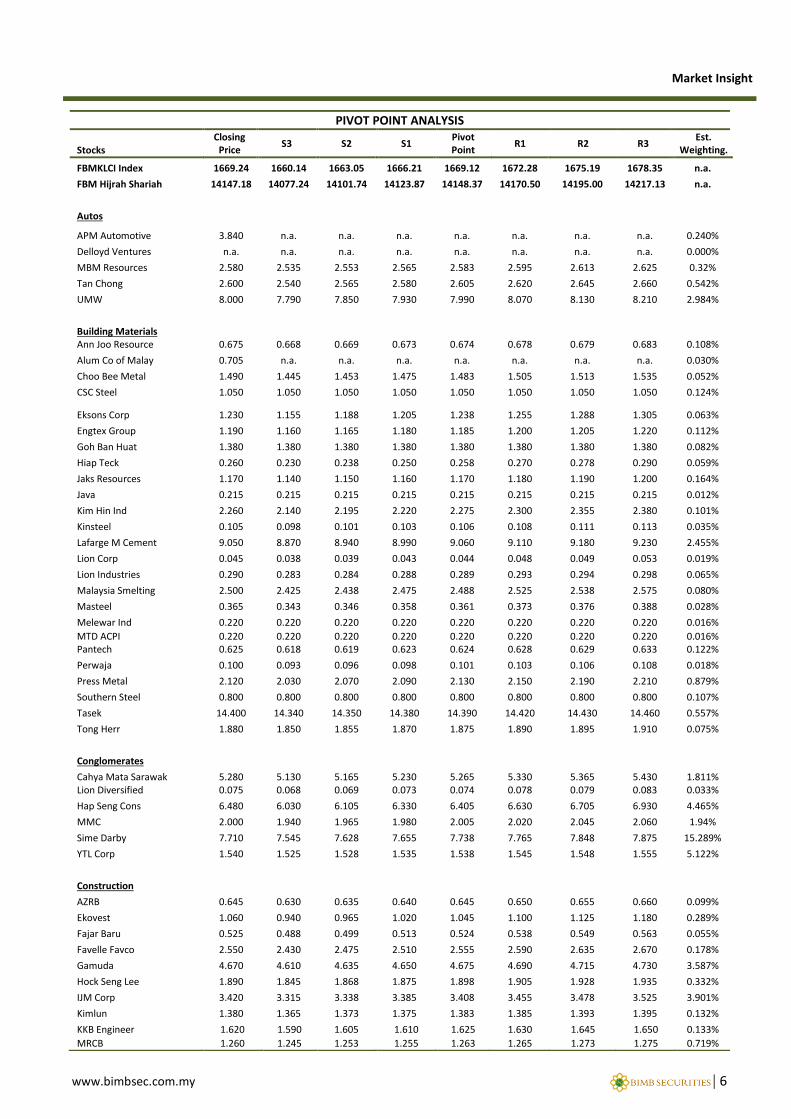
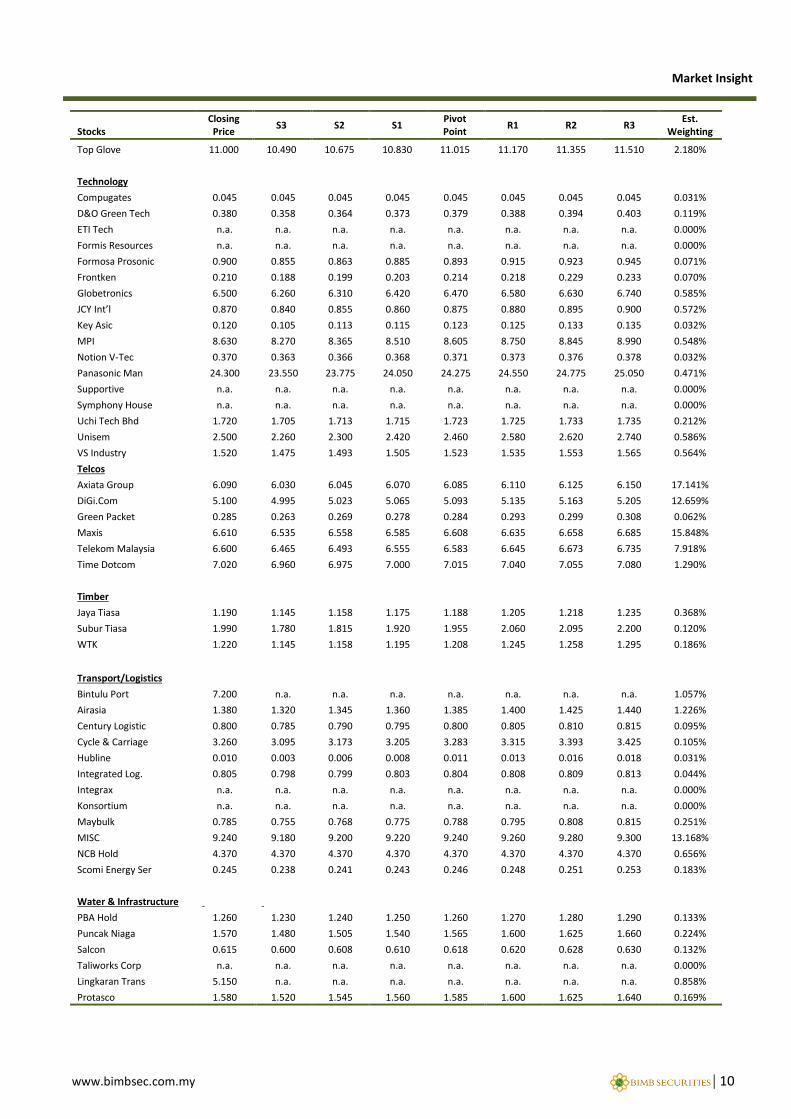
PIVOT POINT ANALYSIS
Stocks Closing
Price S3 S2 S1
Pivot Point
R1 R2 R3 Est.
Weighting.
FBMKLCI Index 1669.24 1660.14 1663.05 1666.21 1669.12 1672.28 1675.19 1678.35 n.a.
FBM Hijrah Shariah 14147.18 14077.24 14101.74 14123.87 14148.37 14170.50 14195.00 14217.13 n.a.
Autos
APM Automotive 3.840 n.a. n.a. n.a. n.a. n.a. n.a. n.a. 0.240%
Delloyd Ventures n.a. n.a. n.a. n.a. n.a. n.a. n.a. n.a. 0.000%
MBM Resources 2.580 2.535 2.553 2.565 2.583 2.595 2.613 2.625 0.32%
Tan Chong 2.600 2.540 2.565 2.580 2.605 2.620 2.645 2.660 0.542%
UMW 8.000 7.790 7.850 7.930 7.990 8.070 8.130 8.210 2.984%
Building Materials Ann Joo Resource 0.675 0.668 0.669 0.673 0.674 0.678 0.679 0.683 0.108%
Alum Co of Malay 0.705 n.a. n.a. n.a. n.a. n.a. n.a. n.a. 0.030%
Choo Bee Metal 1.490 1.445 1.453 1.475 1.483 1.505 1.513 1.535 0.052%
CSC Steel 1.050 1.050 1.050 1.050 1.050 1.050 1.050 1.050 0.124%
Eksons Corp 1.230 1.155 1.188 1.205 1.238 1.255 1.288 1.305 0.063%
Engtex Group 1.190 1.160 1.165 1.180 1.185 1.200 1.205 1.220 0.112%
Goh Ban Huat 1.380 1.380 1.380 1.380 1.380 1.380 1.380 1.380 0.082%
Hiap Teck 0.260 0.230 0.238 0.250 0.258 0.270 0.278 0.290 0.059%
Jaks Resources 1.170 1.140 1.150 1.160 1.170 1.180 1.190 1.200 0.164%
Java 0.215 0.215 0.215 0.215 0.215 0.215 0.215 0.215 0.012%
Kim Hin Ind 2.260 2.140 2.195 2.220 2.275 2.300 2.355 2.380 0.101%
Kinsteel 0.105 0.098 0.101 0.103 0.106 0.108 0.111 0.113 0.035%
Lafarge M Cement 9.050 8.870 8.940 8.990 9.060 9.110 9.180 9.230 2.455%
Lion Corp 0.045 0.038 0.039 0.043 0.044 0.048 0.049 0.053 0.019%
Lion Industries 0.290 0.283 0.284 0.288 0.289 0.293 0.294 0.298 0.065%
Malaysia Smelting 2.500 2.425 2.438 2.475 2.488 2.525 2.538 2.575 0.080%
Masteel 0.365 0.343 0.346 0.358 0.361 0.373 0.376 0.388 0.028%
Melewar Ind 0.220 0.220 0.220 0.220 0.220 0.220 0.220 0.220 0.016%
MTD ACPI 0.220 0.220 0.220 0.220 0.220 0.220 0.220 0.220 0.016% Pantech 0.625 0.618 0.619 0.623 0.624 0.628 0.629 0.633 0.122%
Perwaja 0.100 0.093 0.096 0.098 0.101 0.103 0.106 0.108 0.018%
Press Metal 2.120 2.030 2.070 2.090 2.130 2.150 2.190 2.210 0.879%
Southern Steel 0.800 0.800 0.800 0.800 0.800 0.800 0.800 0.800 0.107%
Tasek 14.400 14.340 14.350 14.380 14.390 14.420 14.430 14.460 0.557%
Tong Herr 1.880 1.850 1.855 1.870 1.875 1.890 1.895 1.910 0.075%
Conglomerates
Cahya Mata Sarawak 5.280 5.130 5.165 5.230 5.265 5.330 5.365 5.430 1.811% Lion Diversified 0.075 0.068 0.069 0.073 0.074 0.078 0.079 0.083 0.033%
Hap Seng Cons 6.480 6.030 6.105 6.330 6.405 6.630 6.705 6.930 4.465%
MMC 2.000 1.940 1.965 1.980 2.005 2.020 2.045 2.060 1.94%
Sime Darby 7.710 7.545 7.628 7.655 7.738 7.765 7.848 7.875 15.289%
YTL Corp 1.540 1.525 1.528 1.535 1.538 1.545 1.548 1.555 5.122%
Construction
AZRB 0.645 0.630 0.635 0.640 0.645 0.650 0.655 0.660 0.099%
Ekovest 1.060 0.940 0.965 1.020 1.045 1.100 1.125 1.180 0.289%
Fajar Baru 0.525 0.488 0.499 0.513 0.524 0.538 0.549 0.563 0.055%
Favelle Favco 2.550 2.430 2.475 2.510 2.555 2.590 2.635 2.670 0.178%
Gamuda 4.670 4.610 4.635 4.650 4.675 4.690 4.715 4.730 3.587%
Hock Seng Lee 1.890 1.845 1.868 1.875 1.898 1.905 1.928 1.935 0.332%
IJM Corp 3.420 3.315 3.338 3.385 3.408 3.455 3.478 3.525 3.901%
Kimlun 1.380 1.365 1.373 1.375 1.383 1.385 1.393 1.395 0.132%
KKB Engineer 1.620 1.590 1.605 1.610 1.625 1.630 1.645 1.650 0.133%
MRCB 1.260 1.245 1.253 1.255 1.263 1.265 1.273 1.275 0.719%
www.bimbsec.com.my | 7
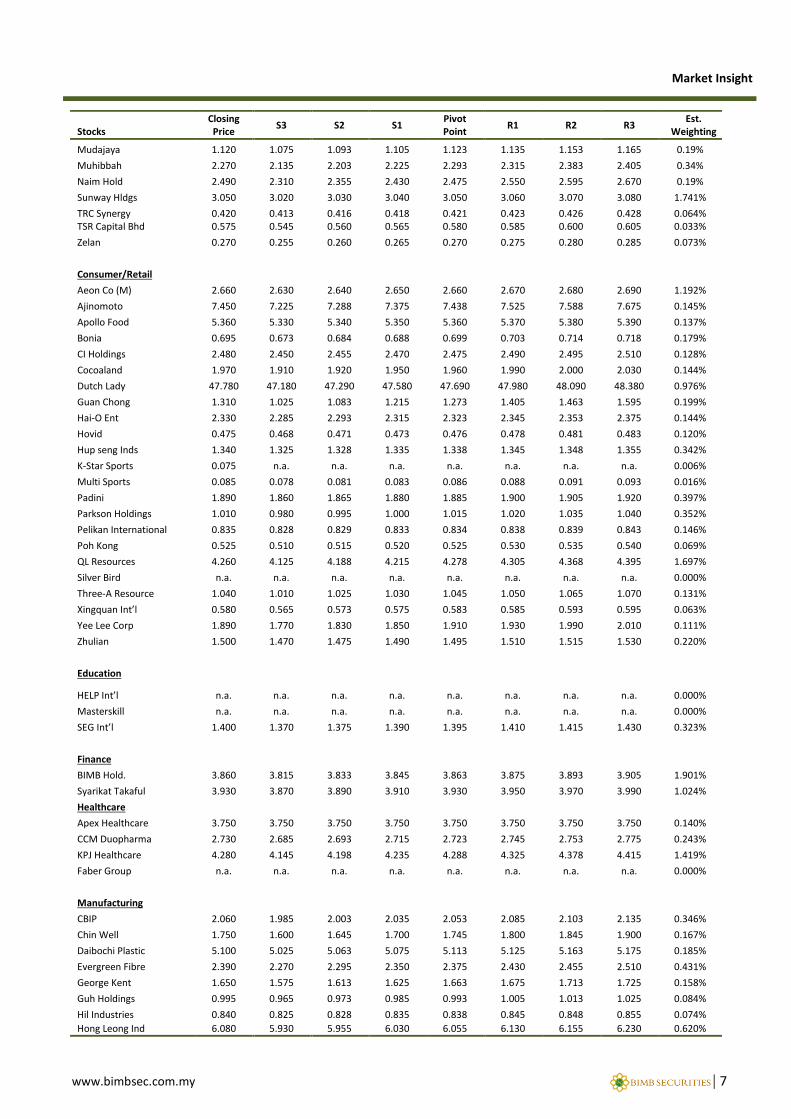
Market Insight
Stocks Closing Price
S3 S2 S1 Pivot Point
R1 R2 R3 Est.
Weighting
Mudajaya 1.120 1.075 1.093 1.105 1.123 1.135 1.153 1.165 0.19%
Muhibbah 2.270 2.135 2.203 2.225 2.293 2.315 2.383 2.405 0.34%
Naim Hold 2.490 2.310 2.355 2.430 2.475 2.550 2.595 2.670 0.19%
Sunway Hldgs 3.050 3.020 3.030 3.040 3.050 3.060 3.070 3.080 1.741%
TRC Synergy 0.420 0.413 0.416 0.418 0.421 0.423 0.426 0.428 0.064% TSR Capital Bhd 0.575 0.545 0.560 0.565 0.580 0.585 0.600 0.605 0.033%
Zelan 0.270 0.255 0.260 0.265 0.270 0.275 0.280 0.285 0.073%
Consumer/Retail
Aeon Co (M) 2.660 2.630 2.640 2.650 2.660 2.670 2.680 2.690 1.192%
Ajinomoto 7.450 7.225 7.288 7.375 7.438 7.525 7.588 7.675 0.145%
Apollo Food 5.360 5.330 5.340 5.350 5.360 5.370 5.380 5.390 0.137%
Bonia 0.695 0.673 0.684 0.688 0.699 0.703 0.714 0.718 0.179%
CI Holdings 2.480 2.450 2.455 2.470 2.475 2.490 2.495 2.510 0.128%
Cocoaland 1.970 1.910 1.920 1.950 1.960 1.990 2.000 2.030 0.144%
Dutch Lady 47.780 47.180 47.290 47.580 47.690 47.980 48.090 48.380 0.976%
Guan Chong 1.310 1.025 1.083 1.215 1.273 1.405 1.463 1.595 0.199%
Hai-O Ent 2.330 2.285 2.293 2.315 2.323 2.345 2.353 2.375 0.144%
Hovid 0.475 0.468 0.471 0.473 0.476 0.478 0.481 0.483 0.120%
Hup seng Inds 1.340 1.325 1.328 1.335 1.338 1.345 1.348 1.355 0.342%
K-Star Sports 0.075 n.a. n.a. n.a. n.a. n.a. n.a. n.a. 0.006%
Multi Sports 0.085 0.078 0.081 0.083 0.086 0.088 0.091 0.093 0.016%
Padini 1.890 1.860 1.865 1.880 1.885 1.900 1.905 1.920 0.397%
Parkson Holdings 1.010 0.980 0.995 1.000 1.015 1.020 1.035 1.040 0.352%
Pelikan International 0.835 0.828 0.829 0.833 0.834 0.838 0.839 0.843 0.146%
Poh Kong 0.525 0.510 0.515 0.520 0.525 0.530 0.535 0.540 0.069%
QL Resources 4.260 4.125 4.188 4.215 4.278 4.305 4.368 4.395 1.697%
Silver Bird n.a. n.a. n.a. n.a. n.a. n.a. n.a. n.a. 0.000%
Three-A Resource 1.040 1.010 1.025 1.030 1.045 1.050 1.065 1.070 0.131%
Xingquan Int’l 0.580 0.565 0.573 0.575 0.583 0.585 0.593 0.595 0.063%
Yee Lee Corp 1.890 1.770 1.830 1.850 1.910 1.930 1.990 2.010 0.111%
Zhulian 1.500 1.470 1.475 1.490 1.495 1.510 1.515 1.530 0.220%
Education
HELP Int’l n.a. n.a. n.a. n.a. n.a. n.a. n.a. n.a. 0.000%
Masterskill n.a. n.a. n.a. n.a. n.a. n.a. n.a. n.a. 0.000%
SEG Int’l 1.400 1.370 1.375 1.390 1.395 1.410 1.415 1.430 0.323%
Finance
BIMB Hold. 3.860 3.815 3.833 3.845 3.863 3.875 3.893 3.905 1.901%
Syarikat Takaful 3.930 3.870 3.890 3.910 3.930 3.950 3.970 3.990 1.024%
Healthcare
Apex Healthcare 3.750 3.750 3.750 3.750 3.750 3.750 3.750 3.750 0.140%
CCM Duopharma 2.730 2.685 2.693 2.715 2.723 2.745 2.753 2.775 0.243%
KPJ Healthcare 4.280 4.145 4.198 4.235 4.288 4.325 4.378 4.415 1.419%
Faber Group n.a. n.a. n.a. n.a. n.a. n.a. n.a. n.a. 0.000%
Manufacturing
CBIP 2.060 1.985 2.003 2.035 2.053 2.085 2.103 2.135 0.346%
Chin Well 1.750 1.600 1.645 1.700 1.745 1.800 1.845 1.900 0.167%
Daibochi Plastic 5.100 5.025 5.063 5.075 5.113 5.125 5.163 5.175 0.185%
Evergreen Fibre 2.390 2.270 2.295 2.350 2.375 2.430 2.455 2.510 0.431%
George Kent 1.650 1.575 1.613 1.625 1.663 1.675 1.713 1.725 0.158%
Guh Holdings 0.995 0.965 0.973 0.985 0.993 1.005 1.013 1.025 0.084%
Hil Industries 0.840 0.825 0.828 0.835 0.838 0.845 0.848 0.855 0.074%
Hong Leong Ind 6.080 5.930 5.955 6.030 6.055 6.130 6.155 6.230 0.620%
www.bimbsec.com.my | 8
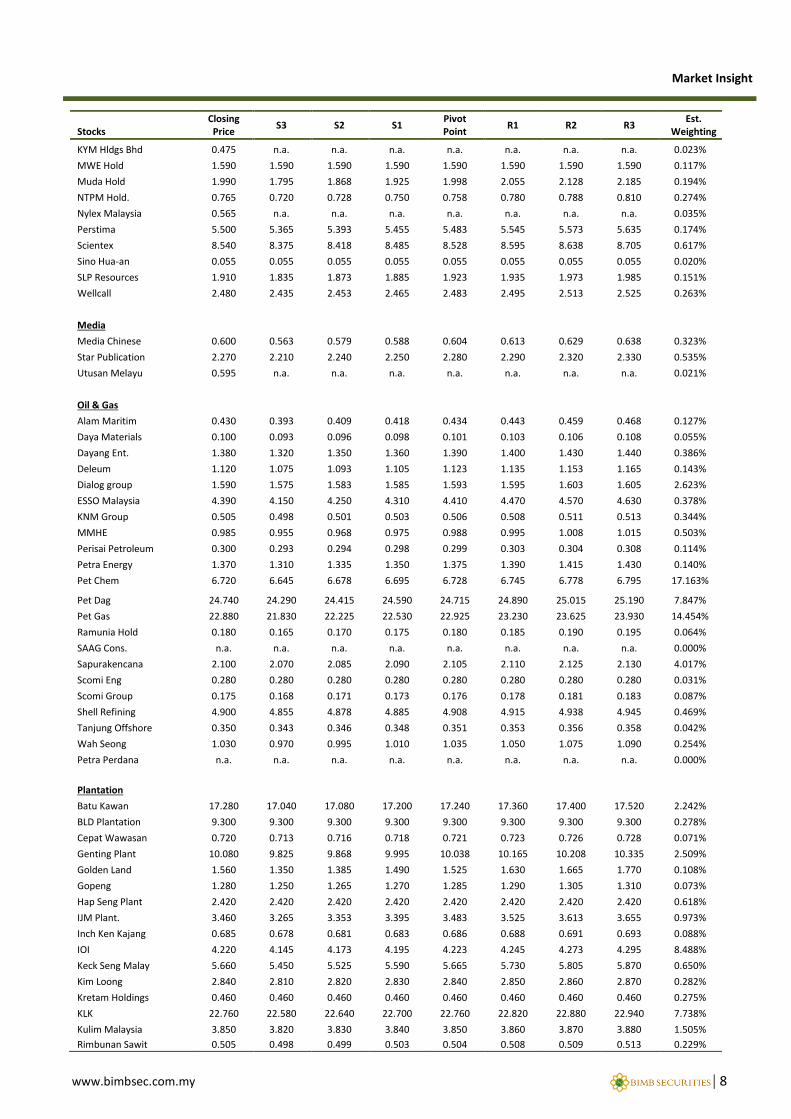
Market Insight
Stocks Closing Price
S3 S2 S1 Pivot Point
R1 R2 R3 Est.
Weighting
KYM Hldgs Bhd 0.475 n.a. n.a. n.a. n.a. n.a. n.a. n.a. 0.023%
MWE Hold 1.590 1.590 1.590 1.590 1.590 1.590 1.590 1.590 0.117%
Muda Hold 1.990 1.795 1.868 1.925 1.998 2.055 2.128 2.185 0.194%
NTPM Hold. 0.765 0.720 0.728 0.750 0.758 0.780 0.788 0.810 0.274%
Nylex Malaysia 0.565 n.a. n.a. n.a. n.a. n.a. n.a. n.a. 0.035%
Perstima 5.500 5.365 5.393 5.455 5.483 5.545 5.573 5.635 0.174%
Scientex 8.540 8.375 8.418 8.485 8.528 8.595 8.638 8.705 0.617%
Sino Hua-an 0.055 0.055 0.055 0.055 0.055 0.055 0.055 0.055 0.020%
SLP Resources 1.910 1.835 1.873 1.885 1.923 1.935 1.973 1.985 0.151%
Wellcall 2.480 2.435 2.453 2.465 2.483 2.495 2.513 2.525 0.263%
Media
Media Chinese 0.600 0.563 0.579 0.588 0.604 0.613 0.629 0.638 0.323%
Star Publication 2.270 2.210 2.240 2.250 2.280 2.290 2.320 2.330 0.535%
Utusan Melayu 0.595 n.a. n.a. n.a. n.a. n.a. n.a. n.a. 0.021%
Oil & Gas
Alam Maritim 0.430 0.393 0.409 0.418 0.434 0.443 0.459 0.468 0.127%
Daya Materials 0.100 0.093 0.096 0.098 0.101 0.103 0.106 0.108 0.055%
Dayang Ent. 1.380 1.320 1.350 1.360 1.390 1.400 1.430 1.440 0.386%
Deleum 1.120 1.075 1.093 1.105 1.123 1.135 1.153 1.165 0.143%
Dialog group 1.590 1.575 1.583 1.585 1.593 1.595 1.603 1.605 2.623%
ESSO Malaysia 4.390 4.150 4.250 4.310 4.410 4.470 4.570 4.630 0.378%
KNM Group 0.505 0.498 0.501 0.503 0.506 0.508 0.511 0.513 0.344%
MMHE 0.985 0.955 0.968 0.975 0.988 0.995 1.008 1.015 0.503%
Perisai Petroleum 0.300 0.293 0.294 0.298 0.299 0.303 0.304 0.308 0.114%
Petra Energy 1.370 1.310 1.335 1.350 1.375 1.390 1.415 1.430 0.140%
Pet Chem 6.720 6.645 6.678 6.695 6.728 6.745 6.778 6.795 17.163%
Pet Dag 24.740 24.290 24.415 24.590 24.715 24.890 25.015 25.190 7.847%
Pet Gas 22.880 21.830 22.225 22.530 22.925 23.230 23.625 23.930 14.454%
Ramunia Hold 0.180 0.165 0.170 0.175 0.180 0.185 0.190 0.195 0.064%
SAAG Cons. n.a. n.a. n.a. n.a. n.a. n.a. n.a. n.a. 0.000%
Sapurakencana 2.100 2.070 2.085 2.090 2.105 2.110 2.125 2.130 4.017%
Scomi Eng 0.280 0.280 0.280 0.280 0.280 0.280 0.280 0.280 0.031%
Scomi Group 0.175 0.168 0.171 0.173 0.176 0.178 0.181 0.183 0.087%
Shell Refining 4.900 4.855 4.878 4.885 4.908 4.915 4.938 4.945 0.469%
Tanjung Offshore 0.350 0.343 0.346 0.348 0.351 0.353 0.356 0.358 0.042%
Wah Seong 1.030 0.970 0.995 1.010 1.035 1.050 1.075 1.090 0.254%
Petra Perdana n.a. n.a. n.a. n.a. n.a. n.a. n.a. n.a. 0.000%
Plantation
Batu Kawan 17.280 17.040 17.080 17.200 17.240 17.360 17.400 17.520 2.242%
BLD Plantation 9.300 9.300 9.300 9.300 9.300 9.300 9.300 9.300 0.278%
Cepat Wawasan 0.720 0.713 0.716 0.718 0.721 0.723 0.726 0.728 0.071%
Genting Plant 10.080 9.825 9.868 9.995 10.038 10.165 10.208 10.335 2.509%
Golden Land 1.560 1.350 1.385 1.490 1.525 1.630 1.665 1.770 0.108%
Gopeng 1.280 1.250 1.265 1.270 1.285 1.290 1.305 1.310 0.073%
Hap Seng Plant 2.420 2.420 2.420 2.420 2.420 2.420 2.420 2.420 0.618%
IJM Plant. 3.460 3.265 3.353 3.395 3.483 3.525 3.613 3.655 0.973%
Inch Ken Kajang 0.685 0.678 0.681 0.683 0.686 0.688 0.691 0.693 0.088%
IOI 4.220 4.145 4.173 4.195 4.223 4.245 4.273 4.295 8.488%
Keck Seng Malay 5.660 5.450 5.525 5.590 5.665 5.730 5.805 5.870 0.650%
Kim Loong 2.840 2.810 2.820 2.830 2.840 2.850 2.860 2.870 0.282%
Kretam Holdings 0.460 0.460 0.460 0.460 0.460 0.460 0.460 0.460 0.275%
KLK 22.760 22.580 22.640 22.700 22.760 22.820 22.880 22.940 7.738%
Kulim Malaysia 3.850 3.820 3.830 3.840 3.850 3.860 3.870 3.880 1.505%
Rimbunan Sawit 0.505 0.498 0.499 0.503 0.504 0.508 0.509 0.513 0.229%
www.bimbsec.com.my | 9
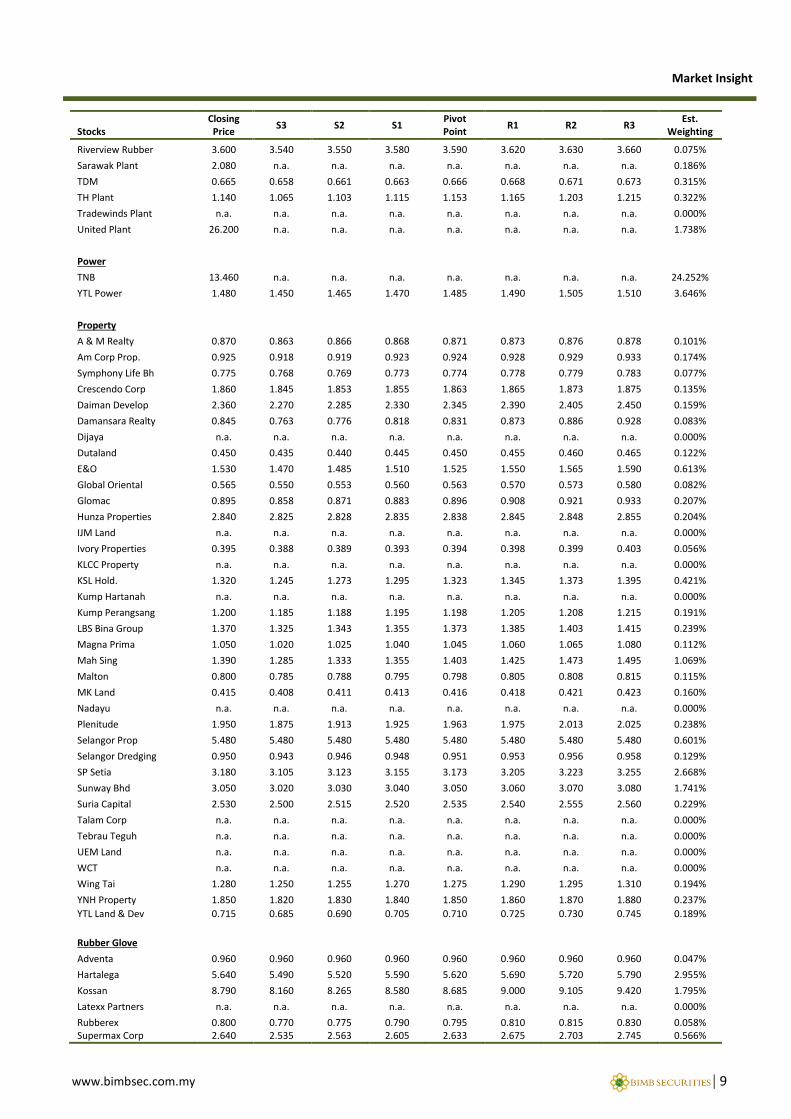
Market Insight
Stocks Closing Price
S3 S2 S1 Pivot Point
R1 R2 R3 Est.
Weighting
Riverview Rubber 3.600 3.540 3.550 3.580 3.590 3.620 3.630 3.660 0.075%
Sarawak Plant 2.080 n.a. n.a. n.a. n.a. n.a. n.a. n.a. 0.186%
TDM 0.665 0.658 0.661 0.663 0.666 0.668 0.671 0.673 0.315%
TH Plant 1.140 1.065 1.103 1.115 1.153 1.165 1.203 1.215 0.322%
Tradewinds Plant n.a. n.a. n.a. n.a. n.a. n.a. n.a. n.a. 0.000%
United Plant 26.200 n.a. n.a. n.a. n.a. n.a. n.a. n.a. 1.738%
Power
TNB 13.460 n.a. n.a. n.a. n.a. n.a. n.a. n.a. 24.252%
YTL Power 1.480 1.450 1.465 1.470 1.485 1.490 1.505 1.510 3.646%
Property
A & M Realty 0.870 0.863 0.866 0.868 0.871 0.873 0.876 0.878 0.101%
Am Corp Prop. 0.925 0.918 0.919 0.923 0.924 0.928 0.929 0.933 0.174%
Symphony Life Bh 0.775 0.768 0.769 0.773 0.774 0.778 0.779 0.783 0.077%
Crescendo Corp 1.860 1.845 1.853 1.855 1.863 1.865 1.873 1.875 0.135%
Daiman Develop 2.360 2.270 2.285 2.330 2.345 2.390 2.405 2.450 0.159%
Damansara Realty 0.845 0.763 0.776 0.818 0.831 0.873 0.886 0.928 0.083%
Dijaya n.a. n.a. n.a. n.a. n.a. n.a. n.a. n.a. 0.000%
Dutaland 0.450 0.435 0.440 0.445 0.450 0.455 0.460 0.465 0.122%
E&O 1.530 1.470 1.485 1.510 1.525 1.550 1.565 1.590 0.613%
Global Oriental 0.565 0.550 0.553 0.560 0.563 0.570 0.573 0.580 0.082%
Glomac 0.895 0.858 0.871 0.883 0.896 0.908 0.921 0.933 0.207%
Hunza Properties 2.840 2.825 2.828 2.835 2.838 2.845 2.848 2.855 0.204%
IJM Land n.a. n.a. n.a. n.a. n.a. n.a. n.a. n.a. 0.000%
Ivory Properties 0.395 0.388 0.389 0.393 0.394 0.398 0.399 0.403 0.056%
KLCC Property n.a. n.a. n.a. n.a. n.a. n.a. n.a. n.a. 0.000%
KSL Hold. 1.320 1.245 1.273 1.295 1.323 1.345 1.373 1.395 0.421%
Kump Hartanah n.a. n.a. n.a. n.a. n.a. n.a. n.a. n.a. 0.000%
Kump Perangsang 1.200 1.185 1.188 1.195 1.198 1.205 1.208 1.215 0.191%
LBS Bina Group 1.370 1.325 1.343 1.355 1.373 1.385 1.403 1.415 0.239%
Magna Prima 1.050 1.020 1.025 1.040 1.045 1.060 1.065 1.080 0.112%
Mah Sing 1.390 1.285 1.333 1.355 1.403 1.425 1.473 1.495 1.069%
Malton 0.800 0.785 0.788 0.795 0.798 0.805 0.808 0.815 0.115%
MK Land 0.415 0.408 0.411 0.413 0.416 0.418 0.421 0.423 0.160%
Nadayu n.a. n.a. n.a. n.a. n.a. n.a. n.a. n.a. 0.000%
Plenitude 1.950 1.875 1.913 1.925 1.963 1.975 2.013 2.025 0.238%
Selangor Prop 5.480 5.480 5.480 5.480 5.480 5.480 5.480 5.480 0.601%
Selangor Dredging 0.950 0.943 0.946 0.948 0.951 0.953 0.956 0.958 0.129%
SP Setia 3.180 3.105 3.123 3.155 3.173 3.205 3.223 3.255 2.668%
Sunway Bhd 3.050 3.020 3.030 3.040 3.050 3.060 3.070 3.080 1.741%
Suria Capital 2.530 2.500 2.515 2.520 2.535 2.540 2.555 2.560 0.229%
Talam Corp n.a. n.a. n.a. n.a. n.a. n.a. n.a. n.a. 0.000%
Tebrau Teguh n.a. n.a. n.a. n.a. n.a. n.a. n.a. n.a. 0.000%
UEM Land n.a. n.a. n.a. n.a. n.a. n.a. n.a. n.a. 0.000%
WCT n.a. n.a. n.a. n.a. n.a. n.a. n.a. n.a. 0.000%
Wing Tai 1.280 1.250 1.255 1.270 1.275 1.290 1.295 1.310 0.194%
YNH Property 1.850 1.820 1.830 1.840 1.850 1.860 1.870 1.880 0.237%
YTL Land & Dev 0.715 0.685 0.690 0.705 0.710 0.725 0.730 0.745 0.189%
Rubber Glove
Adventa 0.960 0.960 0.960 0.960 0.960 0.960 0.960 0.960 0.047%
Hartalega 5.640 5.490 5.520 5.590 5.620 5.690 5.720 5.790 2.955%
Kossan 8.790 8.160 8.265 8.580 8.685 9.000 9.105 9.420 1.795%
Latexx Partners n.a. n.a. n.a. n.a. n.a. n.a. n.a. n.a. 0.000%
Rubberex 0.800 0.770 0.775 0.790 0.795 0.810 0.815 0.830 0.058% Supermax Corp 2.640 2.535 2.563 2.605 2.633 2.675 2.703 2.745 0.566%
www.bimbsec.com.my | 10
Market Insight
Stocks Closing Price
S3 S2 S1 Pivot Point
R1 R2 R3 Est.
Weighting
Top Glove 11.000 10.490 10.675 10.830 11.015 11.170 11.355 11.510 2.180%
Technology
Compugates 0.045 0.045 0.045 0.045 0.045 0.045 0.045 0.045 0.031%
D&O Green Tech 0.380 0.358 0.364 0.373 0.379 0.388 0.394 0.403 0.119%
ETI Tech n.a. n.a. n.a. n.a. n.a. n.a. n.a. n.a. 0.000%
Formis Resources n.a. n.a. n.a. n.a. n.a. n.a. n.a. n.a. 0.000%
Formosa Prosonic 0.900 0.855 0.863 0.885 0.893 0.915 0.923 0.945 0.071%
Frontken 0.210 0.188 0.199 0.203 0.214 0.218 0.229 0.233 0.070%
Globetronics 6.500 6.260 6.310 6.420 6.470 6.580 6.630 6.740 0.585%
JCY Int’l 0.870 0.840 0.855 0.860 0.875 0.880 0.895 0.900 0.572%
Key Asic 0.120 0.105 0.113 0.115 0.123 0.125 0.133 0.135 0.032%
MPI 8.630 8.270 8.365 8.510 8.605 8.750 8.845 8.990 0.548%
Notion V-Tec 0.370 0.363 0.366 0.368 0.371 0.373 0.376 0.378 0.032%
Panasonic Man 24.300 23.550 23.775 24.050 24.275 24.550 24.775 25.050 0.471%
Supportive n.a. n.a. n.a. n.a. n.a. n.a. n.a. n.a. 0.000%
Symphony House n.a. n.a. n.a. n.a. n.a. n.a. n.a. n.a. 0.000%
Uchi Tech Bhd 1.720 1.705 1.713 1.715 1.723 1.725 1.733 1.735 0.212%
Unisem 2.500 2.260 2.300 2.420 2.460 2.580 2.620 2.740 0.586%
VS Industry 1.520 1.475 1.493 1.505 1.523 1.535 1.553 1.565 0.564%
Telcos
Axiata Group 6.090 6.030 6.045 6.070 6.085 6.110 6.125 6.150 17.141%
DiGi.Com 5.100 4.995 5.023 5.065 5.093 5.135 5.163 5.205 12.659%
Green Packet 0.285 0.263 0.269 0.278 0.284 0.293 0.299 0.308 0.062%
Maxis 6.610 6.535 6.558 6.585 6.608 6.635 6.658 6.685 15.848%
Telekom Malaysia 6.600 6.465 6.493 6.555 6.583 6.645 6.673 6.735 7.918%
Time Dotcom 7.020 6.960 6.975 7.000 7.015 7.040 7.055 7.080 1.290%
Timber
Jaya Tiasa 1.190 1.145 1.158 1.175 1.188 1.205 1.218 1.235 0.368%
Subur Tiasa 1.990 1.780 1.815 1.920 1.955 2.060 2.095 2.200 0.120%
WTK 1.220 1.145 1.158 1.195 1.208 1.245 1.258 1.295 0.186%
Transport/Logistics
Bintulu Port 7.200 n.a. n.a. n.a. n.a. n.a. n.a. n.a. 1.057%
Airasia 1.380 1.320 1.345 1.360 1.385 1.400 1.425 1.440 1.226%
Century Logistic 0.800 0.785 0.790 0.795 0.800 0.805 0.810 0.815 0.095%
Cycle & Carriage 3.260 3.095 3.173 3.205 3.283 3.315 3.393 3.425 0.105%
Hubline 0.010 0.003 0.006 0.008 0.011 0.013 0.016 0.018 0.031%
Integrated Log. 0.805 0.798 0.799 0.803 0.804 0.808 0.809 0.813 0.044%
Integrax n.a. n.a. n.a. n.a. n.a. n.a. n.a. n.a. 0.000%
Konsortium n.a. n.a. n.a. n.a. n.a. n.a. n.a. n.a. 0.000%
Maybulk 0.785 0.755 0.768 0.775 0.788 0.795 0.808 0.815 0.251%
MISC 9.240 9.180 9.200 9.220 9.240 9.260 9.280 9.300 13.168%
NCB Hold 4.370 4.370 4.370 4.370 4.370 4.370 4.370 4.370 0.656%
Scomi Energy Ser 0.245 0.238 0.241 0.243 0.246 0.248 0.251 0.253 0.183%
Water & Infrastructure
PBA Hold 1.260 1.230 1.240 1.250 1.260 1.270 1.280 1.290 0.133%
Puncak Niaga 1.570 1.480 1.505 1.540 1.565 1.600 1.625 1.660 0.224%
Salcon 0.615 0.600 0.608 0.610 0.618 0.620 0.628 0.630 0.132%
Taliworks Corp n.a. n.a. n.a. n.a. n.a. n.a. n.a. n.a. 0.000%
Lingkaran Trans 5.150 n.a. n.a. n.a. n.a. n.a. n.a. n.a. 0.858%
Protasco 1.580 1.520 1.545 1.560 1.585 1.600 1.625 1.640 0.169%
www.bimbsec.com.my | 11
Market Insight
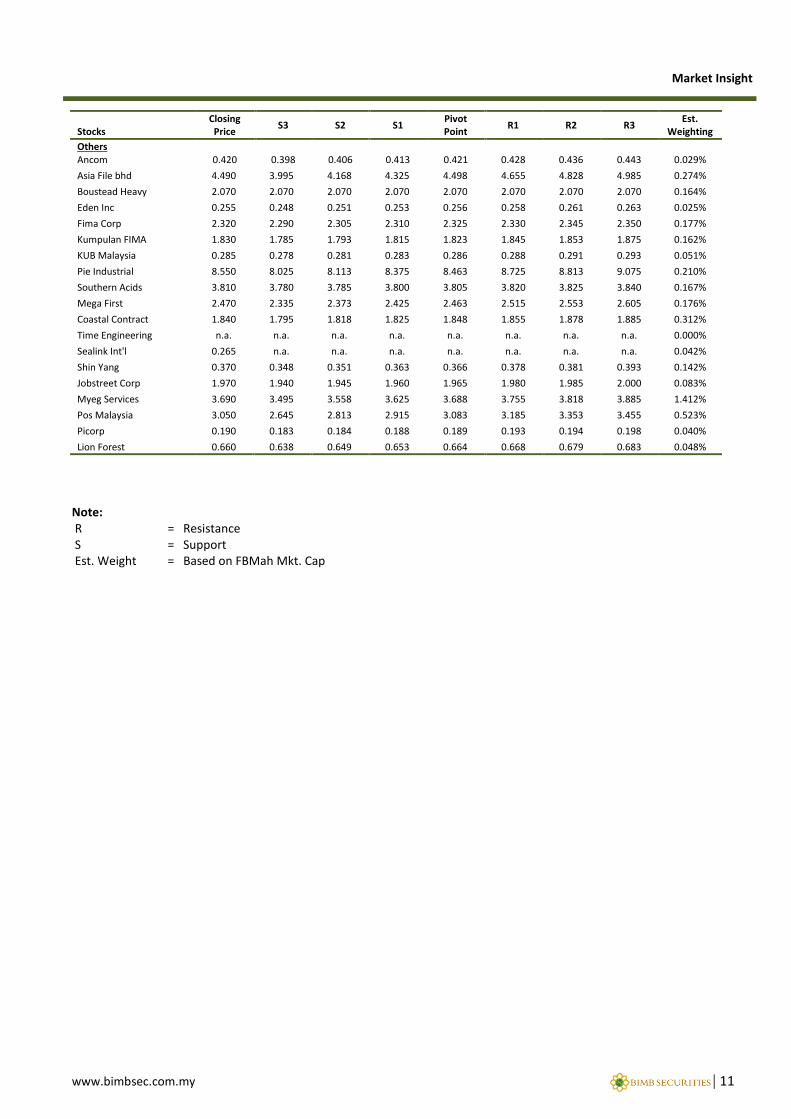
Note: R = Resistance S = Support Est. Weight = Based on FBMah Mkt. Cap
Stocks Closing Price
S3 S2 S1 Pivot Point
R1 R2 R3 Est.
Weighting
Others Ancom 0.420 0.398 0.406 0.413 0.421 0.428 0.436 0.443 0.029%
Asia File bhd 4.490 3.995 4.168 4.325 4.498 4.655 4.828 4.985 0.274%
Boustead Heavy 2.070 2.070 2.070 2.070 2.070 2.070 2.070 2.070 0.164%
Eden Inc 0.255 0.248 0.251 0.253 0.256 0.258 0.261 0.263 0.025%
Fima Corp 2.320 2.290 2.305 2.310 2.325 2.330 2.345 2.350 0.177%
Kumpulan FIMA 1.830 1.785 1.793 1.815 1.823 1.845 1.853 1.875 0.162%
KUB Malaysia 0.285 0.278 0.281 0.283 0.286 0.288 0.291 0.293 0.051%
Pie Industrial 8.550 8.025 8.113 8.375 8.463 8.725 8.813 9.075 0.210%
Southern Acids 3.810 3.780 3.785 3.800 3.805 3.820 3.825 3.840 0.167%
Mega First 2.470 2.335 2.373 2.425 2.463 2.515 2.553 2.605 0.176%
Coastal Contract 1.840 1.795 1.818 1.825 1.848 1.855 1.878 1.885 0.312%
Time Engineering n.a. n.a. n.a. n.a. n.a. n.a. n.a. n.a. 0.000%
Sealink Int'l 0.265 n.a. n.a. n.a. n.a. n.a. n.a. n.a. 0.042%
Shin Yang 0.370 0.348 0.351 0.363 0.366 0.378 0.381 0.393 0.142%
Jobstreet Corp 1.970 1.940 1.945 1.960 1.965 1.980 1.985 2.000 0.083%
Myeg Services 3.690 3.495 3.558 3.625 3.688 3.755 3.818 3.885 1.412%
Pos Malaysia 3.050 2.645 2.813 2.915 3.083 3.185 3.353 3.455 0.523%
Picorp 0.190 0.183 0.184 0.188 0.189 0.193 0.194 0.198 0.040%
Lion Forest 0.660 0.638 0.649 0.653 0.664 0.668 0.679 0.683 0.048%
www.bimbsec.com.my | 12
Market Insight
DEFINITION OF RATINGS BIMB Securities uses the following rating system: STOCK RECOMMENDATION BUY Total return (price appreciation plus dividend yield) is expected to exceed 10% in the next 12 months. TRADING BUY Share price may exceed 15% over the next 3 months, however longer-term outlook remains uncertain. HOLD Share price may fall within the range of +/- 10% over the next 12 months TAKE PROFIT Target price has been attained. Fundamentals remain intact. Look to accumulate at lower levels. TRADING SELL Share price may fall by more than 15% in the next 3 months. SELL Share price may fall by more than 10% over the next 12 months. NOT RATED Stock is not within regular research coverage. SECTOR RECOMMENDATION OVERWEIGHT The Industry as defined by the analyst’s coverage universe, is expected to outperform the relevant primary market
index over the next 12 months NEUTRAL The Industry as defined by the analyst’s coverage universe, is expected to perform in line with the relevant primary
market index over the next 12 months UNDERWEIGHT The Industry as defined by the analyst’s coverage universe, is expected to underperform the relevant primary
market index over the next 12 months Applicability of ratings The respective analyst maintains a coverage universe of stocks, the list of which may be adjusted according to needs. Investment ratings are only applicable to the stocks which form part of the coverage universe. Reports on companies which are not part of the coverage do not carry investment ratings as we do not actively follow developments in these companies. Disclaimer The investments discussed or recommended in this report may not be suitable for all investors. This report has been prepared for information purposes only and is not an offer to sell or a solicitation to buy any securities. The directors and employees of BIMB Securities Sdn Bhd may from time to time have a position in or either the securities mentioned herein. Members of the BIMB Group and their affiliates may provide services to any company and affiliates of such companies whose securities are mentioned herein. The information herein was obtained or derived from sources that we believe are reliable, but while all reasonable care has been taken to ensure that stated facts are accurate and opinions fair and reasonable, we do not represent that it is accurate or complete and it should not be relied upon as such. No liability can be accepted for any loss that may arise from the use of this report. All opinions and estimates included in this report constitute our judgements as of this date and are subject to change without notice. BIMB Securities Sdn Bhd accepts no liability for any direct, indirect or consequential loss arising from use of this report.
Published by
BIMB SECURITIES SB (290163-X) A Participating Organisation of Bursa Malaysia Securities Berhad Level 32, Menara Multi Purpose, Capital Square, No. 8 Jalan Munshi Abdullah, 50100 Kuala Lumpur Tel: 03-2691 8887, Fax: 03-2691 1262 Kenny Yee http://www.bimbsec.com.my Head of Research
The investments discussed or recommended in this report may not be suitable for all investors. This report has been prepared for information purposes only and is not an offer to sell or a solicitation to buy any securities. The directors and employees of BIMB Securities Sdn Bhd may from time to time have a position in or with the securities mentioned herein. Members of the BIMB Group and their affiliates may provide services to any company and affiliates of such companies whose securities are mentioned herein. The information herein was obtained or derived from sources that we believe are reliable, but while all reasonable care has been taken to ensure that stated facts are accurate and opinions fair and reasonable, we do not represent that it is accurate or complete and it should not be relied upon as such. No liability can be accepted for any loss that may arise from the use of this report. All opin-ions and estimates included in this report constitute our judgement as of this date and are subject to change without notice..
The investments discussed or recommended in this report may not be suitable for all investors. This report has been prepared for information purposes only and is not an offer to sell or a solicitation to buy any securities. The directors and employees of BIMB Securities Sdn Bhd may from time to time have a position in or with the securities mentioned herein. Members of the BIMB Group and their affiliates may provide services to any company and affiliates of such companies whose securities are mentioned herein. The information herein was obtained or derived from sources that we believe are reliable, but while all reasonable care has been taken to ensure that stated facts are accurate and opinions fair and reasonable, we do not represent that it is accurate or complete and it should not be relied upon as such. No liability can be accepted for any loss that may arise from the use of this report. All opin-ions and estimates included in this report constitute our judgement as of this date and are subject to change without notice..
The investments discussed or recommended in this report may not be suitable for all investors. This report has been prepared for information purposes only and is not an offer to sell or a solicitation to buy any securities. The directors and employees of BIMB Securities Sdn Bhd may from time to time have a position in or with the securities mentioned herein. Members of the BIMB Group and their affiliates may provide services to any company and affiliates of such companies whose securities are mentioned herein. The information herein was obtained or derived from sources that we believe are reliable, but while all reasonable care has been taken to ensure that stated facts are accurate and opinions fair and reasonable, we do not represent that it is accurate or complete and it should not be relied upon as such. No liability can be accepted for any loss that may arise from the use of this report. All opin-ions and estimates included in this report constitute our judgement as of this date and are subject to change without notice..