bim and trends in construction | empowering you in a bim world
TRANSCRIPT

David BainResearch Manager, RIBA Enterprises
BIM and Trends in the Construction Industry

Overview
• Where we are
• Challenges for the Industry
• BIM now and in the future
BIM and Trends in the Construction Industry

Where we are

Where we are
Q1 Q2 Q3 Q4 Q1 Q2 Q3 Q4 Q1 Q2 Q3 Q4 Q1 Q2 Q3 Q4 Q1 Q2 Q3 Q4 Q1 Q2 Q3 Q4 Q1 Q2 Q3 Q4 Q1 Q2 Q3 Q4 Q1 Q2 Q3 Q4 Q1 Q2 Q3 Q4 Q1 Q2 Q3 Q4 Q1 Q2 1997 1998 1999 2000 2001 2002 2003 2004 2005 2006 2007 2008
80.0
85.0
90.0
95.0
100.0
105.0
110.0
115.0
120.0
92.0
116.5
Construction Output in Great Britain - 1997 to 2008Source: ONS - Volume Seasonally Adjusted Index Numbers - 2011 = 100

Where we are
Construction Output in Great Britain - 2008 to 2016Source: ONS - Volume Seasonally Adjusted Index Numbers - 2011 = 100
Q1
Q2
Q3
Q4
Q1
Q2
Q3
Q4
Q1
Q2
Q3
Q4 Q1 Q2 Q3 Q4 Q1
Q2
Q3
Q4
Q1 Q2 Q3 Q4 Q1
Q2
Q3
Q4 Q1
Q2
Q3
Q4 Q1
2008 2009 2010 2011 2012 2013 2014 2015 2016
80.0
85.0
90.0
95.0
100.0
105.0
110.0
115.0
120.0116.5
111.1

Where we are
Construction Output in Great Britain
Q1
Q2
Q3
Q4
Q1
Q2
Q3
Q4
Q1
Q2
Q3
Q4
Q1
Q2
Q3
Q4
Q1
Q2
Q3
Q4
Q1
Q2
Q3
Q4
Q1
Q2
Q3
Q4
Q1
Q2
Q3
Q4
Q1
Q2
Q3
Q4
Q1
Q2
Q3
Q4
Q1
Q2
Q3
Q4
Q1
Q2
Q3
Q4
Q1
Q2
Q3
Q4
Q1
Q2
Q3
Q4 Q1 Q2 Q3 Q4 Q1
Q2
Q3
Q4
Q1 Q2 Q3 Q4 Q1
Q2
Q3
Q4 Q1
Q2
Q3
Q4 Q1
1997 1998 1999 2000 2001 2002 2003 2004 2005 2006 2007 2008 2009 2010 2011 2012 2013 2014 2015 2016
80
85
90
95
100
105
110
115
120

Where we are
GDP and sectoral output - 2008 to 2016Source ONS: GDP and main components
2008 Q
1
2008 Q
2
2008 Q
3
2008 Q
4
2009 Q
1
2009 Q
2
2009 Q
3
2009 Q
4
2010 Q
1
2010 Q
2
2010 Q
3
2010 Q
4
2011 Q
1
2011 Q
2
2011 Q
3
2011 Q
4
2012 Q
1
2012 Q
2
2012 Q
3
2012 Q
4
2013 Q
1
2013 Q
2
2013 Q
3
2013 Q
4
2014 Q
1
2014 Q
2
2014 Q
3
2014 Q
4
2015 Q
1
2015 Q
2
2015 Q
3
2015 Q
4
2016 Q
1 80
85
90
95
100
105
110
115
Total
Services
Production
Construction
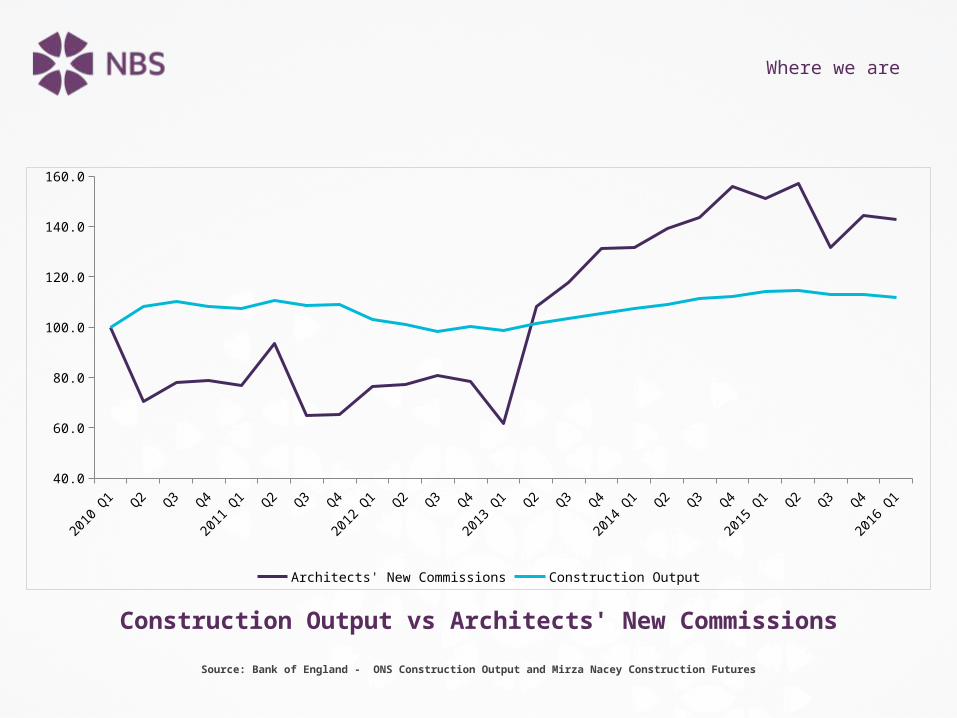
Where we are
Construction Output vs Architects' New CommissionsSource: Bank of England - ONS Construction Output and Mirza Nacey Construction Futures
2010 Q1
Q2 Q3 Q4 2011 Q1
Q2 Q3 Q4 2012 Q1
Q2 Q3 Q4 2013 Q1
Q2 Q3 Q4 2014 Q1
Q2 Q3 Q4 2015 Q1
Q2 Q3 Q4 2016 Q1
40.0
60.0
80.0
100.0
120.0
140.0
160.0
Architects' New Commissions Construction Output

Where we are
How do you expect your architectural workload to change over the next three months?
Source: RIBA Future Trends Survey April 2016
03-1005-10
07-1009-10
11-1001-11
03-1105-11
07-1109-11
11-1101-12
03-1205-12
07-1209-12
11-1201-13
03-1305-13
07-1309-13
11-1301-14
03-1405-14
07-1409-14
11-1401-15
03-1505-15
07-1509-15
11-1501-16
03-16-20
-10
0
10
20
30
40
50

Where we are
Output balance and architects' outlookSource: RIBA Future Trends Survey July 2015 & ONS
03-1005-10
07-1009-10
11-1001-11
03-1105-11
07-1109-11
11-1101-12
03-1205-12
07-1209-12
11-1201-13
03-1305-13
07-1309-13
11-1301-14
03-1405-14
07-1409-14
11-1401-15
03-1505-15
07-1509-15
11-1501-16
03-16
-20
-10
0
10
20
30
40
50
Balance Construction Output

Where we are
2014 2015 2016 2017 20180.0%1.0%2.0%3.0%4.0%5.0%6.0%7.0%8.0%
£M 115,000
£M 120,000
£M 125,000
£M 130,000
£M 135,000
£M 140,000
£M 145,0007.5%
3.4%
2.0%2.9% 2.6%
% change Value (£M)
Experian Construction output ForecastSource: Experian

Where we are
Architectural Services Balance of PaymentsSource: ONS
2008 2009 2010 2011 2012 2013 20140 £m
100 £m
200 £m
300 £m
400 £m
500 £m
600 £m
21 19 25 29 37
111 93
357
297
378 369 351
484440
Imports Exports

Urbanization & Globalization

Urbanisation - 1970
Urbanisation - UN ProjectionsSource: ONS
1950 1955 1960 1965 1970 1975 1980 1985 1990 1995 2000 2005 2010 2015 2020 2025 2030 2035 2040 2045 20500 B
1 B
2 B
3 B
4 B
5 B
6 B
7 B
8 B
9 B
10 B
0%
10%
20%
30%
40%
50%
60%
70%
Total World Population Urban Population % Urban

Urbanisation - 1970

Urbanisation - 2014

Urbanisation - 2030

So, in the 15 years between 2015 and 20301.2 billion people will need urban accommodation.
This works out as:
500 people per building 2.2M buildings250 people per building 4.4M buildings100 people per building 11M buildings10 people per building 110M buildings5 people per building 220M buildings
Urbanisation - 2030

Urbanisation – the reality

Urbanisation – the reality

Urbanisation – the reality

Urbanisation – the reality
BIM and Trends in the Construction Industry
• The world’s urban population has grown from 746m in 1950 to 4bn in 2015
• It’s projected to grow by 2.5bn by 2050, to 6.3bn in 2050 with nearly 90% of the increase concentrated in Asia and Africa
• India, China and Nigeria are expected to account for 37% of the projected growth
• India alone is projected to add 404m urban dwellers, China 292m and Nigeria 212m
• As the world continues to urbanize, sustainable development challenges will be concentrated in cities, particularly in the lower-middle-income countries where the pace of urbanization is fastest
• Integrated policies are needed to improve the lives of both urban and rural dwellers

BIM and Trends in the Construction Industry
2011 2012 2020 2025 2030 2035 20400
100200300400500600700800900
OECD Other China IndiaWorld energy consumption by region
(Quadrillion Btu)Source: International Energy Agency

BIM and Trends in the Construction Industry
Source: International Energy Agency

BIM and Trends in the Construction Industry
Buildings globally account for:
• 40 % of Primary energy use (50 % if we include embedded energy in manufacturing the materials used to construct them)
• 30-40 % of Final energy use (the energy delivered after loss in production and distribution of energy)
• In EU, 36 % of GHG emission comes from buildings
Source: World Business Council of Sustainable Development 2009

Building Information Modelling

"This Government's four year strategy for BIM implementation will change the dynamics and behaviours of the construction supply chain, unlocking new, more efficient and collaborative ways of working. This whole sector adoption of BIM will put us at the vanguard of a new digital construction era and position the UK to become the world leaders in BIM.“
Francis MaudeMinister for the Cabinet Office
UK Government strategy

UK Government strategy
Lower emissions50%Reduction in greenhouse gas emissions in the built environment.
Faster delivery50%Reduction in the overall time, from inception to completion, fornew build and refurbished assets.
Lower costs33%Reduction in the initial cost of construction and the whole life cost of built assets.
Improvement in exports50%Reduction in the trade gap between total Exports and total imports for constructionproducts and materials.
BIM and Trends in the Construction Industry
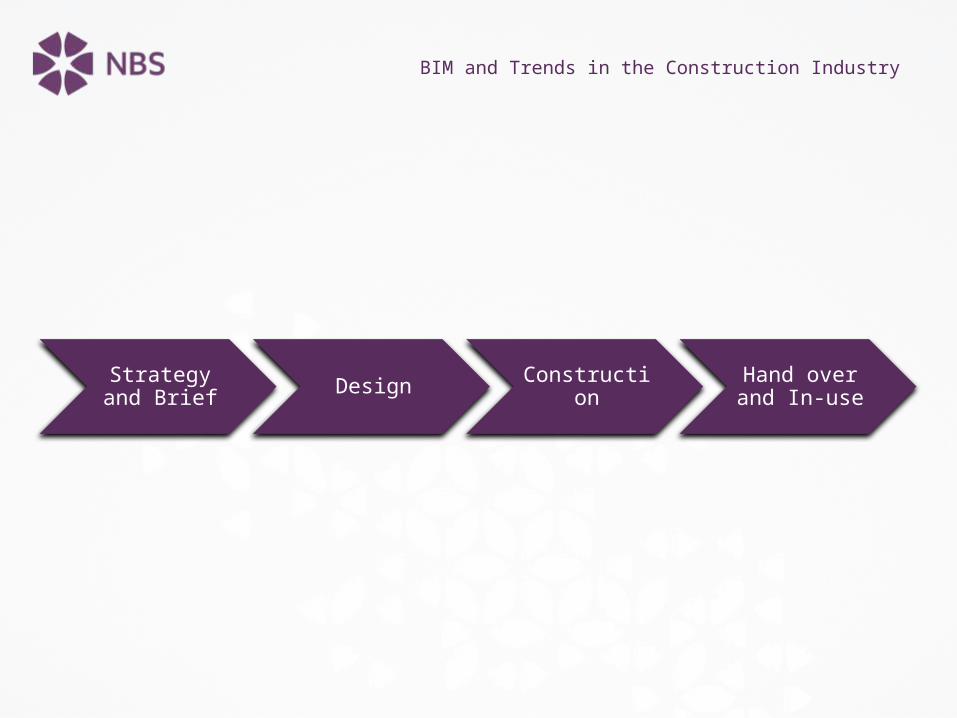
Strategy and Brief Design Constructio
nHand over and In-use

BIM and Trends in the Construction Industry
The scientific method "a method or procedure, consisting in systematic observation, measurement, and experiment, and the formulation, testing, and modification of hypotheses.”
HypothesisFormulation
Experiment Design
ExperimentObservation
and Measurement
Hypothesis modification
Strategy & Brief
Design
ConstructionHand over and in use
Learnings

BIM and Trends in the Construction Industry
NBS National BIM Report (2011-2016)
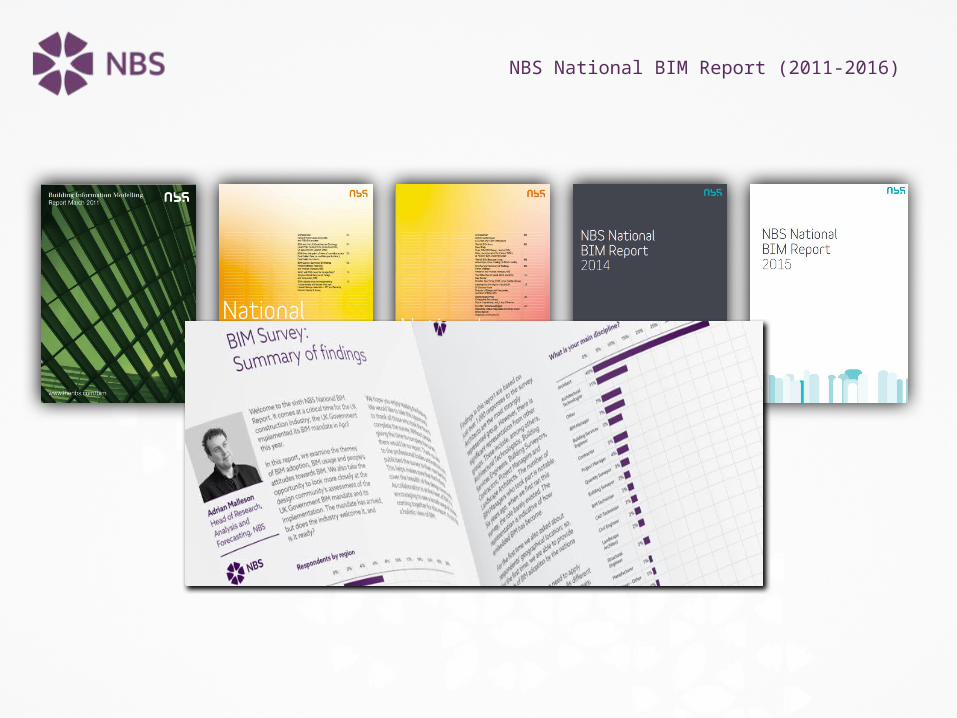
NBS National BIM Report (2011-2016)
NBS National BIM Report (2011-2016)

NBS National BIM Report (2011-2016)

NBS National BIM Report (2011-2016)

NBS National BIM Report (2011-2016)

NBS National BIM Report (2011-2016)

NBS National BIM Report (2011-2016)

NBS National BIM Report (2011-2016)

NBS National BIM Report (2011-2016)

NBS National BIM Report (2011-2016)

NBS National BIM Report (2011-2016)

NBS National BIM Report (2011-2016)

NBS National BIM Report (2011-2016)

NBS National BIM Report (2011-2016)

NBS National BIM Report (2011-2016)

NBS National BIM Report (2011-2016)