bike share webinar presentation july 2015 dr elliot fishman
TRANSCRIPT

Global Bike Share
Webinar – July 2015Dr Elliot Fishman
Institute for Sensible Transport
Outline• History of bike share• How usage varies between cities• Mode substitution – and why it’s important• Impacts• What motivates people to use bike share• Bike share gone wrong• Elements of success
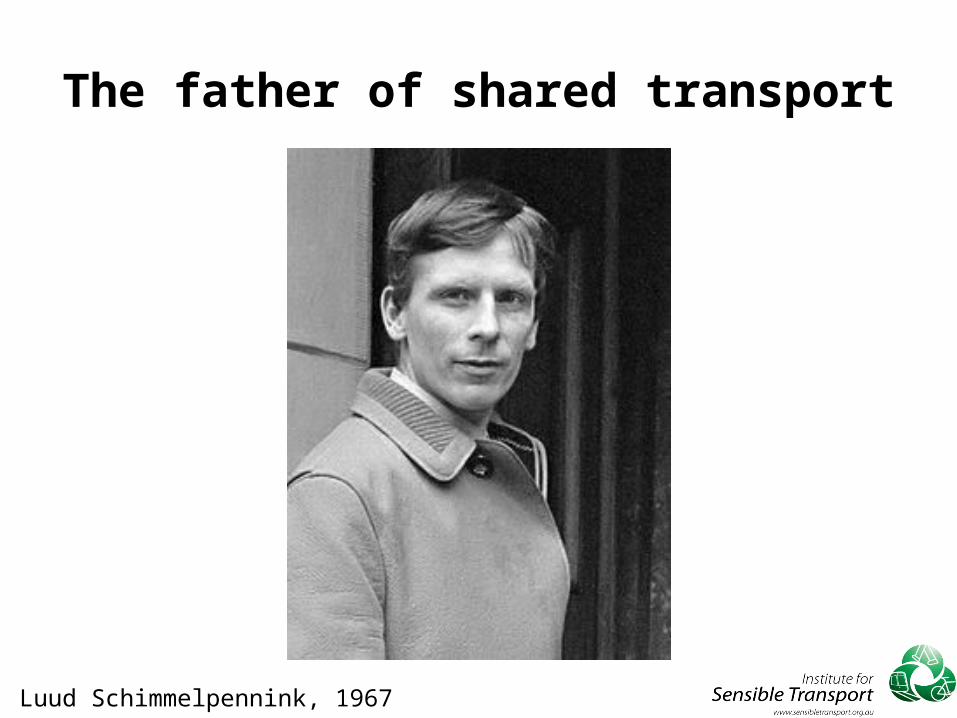
The father of shared transport
Luud Schimmelpennink, 1967

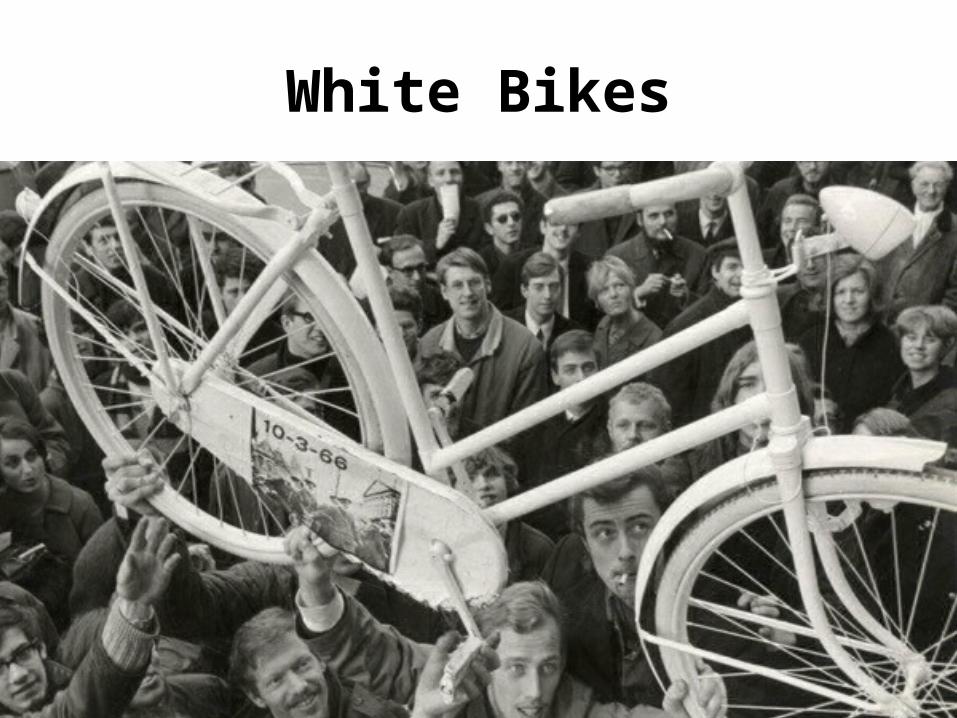
White Bikes
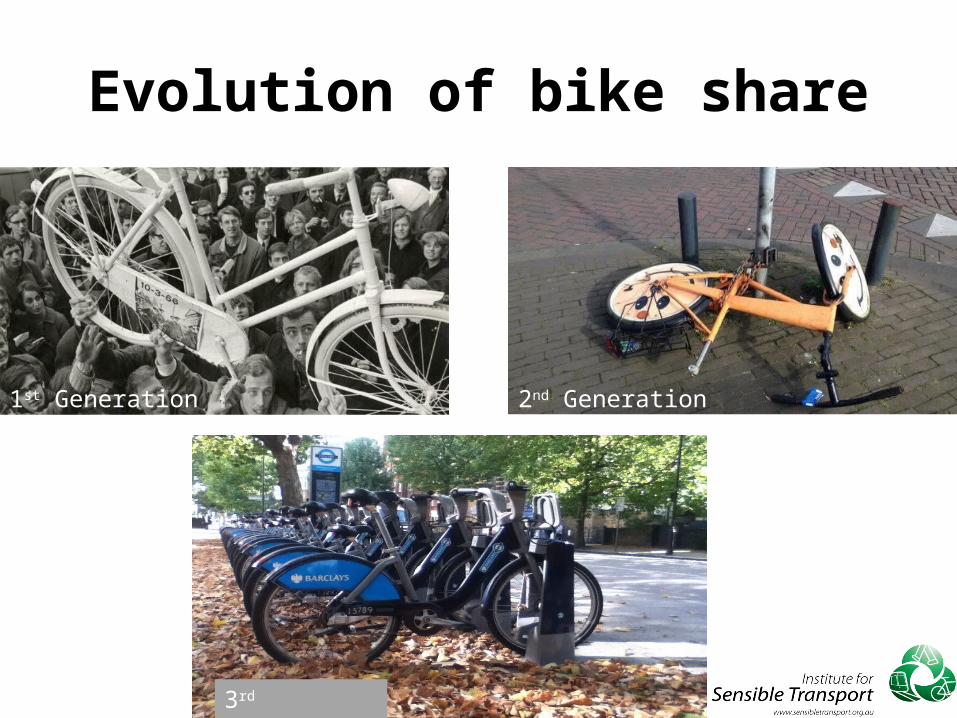
Evolution of bike share
1st Generation 2nd Generation
3rd Generation
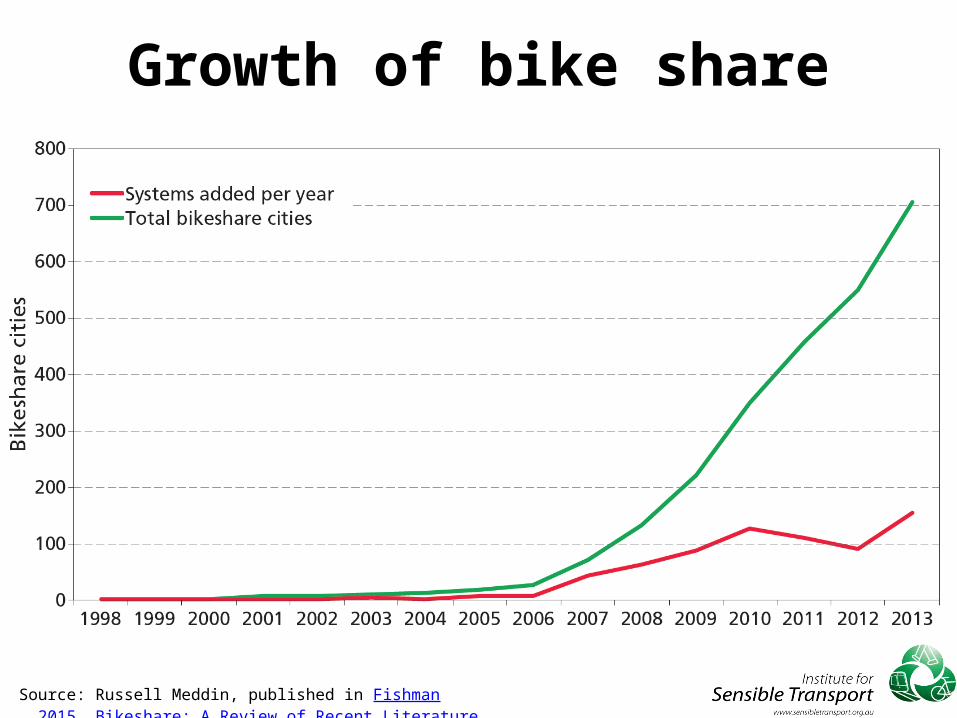
Growth of bike share
Source: Russell Meddin, published in Fishman, 2015, Bikeshare: A Review of Recent Literature
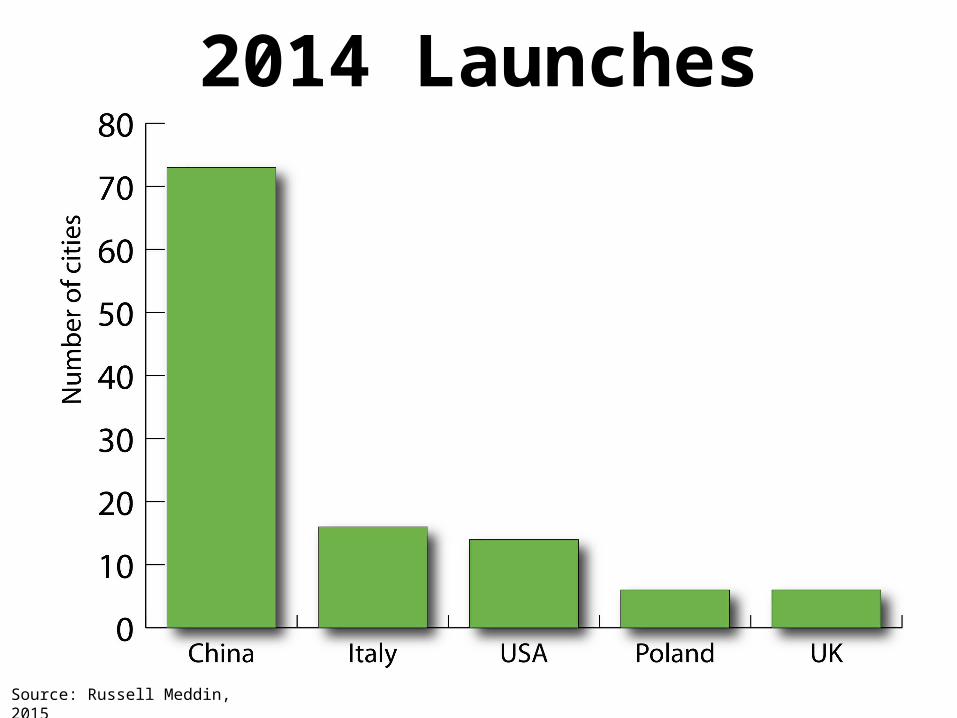
2014 Launches
Source: Russell Meddin, 2015
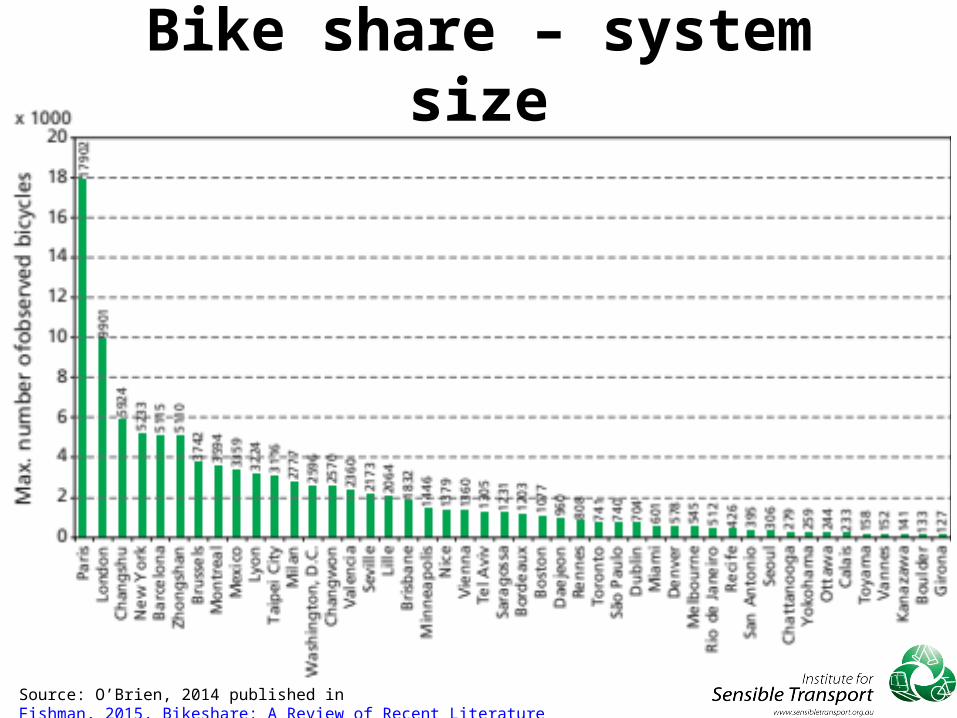
Bike share – system size
Source: O’Brien, 2014 published in Fishman, 2015, Bikeshare: A Review of Recent Literature
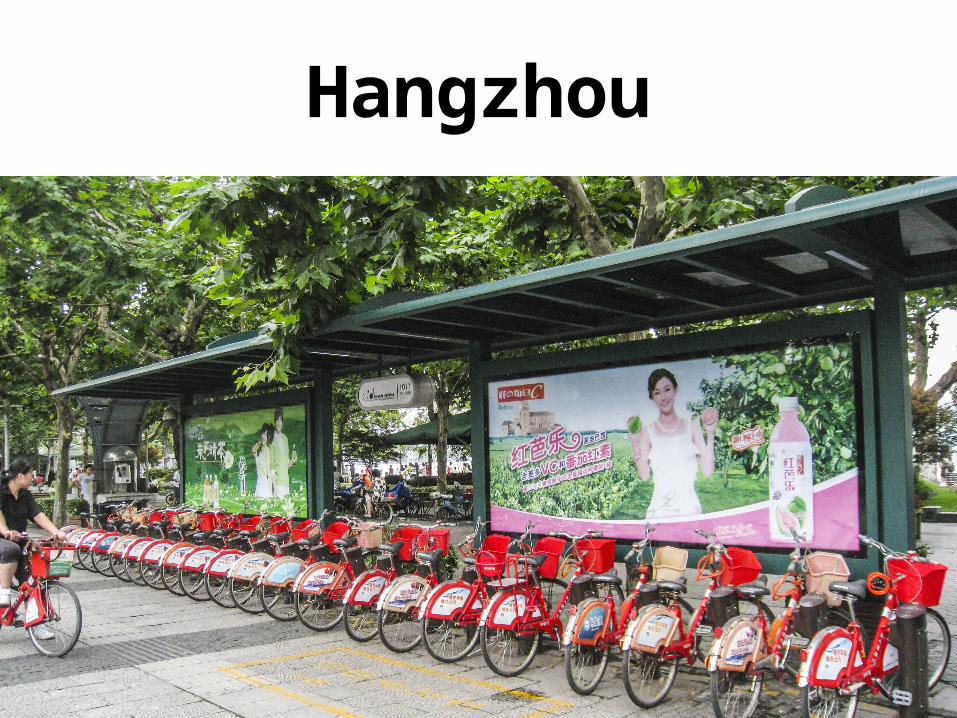
Hangzhou
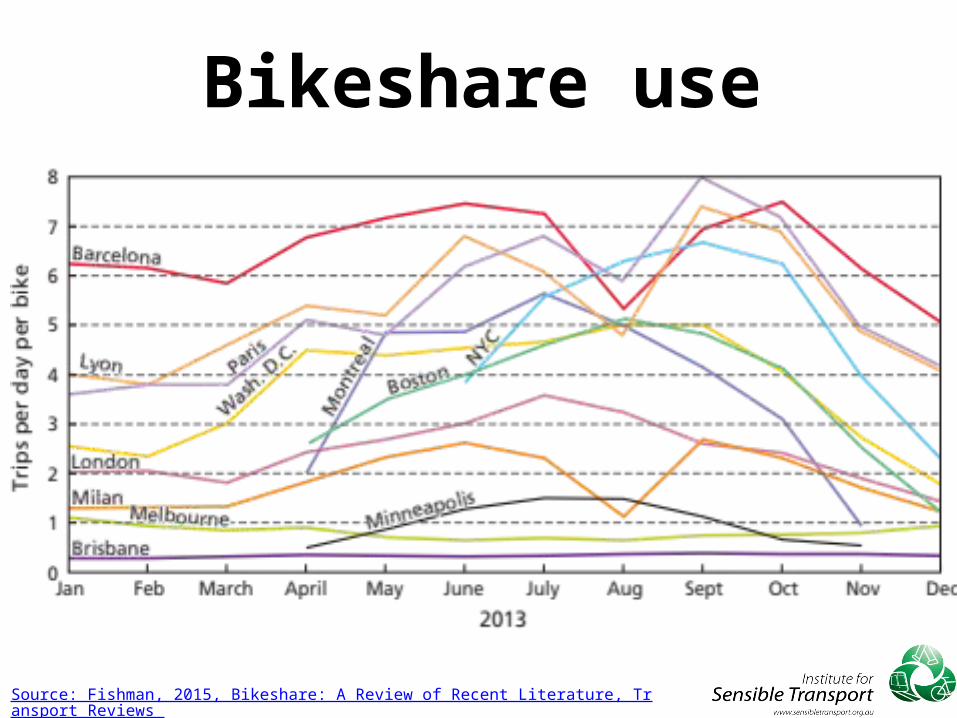
Bikeshare use
Source: Fishman, 2015, Bikeshare: A Review of Recent Literature, Transport Reviews
So
urc
e:
Fis
hm
an
et
al.,
20
14
Ba
rrie
rs t
o b
ike
sha
ring
, Jo
urn
al o
f Tra
nsp
ort
Ge
og
rap
hy
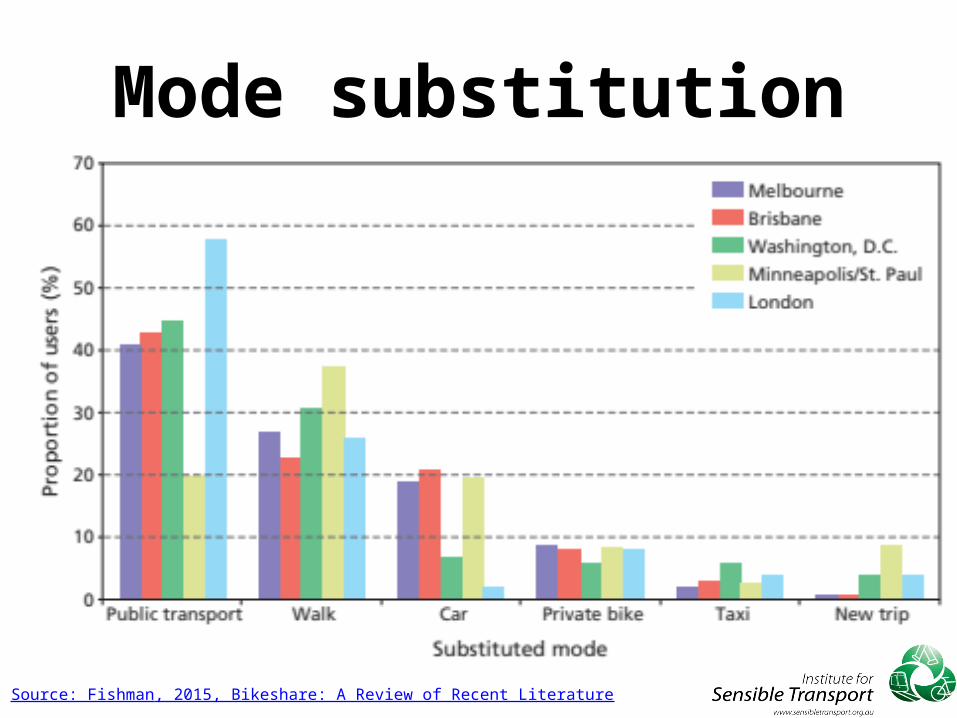
Mode substitution
Source: Fishman, 2015, Bikeshare: A Review of Recent Literature
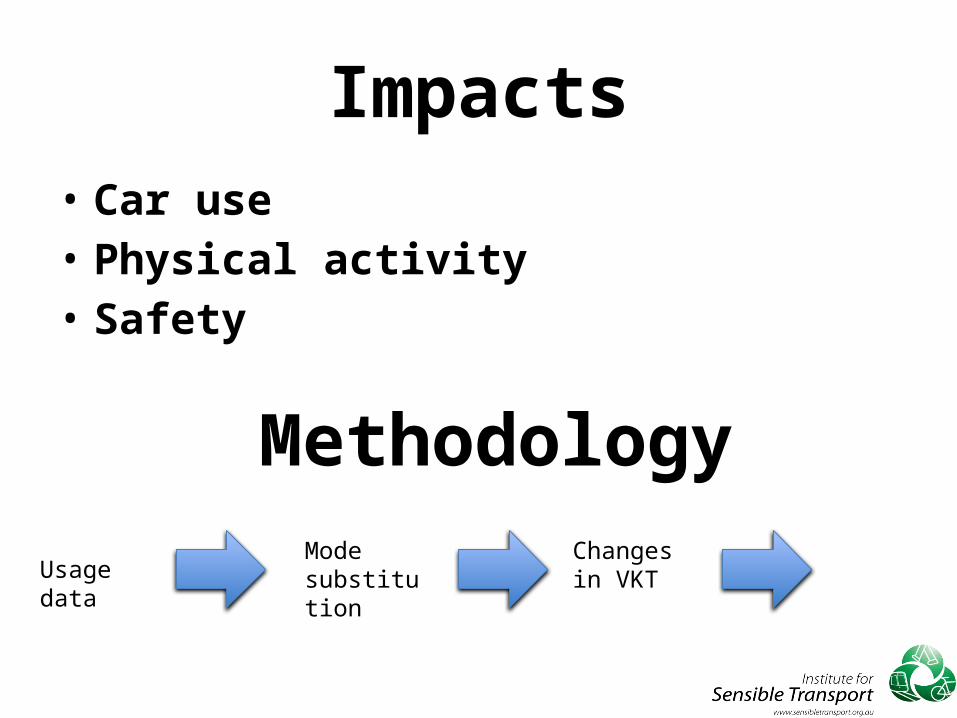
Impacts• Car use• Physical activity • Safety
Usage dataMode substitution
Changes in VKT
Methodology
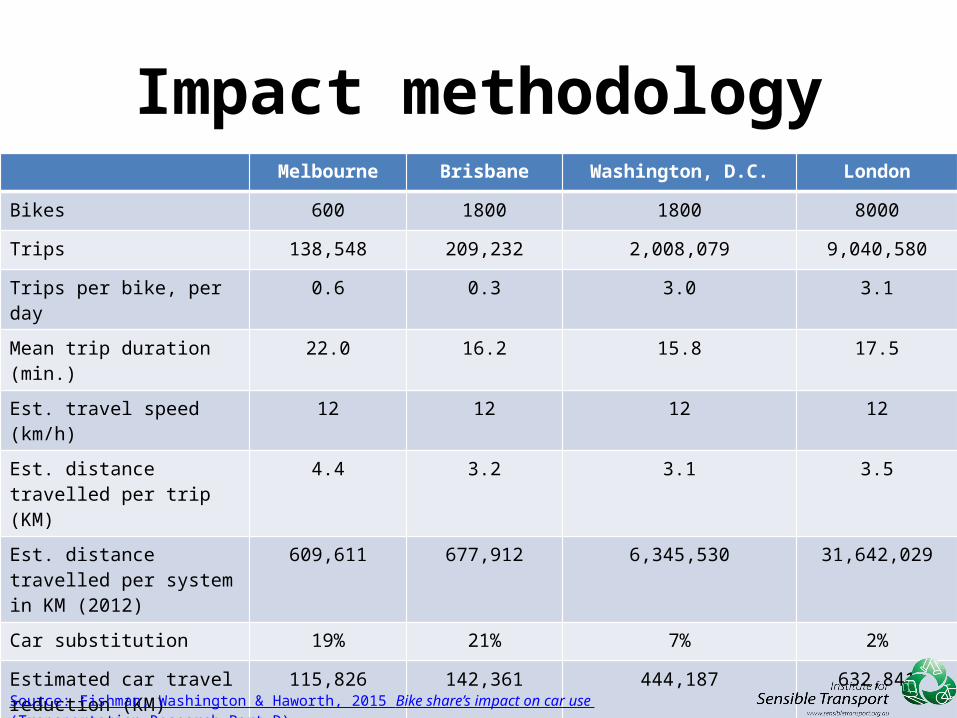
Impact methodologyMelbourne Brisbane Washington, D.C. London
Bikes 600 1800 1800 8000
Trips 138,548 209,232 2,008,079 9,040,580
Trips per bike, per day 0.6 0.3 3.0 3.1
Mean trip duration (min.) 22.0 16.2 15.8 17.5
Est. travel speed (km/h) 12 12 12 12
Est. distance travelled per trip (KM)
4.4 3.2 3.1 3.5
Est. distance travelled per system in KM (2012)
609,611 677,912 6,345,530 31,642,029
Car substitution 19% 21% 7% 2%
Estimated car travel reduction (KM)
115,826 142,361 444,187 632,841
Est. car travel reduction per bike (KM)
193 79 247 79
Source: Fishman, Washington & Haworth, 2015 Bike share’s impact on car use (Transportation Research Part D)
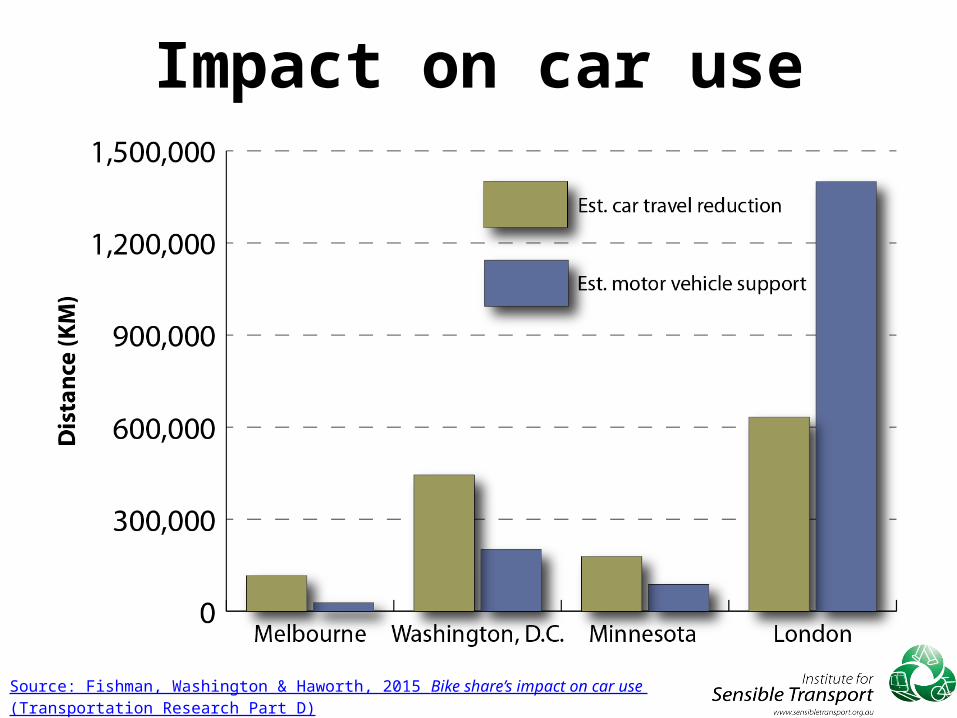
Impact on car use
Source: Fishman, Washington & Haworth, 2015 Bike share’s impact on car use (Transportation Research Part D)
Melbourne
Brisbane
Washington DC
Minneapolis/St. Paul
London
-50000000 0 50000000 100000000
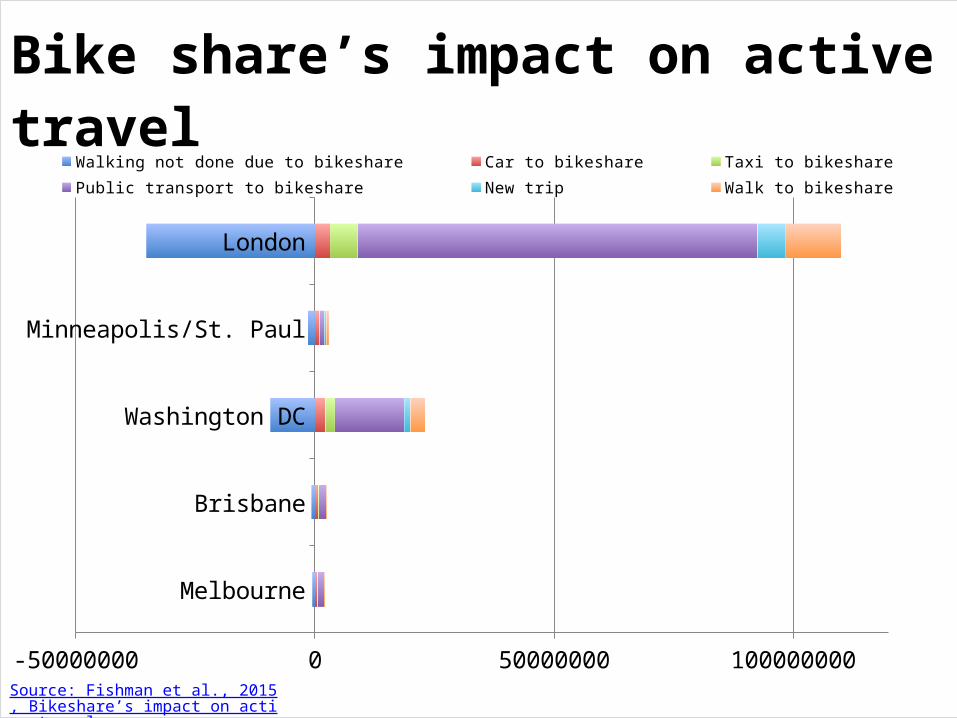
Walking not done due to bikeshare Car to bikeshare Taxi to bikeshare Public transport to bikeshare New trip Walk to bikeshare
Bike share’s impact on active travel
Source: Fishman et al., 2015, Bikeshare’s impact on active travel
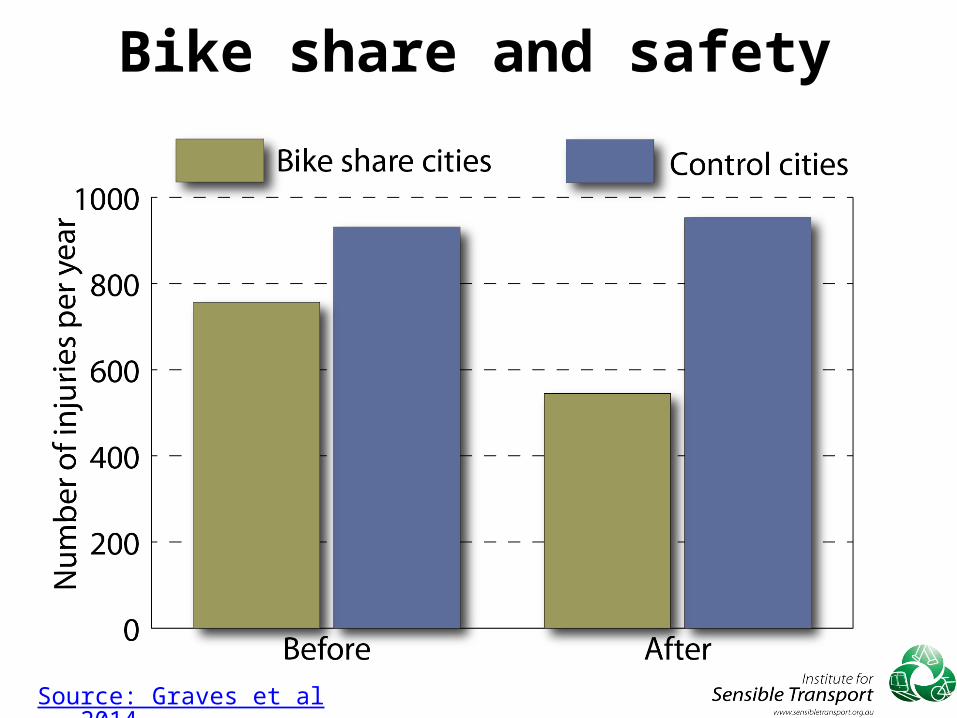
Bike share and safety
Source: Graves et al., 2014
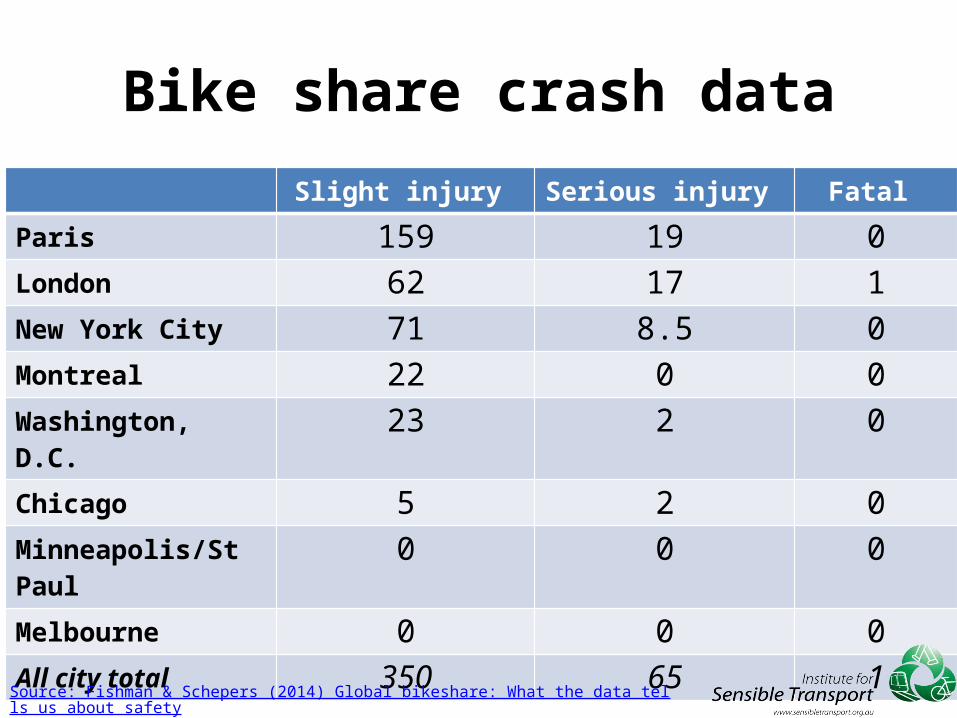
Bike share crash dataSlight injury Serious injury Fatal
Paris 159 19 0London 62 17 1New York City 71 8.5 0Montreal 22 0 0Washington, D.C. 23 2 0Chicago 5 2 0Minneapolis/St Paul 0 0 0Melbourne 0 0 0All city total 350 65 1
Source: Fishman & Schepers (2014) Global bikeshare: What the data tells us about safety

Injuries per distance travelledSlight injuries per
million kmSerious injuries per
million km
Paris 1.3 0.2
London 2.6 0.7
NYC 4.0 0.5
Montreal 2.2 0
Washington, D.C. 3.3 0.3
Chicago 1.8 0.7
Minneapolis/St. Paul 0 0
Melbourne 0 0
All city average 1.9 0.3
Source: Fishman & Schepers (2014) Global bikeshare: What the data tells us about safety
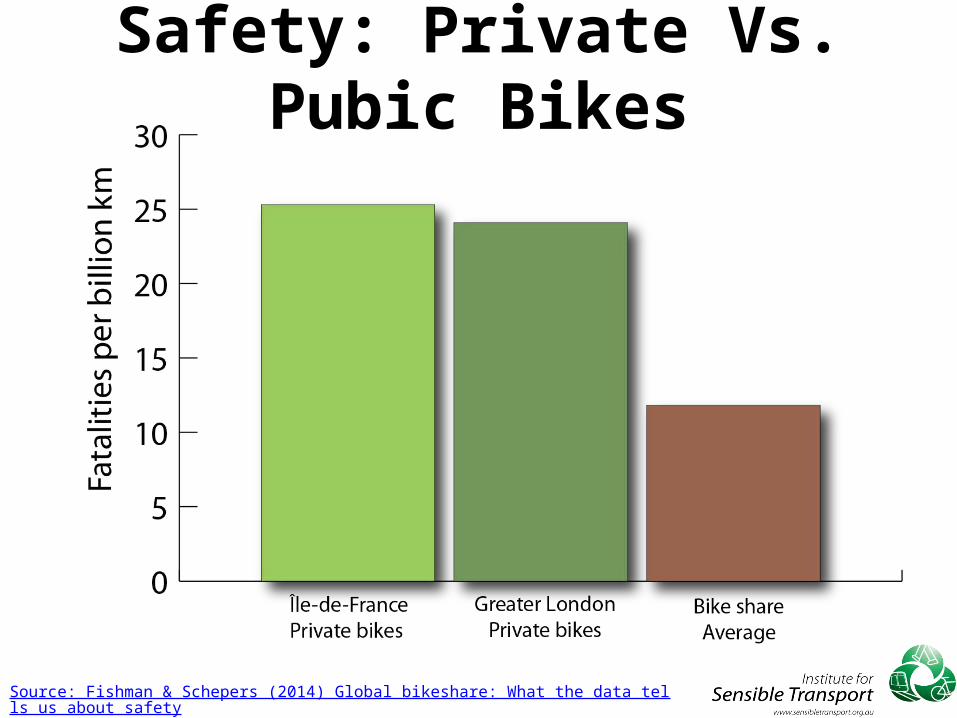
Safety: Private Vs. Pubic Bikes
Source: Fishman & Schepers (2014) Global bikeshare: What the data tells us about safety
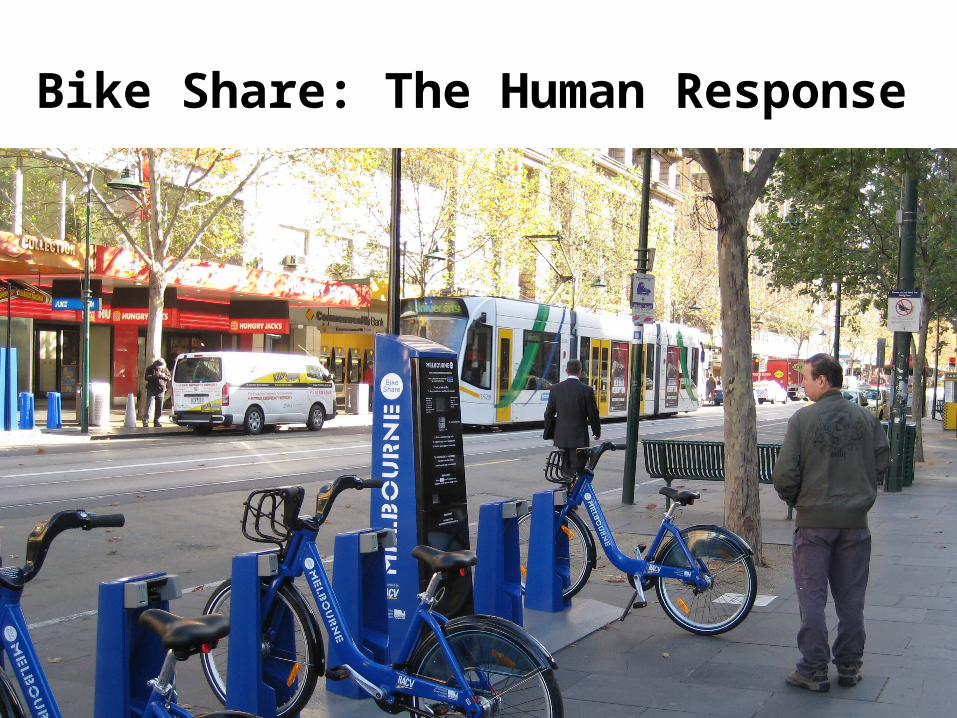
Bike Share: The Human Response
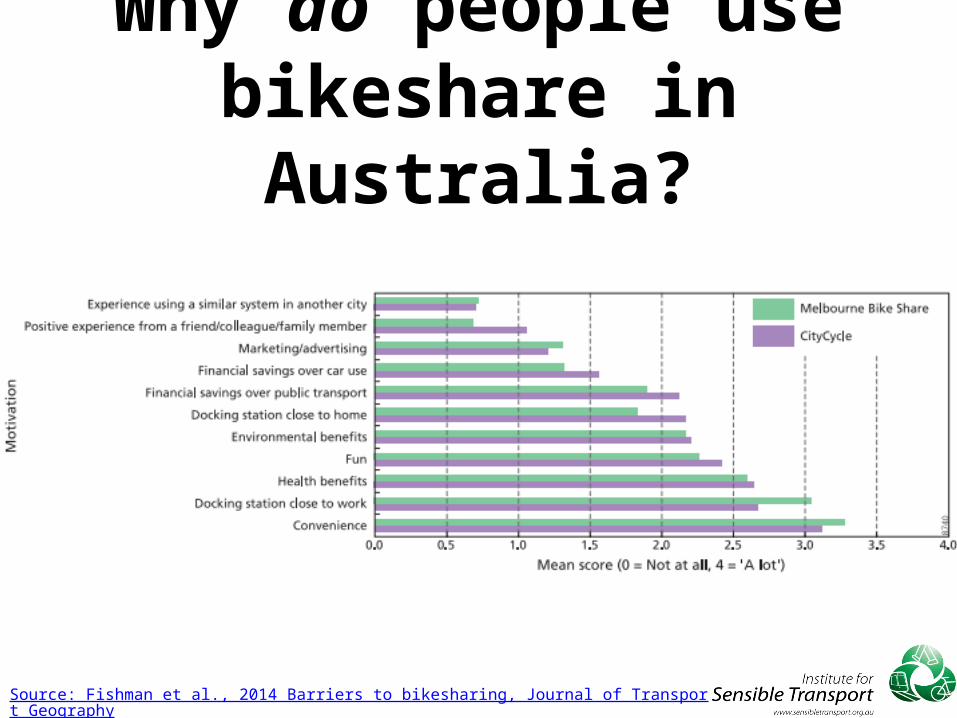
Why do people use bikeshare in Australia?
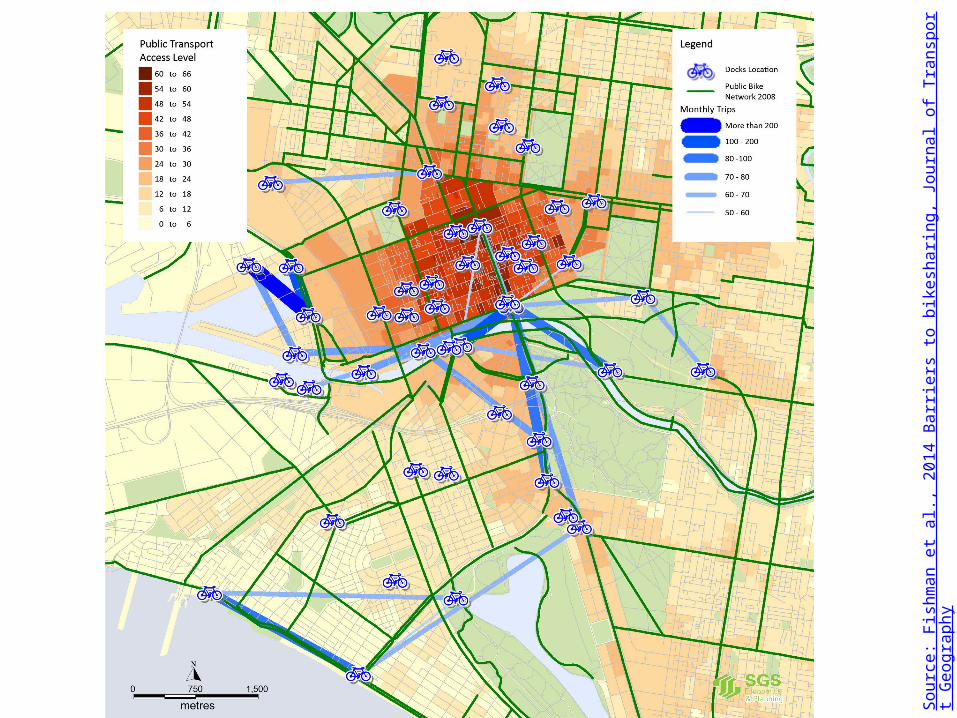
Source: Fishman et al., 2014 Barriers to bikesharing, Journal of Transport Geography
Convenience is everything
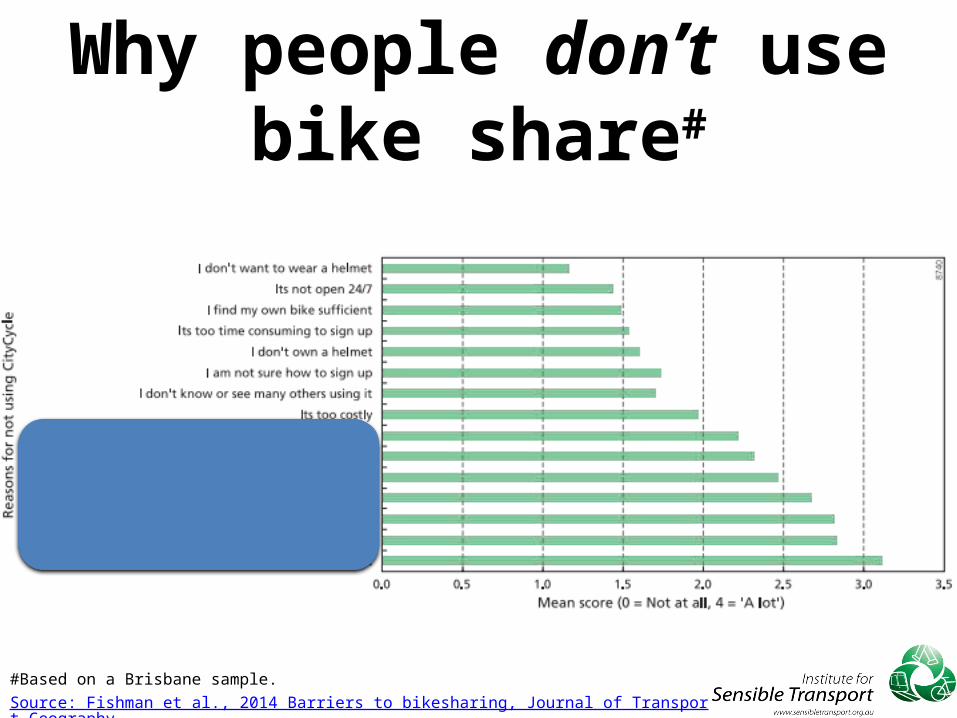
Why people don’t use bike share#
Source: Fishman et al., 2014 Barriers to bikesharing, Journal of Transport Geography
#Based on a Brisbane sample.
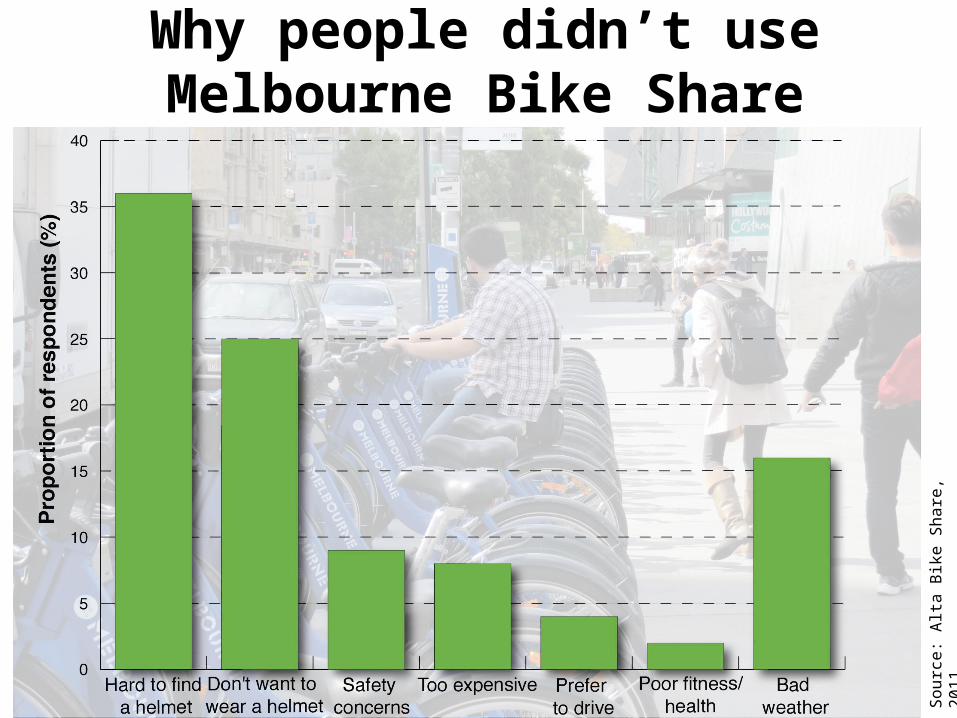
Why people didn’t use Melbourne Bike Share
So
urc
e: A
lta B
ike
Sh
are
, 2
011
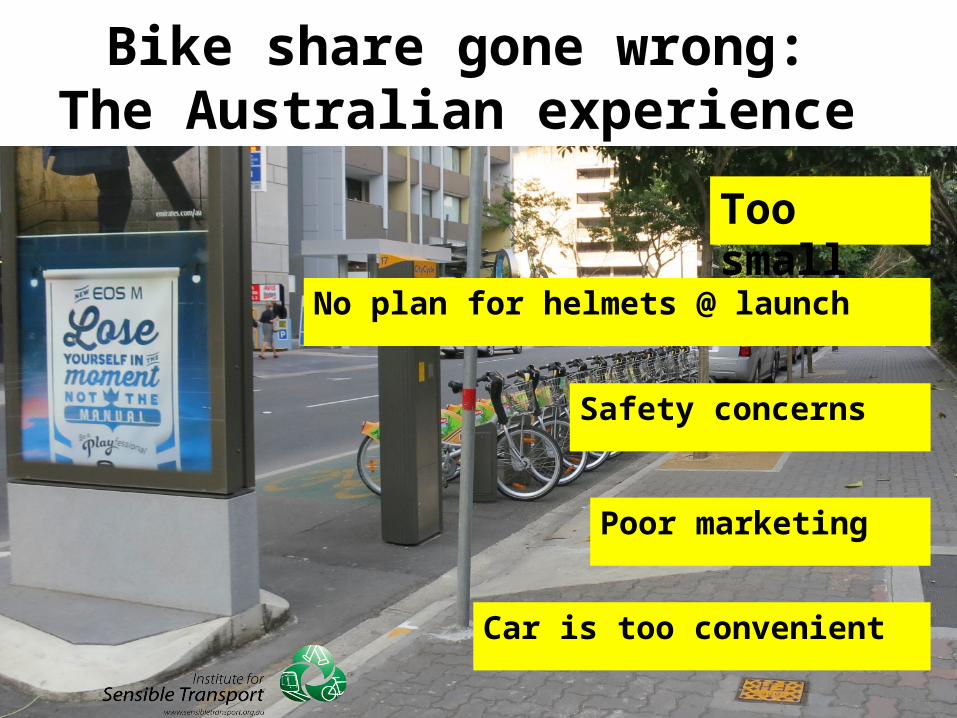
Bike share gone wrong: The Australian experience
Too small
No plan for helmets @ launch
Safety concerns
Poor marketing
Car is too convenient
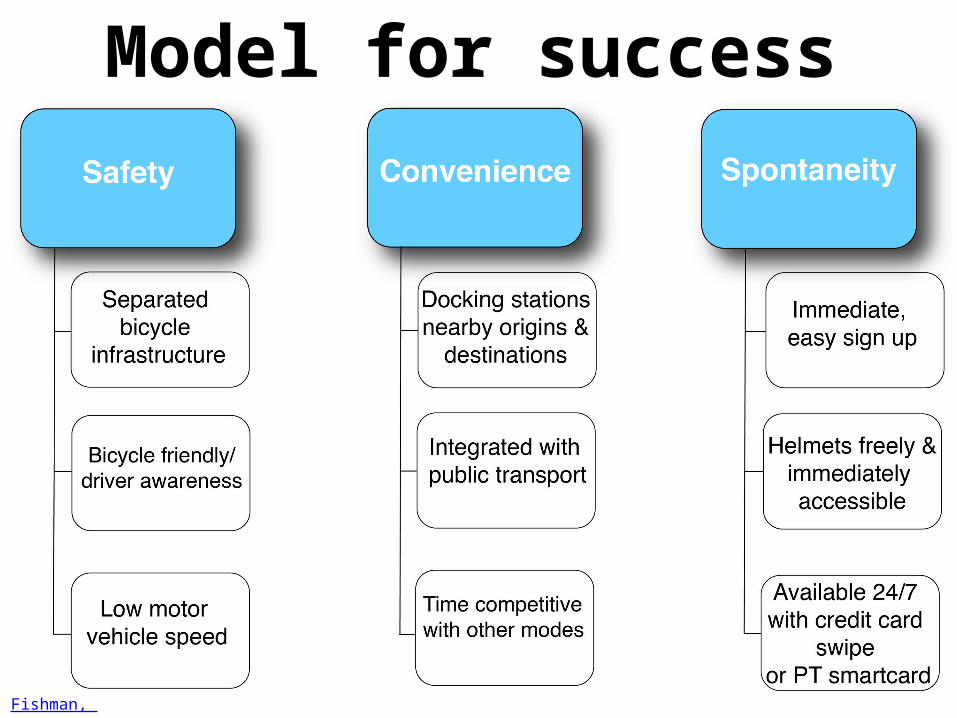
Model for success
Fishman, 2014 Bikeshare : barriers, facilitators and impacts on car use
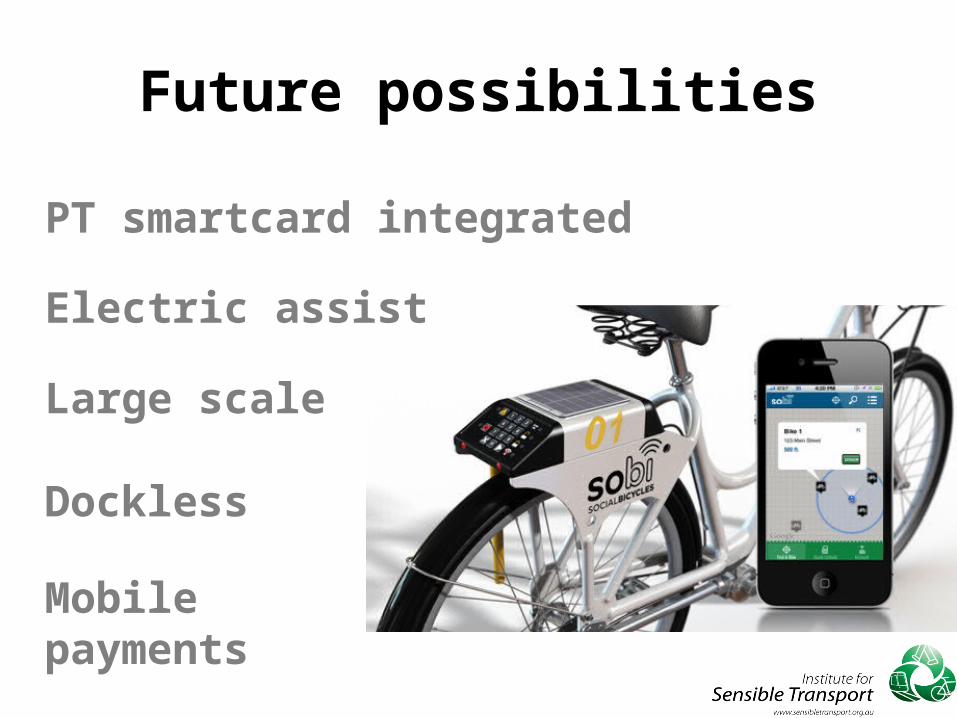
Future possibilities
PT smartcard integrated
Electric assist
Large scale
Dockless
Mobile payments
Thank you.
Dr Elliot Fishman
Director, Transport Innovation
Institute for Sensible Transport
W: www.sensibletransport.org.au