big debates 2011 – europe
DESCRIPTION
TRANSCRIPT
Morgan Stanley does and seeks to do business with companies covered in Morgan Stanley Research. As a result, investors should be aware that the firm may have a conflict of interest that could affect the objectivity of Morgan Stanley Research. Investors should consider Morgan Stanley Research as only a single factor in making their investment decision.
For analyst certification and other important disclosures, refer to the Disclosures Section. += Analysts employed by non-U.S. affiliates are not registered with FINRA, may not be associated persons of the member and may not be subject to NASD/NYSE restrictions on communications with a subject company, public appearances and trading securities held by a research analyst account.
December 8, 2010
We are well into the third year of macro. Debates around the outlook of different economies and asset classes continue to dominate investors’ agendas and the movements of individual securities across regions and sectors.
Our global team of economists and strategists is focused on these key debates, expectations and risk-reward scenarios (for their latest risk-reward views, please consult the Global Debates Playbook monthly and their special year-end publications).
In this series, Big Debates: 2011, our industry analysts around the globe look at the industry- and company-specific investor debates that are likely to drive stocks in the upcoming year. We looked for debates that are likely to matter, that are likely to be settled (or significantly advanced) in the coming year, and for which we have a view that differs sharply from the current market view.
Our job as securities analysts starts with conversations with leading investors. We look to identify which debates matter today, and more important, which will matter tomorrow. Through these conversations, along with an increasing array of analytics, we also get a read for “what’s in the price” – what are the types of expectations that may warrant the current price.
As always, we look forward to your feedback.
Linda Riefler Global Head of Research
Juan-Luis Perez Global Director of Research
Rupert Jones Director of EU Research
Big Debates: 2011 – North America December 6, 2010
Big Debates: 2011 – Asia Pacific December 7, 2010
Global Debates Playbook November 16, 2010
M O R G A N S T A N L E Y R E S E A R C H
E U R O P E
Big Debates: 2011 Key Investor Debates Likely to Drive Stocks in the Upcoming Year
M O R G A N S T A N L E Y R E S E A R C H
Big Debates: 2011December 8, 2010
Table of Contents
2
4 Aerospace & Defence EADS: Could the A350XWB be on time? Rupinder Vig
6 Autos & Auto Parts Sharp Recovery in US Consumption – Buy FIAT Stuart Pearson
8 Banks & Diversified Financials Which Banks Could Refocus Portfolios and Create Value in 2011? Huw van Steenis
10 Beverages Can Carlsberg Close the Valuation Discount to Peers in 2011? Michael Steib
12 Biotech & Medical Technology EU Austerity Measures: Does Past Data Predict Future Performance? Michael Jungling
14 Brands Is Big Becoming the New Beautiful? Louise Singlehurst
16 Building & Construction Is EM Exposure an Earnings Driver or an Earnings Risk in 2011? Alejandra Pereda
18 Business & Employment Services Can HomeServe Roll Out Its UK Business Model Successfully in the US? Jessica Alsford
20 Capital Goods Will Grid Investment Recover in 2011? Ben Uglow
22 Chemicals Petrochemical Margins – Imminent Decline or Supercycle? Paul Walsh
24 Clean Energy EDP Renovaveis: Further Capex Cuts Could Crystallize Value Allen Wells
26 Food Producers Will Danone Return to Historical Growth Rates? Michael Steib
28 Insurance Does Aegon Need to Raise Equity to Repay Dutch State Aid? Farooq Hanif
30 Leisure & Hotels Could Hotel RevPAR Increase 10%+ in 2011? Jamie Rollo
32 Media & Internet Will the German Consumer Embrace Pay TV? Patrick Wellington
34 Metals & Mining Will Kazakhmys Dispose of Its Stake in ENRC? Ephrem Ravi
36 Oil & Gas Can Big Oil Unlock Shareholder Value in 2011? Theepan Jothilingam
38 Oil Services Saipem: Revenue Upside from Fleet Expansion Is Not in the Price Martijn Rats
40 Paper & Packaging Will Consolidation Finally Begin in 2011? Markus Almerud
42 Pharmaceuticals Cheap Sector or Value Trap? Andrew Baum
44 Property Macro Tailwinds versus Debt-Related Headwinds Bart Gysens
46 Retail Unprecedented Apparel Inflation: What Is the Price Elasticity of Clothing? Charlie Muir-Sands
48 Technology Can Nokia Turn Around the Smartphone Business? Patrick Standaert
50 Telecommunications Services KPN: Can Fibre Drive a Wireline Inflection and Stable FCF? Luis Prota
52 Tobacco Can Imperial Tobacco Deliver Organic Growth? Toby McCullagh
54 Transport Container Shipping: Could Better Rate Discipline Drive Upside for Maersk? Menno Sanderse
56 Utilities Could 2011 Bring an Inflection Point in Earnings? We Think Not Emmanuel Turpin
58 EEMEA Banks Can Credit Normalization Continue to Drive Outperformance? Magdalena Stoklosa
60 EEMEA Oil & Gas Is Russian Oil Tax Reform Actually Happening … And Does It Matter? Matthew Thomas
62 Turkey Tekfen Holding AS: Contract Awards to Pick Up Materially Sayra Can Altuntas

M O R G A N S T A N L E Y R E S E A R C H
Big Debates: 2011December 8, 2010
3

M O R G A N S T A N L E Y R E S E A R C H
Big Debates: 2011December 8, 2010
Aerospace & Defence EADS: Could the A350XWB Be on Time?
Morgan Stanley & Co.
International plc+
Rupinder Vig [email protected]
Ovunc Okyay [email protected]
Our View Market View
We see a possibility that development of the A350XWB (new wide-bodied Airbus aircraft) meets current management guidance of a 2H13 EIS. Management could be in a position to dedicate sufficient engineering time and resource to complete final assembly in 3Q11 followed by on-time first flight in mid-2012. This would leave ~12 months for flight testing before entry-into-service in 2H13. In this scenario, EADS shares could move towards our bull case of €32.
The market expects a 12-18 month delay in the A350XWB (particularly given past experience on the A380 and B787). Concerns over program execution on A350XWB have weighed on EADS shares over the past 18 months. Although management remains confident it can deliver the A350XWB on time in 2H13, the market remains very sceptical. Any indication that the project is on track during 2011 could therefore have a material impact on the share price.
What’s in the Price Successful execution on A350XWB would be a key positive surprise for EADS shares Morgan Stanley Risk-Reward View (Left.) vs. Probabilities Implied by Option Prices (Right)
Price Target : € 24 Stock Rating : OverweightMS Industry view : In-Line
The probabilities of our Bull, Base, and Bear case scenarios playing out were estimated with implied volatility data from the options market as of Dec 2,2010. All figures are approximaterisk-neutral probabilities of the stock reaching beyond the scenario price in one-year’s time.
EADS NV
€ 17.58
Prob(> € 32 ) < 5%€ 32
€ 13 Prob(< € 13 ) ~ 20%
€ 24 Prob(> € 24 ) ~ 15%
€
-
5
10
15
20
25
30
35
40
45
Dec-08
Feb-09
May-09
Aug-09
Nov-09
Feb-10
May-10
Aug-10
Oct-10
Jan-11
Mar-11
May-11
Jul-11
Sep-11
Nov-11
~ 15% probability the stock will reach above € 24 price target in 12 months
Risk-Reward Scenarios
€12.50 Bear Case
12.3x P/E on Bear Case
2012e EPS of €1.02
€24.00 Base Case
11.6x P/E on Base Case
2012e EPS of €2.07
€32.00 Bull Case
10.0x P/E on Bull Case
2012e EPS of €3.19
Airbus deliveries fall, euro strengthens. EUR/USD trends to 1.50, market accords zero value for Airbus, customer financing concerns are realized and margins trend to 4.0-4.5% long term.
Airbus remains robust; cycle remains elevated, euro remains stable. Deliveries remain stable in 2011 and then increase in 2012 on the back of rising production rates. Airbus margins trend to 6.0-6.5% long term.
Airbus restructures further, deliveries rise, euro weakens further. New aircraft order flow picks up, EUR/USD rate trends to 1.25 and additional cost savings push group margins up to 9.0-9.5% long term.
Source: FactSet (price data), Morgan Stanley Research estimates
4

M O R G A N S T A N L E Y R E S E A R C H
Big Debates: 2011December 8, 2010
Potential Catalysts
FY10 results – March 2011 Management will provide an update on whether A350XWB remains on track (and on cost)
Final assembly of first aircraft – 3Q11 Completion of final assembly of MSN001 (first A350-900) is scheduled for 3Q11
First flight – Mid 2012 First flight is scheduled for mid-2012, followed by a 12-month flight test program (on 5 aircraft)
Entry into service – 2013 Management expects the A350 to enter service in 2H13
Delays to new aircraft programs have been a major overhang on EADS shares. The past few years have seen program execution become something of an Achilles heel for EADS, with a number of problems on major programs, including A380 and A400M. Exhibit 1 below shows how the EADS share price has fallen following delay announcements, with a total aggregate relative underperformance from the four A380 delay announcements of 37% versus MSCI Europe and 39% versus Boeing.
The market is very sceptical that the A350XWB will be able to launch in 2H13. Given the past experience of A380, A400M and also B787, the market clearly expects A350XWB
to be delayed beyond 2013. This view was given further fuel when EADS announced a two-month delay on November 12 (the shares have since fallen by 7%, despite the strengthening dollar).
The consensus view appears to be that a delay of 12-18 months is likely. Many investors now expect the November 12 delay announcement to be the first of a series that will ultimately see A350XWB delayed by 12-18 months (a similar length of delay experienced by other recent development programs undertaken by Boeing and Airbus).
We therefore think the shares would react very positively to signs that A350XWB could launch on time. In our view, the next 12 months will be crucial in giving the market confidence that management can deliver on its guidance for a 2H13 entry into service. Final assembly is scheduled for 3Q11, and first flight is expected within six months of this date. If both occur on time, the market is likely to gain more confience that A350XWB can deliver in 2013.
We remain Overweight on EADS with A350XWB a key catalyst (and potential positive surprise). Although 2011 is likely to be a tough year for EADS, given the numerous challenges that remain, we continue to believe that valuation is very attractive, pricing is picking up and that program execution is showing signs of improvement. This, coupled with the cyclical upturn, makes EADS a compelling buy for longer-term investors, in our view. Successful execution on A350XWB could trigger a material re-rating in the stock.
Exhibit 1
Program delays have historically hit EADS hard, so on-time A350XWB development would be a key catalyst
5
10
15
20
25
30
35
40
45
Jan-05
Apr-05
Jul-05
Oct-05
Jan-06
Apr-06
Jul-06
Oct-06
Jan-07
Apr-07
Jul-07
Oct-07
Jan-08
Apr-08
Jul-08
Oct-08
Jan-09
Apr-09
Jul-09
Oct-09
Jan-10
Apr-10
Jul-10
Oct-10
EA
DS
sh
are
pric
e (
€)
First delay (June 1, 2005): Delivery will slip by 6-months. 2009 planned deliveries down to 90–100 (from 120). EADS down 3% vs. MSCI in the following 2 weeks.
Second delay (June 13, 2006): Additional delay of 7-months. EADS down 20% vs. MSCI in the following 2 weeks. EADS CEO, Airbus CEO and A380 program manager departed.
Third delay (October 3, 2006): Additional delay of one year. EADS down 10%vs. MSCI in the following 2 weeks. Fourth delay (May 13, 2008):
Reduced deliveries for 2008 and 2009. EADS down 4% vs. MSCI in the following 2 weeks.
Source: FactSet, Company data, Morgan Stanley Research
5

M O R G A N S T A N L E Y R E S E A R C H
Big Debates: 2011December 8, 2010
Autos & Auto Parts Sharp Recovery in US Consumption – Buy FIAT Morgan Stanley & Co.
International plc+
Stuart Pearson, CFA [email protected]
Our View Market View
We expect the US car market to surprise materially in 2011, jumping +20% to a 14m SAAR. Rebounding US consumer confidence provides the final ingredient to a set of conditions already ripe for a sharp recovery in demand. These include record high used vehicle prices, the oldest US fleet age on record, strong credit quality, and improving credit availability. The latter should also aid Chrysler’s market share recovery, given the lower average credit score of its customers. With an effective 35% stake in Chrysler (and option to move to 51%), we see Fiat as the best European play on the recovering US market.
Consensus assumes a slow recovery in the US market to a c.13m SAAR next year. The recovery of the US market thus far has been lackluster, constrained by the lack of credit availability and weak consumer confidence. Consensus assumes this continues into 2011e, driving more modest +10% growth. Furthermore, consensus remains highly skeptical on Chrysler’s ability to deliver the necessary product to win back market share. Sceptics doubt the heavy ‘refresh’ work on Chrysler’s 10 new model launches in Q410 will prove sufficient to win back retail share.
What’s in the Price Fiat shares assign a low probability to a sharp US recovery
Morgan Stanley Risk-Reward (left) versus Probabilities Implied by Option Prices (right) Price Target : € 17
Stock Rating : OverweightMS Industry view : In-Line
The probabilities of our Bull, Base, and Bear case scenarios playing out were estimated with implied volatility data from the options market as of Dec 2,2010. All figures are approximaterisk-neutral probabilities of the stock reaching beyond the scenario price in one-year’s time.
FIAT SPA
€ 13.48
Prob(> € 22 ) ~ 5%€ 22
€ 9 Prob(< € 9 ) ~ 20%
€ 17 Prob(> € 17 ) ~ 20%
€
-
5
10
15
20
25
30
Dec-08
Feb-09
May-09
Aug-09
Nov-09
Feb-10
May-10
Aug-10
Oct-10
Jan-11
Mar-11
May-11
Jul-11
Sep-11
Nov-11
~ 20% probability the stock will reach above € 17 price target in 12 months
Risk-Reward Scenarios
€9 Bear Case
€2.5 for Fiat Auto, €1.5 for
Chrysler, €5 for Industrial
€17 Base Case
€6.4 for Fiat Auto, €3.6 for
Chrysler, €7 for Industrial
€22 Bull Case
€8 for Fiat Auto, €5 for
Chrysler, €9 for Industrial
Fiat Auto delivers a trading margin of 2% in 2011e, rising to 3% by 2013e. Fiat Industrial delivers a trading margin of 6% in 2011e, rising to 7% by 2013e. Chrysler delivers a trading margin of 2% in 2011e, rising to 3% by 2013e.
Fiat Auto delivers a trading margin of 3% in 2011e, rising to 5% by 2013e. Fiat Industrial delivers a trading margin of 7% in 2011e, rising to 8% by 2013e. Chrysler delivers a trading margin of 3.7% in 2011e, rising to 6.4% by 2013e.
Fiat Auto delivers a trading margin of 3% in 2011e, rising to 6% by 2013e. Fiat Industrial delivers a trading margin of 7% in 2011e, rising to 10% by 2013e. Chrysler delivers a trading margin of 3.7% in 2011e, rising to 8% by 2013e.
Source: FactSet (price data), Morgan Stanley Research estimates
6

M O R G A N S T A N L E Y R E S E A R C H
Big Debates: 2011December 8, 2010
We think Chrysler may prove to be one of 2011’s most surprising success stories. With refreshed product meeting a sharp recovery in the US market and a restructured cost base, we believe Chrysler’s US share and profitability could step up in 2011-12. We highlight a number of factors moving in Chrysler’s favour in recent months:
US market recovery. We forecast a 20% jump in the US car market in 2011. With 70% of unit sales to the US, Chrysler carries by far the largest exposure to the market of any global OEM. This is an exposure we want to own heading into 2011.
Market share revival. Within the US market we believe Chrysler can steadily reclaim lost market share. The acid test for Chrysler will be the success of its refreshed product offerings arriving in 2011, and all new models from 2012. We conservatively see share recovering to 10.5%. We believe consensus expectations here are too low, at c.9%.
Debt restructuring. Chrysler’s strong gross cash position ($8.3bn) and potential DoE loan approval (for c.$3-4bn) should allow the firm to repay US treasury loans ($7bn outstanding). This could materially reduce Chrysler’s interest burden, given interest rates on state debt currently range between 7% and 20%. We estimate Chrysler’s interest costs could fall by c.$400m.
Perhaps more significantly for Fiat shareholders, the repayment of Chrysler’s government loans would also clear one hurdle for Fiat to move to a majority share in the company. This could be timed to coincide with a possible Chrysler IPO, one of several options being considered. However, any such move would require the agreement of all the stakeholders in Chrysler (including the US treasury and UAW).
Bull case value of up to €22 per share Chrysler is the key point of differentiation between our base and bull case valuations for Fiat – and especially for the post demerger Fiat Auto business. Under our base case, we value Chrysler at €3.6 of our €9.3 per share Fiat Auto 2011 sum of parts. This assumes Chrysler margins peak at 6% in 2013 on a 10.5% US share.
Under our bull case scenario of a 13% US share and 8% peak margins (closer to Chrysler’s actual business plan), we value Chrysler at up to €6 per Fiat share. This would increase our Fiat Auto valuation to close to €12/share, and help take our group bull case valuation to €22 per share.
Potential catalysts for Fiat equity
First day of each month US sales data release revealing demand, inventory and incentive levels
January 3rd, 2011 Demerger of Fiat into separate Industrial and Automotive units
1H 2011e Chrysler likely to receive DoE loans and repay high cost US Treasury debt
2H 2011e Potential Chrysler IPO (as flagged by management)
Exhibit 1
Chrysler US sales and market share
0
50,000
100,000
150,000
200,000
250,000
300,000
Jan-05 Jul-05 Jan-06 Jul-06 Jan-07 Jul-07 Jan-08 Jul-08 Jan-09 Jul-09 Jan-10 Jul-10
0%
2%
4%
6%
8%
10%
12%
14%
16%
US Unit Sales (LHS) US Market Share, % Source: Autodata, Morgan Stanley Research
Exhibit 2
Chrysler bull/base share and margin assumptions
0%
1%
2%
3%
4%
5%
6%
7%
8%
9%
2010e 2011e 2012e 2013e 2014e
0%
2%
4%
6%
8%
10%
12%
14%
Base Case EBIT Margin Bull Case EBIT Margin Base Case US Share Bull Case US Share
Source: Morgan Stanley Research estimates
7

M O R G A N S T A N L E Y R E S E A R C H
Big Debates: 2011December 8, 2010
Banks & Diversified Financials Which Banks Could Refocus Portfolios and Create Value in 2011? Morgan Stanley & Co.
International plc+
Huw van Steenis Francesca Tondi, Maxence Le Gouvello, Henrik Schmidt, Steve Hayne , Hubert Lam, [email protected] Chris Manners, Thibault Nardin, Alice Timperley, Wouter Janssens
Our View Market View
2011 is likely to be a year for difficult portfolio choices, which could drive considerable value if we get clarity on the macro environment and regulation. We would look at the sub-scale fixed income players and those seeking to sell assets to meet Basel 3 norms or to refocus business. Stocks in focus: UBS, Barclays, Soc Gen, UCG
The market thinks the large wholesale/universal banks will be very heavily impacted by Basel III and their current portfolio mix. The banks are therefore trading at 0.7-0.85x 2011e TNAV (or in the case of UBS the investment bank is at this type of valuation). The market doubts that we will get the regulatory or macro clarity for transformation programmes.
What’s in the Price Book value growth at a reasonable price will be key for stock performance
DANSKE
SHB
NDA SWED
CSGN
STAN
BNP
HSBC
BP PMI
MBUCG
MPS
ISP
UBS
SocGenCASA
BAC
BARC
KN
DBKLLOY
RBSC
DNB
SEB
0.0x
0.5x
1.0x
1.5x
2.0x
2.5x
0% 10% 20% 30% 40% 50% 60% 70%Accumulated Book value creation 1H10e-2012e
Pri
ce/1
1e
Ta
ng
ible
Bo
ok
Va
lue
Source: FactSet (price data), Morgan Stanley Research estimates
Greater differentiation in European banks stocks is likely, we think, as the market is not reflecting very different book value growth, macro risks, credit recovery stage, funding profiles or deleveraging risks. Given our view of lacklustre book growth for many banks, funding being a drag anchor on lending and provisions, the teething pains of a new paradigm in banking regulation and macro uncertainty, there is no one theme to play such a diverse group of European banks. We wrote extensively about this in our December 1 report, Expect
Greater Differentiation and in our November 16 note, Sovereign Risk and Bank Funding.
Regulatory pragmatism shouldn't be mistaken for no action. We still expect regulators to have tougher standards, but the repricing of risk and a pragmatic approach to enable credit creation are likely to allow banks to generate reasonable returns.
8

M O R G A N S T A N L E Y R E S E A R C H
Big Debates: 2011December 8, 2010
2011 will be a critical year when banks review and reshape business plans for the new regulatory paradigm and market conditions. The stocks in focus, in our minds, are those where we see a strong possibility that major decisions will be made on portfolios, whether it be UBS rethinking the scale of its ambitions in fixed income, Barclays reshaping its group portfolio, Soc Gen beginning to consider divesting non-core assets more quickly to meet new regulatory standards, or Unicredit rethinking its portfolio and/or geographical footprint. We look at these four examples in turn.
1. UBS’s equities franchise has regrouped to be top five YTD on reported revenues, but the bank is still outside the top 10 in FICC trading and has seen far more volatility than the flowmonsters. UBS has had about two-fifths of the FICC revenue share of JPM this year, but with materially higher volatility. The strategic response has been to reinvest and grow scale, but this means the fixed cost base has significantly increased, making UBS even more operationally geared to markets and contributing to the investment bank breaking even in Q3. For instance, if we use our assumptions on Basel 3 (published previously), the investment bank may need allocated equity of SFr 35-40bn (up to ~80% of the total targeted capital of the group). Management targets suggest SFr 6bn of PBT for the investment bank. Assuming a 30% tax rate (although we recognise huge DTAs for the coming years) means the i-bank would only make a ~10.5% post-tax return on capital in 2013, which is below our view of the cost of equity and leaves no room for error. Our 2012 estimate of SFr 4.5bn is clearly well below the cost of equity, which implies UBS has to cut costs, focus on generating higher returns on less capital-intensive businesses, rethink its priorities and be ruthless on capital allocation decisions, and/or execute flawlessly. This will be no mean feat in FICC trading. Hence, we think the market will remain reluctant to attribute a value to the investment bank much above 1x. The opportunity is whether UBS can reshape the allocation (perhaps saving SFr 5-10bn of equity) and so drive stronger returns. Today management is focused on growing its way out of low profits, but we believe a more fundamental rethink could well begin in 2011.
2. Over the next 18-24 months, Soc Gen’s management will focus on executing its industrial plan. In our view, much of the plan’s success will depend on management’s ability to shed more light on group core businesses and to dispose of non-core assets, such as legacy assets or non-leading, non-funded franchises. SG’s solvency is heavily penalised by its €54bn legacy portfolio, which represents more than 42% of RWA inflation under Basel 3. We saw clear
motivation to reduce this portfolio in Q3, when Soc Gen disposed of €2.6bn in assets, giving more flexibility to group solvency. We expect this trend to continue, but it will also depend on market conditions. Last June, Soc Gen announced it would refocus its business on core franchises with the following criteria: significant market share, L/D ratio <130%, and potential upside. As we noted in our March 16 note Roadmap to Crystallize Value, we see the group launching a strategic review on SFS and some CEE countries.
3. UCG's new CEO is also facing difficult choices to increase the group’s return (from the current depressed level of c. 4% RoNAV) and further improve capital to put the group on a more solid footing. This may require some radical decisions, possibly reversing recent expansion strategies, both in terms of business mix (for example, reducing the CIB division, which now absorbs over 50% of group RWA) and geographical footprint (the group is present in nearly 20 countries, not all of them profitable). Indeed, UCG may not be alone in shifting geographical strategy away from ‘putting flags on the map’ towards a focus on a few key ‘home markets’ where it can attain critical mass. It is not yet clear to us whether the new CEO has the mandate to undertake a radical review of the group, and we are concerned that a ‘slow burn’ strategy could see returns staying depressed for longer.
At Barclays, management is now focusing on returns and execution over growth, with the stock trading at a 23% discount to book value. It hopes to achieve this by: i) raising the ROTE in the underperforming businesses (such as Western Europe retail banking, where a review is to be conducted); and ii) growing in higher ROE business lines, such as equities, M&A and wealth management. We think the new CEO Bob Diamond, who was started a review of returns on allocated capital in the 50 business lines, is likely to make some tough decisions to refocus the group. We consider this a reassuring message, as the sub cost of capital ROE expectations are a root cause of the discount (trading at 0.7x 11e TNAV). We forecast a ROTE of 13.1% by 2012, and so expect the discount to narrow should changes in the portfolio come through.
Potential Catalysts
UCG and Barclays – news flow on reshaping strategy / portfolios as new management takes control, presumably starting with the FY results
April / May 2011 – business reviews post Q1 results
4Q 11 results – as banks reflect on 2011 performance and budget for 2012
9

M O R G A N S T A N L E Y R E S E A R C H
Big Debates: 2011December 8, 2010
Carlsberg Can Carlsberg Close the Valuation Discount to Peers in 2011? Morgan Stanley & Co.
International plc+
Michael Steib [email protected]
Eveline Varin [email protected]
Our View Market View
Carlsberg’s valuation gap with ABI and SAB should narrow as Russia helps deliver strong earnings growth. Carlsberg derives some 40% of its profits in Russia, where we think the risks are weighted to the upside. Strong macro-economic factors are supportive of a recovery in consumer demand, consumer trend preferences are moving in favour of beer, and future regulatory moves are likely to be softer than the tax increase put through in January 2010.
The market applies a discount to Carlsberg’s valuation due to the risks associated with its exposure to Russia. We estimate Carlsberg’s current share price is discounting long-term earnings growth of around 3.5%, against 5% on average for ABI and SAB.
What’s in the Price Carlsberg’s shares are discounting lower LT growth than peers – we think this is undeserved
0%
20%
40%
60%
80%
100%
ABInBev SABMiller Carlsberg Heineken
% v
alu
e im
plie
d in
cu
rre
nt
sha
re p
rice
Current earnings Explicit period LT growth
Carlsberg's LT growth implied in current share price remains below that of ABInBev and SABMiller
Source: FactSet (price data and consensus earnings), Morgan Stanley Research
We expect strong macro factors to support the recovery of the beer market in Russia, and forecast volume growth of 5% in FY11. Our economics team expects private consumption in Russia to grow by 4.5% next year, outperforming GDP growth. The Russian beer market was hurt badly by the recession in 2009, but with the oil price recovering, the RUB strengthening against the euro and strong stimulus-fuelled GDP forecast for 2010, we expect beer volume growth to recover over the next three years to at least Carlsberg’s medium-term guidance of 3-5% a year.
Beer should continue to gain share from vodka. Beer accounts for only 38% of alcohol consumption in Russia,
Exhibit 1
Russia’s macro environment is supportive of a recovery in consumer demand 2007 2008 2009 2010E 2011E
Real GDP (% YoY) 8.1 5.6 -7.9 3.8 4.5
Private Consumption 13.9 10.8 -7.7 4.5 5.5
Unemployment Rate (%, ILO, eop) 6.1 7.8 8.2 7.2 6.7
CPI Inflation (Annual Average) 9.0 14.1 11.7 6.7 8.5Source: Morgan Stanley Economics team
compared with an average of ~60% in Western European countries. The beer market has gained 10ppt volume market share (based on equivalent units) since 2003, and we think this trend should continue in the medium to long term.
10

M O R G A N S T A N L E Y R E S E A R C H
Big Debates: 2011December 8, 2010
Exhibit 2
In Russia, beer has consistently gained market share against spirits in the past five years
28% 30% 32% 33% 37% 38%
72% 70% 68% 67% 63% 62%
0%10%20%30%40%50%60%70%80%90%
100%
2003 2004 2005 2006 2007 2008
Ru
ssia
n V
iolu
me
ma
rke
t sh
are
(in
E
qu
iva
len
t un
it)
Beer Spirits Source: Euromonitor
In North and Western Europe, the Business Standardisation program should boost margins by ~50-80bps a year for the next five years. Carlsberg recently reiterated its medium-term group margin target of 20%, including a 15-17% margin target in N&W Europe. We forecast 16% EBIT margin in N&W Europe in FY14 with 50-80bps annual margin improvement from the Business Standardisation program.
We expect Carlsberg to deliver the fastest three-year CAGR in net sales and profits among the global brewers. Over the next three years, we forecast Carlsberg to grow organic net sales by 6-7%, against peers at 3.5-6.5%, thanks to Russian volume growth and strong margin expansion from N&W Europe. On our forecasts, Carlsberg will also deliver the fastest three-year CAGR in profit among the global brewers, at 22%. We expect Carlsberg to grow profits by ~12% versus peers at 6.5-10.5%, driven by higher margins in N&W Europe.
Exhibit 3
We are below consensus EPS for FY10e but above for FY11e
0
10
20
30
40
50
60
FY09 FY10e FY11e FY12e
ModelWare EPS (DKr) Consensus EPS (DKr)§
New MW EPS Consensus
We are 4% below consensus for FY10e but 6% above for FY11e
Source: Company data, FactSet, Morgan Stanley Research estimates (e)
Potential Catalysts
1Q CY11 – Potential government decision on restricting the sale of beer above 5% alcohol via kiosks
21 Feb 2011 – Preliminary FY10 results
11 May 2011 – 1Q11 results
Exhibit 4
We expect Carlsberg to grow sales and profit faster
Three-year CAGR
(CY11e-CY13e)
Organic net sales growth
Carlsberg (%) 6.0
ABInBev (%) 4.5
Heineken (%) 3.4
SABMiller (%) 5.9
Organic profit growth
Carlsberg (%) 12.8
ABInBev (%) 9.5
Heineken (%) 9.4
SABMiller (%) 9.7 Source: Morgan Stanley Research estimates
The shares should rerate towards ABI and SAB in the medium term, in our view. Given the robust earnings outlook, we argue that Carlsberg should trade more in line with ABI and SAB in the medium term, as higher earnings growth offsets the discount for Russia exposure that we believe should apply in the long run. We forecast a 19% three-year EPS CAGR for Carlsberg, against 15-18% for the other global brewers.
Our bull case scenario implies low double-digit organic net sales growth in FY11 versus our base case of ~7%. This could come from higher than expected pricing in N&W Europe and Russia, more than covering raw material cost pressure. Our bull case valuation of DKr 770 implies a target multiple of 16.5x CY11e.
Our base case target multiple of 15.5x Cal 11 P/E would bring the stock closer to ABI and SABMiller, which are currently trading at 15-17x. This implies more than a two-point rerating from the current valuation of 13x.
11

M O R G A N S T A N L E Y R E S E A R C H
Big Debates: 2011December 8, 2010
Biotech & Medical Technology EU Austerity Measures: Does Past Data Predict Future Performance?Morgan Stanley & Co.
International plc+
Michael Jungling [email protected]
Our View Market View
We see a risk that further EU austerity measures lead to material cuts in government healthcare budgets. Data from the previous two recessions in Europe shows that most countries experience year-on-year reductions in healthcare expenditure within two years of negative GDP growth. The recession that ended in 3Q 2009 therefore suggests headwinds to health spend in 2011 and 2012. We are cautious on the reimbursed portion of our coverage universe that is paid by the government, especially EU Pharma Distribution, Ostomy and Incontinence sub-sectors. As such, we have Underweight ratings on Celesio and Coloplast.
The market is discounting no impact from EU austerity measures across the most exposed EU medtech companies – our bear case implies -5-15% downside. While the potential impact of EU austerity measures is recognized by investors, we feel that consensus is not reflecting the risk in its numbers. Our bear case scenarios for each stock reflect the potential impact from healthcare budget declines and imply between -5% and -15% downside to consensus estimates. We therefore see downside risk should past observations on healthcare spending materialize over the next 12-24 months.
What’s in the Price Government budget cuts put our bear case EPS forecasts well below consensus estimates
0.4% 0.5%
-1.2%-1.0%
-1.4%-1.2%-1.0%-0.8%-0.6%-0.4%-0.2%0.0%0.2%0.4%0.6%
CLSGn.DE COLOb.CO
MS Sales vs. Consensus MS Bear Case Sales vs. Consensus
Source: FactSet (Consensus), Morgan Stanley Research estimates .
-7.1%
4.0%
-12.4%
-4.5%
-14.0%-12.0%-10.0%
-8.0%-6.0%-4.0%-2.0%0.0%2.0%4.0%6.0%
CLSGn.DE COLOb.CO
MS EPS vs. Consensus MS Bear Case EPS vs. Consensus
Source: FactSet (consensus), Morgan Stanley Research estimates
Past experience suggests 2011 could be the toughest year for healthcare spending To understand the risk that the financial crisis poses to European healthcare and the timing of any cuts, we refer to a McKinsey & Company report commissioned by the UK Department of Health in 2009, the results of which were released by the Coalition government in 2010. Historical data shows that in the majority of European countries, healthcare spend declines year on year within two years of negative GDP growth (Exhibit 1).
During the oil crisis of 1980-83, 77% of European countries recorded a decline in healthcare spend within two years, while during the post Soviet destabilization between 1988 and 1993, the figure was 59% of countries. Note that we
have not yet seen any material healthcare spending cuts in 2010 for most European countries, including the largest markets of Germany, the UK, France and Italy. However, Germany has made some adjustments to its pharmaceutical spend, by asking pharma companies to give larger rebates, while the UK has cut the healthcare capital budget.
Most European countries exited the recession in 3Q 2009 (Exhibit 2). In our view, it should not be surprising therefore that governments had little time to adjust cost bases in 2010, and that 2011 could well be a tougher year for European healthcare spending. This would be within the two-year time frame highlighted in the McKinsey report. As a result, we believe it is prudent for investors to take a cautious view on Europe in 2011.
12

M O R G A N S T A N L E Y R E S E A R C H
Big Debates: 2011December 8, 2010
Exhibit 1
% of EU countries with negative YOY healthcare growth within two years of negative GDP growth
77%59%
23%41%
0%
10%
20%
30%
40%
50%
60%
70%
80%
90%
100%
Oil Crisis (1980-83) Post Soviet Destabilization(1988-93)
Negative Healthcare Growth No Healthcare Decline
Source: ‘Achieving World Class Productivity in the NHS 2009/10 – 2013/14: Detailing the Size of the Opportunity’ March 2009, McKinsey & Company, Morgan Stanley Research.
Exhibit 2
European GDP growth – quarterly data
-4%
-3%
-2%
-1%
0%
1%
2%
3%
4%
Mar-06 Sep-06 Mar-07 Sep-07 Mar-08 Sep-08 Mar-09 Sep-09 Mar-10 Sep-10
France Germany Greece Italy Portugal Spain UK
Source: Morgan Stanley Research
All reimbursed names would be affected, but we see most downside for Celesio and Coloplast. Although budget constraints could affect several of our reimbursed medical device stocks, including Elekta (reduction in capital equipment spend) and Smith & Nephew (reduced procedure volumes), we are particularly cautious on the EU Pharma Distribution and Ostomy and Incontinence sub-sectors. We are therefore Underweight Celesio and Coloplast. Our bear case scenario for each stock assumes healthcare budget declines in 2011, suggesting downside to consensus estimates of at least -15% for Celesio and -5% for Coloplast.
Celesio can no longer offset downside from reimbursement cuts. Celesio has faced very negative and broad reimbursement headwinds over the past two to three years, and one could reasonsably expect that the reimbursement cycle should ease over the next few years. However, given Celesio’s material exposure to a number of
European countries with large 2010 budget deficits, including the UK (-9.2% of nominal GDP), France (-7.7%) and Germany (-4.2%), we feel the risk of further ad-hoc reimbursement changes is high. Although there is little news flow on pending reimbursement cuts – with the exception of the UK – we feel the market is not adequately reflecting the risk of healthcare reform in current valuations. Celesio’s profitability has already been materially reduced in the past two years by ad hoc reimbursement challenges, leaving little room for organic improvements to offset structural downside. We now expect the company’s two-year EPS CAGR of +8% to be below that of the EU market consensus of +10%, and see downside risk to the shares as investors assign a discount to the current market relative P/E of ~1x to closer to 0.8x.
Coloplast derives 60-70% of sales from prices regulated by EU governments. In Europe (73% of group sales) the majority of products that Coloplast sells – ostomy bags, intermittent catheters and wound dressings – are used within the community setting (often dispensed through pharmacies) and are more typically directly price regulated. We estimate that 60-70% of Coloplast’s revenues are exposed to price cuts that could result from further European austerity measures, making it the most exposed medical device company under our coverage. Our bear case assumes additional 2% pricing cuts, which reduce sales growth by c.1-1.5% a year and deliver a FY11-14e EPS CAGR of 9.7% – 220bps lower than our base case. In addition, our residual income model – which calculates the implied long-term growth rate for Coloplast based on consensus estimates – shows that since Q4 FY09 the implied market view on long-term growth has declined by 29%, while the share price has appreciated by 65%. On this basis, the stock looks expensive relative to its recent history.
Exhibit 3
Coloplast – the implied long-term growth rate is declining but the share price is increasing.
0
100
200
300
400
500
600
700
800
900
4 1 2 3 4 1 2 3 4 1 2 3 4 1 2 3 4 1 2 3 4 1 2 3 4 1 2 3 4 1 2 3 *
2002 2003 2004 2005 2006 2007 2008 2009 2010
0.0%
1.0%
2.0%
3.0%
4.0%
5.0%
6.0%
7.0%
8.0%
COLOPLAST- Price Implied long - term growth rate
Source: Morgan Stanley Research
13

M O R G A N S T A N L E Y R E S E A R C H
Big Debates: 2011December 8, 2010
Brands Is Big Becoming the New Beautiful? Morgan Stanley & Co.
International plc+
Lousie Singlehurst [email protected]
Our View Market View
‘Big’ is becoming more beautiful within brands. We believe that size is going to be a more dominant theme over the next five years as brands with the fastest growth are those with a global footprint, best-in-class product and customer service and strong brand awareness (particularly among emerging market consumers). This requires investment. We like the merits of a multibrand structure – sourcing, distribution, advertising and retail efficiencies – and think these will drive superior EBIT growth. With brands increasing their exposure to non-core categories, we explore a scenario in which Richemont expands the leather goods category within Cartier.
The market has tended to favour monobrands over large multibrands. Historically, investors have favoured monobrands for their superior growth prospects (under penetrated expansion) and potential returns (large groups typically contain sub-scale loss making brands). The market has two main concerns about the multibrand structure, in our view: 1) the inherent risk of M&A activity – strong niche brands within luxury are rare and may command a high price premium; and 2) the ability to maintain brand integrity within a large group. However, we think these preferences will begin to reverse.
Richemont – potential earnings uplift from soft category expansion scenario
1.50
2.00
2.50
3.00
3.50
4.00
2012e 2013e 2014e 2015e 2016e
EP
S €
Base Case Scenario
Source: Morgan Stanley Research estimates
We see scope for new revenue opportunities at Cartier within the soft luxury category, taking advantage of the brand’s global recognition and retail footprint
There has been no intention indicated by management to move more extensively into the soft category at Cartier, but the segment does exist in a minor capacity
The merits of a well-run leather and accessory brand – higher gross margin, higher store footfall – could have a halo effect at Cartier, in our view
The greatest challenge is to introduce a new product category and not dilute the brand image
We expect the bigger brands to outperform over the next five years. Major brands are increasing their exposure to non-core categories; for example, Watches (Gucci and Burberry), Leather goods (Bulgari and Tiffany) and Jewellery (Louis Vuitton, Chanel). Expansion into categories such as perfumes and sunglasses is now commonplace. In this context, we look at a scenario in which Richemont expands the leather goods category within Cartier.
Richement is likely to explore revenue opportunities in the soft category. Richemont has exposure to the soft category through smaller brands (Lancel, Chloe, Dunhill) but we see scope for new revenue opportunities, taking advantage of Cartier’s global brand recognition and retail footprint (c.275 stores globally). At some point, we would expect Richemont to explore the revenue opportunities of the
soft category within the group – particularly following the acquisition of net-a-porter, the leading luxury online portal, announced earlier this year. The website already sells products from brands such as Chloe, and the company has announced the launch of Mr Porter, dedicated to men’s product, which will include Dunhill.
In our scenario analysis, leather goods and accessories reach 20% of brand sales by 2016. This assumes that Richemont announces the expansion of the soft category (leather and accessories) at Cartier in 2011. We anticipate it would take time to build scale in this division, but believe the execution risk would be reduced, given Cartier would introduce new product within its own directly operated stores (using wall space not used for watches and jewellery) and would be able to monitor immediate customer feedback
14

M O R G A N S T A N L E Y R E S E A R C H
Big Debates: 2011December 8, 2010
through the retail channel. We assume initial investment in 2011 and 2012, and leather goods and accessories accounting for 20% of brand sales by 2016 (fiscal year end) with a 30% operating margin (for reference, Bulgari’s accessories division is 10% of brand sales in 2010e). This increases Richemont’s earnings by 15% in FY2016e and enhances group margin by ~250 bp (we assume a ~30% operating margin for the product category).
Over the medium term, we believe the greater demands of the luxury consumer – service, store experience and choice – coupled with rising investment demands, will become a greater challenge to the monobrands. We see Hermes as an exception (with a reported EBIT margin of 24% in 2009), reflecting its leading position within the high-end luxury category.
Exhibit 1
Greater demands of the luxury consumer will mean more pressure for the monobrands, in our view
0
50
100
150
200
250
2000
2001
2002
2003
2004
2005
2006
2007
2008
2009
2010
e
EB
IT G
row
th (10
-yr be
nchm
ark)
LVMHHermesSwatch
Richemont
Tiffany
Bulgari
Source: Company data, Morgan Stanley Research estimates (e) *Hermes is not covered, FactSet consensus used for 2010e
Exhibit 2
Brand exposure to non-core categories B rand Core competence Brand extension
Tiffany Jewellery Leather goods
Louis Vuitton Leather goods & accessories High-end jewellery Watches
Bulgari Jewellery Watches Perfume Sunglasses Leather goods
Cartier Jewellery Small leather goods
Mont Blanc Writing instruments Jewellery, leather goods
Dunhill Leather goods & accessories Watches Perfume Source: Morgan Stanley Research
Exhibit 3
Our preferred stocks are within the soft luxury category and the larger groups. We least favour the more cyclical hard luxury brands and those that lack scale (4 top picks, 4 least preferred)
-60%
-40%
-20%
0%
20%
40%
60%
LVMH Adidas PPR Pandora Bulgari Puma Swatch Richemont
Ris
k R
ew
ard
Pa
yoff
Ma
trix
Base Bear Bull
For valuation methodology and risks associated with any price targets above, please email [email protected] with a request for valuation methodology and risks on a particular stock. Source: Morgan Stanley Research estimates
15

M O R G A N S T A N L E Y R E S E A R C H
Big Debates: 2011December 8, 2010
Building & Construction Is EM Exposure an Earnings Driver or an Earnings Risk in 2011? Morgan Stanley & Co.
International plc+
Alejandra Pereda [email protected]
Our View Market View
We expect the earnings contribution from emerging markets to stagnate on a growing cost/price imbalance. Booming growth in emerging markets is pushing up the cost of energy and raw materials, and we expect cement producers to face 5-10% cost inflation in 2011. At the same time, large net capacity additions will lower utilization rates and make it harder for the industry to pass on higher costs. We therefore expect margins to fall in most emerging markets over the next 12 months, denting earnings growth for global cement companies.
Emerging markets will remain the engine of earnings growth until developed markets recover. Consensus estimates do not appear to reflect our concerns over cost and pricing in emerging markets. Thus, for the global cement players, such as Holcim, our 2011 and 2012 EBITDA expectations are 4-10% below consensus. Moreover, Holcim is still trading at a premium to peers, based on its emerging market exposure.
What’s in the Price Little concern over EM earnings delivery – Holcim has the most EM exposure and trades at a material premium to peers, even stripping out India
8
12
16
20
2010e 2011eHolcim EV/EBIT Holcim EV/EBIT ex India Cement EV/EBIT ex Holcim
Holcim (adjusted for India subsidiaries) trades at a substantial premium to other cement stocks, as investors seek EM growth. Holcim is also on a premium to locally traded EM stocks, and we see material downside potential if EM disappoint.
Source: FactSet (price data), Morgan Stanley Research estimates .
We are worried about a cost/price imbalance in emerging markets next year. With energy and distribution accounting for >50% of total cost in most emerging markets, cost inflation per tonne looks likely to remain above 5% throughout 2011. We see a risk that the industry will be unable to fully offset this increase through higher volume or prices. Pricing power in the industry is diminishing, for three key reasons:
1) Market fragmentation. Many emerging markets remain substantially less consolidated than developed markets, with small regional players still playing a material role and often prioritising market share over profitability.
2) New capacity coming on stream. We expect the influx of new plants to significantly reduce utilization rates and lead to further market fragmentation. This – coupled with the lower cash costs of new plants and the need to generate cash to pay down debt incurred in building them – could intensify price competition until utilisation recovers. We believe this could take four to eight quarters, depending on the strength of local demand.
3) Low freight costs support global trade. Average freight cost per ton remains $20 on routes between Asia, Europe and Africa, according to International Cement magazine, which
16

M O R G A N S T A N L E Y R E S E A R C H
Big Debates: 2011December 8, 2010
compares to >$80 at the 2007/08 peak. Freight capacity is also in good supply, allowing for profitable global trade to and from destinations that were not viable three years go. This adds to overall price competition.
These factors are likely to weigh on margin recovery for the global cement players in 2011. We expect Heidelberg Cement to be less affected (+290bp growth) as it has less emerging market exposure, while Holcim shows the smallest margin increase, on our forecasts, at only 60bp in 2009-2012.
Exhibit 1
Energy (mainly coal & petcoke) and distribution are >50% of cement costs in EM vs <40% in DM
% of total cost
0%
20%
40%
60%
80%
100%
Mature India Brazil/MX MiddleEast
Indonesia
Energy Transportation Raw Materials Others* Source: Company data (2009), Morgan Stanley Research
Potential Catalysts
4Q 2010 and 1H 2011 earnings are likely to show a negative cost/price balance in EM This would be the second or third quarter in a row, and could prompt investors to question near-term EM earnings growth, particularly as energy and raw materials prices trend higher
4Q 2010 and 1Q 2011 should see significant earnings growth in DM The easy comp and mild autumn should help the US and Western Europe deliver robust volume growth, neutral price/cost balance and better margins on improved cost-cutting visibility
Ongoing coal, power and oil prices will see cement companies raise energy cost guidance for 2011 Holcim has already revised guidance, announcing a 2H10 expected impact of >5% and 2011 energy per ton guidance of +4% on a group average
Exhibit 2
St Gobain and HeidelbergCement – large exposure to DM and our top picks in building materials for 2011
PT
BEAR
BASE
BULL
currentprice
7%14%
21%
-12%-9%
-60%
-40%
-20%
20%
40%
60%
80%
100%
St Gobain Lafarge HeidelbergCement CRH Holcim
For valuation methodology and risks associated with any price targets above, please email [email protected] with a request for valuation methodology and risks on a particular stock. Source: FactSet, Morgan Stanley Research estimates
17

M O R G A N S T A N L E Y R E S E A R C H
Big Debates: 2011December 8, 2010
Business & Employment Services Can HomeServe Roll Out Its UK Business Model Successfully in the US? Morgan Stanley & Co.
International plc+
Jessica Alsford [email protected]
Our View Market View
HomeServe successfully replicates its UK home emergency services business model in the US. The growth trajectory is in line with that achieved in the UK at the same point of its business life cycle, with US policies increasing from 756k in FY10 to 13.8m in FY14. HomeServe’s marketing efforts serve to educate the US consumer, improving awareness of home emergency insurance. This scenario is factored into our bull case, which implies c.165% upside potential to the shares. Our price target of 566p (c.24% upside) assumes a 15% probability of the bull case (and 10% probability of the bear case).
HomeServe does not achieve perfect execution in the US. Roll-out of the US operations is steady, but not perfect (consensus forecasts are in line with our base case). Growth is slower than that experienced in the UK, due to the fragemented Utilities market and lack of consumer awareness of home emergency services. According to our ‘What’s In the Price’ analyser, the market is currently pricing in an earnings growth rate of only c.1% post-FY13 (see chart).
What’s in the Price HomeServe’s current share price implies a growth rate of only ~1% post FY13
0.0
0.5
1.0
1.5
2.0
2.5
3.0
3.5
4.0
4.5
5.0
4 1 2 3 4 1 2 3 4 1 2 3 4 1 2 3 4 1 2 3 4 1 2 3 4 1 2 3 4 1 2 3 *
2002 2003 2004 2005 2006 2007 2008 2009 2010
-20%
-15%
-10%
-5%
0%
5%
10%HOMESERVE- Price Implied long - term grow th rate
Risk-Reward Scenarios
210p Bear Case
11.5x FY14 (March) Bear
Case EPS of 19p (-3% EPS
CAGR FY10-14e)
485p Base Case
14.0x FY14 (March) Base
Case EPS of 34.5p (12%
EPS CAGR FY10-14e)
1,210p Bull Case
14.9x FY14 (March) Bull
Case EPS of 81p (39%
EPS CAGR FY10-14e)
Earnings pressure in the UK, slower US roll-out. The UK business loses market share to the AA. Customer numbers fall by 3% pa, whilst prices also decline by the same amount. The US strategy works, but it is slower to make progress.
Slowing growth in UK, steady growth in US and CE. UK EBITA growth slows to +6% (FY10-14e) compared to +18% in FY05-10. HomeServe continues to increase its penetration and profitability in the US and CE, with US penetration increasing +140bp to 7.2% and EBITA to £26.1m (from £1.5m in FY10). This results in low double-digit EPS growth over the next four years.
Successful growth strategy in US and UK. US affinity partners treble to 64m by 2014, with the penetration rate reaching 12% (vs 12.3% in the UK). Revenue per customer increases from $101 in the base case to $115 in the bull case, driven by multiple policies and price inflation. In the UK, HomeServe achieves +8% customer growth pa.
Source: FactSet (price data), Morgan Stanley Research estimates
18

M O R G A N S T A N L E Y R E S E A R C H
Big Debates: 2011December 8, 2010
Potential Catalysts
January / February 2011 3Q11 IMS will provide an update on progress in the US, including efforts to increase penetration
Ad hoc HomeServe doubled its US Affinity Partner (AP) households this year by aquiring existing policies and entering into AP marketing agreements. We expect this kind of activity to continue in 2011 and to positively impact the shares
Our bull case scenario assumes a successful US growth strategy. The US market is five times the size of the UK in terms of households, and market penetration is much lower at c.10% (vs. 32% in the UK). Over the next three years, HomeServe achieves perfect execution in this market, capitalizing on the progress it has made so far (total number of US policies has grown by an average 20% p.a. since 2005 to 756k in 2010, while AP households have increased from 0.5m to 20m).
HomeServe grows its US operations through acquisitions and AP marketing agreements. HomeServe has a strong growth track record in the UK under its current CEO and founder. It leverages its expertise in this market to capitalize on the US opportunity through acquisitions of existing policy books, new marketing agreements with APs and increased brand awareness.
The business grows customer numbers by educating US consumers on the benefits of home emergency cover. Consumer education is key to the business’s success. Our AlphaWise survey showed that initially only 4% of non-policy holders surveyed said they were extremely or quite likely to take out a policy. However, once respondents were made aware of HomeServe’s offering, 31% said they would consider taking out a policy.
US EBITA grows rapidly from £1.5m in FY10 to £166m in FY14. This assumes that HomeServe increases its number of US Affinity Partner households from 20m at present to 64m in FY14. The penetration of this marketable consumer base also increases from 5.8% in FY10 to 12.0% in FY14.
Beyond FY14, the US opportunity is even bigger. In our blue sky scenario, we assume that the US business reaches the levels of penetration and income per customer that HomeServe currently achieves in the UK. This alone would mean that the US business generates c. £390m of EBITA – almost four times FY10 group EBITA of £104m.
Exhibit 1
The US market is much less developed than the UK
0 20 40 60 80 100 120 140
UK
US
HomeServe policies relative to total country households (mn)
FY10 FY14e - Base FY14e - Bull Potential
Source: Company data, Morgan Stanley Research e = Morgan Stanley Research estimates
Exhibit 2
Bull case assumes the same household penetration rate in US as in UK after 12 years of operations
UK 2010
UK 2014e
US 2010 US 2014e
US Bull Case
0%
5%
10%
15%
20%
25%
30%
35%
1 2 3 4 5 6 7 8 9 10 11 12 13 14 15 16 17 18 19 20 21 22
No. of yrs of operation
No
. of
polic
ies
as
% o
f Ho
use
hol
ds
Source: Morgan Stanley Research estimates
Exhibit 3
Replicating the UK success story increases US bull case EBITA by c.180%
0
100
200
300
400
500
600
FY14 group basecase EBITA
FY14 base case+ US bull case
FY14 base case+ US bull case +
US blue sky
EB
ITA
(£m
n)
+85%
+240%
+85%
Source: Morgan Stanley Research estimates
19

M O R G A N S T A N L E Y R E S E A R C H
Big Debates: 2011December 8, 2010
Capital Goods Will Grid Investment Recover in 2011? Morgan Stanley & Co.
International plc+
Ben Uglow [email protected]
Our View Market View
An upside surprise on grid investment drives expectations higher for ABB and Schneider. Grid investment will be the key upside surprise for 2011, we believe, and will be at least double the growth rates in consensus earnings models. We expect international suppliers to surprise the market in 1H11 by winning large UHV contracts – even in China. Although some pricing pressure will remain next year, it will not be as acute as consensus currently believes.
Grid investment will remain subdued and transformer pricing will fall further. The prevailing view embedded in consensus is that grid investment will remain subdued in 2011, with growth rates in low to mid single digits. The Chinese market will remain dominated by local suppliers. Internationally, the secular shift in transformer production will continue to depress prices, driving transformer margins lower.
What’s in the Price ABB shares are pricing in weakness in grid investment in 2011
Morgan Stanley Risk-Reward (left) versus Probabilities Implied by Option Prices (right)
Source: FactSet (price data), Morgan Stanley Research estimates
Four drivers of higher grid investment
1. We think State Grid spending in China will come back strongly next year, an increase from Rmb330bn in 2010 to Rmb370bn (+12%). Chinese companies alone will not be able to meet additional demand in the UHV segment, and this could lead to large contract awards – which would be a surprise – for ABB, Alstom and Siemens, in particular.
2. Commercial adoption of so-called ‘smart grid’ applications will begin in earnest in 2011. In a recent presentation, Schneider Electric showed that there could be
an incremental opportunity of €40bn+ in smart grid between 2015 and 2020. We see the single biggest market opportunity in distribution automation: Pike Research estimates the global market increases from $2.2bn in 2010 to $8.8bn by 2012.
3. In the US, SPX (the largest domestic transformer manufacturer) recently indicated that demand was bottoming out and that its transformer backlog had increased by ~14%. The Edison Electric Institute, the largest industry association in the US, expects transmission investment to increase from $9.7bn in 2010 to $12.3bn in 2013, an 8.3% CAGR.
20
M O R G A N S T A N L E Y R E S E A R C H
Big Debates: 2011December 8, 2010
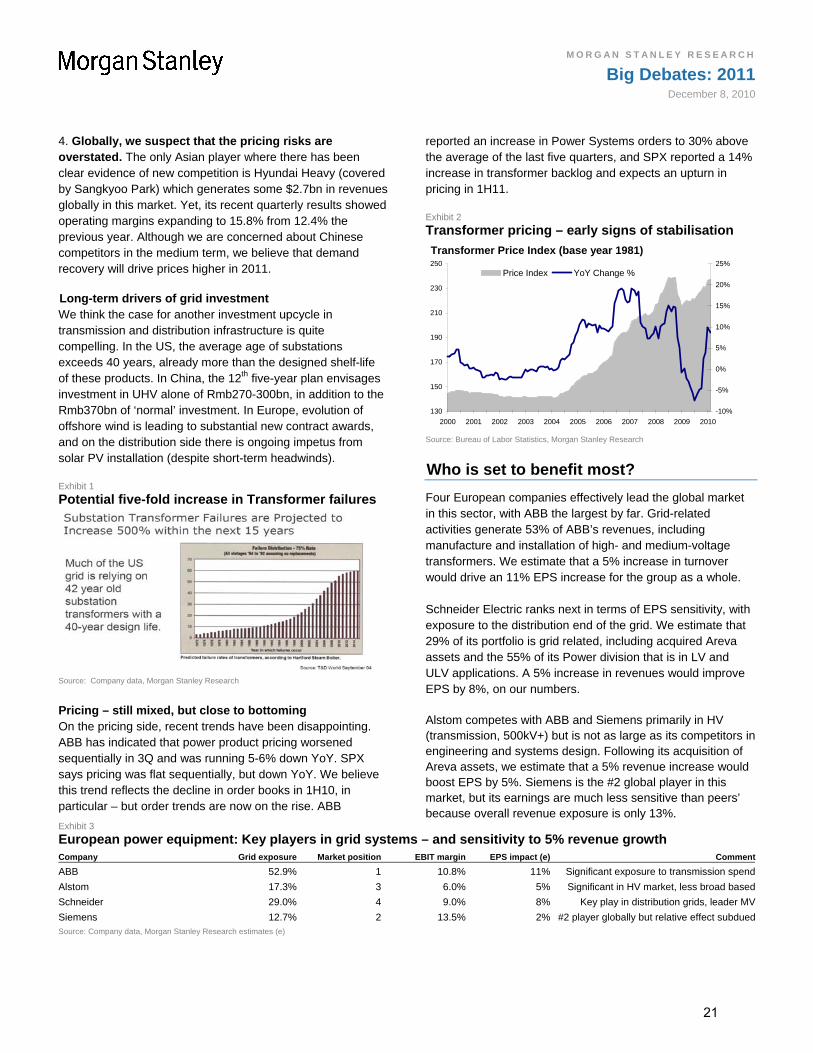
4. Globally, we suspect that the pricing risks are overstated. The only Asian player where there has been clear evidence of new competition is Hyundai Heavy (covered by Sangkyoo Park) which generates some $2.7bn in revenues globally in this market. Yet, its recent quarterly results showed operating margins expanding to 15.8% from 12.4% the previous year. Although we are concerned about Chinese competitors in the medium term, we believe that demand recovery will drive prices higher in 2011.
Long-term drivers of grid investment We think the case for another investment upcycle in transmission and distribution infrastructure is quite compelling. In the US, the average age of substations exceeds 40 years, already more than the designed shelf-life of these products. In China, the 12th five-year plan envisages investment in UHV alone of Rmb270-300bn, in addition to the Rmb370bn of ‘normal’ investment. In Europe, evolution of offshore wind is leading to substantial new contract awards, and on the distribution side there is ongoing impetus from solar PV installation (despite short-term headwinds).
Exhibit 1
Potential five-fold increase in Transformer failures
Source: Company data, Morgan Stanley Research
Pricing – still mixed, but close to bottoming On the pricing side, recent trends have been disappointing. ABB has indicated that power product pricing worsened sequentially in 3Q and was running 5-6% down YoY. SPX says pricing was flat sequentially, but down YoY. We believe this trend reflects the decline in order books in 1H10, in particular – but order trends are now on the rise. ABB
reported an increase in Power Systems orders to 30% above the average of the last five quarters, and SPX reported a 1increase in transf
4% ormer backlog and expects an upturn in
pricing in 1H11.
Transformer pricing – early signs of stabilisation Exhibit 2
Transformer Price Index (base year 1981)
130
150
170
190
210
230
250
2009 2010
-10%
-5%
0%
5%
10%
15%
20%
25%Price Index
2000 2001 2002 2003 2004 2005 2006 2007 2008
YoY Change %
Source: Bureau of Labor Statistics, Morgan Stanley Research
Who is set to benefit most?
Four European companies effectively lead the global min this sector, with ABB the largest by far. Grid-relatedactivities generate 53% of ABB’s revenues, including manufacture and installation of high- and medium-voltage transformers. We estimate that a 5% increase in turnover
arket
would drive an 11% EPS increase for the group as a whole.
t
se in revenues would improve EPS by 8%, on our numbers.
uld
han peers’ because overall revenue exposure is only 13%.
Schneider Electric ranks next in terms of EPS sensitivity, with exposure to the distribution end of the grid. We estimate tha29% of its portfolio is grid related, including acquired Arevaassets and the 55% of its Power division that is in LV and ULV applications. A 5% increa
Alstom competes with ABB and Siemens primarily in HV (transmission, 500kV+) but is not as large as its competitors inengineering and systems design. Following its acquisition of Areva assets, we estimate that a 5% revenue increase woboost EPS by 5%. Siemens is the #2 global player in this market, but its earnings are much less sensitive t
Exhibit 3
European power equipment: Key players in grid systems – and sensitivity to 5% revenue growth Company Grid exposure Market position EBIT margin EPS impact (e) Comment
on spendABB 52.9% 1 10.8% 11% Significant exposure to transmissi
Alstom
Schneid
17.3% 3 6.0% 5% Significant in HV market, less broad based
er
Siemens
29.0% 4 9.0% 8% Key play in distribution grids, leader MV
12.7% 2 13.5% 2% #2 player globally but relative effect subduedSource: Company data, Morgan Stanley Research estimates (e)
21
M O R G A N S T A N L E Y R E S E A R C H
Big Debates: 2011December 8, 2010
Chemicals Petrochemical Margins – Imminent Decline or Supercycle? Morgan Stanley & Co.
International plc+
Paul Walsh [email protected]
Peter Mackey [email protected]
Our View Market View
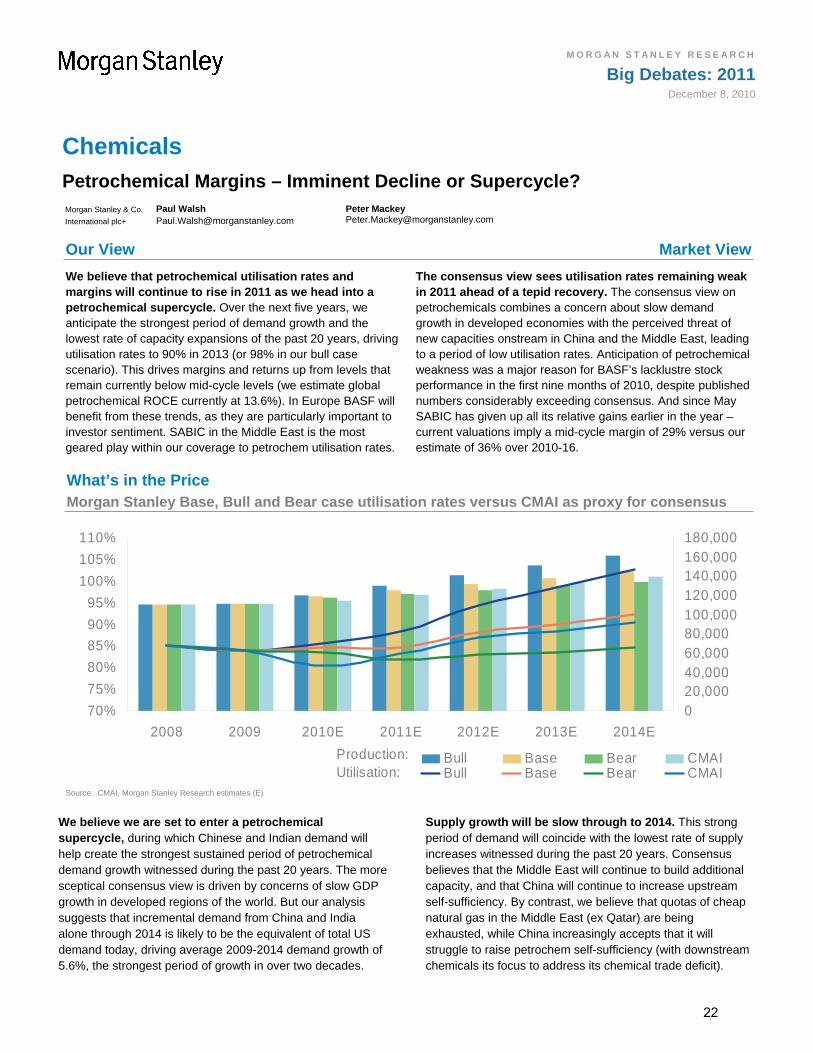
We believe that petrochemical utilisation rates and margins will continue to rise in 2011 as we head into a petrochemical supercycle. Over the next five years, we anticipate the strongest period of demand growth and the lowest rate of capacity expansions of the past 20 years, driving utilisation rates to 90% in 2013 (or 98% in our bull case scenario). This drives margins and returns up from levels that remain currently below mid-cycle levels (we estimate global petrochemical ROCE currently at 13.6%). In Europe BASF will benefit from these trends, as they are particularly important to investor sentiment. SABIC in the Middle East is the most geared play within our coverage to petrochem utilisation rates.
The consensus view sees utilisation rates remaining weak in 2011 ahead of a tepid recovery. The consensus view on petrochemicals combines a concern about slow demand growth in developed economies with the perceived threat of new capacities onstream in China and the Middle East, leading to a period of low utilisation rates. Anticipation of petrochemical weakness was a major reason for BASF’s lacklustre stock performance in the first nine months of 2010, despite published numbers considerably exceeding consensus. And since May SABIC has given up all its relative gains earlier in the year – current valuations imply a mid-cycle margin of 29% versus our estimate of 36% over 2010-16.
What’s in the Price Morgan Stanley Base, Bull and Bear case utilisation rates versus CMAI as proxy for consensus
70%
75%
80%
85%
90%
95%
100%
105%
110%
2008 2009 2010E 2011E 2012E 2013E 2014E
020,00040,00060,00080,000100,000120,000140,000160,000180,000
Bull Base Bear CMAIBull Base Bear CMAIUtilisation:
Production:
Source: CMAI, Morgan Stanley Research estimates (E)
We believe we are set to enter a petrochemical supercycle, during which Chinese and Indian demand will help create the strongest sustained period of petrochemical demand growth witnessed during the past 20 years. The more sceptical consensus view is driven by concerns of slow GDP growth in developed regions of the world. But our analysis suggests that incremental demand from China and India alone through 2014 is likely to be the equivalent of total US demand today, driving average 2009-2014 demand growth of 5.6%, the strongest period of growth in over two decades.
Supply growth will be slow through to 2014. This strong period of demand will coincide with the lowest rate of supply increases witnessed during the past 20 years. Consensus believes that the Middle East will continue to build additional capacity, and that China will continue to increase upstream self-sufficiency. By contrast, we believe that quotas of cheap natural gas in the Middle East (ex Qatar) are being exhausted, while China increasingly accepts that it will struggle to raise petrochem self-sufficiency (with downstream chemicals its focus to address its chemical trade deficit).
22
M O R G A N S T A N L E Y R E S E A R C H
Big Debates: 2011December 8, 2010
Potential Catalysts
Start-up of new petrochemical plants The last slug of new facilities are likely to commence production during 1Q 2011, when we expect 3.3 million tons of ethylene capacity to enter the market, which represents 2.3% of global capacity. Such a supply increase will likely result in some moderation of prices in Asia, which will feed through worldwide. Once we have experienced these capacity increases, we expect industry utilization rates to tighten for the next 4-5 years.
Utilisation rates to rise to 90% in 2013. With supply increases between 2010 and 2014 set to average just 2.8% – half the rate of demand growth – global utilisation rates are set to tighten from 84% in 2009 to above 90% from 2013. Such a tightening will be a favourable tailwind for the global industry. In the short term, we could see some easing of utilisation rates in 1H 2011, driven by the last of the current phase of capacity expansions (largely in Thailand), but we see the situation tightening again as 2011 develops.
Investor sentiment is driven by petrochemical margins for BASF. Chemicals and Plastics, BASF’s two upstream divisions most exposed to the petrochemical cycle, account for ~32% of group sales and 36% of EBIT. BASF sells very limited quantities of upstream petrochemicals to external customers, but essentially crystalises the petrochemical margin within its integrated structure. The group is not heavily
geared to petrochemical margins, but it is a strong influence on investor sentiment, so will likely provide support for the stock in 2011.
SABIC is the purest play on rising petrochemical prices. Within our Europe and EEMEA coverage, SABIC is the company with the greatest exposure to strong petrochemical prices driven by rising utilisation rates. With a relatively fixed feedstock base (at attractive rates), it will also benefit from a broadly rising oil price environment. Petrochemical activities account for 85% of sales and 76% of EBIT, and our bull case pricing assumptions (based on 98% utilisation by 2014) would drive 63% upside to our 2013 EPS forecasts.
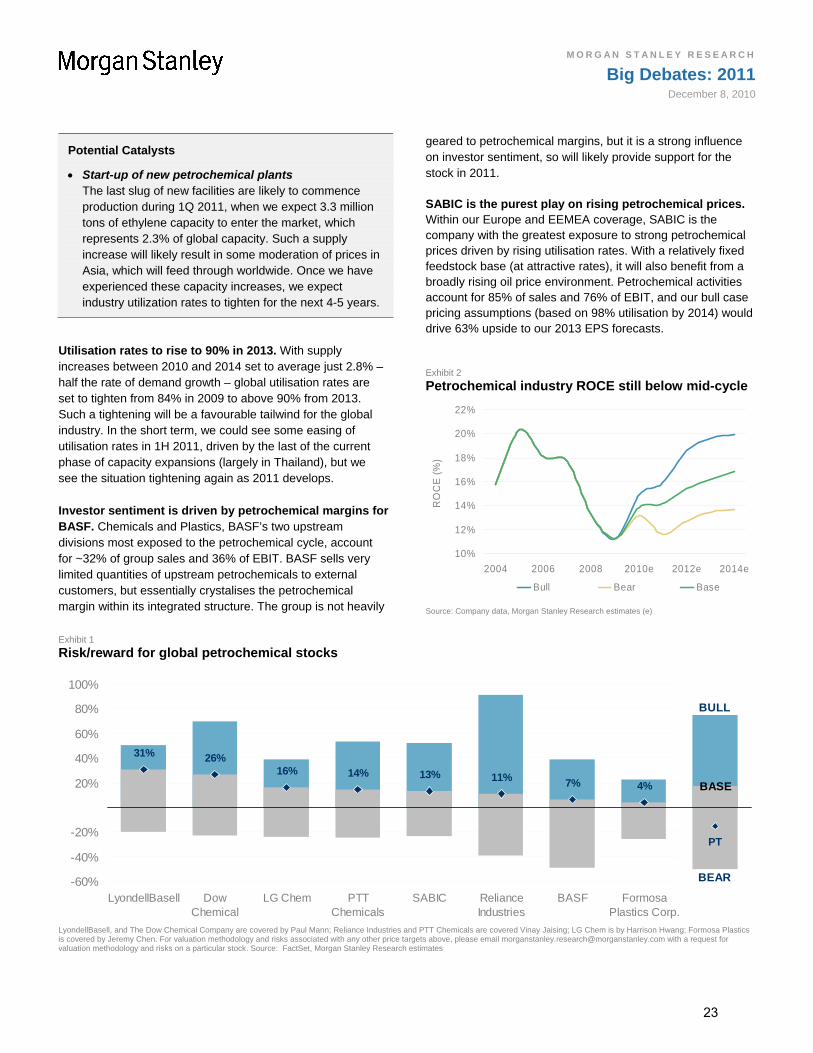
Exhibit 2
Petrochemical industry ROCE still below mid-cycle
10%
12%
14%
16%
18%
20%
22%
2004 2006 2008 2010e 2012e 2014e
RO
CE
(%
)
Bull Bear Base
Source: Company data, Morgan Stanley Research estimates (e)
Exhibit 1
Risk/reward for global petrochemical stocks
31% 26%16% 14% 13% 11% 7% 4%
PT
BASE
BEAR
BULL
-60%
-40%
-20%
20%
40%
60%
80%
100%
LyondellBasell DowChemical
LG Chem PTTChemicals
SABIC RelianceIndustries
BASF FormosaPlastics Corp.
LyondellBasell, and The Dow Chemical Company are covered by Paul Mann; Reliance Industries and PTT Chemicals are covered Vinay Jaising; LG Chem is by Harrison Hwang; Formosa Plastics is covered by Jeremy Chen. For valuation methodology and risks associated with any other price targets above, please email [email protected] with a request for valuation methodology and risks on a particular stock. Source: FactSet, Morgan Stanley Research estimates
23

M O R G A N S T A N L E Y R E S E A R C H
Big Debates: 2011December 8, 2010
Clean Energy EDP Renovaveis: Further Capex Cuts Could Crystallize Value Morgan Stanley & Co.
International plc+
Allen Wells [email protected]
Andrew Humphrey [email protected]
Our View Market View
We believe further capex cuts at EDPR are possible and would be taken positively by the market. We think the market is too bearish on macro and regulatory drivers. Concerns over potentially dilutive expansion are real, though we see a possibility that further capex cuts in 2011 could crystallize value in the shares. We believe the shares would generate a Free Cash Flow Yield of 11% in 2012 and 13% in 2013, assuming management cuts all growth capex, other than for those assets currently under construction. Our assumptions on power prices are conservative, and we see the regulatory outlook as unlikely to deteriorate further.
The market is cautious on tariff cuts and growth dilution. Investors have been cautious on the Spanish government’s proposals to cut wind tariffs. Uncertainty persists here, but resolutions proposed to date have been fairly benign for the wind sector. We believe the shares are pricing in a 25% cut to Spanish tariffs (fixed, tariff, premium and tariff floor), and only inflationary increases in US power prices. Alternatively, we estimate the shares are pricing in cost of equity of 12.5%, or a blended WACC of 8.9%. While debt costs should rise over coming years, this is already reflected in our long-term cost of capital estimates, and we think this view is too bearish.
What’s in the Price The stock is pricing in a 25% reduction to Spanish tariffs and downside to US power prices
€7.40 (+91%)
€ 3.87€4.7 (+22%)
€8.4 (+117%)
0
1
2
3
4
5
6
7
8
9
Dec-09 Jun-10 Dec-10 Jun-11 Dec-11
€
Price Target (Dec-11) Historical Stock Performance Current Stock Price Risk-Reward Scenarios
€4.7 Bear Case
20x P/E on Bear Case
C2011 Adj. EPS of €0.239
€7.4 Base Case
30x P/E on Base Case
C2011 Adj. EPS of €0.249
€8.4 Bull Case
34x P/E on Bull Case
C2010 Adj. EPS of €0.244
Value of operating assets. No new capacity after 2010, fair value equals value of assets as of Dec-10. LT Spanish pool prices of €42 per MWh.
Solid growth, muted power price outlook. New capacity at ~1.2GW in 2010-12. Power hedges protect earnings in Spain from low pool prices in 2010. LT Spanish prices at €65/MWh. 20-27% EPS growth in 2010-12 on the impact from new capacity and higher power prices.
Accelerating new capacity growth, bullish power price recovery. 1.5-1.6GW pa installed in 2010-15. LT Spanish prices at €82/MWh by 2018, solid power prices across other regions.
Source: FactSet (price data), Morgan Stanley Research estimates
24

M O R G A N S T A N L E Y R E S E A R C H
The Big Debates: 2011December 8, 2010
Potential Catalysts
Early 2011 Spanish government to finalise tariff package for existing renewable energy assets, following discussion with the industry. Early draft already published
Mid-late 2011 Further capex cuts in 2011 and 2012 from wind developers. While this would naturally slow long-term growth, we believe it could substantially improve near-term cash generation
The market is too bearish on Spanish tariffs, in our view. While the issue of regulated tariffs for Spanish wind assets remains unresolved, we believe the market is pricing in too bearish a scenario. On our estimates, the shares reflect a 25% reduction to the tariff premium, fixed-tariff option, and to the guaranteed floor for wind, applied to all assets in the portfolio. Furthermore, the shares are pricing in no upside to average 2010 US power prices, which are ~10% lower than current blended levels reported by the company. While US wind farms currently selling power on the merchant market are not earning their cost of capital, we believe this is too bearish an expectation for the long term. Looked at another way, the current share price reflects a value for only the existing wind assets of €1.1m/MW – roughly 10% below replacement cost.
Further capex cuts are likely in this scenario. If the scenario outlined above plays out, we believe EDPR management would cut capex, rather than pursue dilutive capacity expansion. On our estimates, cutting capex to a minimum would put the shares on a FCF yield of 11% in 2012 and 13% in 2013, which we believe would be highly attractive for investors. Management has already cut capex materially in 2010, but it could instigate further cuts in the event that the broader macro environment does not improve (i.e. the Spanish government introduces larger cuts, or PPAs are not signed in the US). We view this as a potential catalyst for sentiment turning more positive on the shares.
EDPR had 900MW under construction at end of 3Q. We assume 300MW is built out in 4Q, and of the remaining 600MW, 450MW comes online in 2011 and 150MW in 2012, with a normal ramp profile. We are encouraged that only 122MW of capacity under construction is in the US, where we view risk as highest in terms of built assets being stuck selling power at depressed spot market prices. EDPR has significant flexibility here.
For the purposes of this analysis, we assume EDPR rolls out only the 900MW already under construction at 3Q, and undertakes no further uncommitted growth capex thereafter. In this scenario, EDPR buys out its stake in its Portuguese JV in 2013. The company does not develop the 370MW of cumulative capacity in the US, where PPAs are under late stage negotiation (PJM, North West), or where a long-term contract for the RECs is already in place (170MW), though both are likely to come on line in the next two years.
Exhibit 1
FCFE increases dramatically if capex is cut
-1,500
-1,000
-500
0
500
2009 2010e 2011e 2012e 2013e
FC
FE
-40%
-30%
-20%
-10%
0%
10%
20%
Base Case FCFE Capex cuts FCFE FCF Yield (%)
Source: Company data, Morgan Stanley Research estimates (e)
Our power price and macro estimates are conservative. We assume average Spanish power prices of €43/MWh in 2011, €44/MWh in 2012 and €53/MWh in 2013, compared to €42/MWh currently. We assume US blended prices of $55/MWh in 2011, $57/MWh in 2012 and $59/MWh in 2013, compared to $49/MWh over the first 9 months of 2010. We are also comfortable that our estimates reflect rising costs of financing. Our WACC estimates, which determine valuation for the assets, reflect 7.5% long-term cost of debt. If current low rates persist for a protracted period, there would effectively be upside to equity value. Inflation-linked tariffs in major markets are also defensive from a macro point of view.
Exhibit 2
Our assumptions on power prices are conservative
-
10
20
30
40
50
60
2009 2010e 2011e 2012e 2013e
Po
we
r p
rice
s (p
er
MW
h)
Spain (EUR/MWh) US ($/MWh)
Source: Company data, Morgan Stanley Research estimates (e)
25

M O R G A N S T A N L E Y R E S E A R C H
Big Debates: 2011December 8, 2010
Food Producers Will Danone Return to Historical Growth Rates? Morgan Stanley & Co.
International plc+
Michael Steib [email protected]
Our View Market View
Danone will re-emerge as the fastest-growing food company in 2011, restoring the historical valuation premium to the shares. Danone’s core yogurt division should deliver sustained volume growth of 6% in 2011, as per capita consumption in core markets continues to grow and the company expands to new geographies. Strong operating leverage means this should make Danone the fastest grower in European food in terms of sales, earnings and cash flow. As a result, we think the shares can steadily regain the 2-3 multiple point premium to peers that they commanded back in 2008.
The market is sceptical that Danone can sustain growth rates in the yogurt category. At 60% of Danone’s sales, the yogurt category has historically been among the highest growth and most innovative segments in the global Food space. But, the consensus view is that growth will be impaired by consumer downtrading and regulatory changes that slow innovation.
We estimate the shares are discounting long-term growth of just 1.8%, compared to the 3% delivered historically.
What’s in the Price The market’s cautious outlook for the yogurt category has driven down growth expectations
0
10
20
30
40
50
60
70
4 1 2 3 4 1 2 3 4 1 2 3 4 1 2 3 4 1 2 3 4 1 2 3 4 1 2 3 4 1 2 3 *
2002 2003 2004 2005 2006 2007 2008 2009 2010
-3.0%
-2.0%
-1.0%
0.0%
1.0%
2.0%
3.0%
4.0%
5.0%
6.0%
DANONE- Price Implied long - term growth rate
Risk-Reward Scenarios
€40 Bear Case
14x Bear Case 2011e Adj.
EPS of €2.85
€52 Base Case
16x Base case 2011e Adj.
EPS of €3.16
€57 Bull Case
17x Bull Case 2011e Adj.
EPS of €3.35
Danone suffers from a sharp downturn in Western Europe in 2011. Austerity measures drive a -5% decline in demand across the business, with modest growth thereafter. Underlying net income growth of 9% to 2012, driving a de-rating of the stock.
Strongest growth profile in European Food. Danone delivers 6-7% ongoing organic growth with Dairy sustaining recovery. Margin gains of 20 bps pa and strong cash flow growth drive 12% underlying net income CAGR to 2012.
Danone returns to its historical growth profile from 2011. Organic growth of over 7% is driven by high-single digit growth in Dairy and over 10% growth in Baby and Medical. Margin gains of 50 bps pa from operational leverage. Underlying net income growth of 15% to 2012.
Source: FactSet (historical share price data), Morgan Stanley Research estimates
26

M O R G A N S T A N L E Y R E S E A R C H
Big Debates: 2011December 8, 2010
Potential Catalysts
FY10 Results February 15, 2011 Danone’s strong 4Q momentum and 2H margin recovery should reassure investors
Danone Capital Markets days May 24-25, 2011 Danone could raise guidance for long-term growth from 5%+ to 6%+, with consolidation of Unimilk in Russia and strong trends in Dairy
Ongoing market data from IRI and Nielsen Monthly data should show strong volume growth for Europe/North America, with share gains for Danone
We think the market underestimates the growth outlook for yogurt. Yogurt has delivered ongoing growth of 6% since 2005, as per capita consumption has increased in developed markets and the category has become established in many emerging markets. Growth slowed in 2008 as prices rose to cover milk inflation and markets focused on premiumisation, but recovered this year as pricing reversed. We think the global yogurt market can maintain mid-single-digit volume growth with a positive value contribution, as there is still scope for per capita consumption in Western Europe to grow to the levels of France and Spain and the share of value-added (e.g. probiotic) yogurts in the market to increase. Innovation in Dairy should remain strong, particularly as greater clarity around EFSA regulations should give companies more comfort in designing scientific dossiers that support health claims and maintaining a high level of innovation. In emerging markets, per capita consumption remains low, but Danone’s experience in Russia (today 10% of group sales) suggests it can build leading positions and develop overall markets to deliver ongoing growth.
Exhibit 1
Danone’s volume growth in Dairy should stabilize at a high level, with a small positive value contribution
-8%-6%-4%-2%0%2%4%6%8%
10%12%14%
1Q
07
2Q
07
3Q
07
4Q
07
1Q
08
2Q
08
3Q
08
4Q
08
1Q
09
2Q
09
3Q
09
4Q
09
1Q
10
2Q
10
3Q
10
4Q10
e
FY
10e
FY
11e
Volume growth Pricing
Volume growth should stabilise at~6% in coming quarters
Pricing/mix a small positive for organic
growth
Source: Company data, Morgan Stanley Research estimates (e)
Danone should continue to outgrow the market. With 18% share of the global yogurt market, Danone is the only truly international player, and has a strong track record of driving market growth through innovation and building growth platforms in emerging markets (organically and through M&A).
Cash generation is improving … Higher volume growth in Dairy should boost cash flow, given the negative working capital cycle in this business. Also, post integration of Numico, Danone aims to drive working capital efficiency towards the overall group level over the next few years.
… and returns to shareholders are an option. Danone will consider cash returns above its ongoing target net debt / EBITDA of 2.5x, which suggests it is not considering further large-scale M&A. It will also buy back €500m worth of stock in coming months, returning the proceeds of recent disposals.
Exhibit 2
Danone’s FCF growth (2006-12e)
7.4%
-13.2%
18.4%
24.1%29.2%
18.3%
9.9%
-20%-15%-10%
-5%0%5%
10%15%20%25%30%
2006 2007 2008 2009 2010e 2011e 2012e
Source: Company data, Morgan Stanley Research, e = Morgan Stanley Research estimates
Exhibit 3
Danone should see leading sales, earnings and free cash flow growth among European Food Producers 2010-12e CAGR (%) Danone Nestle Unilever
Organic sales 6.5 5.2 4.5
EBIT 9.0 6.5 6.0
Net income 12.1 9.3 8.8
Free cash flow 14 9 12Source: Company data, Morgan Stanley Research, e = Morgan Stanley Research estimates
Exhibit 4
Danone’s P/E is in line with European Food peers – but we think it can regain its 2-3 point premium
10x
12x
14x
16x
18x
20x
22x
24x
Fo
rwa
rd P
E
-1x
0x
1x
2x
3x
4x
5x
6x
Mu
ltip
le P
oin
ts P
rem
ium
Point Premium to European Food (RHS) PE (LHS)
September 2004 November 2010
Source: FactSet, Morgan Stanley Research
27
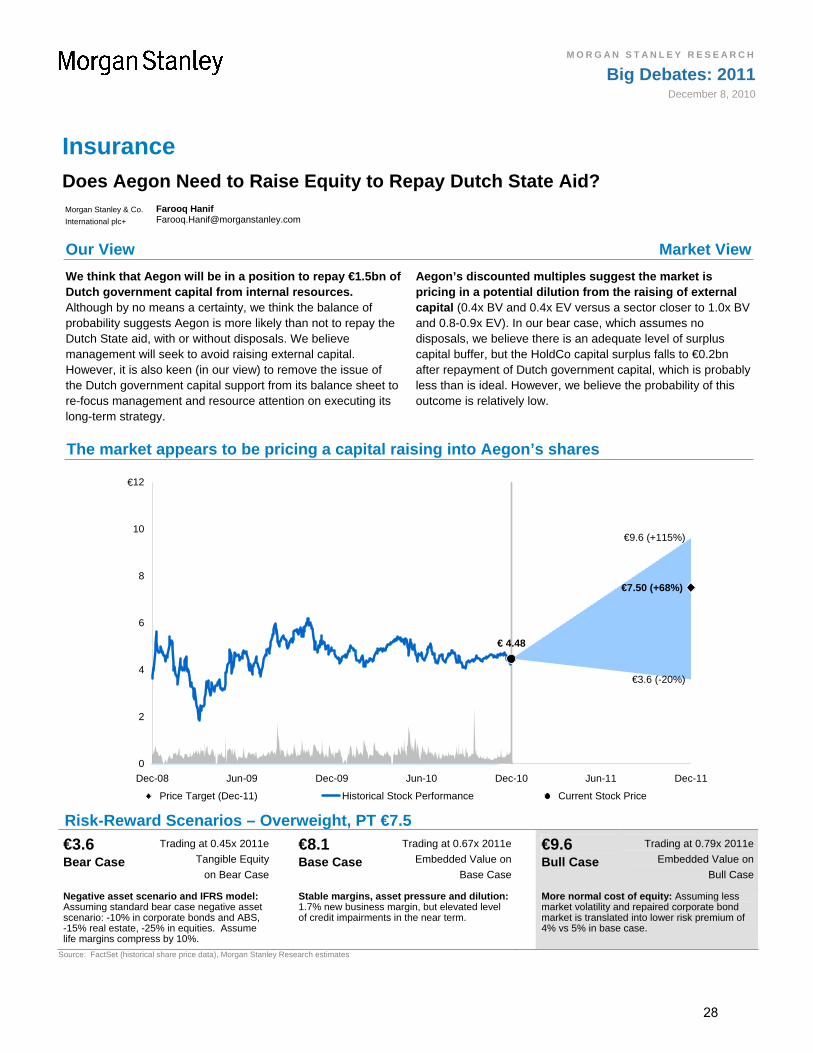
M O R G A N S T A N L E Y R E S E A R C H
Big Debates: 2011December 8, 2010
Insurance Does Aegon Need to Raise Equity to Repay Dutch State Aid? Morgan Stanley & Co.
International plc+
Farooq Hanif [email protected]
Our View Market View
We think that Aegon will be in a position to repay €1.5bn of Dutch government capital from internal resources. Although by no means a certainty, we think the balance of probability suggests Aegon is more likely than not to repay the Dutch State aid, with or without disposals. We believe management will seek to avoid raising external capital. However, it is also keen (in our view) to remove the issue of the Dutch government capital support from its balance sheet to re-focus management and resource attention on executing its long-term strategy.
Aegon’s discounted multiples suggest the market is pricing in a potential dilution from the raising of external capital (0.4x BV and 0.4x EV versus a sector closer to 1.0x BV and 0.8-0.9x EV). In our bear case, which assumes no disposals, we believe there is an adequate level of surplus capital buffer, but the HoldCo capital surplus falls to €0.2bn after repayment of Dutch government capital, which is probably less than is ideal. However, we believe the probability of this outcome is relatively low.
The market appears to be pricing a capital raising into Aegon’s shares
WARNINGDONOTEDIT_RRS4RL~AEGN.AS~
€7.50 (+68%)
€ 4.48
€3.6 (-20%)
€9.6 (+115%)
0
2
4
6
8
10
12
Dec-08 Jun-09 Dec-09 Jun-10 Dec-10 Jun-11 Dec-11
€
Price Target (Dec-11) Historical Stock Performance Current Stock Price
Risk-Reward Scenarios – Overweight, PT €7.5
€3.6 Bear Case
Trading at 0.45x 2011e
Tangible Equity
on Bear Case
€8.1 Base Case
Trading at 0.67x 2011e
Embedded Value on
Base Case
€9.6 Bull Case
Trading at 0.79x 2011e
Embedded Value on
Bull Case
Negative asset scenario and IFRS model: Assuming standard bear case negative asset scenario: -10% in corporate bonds and ABS, -15% real estate, -25% in equities. Assume life margins compress by 10%.
Stable margins, asset pressure and dilution: 1.7% new business margin, but elevated level of credit impairments in the near term.
More normal cost of equity: Assuming less market volatility and repaired corporate bond market is translated into lower risk premium of 4% vs 5% in base case.
Source: FactSet (historical share price data), Morgan Stanley Research estimates
28

M O R G A N S T A N L E Y R E S E A R C H
Big Debates: 2011December 8, 2010
Aegon aims to repay the remaining €1.5bn of Dutch government capital by June 2011, as part of its agreement with the European Commission. This involves a payment of €2.25bn including a repayment penalty.
In our view, to do this Aegon needs to have sufficient group surplus capital of, say, at least €1-1.5bn above a ‘AA’ rating requirement. In addition, it needs to have sufficient HoldCo surplus capital: Aegon can only repay debt from its HoldCo resources and cannot use surplus capital that is tied up in business units that cannot be transferred out. It also needs to try to make sure that there is some buffer HoldCo surplus after repaying the Dutch State, to meet interest payments and other liquidity requirements. We estimate a residual buffer of ~€0.5bn would be ideal at the HoldCo.
We show our bear, base and bull case estimates for the evolution of Aegon’s group capital surplus and HoldCo surplus in Exhibits 1 and 2. These model the possible outcomes over 1H11 and assume that Aegon repays the Dutch government capital (with a 50% penalty) at end June 2011: a payment of €2.25bn altogether.
Our scenario analysis suggests a comfortable level of group capital surplus to repay the Dutch State, with or without disposals. In our bear case, which assumes there are no disposals and takes into account negative market-related effects, our forecasts suggest a €1.1bn surplus capital position after repaying the Dutch government capital. We believe this is an adequate level of surplus capital buffer.
HoldCo capital surplus is more stressed if Aegon does not make disposal gains. Our analysis allows for the amount of surplus capital that could be generated and then released to the HoldCo from disposals of between €0.7bn and €1.6bn in the base and bull cases, but assumes no disposals in the bear case. Allowing for the release of other surplus buffer capital from business units, we believe Aegon would be left with a comfortable surplus HoldCo capital position if it can make disposals with a cumulative impact of this order of magnitude. Without any disposals, HoldCo surplus could fall to €0.15bn, lower than the ~€0.5bn surplus that we believe Aegon should ideally hold at the holding company level.
We still believe it is most probable that Aegon will be able to repay the Dutch State with internal resources, based on our assessment of the probability of financial outcomes, including potential disposals. Therefore, we think market concerns about a potential external capital raising are overdone.
Even if Aegon has to resort to raising capital, it is already in the share price, in our view. We believe management will seek to avoid raising external capital. However, it is also keen (in our view) to remove the issue of the Dutch government capital support from its balance sheet to re-focus management and resource attention on executing its long-term strategy.
Exhibit 1
Our bear to bull scenarios suggest Aegon could maintain a group capital surplus (over AA requirements) of €1.1-€2.1bn at 2Q11e after repaying the outstanding Dutch government capital – a comfortable buffer €bn Bear Base Bull
End 4Q10e Group Capital Surplus 3.50 3.50 3.50
Net capital generation 0.35 0.35 0.35
Other market related events -0.50 0.00 0.50
Repay Dutch State -2.25 -2.25 -2.25
Capital release from disposals 0.00 0.71 1.03
End 2Q11e Group Capital Surplus 1.10 1.60 2.10Source: Morgan Stanley Research estimates
Exhibit 2
Our bear to bull range of outcomes for HoldCo surplus capital suggest a €0.2-€1.2bn surplus after repaying the Dutch government – adequate in the base and bull cases, a little low in the bear case €bn Bear Base Bull
End 4Q10e HoldCo Capital Surplus 1.35 1.35 1.35
Net capital generation 0.35 0.35 0.35
Release of other business unit surplus capital 0.70 0.80 1.00
Release of capital from disposals 0.00 0.36 0.77
Repay Dutch State -2.25 -2.25 -2.25
End 2Q11e Group Capital Surplus 0.15 0.61 1.22Source: Morgan Stanley Research estimates
29
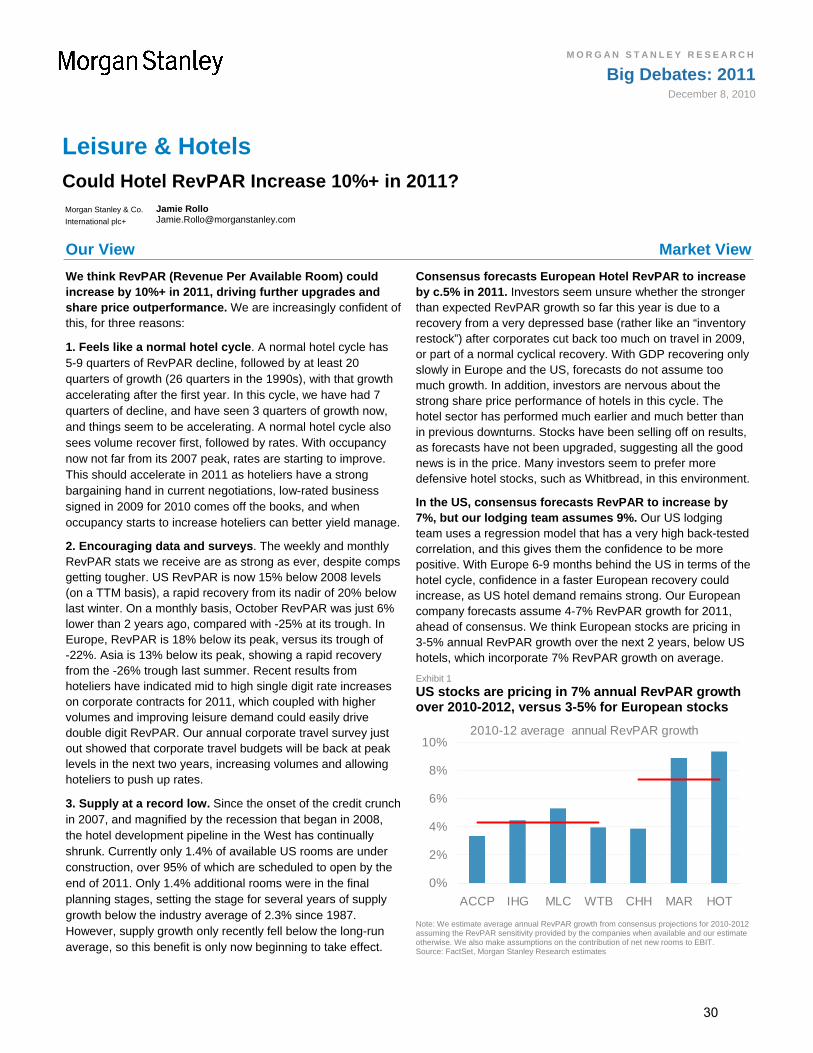
M O R G A N S T A N L E Y R E S E A R C H
Big Debates: 2011December 8, 2010
Leisure & Hotels Could Hotel RevPAR Increase 10%+ in 2011? Morgan Stanley & Co.
International plc+
Jamie Rollo [email protected]
Our View Market View
We think RevPAR (Revenue Per Available Room) could increase by 10%+ in 2011, driving further upgrades and share price outperformance. We are increasingly confident of this, for three reasons:
1. Feels like a normal hotel cycle. A normal hotel cycle has 5-9 quarters of RevPAR decline, followed by at least 20 quarters of growth (26 quarters in the 1990s), with that growth accelerating after the first year. In this cycle, we have had 7 quarters of decline, and have seen 3 quarters of growth now, and things seem to be accelerating. A normal hotel cycle also sees volume recover first, followed by rates. With occupancy now not far from its 2007 peak, rates are starting to improve. This should accelerate in 2011 as hoteliers have a strong bargaining hand in current negotiations, low-rated business signed in 2009 for 2010 comes off the books, and when occupancy starts to increase hoteliers can better yield manage.
2. Encouraging data and surveys. The weekly and monthly RevPAR stats we receive are as strong as ever, despite comps getting tougher. US RevPAR is now 15% below 2008 levels (on a TTM basis), a rapid recovery from its nadir of 20% below last winter. On a monthly basis, October RevPAR was just 6% lower than 2 years ago, compared with -25% at its trough. In Europe, RevPAR is 18% below its peak, versus its trough of -22%. Asia is 13% below its peak, showing a rapid recovery from the -26% trough last summer. Recent results from hoteliers have indicated mid to high single digit rate increases on corporate contracts for 2011, which coupled with higher volumes and improving leisure demand could easily drive double digit RevPAR. Our annual corporate travel survey just out showed that corporate travel budgets will be back at peak levels in the next two years, increasing volumes and allowing hoteliers to push up rates.
3. Supply at a record low. Since the onset of the credit crunch in 2007, and magnified by the recession that began in 2008, the hotel development pipeline in the West has continually shrunk. Currently only 1.4% of available US rooms are under construction, over 95% of which are scheduled to open by the end of 2011. Only 1.4% additional rooms were in the final planning stages, setting the stage for several years of supply growth below the industry average of 2.3% since 1987. However, supply growth only recently fell below the long-run average, so this benefit is only now beginning to take effect.
Consensus forecasts European Hotel RevPAR to increase by c.5% in 2011. Investors seem unsure whether the stronger than expected RevPAR growth so far this year is due to a recovery from a very depressed base (rather like an “inventory restock”) after corporates cut back too much on travel in 2009, or part of a normal cyclical recovery. With GDP recovering only slowly in Europe and the US, forecasts do not assume too much growth. In addition, investors are nervous about the strong share price performance of hotels in this cycle. The hotel sector has performed much earlier and much better than in previous downturns. Stocks have been selling off on results, as forecasts have not been upgraded, suggesting all the good news is in the price. Many investors seem to prefer more defensive hotel stocks, such as Whitbread, in this environment.
In the US, consensus forecasts RevPAR to increase by 7%, but our lodging team assumes 9%. Our US lodging team uses a regression model that has a very high back-tested correlation, and this gives them the confidence to be more positive. With Europe 6-9 months behind the US in terms of the hotel cycle, confidence in a faster European recovery could increase, as US hotel demand remains strong. Our European company forecasts assume 4-7% RevPAR growth for 2011, ahead of consensus. We think European stocks are pricing in 3-5% annual RevPAR growth over the next 2 years, below US hotels, which incorporate 7% RevPAR growth on average.
Exhibit 1
US stocks are pricing in 7% annual RevPAR growth over 2010-2012, versus 3-5% for European stocks
2010-12 average annual RevPAR growth
0%
2%
4%
6%
8%
10%
ACCP IHG MLC WTB CHH MAR HOT
Note: We estimate average annual RevPAR growth from consensus projections for 2010-2012 assuming the RevPAR sensitivity provided by the companies when available and our estimate otherwise. We also make assumptions on the contribution of net new rooms to EBIT. Source: FactSet, Morgan Stanley Research estimates
30

M O R G A N S T A N L E Y R E S E A R C H
Big Debates: 2011December 8, 2010
Exhibit 2
This cycle has recovered faster than previous cycles, and we should really see mid to high single-digit growth over the next 4-5 years
TTM RevPAR
70
80
90
100
110
120
130
M1
M6
M11
M16
M21
M26
M31
M36
M41
M46
M51
M56
M61
M66
M71
M76
M81
M86
M91
Re
vPA
R in
de
x
Oct-90 - Jul-98 Mar-01 - Feb-08 Jul-08 to Dec-15
We are here
Source: FactSet, Morgan Stanley Research estimates
If this is the beginning of a normal hotel cycle, we have another 4-5 years of at least high single digit RevPAR growth to come. Long-run RevPAR growth is 20-30% peak to peak in nominal terms, and given RevPAR dropped 15-20% in 2009 for most companies, and each cycle is 7-9 years in length, there should be at least 40% growth from 2009 to the next peak. This year RevPAR will increase 7-10% for most companies, which still leaves significant upside. With 1% on RevPAR driving 3-6% EPS for most hotel companies, we think the stocks could generate 20%+ annual EPS growth for the next 5 years. Historically, hoteliers have sustained high multiples during this period.
Other drivers:
1) Shift to branded. Many markets remain underpenetrated (Europe and Asia are 20-30% branded versus the US at 70%), the hotel market is very fragmented (IHG is the largest operator with 3% room share), and there are big scale economies from costs, such as marketing. We think a further market share shift to the big brands seems likely.
2) Asset sales. All European listed hotel operators have assets they are either explicitly planning to, or in our opinion could, sell. With demand for hotel assets improving after three years of virtual stagnation, we see some positive surprises here. In fact, in the US full-service hotel transactions in 2010 are now back above 2006 peak levels, averaging $180k per key, versus $100k at the trough. Lending to hotels is back, with more than a dozen hotel mortgages closed in the past few weeks, up from virtually zero in the first half of the year.
3) Emerging market growth. IHG, M&C and Accor have large emerging market exposure, and we forecast China to grow to 25% of IHG’s EBIT within 5 years.
4) Valuation. European hotel companies are on a significant valuation discount to their US peers. On 2012e EV/EBITDA, European companies trade around 4 turns lower than US companies and on P/E around 8 turns. Exhibit 3 shows that US hotel stocks are pricing in higher long-term growth than European hotels based on consensus estimates and a cost of capital of 8%.
History also suggests lodging stocks tend to perform in line with each other, making stock selection less relevant. Exhibit 4 shows the share prices of the major international operators, indexed to 100 at the 2007 peak. While some are more operationally geared than others and so benefit more in an up-cycle, they lose more in a down-cycle, and the impact smooths out over time. Overall, this is a growing industry.
Exhibit 3
US hotel stocks are pricing in higher LT growth
0%
20%
40%
60%
80%
100%
WTB.L IHG.L ACCP.PA MLC.L CHH-USMAR-USHOT-US
Current Earnings(1) Explicit Period (2) Long-Term Growth (3)
(1) Consensus mean EPS estimate for FY10 (FY11 for WTB) capitalized at 8% (2) The incremental growth represented by the present value of the next two years' forward consensus mean EPS estimates and dividends less (1). (3) The residual of the current price less (1) and (2) Source: FactSet, Morgan Stanley Research estimates
Exhibit 4
Stock picking not actually that important for hotels
0
20
40
60
80
100
120
Jan-90 Jan-94 Jan-98 Jan-02 Jan-06 Jan-10
US Hotels Accor Whitbread M&C IHG Marriott Starwood
Source: DataStream, Morgan Stanley Research
31
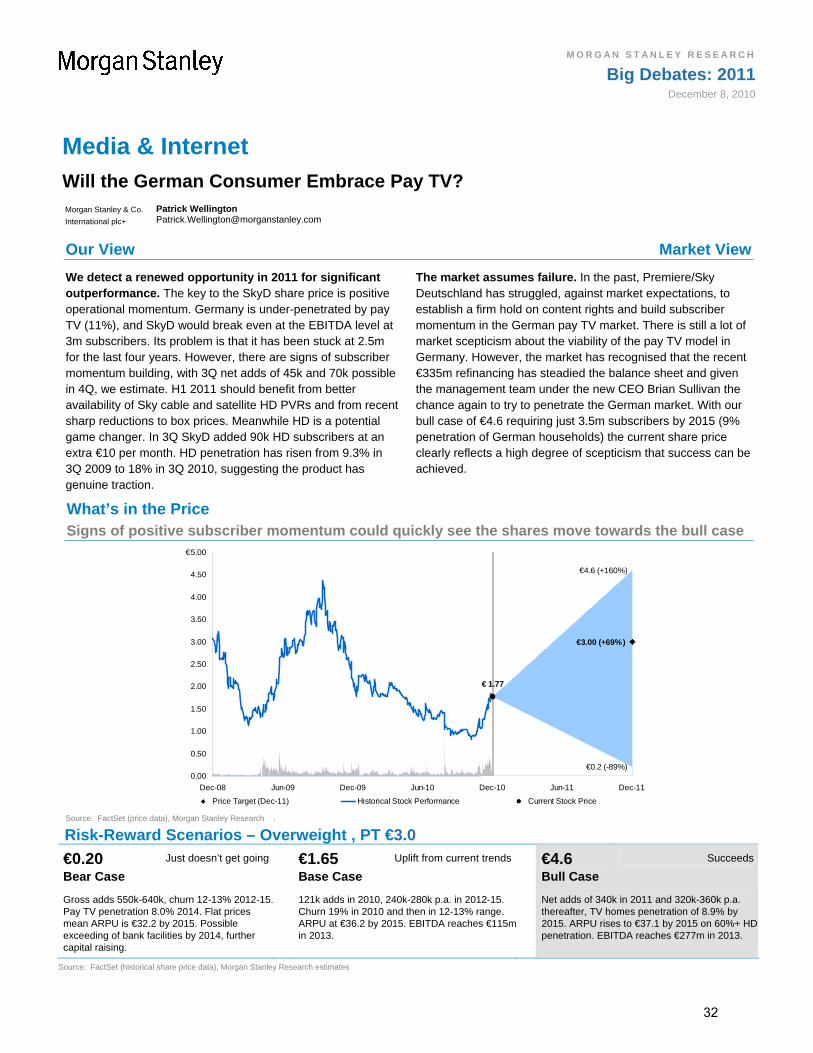
M O R G A N S T A N L E Y R E S E A R C H
Big Debates: 2011December 8, 2010
Media & Internet Will the German Consumer Embrace Pay TV? Morgan Stanley & Co.
International plc+
Patrick Wellington [email protected]
Our View Market View
We detect a renewed opportunity in 2011 for significant outperformance. The key to the SkyD share price is positive operational momentum. Germany is under-penetrated by pay TV (11%), and SkyD would break even at the EBITDA level at 3m subscribers. Its problem is that it has been stuck at 2.5m for the last four years. However, there are signs of subscriber momentum building, with 3Q net adds of 45k and 70k possible in 4Q, we estimate. H1 2011 should benefit from better availability of Sky cable and satellite HD PVRs and from recent sharp reductions to box prices. Meanwhile HD is a potential game changer. In 3Q SkyD added 90k HD subscribers at an extra €10 per month. HD penetration has risen from 9.3% in 3Q 2009 to 18% in 3Q 2010, suggesting the product has genuine traction.
The market assumes failure. In the past, Premiere/Sky Deutschland has struggled, against market expectations, to establish a firm hold on content rights and build subscriber momentum in the German pay TV market. There is still a lot of market scepticism about the viability of the pay TV model in Germany. However, the market has recognised that the recent €335m refinancing has steadied the balance sheet and given the management team under the new CEO Brian Sullivan the chance again to try to penetrate the German market. With our bull case of €4.6 requiring just 3.5m subscribers by 2015 (9% penetration of German households) the current share price clearly reflects a high degree of scepticism that success can be achieved.
What’s in the Price Signs of positive subscriber momentum could quickly see the shares move towards the bull case
WARNINGDONOT EDIT _RRS4RL~SKYDn.DE~
€3.00 (+69%)
€ 1.77
€0.2 (-89%)
€4.6 (+160%)
0.00
0.50
1.00
1.50
2.00
2.50
3.00
3.50
4.00
4.50
5.00
Dec-08 Jun-09 Dec-09 Jun-10 Dec-10 Jun-11 Dec-11
€
Price Target (Dec-11) Historical Stock Performance Current Stock Price Source: FactSet (price data), Morgan Stanley Research .
Risk-Reward Scenarios – Overweight , PT €3.0
€0.20 Bear Case
Just doesn’t get going €1.65 Base Case
Uplift from current trends €4.6 Bull Case
Succeeds
Gross adds 550k-640k, churn 12-13% 2012-15. Pay TV penetration 8.0% 2014. Flat prices mean ARPU is €32.2 by 2015. Possible exceeding of bank facilities by 2014, further capital raising.
121k adds in 2010, 240k-280k p.a. in 2012-15. Churn 19% in 2010 and then in 12-13% range. ARPU at €36.2 by 2015. EBITDA reaches €115min 2013.
Net adds of 340k in 2011 and 320k-360k p.a. thereafter, TV homes penetration of 8.9% by 2015. ARPU rises to €37.1 by 2015 on 60%+ HD penetration. EBITDA reaches €277m in 2013.
Source: FactSet (historical share price data), Morgan Stanley Research estimates
32

M O R G A N S T A N L E Y R E S E A R C H
Big Debates: 2011December 8, 2010
Germany is under-penetrated by premium TV services. It is widely recognised that Germany is a market under-penetrated by pay TV services. Pay TV penetration by household is 11%, compared with 38% in Italy, 42% in France and 53% in the UK. Penetration of both HD services (but not of HD sets, at almost 14m households) and PVR penetration is also relatively low. This has been true throughout the existence of Premiere/Sky.
Slow start for Sky. The immediate effects of the 3Q 2009 Sky relaunch were disappointing. Sky faced customer fulfillment and service issues, reaction to Sky’s higher prices was hostile, and churn remained stubbornly high. 3Q 2009 subscriber growth was 67k, with 4Q at 39k, Q1 2010 at 1k and 2Q 2010 at 6k.
Significant turning point. We think there are signs of fundamental improvement in Sky’s position:
Indications of positive subscriber momentum: 3Q net adds were 45k (including c25k in September) and we raise our 4Q net adds forecast from 60k to 70k. 1H11 should benefit from better availability of Sky cable and satellite HD PVRs, and from recent sharp reductions to box prices (the HD receiver is now free, the PVR is €99). We look for 50k net adds in 1Q11 and 30k in the seasonally low 2Q11. In light of recent trends, we feel that these numbers are very beatable.
HD – a potential game-changer: In 3Q Sky added 90k HD subscribers at an extra €10 per month. HD penetration rose from 9.3% in 3Q09 to 18% in 3Q10, suggesting the product has genuine traction. In the UK, HD has been the incremental driver of pay-TV subs since 2007 and it may now be emerging as the key game-changer in Germany. SkyD surveys suggest 90% of its HD subscribers would recommend the product to a friend, a big shift in word of mouth recommendation.
Customer satisfaction levels are improving: Sky reports that satisfaction levels among existing customers have greatly improved in the last 18 months. The customer service experience is better, with 80% of calls answered in 20 seconds. 90% of Bundesliga customers and 75% of movie customers express satisfaction with the service. Sky’s next challenge is to attract new customers.
Startling pace of product innovation: Bundesliga on Sky has been extended from 2 to 5 start times, and viewership is up 80%. Movies have been extended to 10
start times. Sky has extended the HD offering to 12 channels, including recently putting four HD channels in the basic Welt package. A Multiroom option was introduced in June 2010. CEO Brian Sullivan promises more content innovations, more HD channels and technology innovation in the next few months. The aim is to make existing customers feel better about their Sky service, to upsell and to attract new subscribers.
Balance sheet sorted: The injection of €110m in the January placing, the €177m rights issue in September and the planned convertible/loan in January of €163m has bolstered the balance sheet. Both our base and bull cases show Sky Deutschland able to operate within its existing €400m bank facilities.
Impressive new management: We have been impressed by the approach of new CEO Brian Sullivan. He has a record of working within a successful pay-TV environment and, building on his predecessor’s work, has rapidly pushed through a series of content, product and price innovations. He has also taken an active stance in establishing better relations with cable companies and other counterparts in the German market.
Upside targets not that testing. Our bull case values SkyD at €4.6 per share. This would require Sky to reach 3.5m subscribers by 2015, equivalent to less than 9% of German TV homes. It requires an uplift in ARPU to €37.1 by 2015 against the current €30, a 23% rise. These targets would not be demanding in a vibrant pay-TV market. The UK’s leading pay TV company has 40% of UK households and ARPU of almost €52 per month. Our argument is that if SkyD can begin to show positive momentum in gross and net adds and in ARPU, then the market will quickly calibrate the company against bull case valuations, leading to potential substantial share price performance. The key is to detect the turning point in operational performance.
Risks – there are plenty. In the past Premiere/Sky Deutschland has struggled, against market expectations, to establish a firm hold on content rights and build subscriber momentum in the German pay-TV market. There is still a lot of scepticism about the pay-TV model in Germany. Multiples are high – Sky Deutschland will make significant EBITDA losses in 2011-12 and will still be on 12.6x EV/EBITDA and 34x P/E, on our base case numbers in 2013. In addition, relatively small changes in subscriber growth, ARPU and pricing assumptions lead to big swings in our valuation model, both negative and positive.
33

M O R G A N S T A N L E Y R E S E A R C H
Big Debates: 2011December 8, 2010
Metals & Mining Will Kazakhmys Dispose of Its Stake in ENRC? Morgan Stanley & Co.
International plc+
Ephrem Ravi [email protected]
Our View Market View
A key debate in the market is whether Kazakhmys will dispose of its 26% stake in ENRC and announce a special dividend. Kazakhmys’ 26% ownership in ENRC is now worth close to $5.4bn (£6.3/share). A disposal of the stake at the market price would help the company realize a net cash position of $3.8bn after paying back its debt. In such a scenario, Kazakhmys could purchase an equivalent of 250ktpa of copper production at an average capex/tonne of $15,000. Alternatively, it is worth c.30% of the current market cap in potential cash return.
The shares appear to be discounting retention of the 26% stake in ENRC as a strategic investment and diversifying element to earnings. Our ‘what’s in the price’ analysis of the implied copper price in Kazakhmys’ shares (after excluding the ENRC stake) suggests that the company’s shares are discounting a copper price significantly below its peers. The large discount of the KAZ stub ex-ENRC would suggest that the market does not expect a disposal of the stake and a subsequent re-rating of the company’s core copper business.
Exhibit 1
Kazakhmys’ earnings exposure is skewed to copper prices …
Energy, 5%
Other, 2%Gold, 2%
Copper, 91%
Source: Company data, Morgan Stanley Research. Current data shown
In our base case scenario, we assume Kazakhmys keeps its 26% stake in ENRC, retaining it as a strategic investment and providing the opportunity to diversify its asset portfolio across commodities and geographies. Nevertheless, we believe that a stake disposal could trigger a rerating of the Kazakhmys stub ex-ENRC and result in an announcement of a special dividend.
Management has said that it will consider all options with regards to the stake and would sell at the right price. In early October, company Chairman Vladimir Kim sold an 11% stake in Kazakhmys to Samruk (a government-owned entity) at the market price. As a result, the government now owns 26% of Kazakhmys and 11.6% of ENRC, and could conceivably seek to simplify its holding structure in both companies by purchasing at least part of Kazakhmys’ stake in ENRC (Exhibit 5). Samruk has said it could seek to raise its stake in ENRC in the long run (The Telegraph, October 6).
Exhibit 2
… while its stake in ENRC offers earnings diversification on an attributable basis
Alu, 3%Iron Ore,
14%
FeCr, 10%
Copper, 62%
Gold, 1%Other, 3%
Energy, 7%
Source: Morgan Stanley Research estimates, based on current company data
Our thesis remains that ownership of the ENRC stake keeps Kazakhmys’ copper business fundamentally undervalued at $6bn – which implies a copper price of $2.70/lb is discounted in the company’s core business. This is a significant discount to the current spot copper price, as well as to the copper price reflected in other pure-play copper names within our universe. We believe the large discount in the implied copper price reflects the market’s view that a re-rating (potentially from a disposal of the ENRC stake) is unlikely. This suggests that any moves towards a disposal could have a material impact on the share price. ENRC’s share price is a key driver of Kazakhmys shares, with every 100p change in ENRC’s share price worth c.60p to Kazakhmys shares. At current market prices, the value of the ENRC stake is a little over 40% of Kazakhmys’ market capitalization. We value the stake in our base case DCF for ENRC at $6.56bn or £8.17, out of our £17.77 price target for Kazakhmys.
34

M O R G A N S T A N L E Y R E S E A R C H
Big Debates: 2011December 8, 2010
Exhibit 3
The value of Kazakhmys’ copper business is increasingly reflected in the share price post-crisis
-
2,000
4,000
6,000
8,000
10,000
12,000
14,000
Jan-09 May-09 Sep-09 Jan-10 May-10 Sep-10
(US
$m) ENRC Stake KAZ MCAP ex-ENRC
Source: FactSet, Morgan Stanley Research
We believe a disposal of the stake would lead to a re-rating of Kazakhmys shares. A potential sale of the ENRC stake would leave Kazakhmys with a net cash position of approximately $3.8bn (the current market value of the stake is approximately $5.4bn, less Kazakhmys’ net debt position of $1.6bn). In the event of a sale, we believe that management would either deploy cash to increase its growth profile or return cash to shareholders in a form of a special dividend, which could be in the magnitude of £4.4/share, based on the return of the full $3.8bn.
Exhibit 4
A disposal of the ENRC stake would leave Kazakhmys with a $3.8bn net cash balance
$5,381m
$3,753m
$1,628m
ENRC stake Net Debt Remaining Cash
Source: Company data based on ENRC market cap of $20.7bn, Morgan Stanley Research estimates (net debt)
Exhibit 5
New shareholding structure: The Kazakh government now has a 26% stake in Kazakhmys and an 18.4% effective stake in ENRC
Kazakhmys
Kazakh Government
ENRC
26%
11.6%
26%
effective ownership 18.4%
Source: Company data, Morgan Stanley Research
35
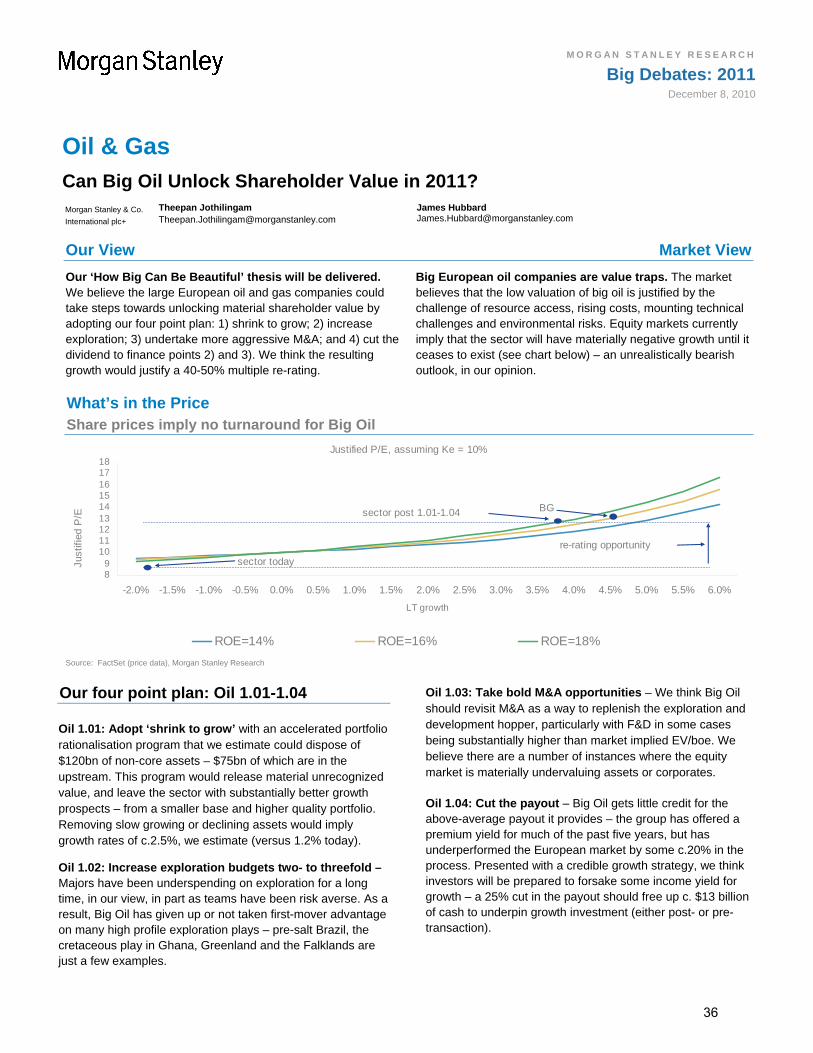
M O R G A N S T A N L E Y R E S E A R C H
Big Debates: 2011December 8, 2010
Oil & Gas Can Big Oil Unlock Shareholder Value in 2011? Morgan Stanley & Co.
International plc+
Theepan Jothilingam [email protected]
James Hubbard [email protected]
Our View Market View
Our ‘How Big Can Be Beautiful’ thesis will be delivered. We believe the large European oil and gas companies could take steps towards unlocking material shareholder value by adopting our four point plan: 1) shrink to grow; 2) increase exploration; 3) undertake more aggressive M&A; and 4) cut the dividend to finance points 2) and 3). We think the resulting growth would justify a 40-50% multiple re-rating.
Big European oil companies are value traps. The market believes that the low valuation of big oil is justified by the challenge of resource access, rising costs, mounting technical challenges and environmental risks. Equity markets currently imply that the sector will have materially negative growth until it ceases to exist (see chart below) – an unrealistically bearish outlook, in our opinion.
What’s in the Price Share prices imply no turnaround for Big Oil
Justified P/E, assuming Ke = 10%
89
101112131415161718
-2.0% -1.5% -1.0% -0.5% 0.0% 0.5% 1.0% 1.5% 2.0% 2.5% 3.0% 3.5% 4.0% 4.5% 5.0% 5.5% 6.0%
LT growth
Just
ified
P/E
ROE=14% ROE=16% ROE=18%
sector today
BGsector post 1.01-1.04
re-rating opportunity
Source: FactSet (price data), Morgan Stanley Research
Our four point plan: Oil 1.01-1.04 Oil 1.01: Adopt ‘shrink to grow’ with an accelerated portfolio rationalisation program that we estimate could dispose of $120bn of non-core assets – $75bn of which are in the upstream. This program would release material unrecognized value, and leave the sector with substantially better growth prospects – from a smaller base and higher quality portfolio. Removing slow growing or declining assets would imply growth rates of c.2.5%, we estimate (versus 1.2% today).
Oil 1.02: Increase exploration budgets two- to threefold – Majors have been underspending on exploration for a long time, in our view, in part as teams have been risk averse. As a result, Big Oil has given up or not taken first-mover advantage on many high profile exploration plays – pre-salt Brazil, the cretaceous play in Ghana, Greenland and the Falklands are just a few examples.
Oil 1.03: Take bold M&A opportunities – We think Big Oil should revisit M&A as a way to replenish the exploration and development hopper, particularly with F&D in some cases being substantially higher than market implied EV/boe. We believe there are a number of instances where the equity market is materially undervaluing assets or corporates.
Oil 1.04: Cut the payout – Big Oil gets little credit for the above-average payout it provides – the group has offered a premium yield for much of the past five years, but has underperformed the European market by some c.20% in the process. Presented with a credible growth strategy, we think investors will be prepared to forsake some income yield for growth – a 25% cut in the payout should free up c. $13 billion of cash to underpin growth investment (either post- or pre-transaction).
36
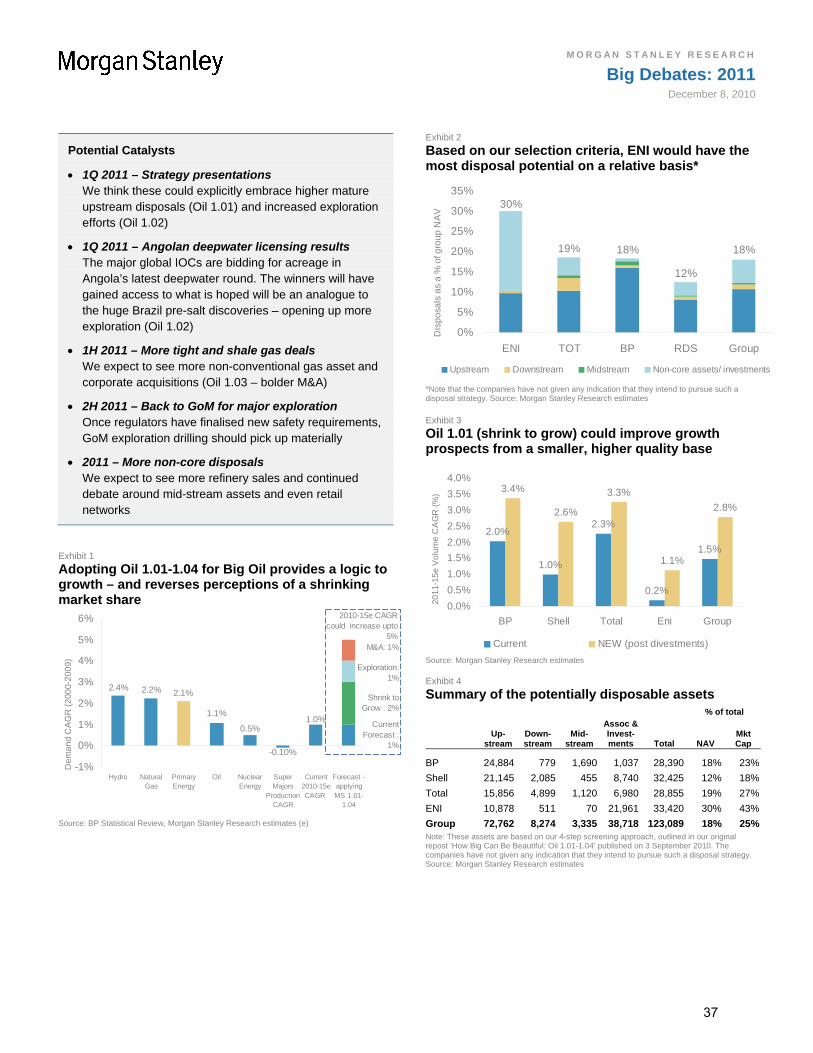
M O R G A N S T A N L E Y R E S E A R C H
Big Debates: 2011December 8, 2010
Potential Catalysts
1Q 2011 – Strategy presentations We think these could explicitly embrace higher mature upstream disposals (Oil 1.01) and increased exploration efforts (Oil 1.02)
1Q 2011 – Angolan deepwater licensing results The major global IOCs are bidding for acreage in Angola’s latest deepwater round. The winners will have gained access to what is hoped will be an analogue to the huge Brazil pre-salt discoveries – opening up more exploration (Oil 1.02)
1H 2011 – More tight and shale gas deals We expect to see more non-conventional gas asset and corporate acquisitions (Oil 1.03 – bolder M&A)
2H 2011 – Back to GoM for major exploration Once regulators have finalised new safety requirements, GoM exploration drilling should pick up materially
2011 – More non-core disposals We expect to see more refinery sales and continued debate around mid-stream assets and even retail networks
Exhibit 1
Adopting Oil 1.01-1.04 for Big Oil provides a logic to growth – and reverses perceptions of a shrinking market share
-0.10%
2.2%2.4%2.1%
1.1%
0.5%1.0%
-1%
0%
1%
2%
3%
4%
5%
6%
Hydro NaturalGas
PrimaryEnergy
Oil NuclearEnergy
SuperMajors
ProductionCAGR
Current2010-15eCAGR
Forecast -applyingMS 1.01-
1.04
De
ma
nd C
AG
R (
200
0-2
009
)
2010-15e CAGR could increase upto
5%
Shrink to Grow : 2%
Exploration: 1%
M&A: 1%
Current Forecast :
1%
Source: BP Statistical Review, Morgan Stanley Research estimates (e)
Exhibit 2
Based on our selection criteria, ENI would have the most disposal potential on a relative basis*
0%
5%
10%
15%
20%
25%
30%
35%
ENI TOT BP RDS Group
Dis
po
sals
as
a %
of g
rou
p N
AV
Upstream Downstream Midstream Non-core assets/ investments
30%
19% 18%
12%
18%
*Note that the companies have not given any indication that they intend to pursue such a disposal strategy. Source: Morgan Stanley Research estimates
Exhibit 3
Oil 1.01 (shrink to grow) could improve growth prospects from a smaller, higher quality base
2.0%
1.0%
2.3%
0.2%
1.5%
3.4%
2.6%
3.3%
1.1%
2.8%
0.0%
0.5%
1.0%
1.5%
2.0%
2.5%
3.0%
3.5%
4.0%
BP Shell Total Eni Group
2011
-15e
Vol
ume
CA
GR
(%
)
Current NEW (post divestments)
Source: Morgan Stanley Research estimates Exhibit 4
Summary of the potentially disposable assets % of total
Up-
streamDown- stream
Mid- stream
Assoc & Invest-ments Total NAV
Mkt Cap
BP 24,884 779 1,690 1,037 28,390 18% 23%
Shell 21,145 2,085 455 8,740 32,425 12% 18%
Total 15,856 4,899 1,120 6,980 28,855 19% 27%
ENI 10,878 511 70 21,961 33,420 30% 43%
Group 72,762 8,274 3,335 38,718 123,089 18% 25%Note: These assets are based on our 4-step screening approach, outlined in our original repost ‘How Big Can Be Beautiful: Oil 1.01-1.04’ published on 3 September 2010. The companies have not given any indication that they intend to pursue such a disposal strategy. Source: Morgan Stanley Research estimates
37
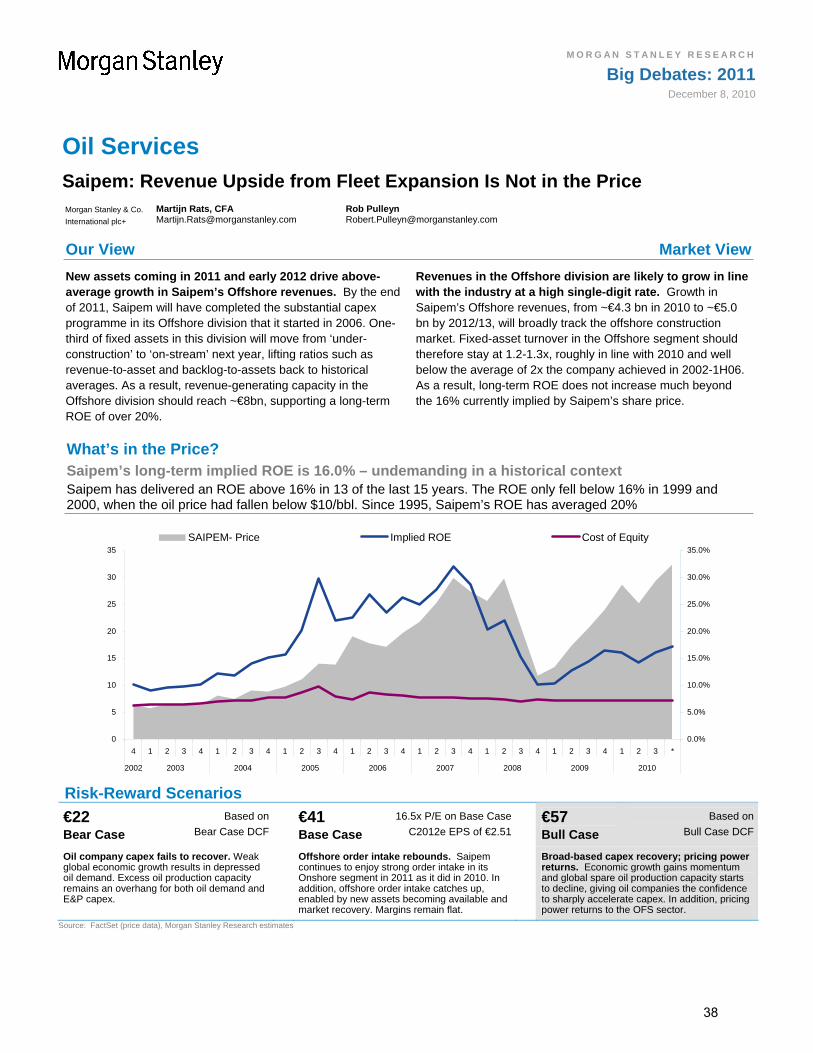
M O R G A N S T A N L E Y R E S E A R C H
Big Debates: 2011December 8, 2010
Oil Services Saipem: Revenue Upside from Fleet Expansion Is Not in the Price Morgan Stanley & Co.
International plc+
Martijn Rats, CFA [email protected]
Rob Pulleyn [email protected]
Our View Market View
New assets coming in 2011 and early 2012 drive above-average growth in Saipem’s Offshore revenues. By the end of 2011, Saipem will have completed the substantial capex programme in its Offshore division that it started in 2006. One-third of fixed assets in this division will move from ‘under-construction’ to ‘on-stream’ next year, lifting ratios such as revenue-to-asset and backlog-to-assets back to historical averages. As a result, revenue-generating capacity in the Offshore division should reach ~€8bn, supporting a long-term ROE of over 20%.
Revenues in the Offshore division are likely to grow in line with the industry at a high single-digit rate. Growth in Saipem’s Offshore revenues, from ~€4.3 bn in 2010 to ~€5.0 bn by 2012/13, will broadly track the offshore construction market. Fixed-asset turnover in the Offshore segment should therefore stay at 1.2-1.3x, roughly in line with 2010 and well below the average of 2x the company achieved in 2002-1H06. As a result, long-term ROE does not increase much beyond the 16% currently implied by Saipem’s share price.
What’s in the Price? Saipem’s long-term implied ROE is 16.0% – undemanding in a historical context Saipem has delivered an ROE above 16% in 13 of the last 15 years. The ROE only fell below 16% in 1999 and 2000, when the oil price had fallen below $10/bbl. Since 1995, Saipem’s ROE has averaged 20%
0
5
10
15
20
25
30
35
4 1 2 3 4 1 2 3 4 1 2 3 4 1 2 3 4 1 2 3 4 1 2 3 4 1 2 3 4 1 2 3 *
2002 2003 2004 2005 2006 2007 2008 2009 2010
0.0%
5.0%
10.0%
15.0%
20.0%
25.0%
30.0%
35.0%
SAIPEM- Price Implied ROE Cost of Equity
Risk-Reward Scenarios
€22 Bear Case
Based on
Bear Case DCF
€41 Base Case
16.5x P/E on Base Case
C2012e EPS of €2.51
€57 Bull Case
Based on
Bull Case DCF
Oil company capex fails to recover. Weak global economic growth results in depressed oil demand. Excess oil production capacity remains an overhang for both oil demand and E&P capex.
Offshore order intake rebounds. Saipem continues to enjoy strong order intake in its Onshore segment in 2011 as it did in 2010. In addition, offshore order intake catches up, enabled by new assets becoming available and market recovery. Margins remain flat.
Broad-based capex recovery; pricing power returns. Economic growth gains momentum and global spare oil production capacity starts to decline, giving oil companies the confidence to sharply accelerate capex. In addition, pricing power returns to the OFS sector.
Source: FactSet (price data), Morgan Stanley Research estimates
38

M O R G A N S T A N L E Y R E S E A R C H
Big Debates: 2011December 8, 2010
Our Overweight thesis for Saipem rests on three pillars:
1. Potential for upside surprise in order intake in Offshore Saipem started a significant programme of capital expenditure in its key Offshore division in 2006. This programme will come to an end in 2011, when four significant assets will come on-stream: a high-end pipelay vessel, a high-end field development vessel, a new diving support vessel and a fabrication yard in Indonesia.
As a result of the significant capex, Saipem’s asset base has contained a high share of ‘assets under construction’, depressing ratios such as asset turnover and backlog-to-assets (Exhibits 2 and 3). We expect these ratios to normalize in 2012/13, as the assets come on stream and order intake is supported by the strong outlook for offshore investment.
If Saipem’s asset turnover and backlog-to-asset ratio in the Offshore division return to their historical averages of 2.0x and 2.6x, respectively, revenues could eventually reach ~€8.0 bn and the order backlog could increase to €9.0 bn (which would also support annual revenues of ~€8.0 bn). At the moment, the offshore construction market is recovering from a sharp slowdown over the past 18 months, and how long it will take to recover is uncertain. Therefore, we still forecast revenues of ‘just’ €5.9 bn by 2012 and €6.4 bn by 2013. Still, this suggests considerable upside to consensus revenues for the Offshore division of €5.0 bn in 2012.
2. Growth in energy infrastructure spend in the Middle East and North Africa. Saipem derives ~30% of operating profit from Onshore construction, which is significantly exposed to growing spend on up- and downstream energy infrastructure in the Middle East. Saipem has benefited from this trend in 2010, with key contract wins in the UAE and Kuwait. Unawarded projects of $440bn in coming years in MENA ex Iran/Iraq suggest several years of strong revenue and backlog growth for Saipem in the region.
3. Undemanding valuation, assuming ROE and P/E revert to historical averages. Better utilization of assets in the Offshore segment should support a long-term ROE of at least 19.4%, we estimate, similar to the average of 20% since 1995. This suggests mid-cycle earnings of at least €2.64 per share. Capitalised at the average one-year forward P/E of the last 10 years of 16.4, this points to a valuation of €43 per share over the next 18 months (27% upside). If Offshore revenues reach the full €8 bn, earnings could eventually be ~€3.5 per share, indicating further upside to our bull case scenario of €57.
Exhibit 1
Capex began accelerate in 2006 … Offshore Construction - Capital Expenditure (€ mn)
-
100
200
300
400
500
600
700
800
900
2001 2002 2003 2004 2005 2006 2007 2008 2009 2010e Source: Company data, Morgan Stanley Research estimates (e)
Exhibit 2
… and so asset turnover started to fall … Offshore Construction - Fixed Asset Turnover
-
0.5
1.0
1.5
2.0
2.5
2001 2002 2003 2004 2005 2006 2007 2008 2009 2010e Source: Company data, Morgan Stanley Research estimates (e)
Exhibit 3
… and backlog-to-assets declined. But we think this can normalize after 2012 Offshore Construction - Backlog-to-Fixed Assets
-
0.5
1.0
1.5
2.0
2.5
3.0
2001 2002 2003 2004 2005 2006 2007 2008 2009 2010e Source: Company data, Morgan Stanley Research estimates (e)
39

M O R G A N S T A N L E Y R E S E A R C H
Big Debates: 2011December 8, 2010
Paper & Packaging Will Consolidation Finally Begin in 2011? Morgan Stanley & Co.
International plc+
Markus Almerud [email protected]
Our View Market View
Long-awaited consolidation in the sector is a real possibility next year. Sector consolidation has been a key debate for investors for much of the past decade, but has yet to materialize. However, we see enough to suggest that M&A could feature in 2011, namely poor pricing power, confirmed negotiations, and weak balance sheets. Consolidation would eliminate some capacity, improve the supply/demand balance and boost long-term EBITDA/t, taking share prices towards our bull cases of €10.2 for Stora Enso and €17.6 for UPM.
Our ‘What’s in the Price’ analysis suggests the possibility of consolidation is not priced in. Our WITP tool is a three-stage model using 2010-2012 consensus mean EPS and DPS estimates to assess how much long-term growth is discounted in share prices. It indicates that the sector is discounting no value and no growth beyond 2013. Since consolidation would remove capacity and bolster pricing power and earnings growth, we conclude that shares prices discount very little possibility of sector consolidation next year.
What’s in the Price Discounting negative growth post 2013 (lhs) – sharply down on expectations in recent years (rhs)
Distribution of value between time periods
-150%
-100%
-50%
0%
50%
100%
150%
200%
250%
Sappi SCA Portucel Stora Holmen SKG UPM Mondi Billerud
Current earnings and explicit period Long-term
LT as share of total value
-60%
-40%
-20%
0%
20%
40%
60%
-00 -01 -02 -03 -04 -05 -06 -07 -08 -09
Stora Enso UPM Source: FactSet (price data), Morgan Stanley Research
We see a number of reasons to believe that consolidation moves could be a feature of 2011.
1. Newsprint manufacturers’ need for pricing power. Operating rates for newsprint remain below the level where the market is balanced (90-94%) and, according to RISI, 50% of producers are cash loss making. Negotiations for next year’s newsprint prices started at the beginning of October. European producers are looking to get back to the price levels of early 2009, which would imply ~€520-540/t, or ~£450-470/t for the UK.
Our channel checks indicate that the worst case for UK publishers is £390-395/t (the current price settlement is £365-370/t), which would correspond to €460-470/t at current exchange rates. UK publishers have historically been the first to settle and have thus set the bar for the rest of Europe.
With an average European price of ~€420/t, the indicated European price would not even cover the higher cost. Waste paper (old newspaper – ONP) has risen 70% or €64/t YTD, meaning that the raw material cost has risen by €77/t during the year (it takes 1.2 tonnes of ONP to make one tonne of newsprint). We forecast newsprint at €500/t for next year.
Given the high number of loss-making producers, it is possible that price settlements in line with buyers’ expectations could trigger M&A to create pricing power.
2. Negotiations between UPM and Myllykoski. UPM and Myllykoski have confirmed that they are discussing the former taking over the latter’s assets in Finland, Germany and the US – a total of c.2.8mt of capacity. If the deal goes ahead, this suggests UPM would increase its European market share in magazine paper from 26% to 39%. Although this level of
40

M O R G A N S T A N L E Y R E S E A R C H
Big Debates: 2011December 8, 2010
share could encounter regulatory hurdles, we believe UPM could potentially navigate these with a credible closure plan, given the prevailing difficulties in the industry.
Myllykoski has been in negotiations with its financiers on its debt. In a press release on September 28, the company stated, “The negotiations have been prolonged, but continue in a positive spirit. The company has been engaged in negotiations with various partners regarding structural arrangements”. At the end of 2Q10, Myllykoski had debt of €712mn, of which 79% was current, and only €52mn in cash.
3. Sector balance sheets are weak. Although the balance sheets of European paper and packaging companies have improved somewhat in the past six months, net debt/equity (ND/E) is still over 100% on average, while net debt/EBITDA averages at ~3.5x (Exhibit 1). We do not believe any company has a strong enough balance sheet to be a consolidator, and see joint ventures and asset swaps as more plausible.
Based on comments by Myllykoski and UPM, it appears one of the drivers behind the companies’ discussions is refinancing. Many of the companies are private, and so refinancing schedules are not public; however, given generally high debt levels, we would not be surprised to see further discussions on the back of refinancing needs.
Signs of consolidation could drive share prices towards our bull case. We would expect sector consolidation to reduce industry capacity, redress the supply-demand balance and improve long-term profitability. Our bull cases assume ~10% higher long-term EBITDA/t, and imply more than 50% upside to €17.6 for UPM and €10.2 for Stora.
Exhibit 1
ND/EBITDA is still high at ~3.5x
Average
6.6
6.2
5.1
4.2
3.7
3.5
2.8
2.5
2.4
2.3
2.3
2.2
2.1
0 1 2 3 4 5 6 7
Current ND/EBITDA for European paper and packaging
Burgo
Norske Skog
Myllykoski
SKG
M-Real
Sappi
UPM
SCA
Stora Enso
Holmen
Portucel
Mondi
Arcitic Paper Source: Company data, Morgan Stanley Research (6m 2010)
Potential Catalysts
Newsprint negotiations We expect newsprint prices to come in at ~€500/t to cover cost. We believe the market is expecting €450-470 and hence the outcome should be a positive surprise
Announcement of magazine paper price increases We expect another magazine paper price increase in January. In our proprietary survey (see 2011: Headwinds on the Horizon But Still Some Momentum, November 22) 70-85% of respondents expected publication papers to increase in the next six months, which provide a good foundation to raise prices
Outcome of the UPM-Myllykoski negotiations Both UPM and Myllykoski have confirmed that they are negotiating, but subsequent news flow has been scant. News, either positive or negative, will be important
Exhibit 2
Consolidation could see shares move towards our bull case
PT
BEAR
BASE
BULL
currentprice
18%24%24%
-60%
-40%
-20%
20%
40%
60%
80%
100%
UPM SCA Stora Enso For valuation methodology and risks associated with any price targets above, please email [email protected] with a request for valuation methodology and risks on a particular stock. Source: Morgan Stanley Research estimates
41

M O R G A N S T A N L E Y R E S E A R C H
Big Debates: 2011December 8, 2010
Pharmaceuticals Cheap Sector or Value Trap? Morgan Stanley & Co.
International plc+
Andrew Baum [email protected]
Our View Market View
The sector rating fails to reflect the material strategic shift under way in the industry. We believe that the ROIC on new investment will at the very minimum exceed the cost of capital. Adoption of Pharma 2.0 strategies (diversified assets and geographies and focus on capital allocation) will ultimately produce stable, cash generative businesses, albeit with a lower overall margin structure than historically. We see intrinsic value in the sector, but investors will need demonstrable proof of value creation, given the past seven years of almost continuous value destruction. The impact of this strategic shift is unlikely to be evident in the next 12-24 months, in the face of ongoing macroeconomic pressures on legacy franchises. Outperforming stocks are likely to be those with aggressive cost management or cash redistribution programmes (AstraZeneca) or visible pipeline or earnings drivers (Novartis).
Share prices are currently discounting continued lacklustre returns, with an average terminal growth of -3%. The market appears to expect the continued depressed returns produced under the industry’s strategic model of the past 10 years. A lamentable ROI on R&D, value-destructive transactions and poor fiscal discipline were hallmarks of an industry poorly aligned to an ever more challenging operating environment. Certainly, the industry faces a difficult three years, with growing generic pressure and ongoing austerity measures that will weigh on pricing and reduce utilization of low value added drugs. But we think this is well captured in the lowly industry valuations. Investors are paid a robust 5% dividend yield, with, we believe, increasing visibility on longer-term capital appreciation.
What’s in the Price Current prices imply an average terminal growth rate of -3% vs. a uniform 2% in our valuations
-10%
-8%
-6%
-4%
-2%
0%
2%
4%
Astra Novartis Roche Glaxo Bayer Novo
Lo
ng
-te
rm g
row
th r
ate
Source: FactSet (price data), Morgan Stanley Research estimates
Half way to creating long-term shareholder value. We believe pharma is about half way through the required evolution of its industry model to create long-term shareholder value. We highlight four encouraging signs of progress: i) a new generation of industry management has been implementing pharma 2.0 stratagems in the past 24 months; ii) we believe the FDA has turned the dial back on its
previously risk-averse approach, as suggested by the recent approval of contentious agents such as Novo’s Victoza, LLY’s Effient, GSK’s Cervarix and Novartis’s Gilenya; iii) emerging market estimates have increased in the past year, but we see room for further upside; and iv) the industry has adroitly managed its near- and mid-term risk from implementation of
42
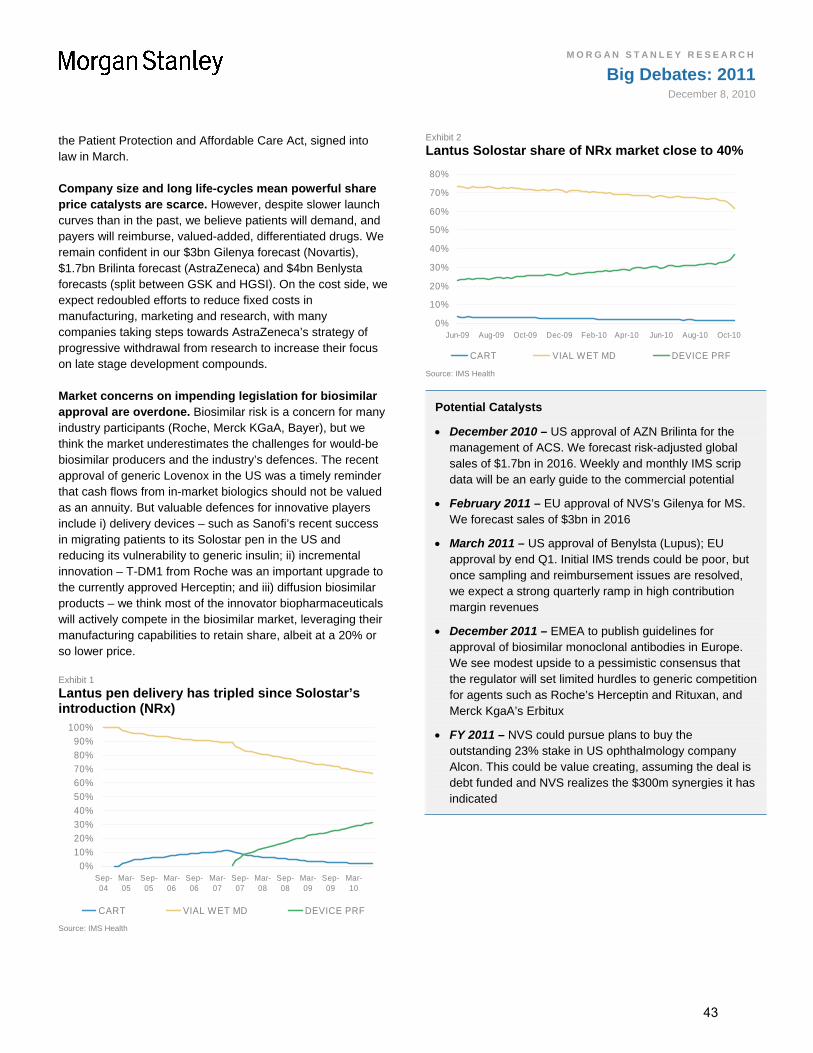
M O R G A N S T A N L E Y R E S E A R C H
Big Debates: 2011December 8, 2010
the Patient Protection and Affordable Care Act, signed into law in March.
Company size and long life-cycles mean powerful share price catalysts are scarce. However, despite slower launch curves than in the past, we believe patients will demand, and payers will reimburse, valued-added, differentiated drugs. We remain confident in our $3bn Gilenya forecast (Novartis), $1.7bn Brilinta forecast (AstraZeneca) and $4bn Benlysta forecasts (split between GSK and HGSI). On the cost side, we expect redoubled efforts to reduce fixed costs in manufacturing, marketing and research, with many companies taking steps towards AstraZeneca’s strategy of progressive withdrawal from research to increase their focus on late stage development compounds.
Market concerns on impending legislation for biosimilar approval are overdone. Biosimilar risk is a concern for many industry participants (Roche, Merck KGaA, Bayer), but we think the market underestimates the challenges for would-be biosimilar producers and the industry’s defences. The recent approval of generic Lovenox in the US was a timely reminder that cash flows from in-market biologics should not be valued as an annuity. But valuable defences for innovative players include i) delivery devices – such as Sanofi’s recent success in migrating patients to its Solostar pen in the US and reducing its vulnerability to generic insulin; ii) incremental innovation – T-DM1 from Roche was an important upgrade to the currently approved Herceptin; and iii) diffusion biosimilar products – we think most of the innovator biopharmaceuticals will actively compete in the biosimilar market, leveraging their manufacturing capabilities to retain share, albeit at a 20% or so lower price.
Exhibit 1
Lantus pen delivery has tripled since Solostar’s introduction (NRx)
0%
10%
20%
30%
40%
50%
60%
70%
80%
90%
100%
Sep-04
Mar-05
Sep-05
Mar-06
Sep-06
Mar-07
Sep-07
Mar-08
Sep-08
Mar-09
Sep-09
Mar-10
CART VIAL WET MD DEVICE PRF Source: IMS Health
Exhibit 2
Lantus Solostar share of NRx market close to 40%
0%
10%
20%
30%
40%
50%
60%
70%
80%
Jun-09 Aug-09 Oct-09 Dec-09 Feb-10 Apr-10 Jun-10 Aug-10 Oct-10
CART VIAL WET MD DEVICE PRF Source: IMS Health
Potential Catalysts
December 2010 – US approval of AZN Brilinta for the management of ACS. We forecast risk-adjusted global sales of $1.7bn in 2016. Weekly and monthly IMS scrip data will be an early guide to the commercial potential
February 2011 – EU approval of NVS’s Gilenya for MS. We forecast sales of $3bn in 2016
March 2011 – US approval of Benylsta (Lupus); EU approval by end Q1. Initial IMS trends could be poor, but once sampling and reimbursement issues are resolved, we expect a strong quarterly ramp in high contribution margin revenues
December 2011 – EMEA to publish guidelines for approval of biosimilar monoclonal antibodies in Europe. We see modest upside to a pessimistic consensus that the regulator will set limited hurdles to generic competition for agents such as Roche’s Herceptin and Rituxan, and Merck KgaA’s Erbitux
FY 2011 – NVS could pursue plans to buy the outstanding 23% stake in US ophthalmology company Alcon. This could be value creating, assuming the deal is debt funded and NVS realizes the $300m synergies it has indicated
43

M O R G A N S T A N L E Y R E S E A R C H
Big Debates: 2011December 8, 2010
Property Macro Tailwinds versus Debt-Related Headwinds
Morgan Stanley & Co.
International plc+
Bart Gysens, CFA [email protected]
Our View Market View
Tailwinds from rising liquidity and inflation expectations should more than offset headwinds from debt deleveraging and refinancing in the medium term. We think that the quoted property sector will continue its recent trend of outperformance relative to the broader equity market well into 2011.
Recent strong performance has resulted in a trading range breakout, suggesting that equity markets are giving more weight to the tailwinds. However, the sector remains unloved and under-owned by generalists, hedge funds have limited exposure, and we do not detect a strong consensus view among specialist investors.
What’s in the Price Is QE2 already in the price? Yield spreads suggest not
Property Yield - (5yr Bond Yield - Inflation Expectations)
0
1
2
3
4
5
6
7
8
9
1987 1988 1989 1990 1991 1992 1993 1994 1995 1996 1997 1998 1999 2000 2001 2002 2003 2004 2005 2006 2007 2008 2009 2010
(%)
Source: IPD, Datastream, Morgan Stanley Research
Four property bull markets in the last 45 years During the last 45 years, there have been four distinct bull markets in UK property stocks, during which UK property as a sector outperformed the broader equity market in a material way and for a protracted period (see Exhibit 1).
Driven by inflation or liquidity Three of the four bull markets were, in our view, at least partially driven by rising inflation and/or inflation expectations (see Exhibit 1). The fourth property bull market was initially driven by a rotation out of ‘new economy’ sectors back into ‘old economy’ stocks and was then followed and fuelled by the credit bubble.
Inflation drives NAVs and earnings Pension funds and insurance companies tend to allocate more capital to commercial property in times of rising inflation, driving property values, hence NAVs, higher. In addition, property stocks benefit from better earnings growth in times of high inflation. UK companies recoup inflation through the rent review process on average after 2.5 years (five-year rent review cycle), while they typically fund with long-term fixed-rate debt. As a result, we think it is not surprising that property stocks trade on higher P/E multiples in times of high inflation. And while in continental Europe leases and debt duration are shorter, most leases are indexed with some measure of inflation, which allows for an even shorter feedback loop into earnings.
44

M O R G A N S T A N L E Y R E S E A R C H
Big Debates: 2011December 8, 2010
Exhibit 1
During the last 45 years, there have been four protracted periods of meaningful outperformance
Performance of UK Property relative to the broader UK equity market
0
50
100
150
200
250
Dec-65
Dec-70
Dec-75
Dec-80
Dec-85
Dec-90
Dec-95
Dec-00
Dec-05
Dec-10
Not including shorter bear market rallies such as
1 2 3 4
Source: DataStream, Morgan Stanley Research
Unloved and under-owned In addition, the quoted property sector remains very much unloved and under-owned by generalist investors, which are on average underweight property.
Outperformance ahead Given the pricing of direct property (all-time high spreads over real bond yields), rising inflation expectations and the near-term QE2-driven liquidity boost, we think all the ingredients are there for the quoted property sector to outperform.
Exhibit 2
Institutions increase allocations to direct property in times of rising inflation
0
5
10
15
20
25
30
1963 1968 1973 1978 1983 1988 1993 1998 2003 2008
0
5
10
15
20
25
30
%
Inflation
UK long-term insurance funds - weighting to property
UK pension funds -weighting to
property
Source: WM Mercer, CEA, DataStream, Morgan Stanley Research
Exhibit 3
Three of those periods were driven mainly by rising inflation (expectations), the other by liquidity
UK RPI Inflation
-5
0
5
10
15
20
25
30
Dec-65
Dec-70
Dec-75
Dec-80
Dec-85
Dec-90
Dec-95
Dec-00
Dec-05
Dec-10
(%)
Source: DataStream, Morgan Stanley Research
Delay rather than removal of downside risks The main reason for our previous Cautious industry view – a wall of refinancing and recapitalizations – has not been removed, and gross debt outstanding remains close to peak levels. Therefore, in our view, the QE liquidity boost is merely delaying what we think is an inevitable period of poor performance in absolute terms and underperformance in relative terms. But we believe this delay will be too long to ignore for equity investors.
Exhibit 4
UK property stocks’ P/E relative to the market P/E is highly correlated to inflation
-5
0
5
10
15
20
25
30
1966 1969 1972 1975 1978 1981 1984 1987 1990 1993 1996 1999 2002 2005 20080
1
2
3
4
5
6
UK inflation (LH side)
Ratio of property sector PE over broader equity
market PE (RH side)
(%)
Source: DataStream, Morgan Stanley Research
45

M O R G A N S T A N L E Y R E S E A R C H
Big Debates: 2011December 8, 2010
Retail Unprecedented Apparel Inflation: What Is the Price Elasticity of Clothing? Morgan Stanley & Co.
International plc+
Charlie Muir-Sands [email protected]
Our View Market View
We expect total value of sales to be broadly unchanged by impending inflation – price elasticity of ~1.0. We see markdown from overstocking as the biggest risk. Our regression analysis suggests a relationship of ~0.85 over the last 20 years. However, given the difficult economic environment, we would expect consumers to be extra price sensitive. Our key concern, however, is that some retailers may assume much less elastic pricing, in which case overstocking could be an issue by the spring, and markdown a major problem by the summer.
Sellside consensus expects 10% earnings growth in 2011 across our apparel coverage – we are 11% below. There is considerable investor nervousness about the impact of higher inflation, but very little consensus as to how the situation will play out. Retailers have publically suggested price elasticity from as little as zero (i.e. no volume impact from higher prices) to as much as 1.0. Sellside forecasts appear to be largely ignoring the issue. Consensus assumes EPS growth of at least 7% next year at each of the seven European apparel retailers we cover, with no apparent gross margin pressure built into forecasts at this stage.
What’s in the Price? Our below consensus forecasts are driven by cautious gross margin and top line assumptions
Calendar 2011 Gross Margin forecast
-1.4%
-1.1%
-0.4% -0.4%
0.0%
0.2%
0.3%
-1.6%
-1.4%
-1.2%
-1.0%
-0.8%
-0.6%
-0.4%
-0.2%
0.0%
0.2%
0.4%
0.6%
H&M (OW)
Next (EW)
M&S (EW)*
Inditex (EW)
Debenhams(EW)
N Brown (OW)
Asos (UW)
* General Merchandise Source: FactSet (price data), Morgan Stanley Research estimares
-18%
-13% -13%
-6%
0%
5%
0%
-20%
-15%
-10%
-5%
0%
5%
10%
Debenhams(EW)
Next (EW)
M&S (EW)
Inditex (EW)
ASOS (UW)
H&M (OW)
N Brown (OW)
Morgan Stanley EPS vs. Consensus - Cal 2011 Market Implied Long Term growth rate %
Source: FactSet (consensus), Morgan Stanley Research estimates
European apparel retailers are facing c10% input cost inflation in spring-summer 2011, possibly more in H2, with cotton prices spiking, minimum wage increases in China, global demand recovering and Far East supply tight. Most retailers have been clear that they intend to try to pass this on to consumers. However, there hasn’t been inflation in this market in c.20 years, and no one knows how consumers will respond.
We haven’t had apparel inflation since 1991 … The UK clothing market has experienced deflation for nearly 20 years due to increased direct sourcing from low cost countries and the removal of trade barriers and tariffs. Though less extreme, clothing inflation in other Western markets has also been rare
and modest. Hence there is no recent precedent to the 5-10% price rises many retailers plan to put through in 2011.
… so there is a wide divergence of opinions as to price elasticity today. Among the retailers, there are a wide range of opinions: some US retailers suggest near zero elasticity, through to Next at 1.0 (‘unit elastic’). The vast majority of retailers, however, decline to comment, preferring to keep their buying plans for 2011 confidential.
If elasticity proves to be zero, consensus forecasts are likely to be c.30% too low … If retailers can increase their prices to maintain gross margin percentage (as, for example, Next intends to do), and this has no impact on volumes, the
46

M O R G A N S T A N L E Y R E S E A R C H
Big Debates: 2011December 8, 2010
industry could report 8-10% like-for-like sales in 2011 (ex-VAT). With demand generally expected to be lower than this, industry gross margins would also benefit from lower markdowns, albeit the rush for extra stock would incur some offsetting costs such as expedited freight charges. Additionally, with higher selling prices and many operating costs being volume (rather than value) related, opex/sales ratios would also fall. Hence, with financial leverage (in some instances) we estimate earnings forecasts could be 30% too low on average.
… and if it is 1.5, there could be 30% downside. However, apparel has become increasingly discretionary in recent years, in our view, so price rises may prompt consumers to spend their discretionary income elsewhere. In this event, not only would we see a weak top line (1.5 elasticity implies -7% LFL, or -9% ex-VAT in UK), but promotional markdown could also weigh on gross margins by 300-400bps. Declines in volume-related operating costs would offset some P&L impact, but we nevertheless would see significant downgrades in our apparel coverage. Absent any specific cost-cutting measures, our scenario analysis suggests up to 60% downside to earnings. Neither extreme scenario seems likely to us, but even within more modest ranges we believe there is material uncertainty to 2011 forecasts.
Exhibit 1
We see 30% average upside / downside to our earnings forecasts at the extremes of elasticity
-80% -60% -40% -20% 0% 20% 40% 60%
H&M
N Brown
M&S
Inditex
Next
Debenhams
Elasticity = ZeroElasticity = 1.5
Earnings sensitivity by Clothing Elasticity of Demand scenario
Source: Morgan Stanley Research estimates
Our best estimate is for elasticity of around 1.0 … Based on our own analysis of the last 20 years, historical elasticity has been 0.85 in UK, while our US colleagues have found it to be more than 1.0. Hence, with elasticity increasing in recent years, we anticipate a UK response close to, and potentially slightly above, 1.0.
Exhibit 2
Elasticity of demand to changes in clothing prices has generally increased over time
-1.6
-1.4
-1.2
-1.0
-0.8
-0.6
-0.4
-0.2
0.0
Q11963
Q11968
Q11973
Q11978
Q11983
Q11988
Q11993
Q11998
Q12003
Q12008
Household Final Consumption Expenditure - Clothing & Footwear, 10 year rolling price elasticity %
PerfectlyInelastic
Unit elastic
Inelastic
Elastic
Source: National Statistics, Morgan Stanley Research
… with excess stock thus the key downside risk to margins. However, it is not the absolute elasticity of demand that matters most, in our view, but the difference between actual elasticity and that anticipated by retailers. We fear the market in aggregate will buy for more demand in 2011 than subsequently materializes. If this is the case, we think aggressive discounting could spread across the market by late spring, weighing on the margins of even the more prudent and flexible retailers.
Retailers with ‘self-help’ have the biggest protection from cost price rises on bought-in margins … Several retailers start the year with strategic or tactical gross margin advantages over the wider market. For example, Debenhams continues to increase allocation to higher-margin own-bought ranges, and ASOS should achieve year-on-year benefits in sourcing from its rapid growth in scale. Longer term, M&S should also benefit from increasing direct sourcing, but this is unlikely to mitigate pressures on its clothing business on a 12-month view. However, these are all well-understood advantages, in our view, and thus already ‘in the price’ and sellside forecasts.
… but those with superior supply chains or cost structures can best navigate the demand uncertainty. Inditex’ proximity sourcing model is the most flexible supply chain across our coverage, though the company’s southern European exposure and already high expectations leave us on the sidelines. We prefer H&M, where not only are margin expectations already low, but the company’s scale and rate of growth should help mitigate cost inflation at source. We also like N Brown, whose niche position provides pricing power, and variable cost structure and well-provisioned credit book (contributing c40% of gross profits) delivers margin stability.
47
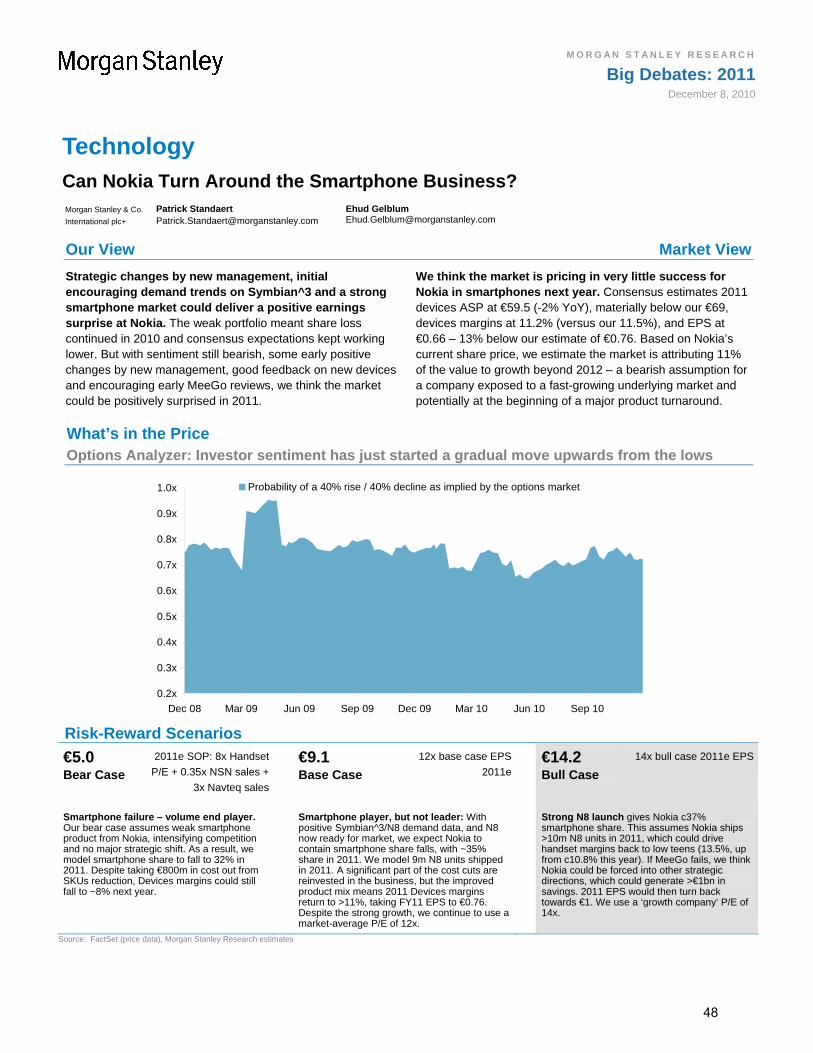
M O R G A N S T A N L E Y R E S E A R C H
Big Debates: 2011December 8, 2010
Technology Can Nokia Turn Around the Smartphone Business? Morgan Stanley & Co.
International plc+
Patrick Standaert [email protected]
Ehud Gelblum [email protected]
Our View Market View
Strategic changes by new management, initial encouraging demand trends on Symbian^3 and a strong smartphone market could deliver a positive earnings surprise at Nokia. The weak portfolio meant share loss continued in 2010 and consensus expectations kept working lower. But with sentiment still bearish, some early positive changes by new management, good feedback on new devices and encouraging early MeeGo reviews, we think the market could be positively surprised in 2011.
We think the market is pricing in very little success for Nokia in smartphones next year. Consensus estimates 2011 devices ASP at €59.5 (-2% YoY), materially below our €69, devices margins at 11.2% (versus our 11.5%), and EPS at €0.66 – 13% below our estimate of €0.76. Based on Nokia’s current share price, we estimate the market is attributing 11% of the value to growth beyond 2012 – a bearish assumption for a company exposed to a fast-growing underlying market and potentially at the beginning of a major product turnaround.
What’s in the Price Options Analyzer: Investor sentiment has just started a gradual move upwards from the lows
0.2x
0.3x
0.4x
0.5x
0.6x
0.7x
0.8x
0.9x
1.0x
Dec 08 Mar 09 Jun 09 Sep 09 Dec 09 Mar 10 Jun 10 Sep 10
Probability of a 40% rise / 40% decline as implied by the options market
Risk-Reward Scenarios
€5.0 Bear Case
2011e SOP: 8x Handset
P/E + 0.35x NSN sales +
3x Navteq sales
€9.1 Base Case
12x base case EPS
2011e
€14.2 Bull Case
14x bull case 2011e EPS
Smartphone failure – volume end player. Our bear case assumes weak smartphone product from Nokia, intensifying competition and no major strategic shift. As a result, we model smartphone share to fall to 32% in 2011. Despite taking €800m in cost out from SKUs reduction, Devices margins could still fall to ~8% next year.
Smartphone player, but not leader: With positive Symbian^3/N8 demand data, and N8 now ready for market, we expect Nokia to contain smartphone share falls, with ~35% share in 2011. We model 9m N8 units shipped in 2011. A significant part of the cost cuts are reinvested in the business, but the improved product mix means 2011 Devices margins return to >11%, taking FY11 EPS to €0.76. Despite the strong growth, we continue to use a market-average P/E of 12x.
Strong N8 launch gives Nokia c37% smartphone share. This assumes Nokia ships >10m N8 units in 2011, which could drive handset margins back to low teens (13.5%, up from c10.8% this year). If MeeGo fails, we think Nokia could be forced into other strategic directions, which could generate >€1bn in savings. 2011 EPS would then turn back towards €1. We use a ‘growth company’ P/E of 14x.
Source: FactSet (price data), Morgan Stanley Research estimates
48

M O R G A N S T A N L E Y R E S E A R C H
Big Debates: 2011December 8, 2010
Potential Catalysts
2H 2010 Closing of the accretive Motorola deal
Jan 2011 4Q 2010 Results. We expect good performance on Symbian^3 devices, N8 and positive ASP trends
Feb 2011 Nokia will host its Capital Markets Day, at which new CEO Stephen Elop will present for the first time, setting out his long-term vision and strategy for Nokia
1H 2010 Announcement of MeeGo based devices
Swift changes by new CEO. Over the past three years, Nokia has tried to be all things to all people, resulting in major fragmentation and huge R&D spend. Not surprisingly, new CEO Stephen Elop was quick to identify inefficiencies, resulting in the recently announced 1,800 headcount cuts (~10% of total) in R&D. We think this represents >100bps in Devices margins.
We believe Nokia’s CEO has a clear view of the company’s challenges and weakness – relating to software, hardware and developers. Nokia pushed out the Capital Markets Day to February 2011 (from December) to give the new CEO time to formulate his strategy. However, given his early decisions, we think the market could be positively surprised with further announcements in February.
N8 / Symbian^3 – a key driver for 2011 estimates. We assume Nokia ships ~9m N8 in 2011. Given the high ASP of the device and gross margins of ~40%, we estimate the N8 alone can contribute €0.24 of incremental EPS to 2011 (i.e. 32% of our 2011 EPS of €0.76). Our proprietary survey with 150 European retailers as well as anecdotal demand data points have been supportive of our above-consensus estimates. In addition, we note that the N8 has been among the top-selling phones in Phone Warehouse in France and Spain and has been sold out at a few operators in the UK. To put our N8 unit assumptions in context, our Apple analyst Katy Huberty estimates 72m iPhone shipments in 2011, so we think our 9m N8 assumption is reasonable.
In addition to the N8, other Symbian^3 devices, including the C6-01 and C7, have also been selling well, with the E7 to start selling in January 2011. We think these additions to Nokia’s portfolio will help curtail the significant smartphone share declines seen in the past few quarters.
Exhibit 1
The N8 alone could add €0.24 to our 2011 EPS 1Q 11e 2Q 11e 3Q 11e 4Q 11e
N8 Global Weekly Run rate 203,400 186,450 169,500 169,500N8 Units in the qtr (mn) 2.6 2.4 2.0 2.0ASP (€) 343 336 329 323N8 Revenues (€m) 907 815 659 646Gross Margins on N8 (%) 40 40 40 40Gross Profit on N8 363 326 264 258Mkting Cost (€7 fade to €5/unit) 21 15 4 4Operating Profit on N8 342 311 260 254NOPAT (26% tax rate) 253 230 192 188Diluted Shares O/S 3,656 3,656 3,656 3,656EPS contribution from N8 0.07 0.06 0.05 0.05
Source: Morgan Stanley Research estimates
MeeGo remains a free option. MeeGo will be Nokia’s operating system for the high end smartphones and mobile computers. With no devices yet (expected mid 2011), MeeGo success remains a free option for investors. If MeeGo fails, Nokia could be forced to pursue other strategic options, we think, which could be viewed positively. Our early take from the MeeGo event in Dublin and looking at Nokia’s focus on developers/apps is that the platform has potential, but that Nokia will need to deliver.
Exhibit 2
Attractive risk-reward, with our bull case more likely than the bear case
WARNINGDONOTEDIT_RRS4RL~NOK1V.HE~
€9.70 (+31%)
€ 7.38
€5 (-32%)
€14.2 (+92%)
0
2
4
6
8
10
12
14
16
Dec-08 Jun-09 Dec-09 Jun-10 Dec-10 Jun-11 Dec-11
€
Price Target (Dec-11) Historical Stock Performance Current Stock Price Our €9.70 PT is based on a 10% weighting to the bear case, 20% to the bull case and 70% to the base case. Source: FactSet (historical prices), Morgan Stanley Research estimates
Exhibit 3
Nokia price implies that the market is attributing 11% of the current value to growth post-2012
6.36
7.38
0.19
0.82
QQQQQQQQQQQQQQQQQQQQQQQQ
Value of current earnings
Value of growth in next 3 years
Implied value of long-term growth
Current price
Source: FactSet consensus, Morgan Stanley Research estimates
49

M O R G A N S T A N L E Y R E S E A R C H
Big Debates: 2011December 8, 2010
Telecommunications Services KPN: Can Fibre Drive a Wireline Inflection and Stable FCF? Morgan Stanley & Co.
International plc+
Luis Prota [email protected]
Our View Market View
Reggefiber concerns should be materially reduced in 2011 as KPN reports pro forma numbers with this asset. We estimate a stable FCF profile until 2015, with a €1 bn buyback and growing sustainable DPS, even with a consolidated Reggefiber.
The market is concerned about increasing cable competition in the Netherlands in 2011, and expects KPN to show pro forma FCF dilution from Reggefiber. Line loss and ARPU are not expected to improve materially. We estimate the shares are discounting a 30-60% decline in FCF by 2015/16.
Risk-Reward Scenarios Upside skew reflects our greater conviction on cash flow sustainability and shareholder returns
WARNINGDONOTEDIT_RRS4RL~KPN.AS~
€15.0 (+37%)
€ 10.97
€8.4 (-23%)
€18.2 (+66%)
0
2
4
6
8
10
12
14
16
18
20
Dec-08 Jun-09 Dec-09 Jun-10 Dec-10 Jun-11 Dec-11
€
Base Case (Dec-11) Historical Stock Performance Current Stock Price .
€8.4 Bear Case
Macro environment and
tough competition hurts BB
growth, shares falls 2-3pp
€15.0 Base Case
No double dip, stable
VoIP and BB share
€18.2 Bull Case
BB share gains,
further cost cuts and
sale of mobile towers
10% share loss in domestic mobile. Factors in the potential €1.6bn liability from KPN Qwest. BB penetration of 78%, with VoIP penetration 60% and KPN share 38%; Eplus 13% LT share of revenues. 5% lower consumer ARPU by 2012 and 10% in the business segment. No more buybacks.
BB penetration reaches 86%; VoIP penetration 63% and KPN share 40%. Eplus takes share till 2012 only, stabilising at 16% LT revenue share. Domestic mobile sees no further benefit from in-market consolidation. Buybacks of €1 bn a year continue until 2015.
BB penetration reaches 86%, with VoIP penetration of 63% and KPN’s share 45%. Eplus takes 20% long-term share of revenues and mobile towers sold at 15x EBITDA. Benefits from domestic mobile consolidation. Buybacks of around €1bn per year continue until 2015.
Source: FactSet (price data), Morgan Stanley Research estimates
Concerns over Reggefiber dilution risk should abate in 2011. Reggefiber is 40% owned by KPN and is building the company’s fiber network. Consolidated as an associate, it is perceived by some in the market as an off balance sheet risk that could dilute FCF and shareholder returns. KPN says the agreement to buy the remaining stake in Reggefiber will not
lead to full consolidation until 2013 at the earliest, and we estimate that the maximum dilution would be €162m (KPN estimate €170m). Market fears on this point should be addressed with the release of pro forma numbers with Reggefiber by mid next year. We also expect line loss to decline in 2011 to 100k lines from >150k this year, which
50

M O R G A N S T A N L E Y R E S E A R C H
Big Debates: 2011December 8, 2010
should improve sentiment on the benefits of a network upgrade (reducing churn) and the potential for an inflection in wireline revenues.
We think risks to FCF are exaggerated. We see FCF as relatively stable with an unchanged returns policy over the next five years. KPN’s five-year bond yield is trading at 3.16% versus a safe dividend yield of 7.5% for 2011e (55% of total FCF), suggesting the market expects 30% lower FCF by 2015/16. If we consider the buyback as a cash distribution, the cut to FCF would be 60%.
Even on a pro forma proportionate consolidation of Reggefiber from 2010, underlying FCF stays above €2 bn, on our estimates, averaging ~€2.2 bn in 2010-15 (Exhibit 1). This would still cover annual shareholder returns of €2.2bn in 2010-15e, which we see as a key attraction of the stock. Underlying FCF excludes the double tax payment in Germany (recapture), which we expect to end by mid 2013, and includes the proportionate consolidation of Reggefiber. We estimate net debt to EBITDA for the period at 2-2.2x, well below the higher end of the 2-2.5x guidance range, providing substantial financial flexibility.
Exhibit 1
Average underlying FCF in line with SHR for 2010-15e: FCF excess until 2012e, minor deficit 2013-15e
1,900
1,9502,000
2,0502,100
2,1502,200
2,2502,300
2,350
2010e 2011e 2012e 2013e 2014e 2015e
Underlying FCFE ex recapture with Reggefiber proportionateShareholders returns
Average underlying FCFE 2010-15e Source: Morgan Stanley Research estimates
Fears over share loss to cable competition and launch of Docsis 3.0 (speeds up to 100M) are overdone. We note that share loss has been only 1pp in the past 12 months and only -10k DSL customers out of 2.57 million. KPN says that it is losing no more customers to cable than normal. There is minimal price competition with cable – KPN prices are very similar for such bandwidth range – and 80% of the new KPN IPTV customers are taking other services from KPN (i.e. they are not taking these from cable). Given the VDSL network upgrade has only been in place since May, KPN’s broadband momentum should pick up going into 2011.
Wireline inflection is feasible and a free call option. Our average underlying FCF estimate of €2.2 bn for 2010-2015 is ~€200 m lower than company guidance of >€2.4bn for 2010 and 2011. However, if we assume line loss falls to zero by 2012 (KPN stated at our November TMT conference that it considered this feasible) down from our 40k average loss for 2012-2015, revenues would be ~€120m higher in the outer years. This also assumes lines not lost would take triple play with average monthly ARPU of €55, similar to current levels. Obviously not all the extra revenues would be additional FCF, but we would expect a large share to translate into higher cash generation due to the high margins on retained lines.
Longer term, a successful take-up of triple play services could provide a material boost to revenues and bring revenue growth to the wireline division. In the Netherlands, all households can go for KPN or cable or both. KPN has a 20% share in the single access market (customers with all services contracted with KPN), cable has 20% share, and the remaining 60% either does not have triple play connection or takes services from both KPN and cable. Of the 7 million households in the Netherlands, 17% are mobile-only, which implies the 60% share above is ~3.5 million households. If we assume KPN takes half of these (i.e. 1.75 million) and boosts ARPU by €10 (similar to current TV ARPU) the revenue impact could exceed €210 m. This is 13% of 2010e consumer wireline revenues, or 5% of 2010e total consumer revenues. Extending this out to 2015 suggests a consumer revenue CAGR of 1.5%, compared with around zero growth in our base case.
Potential Catalysts
Late January 2011 – 4Q10 results KPN should meet FY10 guidance, reiterate FY11 guidance and announce another €1 bn buyback
Late April 2011 – pro forma numbers with ReggefiberThese should show how small the impact is and reassure the market
Late January 2011 and April 2011 KPN management is excited about the mobile data contribution from Germany (Eplus). Services launched in November 2010, so we should have visibility with the FY10 and 1Q11 results
51

M O R G A N S T A N L E Y R E S E A R C H
Big Debates: 2011December 8, 2010
Tobacco Can Imperial Tobacco Deliver Organic Growth? Morgan Stanley & Co.
International plc+
Toby McCullagh [email protected]
Our View Market View
Imperial Tobacco’s valuation discount should shrink in 2011 as organic profit growth surprises and deployment of cash underpins earnings. We expect IMT to deliver 6.3% organic tobacco operating profit growth in FY11, in line with our estimates for BAT and PMI. IMT is also now below key leverage thresholds, and we expect it to outline its intentions for its strong cash flows over the coming months. Given peer-matching organic growth and cash return optionality, we expect the stock’s valuation discount to diminish through 2011.
The market is deeply sceptical of IMT’s ability to deliver organic revenue and profit growth, given its Developed Markets-biased footprint. IMT generates ~50% of volumes from Emerging Markets, but these sales generate only ~20% of its tobacco operating profit. The market believes that DM-led sluggish volumes and difficult pricing in already expensive markets will limit profit growth relative to the peers. We estimate that the share price implies a long-term decline of 5.0%, sharply lower than the historically pessimistic -1.4% and the most significant implied decline in the tobacco peer group.
What’s in the Price The market has an excessively pessimistic view of Imperial Tobacco’s growth prospects
0
5
10
15
20
25
4 1 2 3 4 1 2 3 4 1 2 3 4 1 2 3 4 1 2 3 4 1 2 3 4 1 2 3 4 1 2 3 *
2002 2003 2004 2005 2006 2007 2008 2009 2010
-8.0%
-6.0%
-4.0%
-2.0%
0.0%
2.0%
4.0%
IMPERIAL TOBACCO- Price Implied long - term growth rate
Risk-Reward Scenarios
1,460p Bear Case
7.5x Bear Case
FY11e Adj. EPS
2,270p Base Case
11.5x Base case CY11
Adj. EPS
2,590p Bull Case
12.9x P/E on Bull Case
FY11 Adj. EPS
Core markets slow volume growth and competition pressures pricing and margins. FY10-13 revenue and CAGR of 2.2% (vol -0.3%/price +1.8%) and operating profit CAGR of 2.0% on lack of incremental cost savings.
IMT deleverages to 2.5x Net debt / EBITDA by the end of FY11. FY10-13 revenue CAGR of 3.5% (vol +0.4%/price +3.1%) and operating profit CAGR of 4.5% (FY10-13 margin +150bps).
Exceeds growth potential identified in our profit pool analysis, driven by 100bps pa stronger pricing and stronger post-Altadis cost savings. FY10-13 revenue and operating profit CAGRs of 4.2% and 6.5%, respectively.
Source: FactSet (historical share price data), Morgan Stanley Research estimates
52

M O R G A N S T A N L E Y R E S E A R C H
Big Debates: 2011December 8, 2010
Potential Catalysts
F1Q11 IMS – IMT’s F1Q10 IMS should confirm continued strong performance into FY11
Announcements on use of cash
Market data from Nielsen – monthly data should show sustained momentum across core European markets
Market too bearish on IMT’s near-term growth The market perceives IMT as having structurally unattractive regional exposure and as lacking the brand portfolio to be able to drive further price increases. Despite its recent volume travails, IMT’s organic volume growth compares well with peers, helped by solid growth in its market-leading fine cut tobacco portfolio. IMT has also posted very strong pricing. Bears claim that because IMT operates in markets where cigarette prices are already high, it has less opportunity to increase prices further. This may be true over the very long term, but near term we think it is offset by the tax leverage in its core markets, which allows it to extract significant manufacturer pricing for relatively modest retail price increases.
Given that IMT is competitive on the main two net revenue drivers, we believe that it is reasonable to assume competitive operating profit growth rates – counter to the perception in the market.
Medium-term growth also surprisingly competitive We think the market underestimates IMT’s longer-term growth potential and fades its growth estimates too quickly. Our in-depth profit pool analysis suggests the global cigarette profit pool should grow by 6.2% a year for the next five years, and that IMT should deliver sustainable organic cigarette operating profit growth of 6.0% a year (versus 6.6% in FY10 and 6.3% in FY11e). Although this lags BAT and PM by as much as 90 bps a year, the magnitude of these companies’ structural advantage is considerably smaller than the market perceives. We therefore expect upgrades to medium-term consensus estimates for IMT, relative to its main peers.
Cash to be put to work or returned to shareholders The rate of debt reduction has been a central tenet of our Overweight stance on IMT. By end FY10, net debt / EBITDA was below 3.0x, and we believe the company is transitioning from pure debt reduction mode to being more creative with its strong cash generation. Although our base case assumes FY11 is another year focused on debt reduction, alternatives include product- or market-specific M&A, buybacks or an increase in the dividend payout ratio.
Exhibit 1
Organic volumes vs peers since 1Q09
-6%
-5%
-4%
-3%
-2%
-1%
0%
1%
1Q09 2Q09 3Q09 4Q09 1Q10 2Q10 3Q10
IMT PM BAT
PMIMT
BAT
Source: Company data, Morgan Stanley Research Exhibit 2
Price / mix versus peers since 2009
0%
2%
4%
6%
8%
10%
2009 2010e
BAT PM IMT Source: Company data, Morgan Stanley Research estimates (e) Exhibit 3
Profit pool determined cigarette growth potential Source of cigarette profits (%)
Countries
Share of profit
pool (%)5-yr profit CAGR (%) BAT PMI IMT
USA 26 4.0 9
Japan 9 0.3 3 11
Russia 6 11.9 8 7 4
Germany 6 4.3 7 9 14
Indonesia 4 11.8 1 7
Italy 6 6.9 8 11 2
UK 4 5.0 1 1 22
Spain 3 5.2 1 4 10
Turkey 2 10.2 3 5
Canada 3 4.9 8 3
France 3 3.6 2 4 6
India 2 12.7
Brazil 2 7.4 11 1
Australia 2 6.3 7 3 3
Korea 2 6.8 1 1
South Africa 2 5.2 8 0
Malaysia 1 4.6 4 1
Other 15 8.0 27 32 31
Implied growth rate (%) 6.9 6.8 6.0Source: Morgan Stanley Research estimates
53

M O R G A N S T A N L E Y R E S E A R C H
Big Debates: 2011December 8, 2010
Transport Container Shipping: Could Better Rate Discipline Drive Upside for Maersk? Morgan Stanley & Co.
International plc+
Menno Sanderse [email protected]
Douglas Hayes [email protected]
Our View Market View
Weak balance sheets in the container shipping industry create a major incentive for rate discipline. Though unit revenue on the key Asia to Europe trade lane is still declining, we believe the hard lessons learnt in the rate wars of 2009 and the continued weakness in balance sheets across the industry could drive rates higher next year from current levels. Earnings are highly sensitive to changes in container rates, and a return to peak rates and valuation could take Maersk towards our bull case of DKr68,000 per share (40% upside).
Maersk shares are pricing in container rates at current levels for next year (33% below July peak). Asia-Europe container rates are down 33% from the July high, and the peak season demand has disappointed, fuelling fears of a repeat of the 2009 rate wars. Consensus estimates imply that rates will stabilize around current levels, which implies a more than 10% YoY decline in 2011, fuelling the somewhat bearish relative performance of the shares since 3Q 2010.
What’s in the Price? Maersk shares are priced for little change in rates. The options market implies a 45% probability of the shares exceeding our DKr50,000 PT, and 10% that the shares reach our DKr68,000 bull case
Price Target : DKr 50,000 Stock Rating : Equal-Weight
MS Industry view : In-Line
The probabilities of our Bull, Base, and Bear case scenarios playing out were estimated with implied volatility data from the options market as of Dec 2,2010. All figures are approximaterisk-neutral probabilities of the stock reaching beyond the scenario price in one-year’s time.
A.P. MOLLER-MAERSK A/S
DKr 48,520.00
Prob(> DKr 68,000 ) ~ 10%DKr 68,000
DKr 25,000 Prob(< DKr 25,000 ) ~ 5%
DKr 50,000 Prob(> DKr 50,000 ) ~ 45%
DKr
-
20,000
40,000
60,000
80,000
100,000
Dec-08
Feb-09
May-09
Aug-09
Nov-09
Feb-10
May-10
Aug-10
Oct-10
Jan-11
Mar-11
May-11
Jul-11
Sep-11
Nov-11
~ 45% probability the stock will reach above DKr 50,000 price target in 12 months
Source: FactSet (price data), Morgan Stanley Research .
Container shipping is a highly fragmented industry … The big challenge facing the container shipping industry is the very nature of its trade. It is a capital intensive industry, perceived to be a commodity service by customers, with a fragmented supplier base. Returns barely meet the cost of capital over the cycle, while volatility in unit revenue has been very high.
… but much has changed since 2009. In 2009, the collapse in container shipping rates led to industry losses of $11.4 billion, according to Drewry. Major change was inevitable. Companies were recapitalised (via both debt and equity) and capacity was reduced by laying up ships – which rose to 12%
of capacity by December 2009 – and slow steaming, which absorbed around 4-5% of capacity. Margins and returns on capital recovered, returning to peak in Q2 and Q3 2010.
The industry appears keen to avoid another rate war. The orderbook as a percentage of total fleet has normalised to 21% in 2010e, versus 61% at the 2007 peak (Exhibit 1), which will help to prevent rapid capacity expansion. Furthermore, carriers appear quicker to react to any fall in demand growth by putting ships into lay-up to constrict supply and support rates (Exhibit 2). This discipline is reinforced by the industry’s weaker balance sheets compared to the pre-crisis years.
54

M O R G A N S T A N L E Y R E S E A R C H
Big Debates: 2011December 8, 2010
But capacity cascading could weigh on rates. Rates have started to decline from peak, in line with the usual seasonal downturn in demand. However, fears of further falls are compounded by the delivery of post panamax container ships (>10,000 TEUs) in 2011 and 2012. Ships of >10,000 TEUs are 44% of the order book of 1.4 million TEUs, and can only be deployed economically on the Asia-Europe trade lane, which has 3.6 million TEUs of capacity. The 17% implied capacity growth in 2011 (pre scrapping) significantly exceeds supply and risks triggering a cascading effect, as the smaller ships are deployed to other routes. This could put pressure on rates across trade lanes. Interestingly, though, forward prices on the Asia-Europe trade lane are in line with spot prices, suggesting a benign outcome – though the early stage of development and relatively low liquidity in container derivative contracts make this data difficult to interpret.
Better rate discipline would drive upside to Maersk. Our 2011 base case forecasts for Maersk assume a typical mid-cycle slowdown, with a -2% YoY fall in unit revenue ex-bunker costs, a 25% YoY decline in EBITDA and 12% EBITDA margin. Consensus forecasts a 15% EBITDA margin on flat unit revenue and an 18% decline in EBITDA. However, should 2011 rates exceed 2010 levels, the earnings and re-rating potential is significant. Every 1% YoY increase in unit revenue equals $160mn of net income and close to that amount in EBITDA. A return to peak valuation (based on peak rates) of ~5x EV/EBITDA for the division would take the shares towards our bull case of DKr 68,000.
The shares look inexpensive, on 1.1x book, while container shipping peers trade at 1.3x. Historically, APM has traded at 1.6x FY1 P/B (since 1998 based on 16% ROE), and we estimate ROE to be c.16% in 2010. However, valuation alone is rarely enough to move the shares, as the stock tends to trade on oil price and container rates (see Exhibit 4). Hence, we see potential for a rerating if rates rise in 2011.
Exhibit 1
Orderbook has normalized as a percentage of fleet, suggesting an improved outlook for the industry …
1,000
3,000
5,000
7,000
9,000
11,000
13,000
15,000
17,000
1995 2000 2003 2006 2009 2012e
Co
nta
ine
rsh
ip F
lee
t ('0
00
TE
Us)
2%
12%
22%
32%
42%
52%
62%
72%
Ord
erb
oo
k a
s %
of T
ota
l Fle
et
Fleet* Total Orderbook (% of fleet) Source: Drewry, Morgan Stanley Research
Exhibit 2
…and the quick reaction to declining rates via laying up ships shows that things may have structurally changed
0%
2%
4%
6%
8%
10%
12%
14%
Jan-09 Apr-09 Jul-09 Oct-09 Jan-10 Apr-10 Jul-10 Oct-10
Sh
ips
in la
y-u
p a
s %
of t
ota
l fle
et c
ap
aci
ty
750
800
850
900
950
1,000
1,050
1,100
1,150
1,200
1,250
Ch
ina
Co
nta
ine
r S
hip
pin
g In
de
x
Fleet in Lay-Up (LHS) Shanghai Container Index (RHS)
Source: Alphaliner, Morgan Stanley Research
Exhibit 3
Number of large container ships on order fuels fears of cascading and a knock-on effect on rates
1,259
537 487807
1,561
236 198
207701
372614
782
0
500
1,000
1,500
2,000
2,500
3,000
3,500
4,000
Asia-Europe 2011Deliveries*
2012Deliveries*
2013Deliveries*
Ca
pa
city
('0
00
TE
Us)
o.w. ships <7,500 TEUs o.w. ships >7,500 TEUs (<10,000) o.w. ships >10,000
denotes capacity (TEUs) of new deliveries as a percentage of prior year's Asia-Europe capacity (assuming that all newbuilds >10,000 TEUs are deployed to Asia-Europe)
17%^ 17%^ 8%^
Source: Alphaliner, Morgan Stanley Research
Exhibit 4
The Maersk share price is highly correlated with oil prices and changes in container rates
20,000
25,000
30,000
35,000
40,000
45,000
50,000
55,000
Jan-09 Mar-09 May-09 Jul-09 Sep-09 Nov-09 Jan-10 Mar-10 May-10 Jul-10 Sep-10 Nov-10
AP Moller share price APM "B" regression share price
From Jan 1, 2009:Correlation = 0.92R-Squared = 0.84
Source: FactSet, Drewry, Morgan Stanley Research
55

M O R G A N S T A N L E Y R E S E A R C H
Big Debates: 2011December 8, 2010
Utilities Could 2011 Bring an Inflection Point in Earnings? We Think Not Morgan Stanley & Co.
International plc+
Emmanuel Turpin [email protected]
Bobby Chada [email protected]
Our View Market View
Consensus earnings are still too high. The utilities sector has been among the worst performers in 2009 and 2010, but we believe there is further underperformance to come. We expect prolonged commodity weakness in Europe, windfall taxes and further need for balance sheet repairs through disposals, capex cuts and possible revisions to dividend policy. Indeed, the tough conditions in the sector could produce a more fundamental rethink among corporates. Consensus forecasts need to come down further, we believe.
The market appears to be discounting an EPS CAGR of ~4% for the sector over the next 10 years – almost 1 percentage point higher than the average for Europe and in line with the growth we estimate for the next three years. While the long-term implied growth rate may prove right over 10 years, we see a risk of disappointment for short-term consensus estimates. Our bottom-up analysis suggests a further c.4-5% downside to average consensus EPS for the sector in 2011-13.
What’s in the Price The market is discounting 4.2% CAGR in EPS over the next 10 years – ripe for disappointment over the next three years, we believe
0+1+2+3+4+5+6+7+8+9
Hou
seho
ldP
rod
Rea
l Est
ate
Con
s D
ur
Hea
lth C
are
Foo
d &
Bev
Ret
ailin
g
Sem
is
Com
mS
erv
Sof
twar
e
Con
s S
erv
Foo
d R
etai
l
Cap
Goo
ds
Med
ia
Util
ities
Tec
hH
ardw
are
Tra
nspo
rt
Pha
rma
Tel
ecom
ms
Mat
eria
ls
Div
Fin
Ene
rgy
Aut
os
Insu
ranc
e
Ban
ks
Eur
ope
Source: Morgan Stanley Research, c/o Morgan Stanley European Strategy Team .
Three risks to earnings in 2011 1. Commodity prices remaining weak: The structural overcapacity in power generation in Europe will not abate in 2011, as we estimate newbuild will cover the increase in demand. We also doubt whether possible further negotiations between gas producers and large European importers will be enough to replenish supply margins. We see further downside to consensus on this front.
2. Disposals are likely to be dilutive: We expect utilities companies to continue to pursue disposals to strengthen their balance sheets. In today’s low interest rate environment, there
is a real risk that selling asset-heavy businesses, such as utilities, is dilutive.
3. Government initiatives could also weigh on earnings: We expect this to be the case in Germany, primarily, as 2011 will be the first year of the nuclear windfall tax. We should also get more details next year on reform of the Spanish utilities sector and on the Czech plan to curb free CO2 allocations. In Russia, 2011 will be the first year when most of the regulatory rules are in place for both the wholesale power market and regulated utilities.
56

M O R G A N S T A N L E Y R E S E A R C H
Big Debates: 2011December 8, 2010
Exhibit 2
UK forward thermal spreads remain low
0
5
10
15
20
25
30
Sep2004
Feb2005
Aug2005
Jan2006
Jun2006
Nov2006
May2007
Oct2007
Mar2008
Aug2008
Feb2009
Jul2009
Dec2009
Jun2010
Nov2010
Apr2011
£ /
MW
h
Dark 2007/08 Dark 2008/09 Spark 2007/08 Spark 2008/09 Dark 2009/10
Spark 2009/10 Dark 2010/11 Spark 2010/11 Dark 2011/12 Spark 2011/12
Source: Bloomberg
We see more earnings downside for large integrated utilities and less for regulated companies and gencos (Exhibit 2). We see an average 4% downside to 2011 consensus earnings for integrated utilities. Underweight-rated names where we see downside risk to consensus earnings include Gas Natural, Iberdrola and E.ON. We see upside risk to consensus for Overweight-rated Enel, as well as attractive valuation and strong free cash flow generation. We see less earnings risk to the upside or downside for regulated infrastructure stocks – unsurprisingly, given the higher visibility of cash flows. We see some upside to consensus earnings for SEV, one of our key Overweights in the environment space. In the gencos category, we see earnings upside to our preferred generating company PGE, and downside to Underweight, Drax.
Exhibit 1
Upside / downside to 2011 consensus estimates – we see more downside to EPS for integrated utilities
-25%
-20%
-15%
-10%
-5%
0%
5%
10%
15%
20%
Edi
son
Ene
l
RW
EA
2A
Cen
tric
a
SS
EE
ndes
a
AC
EA
Ave
rage
E.O
N
ED
P
GS
ZE
DF
PP
C
Iber
drol
a G
AS
FE
ES
SE
VI
PN
N
Ave
rage
NW
G
Ena
gas
SR
GT
erna
SV
T
RE
EN
G
UU
CE
Z
For
tum
Ave
rage
Dra
x
Ver
bundU
psid
e/(D
owns
ide)
to 2
011
Con
sens
us E
PS Integrated Infrastructure Gencos
Source: FactSet, Morgan Stanley Research estimates Note: UU stands out owing to the accounting treatment of recent disposal
Potential Catalysts
FY reporting season from 2 Feb The reporting season kicks off on 2 February with Fortum and runs into March. We expect consensus estimates to rebase further
Spanish industry reform – 1Q 2011? The Spanish government could announce reforms to electricity system costs by year end or in 1Q 2011. This could include a new nuclear tax and reform of the other system costs, as well as a revision of transmission and distribution costs and a mechanism to reduce investment in renewables generation
Details on Czech CO2 clawback and regulatory reform in Russia – 4Q 2010 / 1H 2011 We expect the Czech government to finalise the 2011 and 2012 tax rate on free CO2 allocations soon, but debate on the clawback of free CO2 credits after 2012 may spill over into 1H 2011. In Russia, wholesale market pricing (primarily related to capacity payments) should be known by this year end. But, in distribution, the switch from cost-plus to RAB-based tariff setting (due to be implementend before January 2011) may be delayed in some regions
57

M O R G A N S T A N L E Y R E S E A R C H
Big Debates: 2011December 8, 2010
EEMEA Banks Can Credit Normalization Continue to Drive Outperformance? Morgan Stanley & Co.
International plc+
Magdalena Stoklosa [email protected]
Our View Market View
Credit normalization to drive strong earnings growth. Over 2011/12, we expect cyclical uplift to lead to ROEs normalizing to pre-crisis levels. Yet our normalization theme shifts geographically from Turkey, whose ROEs did not de-rate through the cycle, to Russia, Poland and the Czech Republic.
Buy Sberbank, PKO BP, Komercni. We are positive on Russia, through Sberbank (OW), and Poland through PKO BP (OW). We turn equal-weight on Turkey, with Garanti (OW) our top pick. We remain cautious on South Africa, where we see only half of the story, i.e. credit normalization, without the asset growth; Standard Bank (OW) is our preferred name.
We still see the market as willing to look through the cycle to assess ROEs – this is now relatively easy, as we are already coming off the cyclical provisioning highs. We see the rationale for sustainable ROEs, and ourselves use through-the-cycle valuations to assess longer-term potential which, in markets like Turkey, Russia and Poland, may only become fully evident on a multi-year view.
Exhibit 1
Russia: credit normalization in 2011e and 2012e Earnings drivers/Avg. Assets
0.0%
1.0%
2.0%
3.0%
4.0%
5.0%
6.0%
PPP COR PPP COR PPP COR PPP COR
2009 2010e 2011e 2012e
Sber VTB
PPP= Pre-Provision Profit margin COR = Cost of Risk Source: Company data, Morgan Stanley Research (estimates for 2010-12)
Exhibit 2
CEE is also normalized yet stronger in 2012e Earnings drivers/Avg. Assets
0.0%
0.5%
1.0%
1.5%
2.0%
2.5%
3.0%
3.5%
4.0%
4.5%
PPP COR PPP COR PPP COR PPP COR
2009 2010e 2011e 2012e
PEK PKO OTP KB
PPP= Pre-Provision Profit margin COR = Cost of Risk Source: Company data, Morgan Stanley Research (estimates for 2010-12)
Exhibit 3
Turkey earliest normalization, already in 2010e Earnings drivers/Avg. Assets
0.0%
1.0%
2.0%
3.0%
4.0%
5.0%
6.0%
PPP COR PPP COR PPP COR PPP COR
2009 2010e 2011e 2012e
AKB GAR
ISB YKB
PPP= Pre-Provision Profit margin COR = Cost of Risk Source: Company data, Morgan Stanley Research (estimates for 2010-12)
Exhibit 4
SA normalizing in 2011e and 2012e Earnings drivers/Avg. Assets
0.0%
1.0%
2.0%
3.0%
PPP COR PPP COR PPP COR PPP COR
2009 2010e 2011e 2012e
ABSA FSR NED SBK
PPP= Pre-Provision Profit margin COR = Cost of Risk Source: Company data, Morgan Stanley Research (estimates for 2010-12)
58

M O R G A N S T A N L E Y R E S E A R C H
Big Debates: 2011December 8, 2010
Key Themes: Cyclical normalisation and NIM expansion drive earnings momentum. Prefer Poland and Russia. Impairment curves inflected over the past three quarters for the majority of EMEA banks, with cost of risk normalizing at 130bps in 2010 and 110bps in 2011. Despite a deceleration in NPL flow, the actual stock remains persistently high at 5-11% in all of our countries, though we believe we should see NPLs declining in Russia, Poland and Czech Republic.
Best Positioned: Sberbank, PKO BP More Challenged: Nedbank, Turkish banks
Key Themes: Retail credit growth reaching ~20% further underpins revenues. Low leverage, rising affordability and savings buffers cap retail NPLs and underpin retail credit growth. Debt capacity, limited stress on household balance sheets and a wealth effect all point to a resilient consumer cycle in Turkey and Russia. The Polish consumer also seems to have weathered the cycle. We forecast 25% retail growth in Turkey, 20% in Russia and Poland, 5% in South Africa and a 7% decline in Hungary.
Best Positioned: Sberbank, PKO BP, Isbank More Challenged: South African banks
Key Themes: Valuation catch-up due in Russia and Poland, further dividend support for Poland. Our sustainable ROE levels should be attained by 2011, with CoE risks stabilizing. We use through-the-cycle valuations to assess longer-term potential which, in markets like Turkey, Russia and Poland, may only become fully evident on a multi-year view. Cost of equity gains are broadly over, as we have priced in already low valuations of EMEA sovereign risks.
Key Themes: Polish/Czech/MENA banks’ capital buffers allow for large dividend payouts, supporting returns into 2011. (1) We assume CEE banks should be run with ~10% core tier 1 ratio, leaving PEO and PKO with excess capital, at 17.6% and 13.2% core tier 1 respectively. As share buybacks are not fiscally optimal, we are building in payout ratios close to 100% at PEO and 70% at PKO. (2) We think a high payout ratio will also be reflected at Komercni Banca (90%) through a mix of ordinary and special dividends, as Komercni is the most cash-generative bank in our universe (~8% dividend yield). (3) CBQ reflects this theme in MENA, at a 6.4% dividend yield. We also believe the stock looks attractive at a 35% discount to EMEA and Qatar peers, as it has been penalised for being over-capitalised, despite superior underlying ROAA (3.1% vs. EMEA average of 1.7%).
Best Positioned: Pekao SA, PKO BP, Komercni, CBQ
Exhibit 5
EMEA Banks Risk-Reward Profile
0%
32%
13%23%
11%21%
28%
0%8%
19%
0%
14% 18% 15%
2% 0%6%
-2% 1% 0% 0% 0%
-17%
0%
-100%
-50%
0%
50%
100%
OT
P
Sau
di B
B
AD
CB
Sam
ba
Isba
nk
AN
B
Firs
t G
ulf
Ban
k
Gar
anti
Ban
k
Yap
i Kre
di
Kom
ercn
i
Firs
tran
d
UN
B
Sbe
rban
k
NB
AD
Akb
ank
Sta
ndar
d B
ank
CB
Q
PK
O B
P
Al R
ajhi
Ban
k
CIB
Abs
a
Ned
bank
Pek
ao S
A
VT
B B
ank
JSC
Bear Case Base Case Bull Case Price Target% Difference Between Current Price and :
For valuation methodology and risks associated with any price targets above, please email [email protected] with a request for valuation methodology and risks on a particular stock. Source: FactSet, Morgan Stanley Research estimates
59

M O R G A N S T A N L E Y R E S E A R C H
Big Debates: 2011December 8, 2010
EEMEA Oil & Gas Is Russian Oil Tax Reform Actually Happening … And Does It Matter? Morgan Stanley & Co.
International plc+
Matthew Thomas [email protected]
Our View Market View
Yes and Yes. In contrast to the market, we perceive a promising, energized policy discussion over ways to improve the oil tax regime. We expect enough news flow by early 2011 to 1) overcome market doubt that a meaningful tax debate is actually taking place, and 2) convince the market that the overall oil tax burden will fall, even though this may require a temporary decline in Federal budget revenues from the sector. We fully accept that implementation of any improvements to the tax regime are unlikely before 1 January 2012 or even 2013. But we think that 2011 will bring the news flow and clarity to shift investor perceptions of the process and begin a rerating of Russian oil stocks.
No and No. The overwhelming market consensus is that tax “reform” is neither imminent nor more than a zero-sum rebalancing of the existing regime. The market views the mixed bag of recent Russian oil tax news flow, which indeed implies higher tax for 2011, as proof positive that the policy debate on tax reduction is barely existent and that any cuts in one area of the oil tax regime will be offset by increases in other oil tax areas. Frankly, scepticism runs deeper still; even among the handful of believers in the process, many point out that incremental savings must be reinvested to simply maintain production levels, casting another form of doubt on the share price upside potential of the entire process.
What’s in the Price?
Russian barrels offer ample scope for rerating on the back of tax reform
EV to proved and probable (2P) reserves
1.11.4 1.5 1.8 2.0 2.2 2.2 2.5
4.4
5.6 5.7
6.6 6.77.2
-
1
2
3
4
5
6
7
8
Gazpr
om
Tatne
ft
Russia
n av
g*
TNK-BP
Luko
il
Rosne
ft
Gazpr
om N
eft
Novat
ek BP
Petro
bras
**
Allianc
e Oil
RDS
Eur. M
ajors
avg
*Tot
al
EV/2P (Proved & probable reserves)
TNK-BP
Shell
Total
BP Petrobras
TatneftRosneft
GazpNeft
Lukoil
-
1
2
3
4
5
6
7
8
0 10 20 30 40
US$ OCF/boe 2010
Bubble size represents 2P Reserves
50
Source: FactSet (price data), Morgan Stanley Research *Market cap weighted average, **Petrobras 2P reserves are according to Morgan Stanley estimates .
Why the market is sceptical and why we’re optimistic. We think investors are jaded by longstanding inaction on oil taxes; the market, like the companies, regards the tax regime’s focus on revenues and production rather than profits as far from optimal and long overdue a change. Against this backdrop, we think the confusing 2010 ‘on again / off again’ debate around export duty relief for Rosneft served to harden scepticism. As we wrote in our 18 August report Tactical Roadmap, we think ‘tax fatigue’, which precludes real consideration of tax developments, is gripping the market. The default analysis is to reject positive data points and embrace negative ones. For example, we think that investors assume (incorrectly, in our view) that the Russian Finance Ministry has no interest in easing the overall oil tax burden.
Yet, the Finance Ministry has granted ad hoc tax relief for two years now, as stop-gap fixes to boost oil production. The market also ignores encouraging comments from the Energy Ministry about proposed reductions in key taxes and the overall tax take, and dismisses the characterization of the current debate as “constructive” by Rosneft. Even recent comments from Prime Minister Putin (Interfax, 29 Oct) suggesting that: 1) average sector upstream spending should rise 50% over the next decade just to maintain flat production; and 2) that he would like to see a tax plan agreed by end 1H11, have done little to change market sentiment.
60
M O R G A N S T A N L E Y R E S E A R C H
Big Debates: 2011December 8, 2010
Potential Catalysts
By 1Q11
All proposals for new tax regime submitted
By end 2Q11
Legislative package prepared
By end 2011
Passage of new legislative package by Duma
January 1, 2012 or 2013
Full implementation
Expected Contours of Oil Tax Changes
Reduction in overall burden, shift in focus. The current tax
regime is harder on crude producers (upstream) than refiners
(downstream) and rests on production and revenues rather
than profits. These features undermine and distort investment
in both segments, a point we think policymakers increasingly
recognize: A tax reform debate has begun that we think will
lead to improvements in overall oil tax regime that both spur
new investment and improve returns, and – of particular
importance – ensure the stability of Russian crude production.
Crude export duty reductions are key. The oil tax regime is
basically ‘dominated’ by export duties, particularly on crude oil.
We anticipate a material reduction in the marginal crude export
duty – possibly from 65% to 55% – which at the current oil
price would generate an additional $5.5 per bbl, or roughly
$10bn in incremental tax cash flows. The marginal tax take on
crude would also drop to 82% from 90%.
Refined product export duties likely to rise. In contrast, the
marginal tax take for a pure refiner currently stands at just
41%, a function of far lower export duties than on crude. We
expect product duties to rise relative to crude duties, migrating
sector value back ‘upstream’, where risks are greater and thus
deserving of greater rewards. We remind that Russia is ‘long’
crude, suggesting that downstream tax increases will still leave
a net gain from lower crude duties for the sector as a whole
Production tax (MET). We expect this tax, the second and
only other significant oil tax, to rise. However, we also expect
more exceptions and exemptions, as it becomes a more widely
used policy instrument by the Government.
Profit taxes on Greenfields. We expect changes on taxes for
new fields to be among the most far reaching, with the
production tax entirely replaced by an excess profits tax –
sharply reducing the risk of taking on large, long-lead time oil
development projects in Russia.
Broad contours of tax policy revisions are clear and positive, in our view. Crude export duties are likely to fall, refined product export duties are likely to rise. The production tax – aka MET – remains contentious: it will rise, we think, but with potentially major mitigating factors. But net net, we believe that the overall tax take will be lower.
Government target IRR of 16% is above market expectations of 10-12%. We also point out that the ‘reference return’ in the tax debate is, according to our understanding from multiple industry conversations, around 16%. This is the return that the Government, including the Finance Ministry, seems to regard as reasonable for greenfield and brownfield projects alike. This contrasts with current Russian oil sector valuations that imply, in our judgement, an upstream IRR of only 10-12%. Hence, even if savings from tax relief are ploughed back into fields to simply maintain overall production levels, tax reform should ‘de-risk’ the future, giving the market the confidence to price in higher long-term returns.
An average of 17% could be returned at the net income level in 2012/13 alone, we estimate. In sum, we think that during 2011 investors will come to accept that oil tax reform is real, meaningful, and worth pricing into stocks ahead of its full implementation. Considering government proposals indicated so far, we estimate that approximately $2.28/bbl or c.17% could be returned to 2012/2013 consensus net income alone. All of this should matter in 2011, because it is then that we expect to know the debate outcomes.
Order of preference for oil tax reform exposure in our coverage universe. Our analysis of the potential uplift to consensus earnings from the proposed oil tax reforms suggests the following ranking of beneficiaries.
1. Rosneft: Up to 24% uplift to consensus earnings (2012/2013) from brownfields alone, on our analysis, in addition to preferred access to strategic resources, implying considerable greenfield tax benefits.
2. Surgutneftegaz: Up to 24% uplift to consensus earnings; plus huge cash stock pile may mean increased greenfield investments.
3. Gazprom Neft: Up to 20% uplift to consensus earnings.
4. Lukoil: Up to 17% uplift to consensus earnings.
5. Alliance Oil: Up to 4% uplift to consensus earnings.
61

M O R G A N S T A N L E Y R E S E A R C H
Big Debates: 2011December 8, 2010
Turkey – Tekfen Holding A.S Tekfen Holding AS: Contract Awards to Pick Up Materially
Morgan Stanley & Co.
International plc+
Sayra Can Altuntas, CFA [email protected]
Erol Danis, CFA [email protected]
Batuhan Karabekir
Our View Market View
Tekfen’s contract awards should pick up materially in 2011, while fertilizer business is buoyant. Our house oil price forecasts (an average of $100/bbl in 2011) point to a material improvement in Tekfen’s fertilizer and contracting business, which has a backlog concentrated in oil-rich regions. A pick-up in energy investments in Turkey (Tupras’ residuum project and Petkim refinery) adds support to the contracting business in 2011.
Following the slow pace of project awards in 2010, the market appears unwilling to price in a material improvement in 2011. In addition, concern over the pace of recovery in Middle Eastern economies, and the intensity of competition, especially from South Korean contractors, have made investors less enthusiastic about contracting prospects.
Tekfen offers good risk-reward, but contracting wins are key to reaching our price target
TL7.20 (+16%)TL 6.22
TL3.90 (-37%)
TL8.60 (+38%)
0
1
2
3
4
5
6
7
8
9
10
Dec-08 Jun-09 Dec-09 Jun-10 Dec-10 Jun-11 Dec-11
TL
Price Target (Dec-11) Historical Stock Performance Current Stock Price
Risk-Reward Scenarios – Overweight , PT TL7.2
TL3.9 Bear Case
$625 mn/yr new backlog,
7% fertilizer business
margin 2011 onwards
TL7.2 Base Case
$1.25 bn/yr new backlog,
9.5% fertilizer business
margin 2011 onwards
TL8.6 Bull Case
$1.5 bn/yr new backlog,
14% fertilizer business
margin 2011 onwards
$6.25 billion new backlog over the next 10 years. Contracting EBITDA margin falls to ~8% over the long term. Fertilizer business margin is 8% in 2010 and 7% from 2011 onwards. We apply the same valuation multiples used in our base case.
$12 billion new backlog over the next 10 years. New projects drive contracting EBITDA margin to ~12% in 2011 (low end of management’s long-term guidance). Fertilizer business market share remains at 34% in 2011 and beyond, with margins normalising at 9.5% in 2011 and beyond. We value the contracting business on 7.0x 11e EV/EBITDA and the fertilizer business on 6.0x 11e EV/EBITDA.
Tekfen adds another $2.5 bn in new projects over the next 10 years on top of our base case estimate. LT EBITDA margin reaches 14% (the high end of the management guidance) in 2014 due to a higher proportion of cost-plus projects in the backlog. Fertilizer margins recover to 14% in 2010 and 2011 and remain at normalized levels long term. We apply the same valuation multiples used in our base case.
Source: FactSet (historical share price data), Morgan Stanley Research estimates
62

M O R G A N S T A N L E Y R E S E A R C H
Big Debates: 2011December 8, 2010
Our house view on oil prices suggests a material improvement in Tekfen’s contracting and fertilizer businesses (oil price of $100/bbl in 2011). Tekfen shares are highly correlated with the oil price, given the positive correlation with fertilizer prices and the concentration of the company’s contracting business in geographies that benefit from a strong oil price.
Tekfen has been awarded $920mn of projects in 2010, in line with our $0.9bn forecast. Projects are in Azerbaijan (manufacturing and erecting a sea platform; and construction of SOCAR’s new management building) and Morocco (construction and installation of the topping unit of the Samir Refinery; and construction of a phosphate mud pipeline work). With the signing of the Morocco contract ($460mn, phosphate mud pipeline), likely in December, Tekfen’s backlog will rise to $1.8bn.
We expect $1.25bn of additional backlog in 2011. New projects are more likely to come from North Africa and the Caspian region. Saudi Arabia also provides sizeable opportunities, despite the competitive environment, with recently approved plans to invest $385bn in infrastructure in the next five years, a substantial uplift over previous plans.
More important, perhaps, are the emerging opportunities for Tekfen in the domestic market. Turkey makes up 3% of Tekfen’s backlog, but management aims to increase this to 25% over the next few years. The pick-up in energy investments in Turkey with Tupras’ upcoming Residuum Investment, refinery construction in Ceyhan and numerous electricity generation projects in the pipeline, should provide opportunities for the company.
Tupras award likely in the next few months. Technicas Reunidas, a company Tekfen has worked with before, was chosen as the prime contractor earlier this year for Tupras’ Residuum upgrade project (total of $1.8-2.0bn). We expect the project portion that would be of interest to Tekfen to be worth around $400mn.
Petkim refinery could be a sizeable project, and SOCAR involvement is a positive. In June, the Energy Market Regulatory Authority (EMRA) granted SOCAR and Turcas Enerji, Petkim’s parent company, a 49-year licence to build a refinery in Petkim’s Aliaga plant. The refinery is expected to have capacity of 10 million tonnes/year and take five years to build at a cost of $4-5bn. We estimate the size of the construction portion to be worth ~$500mn.
2011 should be a good year for the Agribusiness, with a strong global outlook for phosphates. Tekfen’s agri business EBITDA margin jumped to 15.3% in 9M10 from
4.9% in 2009, as fertilizer prices have recovered. The outlook is positive for 2011 and beyond, driven by higher grain prices, high Chinese tariffs in force for longer, and greater domestic consumption of fertilizer in Russia, China and Ukraine.
Exhibit 1
Backlog concentrated in oil-rich regions
Middle East47%
Bulgaria1%
Turkey3%
Caspian Region
36%
North Africa13%
Source: Company data [(DATE)], Morgan Stanley Research
Exhibit 2
Oil price outlook is supportive (WTI $/bbl) 2010 2011 2012
Morgan Stanley 95 100 105
Forward Curve 79 85 87Source: FactSet, Morgan Stanley Research estimates- 2010 numbers are year end
Exhibit 3
Tekfen: Sum-of-parts valuation
TekfenStake
Valuation Metric
Target NAV
(TL mn)
Target NAV of stake(TL mn)
% of NAV
Tekfen Construction 100%7.0 2011e
EV/EBITDA 1,059 1,059 40%
Contracting Total 1,059 1,059 40%
Toros Agricultural Trade 100%6.0 2011e
EV/EBITDA 651 651 24%
Toros Marine Terminal 100%6.5 2011e
EV/EBITDA 205 205 8%
Agri-Industry Total 856 856 32%
Akmerkez REIT 10.8% Market Cap. 726 78 3%
Tekfen Tower 100%25 discount to
appraisal value 190 190 7%
Akmerkez Offices 100%25 discount to
appraisal value 18 18 1%
Zeytinburnu Project 100%25 discount to
appraisal value 12 12 0%
Izmir Sek Plant 100%25 discount to
appraisal value 27 27 1%
Real Estate Total 973 326 12%
Eurobank Tekfen 29%transaction
value + cash inj. 540 157 6%
Finance Total 540 157 6%
Total subsidiaries 3,428 2,398 90%
2009 net cash position (holding only) 274 10%
Total NAV (TL mn) 2,672
Tekfen Holding market cap (TL mn) 2,146
Discount to NAV (%) -20
Share price (TL) 6.22
Target NAV per share (TL) 7.20
Implied Upside (%) 16
Source: Morgan Stanley Research estimates
63

M O R G A N S T A N L E Y R E S E A R C H
Big Debates: 2011 December 8, 2010
Valuation Methodology and Risks
Stock Valuation Methodology Risks
EADS Our sum-of-the-parts DCF analysis (which assumes a 0.5-1.5% long-term growth rate and an 8.9% WACC) is cross-checked by a long-term P/FCF valuation analysis.
The key risks are that Airbus could fail to execute on its major programs; the commercial aircraft market could weaken resulting in order cancellations; the USD could weaken; and defence profits could stagnate due to budget cuts. The key upside risks are a successful first flight of A350 and a further strengthening of the USD.
Fiat We value Fiat using a 2011e SOP valuation, arriving at a €7/sh value for Industrial (equivalent to 67% EV/Sales, and at €10/sh for Auto (equivalent to 29% EV/Sales). The latter includes €3.6/sh for Chrysler, based on peer group 1-yr forward multiples. Our target price is equivalent to 14x ‘11e and 9.4x ‘12e PE (historical average – 12.3x).
Risks include: a slower than expected US market recovery, which could lower our expectations and value for Chrysler; more intense price pressure in either Europe or Brazil, which could undermine Fiat auto profitability; and capex could yet surprise negatively and undermine net debt projections.
Carlsberg Our price target is based on a target multiple of 15.5x P/E FY11e, which is a slight premium to the 10-year average to reflect robust earnings growth. This would narrow the discount to ABI and SABMiller. Previously, we had argued that the stock should trade at a discount to longer term, DCF-based intrinsic value but we now argue that, at least in the short run, Carlsberg should trade closer to its peers due to the stronger growth profile. We have repeatedly raised our estimates for Carlsberg this year and our new DCF value is DKr 700.
The main upside and downside risk to our valuation is volume and sales growth in Eastern Europe, particularly Russia. We see upside risk from higher margins in Northern and Western Europe and a pick-up in consumer demand in Eastern Europe, as well as in Western Europe.
HomeServe We reach our price target by applying a 15% weighting to the bull case, 75% weighting to the base case, and 10% weighting to the bull case. For our base case valuation we apply 16x PE to 2014 EPS forecast of 34.5p and discount back at a 7.4% cost of equity. This results in a valuation of 465p per share or 18.9x PE (FY11), implying 1.58x PEG. HomeServe has a low level of financial leverage, with just 0.2x net debt to EBITDA expected by March 2011. As such, its valuation does look relatively more attractive on an EV to EBITA basis. We value 2014 EBITA on 10x EV to EBITA, and again discount back which gives a valuation of 454p per share.
The key risks, as explored in our risk-reward scenarios, are the success of growth strategies in the US and UK and development of market share in the face of competition.
ABB Our price target is based on the average of assumed SOTP multiples (SFr23.3 implies FY11 EV/EBIT of ~10.9x) and a DCF method (SFr28.2 at 7.6% WACC, 2% perpetual growth).
The key risks are (i) new orders may not emerge until late 2010 or early 2011 in the T&D sector (ii) pricing on future orders in Power could see lower margins than in the current backlog (iii) Asian competition may gain long-term traction (at discounted prices) outside traditional core markets. Key upside risks include a snap-back in Automation and T&D demand as well as cost savings being able to support margins at current levels.
EDPR DCF-based valuation of operating assets and pipeline investments (WACC 7.3%, terminal growth 0%).
Key risks include the trajectory of long-term power prices in Spain and across other regions, and the pace of new capacity additions.
Danone Our price target of €52 is based on our intrinsic value model and essentially values the future returns we expect Danone to make in excess of its cost of equity (8.0%), adding the discounted sum of these returns to the beginning shareholders’ equity base to arrive at the market value of the company’s equity. We model the company’s financials in detail over a five-year explicit forecast period, then transition to an intermediate period driven by an assumption of 5% medium-term sales growth. Our price target implies a re-rating of Danone to 16x forward earnings implying a premium to its Food peers, in line with the long-term average.
Potential downside (or upside) risk to our price target could come primarily from (i) the sustainable success of Danone’s efforts to re-accelerate volume growth in the Dairy division – should the price adjustments and stepped up brand support not result in sustained volume growth in the coming quarters, this would impact both top-line growth and margin development negatively; (ii) a significant slowdown (or acceleration) in growth in emerging markets; and (iii) competitive pressure from branded and private label players in Danone's core markets.
Aegon Our €7.5 target price is a 20:60:20 weighted average of bear, base and bull case valuations. In our base case of €8.1 per share (0.67x 2011e EV), we value the life business at 0.88x life EV, consistent with an 8.9% estimated sustainable ROEV and assuming a 1.7% new business margin. We value asset management at 12x 2011e earnings, in line with multiples we apply to asset management businesses of other stocks in the sector. We value other profits at 10x P/E, assuming government capital dilution and value all surplus capital or debt at face value.
Volatility in asset markets can have a significant impact on embedded value and earnings, as demonstrated in our bear case valuation. Uncertainty in margins in the life business, which can be affected by competitive pressure on guarantees and product pricing, market volatility resulting in raising the cost of hedging guarantees and the negative impact of operational leverage in falling markets. A rise in credit default experience above our forecasts could have a significant detrimental impact on earnings and valuation.
64

M O R G A N S T A N L E Y R E S E A R C H
Big Debates: 2011 December 8, 2010
Stock Valuation Methodology Risks
Sky Deutschland Our price target sits half way between our base and bull case and reflects our belief that renewed progress in subscriber additions and ARPU on the back of receiver price reductions, the roll out of PVRs and the continued success of the HD offering, will mean that investors focus on the more upbeat assessments of likely progress by SkyD in the next two years. Our base case DCF assumes a WACC of 9.5% and long-term growth of 1.5%.
Risks: (i) Poor record of Premiere/SkyD; (ii) Litigation risk on historical numbers; (iii) EBITDA losses in 2010-12 (iv) volatile model; (v) OTT and changing TV consumption.
Kazakhmys We set our price target of 1,777p at our base case DCF valuation using a WACC of 11.33% and LT growth rate of 2%.
Key risks include long term commodity prices, the fate of the ENRC stake and political risk in Kazakhstan.
Saipem We set our price target for Saipem at €41, which is based on a target 2012e P/E of 16.5. This is broadly in line with Saipem’s 10-year average P/E as we expect a similar potential for earnings growth over 2010-13 as the company delivered in the past.
Key risks: 1) Decline in oil prices and oil demand, which may impact oil company capex; 2) Weakening US$; 3) Delays to contract awards, 4) Cost overruns on key projects.
Nokia We use 2011 multiples and assign a lower 10% weighting to the bear case vs. 20% to the bull case as initial positive feedback regarding N8 and potential strategic changes have lowered the probability of the bear case. Our base case assumes a market average P/E of 12x.
Risks: 1) Disappointing N8 user experience could result in further market share losses. 2) MeeGo delays could bring back long-term competitiveness issues in the high end. 3)Tough macro environment hampers smartphone spending.
KPN Our DCF-based sum of the parts gives us an intrinsic value of €15 per share. For the group’s operations in Germany and the Netherlands, we use a WACC of 8.5-8.7% and terminal growth of 1%. We value BASE using a multiple of 6x 2010 EBITDA, which we consider reasonable and in line with our valuations for other comparable players in the market.
The main risks to our valuation come from a tougher competitive environment, from cable operators in the Netherlands, in particular, and in Germany, where Eplus is following a growth strategy, which might have negative implications for margins. We expect any potential acquisitions to be small and selective, and KPN has always followed strict investment criteria, but potential overpayment represents is possible risk to the valuation.
Imperial Tobacco We calculate our price target based on the long-term average P/E multiple of 11.5x (calendarised) 2011e. We argue this multiple is appropriate given, in aggregate, the opportunities and risks it faces now are comparable with the past 10 years, pricing is better, but volumes are weaker, litigation risk is less but other regulatory risks are higher.
The key stock-specific risks to our price target for IMT are (i) deterioration of volume trends in core markets, (ii) increased competition pressuring pricing and margins.
AP Moller Maersk We set our price target using a sum-of-parts approach. We value the Container Shipping operation based on its cash-generating power over the cycle rather than 2010 and 2011 earnings. Its value is the average of: (1) second-hand value of the ships, (2) mid-cycle earnings, (3) trough earnings, (4 and 5) future and historical peak earnings and (6) book value of the tangible fixed assets.
The key risks to our price target are the trajectory of oil prices and container rates, as well as container volumes.
Tekfen We use a sum-of-the-parts approach to calculate a target NAV. For the contracting business, we use a 2011e EV/EBITDA multiple of 7.0 (~15% discount to peers to account for lower growth prospects compared with emerging market peers. In Fertilisers, we use a 2011e EV/EBITDA multiple of 6.0 (~25% discount to peers) to account for the lower integration of the business. For real estate, we use the appraisal values of the company’s assets. We only value completed projects. We exclude any value from the real estate business in our bear case valuation to stress test our bear case fair value.
The Tekfen share price is highly correlated with the oil price, given the sizeable role that oil-rich nations play in Tekfen’s contract backlog, and its specialisation in oil and gas construction. Fertiliser prices are correlated with oil, which further increases the company’s sensitivity. The performance of the agri-business is highly dependent on global prices and being able to pass on those prices to the consumer. Project risks can hit profitability significantly if Tekfen fails to deliver on its contractual obligations. Contracting also depends on the company’s ability to win new projects to continue to grow its backlog.
Additional prices for stocks mentioned: Kazakhmys 1511p, Carlsberg DKr567, HomeServe 463p, Danone € 46.40, Saipem € 34.20, AstraZeneca 3034p, Novartis SFr53.5, H&M SFr239, Next 2062p, M&S 385p, Inditex € 62.60,
Debenhams 75.7p, N Brown 297p, Asos 1552p, Imperial Tobacco 1900p, Gas Natural € 11.20, Iberdrola € 5.40, E.ON € 22.30, Enel € 3.70, Suez Environnement € 13.90, PGE ZL22.5, DRAX 374p, St-Gobain € 37, Lafarge € 44,
Heidelberg Cement € 45, CRH € 15, Holcim SFr68, Celesio € 19, Coloplast DKr773, Elekta SKr245, Smith & Nephew 596p.
65

M O R G A N S T A N L E Y R E S E A R C H
Big Debates: 2011December 8, 2010
THIS PAGE HAS BEEN LEFT BLANK INTENTIONALLY
66

M O R G A N S T A N L E Y R E S E A R C H
Big Debates: 2011December 8, 2010
THIS PAGE HAS BEEN LEFT BLANK INTENTIONALLY
67

M O R G A N S T A N L E Y R E S E A R C H
Big Debates: 2011December 8, 2010
THIS PAGE HAS BEEN LEFT BLANK INTENTIONALLY
68

M O R G A N S T A N L E Y R E S E A R C H
Big Debates: 2011December 8, 2010
Disclosure Section Morgan Stanley & Co. International plc, authorized and regulated by Financial Services Authority, disseminates in the UK research that it has prepared, and approves solely for the purposes of section 21 of the Financial Services and Markets Act 2000, research which has been prepared by any of its affiliates. As used in this disclosure section, Morgan Stanley includes RMB Morgan Stanley (Proprietary) Limited, Morgan Stanley & Co International plc and its affiliates.
For important disclosures, stock price charts and equity rating histories regarding companies that are the subject of this report, please see the Morgan Stanley Research Disclosure Website at www.morganstanley.com/researchdisclosures, or contact your investment representative or Morgan Stanley Research at 1585 Broadway, (Attention: Research Management), New York, NY, 10036 USA.
Analyst Certification The following analysts hereby certify that their views about the companies and their securities discussed in this report are accurately expressed and that they have not received and will not receive direct or indirect compensation in exchange for expressing specific recommendations or views in this report: Ben Britz.
Unless otherwise stated, the individuals listed on the cover page of this report are research analysts.
Global Research Conflict Management Policy Morgan Stanley Research has been published in accordance with our conflict management policy, which is available at www.morganstanley.com/institutional/research/conflictpolicies.
Important US Regulatory Disclosures on Subject Companies The following analyst or strategist (or a household member) owns securities (or related derivatives) in a company that he or she covers or recommends in Morgan Stanley Research: Markus Almerud - ABB (common or preferred stock), H&M (common or preferred stock); Andrew Humphrey - BP plc (common or preferred stock); Maxence Le Gouvello du Timat - UBS (common or preferred stock). Morgan Stanley policy prohibits research analysts, strategists and research associates from investing in securities in their sub industry as defined by the Global Industry Classification Standard ("GICS," which was developed by and is the exclusive property of MSCI and S&P). Analysts may nevertheless own such securities to the extent acquired under a prior policy or in a merger, fund distribution or other involuntary acquisition.
As of October 29, 2010, Morgan Stanley beneficially owned 1% or more of a class of common equity securities of the following companies covered in Morgan Stanley Research: ABB, Barclays Bank, BASF, Commercial International Bank, CRH, Danone, Debenhams, Drax, E.ON, Holcim, Iberdrola, Imperial Tobacco, Inditex, Komercni Banka, KPN, LG Chem, LUKOIL, Next, Nokia, Novartis, Royal Dutch Shell, Saint-Gobain, Saipem, Schneider Electric, Siemens, Societe Generale, Stora Enso Oyj, Swatch, TOTAL, UniCredit S.p.A..
Within the last 12 months, Morgan Stanley managed or co-managed a public offering (or 144A offering) of securities of Barclays Bank, Eni SpA, Firstrand, Lafarge, Novartis, Pandora A/S, Societe Generale, UniCredit S.p.A..
Within the last 12 months, Morgan Stanley has received compensation for investment banking services from ABB, AEGON, Akbank, AP Moller-Maersk, AstraZeneca, Barclays Bank, BASF, BP plc, E.ON, EADS, EDP Renovaveis, ENEL, Eni SpA, FIAT, Garanti Bank, Gas Natural, Gazprom Neft, HeidelbergCement AG, Holcim, Iberdrola, Imperial Tobacco, KPN, Lafarge, LyondellBasell Industries N.V., Marks & Spencer, Nokia, Novartis, Pandora A/S, Rosneft, Royal Dutch Shell, Schneider Electric, Siemens, Societe Generale, Stora Enso Oyj, Svenska Cellulosa AB, The Commercial Bank of Qatar (Q.S.C), The Dow Chemical Company, TOTAL, UniCredit S.p.A., UPM-Kymmene Oyj, Yapi Kredi.
In the next 3 months, Morgan Stanley expects to receive or intends to seek compensation for investment banking services from ABB, Absa, Adidas, AEGON, Akbank, Al Rajhi Bank, Alliance Oil Company, Alstom, AP Moller-Maersk, Arab National Bank, AstraZeneca, Barclays Bank, BASF, BP plc, Bulgari SpA, Carlsberg (B), Celesio AG, Coloplast A/S, Commercial International Bank, CRH, Danone, Debenhams, Drax, E.ON, EADS, EDP Renovaveis, ENEL, Eni SpA, FIAT, Firstrand, Formosa Plastics Corporation, Garanti Bank, Gas Natural, Gazprom Neft, HeidelbergCement AG, Holcim, Iberdrola, Imperial Tobacco, Inditex, Kazakhmys, KPN, Lafarge, LG Chem, LUKOIL, LVMH Moet Hennessy Louis Vuitton SA, LyondellBasell Industries N.V., Marks & Spencer, National Bank of Abu Dhabi, Nedbank, Next, Nokia, Novartis, Pandora A/S, PGE Polska Grupa Energetyczna S.A., PKO BP, PPR, Reliance Industries, Riyad Bank, Rosneft, Royal Dutch Shell, SABIC, Saint-Gobain, Saipem, Saudi British Bank, Sberbank, Schneider Electric, Siemens, Sky Deutschland AG, Smith & Nephew, Societe Generale, Standard Bank, Stora Enso Oyj, Suez Environnement, Surgutneftegaz, Svenska Cellulosa AB, Tekfen Holding, The Commercial Bank of Qatar (Q.S.C), The Dow Chemical Company, TOTAL, UniCredit S.p.A., Union National Bank, UPM-Kymmene Oyj, VTB Bank JSC, Yapi Kredi.
69

M O R G A N S T A N L E Y R E S E A R C H
Big Debates: 2011December 8, 2010
Within the last 12 months, Morgan Stanley has received compensation for products and services other than investment banking services from AEGON, Akbank, AP Moller-Maersk, Arab National Bank, AstraZeneca, Barclays Bank, BASF, BP plc, Commercial International Bank, E.ON, EADS, ENEL, Eni SpA, FIAT, Firstrand, Formosa Plastics Corporation, Garanti Bank, Gas Natural, Iberdrola, Imperial Tobacco, Inditex, Komercni Banka, Lafarge, LG Chem, LUKOIL, LyondellBasell Industries N.V., Marks & Spencer, National Bank of Abu Dhabi, Nedbank, Novartis, Pekao SA, Reliance Industries, Riyad Bank, Royal Dutch Shell, Saudi British Bank, Sberbank, Siemens, Societe Generale, Standard Bank, The Commercial Bank of Qatar (Q.S.C), The Dow Chemical Company, TOTAL, UBS, UniCredit S.p.A., Union National Bank, VTB Bank JSC, Yapi Kredi.
Within the last 12 months, Morgan Stanley has provided or is providing investment banking services to, or has an investment banking client relationship with, the following company: ABB, Absa, Adidas, AEGON, Akbank, Al Rajhi Bank, Alliance Oil Company, Alstom, AP Moller-Maersk, Arab National Bank, AstraZeneca, Barclays Bank, BASF, BP plc, Bulgari SpA, Carlsberg (B), Celesio AG, Coloplast A/S, Commercial International Bank, CRH, Danone, Debenhams, Drax, E.ON, EADS, EDP Renovaveis, ENEL, Eni SpA, FIAT, Firstrand, Formosa Plastics Corporation, Garanti Bank, Gas Natural, Gazprom Neft, HeidelbergCement AG, Holcim, Iberdrola, Imperial Tobacco, Inditex, Kazakhmys, KPN, Lafarge, LG Chem, LUKOIL, LVMH Moet Hennessy Louis Vuitton SA, LyondellBasell Industries N.V., Marks & Spencer, National Bank of Abu Dhabi, Nedbank, Next, Nokia, Novartis, Pandora A/S, PGE Polska Grupa Energetyczna S.A., PKO BP, PPR, Reliance Industries, Riyad Bank, Rosneft, Royal Dutch Shell, SABIC, Saint-Gobain, Saipem, Saudi British Bank, Sberbank, Schneider Electric, Siemens, Sky Deutschland AG, Smith & Nephew, Societe Generale, Standard Bank, Stora Enso Oyj, Suez Environnement, Surgutneftegaz, Svenska Cellulosa AB, Tekfen Holding, The Commercial Bank of Qatar (Q.S.C), The Dow Chemical Company, TOTAL, UniCredit S.p.A., Union National Bank, UPM-Kymmene Oyj, VTB Bank JSC, Yapi Kredi.
Within the last 12 months, Morgan Stanley has either provided or is providing non-investment banking, securities-related services to and/or in the past has entered into an agreement to provide services or has a client relationship with the following company: ABB, Adidas, AEGON, Akbank, AP Moller-Maersk, Arab National Bank, AstraZeneca, Barclays Bank, BASF, BP plc, Commercial International Bank, CRH, Debenhams, E.ON, EADS, ENEL, Eni SpA, FIAT, Firstrand, Formosa Plastics Corporation, Garanti Bank, Gas Natural, HeidelbergCement AG, Iberdrola, Imperial Tobacco, Inditex, Komercni Banka, Lafarge, LG Chem, LUKOIL, LyondellBasell Industries N.V., Marks & Spencer, National Bank of Abu Dhabi, Nedbank, Novartis, Pekao SA, PKO BP, Reliance Industries, Riyad Bank, Rosneft, Royal Dutch Shell, SABIC, Saint-Gobain, Saudi British Bank, Sberbank, Siemens, Smith & Nephew, Societe Generale, Standard Bank, Stora Enso Oyj, The Commercial Bank of Qatar (Q.S.C), The Dow Chemical Company, TOTAL, UBS, UniCredit S.p.A., Union National Bank, UPM-Kymmene Oyj, VTB Bank JSC, Yapi Kredi.
Morgan Stanley & Co. Incorporated makes a market in the securities of LyondellBasell Industries N.V., The Dow Chemical Company.
Morgan Stanley & Co. International plc is a corporate broker to AstraZeneca, Imperial Tobacco, Marks & Spencer, Whitbread.
The equity research analysts or strategists principally responsible for the preparation of Morgan Stanley Research have received compensation based upon various factors, including quality of research, investor client feedback, stock picking, competitive factors, firm revenues and overall investment banking revenues.
Morgan Stanley and its affiliates do business that relates to companies/instruments covered in Morgan Stanley Research, including market making, providing liquidity and specialized trading, risk arbitrage and other proprietary trading, fund management, commercial banking, extension of credit, investment services and investment banking. Morgan Stanley sells to and buys from customers the securities/instruments of companies covered in Morgan Stanley Research on a principal basis. Morgan Stanley may have a position in the debt of the Company or instruments discussed in this report.
Certain disclosures listed above are also for compliance with applicable regulations in non-US jurisdictions.
STOCK RATINGS Morgan Stanley uses a relative rating system using terms such as Overweight, Equal-weight, Not-Rated or Underweight (see definitions below). Morgan Stanley does not assign ratings of Buy, Hold or Sell to the stocks we cover. Overweight, Equal-weight, Not-Rated and Underweight are not the equivalent of buy, hold and sell. Investors should carefully read the definitions of all ratings used in Morgan Stanley Research. In addition, since Morgan Stanley Research contains more complete information concerning the analyst's views, investors should carefully read Morgan Stanley Research, in its entirety, and not infer the contents from the rating alone. In any case, ratings (or research) should not be used or relied upon as investment advice. An investor's decision to buy or sell a stock should depend on individual circumstances (such as the investor's existing holdings) and other considerations.
Global Stock Ratings Distribution (as of November 30, 2010)
70

M O R G A N S T A N L E Y R E S E A R C H
Big Debates: 2011December 8, 2010
For disclosure purposes only (in accordance with NASD and NYSE requirements), we include the category headings of Buy, Hold, and Sell alongside our ratings of Overweight, Equal-weight, Not-Rated and Underweight. Morgan Stanley does not assign ratings of Buy, Hold or Sell to the stocks we cover. Overweight, Equal-weight, Not-Rated and Underweight are not the equivalent of buy, hold, and sell but represent recommended relative weightings (see definitions below). To satisfy regulatory requirements, we correspond Overweight, our most positive stock rating, with a buy recommendation; we correspond Equal-weight and Not-Rated to hold and Underweight to sell recommendations, respectively.
Coverage Universe Investment Banking Clients (IBC)
Stock Rating Category Count
% of
Total Count
% of
Total IBC
% of Rating
Category
Overweight/Buy 1121 40% 417 44% 37%Equal-weight/Hold 1175 42% 410 43% 35%Not-Rated/Hold 119 4% 26 3% 22%Underweight/Sell 392 14% 105 11% 27%Total 2,807 958
Data include common stock and ADRs currently assigned ratings. An investor's decision to buy or sell a stock should depend on individual circumstances (such as the investor's existing holdings) and other considerations. Investment Banking Clients are companies from whom Morgan Stanley received investment banking compensation in the last 12 months.
Analyst Stock Ratings Overweight (O). The stock's total return is expected to exceed the average total return of the analyst's industry (or industry team's) coverage universe, on a risk-adjusted basis, over the next 12-18 months.
Equal-weight (E). The stock's total return is expected to be in line with the average total return of the analyst's industry (or industry team's) coverage universe, on a risk-adjusted basis, over the next 12-18 months.
Not-Rated (NR). Currently the analyst does not have adequate conviction about the stock's total return relative to the average total return of the analyst's industry (or industry team's) coverage universe, on a risk-adjusted basis, over the next 12-18 months.
Underweight (U). The stock's total return is expected to be below the average total return of the analyst's industry (or industry team's) coverage universe, on a risk-adjusted basis, over the next 12-18 months.
Unless otherwise specified, the time frame for price targets included in Morgan Stanley Research is 12 to 18 months.
Analyst Industry Views Attractive (A): The analyst expects the performance of his or her industry coverage universe over the next 12-18 months to be attractive vs. the relevant broad market benchmark, as indicated below.
In-Line (I): The analyst expects the performance of his or her industry coverage universe over the next 12-18 months to be in line with the relevant broad market benchmark, as indicated below.
Cautious (C): The analyst views the performance of his or her industry coverage universe over the next 12-18 months with caution vs. the relevant broad market benchmark, as indicated below.
Benchmarks for each region are as follows: North America - S&P 500; Latin America - relevant MSCI country index or MSCI Latin America Index; Europe - MSCI Europe; Japan - TOPIX; Asia - relevant MSCI country index. .
Important Disclosures for Morgan Stanley Smith Barney LLC Customers Citi Investment Research & Analysis (CIRA) research reports may be available about the companies or topics that are the subject of Morgan Stanley Research. Ask your Financial Advisor or use Research Center to view any available CIRA research reports in addition to Morgan Stanley research reports.
Important disclosures regarding the relationship between the companies that are the subject of Morgan Stanley Research and Morgan Stanley Smith Barney LLC, Morgan Stanley and Citigroup Global Markets Inc. or any of their affiliates, are available on the Morgan Stanley Smith Barney disclosure website at www.morganstanleysmithbarney.com/researchdisclosures.
For Morgan Stanley and Citigroup Global Markets, Inc. specific disclosures, you may refer to www.morganstanley.com/researchdisclosures and https://www.citigroupgeo.com/geopublic/Disclosures/index_a.html.
Each Morgan Stanley Equity Research report is reviewed and approved on behalf of Morgan Stanley Smith Barney LLC. This review and approval is conducted by the same person who reviews the Equity Research report on behalf of Morgan Stanley. This could create a conflict of interest.
71

M O R G A N S T A N L E Y R E S E A R C H
Big Debates: 2011December 8, 2010
Other Important Disclosures Morgan Stanley & Co. International PLC and its affiliates have a significant financial interest in the debt securities of ABB, Adidas, AEGON, Akbank, Alstom, AstraZeneca, BASF, BP plc, Bulgari SpA, Carlsberg (B), Celesio AG, Danone, EADS, ENEL, Eni SpA, FIAT, Garanti Bank, Gas Natural, HeidelbergCement AG, Holcim, Iberdrola, Imperial Tobacco, KPN, Lafarge, LUKOIL, LVMH Moet Hennessy Louis Vuitton SA, Marks & Spencer, National Bank of Abu Dhabi, Next, Nokia, Novartis, PPR, PTT Chemical Public Company, Reliance Industries, Riyad Bank, Rosneft, Royal Dutch Shell, SABIC, Saint-Gobain, Sberbank, Schneider Electric, Siemens, Societe Generale, Stora Enso Oyj, Suez Environnement, Svenska Cellulosa AB, The Commercial Bank of Qatar (Q.S.C), The Dow Chemical Company, TOTAL, UBS, UniCredit S.p.A., Union National Bank, UPM-Kymmene Oyj, VTB Bank JSC.
Morgan Stanley produces an equity research product called a "Tactical Idea." Views contained in a "Tactical Idea" on a particular stock may be contrary to the recommendations or views expressed in research on the same stock. This may be the result of differing time horizons, methodologies, market events, or other factors. For all research available on a particular stock, please contact your sales representative or go to Client Link at www.morganstanley.com.
Morgan Stanley Research does not provide individually tailored investment advice. Morgan Stanley Research has been prepared without regard to the individual financial circumstances and objectives of persons who receive it. Morgan Stanley recommends that investors independently evaluate particular investments and strategies, and encourages investors to seek the advice of a financial adviser. The appropriateness of a particular investment or strategy will depend on an investor's individual circumstances and objectives. The securities, instruments, or strategies discussed in Morgan Stanley Research may not be suitable for all investors, and certain investors may not be eligible to purchase or participate in some or all of them.
The fixed income research analysts or strategists principally responsible for the preparation of Morgan Stanley Research have received compensation based upon various factors, including quality, accuracy and value of research, firm profitability or revenues (which include fixed income trading and capital markets profitability or revenues), client feedback and competitive factors. Fixed Income Research analysts' or strategists' compensation is not linked to investment banking or capital markets transactions performed by Morgan Stanley or the profitability or revenues of particular trading desks.
Morgan Stanley Research is not an offer to buy or sell or the solicitation of an offer to buy or sell any security/instrument or to participate in any particular trading strategy. The "Important US Regulatory Disclosures on Subject Companies" section in Morgan Stanley Research lists all companies mentioned where Morgan Stanley owns 1% or more of a class of common equity securities of the companies. For all other companies mentioned in Morgan Stanley Research, Morgan Stanley may have an investment of less than 1% in securities/instruments or derivatives of securities/instruments of companies and may trade them in ways different from those discussed in Morgan Stanley Research. Employees of Morgan Stanley not involved in the preparation of Morgan Stanley Research may have investments in securities/instruments or derivatives of securities/instruments of companies mentioned and may trade them in ways different from those discussed in Morgan Stanley Research. Derivatives may be issued by Morgan Stanley or associated persons.
With the exception of information regarding Morgan Stanley, Morgan Stanley Research is based on public information. Morgan Stanley makes every effort to use reliable, comprehensive information, but we make no representation that it is accurate or complete. We have no obligation to tell you when opinions or information in Morgan Stanley Research change apart from when we intend to discontinue equity research coverage of a subject company. Facts and views presented in Morgan Stanley Research have not been reviewed by, and may not reflect information known to, professionals in other Morgan Stanley business areas, including investment banking personnel.
Morgan Stanley Research personnel may participate in company events such as site visits and are generally prohibited from accepting payment by the company of associated expenses unless pre-approved by authorized members of Research management.
The value of and income from your investments may vary because of changes in interest rates, foreign exchange rates, default rates, prepayment rates, securities/instruments prices, market indexes, operational or financial conditions of companies or other factors. There may be time limitations on the exercise of options or other rights in securities/instruments transactions. Past performance is not necessarily a guide to future performance. Estimates of future performance are based on assumptions that may not be realized. If provided, and unless otherwise stated, the closing price on the cover page is that of the primary exchange for the subject company's securities/instruments.
Morgan Stanley may make investment decisions or take proprietary positions that are inconsistent with the recommendations or views in this report.
To our readers in Taiwan: Information on securities/instruments that trade in Taiwan is distributed by Morgan Stanley Taiwan Limited ("MSTL"). Such information is for your reference only. Information on any securities/instruments issued by a company owned by the government of or incorporated in the PRC and listed in on the Stock Exchange of Hong Kong ("SEHK"), namely the H-shares, including the component company stocks of the Stock Exchange of Hong Kong ("SEHK")'s Hang Seng China Enterprise Index; or any securities/instruments issued by a company that is 30% or more directly- or indirectly-owned by the government of or a company incorporated in the PRC and traded on an exchange in Hong Kong or Macau, namely SEHK's Red Chip shares, including the component company of the SEHK's China-affiliated Corp Index is distributed only to Taiwan Securities Investment Trust Enterprises ("SITE"). The reader should independently evaluate the investment risks and is solely responsible for their investment decisions. Morgan Stanley Research may not be distributed to the public media or quoted or used by the public media without the express written consent of Morgan Stanley. Information on securities/instruments that do not trade in Taiwan is for informational purposes only and is not to be construed as a recommendation or a solicitation to trade in such securities/instruments. MSTL may not execute transactions for clients in these securities/instruments.
To our readers in Hong Kong: Information is distributed in Hong Kong by and on behalf of, and is attributable to, Morgan Stanley Asia Limited as part of its regulated activities in Hong Kong. If you have any queries concerning Morgan Stanley Research, please contact our Hong Kong sales representatives.
Morgan Stanley Research is disseminated in Japan by Morgan Stanley MUFG Securities Co., Ltd.; in Hong Kong by Morgan Stanley Asia Limited (which accepts responsibility for its contents); in Singapore by Morgan Stanley Asia (Singapore) Pte. (Registration number 199206298Z) and/or Morgan Stanley Asia (Singapore) Securities Pte Ltd (Registration number 200008434H), regulated by the Monetary Authority of Singapore, which accepts responsibility for its contents; in Australia to "wholesale clients" within the meaning of the Australian Corporations Act by Morgan Stanley Australia Limited A.B.N. 67 003 734 576, holder of Australian financial services license No. 233742, which accepts responsibility for its contents; in Australia to "wholesale clients" and "retail clients" within the meaning of the Australian Corporations Act by Morgan Stanley Smith Barney Australia Pty Ltd (A.B.N. 19 009 145 555, holder of Australian financial services license No. 240813, which accepts responsibility for its contents; in Korea by Morgan Stanley & Co International plc, Seoul Branch; in India by Morgan Stanley India Company Private Limited; in Canada by Morgan Stanley Canada Limited, which has approved of, and has agreed to take responsibility for, the contents of Morgan Stanley Research in Canada; in Germany by Morgan Stanley Bank AG, Frankfurt am Main and Morgan Stanley Private Wealth Management Limited, Niederlassung Deutschland, regulated by Bundesanstalt fuer Finanzdienstleistungsaufsicht (BaFin); in Spain by Morgan Stanley, S.V., S.A., a Morgan Stanley group company, which is supervised by the Spanish Securities Markets Commission (CNMV) and states that Morgan Stanley Research has been written and distributed in accordance with the rules of conduct applicable to financial research as established under Spanish regulations; in the United States by Morgan Stanley & Co. Incorporated, which accepts responsibility for its contents. Morgan Stanley & Co. International plc, authorized and regulated by the Financial Services Authority, disseminates in the UK research that it has prepared, and approves solely for the purposes of section 21 of the Financial Services and Markets Act 2000, research which has been prepared by any of its affiliates. Morgan Stanley Private Wealth Management Limited, authorized and regulated by the Financial Services Authority, also disseminates Morgan Stanley Research in the UK. Private U.K. investors should obtain the advice of their Morgan Stanley & Co. International plc or Morgan Stanley Private Wealth Management representative about the investments concerned.
72

M O R G A N S T A N L E Y R E S E A R C H
Big Debates: 2011December 8, 2010
RMB Morgan Stanley (Proprietary) Limited is a member of the JSE Limited and regulated by the Financial Services Board in South Africa. RMB Morgan Stanley (Proprietary) Limited is a joint venture owned equally by Morgan Stanley International Holdings Inc. and RMB Investment Advisory (Proprietary) Limited, which is wholly owned by FirstRand Limited.
Morgan Stanley Bank AG currently acts as a designated sponsor for the following securities: Sky Deutschland AG.
The information in Morgan Stanley Research is being communicated by Morgan Stanley & Co. International plc (DIFC Branch), regulated by the Dubai Financial Services Authority (the DFSA), and is directed at Professional Clients only, as defined by the DFSA. The financial products or financial services to which this research relates will only be made available to a customer who we are satisfied meets the regulatory criteria to be a Professional Client.
The information in Morgan Stanley Research is being communicated by Morgan Stanley & Co. International plc (QFC Branch), regulated by the Qatar Financial Centre Regulatory Authority (the QFCRA), and is directed at business customers and market counterparties only and is not intended for Retail Customers as defined by the QFCRA.
As required by the Capital Markets Board of Turkey, investment information, comments and recommendations stated here, are not within the scope of investment advisory activity. Investment advisory service is provided in accordance with a contract of engagement on investment advisory concluded between brokerage houses, portfolio management companies, non-deposit banks and clients. Comments and recommendations stated here rely on the individual opinions of the ones providing these comments and recommendations. These opinions may not fit to your financial status, risk and return preferences. For this reason, to make an investment decision by relying solely to this information stated here may not bring about outcomes that fit your expectations.
The trademarks and service marks contained in Morgan Stanley Research are the property of their respective owners. Third-party data providers make no warranties or representations of any kind relating to the accuracy, completeness, or timeliness of the data they provide and shall not have liability for any damages of any kind relating to such data. The Global Industry Classification Standard ("GICS") was developed by and is the exclusive property of MSCI and S&P.
Morgan Stanley Research, or any portion thereof may not be reprinted, sold or redistributed without the written consent of Morgan Stanley.
Morgan Stanley Research is disseminated and available primarily electronically, and, in some cases, in printed form.
Additional information on recommended securities/instruments is available on request.
73

M O R G A N S T A N L E Y R E S E A R C H
Big Debates: 2011December 8, 2010
Europe Director of Research Rupert Jones +44 (0)20 7425 4271 Associate Director of Research Juliet Estridge +44 (0)20 7425 8160 Matthew Ostrower +44 (0)20 7425 8560 Mitzi Frank +44 (0)20 7425 8022 Product Development & SSC Ben Britz +44 (0)20 7425 3055 Fergus O’Sullivan +44 (0)20 7425 6404 Management Sarah Waugh +44 (0)20 7425 8154 Sharon Reid +44 (0)20 7677 6101 Media Relations Sebastian Howell +44 (0)20 7425 5324
MACRO
Equity Strategy Ronan Carr +44 (0)20 7425 4944 Matthew Garman +44 (0)20 7425 3595 Graham Secker +44 (0)20 7425 6188 Chris Sellers +44 20 7425-4013 Economics Joachim Fels +44 (0)20 7425 6138 Manoj Pradham +44 (0)20 7425 3805 Spyros Andreopoulos +44 (0)20 7677 0528 Elga Bartsch +44 (0)20 7425 5434 Olivier Bizimana +44 (0)20 7425 6290 Melanie Baker +44 (0)20 7425 8607 Cath Sleeman +44 (0)20 7425 1820 Daniele Antonucci +44 (0)20 7425 8943 Alina Slyusarchuk +44 (0)20 7677 6869 Pasquale Diana +44 (0)20 7677 4183 Tevfik Aksoy +44 (0)20 7677 6917 Mohamed Jaber +971 4 709 7105 Michael Kafe +27 11 507 0891 Andrea Masia +27 11 507 0887 Derivatives and Portfolios Neil Chakraborty +44 (0)20 7425 2571 Praveen Singh +44 (0)20 7425 7833 SRI Kristina Obrtacova +44 (0)20 7425 6107
Sectors CONSUMER DISCRETIONARY/ INDUSTRIALS
Aerospace & Defence Rupinder Vig +44 (0)20 7425 2687 Ovunc Okyay +44 (0)20 7425-8754 Autos & Auto Parts Stuart Pearson +44 (0)20 7425 6654 Edoardo Spina +44 (0)20 7425 0664 Laura Lembke +44 (0)20 7425-7944 Business & Employment Services Jessica Alsford +44 (0)20 7425 8985 David Hancock +44 (0)20 7425 3752 Simone Porter Smith+44 (0)20 7425 3893 Capital Goods Ben Uglow +44 (0) 20 7425 8750 Guillermo Peigneux +44 (0)20 7425 7225 Vidya Adala +44 (0)20 7425 2044 Robert Davies +44 (0)20 7425 2057 Leisure/Hotels Jamie Rollo +44 (0)20 7425 3281 Vaughan Lewis +44 (0)20 7425 3489 Alex Davie +44 (0)20 7425 9867 Andrea Ferraz +44 (0)20 7425 7242
CONSUMER STAPLES
Beverages Michael Steib +44 (0)20 7425 5263 Eveline Varin +44 (0)20 7425 5717 Food Producers/HPC Michael Steib +44 (0)20 7425 5263 Toby McCullagh +44 (0)20 7425 6636 Mark Christensen +44 (0)20 7425 5392 Erik Sjogren +44 (0)20 7425 3935 Audrey Borius +44 (0)20 7425 7242
Tobacco Toby McCullagh +44 (0)20 7425 6636
ENERGY/UTILITIES
Oil & Gas Theepan Jothilingam +44 (0)20 7425 9761 James Hubbard +44 (0)20 7425 0749 Matthew Lofting +44 (0)20 7425 5915 Jamie Maddock +44 (0)20 7425 4405 Albina Sadykova +44 (0) 20 7425 7502 Sasikanth Chilukuru +44 (0)20 7425 3016 Matt Thomas +44 (0)20 7425 5387 Marina Zavolock +44 (0)20 7425 5354 Oil Services Martijn Rats +44 (0)20 7425 6618 Rob Pulleyn +44 (0)20 7425 4388 Utilities Bobby Chada +44 (0)20 7425 5238 Nicholas Ashworth +44 (0)20 7425 7770 Arsalan Obaidullah +44 (0)20 7425 4267 Igor Kuzmin +44 (0)20 7425 8371 Emmanuel Turpin +44 (0)20 7425 6863 Sean Lee +44 (0)20 7425 6230 Antonella Bianchessi +44 (0)20 7425 7857 Carolina Dores +44 (0)20 7677 7167 Clean Energy Allen Wells +44 (0)20 7425 4146 Andrew Humphrey +44 (0)20 7425 2630
FINANCIALS
Banks/ Diversified Financials Huw van Steenis +44 (0)20 7425 9747 Alice M. Timperley +44 (0)20 7425 9094 Steven Hayne +44 (0)20 7425 8332 Bruce Hamilton +44 (0)20 7425 7597 Anil Sharma +44 (0)20 7425 8828 Chris Manners +44 (0)20 7425 3917 Hubert Lam +44 (0)20 7425 3734 Francesca Tondi +44 (0)20 7425 9721 Wouter Janssens +44 (0)20 7425 2138 Maxence Le Gouvello +44 (0)20 7425 6942 Thibault Nardin +44 (0)20 7677 3787 Magdalena Stoklosa +44 (0)20 7425 3933 Hadrien de Belle +44 (0)20 7425 4466 Samuel Goodacre +44 (0)20 7677 0759 Henrik Schmidt +44 (0)20 7425 8808 Insurance Jon Hocking +44 (0)20 7425 2307 Farooq Hanif +44 (0)20 7425 6477 Adrienne Lim +44 (0)20 7425 6679 Maciej Wasilewicz +44 (0)20 7425 9104 Damien Kingsley-Tomkins +44 (0)20 7425 1830
HEALTHCARE
Biotech & Medical Technology Michael Jungling +44 (0)20 7425 5975 Karl Bradshaw +44 (0)20 7425 6573 Andrew Olanow +44 (0)20 7425 4107 Valerie Rinecker +44 (0)20 7677-0209 Pharmaceuticals Andrew Baum +44 (0)20 7425 6647 Peter Verdult +44 (0)20 7425 2244 Liav Abraham +44 (0)20 7425 8273 Simon Mather +44 (0)20 7425 3227 Matt Hartley +44 (0)20 7425 2272
MATERIALS
Building & Construction Alejandra Pereda +34 91 412 1747 Michael Watts +44 (0)20 7425 7515 Chemicals Paul Walsh +44 (0)20 7425 4182 Peter J. Mackey +44 (0)20 7425 4657 Amy Walker +44 (0)20 7425-0640 Metals & Mining Ephrem Ravi +44 (0)20 7425 2127 Hannah Kirby +44 (0) 20 7425 6014 Carsten Riek +44 (0)20 7425 3075 Markus Almerud +44 (0)20 7425 9870 Alain Gabriel +44 (0)20 7425 8959
MEDIA
Media & Internet Patrick Wellington +44 (0)20 7425 8605 Edward Hill-Wood +44 (0)20 7425 9224 Julien Rossi +44 (0)20 7425 9755
PROPERTY
Property Bart Gysens +44 (0)20 7425 5862 Chris Fremantle +44 (0)20 7425 5761 Bianca Riemer +44 (0)20 7425 2646
RETAIL
Retailing/Brands Louise Singlehurst +44 (0)20 7425 7239 Emily Tam +44 (0)20 7425 4055 Pallavi Verma +44 (0)20 7425 2644 Retailing Geoff Ruddell +44 (0)20 7425 8954 Fred Bjelland +44 (0)20 7425 3612 Edouard Aubin +44 (0)20 7425 3160 Charlie Muir-Sands +44 (0)20 7425 5207
TECHNOLOGY
Technology Patrick Standaert +44 (0)20 7425 9290 Adam Wood +44 (0)20 7425 4450 Ashish Sinha +44 (0)20 7425 2363 Guillaume Charton +44 (0)20 7425 2686 Francois Meunier +44 (0)20 7425-6603 Sunil George +44 (0)20 7425 3436
TELECOMS
Telecommunications Services Nick Delfas +44 (0)20 7425 6611 Luis Prota +34 91 412 1217 Frederic Boulan +44 (0)20 7425 6830 Terence Tsui +44 (0)20 7425 4399 Ryan Fox +44 (0)20 7425 5413
TRANSPORTATION
Transport Menno Sanderse +44 (0)20 7425 6148 Jaime Rowbotham +44 (0)20 7425 5409 Penny Butcher +44 (0)20 7425 6698 Suzanne Todd +44 (0)20 7425 8316 Doug Hayes +44 (0)20 7425 3831 Daniel Ruivo +44 (0)20 7425 5816
EMERGING MARKETS
Equity Strategy (Global) Jonathan Garner +44 (0)20 7425 9237 Equity Strategy (CEEMEA) Economics Pasquale Diana +44 (0)20 7677 4183 Banks/ Diversified Financials Magdalena Stoklosa +44 (0)20 7425 3933 Samuel Goodacre +44 (0)20 7677 0759 Hadrien de Belle +44 (0)20 7425 4466 Telecommunications Services Sean Gardiner +971 4 709 7120 Consumer Daniel Wakerly +44 (0)20 7425 4389 Maryia Berasneva +44 (0) 20 7425 7502
MIDDLE EAST NORTH AFRICA
Head of Research Sean Gardiner +971 4 709 7120 Economics Mohamed Jaber +971 4 709 7105 Financials Dan Cowan +971 4 709 7165 Suha Urgan +971 4 709 7240 Infrastructure Muneeba Kayani +971 4 709 7117 Saul Rans +971 4 709 7110 Nida Iqbal +971 4 709 7103 Telecoms Sean Gardiner +971 4 709 7120 Cesar Tiron +44 (0)20 7425 8846 Madhvendra Singh +971 4 709 7122
RUSSIA
Economics Alina Slyusarchuk +44 (0)20 7677 6869 Metals & Mining Dmitriy Kolomytsyn +7 495 589 9942
Timur Salikhov +7 495 287 2118 Oil & Gas Matt Thomas +44 (0)20 7425 5387 Marina Zavolock +44 (0)20 7425 5354 Telecommunications Services Sean Gardiner +44 (0)20 7425 2175 Polina Ugryumova +7 495 589 9944 Utilities Bobby Chada +44 (0)20 7425 5238 Igor Kuzmin +44 (0)20 7425 8371
SOUTH AFRICA -
RMB MORGAN STANLEY
Head of Research/Strategy Vaughan Henkel +27 11 282 8260 Economics Michael Kafe +27 11 507 0891 Andrea Masia +27 11 507 0887 Financials Magdalena Stoklosa +27 11 282 1082 Derinia Chetty +27 11 282 8553 Greg Saffy +27 11 282-4228 Industrials Anthony de la Cour +27 11 282 8139 Roy Campbell +27 11 282 1499 Retail Natasha Moolman +27 11 282 8489 Danie Pretorius +27 11 282 1082 Qaqambile Dwayi +27 11 282 4146 TMT Peter Takaendesa +27 11 282 8240 Mining Simon Kendall +27 11 282 4932 Leigh Bregman +27 11 282 8969 Food Producers Qaqambile Dwayi +27 11 282 4146
TURKEY
Sayra Can Altuntas +44 (0)20 7425 2365 Erol Danis +44 (0)20 7425 7123 Batuhan Karabekir - +44 (0)20 7425 3346 Economics Tevfik Aksoy +44 (0)20 7677 6917 Banks Magdalena Stoklosa +44 (0)20 7425 3933 Telecommunications Services Sean Gardiner +971 4 709 7120
74
M O R G A N S T A N L E Y R E S E A R C H
Big Debates: 2011December 8, 2010
Fixed Income Research - Global
Global Cross-Asset Strategy Gregory Peters 1+212 761-1488 Jason Draho 1+212 761-7893
Credit Strategy North America Gregory Peters 1+212 761-1488 Rizwan Hussain 1+212 761-1494 Adam Richmond 1+212 761-1485 Michael Zezas 1+212 761-8609 Maya Abdurahmanova 1+212 761-1470
Europe Andrew Sheets 44+20 7677-2905 Phanikiran Naraparaju 44+20 7677-5065 Carlos Egea 44+20 7425-6247 Serena Tang 44+20 7677-1149 Jonathan Graber 44+20 7425 0577
Japan Hidetoshi Ohashi 81+3 5424-7908 Tomoyuki Hirose 81+3 5424-7912
Asia Pacific Viktor Hjort +852 2848-7479 Kelvin Pang +852 2848-8204 Nishant Sood +852 2239-1597
Structured Credit Strategy Sivan Mahadevan 1+212 761-1349 Ashley Musfeldt 1+212 761-1727 Vishwanath Tirupattur 1+212 761-1043 James Egan 1+212 761-4715 Oliver Chang 1+415 576-2395 Richard Parkus 1+212 761-1444 Andy Bernard 1+212 761-7880 Srikanth Sankaran 44+20 7677-2969
Currency Strategy North America Gabriel de Kock 1+212 761-5154 Ron Leven 1+212 761-3413 Yilin Nie 1+212 761-2886 Christine Tian 1+212 761-5970
Europe Stephen Hull 44+20 7425-1330 Tim Davis 44+20 7677-1692 Calvin Tse
Asia Pacific Stewart Newnham 852+2848-5320 Emma Lawson 852+3963-3190 Yee Wai Chong 852+2239-7117
Economics North America Richard Berner 1+212 761-3398 David Greenlaw 1+212 761-7157 Ted Wieseman 1+212 761-3407 David Cho 1+212 761-0908
Europe Joachim Fels 44+20 7425-6138 Arnaud Marès 44+20 7677-6302 Manoj Pradhan 44+20 7425-3805 Spyros Andreopoulos 44+20 7056-8584
Emerging Markets Economics Tevfik Aksoy 44+20 7677-6917 Pasquale Diana 44+20 7677-4183 Alina Slyusarchuk 44+20 7677-6869 Mohamed Jaber 971+4 709-7105 Michael Kafe 27+11 507-0891 Andrea Masia 27+11 507-0887
Interest Rate Strategy North America Jim Caron 1+212 761-1905 Subadra Rajappa 1+212 761-2983 Bill McGraw 1+212 761-1445 Janaki Rao 1+212 761-1711 George Azarias 1+212 761-1346 Igor Cashyn 1+212 761-1696 Zofia Koscielniak 1+212 761-1307 Jonathan Marymor 1+212 761-2056
Europe Laurence Mutkin 44+20 7677-4029 Anthony O’Brien 44+20 7677-7748 Mayank Gargh 44+20 7677-7528 Anton Heese 44+20 7677-6951 Owen Roberts 44+20 7677-7121 Elaine Lin 44+20 7677-0579 Corentin Rordorf 44+20 7677-0518 Rachael Featherstone 44+20 7677-7764
Japan Takehiro Sato 81+3 5424-5367 Le Ngoc Nhan 81+3 5424-7698 Miho Ohashi 81+3 5424-7904
Asia Pacific Pieter Van Der Schaft +852 3963-0550 Rohit Arora +852 2848-8894
Credit Research Europe – Financials Jackie Ineke 41+44 220-9246 Marcus Rivaldi 44+20 7677-1464 Lee Street 44+20 7677-0406 Fiona Simpson 44+20 7677-3745
Asia Pacific – Financials Desmond Lee +852 2239-1575
Commodities Strategy Hussein Allidina 1+212 761-4150 Chris Corda 1+212 761-6005 Tai Liu 1+212 761-3585 Bennett Meier 1+212-761-4967
EM Fixed Income and Foreign Exchange Strategy North America Rogerio Oliveira 1+212 761-1204 Vitali Meschoulam 1+212 761-1889 Juha Seppala 1+212 761-1949 Rosa Velasquez 1+212 761-8278
Europe Rashique Rahman 44+20 7677-7295 Paolo Batori, CFA 44+20 7677-7971 Vanessa Barrett 44+20 7677-9569 Regis Chatellier 44+20 7677-6982 Chuan Lim, CFA 44+20 7677-7597 James Lord 44+20 7677-3254 Robert Tancsa 44+20 7677-6671
75

M O R G A N S T A N L E Y R E S E A R C H
The Americas 1585 Broadway New York, NY 10036-8293 United States Tel: +1 (1)212 761 4000
Europe 20 Bank Street, Canary Wharf London E14 4AD United Kingdom Tel: +44 (0)20 7425 8000
Japan 4-20-3 Ebisu, Shibuya-ku Tokyo 150-6008 Japan Tel: +81 (0)3 5424 5000
Asia/Pacific 1 Austin Road West Kowloon Hong Kong Tel: +852 2848 5200
© 2010 Morgan Stanley